the amount of electrolyte in cell water and the The most rational
12
THE DISTRIBUTION OF SODIUM AND CHLORIDE AND THE EXTRACELLULAR FLUID VOLUME IN THE RAT 1 BY DONALD B. CHEEK, CLARK D. WEST, AND CATHERINE CARTER GOLDEN (From The Children's Hospital Research Foundation and Department of Pediatrics, University of Cincinnati, Cincinnati, 0.) (Submitted for publication July 9, 1956; accepted October 17, 1956) Our attempts to gain information concerning the amount of electrolyte in cell water and the theoretical concentration of intracellular cations necessarily revolve around our ability to partition total body water into extracellular and intracellular phases. The total body potassium, for example, is confined almost exclusively to the intracellular phase, and if the intracellular volume of the body could be defined, the net intracellular potassium concentration could be readily calculated as: Total body K - Extracellular K Intracellular fluid volume The most rational interpretation of extracellu- lar fluid volume would seem to be that defined originally by Manery, Danielson, and Hastings (1), by Manery and Hastings (2) and later by Nichols, Nichols, Weil, and Wallace (3). These authors divide the extracellular fluid into the fol- lowing components: the plasma water, the inter- stitial water, and the connective tissue water. The interstitial water is considered that volume of fluid which rapidly equilibrates with substances such as inulin. Connective tissue water is the volume of water which is principally associated with col- lagen and elastin, and with which substances such as inulin equilibrate slowly. The study of Nichols, Nichols, Weil, and Wallace (3) would indicate that the sum of these three phases of the extra- cellular fluid is defined reasonably well by the chloride space if correction of the chloride space is made for intracellular chloride, and for the slightly greater concentration of chloride in con- nective tissue water than is present in an ultra- filtrate of serum. The major aim of the present study is to test 1 This investigation was supported in part by a re- search grant (H-1638) from the National Heart Institute, National Institutes of Health, United States Public Health Service. further the validity of the chloride space, cor- rected for the factors described above, as a meas- ure of the extracellular volume by demonstrating an identity between it and the space calculated from the sodium content of extracellular fluid. Extracellular fluid volume has been calculated from sodium by the expression (extracellular so- dium)/(Na)ef where extracellular sodium is the difference between total body sodium and the so- dium which is not in the extracellular fluid (i.e., that in bone, cells, and within the lumen of the gastrointestinal tract) and (Na)ef is the sodium concentration of the serum ultrafiltrate. Values for total body chloride and sodium on which the calculations depend have been obtained by carcass analysis of a large number of normal rats (4, 5). Values for bone sodium have been calculated from the Na/Ca ratio for bone and from total body calcium. Values for cell sodium in muscle have been taken from data in the litera- ture (6) calculated on the assumption that chloride in muscle occupies the same space as inulin and an exclusively extracellular position (7). Values for sodium in red cells were also calculated from the data of other investigators (8, 9) while those in visceral cells have been assessed by comparison of the volumes of distribution of inulin and sodium in the viscera following a constant infusion of inu- lin according to the technique described by Cot- love (7). The good agreement between the sodium and chloride spaces calculated by correcting the value for total body electrolyte in this manner lends credence to the view that a value closely approxi- mating the true extracellular volume of the rat has been determined. On this assumption the data obtained by carcass analysis have been used for further calculation of the intracellular volume and the theoretical concentrations of electrolyte within the cells. 340
Transcript of the amount of electrolyte in cell water and the The most rational

THE DISTRIBUTION OF SODIUM AND CHLORIDE AND THEEXTRACELLULAR FLUID VOLUME IN THE RAT 1
BY DONALD B. CHEEK, CLARK D. WEST, AND CATHERINE CARTER GOLDEN
(From The Children's Hospital Research Foundation and Department of Pediatrics, Universityof Cincinnati, Cincinnati, 0.)
(Submitted for publication July 9, 1956; accepted October 17, 1956)
Our attempts to gain information concerningthe amount of electrolyte in cell water and thetheoretical concentration of intracellular cationsnecessarily revolve around our ability to partitiontotal body water into extracellular and intracellularphases. The total body potassium, for example,is confined almost exclusively to the intracellularphase, and if the intracellular volume of the bodycould be defined, the net intracellular potassiumconcentration could be readily calculated as:
Total body K - Extracellular KIntracellular fluid volume
The most rational interpretation of extracellu-lar fluid volume would seem to be that definedoriginally by Manery, Danielson, and Hastings(1), by Manery and Hastings (2) and later byNichols, Nichols, Weil, and Wallace (3). Theseauthors divide the extracellular fluid into the fol-lowing components: the plasma water, the inter-stitial water, and the connective tissue water. Theinterstitial water is considered that volume of fluidwhich rapidly equilibrates with substances suchas inulin. Connective tissue water is the volumeof water which is principally associated with col-lagen and elastin, and with which substances suchas inulin equilibrate slowly. The study of Nichols,Nichols, Weil, and Wallace (3) would indicatethat the sum of these three phases of the extra-cellular fluid is defined reasonably well by thechloride space if correction of the chloride spaceis made for intracellular chloride, and for theslightly greater concentration of chloride in con-nective tissue water than is present in an ultra-filtrate of serum.The major aim of the present study is to test
1 This investigation was supported in part by a re-search grant (H-1638) from the National Heart Institute,National Institutes of Health, United States Public HealthService.
further the validity of the chloride space, cor-rected for the factors described above, as a meas-ure of the extracellular volume by demonstratingan identity between it and the space calculatedfrom the sodium content of extracellular fluid.Extracellular fluid volume has been calculatedfrom sodium by the expression (extracellular so-dium)/(Na)ef where extracellular sodium is thedifference between total body sodium and the so-dium which is not in the extracellular fluid (i.e.,that in bone, cells, and within the lumen of thegastrointestinal tract) and (Na)ef is the sodiumconcentration of the serum ultrafiltrate.
Values for total body chloride and sodium onwhich the calculations depend have been obtainedby carcass analysis of a large number of normalrats (4, 5). Values for bone sodium have beencalculated from the Na/Ca ratio for bone andfrom total body calcium. Values for cell sodiumin muscle have been taken from data in the litera-ture (6) calculated on the assumption that chloridein muscle occupies the same space as inulin andan exclusively extracellular position (7). Valuesfor sodium in red cells were also calculated fromthe data of other investigators (8, 9) while thosein visceral cells have been assessed by comparisonof the volumes of distribution of inulin and sodiumin the viscera following a constant infusion of inu-lin according to the technique described by Cot-love (7).The good agreement between the sodium and
chloride spaces calculated by correcting the valuefor total body electrolyte in this manner lendscredence to the view that a value closely approxi-mating the true extracellular volume of the rat hasbeen determined. On this assumption the dataobtained by carcass analysis have been used forfurther calculation of the intracellular volume andthe theoretical concentrations of electrolyte withinthe cells.
340
THE PARTITIONING OF SODIUM AND CHLORIDE IN THE RAT
METHODS AND CALCULATIONS
The animals used in the study were male Wistar ratsof the Hamilton Farms strain. For convenience andsimplicity, a rat with a fat free dry solid content of 50grams has been taken as a representative animal. As-suming a normal body fat content, such an animal wouldweigh approximately 220 grams.
Total body electrolyte and water. The carcass elec-trolyte and water content of the hypothetical 220-gm. ratwas determined from regression equations calculatedfrom data obtained by carcass analysis of 30 to 40 ratsof normal health and vigor. The weight range of theanimals was from 70 to 410 gm. with the greatest num-ber falling around 220 grams (4, 5). The animals hadbeen under observation at least two weeks prior to sacri-fice and for ten days had been on a low residue diet ofcomposition previously described (4). The regressions oftotal body electrolyte, water and nitrogen on fat freedry solid are given in Table I.The methods of carcass analysis, with the exception of
that for potassium, have been given previously (4, 5). Inprevious studies, potassium was determined on an acidextract of ashed carcass by flame photometry, while inthe present study potassium in the ash has also been de-termined with chloroplatinic acid by the method of Con-solazio and Talbott (10) modified to determine the saltK2PtCl, gravimetrically instead of by iodometric titration.The method is to be published later in detail (11). Theflame photometric method, employed on 47 animals,yielded a regression equation with a lower slope (0.283),a higher intercept (+ 0.36) and a greater scatter of thedata (standard error of the estimate, 1.08 mEq.) than thegravimetric procedure. For animals of a fat free drysolid content of 50 gm. with which the present paper isconcerned, the two equations gave almost identical values.By the gravimetric procedure, carcass potassium wouldbe 14.38 mEq. as compared with 14.51 by flame photometry.Estimation of bone sodium. Bone sodium was estimated
in five healthy male rats of 210 to 230-gm. weight. Theseanimals were of the same strain and prepared in thesame manner as those used for carcass analysis. Aftersacrifice and exsanguination, the carcass was dried at
100 to 105°C as previously described. After drying, thelarger bones could be easily removed by pulling awaythe dried tissues and cutting free adherent cartilage. Thebones were broken into small pieces, the fat extracted ina Soxhlet apparatus and the pieces further titrated tofine particles in a mortar. A portion of the particleswere then ashed in a platinum crucible and the ash dis-solved in 5.0 ml. of weak HCl. Separate aliquots weretaken for calcium determination by permanganate titra-tion and for sodium determination by the gravimetricmethod of Butler and Tuthill (12). A separate aliquot ofthe bone particles was subjected to alkaline ashing andanalyzed for chloride by the microdiffusion technique.The methods are identical to those used for carcass andare described in greater detail in previous papers (4, 5).The difficulties inherent in the flame photometric deter-mination of bone sodium through interference by cal-cium (13) are obviated by use of the gravimetricprocedure.The sodium incorporated in bone salt was determined
by subtracting from total bone sodium the amount of so-dium calculated as present in the chloride space of bone.The total bone salt sodium of the carcass was calculatedas total bone salt sodium
[bone salt sodium (mEq./100 gm. FFDS)bone calcium (mEq./100 gm. FFDS)
X total body calcium (mEq.).Determination of total body collagen and of connective
tissue chloride. Determinations of carcass collagen were
performed on nine rats weighing approximately 220 gm.,prepared before sacrifice in the same manner as those usedfor carcass analysis. The method of collagen estimationwas that of Spencer, Morgulis, and Wilder (14). Ahomogeneous aliquot of powdered, fat free, dry carcasswas autoclaved to convert collagen to gelatin, the gela-tin was extracted with hot water and finally precipitatedwith tannic acid.The chloride concentration of connective tissue water
was determined by analysis of the achilles tendon of anormal rat and of a normal female mongrel dog. Afterexposure of the tendon, dissection was carried out rapidly,and each piece removed was immediately placed in a
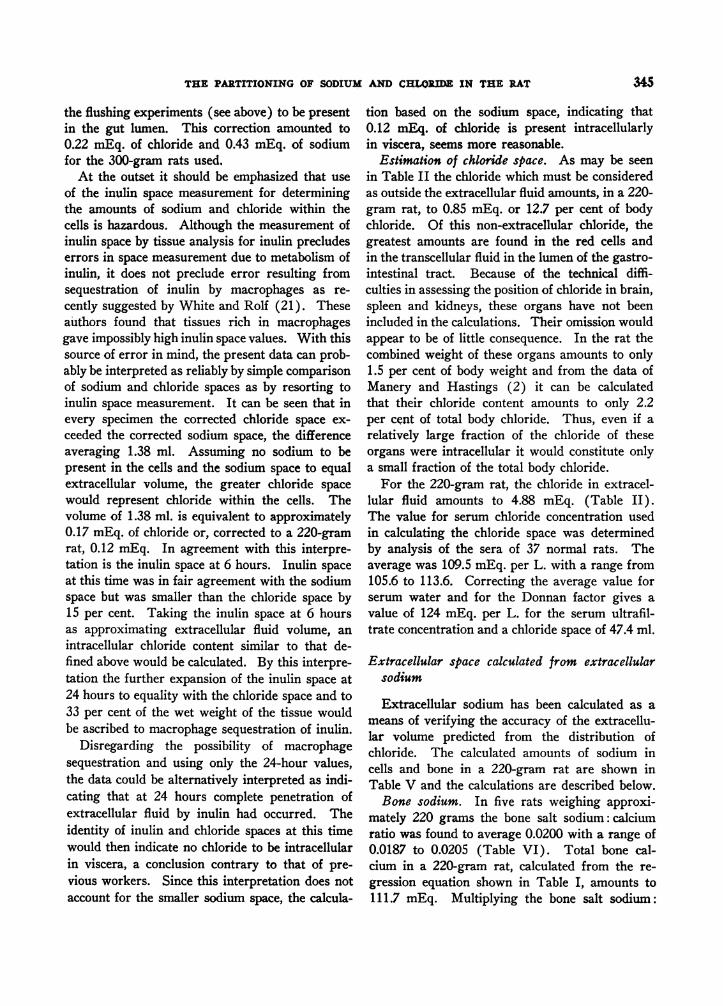
TABLE I
Body composition in the normal rat (wt. range 70 to 410 grams): Regressions of total body electrolyte,nitrogen and water on fat free dry solid
Standard Number Values forerror of of 220-gm. ratRegression equations estimate rats (FFDS = 50 gm.)
Nat (mEq.) = 0.193 FFDS + 0.78 4 0.64 mEq. 36 10.43 mEq.Clt (mEq.) = 0.131 FFDS + 1.04 0.41 mEq. 35 6.73 mEq.Kt (mEq.) = 0.323 FFDS - 1.77 =1= 0.75 mEq. 29 14.38 mEq.Mgt (mEq.) = 0.1014 FFDS + 0.594 0.32 mEq. 32 5.66 mEq.Cat (mEc.) = 2.200 FFDS - 1.74 i11.50 mEq. 35 111.70 mEq.Pt (mM) = 0.849 FFDS + 0.300 3.20 mM 30 42.75 mMNt (grams) = 0.131 FFDS - 0.065 : 0.200 gm. 40 6.49 gm.H20t (ml.) = 2.725 FFDS + 13.19 : 3.70 ml. 36 149.40 ml.
Average fat content: 9.6% body wt.Range 15.3 to 3.3% 36
341

DONALD B. CHEEK, CLARK D. WEST, AND CATHERINE CARTER GOLDEN
separate tared stoppered weighing bottle to minimizeevaporation of water. After weighing, the tendon wasdried to constant weight at 100 to 105'C, reweighed,ground in a mortar and fat extracted. Analyses forchloride, collagen and total nitrogen were carried out asfor carcass (4, 5, 14).Determination of extracellular sodium and chloride of
viscera. Using inulin as a reference substance, sodiumand chloride were partitioned between extra and intra-cellular compartments in the lungs, trachea, esophagus,stomach, intestines and testes.by the method described byCotlove for muscle (7). The data were obtained on 11male rats whose weights ranged from 290 to 310 gm.The animals were placed on a low residue diet (4) fourdays before experimentation and fasted for 24 hours be-fore sacrifice. Under ether anesthesia either a poly-ethylene catheter or a 22 gauge needle was placed in atail vein for inulin infusion and the animal confined inthe apparatus described by Kellogg, Burack, and Issel-bacher (15). Following priming with an amount ofinulin calculated as sufficient to raise the plasma inulinconcentration to 300 mg. per cent, an infusion of inulinwas maintained at a constant rate using an infusion ma-chine. Both priming and maintenance solutions of inu-lin contained 7.5 gm. of inulin and 0.64 gm. of sodiumchloride per 100 ml. After 6 hours of infusion in 7 ani-mals and after 24 hours in 4 animals, ether anesthesia wasagain applied and the animal exsanguinated by aorticpuncture. The infusion was stopped at the moment ofaortic puncture. The lungs, gastrointestinal tract andtestes were then quickly removed and placed in a taredvessel and weighed. Forty milliliters of water were thenadded and the tissues homogenized in a micro Waringblendor. The homogenate was placed in a boiling wa-ter bath for 30 minutes and then filtered. While in thewater bath, the tubes were covered with aluminum foilto reduce evaporation. Serum and filtrate were analyzedfor sodium by flame photometry and for inulin by themethod of Schreiner (16) after preliminary hydrolysiswith alkali as described by Ross and Mokotoff (17).Chloride in the tissue filtrate was determined by themicro diffusion technique of Conway (4, 18) and serumchloride by the method of Van Slyke (19). In earlyexperiments the liver was analyzed separately, but thedata are not included in the presentation because, after24 hours of infusion, the inulin space was found to belarger than either the sodium or chloride space.
Inulinoid blanks were determined on the serum andfiltrate of the visceral organs of 13 rats which receivedno inulin. These animals had been on the same diet asthe experimental animals for four days before sacrificeand fasted for 24 hours before sacrifice. The inulinoidblanks for serum after alkali hydrolysis were found to benegligible and were disregarded. Blank values for thefiltrate of viscera ranged from 2.4 to 4.7 mg. per cent.The average value was 3.44 and the standard deviation± 0.52 mg. per cent. Inulin concentrations in the viscerafiltrates of rats infused with inulin ranged from 25.4 to56.8 mg. per cent with an average value of 38.0 mg. per
cent. Serum inulin levels averaged 290 with a rangefrom 209 to 428 mg. per cent. The total inulin and elec-trolyte content of the tissue was calculated as the prod-uct of viscera filtrate concentration times the volume ofadded water plus tissue water. Tissue water was takenas 81 per cent of wet weight (20).The sodium and chloride spaces in viscera were cor-
rected for the quantities of sodium or chloride presentin the lumen of the gastrointestinal tract. The amountof the correction was determined by analysis of the lu-minal contents of five rats which had been on a low resi-due diet for four days and fasted for 24 hours beforesacrifice. No infusion was given. After anesthetizingwith ether, the lower end of the gastrointestinal tractwas clamped, the gut dissected free and placed in abeaker. A rubber catheter was then inserted in thecardia of the stomach and 50 ml. of 5 per cent glucosein water rapidly injected so that the full length of thegut was distended. The clamp was then removed andthe fluid gently pressed out through several incisionsmade in the gut wall. The whole procedure requiredonly a few minutes. The volume of fluid was thenmeasured and, after filtering, analyzed for sodium andchloride. The volume of fluid recovered averaged49.6 ml.
Estimation of gastrointestinal fluid volume. The valuesfor total body water determined by carcass analysis werecorrected for the water contained within the gastrointesti-nal tract. The volume of fluid within the gut lumen wasdetermined in six rats weighing approximately 220 grams.The animals were prepared in a manner identical to thosesubjected to carcass analysis; a low residue diet was fedfor five days with free access to water. They were thensacrificed after a four-hour fast at the same time of dayas the animals used for carcass analysis. The gastroin-testinal tract was dissected free, placed on a board andopened longitudinally with scissors. The gut surfacewas then gently swabbed with gauze which had beenpreviously dried by heating at 1000 C. The gauze wasimmediately placed in a weighing bottle, covered andweighed. The bottles were then uncovered, placed inan oven at 1000 C for 24 hours and re-weighed. Thewater content of the gut in milliliters was taken as theweight difference of the gauze in grams.
Calculation of sodium, chloride, and inulin sPaces.The volumes of distribution of sodium and chloride werecalculated by dividing the amount of the ion present bythe concentration in a serum ultrafiltrate. To determineserum ultrafiltrate concentration, the serum concentra-tion was corrected for serum water and Donnan equi-librium as follows:
(Na).f = 0.93 X 0.95and
(Cl)Df= 10.93 0.95
in which (Na),f and (Cl).f are the amounts of sodiumand chloride per liter of serum ultrafiltrate, (Na). and(Cl). the amounts per liter of serum, and 0.95 the Don-
342

THE PARTITIONING OF SODIUM AND CHLORIDE IN THE RAT
nan factor. Serum water was taken asof serum and is represented by the factoSerum ultrafiltrate concentrations of i
lated as (In)./0.93 where 0.93 is againcorrection.
RESULTS
Calculation of extracellular volumelular chloride
The total body chloride of a 221the corrections necessary for the esportion of total chloride which isfluid and at a concentration equalrum ultrafiltrate are given in Tabletion of the calculation of these corr
Correction for connective tissuecorrect total body chloride for the 4nective tissue in excess of that prechloride concentration of the sertanalyses of dog and rat tendon forcollagen and total nitrogen were cadata are given in Table III. In bactual chloride content of tendonper 100 gm. of FFDS greater thatdicted from the tendon water contrum ultrafiltrate chloride concentrn
TABLE II
Calculation of extracellular fluid voltcellular chloride in a 220-gram rat (5
Chloride Outside Extraelular nuid
Chloride of connective tiaes inexess of predicted (from deter-minatico of %xcess chloride inrat and dog tendon sal from rattotal body collagan)
Eryto byhe chloride (from chlorideconcentration of red cell water(8), blood volume and hematocrit(9), and red cell water content)
Chloride intracellular in mscle (7)Chloride intracellular in liver
(from difference betwen sodiumend chloride spaces of liver)
Chloride within lusen of gat (deter-mined by flushing of gut)
Chloride intracellular in viscera,exclusive of liver, brain, spleen,snd kidney (from comarison ofsodium, chloride end inulin spaces)
Total
Total Body Chloride
Chloride in Uxtracellular Fluid
Serum ultrafiltrate chloride concentrat
Chloride space - m-8a 147.1
930 ml. per literor 0.93.inulin were calcu-the serum water
from extracel-
O-gram rat andtimation of thatin extracellular
TABLE III
Chlride and wtater cotent of tendon in dog and rat:Calculation of "excess' chloride in tendon
(3)Tendon Cl (4) (5)
(1 ) predicted Tendon "Excess"Tendon (2) Cj chloridewater (2) (1)X1000 found (4)-(3)ml./100 (C1),q* mEq./100 mEq./100 m~q./100
gm. FPDS mEq./L. gm. FFDS gm. FFDS gm. FFDS
Dog 128 127 16.26 17.02 0.76Rat 140 125 17.50 18.26 0.76
* (Cl).f - Chloride concentration of serum ultrafiltrate.
to that in a se- of tendon water content, tendon chloride amountedII- A descrip- to 133 mEq. per L. in the dog and 131 mEq. per L.rections follows, in the rat; in both species the values were 6 mEq.e chloride. To per L. greater than the concentration of the serumchloride in con- ultrafiltrate.dicted from the Taking the excess chloride in connective tissueim ultrafiltrate, as 0.76 mEq. per 100 gm. of FFDS, the excesswater, chloride, chloride associated with collagen in the whole rattrried out. The may be calculated as 0.76/100 X total body col-oth species, the lagen (grams). Total body collagen in nine ratswas 0.76 mEq. of approximately 220 grams body weight averageda would be pre- 11.9 ± 0.48 (SD) grams. The excess chloridetent and the Se- associated with connective tissue then becomesation. In terms 0.10 mEq. The calculation assumes that all body
collagen has the same affinity for chloride as doesachilles tendon. No correction has been made for
'0 gram FFDS) the fact that achilles tendon is not pure collagen;by analysis only 91 per cent of the total nitrogen of
oft Of Total the tendon could be accounted for as collagennitrogen.
Erythrocyte chloride. Calculation of the intra-cellular chloride of erythrocytes was made from the
0.10 1.5 data of Bernstein (8) which give the chloride con-centration of the rat red cell water, and from the
O~l6.1 data of Wang and Hegsted (9) which define theo 0 blood volume and hematocrit. According to the
latter authors, the blood volume of a 220-gram0.06 0.9 rat closely approximates 7 per cent of the body0.16 2.4 weight and the hematocrit averages 45. Red cell
water was taken as 72 grams per 100 ml. and thechloride concentration of red cell water as 72
0.12 1-0 mEq. per L. (8). Using these values, the chlo-0.85 12.7 ride intracellular in erythrocytes may be calcu-
6.73 lated as 1.86 mEq. per Kg. of body weight. In.5.88 87.3 a 220-gram rat the value would be 0.41 mEq.
Chloride intracellular in muscle and liver.tion, 124zmA. Based on the studies of Cotlove (7) comparing
4m. the distribution volumes of inulin and chloride in
343

DONALD B. CHEEK, CLARK D. WEST, AND CATHERINE CARTER GOLDEN
muscle after prolonged inulin infusion, the as-sumption has been made that chloride is not pres-ent in muscle cells. A similar assumption can-not be made for the liver. In this organ the vol-ume of distribution of chloride exceeds that ofsodium so that an intracellular position of chlo-ride must be presumed. For lack of a bettermethod, intracellular chloride in liver has been cal-culated on the assumption that the true extracel-lular volume of this organ is measured by the vol-ume of distribution of sodium. In seven rats, thechloride space of liver exceeded the sodium space
by 0.5 to 0.95 ml. corresponding to 0.066 to 0.120mEq. of chloride. The average value in the 300-gram rat of 0.088 mEq. of intracellular chloridebecomes 0.060 mEq. for a 220-gram rat.
Chloride within the lumen of the gastrointestinaltract. The chloride in the "transcellular" fluidwithin the gut was determined by flushing the in-testinal tract with isotonic glucose solution. Infive rats weighing approximately 300 grams, thechloride recovered averaged 0.22 mEq. and rangedfrom 0.14 to 0.28 mEq. Corrected to a bodyweight of 220 grams, the average value becomes0.16 mEq. Several sources of error in this de-termination should be mentioned. Although theflushing procedure was carried out as rapidly as
possible, the possibility cannot be excluded thatsome chloride diffused from the extracellular fluid
through gut mucosa or serosa or through the in-cisions made in the gut wall. Also, the data werefor use primarily in correcting the chloride spaceof viscera and to compare this space with the in-ulin space, as will be described below. Conse-quently the animals were not prepared in exactlythe same manner as those used for carcass analysis.Food was withheld from those used for carcass
analysis for only four hours while those used forthe flushing procedure were starved for 24 hours.Although both groups had been on the same lowresidue diet, the differences in food intake mighthave produced differences in intraluminal gutchloride. It seems possible that these two sourcesof error, the one tending to give a falsely highvalue and the other a value falsely low, couldbalance out.
Chloride in cells of viscera exclusive of liver,brain, spleen and kidneys. Although chloride hasbeen described as being intracellularly located inthe pylorus, testes and lungs (2) the amountspresent and their significance have not been clearlydefined. The problem has been approached in thepresent study by determining the inulin, chlorideand sodium spaces of gut, lung and testes afterprolonged infusion of inulin. The data for thesevolumes are shown in Table IV. In this tablethe chloride and sodium spaces have been cor-
rected for the amounts of these ions determined by
TABLE IV
Inulin and corrected chloride and sodium spaces of viscera after 6 and 24 hours of inulin infusion
Corrected CorrectedWt. of Inulin chloride sodium
Rat viscera space Inulin 9p. space space InulinsD. InulinSD.no. gm. ma. Viscera wt. "a. ml. C1 space Na space
After 6 hours of inulin infusion2 21.4 5.35 .25 8.55 5.23 0.626 1.023 21.0 6.88 .33 6.21 4.95 1.11 1.394 23.5 7.23 .31 7.43 6.16 0.974 1.177 22.1 6.89 .31 8.62 7.92 0.80 0.87
10 20.5 6.56 .32 8.33 6.73 0.788 0.9711 21.1 5.42 .26 6.57 5.42 8.826 1.0012 21.1 6.26 .30 7.43 5.91 0.842 1.06
Averages .29 7.59 6.04 0.852 1.07
After 24 hours of inulin infusion5 22.6 6.11 .27 7.38 6.89 0.828 0.899 19.8 6.33 .32 6.06 5.78 1.04 1.1013 23.7 9.93 .42 9.23 6.30 1.076 1.5714 25.7 8.53 .33 7.48 6.84 1.19 1.25
Averages .33 7.54 6.45 1.021 1.20Averages (Both groups) 7.57 6.19
344
THE PARTITIONING OF SODIUM AND Cal-ORIDE IN THE RAT
the flushing experiments (see above) to be presentin the gut lumen. This correction amounted to0.22 mEq. of chloride and 0.43 mEq. of sodiumfor the 300-gram rats used,At the outset it should be emphasized that use
of the inulin space measurement for determiningthe amounts of sodium and chloride within thecells is hazardous. Although the measurement ofinulin space by tissue analysis for inulin precludeserrors in space measurement due to metabolism ofinulin, it does not preclude error resulting fromsequestration of inulin by macrophages as re-cently suggested by White and Rolf (21). Theseauthors found that tissues rich in macrophagesgave impossibly high inulin space values. With thissource of error in mind, the present data can prob-ably be interpreted as reliably by simple comparisonof sodium and chloride spaces as by resorting toinulin space measurement. It can be seen that inevery specimen the corrected chloride space ex-ceeded the corrected sodium space, the differenceaveraging 1.38 ml. Assuming no sodium to bepresent in the cells and the sodium space to equalextracellular volume, the greater chloride spacewould represent chloride within the cells. Thevolume of 1.38 ml. is equivalent to approximately0.17 mEq. of chloride or, corrected to a 220-gramrat, 0.12 mEq. In agreement with this interpre-tation is the inulin space at 6 hours. Inulin spaceat this time was in fair agreement with the sodiumspace but was smaller than the chloride space by15 per cent. Taking the inulin space at 6 hoursas approximating extracellular fluid volume, anintracellular chloride content similar to that de-fined above would be calculated. By this interpre-tation the further expansion of the inulin space at24 hours to equality with the chloride space and to33 per cent of the wet weight of the tissue wouldbe ascribed to macrophage sequestration of inulin.
Disregarding the possibility of macrophagesequestration and using only the 24-hour values,the data could be alternatively interpreted as indi-cating that at 24 hours complete penetration ofextracellular fluid by inulin had occurred. Theidentity of inulin and chloride spaces at this timewould then indicate no chloride to be intracellularin viscera, a conclusion contrary to that of pre-vious workers. Since this interpretation does notaccount for the smaller sodium space, the calcula-
tion based on the sodium space, indicating that0.12 mEq. of chloride is present intracellularlyin viscera, seems more reasonable.
Estimation of chloride space. As may be seenin Table II the chloride which must be consideredas outside the extracellular fluid amounts, in a 220-gram rat, to 0.85 mEq. or 12.7 per cent of bodychloride. Of this non-extracellular chloride, thegreatest amounts are found in the red cells andin the transcellular fluid in the lumen of the gastro-intestinal tract. Because of the technical diffi-culties in assessing the position of chloride in brain,spleen and kidneys, these organs have not beenincluded in the calculations. Their omission wouldappear to be of little consequence. In the rat thecombined weight of these organs amounts to only1.5 per cent of body weight and from the data ofManery and Hastings (2) it can be calculatedthat their chloride content amounts to only 2.2per cent of total body chloride. Thus, even if arelatively large fraction of the chloride of theseorgans were intracellular it would constitute onlya small fraction of the total body chloride.For the 220-gram rat, the chloride in extracel-
lular fluid amounts to 4.88 mEq. (Table II).The value for serum chloride concentration usedin calculating the chloride space was determinedby analysis of the sera of 37 normal rats. Theaverage was 109.5 mEq. per L. with a range from105.6 to 113.6. Correcting the average value forserum water and for the Donnan factor gives avalue of 124 mEq. per L. for the serum ultrafil-trate concentration and a chloride space of 47.4 ml.
Extracellular space calculated from extracellularsodium
Extracellular sodium has been calculated as ameans of verifying the accuracy of the extracellu-lar volume predicted from the distribution ofchloride. The calculated amounts of sodium incells and bone in a 220-gram rat are shown inTable V and the calculations are described below.Bone sodium. In five rats weighing approxi-
mately 220 grams the bone salt sodium: calciumratio was found to average 0.0200 with a range of0.0187 to 0.0205 (Table VI). Total bone cal-cium in a 220-gram rat, calculated from the re-gression equation shown in Table I, amounts to111.7 mEq. Multiplying the bone salt sodium:
I&5
DONALD B. CHEEK, CLARK D. WEST, AND CATHERINE CARTER GOLDEN
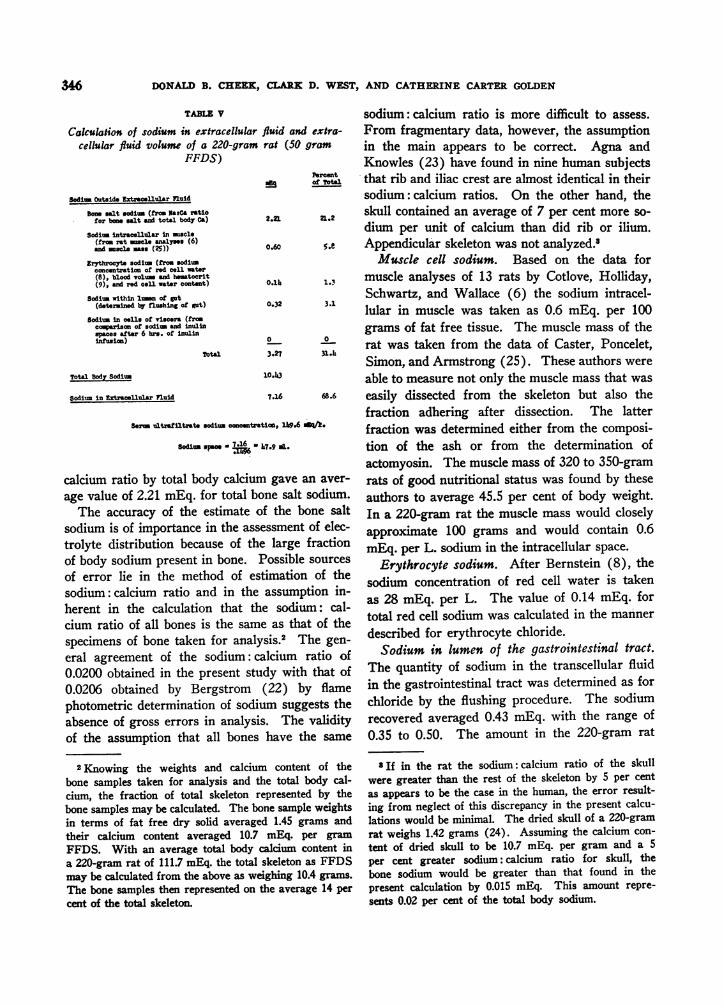
TABLE V
Calculation of sodium in extracellularcellular fluid volume of a 220-gram
FFDS)
Sodium Outside Etraceflular Fluid
Bono malt sodium (from lasCa ratiofor bonos salt and total body Ca)
Sodium intracellular in sacle(from rat muscle analyses (6)and muscle mas (25))
Erythrocyte sodium (from sodiumconcentration of red call water(8), blood volyum and hatocrit(9), and red cell water content)
Sodium within Iumen of got(determined by flushing of gat)
Sodium in oefla of viscera (fromcoarison of sodium and inulinspaces after 6 hrs. of inulininfusion)
Total
Total Body Sodi
sodium in Extraceflular nuid
Serm ultrafiltrate sodium conoentra
Sodium spans a 76'
calcium ratio by total body calciumage value of 2.21 mEq. for total b(The accuracy of the estimate c
sodium is of importance in the ass
trolyte distribution because of theof body sodium present in bone. Iof error lie in the method of es
sodium: calcium ratio and in theherent in the calculation that thcium ratio of all bones is the sam
specimens of bone taken for anal)eral agreement of the sodium: C
0.0200 obtained in the present sty0.0206 obtained by Bergstromphotometric determination of sodiiabsence of gross errors in analysiof the assumption that all bones
2Knowing the weights and calciumbone samples taken for analysis and t]cium, the fraction of total skeleton r
bone samples may be calculated. The bcin terms of fat free dry solid average
their calcium content averaged 10.7FFDS. With an average total bodya 220-gram rat of 111.7 mEq. the totalmay be calculated from the above as we
The bone samples then represented on Icent of the total skeleton.
sodium: calcium ratio is more difficult to assess.fluid and extra- From fragmentary data, however, the assumptionrat (50 gram in the main appears to be correct. Agna and
Knowles (23) have found in nine human subjectsffl OFew that rib and iliac crest are almost identical in their
sodium: calcium ratios. On the other hand, the
2.21 21.2 skull contained an average of 7 per cent more so-dium per unit of calcium than did rib or ilium.
0.60 -.e Appendicular skeleton was not analyzed.Muscle cell sodium. Based on the data for
o.1h 10 muscle analyses of 13 rats by Cotlove, Holliday,Schwartz, and Wallace (6) the sodium intracel-lular in muscle was taken as 0.6 mEq. per 100grams of fat free tissue. The muscle mass of the
L - rat was taken from the data of Caster, Poncelet,3.27 31L.
Simon, and Armstrong (25). These authors were10.X0 able to measure not only the muscle mass that was
7.16 68.6 easily dissected from the skeleton but also thefraction adhering after dissection. The latter
tute0 1I96 W"Ad fraction was determined either from the composi-1.r.9 di. tion of the ash or from the determination of
actomyosin. The muscle mass of 320 to 350-gramn gave an aver- rats of good nutritional status was found by thesemne salt sodium. authors to average 45.5 per cent of body weight.f the bone salt In a 220-gram rat the muscle mass would closelyiessment of elec- approximate 100 grams and would contain 0.6e large fraction mEq. per L. sodium in the intracellular space.Possible sources Erythrocyte sodium. After Bernstein (8), the.timation of the sodium concentration of red cell water is taken
easoum:tin Ic- as 28 mEq. per L. The value of 0.14 mEq. forie as that of the total red cell sodium was calculated in the manner
esis 2 The gene described for erythrocyte chloride.alcium ratio of Sodium in lumen of the gastrointestinal tract.ldy with that of The quantity of sodium in the transcellular fluid(22) by flame in the gastrointestinal tract was determined as for
um suggests the chloride by the flushing procedure. The sodium
s. The validity recovered averaged 0.43 mEq. with the range ofhave the same 0.35 to 0.50. The amount in the 220-gram rat
m content of the aIf in the rat the sodium: calcium ratio of the skullhe total body cal- were greater than the rest of the skeleton by 5 per cent
epresented by the as appears to be the case in the human, the error result-mne sample weights ing from neglect of this discrepancy in the present calcu-:d 1.45 grams and lations would be minimal. The dried skull of a 220-grammEq. per gram rat weighs 1.42 grams (24). Assuming the calcium con-
calcium content in tent of dried skull to be 10.7 mEq. per gram and a 5skeleton as FFDS per cent greater sodium:calcium ratio for skull, theighing 10.4 grams. bone sodium would be greater than that found in thethe average 14 per present calculation by 0.015 mEq. This amount repre-
sents 0.02 per cent of the total body sodium.
346.

THE PARTITIONING OF SODIUM AND CHLORIDE IN THE RAT
TABLE VI
Average values and range for bone cakium, sodium and chloride content and the bone salt sodium: bone cakcium ratio
Sodium inChloride chloride
Sodium Calcium Chloride space spaceNo. of mEq./100 gm. mEq./100 gm. mElq.100 gm. ml. 100 gM. mEq./100 gm. Bone salt sodiumrats FFDS FFDS FFDS FFDS FFDS Bone calcium
5 29.7 1,074.4 6.83 55.1 8.23 0.020032.8-26.7 1,032-1,109 8.65-5.23 0.0187-0.0205
would be 0.32 mEq. or slightly more than 3 percent of total body sodium.Sodium intracellular in viscera. As mentioned
above the liver was considered to contain no in-tracellular sodium; the volume of distribution ofthis ion was considered as a measure of the extra-cellular space. In the rest of the viscera studied(lungs, gastrointestinal tract and testes) the com-parison of the inulin with the sodium space wasused to assess the amount of sodium located in-tracellularly. For the comparison, the sodiumspace was corrected for the amount of sodiumfound by the flushing procedure to be present inthe gut lumen. The correction amounted to 0.43mEq. As may be seen in Table IV the inulinspace approximates the corrected sodium spaceafter six hours of inulin infusion. The data havebeen interpreted to indicate that no sodium ispresent within the cells of the viscera.
Estimation of extracellular sodium space. Sum-ming up these corrections in Table V, it is seenthat the sodium outside the extracellular space ina 220-gram rat would be 3.27 mEq. or 31.4 percent of total body sodium.For calculation of the extracellular sodium
space, the value for extracellular sodium (7.16mEq.) has been divided by the average sodiumconcentration in a serum ultrafiltrate. Serum so-dium concentration in 15 normal rats averaged146.7 mEq. per L. and the calculated serum ul-trafiltrate concentration, 149.6 mEq. per L. Theresultant extracellular sodium space of 47.9 ml.is in good agreement with the extracellular chlo-ride space of 47.4 ml.
Partitioning of body water, sodium, and potas-sium. Total body water in a 220-gram rat averaged149.4 ml. (Table I). Assuming extracellularvolume as 48 ml. the extracellular phase wouldconstitute 32 per cent of total body water or 21.8per cent of body weight.
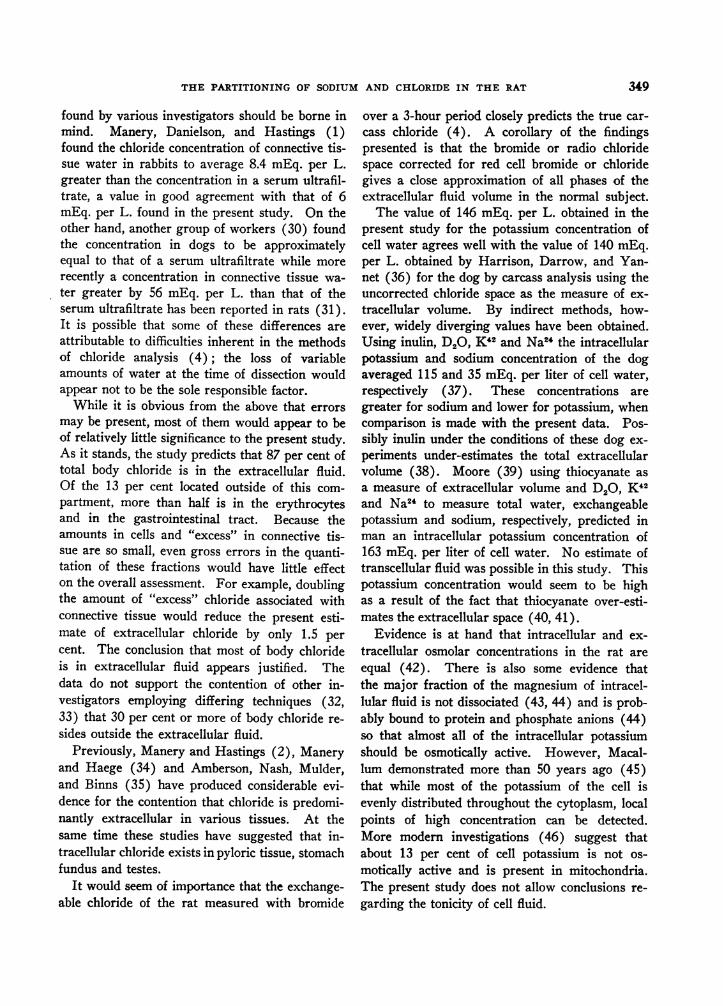
The partitioning of sodium in the body and thenet concentrations of body sodium, potassium andmagnesium in intracellular water are shown inFigure 1. For the calculation of intracellular vol-ume, the volume of fluid within the gut was deter-mined on six rats of 220-gram weight. The av-erage value was 3.6 ± 0.42 (SD)ml. Subtractingthis value and that of 48 ml. for extracellular vol-ume from total body water gives 97.8 ml. for thevolume of intracellular water. Extracellular po-tassium in a 220-gram rat was calculated as 0.19mEq. The net concentration of potassium in cellwater calculated as shown in Figure 1, would be146 mEq. per liter. Sodium concentration in cellwater, similarly calculated, would be 7.4 mEq. perliter.For the calculation of the magnesium concen-
tration of cell water the data of Duckworth, God-den, and Warnock (26) have been used. Theseauthors found the calcium: magnesium ratio ofrat bone to be 41.8. From this ratio and from to-tal body calcium it may be calculated that 2.68mEq. of magnesium are in the bones of a 220-gram
10-
:1g_B-
6
5.e
.5-W=
E4-
3.
2.~
THE PARTITIONING OF BODY SODIUM AND THE AMOUNT OF CELLMg, Na AND K PER LITER OF CELL WATER IN A 220 GRAM RAT
fat free dry solid * 50 gramsTotal Sodium-10.43 mEq
-,.. .....
..,...^.-.gst;.
:.:"£X...... '' ;.; .....,, :,..'.
",,
i' '.:, "I ", "
."' .;., ',w'..'. ,.' e ,.n
.i';
...... X God ffla2 S
5,0. ,S ,.v ;is
;.S Sit. ,2. ,.:k..... t,< Ps oral
_ ys At * to ...
E C FN;- Cl space (corrected) xaveBoneNa3N7, for Bone xCotNeCaCell No' Nat-(ECFNG+BoneeNOa+GutNa)(K) Kt-Ke
(Na) . Cell NaICy
(Mg Mg~{Ca forBonex Cat)CV
184
154
it
._a
CL
uc
-W
E
7.
FIG. 1.
347

DONALD B. CHEEK, CLARK D. WEST, AND CATHERINE CARTER GOLDEN
rat, leaving 3 mEq. in the soft tissues. Neglectingextracellular magnesium the cell water concen-tration of magnesium would be 30 mEq. per liter.This value agrees well with that of 33 mEq. perliter found by other investigators (6) for the mag-nesium concentration of muscle cell water. Simi-larly, from the calcium: phosphorus ratio for bone(26) and from total body calcium it can be cal-culated that 35.3 mMols of phosphorus (or 83per cent of total body phosphorus) are present inbone.
DISCUSSION
For the precise interpretation of change in in-tracellular electrolyte during metabolic studiesand for the proper partitioning of electrolyte inthe body it is desirable that extracellular and in-tracellular volumes be defined. The present studyhas approached the problem of volume measure-ment by determining extracellular volume fromextracellular chloride. An attempt has been madeto verify the result by demonstrating that the so-dium content of this extracellular volume corre-sponds in amount with that calculated from totalbody sodium minus the amounts present in boneand in cells. The good agreement of these inde-pendent approaches strongly suggests that extra-cellular volume has been correctly measured.
In spite of the good agreement, it should in allfairness be pointed out that errors could still existwhich, if present on both the sodium and chloridesides of the balance, would cancel out. Possibleerrors in the assessment of bone sodium and ofintraluminal gut sodium and chloride have alreadybeen mentioned. The exact quantitation of theamounts of sodium and chloride in visceral cellsis likewise a difficult problem and may be a sourceof error. If the assumption that no sodium ispresent in the cells of the viscera were incorrect,the error would balance out and not be detected bythe approach used. Recourse to inulin as amarker to divide the intra- from the extracellularphase has limitations. The technique of con-stant infusion and tissue analysis excludes the er-ror resulting from metabolism of inulin (27) butdoes not exclude error from accumulation of inu-lin in macrophages. Although inulin does notpenetrate most cells under ordinary circumstances,unexpectedly high values for inulin space are ob-tained in anuric patients (28) and in nephrecto-
mized rats (21). Under conditions of nephrec-tomy, many substances normally extracellular indistribution predict volumes which are unreason-ably high (29) and the possibility cannot be ex-cluded that under these conditions ions or mole-cules penetrate the cellular phase. White andRolf (21) using the nephrectomized rat and tis-sue analysis for inulin obtained a progressivelylarge inulin space which, after 72 hours, predictedvolumes exceeding total body water. Such find-ings may be related in some way to the removalof renal tissue, for the inulin space of rat musclewas significantly higher than that demonstratedby Cotlove (7) in animals with intact kidneysconstantly infused with inulin. In White andRolf's study (21), however, the anomaly wasgreatest in tissues rich in macrophages, such asliver, and the authors suggest that sequestrationof inulin can occur in macrophage cells. In thenon-nephrectomized animals in the present studyit was found that in liver, the inulin space greatlyexceeded both the sodium and chloride spaces af-ter 24 hours of infusion. Hence, absence of renaltissue appears not to be the sole factor responsiblefor the large inulin spaces of nephrectomized ani-mals. Whether in the other viscera studied, mac-rophage sequestration of inulin accounted for theincrease in inulin space relative to sodium spaceas the inulin infusion was prolonged to 24 hours(Table IV) cannot be determined. This inter-pretation seems the most plausible, however, whenthe data are considered from all aspects, and theuse of the six-hour inulin space, or the closelysimilar sodium space, as an approximation of ex-tracellular volume appears to be justified.A further source of error lies in the estimation
of the "excess" chloride of connective tissue. Itshould be noted that the calculations assume thatall of body collagen has an affinity for "excess"chloride equal to that of the large tendon massestaken for analysis. This assumption is probablyin the main correct, as pointed out by Manery,Danielson, and Hastings (1), insofar as the con-nective tissue of muscle, which accounts for themajority of body collagen, is a direct extension ofand probably similar in structure to tendon. How-ever, the collagen of bone matrix and in visceralorgans could well differ from tendon in its affinityfor chloride. Also the wide differences in theamount of excess chloride in connective tissue
348
THE PARTITIONING OF SODIUM AND CHLORIDE IN THE RAT
found by various investigators should be borne inmind. Manery, Danielson, and Hastings (1)found the chloride concentration of connective tis-sue water in rabbits to average 8.4 mEq. per L.greater than the concentration in a serum ultrafil-trate, a value in good agreement with that of 6mEq. per L. found in the present study. On theother hand, another group of workers (30) foundthe concentration in dogs to be approximatelyequal to that of a serum ultrafiltrate while morerecently a concentration in connective tissue wa-ter greater by 56 mEq. per L. than that of theserum ultrafiltrate has been reported in rats (31).It is possible that some of these differences areattributable to difficulties inherent in the methodsof chloride analysis (4); the loss of variableamounts of water at the time of dissection wouldappear not to be the sole responsible factor.While it is obvious from the above that errors
may be present, most of them would appear to beof relatively little significance to the present study.As it stands, the study predicts that 87 per cent oftotal body chloride is in the extracellular fluid.Of the 13 per cent located outside of this com-partment, more than half is in the erythrocytesand in the gastrointestinal tract. Because theamounts in cells and "excess" in connective tis-sue are so small, even gross errors in the quanti-tation of these fractions would have little effecton the overall assessment. For example, doublingthe amount of "excess" chloride associated withconnective tissue would reduce the present esti-mate of extracellular chloride by only 1.5 percent. The conclusion that most of body chlorideis in extracellular fluid appears justified. Thedata do not support the contention of other in-vestigators employing differing techniques (32,33) that 30 per cent or more of body chloride re-sides outside the extracellular fluid.
Previously, Manery and Hastings (2), Maneryand Haege (34) and Amberson, Nash, Mulder,and Binns (35) have produced considerable evi-dence for the contention that chloride is predomi-nantly extracellular in various tissues. At thesame time these studies have suggested that in-tracellular chloride exists in pyloric tissue, stomachfundus and testes.
It would seem of importance that the exchange-able chloride of the rat measured with bromide
over a 3-hour period closely predicts the true car-cass chloride (4). A corollary of the findingspresented is that the bromide or radio chloridespace corrected for red cell bromide or chloridegives a close approximation of all phases of theextracellular fluid volume in the normal subject.The value of 146 mEq. per L. obtained in the
present study for the potassium concentration ofcell water agrees well with the value of 140 mEq.per L. obtained by Harrison, Darrow, and Yan-net (36) for the dog by carcass analysis using theuncorrected chloride space as the measure of ex-tracellular volume. By indirect methods, how-ever, widely diverging values have been obtained.Using inulin, D2O, K42 and Na24 the intracellularpotassium and sodium concentration of the dogaveraged 115 and 35 mEq. per liter of cell water,respectively (37). These concentrations aregreater for sodium and lower for potassium, whencomparison is made with the present data. Pos-sibly inulin under the conditions of these dog ex-periments under-estimates the total extracellularvolume (38). Moore (39) using thiocyanate asa measure of extracellular volume and D20, K42and Na24 to measure total water, exchangeablepotassium and sodium, respectively, predicted inman an intracellular potassium concentration of163 mEq. per liter of cell water. No estimate oftranscellular fluid was possible in this study. Thispotassium concentration would seem to be highas a result of the fact that thiocyanate over-esti-mates the extracellular space (40, 41).
Evidence is at hand that intracellular and ex-tracellular osmolar concentrations in the rat areequal (42). There is also some evidence thatthe major fraction of the magnesium of intracel-lular fluid is not dissociated (43, 44) and is prob-ably bound to protein and phosphate anions (44)so that almost all of the intracellular potassiumshould be osmotically active. However, Macal-lum demonstrated more than 50 years ago (45)that while most of the potassium of the cell isevenly distributed throughout the cytoplasm, localpoints of high concentration can be detected.More modern investigations (46) suggest thatabout 13 per cent of cell potassium is not os-motically active and is present in mitochondria.The present study does not allow conclusions re-garding the tonicity of cell fluid.
349

DONALD B. CHEEK, CLARK D. WEST, AND CATHERINE CARTER GOLDEN
SUMMARY
An attempt has been made to determine theamount of sodium and chloride in the extracellularfluid in the rat by correcting total body sodiumand chloride for the amounts of these ions whichare outside the extracellular fluid. Correctionsfor chloride included the "excess" chloride ofconnective tissue calculated from total body col-lagen and the results of tendon analysis, chlo-ride intracellular in liver calculated from the so-
dium space of liver, and chloride in the lumen ofthe gut determined from analysis of gut contents.Erythrocyte chloride was calculated from data inthe literature. The intracellular chloride of therespiratory and gastrointestinal tracts and in thetestes was assessed by tissue analysis after theconstant infusion of inulin. From data of otherinvestigators, it was concluded that no chlorideis present intracellularly in muscle.
It was found that 87.3 per cent of body chloridecan be considered as present in extracellular fluid.The chloride in erythrocytes and in the gut lumen,representing 6.1 and 2.4 per cent of total bodychloride, respectively, account for the bulk of thenon-extracellular chloride.To obtain extracellular sodium, total body so-
dium was corrected for bone salt sodium, calcu-lated as the product of the Na/Ca ratio for boneand total body calcium, and for sodium in the lu-men of the gut, determined from the analysis ofgut contents. Data in the literature were usedfor the calculation of erythrocyte sodium and forthe intracellular sodium of muscle.For a 220-gram rat, extracellular fluid volume
calculated from chloride was found to be 47.4 ml.as compared with 47.9 ml. calculated from sodium.The good agreement between these values sug-
gests that this approach and the corrections usedare valid. Extracellular volume would thus rep-
resent 21.8 per cent of body weight or 32 per cent
of body water.From the data for extracellular volume and
from other parameters of body composition ob-tained from carcass analysis and from the litera-ture, the theoretical net concentrations of potas-
sium, sodium and magnesium in cell water havebeen calculated.
REFERENCES
1. Manery, J. F., Danielson, I. S., and Hastings, A. B.,Connective tissue electrolytes. J. Biol. Chem.,1938, 124, 359.
2. Manery, J. F., and Hastings, A. B., The distributionof electrolytes in mammalian tissues. 3. Biol.Chem., 1939, 127, 657.
3. Nichols, G., Jr., Nichols, N., Weil, W. B., and Wal-lace, W. M., The direct measurement of the ex-tracellular phase of tissues. J. Clin. Invest., 1953,32, 1299.
4. Cheek, D. B., and West, C. D., An appraisal ofmethods of tissue chloride analysis: the total car-cass chloride, exchangeable chloride, potassiumand water of the rat. J. Clin. Invest., 1955, 34,1744.
5. Cheek, D. B., and West, C. D., Alterations in bodycomposition with sodium loading and potassiumrestriction in the rat: the total body sodium, ni-trogen, magnesium and calcium. J. Clin. Invest,1956, 35, 763.
6. Cotlove, E., Holliday, M. A., Schwartz, R., and Wal-lace, W. M., Effects of electrolyte depletion andacid-base disturbance on muscle cations. Am. J.Physiol., 1951, 167, 665.
7. Cotlove, E., Mechanism and extent of distribution ofinulin and sucrose in chloride space of tissues.Am. J. Physiol., 1954, 176, 396.
8. Bernstein, R. E., Potassium and sodium balance inmammalian red cells. Science, 1954, 120, 459.
9. Wang, C. F., and Hegsted, D. M., Normal bloodvolume, plasma volume and thiocyanate space inrats and their relation to body weight. Am. J.Physiol., 1949, 156, 218.
10. Consolazio, W. V., and Talbott, J. H., Modificationof the method of Shohl and Bennett for the deter-mination of potassium in serum and urine. J.Biol. Chem., 1938, 126, 55.
11. Cheek, D. B., and Golden, C. C., Total body potas-sium in the rat: gravimetric determination ascompared with flame photometry. In manuscript.
12. Butler, A. M., and Tuthill, E., An application of theuranyl zinc acetate method for determination ofsodium in biological material. J. Biol. Chem.,1931, 93, 171.
13. Edelman, I. S., James, A. H., Baden, H., and Moore,F. D., Electrolyte composition of bone and thepenetration of radiosodium and deuterium oxideinto dog and human bone. J. Clin. Invest., 1954,33, 122.
14. Spencer, H. C., Morgulis, S., and Wilder, V. M., Amicromethod for the determination of gelatin anda study of the collagen content of muscles fromnormal and dystrophic rabbits. J. Biol. Chem.,1937, 120, 257.
15. Kellogg, R. H., Burack, W. R., and Isselbacher, KJ., Comparison of diuresis produced by isotonicsaline solutions and by water in rats studied by a
350

THE PARTITIONING OF SODIUM AND CHLORIDE IN THE RAT
"steady state" method. Am. J. PhysioL, 1954, 177,27.
16. Schreiner, G. E., Determination of inulin by meansof resorcinol. Proc. Soc. Exper. Biol. & Med.,1950, 74, 117.
17. Ross, G., and Mokotoff, R., Determination of inulinin muscle. J. Biol. Chem., 1951, 190, 659.
18. Conway, E. J., Microdiffusion Analysis and Volu-metric Error. 2nd ed., London, C. Lockwood,1950, Chap. 23 and 24.
19. Van Slyke, D. D., The determination of chlorides inblood and tissues. J. Biol. Chem., 1923, 58, 523.
20. White, H. L., and Rolf, D., Whole tissue electrolyteanalyses in normal and adrenalectomized rats.Am. J. Physiol., 1955, 180, 287.
21. White, H. L., and Rolf, D., Inulin space as a func-tion of equilibration time. Am. J. Physiol., 1956,185, 152.
22. Bergstrom, W. H., The participation of bone in totalbody sodium metabolism in the rat. J. Clin. In-vest., 1955, 34, 997.
23. Agna, J. W., and Knowles, H. C., Jr., Personal com-munication.
24. Donaldson, H. H., Ed., The Rat; Data and Refer-ence Tables for the Albino Rat (Mus norvegicusalbinus) and the Norway Rat (Mus norvegicus).2nd ed., rev., Philadelphia, 1924 (Memoirs of theWistar Institute of Anatomy and Biology, No. 6).
25. Caster, W. O., Poncelet, J., Simon, A. B., and Arm-strong, W. D., Tissue weights of the rat. I. Nor-mal values determined by dissection and chemicalmethods. Proc. Soc. Exper. Biol. & Med., 1956,91, 122.
26. Duckworth, J., Godden, W., and Warnock, G. M.,The effect of acute magnesium deficiency on boneformation in rats. Biochem. J., 1940, 34, 97.
27. Deane, N., and Smith, H. W., Fate of inulin and su-crose in normal subjects as determined by a urinereinfusion technique. J. Clin. Invest., 1955, 34,681.
28. Finkenstaedt, J. T., O'Meara, M. P., and Merrill,J. P., Failure of equilibration of inulin in anuricsubjects. J. Clin. Invest., 1952, 31, 627.
29. McDonald, I. R., Coats, D. A., and Munro, J., Bodywater and electrolyte changes in bilaterally ne-phrectomized sheep. Australian J. Exper. Biol. &M. Sc., 1954, 32, 275.
30. Muntwyler, E., Mellors, R. C., Mautz, F. R., andMangun, G. H., Electrolyte and water equilibriain the dog. III. Electrolyte and water exchangebetween tendon and blood. J. Biol. Chem., 1940,134, 389.
31. Levitt, M. F., Turner, L. B., Sweet, A. Y., andPandiri, D., The response of bone, connective tis-sue, and muscle to acute acidosis. J. Clin. Invest.,1956, 35, 98.
32. Deane, N., Ziff, M., and Smith, H. W., The distri-bution of total body chloride in man. J. Clin. In-vest., 1952, 31, 200.
33. Burch, G. E., Threefoot, S. A., and Ray, C. T., Ratesof turnover and biologic decay of chloride and chlo-ride space in the dog determined with the long-lifeisotope, Cir. J. Lab. & Clin. Med., 1950, 35, 331.
34. Manery, J. F., and Haege, L. F., The extent to whichradioactive chloride penetrates tissues, and its sig-nificance. Am. J. Physiol., 1941, 134, 83.
35. Amberson, W. R., Nash, T. P., Mulder, A. G., andBinns, D., The relationship between tissue chlorideand plasma chloride. Am. J. Physiol., 1938, 122,224.
36. Harrison, H. E., Darrow, D. C., and Yannet, H., Thetotal electrolyte content of animals and its prob-able relation to the distribution of body water.J. Biol. Chem., 1936, 113, 515.
37. Levitt, M. F., and Gaudino, M., Use of radioactiveisotopes to measure intracellular cation concen-trations in the normal dog. Am. J. Physiol.,1949, 159, 67.
38. Swan, R. C., Madisso, H., and Pitts, R F., Meas-urement of extracellular fluid volume in nephrec-tomized dogs. J. Clin. Invest., 1954, 33, 1447.
39. Moore, F. D., Determination of total body water andsolids with isotopes. Science, 1946, 104, 157.
40. Wilde, W. S., The chloride equilibrium in muscle.Am J. Physiol., 1945, 143, 666.
41. Overman, R. R., Davis, A. K., and Tharp, E., Bloodand "extracellular" fluid volumes and ionic balancein human therapeutic malaria. Federation Proc.,1947, 6, 174.
42. Conway, E. J., and McCormack, J. I., The total in-tracellular concentration of mammalian tissuescompared with that of the extracellular fluid. J.Physiol., 1953, 120, 1.
43. Conway, E. J., and Cruess-Callaghan, G., Magnesiumand chloride "permeations" in muscle. Biochem.J., 1937, 31, 828.
44. Tabor, H., and Hastings, A. B., The ionization con-stant of secondary magnesium phosphate. J. Biol.Chem., 1948, 148, 627.
45. Macallum, A. B., On the distribution of potassiumin animal and vegetable cells. J. Physiol., 1905, 32,95.
46. Holland, W. C., and Auditore, G. V., Distribution ofpotassium in liver, kidney and brain of the ratand guinea pig. Am. J. Physiol., 1955, 183, 309.
351