The Alameda Corridor – Lessons Learned
25
The Alameda Corridor: Lessons Learned Plus Past and Future Challenges Presented to: Portland State University May 14, 2010 By: Gill V. Hicks Cambridge Systematics, Inc.
-
Upload
trec-at-psu -
Category
Documents
-
view
193 -
download
1
Transcript of The Alameda Corridor – Lessons Learned

The Alameda Corridor: Lessons Learned
Plus Past and Future Challenges
Presented to:Portland State University
May 14, 2010 By:
Gill V. HicksCambridge Systematics, Inc.


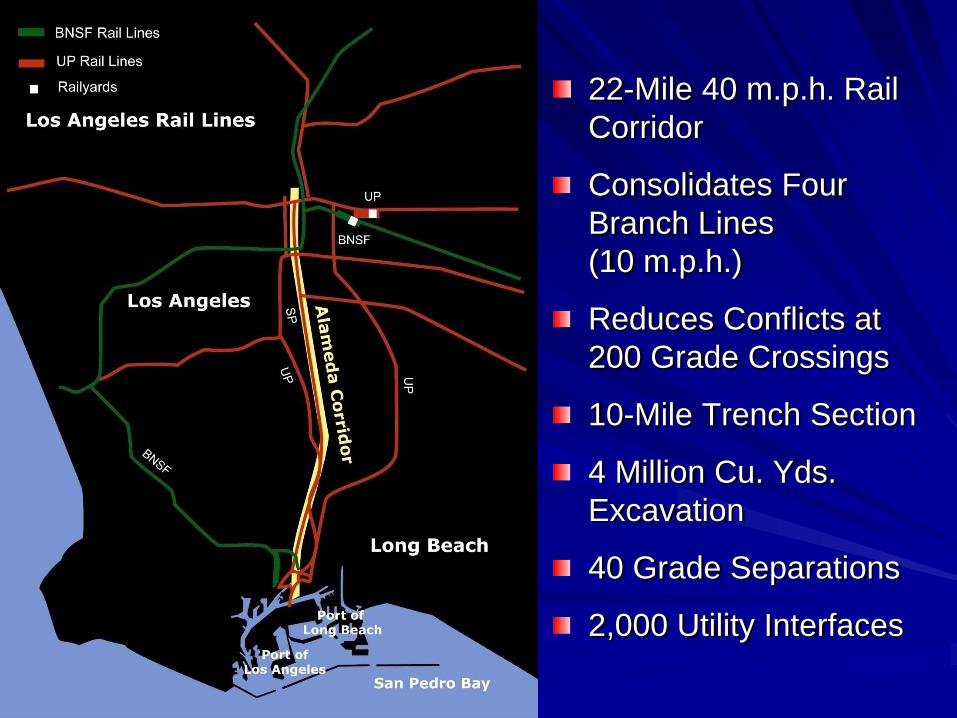
22-Mile 40 m.p.h. Rail Corridor
Consolidates Four Branch Lines (10 m.p.h.)
Reduces Conflicts at 200 Grade Crossings
10-Mile Trench Section
4 Million Cu. Yds. Excavation
40 Grade Separations
2,000 Utility Interfaces

5
Regional Rail System
Source: Multi-County Goods Movement Action Plan, 2006

Timeline1984 – SCAG Recommends Alameda Corridor1989 – Joint Powers Authority Formed1993, 1996 – EIR and EIS approved1997 – Construction begins1999 – $1.1 billion in revenue bonds sold; trench construction begins2002 – Corridor opens for business2008 – Major milestone: 100,000th train
Trench Excavation≈ 4,000,000 cubic yards≈ 9 cubic yards per scoop≈ 444,444 scoops

February 2010Daily train count: 37Revenue: $6.5 MDaily TEUs 10,395

Photo courtesy of the Alameda Corridor Transportation Authority
2009Alameda Corridor handled 13% of nation’s waterborne imports and exports.

Major Challenges During Development
Project definitionGovernance/relations with corridor citiesRailroad cooperation and participationConstruction and project deliveryEnvironmental managementJob training and local participationFund raising

Sources of Funding(in Millions)
Total Project Cost: $2.43 Billion* Federal loan already repaid. Refinanced with $686 M in new revenue bonds

2010 CHARGE PER TWENTY-FOOT EQUIVALENT UNIT (TEU)Effective January 1, 2010
USE FEES: *
Loaded Waterborne TEU: $19.60
Empty TEU and Loaded Non-Waterborne TEU: $4.96
Loaded Rail Cars, other than containers: $9.92 (per rail car)
CONTAINER CHARGE: **
Loaded Waterborne TEU: $19.60
* Uses Corridor**Trucked around Corridor but leaves or enters Southern California by rail.

Lessons LearnedNegotiate third-party agreements early.Concentrate on concurrent processing vs. sequential processing. (“Delay Kills”) Adopt a partnering program.Resolve change orders and disputes quickly.Carefully allocate risk between owner and contractor.Systematically identify obstacles.Maintain adequate contingency and reserves.Consider design-build, particularly for revenue driven projects.Understand how Fitch, Moodys, and S&P think.

Public-Private Partnerships: Keys to Success
Consensus on what to build, funding shares, method of paymentLegal authorityStable revenue streamFunding firewalls Appropriate allocation of riskCost and schedule controlExperienced project managementProduct orientation not process orientationFocused agency mission Clear decision making authority

The Seven C’s of Project Development

New Challenges Facing Alameda Corridor
Environmental challenges on new projectsRecessionLower cargo forecastsCredit ratingCompetition from other gateways

16
Competition from Other Regions
Panama Canal Improvements (2014)CREATE project: ($100 M TIGER, $100 M SAFETEA-LU, $133 M ARRA HSRP)Heartland Corridor ($95 M SAEFTEA-LU)Crescent Corridor ($105 M TIGER)National Gateway Corridor ($98 M TIGER)Prince Rupert and Canadian National Gateway Project

17
Heartland Corridor

18
Prince Rupert and Canadian National Railway

Container Traffic at California Ports 1984-2009 (Millions of TEUs)

20
Container Volumes (TEUs) 2008 and 20092008 2009 Percent Change
Prince Rupert 181,894 265,259 +45.8%Vancouver, BC 2,492,107 2,152,462 -13.6%Seattle 1,704,492 1,584,596 -7.0%Tacoma 1,861,352 1,545,855 -16.9%Portland 245,459 174,203 -29.0%Oakland 2,236,244 2,050,030 -8.3%Los Angeles 7,849,985 6,748,995 -14.0%Long Beach 6,487,816 5,067,597 -21.9%LA/LB combined 14,337,801 11,816,592 -17.6%Manzanillo 1,409,782 1,110,356 -21.2%Lazaro Cardenas 524,791 591,467 +12.7%Houston 1,794,309 1,795,324 +0.1%Charleston 1,635,534 1,370,000 -16.2%Hampton Roads 2,083,278 1,745,228 -16.2%NY/NJ 5,265,053 4,550,032 -13.6%Savannah 2,616,125 2,356,573 -9.9%

21
2010Inbound
LoadsOutbound
Loads Empties TotalPOLB
January – April 873,742 497,041 378,989 1,749,772
% Change from 2009 18.8% 20.7% 7.4% 16.6%
POLAJanuary – April 1,135,525 609,324 499,113 2,243,962
% Change from 2009 5.1% 22.7% 3.4% 9.0%
Both PortsJanuary – April 2,009,267 1,106,365 878,102 3,993,734
% Change from 2009 10.7% 21.8% 5.1% 12.2%
POLA/POLB Container Volumes (TEUs) January - April 2010

22
San Pedro Bay Ports Container Forecasts (millions of TEUs)
Source for 2015, 2020, 2030 values: IHS Global Insight and The Tioga Group, May 2009
Previous Current Difference
2008 (actual) 14.3 14.3 0
2009 (actual) 11.8 11.8 0
2015 27.6 17.0 10.6
2020 36.7 21.8 14.9
2030 43.2 34.6 8.6
2035 43.2 43.2 0

0
5
10
15
20
25
30
35
40
45
Mill
ion
TEU
s
Actual 2009 Forecast 2007 Forecast
Existing Capacity=28.5 @2027
Future Capacity=43.2 @2035
Port of LA and Port of LB Cargo Forecast2009 vs. 2007
Source: The Tioga Group, Inc.– July 2009 Forecast

Conflicting Opinions“Regardless of efforts to develop alternative West Coast gateways, Los Angeles and Long Beach will remain the primary entry points for eastbound imports into the U.S.” Waterfront Coalition“Up to 25% of the US West Coast ports’ present cargo base (primarily hinterland cargo) could be lost to the East Coast and Gulf ports in the decade to come…Without radical action, intermodal distribution [from the West Coast] to the Midwest and beyond will gradually die.” Drewry Supply Chain Advisors“The expansion of the canal will be a bump, not a sea change. We won’t see much of a change — maybe a percent or two —because most of the big retailers are already going all-water.” Prof. Asaf Ashar, National Ports and Waterways Institute, Univ. of New Orleans

STAY TUNED!