The Aging Population Source: U.S. Census Bureau Percent Growth in U.S. Population, 1986-2006 by Age...
43
The Aging Population
-
Upload
bailey-worman -
Category
Documents
-
view
216 -
download
2
Transcript of The Aging Population Source: U.S. Census Bureau Percent Growth in U.S. Population, 1986-2006 by Age...

The Aging Population

Source: U.S. Census Bureau
Percent Growth in U.S. Population, 1986-2006by Age Bracket
14%17%
22%
12%
-1%
-7%
0%
19%
62%
94%
84%
55%
19%
11%
57%
-20%
0%
20%
40%
60%
80%
100%
<5 5-9 10-14 15-19 20-24 25-29 30-34 35-39 40-44 45-49 50-54 55-59 60-64 65-74 75+

Source: U.S. Census Bureau
Growth in U.S. Population Over Five-Year Intervals, 1986-2006
-15%
-10%
-5%
0%
5%
10%
15%
20%
25%
30%
35%
<5 5-9 10-14 15-19 20-24 25-29 30-34 35-39 40-44 45-49 50-54 55-59 60-64 65-74 75+
1986-91 1991-96 1996-2001 2001-06

Source: U.S. Department of Education/U.S. Census Bureau
The Impact of Traditional Students on Total College Enrollment
75%
80%
85%
90%
95%
100%
105%
110%
115%
120%
125%
130%
135%
140%
84-85
86 87 88 89 90 91 92 93 94 95 96 97 98 99 00 01 02 03 04 04-05
Index: 1985 = 100%
Total Enrollment
First-Time Freshmen
18-Year Olds

Source: U.S.Department of Education
Student Enrollments, 1986-2016by Age Bracket
750,000
1,750,000
2,750,000
3,750,000
4,750,000
5,750,000
6,750,000
7,750,000
8,750,000
9,750,000
10,750,000
11,750,000
1985-86 1991 1996 2001 2006 2011 2015-16
18-24
30-34
25-2935+

Source: U.S. Department of Education
College Enrollment Profile, 1986-2016by Age Bracket
0%
20%
40%
60%
80%
100%
1985-86 1991 1996 2001 2006 2011 2015-16
18-24
30-34
35+25-29

Undergraduate Enrollment by Attendance Status 1986-2016
Source: U.S. Department of Education
0
2,000,000
4,000,000
6,000,000
8,000,000
10,000,000
12,000,000
85-86
88 90 92 94 96 98 00 02 04 06 08 10 12 14 15-16
Full-time Part-Time
5,618,000
9,009,000
5,094,000
7,169,000
6,259,000
10,333,000
4,271,000
6,348,000
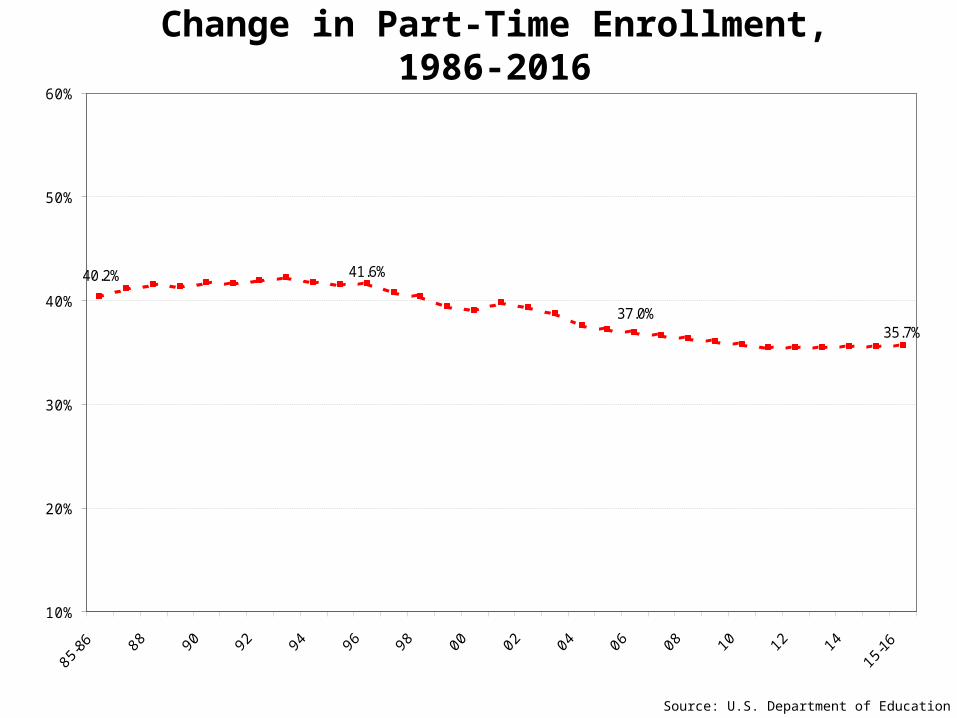
Change in Part-Time Enrollment, 1986-2016
Source: U.S. Department of Education
10%
20%
30%
40%
50%
60%
40.2% 41.6%
35.7%37.0%

Graduate and Professional Enrollment, 1986-2016by Attendance Status
Source: U.S. Department of Education
0
300,000
600,000
900,000
1,200,000
1,500,000
1,800,000
Full-time Part-time
1,341,000
1,173,000
983,000
1,046,000
1,715,000
1,293,000
755,000
894,000

Source: U.S. Department of Education
Gender and Attendance Status1985-2015
10%
15%
20%
25%
30%
35%
40%
PT Men
FT Men
PT Women
FT Women

Growing Ethnic Diversity

Source: U.S. Census Bureau
Growth Rate of U.S. Population by Ethnic Group1981-2051
100%
200%
300%
400%
500%
600%
700%
800%
900%
1000%
1981 1991 2001 2011 2021 2031 2041 2051
Index: 1981 = 100%
Black
White
Hispanic
Asian

Source: U.S. Census Bureau
Growth in U.S. Population by Ethnic Group1981-2051
0
50,000,000
100,000,000
150,000,000
200,000,000
250,000,000
300,000,000
350,000,000
400,000,000
450,000,000
80-81 85-86 90-91 95-96 00-01 05-06 10-11 15-16 20-21 25-26 30-31 40-41 50-51
White Non-Hisp Black Hispanic Asian

Source: U.S. Department of Education
Concentration of Minorities Enrolled in Public Elementary/Secondary Schools, 2003-04,
and Selected Changes from 1993-94
36% to 50%
21% to 35%
10% to 20%
More than 50%
Less than 10%
+19.7%
+9.9%
+10.1%
+19.4%
+9.0%
+10.4%
+10.1%
+9.6%
+11.2%

Source: U.S. Census Bureau
High School Graduation Rates by Ethnic Group1999-2006
40%
50%
60%
70%
80%
90%
100%
05-0604-0503-0402-0301-0200-0199-0098-99
White, non-Hispanic
Black
Hispanic
Asian

Source: U.S. Census Bureau
College-Going Rates of High School Graduates Aged 18 to 24 by Ethnic Group, 1999-2006
20%
25%
30%
35%
40%
45%
50%
55%
60%
65%
70%
05-0604-0503-0402-0301-0200-0199-0098-99
White, Non-Hispanic
Black
Hispanic
Asian

Source: U.S. Department of Education
Concentration of Minorities Enrolled in Higher Education, 2005-06
and Selected Changes from 1994-95
21% to 30%
11% to 20%
0 to 10%
31% to 40%
More than 40%
+12.4%
+10.6%
+12.5%
+11.7%
+13.6%
+15.4%
+9.9%
+14.8%
+9.4%
+10.9%
+10.5%
+9.0%
+9.7%
+10.5%
+11.6%
+9.8%
+9.0%

Growth in College Enrollment by Ethnic Group1994-95 to 2005-06
Source: U.S. Department of Education
90%
100%
110%
120%
130%
140%
150%
160%
170%
180%
94-95 96 97 98 99 00 01 02 03 04 04-05
Index: 1995 = 100%
Asian
Hispanic
American Indian
Black
White, Non-Hispanic

Racial-Ethnic Distribution in College Enrollment 1994-95 to 2005-06
Source: U.S. Department of Education
0%
10%
20%
30%
40%
50%
60%
70%
80%
90%
100%
94-95 96 97 98 99 00 01 02 03 04 04-05
White/ Non-Hispanic Black Hispanic Asian American Indian
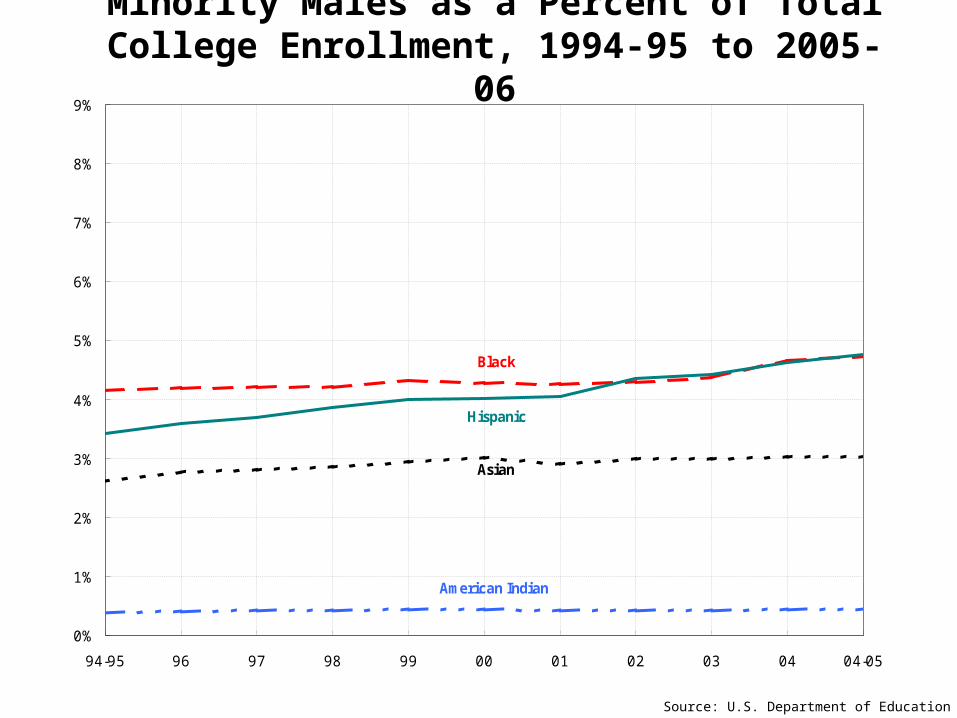
Minority Males as a Percent of Total College Enrollment, 1994-95 to 2005-06
Source: U.S. Department of Education
0%
1%
2%
3%
4%
5%
6%
7%
8%
9%
94-95 96 97 98 99 00 01 02 03 04 04-05
Black
Hispanic
Asian
American Indian

Minority Females as a Percent of Total College Enrollment, 1994-95 to 2005-06
Source: U.S. Department of Education
0%
1%
2%
3%
4%
5%
6%
7%
8%
9%
94-95 96 97 98 99 00 01 02 03 04 04-05
Black
Hispanic
Asian
American Indian

Ratio of Bachelor’s Degrees Earned to Enrollments1993-94 to 2003-04
Source: U.S. Department of Education
0%
1%
2%
3%
4%
5%
6%
7%
8%
9%
10%
11%
12%
93-94 95 96 97 98 99 00 01 02 03 03-04
White
American Indian
Hispanic
Black
Asian

2006 High School Seniors: Graduation and Four-Year College Enrollment
Selected States

2006 High School Seniors: Graduation and Four-Year College Enrollment: California
Source: The College Board/U.S. Department of Education
102,996
378,699
431,926
191,740
155,356
0 100,000 200,000 300,000 400,000 500,000
Fall 2006 enrolled 4-yr. colleges
2005-06 H.S. graduates
2005-06 H.S. seniors
2005-06 senior SAT
2004-05 junior PSAT

2006 High School Seniors: Graduation and Four-Year College Enrollment: Florida
Source: The College Board/U.S. Department of Education
59,868
146,682
165,350
94,601
54,045
0 37,000 74,000 111,000 148,000 185,000
Fall 2006 enrolled 4-yr. colleges
2005-06 H.S. graduates
2005-06 H.S. seniors
2005-06 senior SAT
2004-05 junior PSAT

2006 High School Seniors: Graduation and Four-Year College Enrollment: Massachusetts
Source: The College Board/U.S. Department of Education
34,630
77,683
81,554
59,529
48,500
0 18,000 36,000 54,000 72,000 90,000
Fall 2006 enrolled 4-yr. colleges
2005-06 H.S. graduates
2005-06 H.S. seniors
2005-06 senior SAT
2004-05 junior PSAT

2006 High School Seniors: Graduation and Four-Year College Enrollment: New York
Source: The College Board/U.S. Department of Education
89,751
165,998
153,518
124,657
179,167
0 40,000 80,000 120,000 160,000 200,000
Fall 2006 enrolled 4-yr. colleges
2005-06 H.S. graduates
2005-06 H.S. seniors
2005-06 senior SAT
2004-05 junior PSAT

2006 High School Seniors: Graduation and Four-Year College Enrollment: Ohio
Source: The College Board/U.S. Department of Education
55,089
118,725
131,119
34,970
54,398
0 30,000 60,000 90,000 120,000 150,000
Fall 2006 enrolled 4-yr. colleges
2005-06 H.S. graduates
2005-06 H.S. seniors
2005-06 senior SAT
2004-05 junior PSAT

2006 High School Seniors: Graduation and Four-Year College Enrollment: Texas
Source: The College Board/U.S. Department of Education
81,098
252,493
257,298
129,784
144,497
0 56,000 112,000 168,000 224,000 280,000
Fall 2006 enrolled 4-yr. colleges
2005-06 H.S. graduates
2005-06 H.S. seniors
2005-06 senior SAT
2004-05 junior PSAT

Other Trends Affecting Higher Education

Source: U.S. Census Bureau
Percent Change in Resident Population, 1985-2005by College Board Region
6.4%
5.5%
15.3%
5.1%
12.9%
22.1%
5.7%
4.9%
15.4%
2.3%
24.8%
17.3%
0.0% 5.0% 10.0% 15.0% 20.0% 25.0% 30.0% 35.0% 40.0% 45.0%
New England
Middle States
South
Midwest
Southwest
West
85-95 95-05
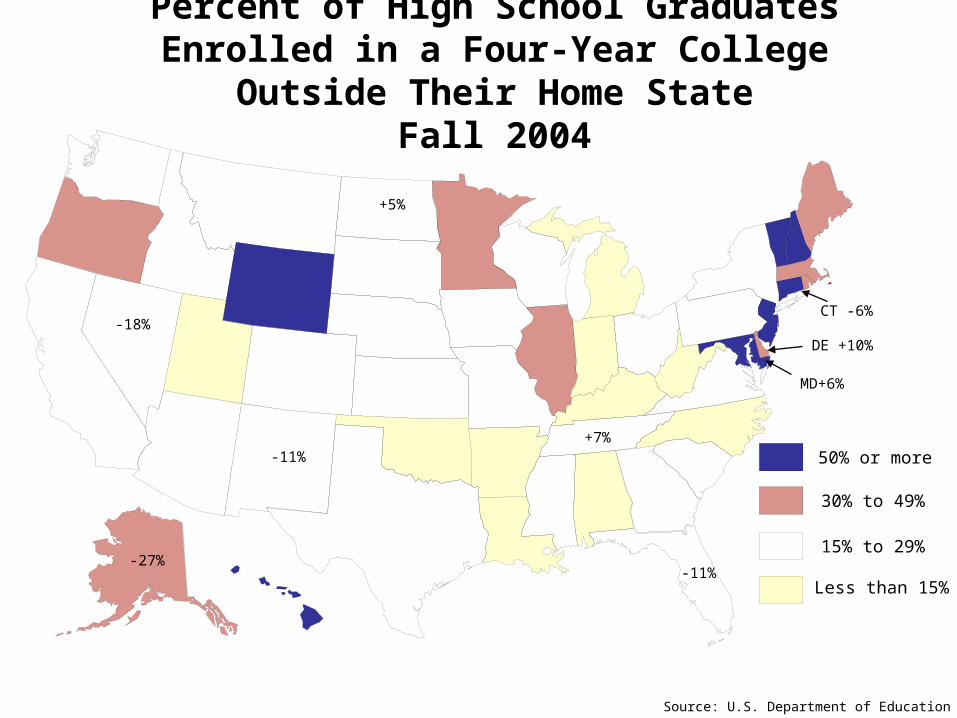
Source: U.S. Department of Education
Percent of High School Graduates Enrolled in a Four-Year College Outside Their Home State
Fall 2004
30% to 49%
15% to 29%
Less than 15%
50% or more
DE +10%
-11%-27%
-9%
-6%
-18%
-11%
CT -6%
MD+6%
+7%
+5%

Source: U.S. Census Bureau
States with Largest Net Migration of Four-YearCollege Freshmen, Fall 2004
7,525
6,567
5,699
4,680
4,568
3,999
-2,331
-3,273
-7,003
-7,676
-8,056
-10,207
-22,187
12,165
-30,000 -24,000 -18,000 -12,000 -6,000 0 6,000 12,000 18,000
Pennsylvania
North Carolina
District of Columbia
Indiana
Massachusetts
Florida
Utah
New York
Minnesota
California
Texas
Maryland
Illinois
New Jersey

Source: CIRP
Change in Intended Major 1976-77 to 2006-07
0%
7%
14%
21%
28%
Business Engineering Education BiologicalSciences
ComputerScience
SocialSciences
Art, Music,Drama
HealthProfessions
76-77 86-87 96-97 06-07

Trends in College Costs and Financial Aid
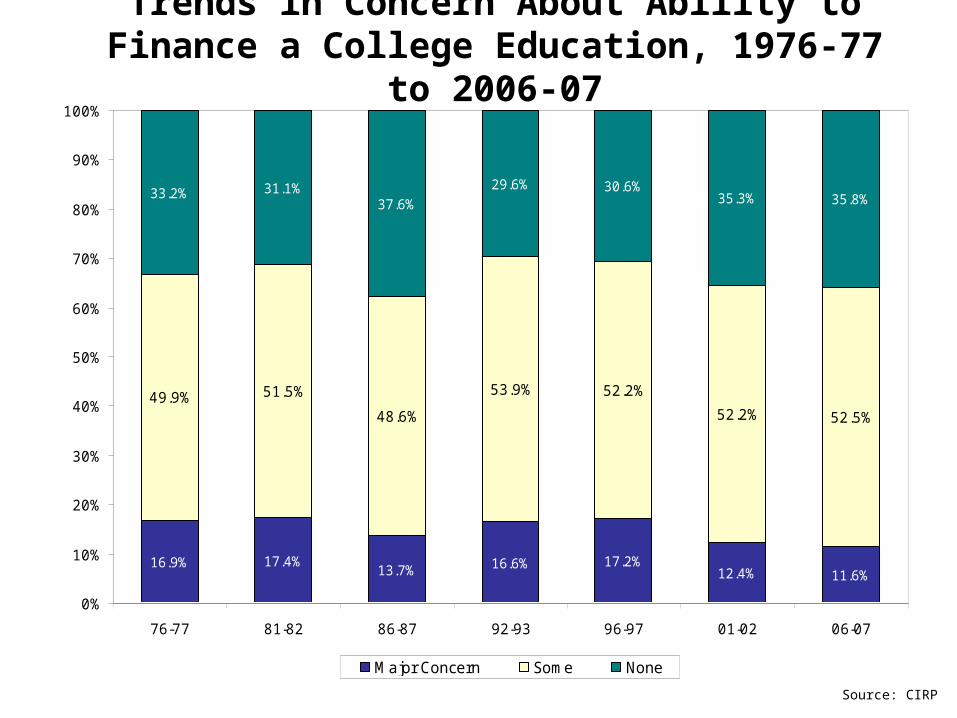
Trends in Concern About Ability to Finance a College Education, 1976-77 to 2006-07
Source: CIRP
16.9% 17.4%13.7% 16.6% 17.2%
12.4% 11.6%
49.9% 51.5%
48.6%
53.9% 52.2%
52.2% 52.5%
33.2% 31.1%37.6%
29.6% 30.6%35.3% 35.8%
0%
10%
20%
30%
40%
50%
60%
70%
80%
90%
100%
76-77 81-82 86-87 92-93 96-97 01-02 06-07
Major Concern Some None

Percent For Whom Financing was a Major Concern 1992-93 to 2006-07 (Selected Years)
Source: CIRP
0%
5%
10%
15%
20%
25%
92-93 94-95 96-97 97-98 99-00 00-01 01-02 02-03 03-04 04-05 05-06 06-07
Public Univ Private Univ Public 4-Yr Private (Non-Sect) 4-Yr

Trends in Rate of Increase in Total Four-Year College Costs, 1979-80 to 2005-06
Source: U.S. Department of Education
0%
2%
4%
6%
8%
10%
12%
14%
16%
79-80
81 82 83 84 85 86 87 88 89 90 91 92 93 94 95 96 97 98 99 00 01 02 03 04 04-05
Public
Private
CPI
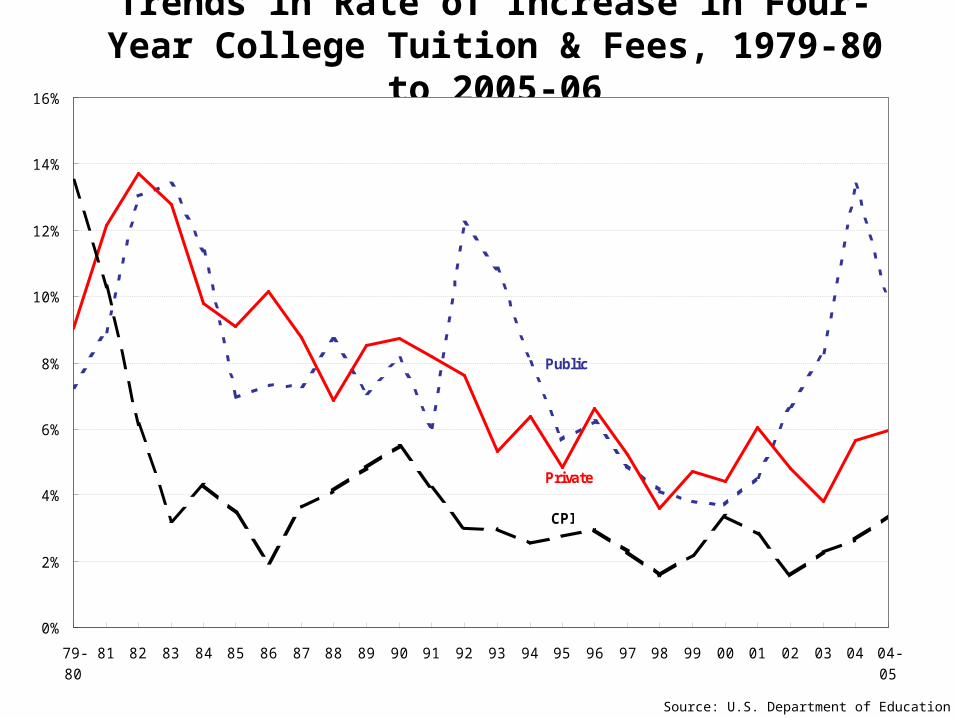
Trends in Rate of Increase in Four-Year College Tuition & Fees, 1979-80 to 2005-06
Source: U.S. Department of Education
0%
2%
4%
6%
8%
10%
12%
14%
16%
79-80
81 82 83 84 85 86 87 88 89 90 91 92 93 94 95 96 97 98 99 00 01 02 03 04 04-05
Public
Private
CPI

College Costs and Disposable Per Capita Income, 1996-97 to 2006-07
Source:The College Board
$0
$5,000
$10,000
$15,000
$20,000
$25,000
$30,000
$35,000
1996-97 1997-98 1998-99 1999-2000
2000-01 2001-02 2002-03 2003-04 2004-05 2005-06 2006-07
Private 4-Year Public 4-Year Per Capita Income
Published Charges

Year-to-Year Change in College Costs and Disposable Income, 1996-97 to 2006-07
Source:The College Board
0%
1%
2%
3%
4%
5%
6%
7%
8%
9%
10%
95-96 to 96-97
96-97 to 97-98
97-98 to 98-99
98-99 to 99-00
99-00 to 00-01
00-01 to 01-02
01-02 to 02-03
02-03 to 03-04
03-04 to 04-05
04-05 to 05-06
05-06 to06-07
Private 4-Year Public 4-Year Per Capita Income
Change in published charges

Types of Financial Aid as a Percentage of Total, 1995-96 to 2005-06
Source:The College Board
0%
10%
20%
30%
40%
50%
60%
95-96 96-97 97-98 98-99 99-00 00-01 01-02 02-03 03-04 04-05 05-06
Grants
Loans
Work
Tax Benefits

Sources of Financial Aid as Percentage of Total, 1995-96 to 2005-06
Source:The College Board
0%
20%
40%
60%
80%
100%
95-96 96-97 97-98 98-99 99-00 00-01 01-02 02-03 03-04 04-05 05-06
Federal: Generally Available Federal: Specially Directed Education Tax BenefitsInstitutional Grants State Grants Private & Employer GrantsNon-Federal Loans