
- Initial Public Offerings, Investment Banking, and Financial Restructuring.
1
THE AFTERMARKET PERFORMANCE OF INITIAL PUBLIC OFFERINGS
IN CANADA
MAHER KOOLI
JEAN-MARC SURET
School of Accounting, Laval University, Quebec
and CIRANO, Montréal
Fisrt draft,
April 30, 2001
_____________________________
[email protected]; [email protected]. We gratefully acknowledge
the financial support of the SSRH (Grant 67816)
2
THE AFTERMARKET PERFORMANCE OF INITIAL PUBLIC OFFERINGS
IN CANADA
ABSTRACT
In this paper, we empirically investigate Canadian initial public offerings (IPOs) to provide one case on the international evidence on the long-run performance of IPOs. Specifically, we examine whether the choice of a performance measurement methodology directly determines both the size and power of statistical test, as documented in previous studies (Mitchell and Stafford, 2000; Loughran and Ritter, 2000; and Brav, Geczy and Gompers, 2000). Our sample consists of 445 IPOs between January 1991 and December 1998. Using cumulative abnormal returns as an abnormal performance measure, we find that the Canadian IPOs underperform significantly the sample of seasoned firms with the same market capitalization. More specifically, the 3 year and the 5 year underperformances estimated on value weighted (VW) basis are statistically significant. Moreover, using the buy-and hold returns as an alternative measurement for long-run performance, we find that investors who buy immediately after listing and hold shares for five years will make a loss of 24,66%, on equally weighted (EW) basis (15,16% on VW basis) relative to an investment in the control firms. Using the calendar-time returns method, we find that the 5 years underperformance is �25,6% on EW basis (�19,22% on VW basis). We have entertained a number of possible explanations for the poor subsequent performance of issuing firms. While, the fads or investor�s overreactions and divergence of opinions hypotheses do not apply in explaining the aftermarket performance of Canadian IPOs, our evidence is consistent with the hot issue market story.
Keywords: Initial public offerings; Underpricing; Aftermarket performance;
3
INTRODUCTION
A large volume of research has demonstrated that investors purchasing initial public
offerings (IPO�s) of common stocks earn a large positive abnormal return in the early
aftermarket period. However, researchers have documented that the gains from early
price appreciation are not sufficient to compensate the losses that occur throughout
subsequent price declines.
Ritter (1991) finds a significant mean market-adjusted return of �29,13% at the end of the
third year following the offering for a sample of 1,526 IPO�s over the period from 1975
to 1984. Further, Ritter (1991) reports that the underperformance is concentrated among
younger firms and firms that went public in the heavy-volume years. Indeed, for more
established firms going public, and for those that went public in the light-volume years of
the mid and late 1970�s, there is no long run underperformance. IPO�s that are not
associated with venture capital financing, and those not associated with high-quality
investment bankers, also tend to do especially poorly. These findings are in conformity
with Loughran and Ritter (1995) who, for 4,753 U.S companies going public in the
period from 1970 to 1990, document the underperformance of IPO�s relative to seasoned
firms with the same market capitalization. Aggarwal and Rivoli (1990) similarly find
negative aftermarket performance of �13,73% in the first year following the initial
offering for 1,435 IPO�s in the period from 1977 to 1987. However, the
underperformance of new issues in the aftermarket has not been documented in all
studies and the international evidence is varied (Loughran et al. (1994)). These
international variations are due, in part, to the differences in regulations, contractual
mechanisms, and characteristics of companies going public (Firch (1997)). Further
research on the long-term stock return performance of IPO�s and in different market
settings seems warranted.
The purpose of this paper is to investigate the long run stock price behaviour of
unseasoned new issues (IPO�s) in Canada. The Canadian environment is interesting
because a large number of the quoted companies are relatively small. Furthermore, the
institutional characteristics of the Canadian market allow for an independent test of the
most well-known issues in the US literature. Canadian IPO�s are still uncovered by
4
researchers. It is also important to study the performance of the IPO�s in the long run. As
Ritter (1991) points out, if systematic price patterns exist in the long run, then this raises
questions concerning aftermarket efficiency. Recently, many researchers such as Brav,
Geczy and Gompers (2000), Brav and Gompers (1997) and Barber and Lyon (1997),
have debated the approaches to long run performance measurement and have examined
the possible existence of a distinct performance anomaly. These authors argue that the
choice of a performance measurement methodology directly determines both the size and
the power of a statistical test and they have criticized the results of many previous
studies. The IPO market is in continuous mutation considering the introduction of new
mechanisms (Direct initial offerings, Dutch auctions, Internet auctions)1. In this context,
if the underpricing or the high initial return is still a mystery, then the aftermarket
underperformance is an even bigger one.
Our sample consists of 445 IPO�s for the period from 1991 to 1998. We use three
methodologies to analyse the relative performance of IPO�s. Using cumulative abnormal
returns as an abnormal performance measure, we find that the Canadian IPO�s
underperform significantly compared to the sample of seasoned firms with the same
market capitalization. The underperformances for 36 and 60 month periods are
statistically significant (on value weighted basis). Moreover, using the buy-and-hold
returns as an alternative measurement for long-run performance, we find that investors
who buy immediately after listing and hold their shares for five years, will make a loss of
24,66% (on equally weighted basis), as opposed to a 15,16% (on value weighted basis)
relatively to an investment in the control firms. Using the calendar-time returns method,
we found that the 5 years underperformance of the IPO�s is �25,6% (on equally weighted
basis) and �19,22% (on value weighted basis). When the sample is segmented by
industry, we notice that the long-run performance of IPO�s varies widely in different
industries. Mining, oil & gas and technology issues show poorer performances than those
of other sectors. We have entertained a number of possible explanations for the poor
subsequent performance of issuing firms. While, the fads or investor�s overreactions and
divergence of opinions hypothesis do not apply in explaining the aftermarket
1 See Biais and Faugeron (2000)
5
performance of Canadian IPO�s, our evidence is fitting with a market where firms take
advantage of windows of opportunity by issuing equity during periods where the
price/earning ratio is high.
The remainder of this paper is organized as follows. Section 1 reviews some of the
international literature on IPO stock market performances and underlines some reasons
for the aftermarket underperformance and the international variations in observed
performances. We also discuss the methodological dimension of measuring the
aftermarket performance. Section 2 contains a discussion of the data and methodology
used in the empirical investigation. Evidence on aftermarket underperformance is
presented in the section 3. We also present the cross-sectional patterns and the results of
multiple regression tests. Section 4 summarizes the findings and provides concluding
remarks.
1. AFTERMARKET PERFORMANCE: THEORETICAL AND METHODOLOGICAL REASONS
1.1- PRIOR RESEARCH
While there is a consensus that average initial underpricing should and does exist in the
IPO market (see table 1), the aftermarket performance provides conflicting findings with
some studies indicating negative, positive or even zero aftermarket performance. In an
early study, Ibbotson (1975) does not reject the hypothesis that the abnormal returns in
the aftermarket are zero. Recently, Paudyal et al. (1998) have reported that the
performance of IPO�s in Malaysia is not different from the performance of the market
portfolio; the IPO�s with higher initial return underperform compared to the market while
those with low initial return outperform the market. In addition, they found that the long-
term performance of IPO�s is positively related to the reputation of the under-writers. If
these results are confirmed, the underpricing will explain the underperformance of
IPO�s2. Buser and Chan (1987) report positive risk-adjusted returns (11,2%) in the two
years after listing for their sample of 1,078 NASDAQ stocks in the period from 1981 to
1985. Jacquillat and al. (1978) report positive aftermarket returns to IPO�s in France
2 To separate the short-run phenomenon and the underperformance, it seems important to consider the performance of IPO�s from the issue price and from the closed price of the first day.
6
during the period from 1966 to 1974. Kim and al. (1995) find that Korean IPO�s
outperform seasoned firms with similar characteristics. They sustained that �high
causality bias� explains the aftermarket underperformance observed in the U.S. and other
international findings. For example, about 17% of the sample firms in Ritter (1991)
experienced subsequent changes in listing details. The bias is even more severe according
to Levis (1993) who reports that 30% of IPO�s were de-listed within a 3-year period
following their initial listing in the U.K.. Kim and al. (1995) also report that the large
degree of underpricing in Korea may explain their results. If they exclude the first month
return, they find that the Korean IPO�s are characterized by neither over-performance nor
underperformance when compared to seasoned firms.
Negative aftermarket returns for IPO�s have been reported by Ritter (1991), Aggarwal
and Rivoli (1990), Loughran and Ritter (1995), Levis (1993), Aggarwal, Leal and
Hernandez (1993), and Firth (1997). Levis (1993) reports long-run underperformance of
�22.96% by the third year after the offering in the UK for 712 IPO�s between 1980-1988.
Aggarwal, Leal and Hernandez (1993) report three-year market-adjusted returns of �47%,
-19.6% and �23.7% for Brazil, Mexico and Chile, respectively. Firth (1997) finds that, in
average, the new issues in New Zealand underperform the market significantly and the
level of long term underperformance is considerably related to profit forecast accuracy,
corporate earnings and cash flows, and the growth rate.
Brav and Gompers (1997) compared the performance of venture and non-venture capital-
backed IPO�s to various benchmarks and found that matching IPO�s to similar size and
book-to-market firms eliminated the underperformance reported by Loughran and Ritter
(1995). They also suggest that we should look more broadly at the types of firms that
underperform and not treat IPO firms as a different group. Studies in Australia (Finn and
Higham, 1988), Germany (Uhler, 1989), and Hong Kong (McGuinness, 1993) all
reported negative aftermarket performance but the abnormal returns they found did not
achieve statistical significance, so this is an evidence of market efficiency in the
aftermarket. Clearly, there are international variations in observed performance and
further research seems warranted. These international variations are due, in part to the
7
contractual mechanisms and characteristics of companies going public, which are related
to the reasons of the aftermarket underperformance. They are also due to the choice of a
performance measurement methodology which directly determines both size and power
of the statistical test3. These methodological measurements are discussed following the
reasons of the underperformance.
1.2- REASONS FOR THE AFTERMARKET UNDERPERFORMANCE
Theoretical explanations for the long-run underperformance of IPO�s are less than
abundant. Aggarwal and Rivoli (1990) establish the possibility that the aftermarket is not
immediately efficient in valuing newly issued securities and that the abnormal returns
that ensue to IPO investors are the result of a temporary overvaluation by investors in the
early trading. This is consistent with the "impresario" hypothesis or the fads4 hypothesis
(Shiller (1990) and Debondt and Thaler (1985, 1987)), which argues that the market for
IPO�s is subject to fads and that IPO�s are underpriced by the investment bankers (the
impresarios) to create the appearance of excess demand, just as the promoter of a rock
concert attempts to make it an �event�. This hypothesis predicts that: the greater the
initial return at the IPO date, the greater the degree of subsequent correction of
overpricing by investors will tend to be and the lowest subsequent returns should be.
Miller (1997 and 2000) confirm the difference of opinion hypothesis to explain the
underperformance of IPO�s. He suggested that the investors who are most optimistic
about an IPO will be its buyers. If there is a great deal of uncertainty about the value of
an IPO, there will be differences of opinion between the optimistic investors and the
pessimistic investors. As the information flows increase with time, the divergence of
expectations decreases and thus the prices are adjusted downwards. Miller predicts that
the greater the initial divergence of opinion and uncertainty, and the greater the
diminution over time are, the more the security should underperform the market. To test
this hypothesis we expect to see a negative relation between the ex-ante uncertainty and 3 Ritter (1991) suggests that the selection of a benchmark portfolio, the length of the period over which the performance is measured, and the sample selection criterion might explain the differences in observed performances. 4 A fad is defined to be a temporary overvaluation caused by over-optimism on the part of investors. Fads are more likely to occur for less certain stocks or stocks held by �noise traders� (Camerer, 1989).
8
the aftermarket performance. One proxy for ex-ante uncertainty is size. For small firms
with little or no operating history it seems clear that there would be a great deal of
uncertainty. The age of the firm and of the industry would be other plausible proxies.
Ritter (1991) and Loughran and Ritter (1995) confirm the windows of opportunity
hypothesis to explain the aftermarket underperformance. This hypothesis predicts that
firms going public in high volume periods are more likely to be overvalued than the other
IPO�s. This has the testable implication that the high-volume periods should be
associated with the lowest long-run returns. This pattern exists indeed in U.S.. Loughran
and Ritter (1995) affirmed that, for the IPO�s, the prior rapid growth of many of the
young companies makes it easy to justify high valuations by investors who want to
believe that they have identified the next Microsoft.
Jain and Kini (1994, p. 1740) point out that the �successful timing or window-dressing
actions taken by issuers may result in potential investors having high, and systematically
biased, expectations of earnings growth in the post-issue period�. These authors found
that IPO firms exhibit a decline in post-issue operating performance in comparison to
their pre-IPO levels. This declining can be attributed to the reduction in management
ownership that occurs when a firm goes public, which is likely to lead to the agency
problem described in Jensen and Meckling (1976).
Teoh, Welch, and Wong (1998) show that IPO underperformance is positively related to
the size of discretionary accruals in the fiscal year of the IPO. They document that
investors may misinterpret high earnings reported at the time of the offering, and
consequently overvalue the new issues. Then, when high pre-issue earnings are not
sustained, disappointed investors revalue the firm downwards. This scenario suggests that
issuers have unusually high income-increasing accounting adjustments and unusually
poor post-issue earnings and return performance.
Overall, we conclude that the investor�s sentiment towards an IPO are an important factor
in the underperformance of IPO�s, if there is one.
9
1.3- PERFORMANCE MEASURE METHODOLOGY
There are several alternative explanations for the aftermarket underperformance. Ritter
(1991) suggests that the selection of a benchmark portfolio, the length of the period over
which the performance is measured, and the sample selection criterion might explain the
differences in observed performances.
One major problem with long-run performance tests is the non-standard distribution of
long-run returns. Both Barber and Lyon (BL, 1997) and Kothari and Warner (KW, 1997)
show that typical tests performed in the literature suffer from potential biases. KW
document that test statistics designed to detect long-run abnormal returns are positively
biased, while BL document that the test statistics are generally negatively biased. Also,
BL recommend the use of buy-and-hold abnormal returns in tests designed to detect long
�run abnormal stock returns because cumulative abnormal returns are a biased predictor
of long term buy-and-hold abnormal returns (BHAR).
Lyon, Barber and Tsai (1999) confirm that the analysis of buy-and-hold abnormal returns
is warranted if a researcher is interested in answering the question of whether sample
firms earned abnormal stock return or not over a particular horizon of analysis. On the
other hand, the cumulative abnormal return or mean monthly abnormal return over a long
horizon are warranted if we are want to answer the following question : do sample firms
persistently earn abnormal monthly returns ?
Among approaches used to measure the aftermarket performance, we retained the next
two, which have recently drawn the attention of many researchers. The first approach is
using the mean buy-and-hold abnormal return as an estimator of long term abnormal
performance. The biggest advantage of this estimator is that it �precisely measures
investor experience� and the disadvantage is that it is more sensitive to the problem of
cross-sectional dependence among sample firms5. To address this problem Ikenberry,
Lakonishok and Vermaelen (1995) and Lee (1997) advocate the use of the bootstrapping
approach for statistical inference. However, several researchers seem sceptical using this
approach. Mitchell and Stafford (2000) emphasize the problem of cross-sectional
dependency and point out that the major corporate actions are not random events, and
5 See Brav (2000).
10
that event samples are unlikely to consist of independent observations. In particular,
major corporate events cluster through time by industry. This leads to positive cross-
correlation of abnormal returns making test statistics severely overstated. Lyon, Barber
and Tsai (1999) also find that this approach may not yield reliable statistical inference
when the sample clusters on some common factors. Jegadeesh (2000) concludes that the
bootstrapping approach is cumbersome to implement.
The second approach is recommended by Fama (1998) and Mitchell and Stafford (2000)
and is based on calendar-time portfolios6. The major advantage of this approach is that it
eliminates the problem of cross-sectional dependence among firms, since the returns on
sample firms are aggregated into a single portfolio. However, this approach, unlike buy-
and-hold approach, does not measure investor experience and remains sensitive to the
bad-model problem, as discussed by Fama (1998)7. Lyon and al. (1999) again argue that
the calendar-time has a lower power to detect abnormal performance because it averages
over the months of « hot » and « cold » event periods8. On the other hand, Mitchell and
Stafford (2000) contradict the results of Loughran and Ritter (1999), who advocate the
BHAR approach and confirm that the calendar-time approach is robust to most serious
statistical problems. Lyon and al. (1999, p 29) conclude « Our central message is that the
analysis of long-run abnormal returns is treacherous ». They suggest as a pragmatic
solution to use both approaches and that�s what we do here.
By comparing alternative approaches, we are able to examine the robustness of our
results. The buy-and-hold strategy is easy to implement by an individual investor who
makes portfolio allocation choices only infrequently. Large institutional investors will,
6 Fama (1998) and Mitchell and Stafford (2000) argue that abnormal performance measures such as cumulative abnormal returns and time series regressions at the monthly frequency, for example, are less likely to yield spurious rejections of market efficiency relative to methodologies that calculate buy-and-hold returns by compounding single period returns. Buy-and-hold method can magnify underperformance, even if it occurs in only a single period. 7 Fama (1998, p. 292) notes that « Bad-model problems are of two types. First, any asset pricing model is just a model and so does not completely describe expected returns.(…). If an event sample is titled toward small stocks, risk adjustment with the CAPM can produce spurious abnormal returns. Second, even if there were a true model, any sample period produces systematic deviations from the model’s predictions ». 8 To control this problem, Mitchell et Stafford (2000) suggest to standardize the monthly calendar-time abnormal returns series by estimates of the portfolio standard deviation.

11
however, be interested on measures based on quite frequent trading and rebalancing
portfolios.
Loughran and Ritter (1998) point out that the choice of the weighting scheme is also
important due to power considerations. Given that, should sample returns be equal or
value weighted ?
Brav and al. (2000) and Lyon and al. (1999) advocate the use of the equally weighting
returns if significant misevaluations are greater among small firms than among big firms.
Loughran and Ritter (1998, p. 3) note that « (�) a traditional event study approach in
which all observations are weighted equally will produce point estimates that are
relevant from the point of view of a manager, investor, or researcher attempting to
predict the abnormal returns associated with a random event. More generally, as Fama
(1998) notes, the weighting scheme should be determined by the economic hypothesis of
interest ». Considering this statement, we will use equally weighting returns.
Nevertheless, we also present results using value-weighting returns in section 3 to
quantify investors� average wealth change subsequent to an event..
It is clear that no winner has emerged as the optimal methodology in term of statistical
properties. However, the choice of a performance measurement methodology directly
determines both the size and the power of statistical test. Fama (1998) documents that if
abnormal returns disappear with reasonable changes in the way they are measured, the
anomaly itself is an illusion and IPO�s belongs to this category. Thus, if there is an IPO
anomaly, it seems to be largely restricted to tiny firms. Schwert (2001) concluded that
« Does this reflect sample selection bias (so that there was never an anomaly in the first
place » Or, does it reflect the actions of practioners in learning about the anomaly and
trading in such away that it no longer remains profitable? ». To this question, the answer
is unclear.
12
2. DATA AND METHODOLOGY
2.1- SAMPLE
Our original sample numbered 563 IPO�s9 listed in the Toronto Stock Exchange,
Montreal Stock Exchange, Vancouver Stock Exchange and Alberta Stock Exchange. The
primary source of data is the �Record of New Issues: Annual Report by the Financial
Post Datagroup� which reports offering dates, offering prices, issue size and the name of
the underwriter. Out of these 563 IPO�s, 118 IPO�s had to be dropped for three reasons:
First of all, Datastream used to obtain the prices at the end of the first day of trading and
the last day of the period does not cover the over the counter (CDN) listed companies.
Second of all, return data, proceed of offering or price issue were not available. Finally,
22 IPO�s were listed on the US market. This resulted in a final sample of 445 IPO�s
between January 1991 and December 1998.
Table 2 presents the distribution of the sample by year, both in terms of the number of
offers and the gross proceeds. Further inspection of the table 2 shows that 321of the 445
sample offers (72,16%) occurred over 1993, 1994, 1996 and 1997. 62,84% ($9212,3
millions of the $14657 millions total) of the aggregate gross proceeds in the sample were
raised in these four years alone and the rest (37,16% or $5445,6 millions of the $14657
millions total) was raised by the 124 IPO�s that occurred over 1991, 1992, 1995 and
1998. This result is consistent with the notion of hot issues market (Ritter, 1991).
Following this, we consider the years 1993, 1994, 1996 and 1997 as hot period and 1991,
1992, 1995, 1998 as cold period.
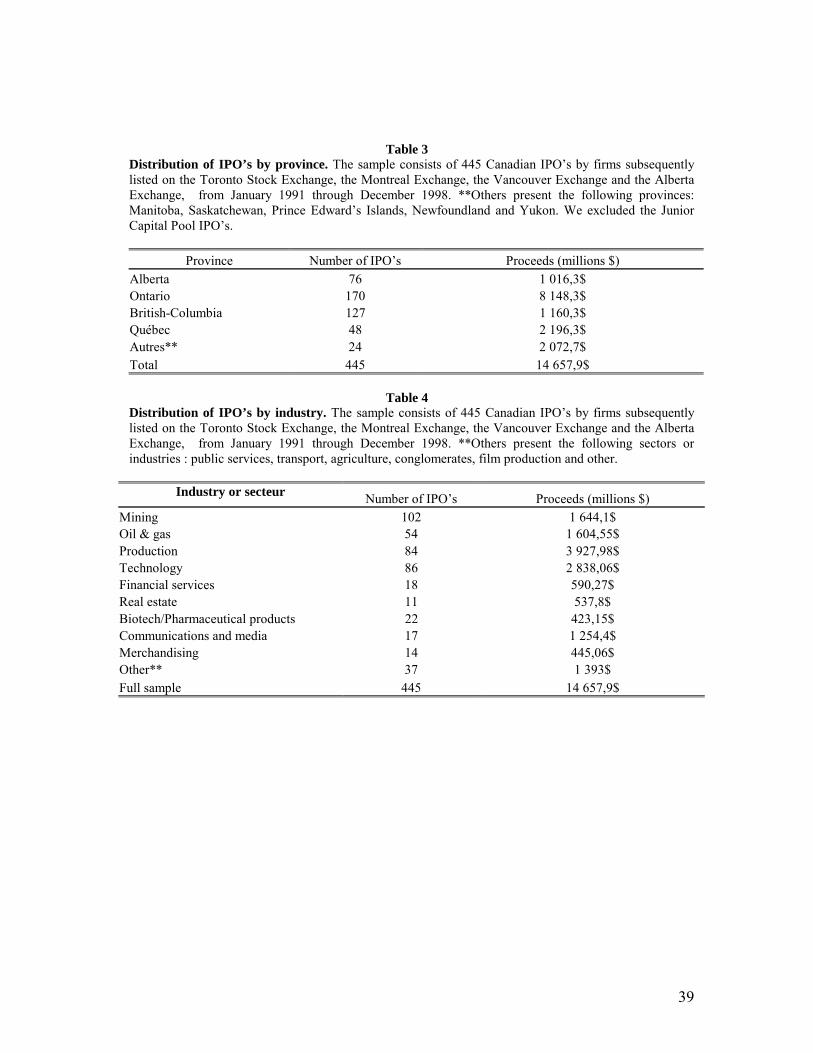
Table 3 presents the distribution of the sample by province, both in terms of the number
of offers and the gross proceeds. Further inspection of table 3 shows that the sample is
diversified across four provinces: The largest amount of gross proceeds occurs in Ontario
($8148,3 millions for 170 IPO�s of 445 total IPO�s, 38,2%), followed by Quebec
($2196,3 millions for 48 IPO�s of 445 total IPO�s, 10,78%), British Columbia ($1160,3
9 Units, Closed-end funds, real estate investment trusts and Junior Capital Pool companies are excluded from our sample. Unit offering are excluded because separating the value of the offerings components is difficult. Junior Capital Pool
13
millions for 127 IPO�s of 445 total IPO�s, 28,35%) and Alberta ($1016,3 millions for 76
IPO�s of 445 total IPO�s, 17,07%).
Table 4 presents the distribution of the sample by industry, both in terms of the number
of offers and the gross proceeds. Inspection of table 4 shows that the sample also covers
different industries. Oil & gas and mining, represent 156 IPO�s of 445 total IPO�s (35%
of the sample). About 22% ($3248,65 millions of the $14657,9 millions total) of the
aggregate gross proceeds in the sample was raised by these industries.
2.2- METHODOLOGY
Recently, Barber and Lyon (1997), Kothari and Warner (KW, 1997), Mitchell and
Stafford (2000), Loughran and Ritter (1998), Lyon et al. (1999) and Brav and al. (2000)
have debated the approaches to long-run performance measurement and have examined
whether a distinct performance anomaly exists or not. These authors argue that the choice
of a performance measurement methodology directly determines both the size and power
of statistical test.
Given this debate, we intend to use three measures to evaluate the long-run performance
of initial public offerings:
a) Cumulative average adjusted returns (CAR) calculated with monthly rebalancing,
where the adjusted returns are computed using a sample of control firms.
b) The buy-and-hold abnormal returns (BHAR).
c) The calendar-time abnormal returns (CTAR)
The aftermarket period includes the following 60 months where months are defined as
successive 21-trading-day periods relatively to the IPO date. Thus, month 1 consists of
event days 2-22, month 2 consists of event days 23-43, etc.
Monthly benchmark-adjusted returns are calculated as the monthly raw return on a stock
minus the monthly benchmark return for the corresponding 21-trading-day period.
Loughran et Ritter (1995) exclude the initial returns from the calculation of the
aftermarket performance. However, we think that the abnormal behaviour of IPO�s is
related to the misevaluation. To dissociate the error of evaluation made by investors at
14
early hours of first trading day from the �error� made by underwriters, we suggest to also
measure the aftermarket performance by the issue price10. This enables us to take a look
at the performance of the IPO�s acquired by mostly institutional investors, who have the
chance to buy at the issue price and also to examine the performance of IPO�s acquired
by individual investors at the market price.
First, the benchmark-adjusted returns for stock i in event month t is defined as
arit = rit – rmt (1)
where rit is the return for firm i in event month t and rmt is the return on the benchmark
during the corresponding time period.
The average benchmark-adjusted return on a portfolio of n stocks for event month t is the
equally-weighted arithmetic average of the benchmark-adjusted returns:
ARt = 1/nt∑=
tn
iitAR
1
(2)
The cumulative benchmark-adjusted return for the aftermarket performance from event
month q to event month s is the summation of the average benchmark-adjusted returns:
CARqs = ∑=
s
qttAR (3)
The statistical significance of cumulative abnormal returns is assessed by:
tCAR1,t =t
it
nCAR
/)(CAR itσ (4)
Where )(CAR itσ is the cross-sectional sample standard deviations of abnormal returns
for the sample of n firms and nt is the number of IPO�s on month t.
Following Barber and Lyon (1997), we prefer the use of cross-sectional standard errors
because requiring pre-event return data, from which a time-series standard errors can be
estimated, intensifies the new listing bias.
More specifically, the statistical test for the CAR1t is:
tCAR1,t = CAR1, t * tn / cov]*1)-(t*2 var *[t + (5)
10 Thus month 1 consists of event days 1-21, month 2 consists of event days 22-42, etc.

15
Where var is the average of the cross-sectional variations over 60 months of the arit, and
var is the first order auto-covariance of the ARt series.
The second measure we use is based on the calculation of the T holding period return11 as
an alternative to the use of the cumulative benchmark-adjusted returns (no portfolio
rebalancing is assumed in these calculations), defined as:
RiT = )1(1 itrTt +=∏ (6)
Where T is number of months and rit is the raw return on firm i in event t. This measures
the total return from a buy and hold strategy where a stock is purchased at the first
closing market price after going public and held until the earlier of its T anniversary.
The holding period return on the benchmark during the corresponding period for firm i,
RmT is also similarly calculated.
The mean buy-and-hold return is calculated as
RT = 1/n
∑
=
N
iiTR
1 (7)
The buy-and-hold abnormal return (BHAR) is defined as follows:
BHARi,T =
−+=∏ 1)1(1 itrT
t -
−+=∏ 1)1(1 mtrT
t (8)
Where rmt is the return on the benchmark during the corresponding time period.
The mean buy-and-hold abnormal returns for a period t is defined as:
BHARt = ∑=
nt
1iitit BHAR x (9)
The weight xit is 1/nt when abnormal returns are equally-weighted and MVit /
∑=
nt
iitMV
1when abnormal returns are value weighted, MV is the market value and nt is the
number of companies during the period.
11 Roll(1983, p. 377) point out that buy-and- hold method « (…) gives an unbiased estimate of the holding period return on a realistic portfolio ».
16
To test the null hypothesis of zero mean buy-and-hold return, we preferred the skewness-
adjusted t statistic advocated by Neyman and Pearson (1928) and recently used by Lyon
et al (1999). The t statistic is defined as:
t = n ×××× ( )γ�6n1 γ� 3
1S S2++ (10)
where S = t
t
(BHAR) Mean(BHAR)
σ ; t = 12, 24, 36, 48 et 60 months;
�γ is an estimate of the coefficient of skewness.
The third measure we use is based on the calendar-time portfolio methods, which
eliminate the problem of cross-sectional dependence among sample firms.
We assume that the event period is five years. For each calendar month, we calculate the
abnormal return (ARit):
ARit = rit – rmt (11)
where rit is the return for firm i in event month t and rmt is the return on the benchmark
during the corresponding time period.
In each calendar month t, we calculate a mean return (MARt) across firms in the
portfolio :
MARt = ∑=
nt
iitit ARx
1 (12)
The weight xit is 1/nt when abnormal returns are equally-weighted and MVit / ∑=
nt
iitMV
1
when abnormal returns are value weighted and nt is the number of firms in the portfolio
in month t. This number in calendar-time portfolio varies from month to month. If in a
particular calendar month there are no firms in the portfolio, then that month is dropped.
The monthly MAR are standardized by estimates of the portfolio standard deviation, for
two reasons (Mitchell and Stafford, 2000). First, we control for heteroskedasticity and
second, we give more weight to periods of heavy event activity than periods of low event
activity (the portfolio residual variance is decreasing in portfolio size, all things equal).
Then, we calculate a grand mean monthly abnormal returns (MMAR) using standardized
MARt:
17
MMAR = 1/ T ×××× ∑=
T
1itrdized)MAR(standa (13)
where T are the total number of calendar months.
To test the null hypothesis of zero mean monthly abnormal returns, a t statistic is
calculated using the time-series standard deviation of the mean monthly standardized
abnormal returns :
t(MMAR) = MMAR / σσσσ(MAR(standardized)t ) ×××× T (14)
Barber et Lyon (1996) present three ways to control the calculation of excess returns: the
reference portfolio, the three factor model of Fama and French (1993) and the control
firms. They document however, in comparing control firm approach to the reference
portfolio that the control firm approach eliminates the new listing bias (since both the
sample and control firm must be listed in the identified event month), the rebalancing
bias (since both the sample and control firm returns are calculated without rebalancing),
and the skewness problem (since the sample and control firm are equally likely to
experience large positive returns).
On the other hand, in comparing the use of the reference portfolio to the use of Fama-
French model to control the excess returns, Lyon and al. (1999) show that the latter
assumes implicit linearity in the constructed market, size, and book-to-market factors,
which is not verified at least during their period of analysis (1973-1994 ). They sustained
that the three factor model assumes there is no interaction between the three factors.
Loughran (1997) shows however that the relation between book-to-market ratio and
returns is most pronounced for small firms.
According to these studies, we use the control firms approach. However, the
measurement bias remains when the control firm approach and the cumulative abnormal
returns are used to detect long-run abnormal stock returns.
We choose a non-issuing matching firm for each issuing firm. To choose a matching
firm, on each December 31 all common stocks listed on the Canadian stock exchanges
that have not issued12 stock within the last five years are ranked by their market
12 Loughran and Ritter (2000) point out that �a test biased towards explanatory power and no abnormal returns if it uses a benchmark that is contaminated with many of the firms that are the subject of the test�.
18
capitalization. The firm whose market capitalization is between 80 and 120 % of that of
the issuing firm is then chosen as its matching firm. We also considered, but have
abandoned, the use of a control firm of similar size and book-to-market ratio13 since this
approach reduces considerably the number of firms in our sample14.
If the control firm is de-listed before the end of the year, we fill the missing return with
the matching control firm return, which respects the same filter (a market Capitalization
between 80 et 120 %). If a chosen matching firm subsequently issues stock, we treat it as
if it is de-listed on its� offering date.
We choose not to consider matching by industry because an industry can time its offers to
take advantage of industry-wide misevaluations. Controlling for industry effects will
reduce the ability to identify abnormal performance (Loughran and Ritter, 1995).
Finally, in calculating the BHAR�s for individual firms, if the sample firm is delisted, we
fill in the missing return with the control firm return. If the sample firm is delisted before
the end of the five years period, we do not rebalance the portfolio, so each BHAR is a
true buy-and-hold return.
3. LONG-TERM PERFORMANCE RESULTS
3.2- LONG-TERM PERFORMANCE MEASURED FROM THE ISSUE PRICE
Figure 1 provides evidence on relative performance with respect to our sample of control
firms. Table 5 provides a summary of results of cumulative abnormal returns (CARs),
over 60-month for 445 Canadian IPO�s between January 1991 and December 1998. It is
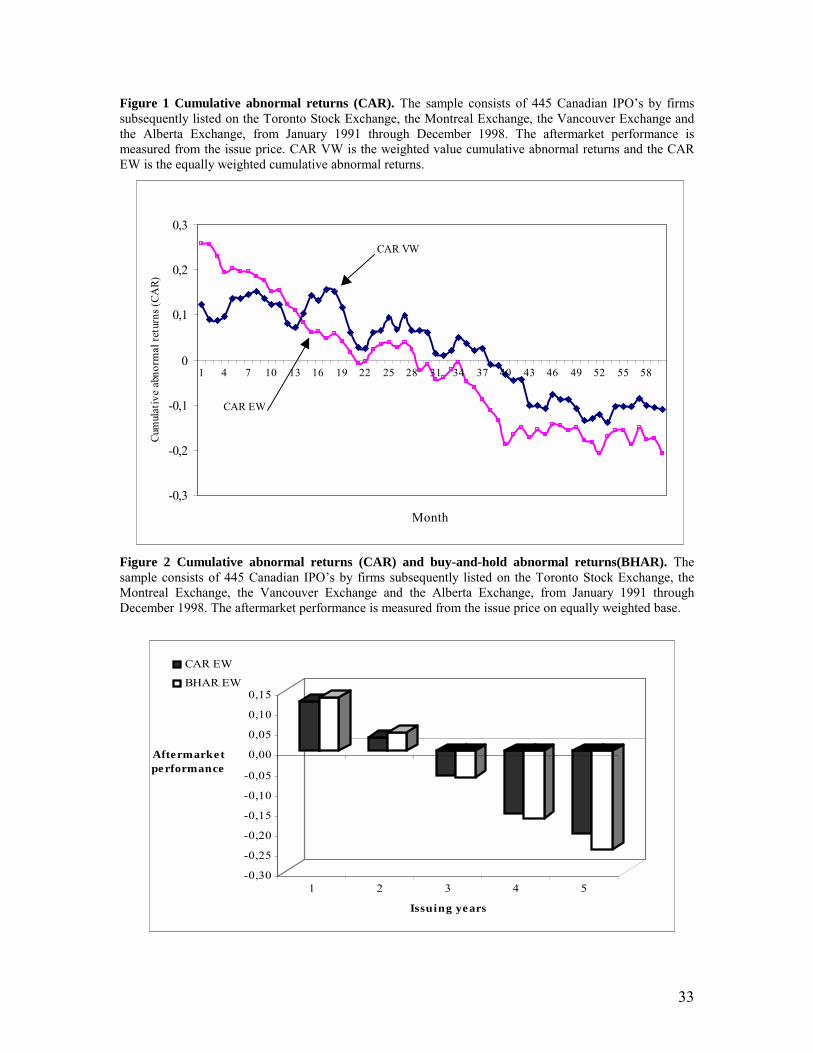
clear from these results that IPO underperformed by approximately 12,35% as measured
by EW CAR over the first 12 months of listing in comparison to the non-issuing
matching firms, and this underperformance is considered significant. From this point on,
the underperformance, as well as its significance, dropped. At 36 months, the CAR was -
6,15% (t-statistic = -0,47). At 60 months, the CAR was -20,65% (t-statistic = -0,84). The
13 See Brav and Gompers (1997 and 1999). 14 For the majority of control firms, it wasn�t possible to have the book value to determine the book-to-market ratio.
19
VW CAR are smaller in magnitude than EW CAR (see table 7). At 36 months, the VW
CAR was still positive 0,02% (t-statistic = -1,29). At 60 months, the VW CAR was -
11,02% (t-statistic = -1,67). Clearly, those IPO�s that continued to be listed for a long
period, provided returns much smaller compared to other companies on the stock market,
after 20 months of performance or �honeymoon� (on EW basis) and 37 months (on VW
basis).
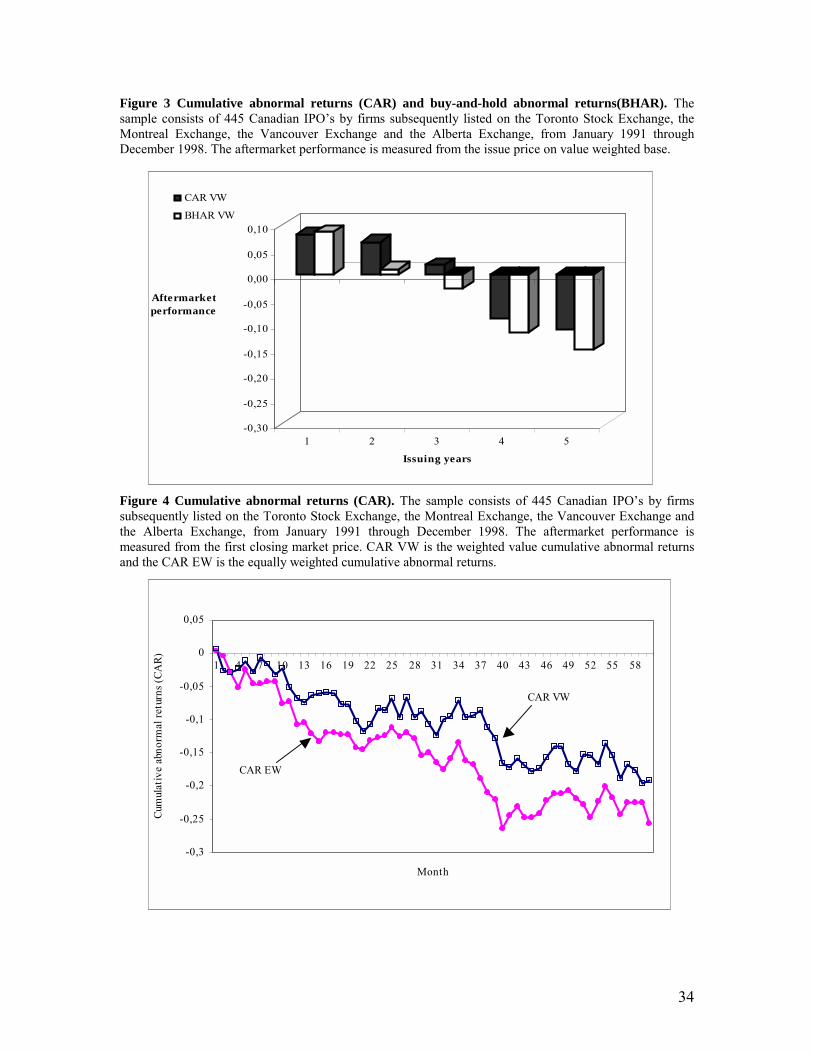
Table 7 provides the summary of the results obtained using the BHAR as a second
measure of aftermarket performance. Clearly, on EW basis, a zero initial investment in
the new issues would have resulted in a loss for the investor of 6,58% by the end of 36
months and of 24,65% by the end of 60 months in the post-IPO period. On VW basis, the
underperformance is smaller. A zero initial investment in the new issues would have
resulted in a loss for the investor of 2,72% by the end of 36 months and 15,16% by the
end of 60 months. The underperformances obtained from BHAR analysis are larger than
those obtained from CAR analysis. This confirms the result of Barber and Lyon (1997)
who have shown that CAR gives positively biased test statistics and BHAR gives
negatively biased test statistics. Figures 2, 3, 5 and 6 confirm these observations.
The results from the CTAR analysis show that on EW basis, the mean monthly calendar-
time abnormal return is �0,34% ( t-statistic = -0,66) which correspond to �12,39%
underperformance for the three years after the issue or to �20,65% underperformance for
the five years after the issue. On VW basis, the mean monthly calendar-time abnormal
return is �0,1837% ( t-statistic = -0,51) which correspond to �6,61% underperformance
for the three years after the issue or to �11,02% underperformance for the five years after
the issue.
These results are based on the fact that we include initial returns to measure the
aftermarket performance. In the next section, the aftermarket performances are measured
from the first closing market price.
20
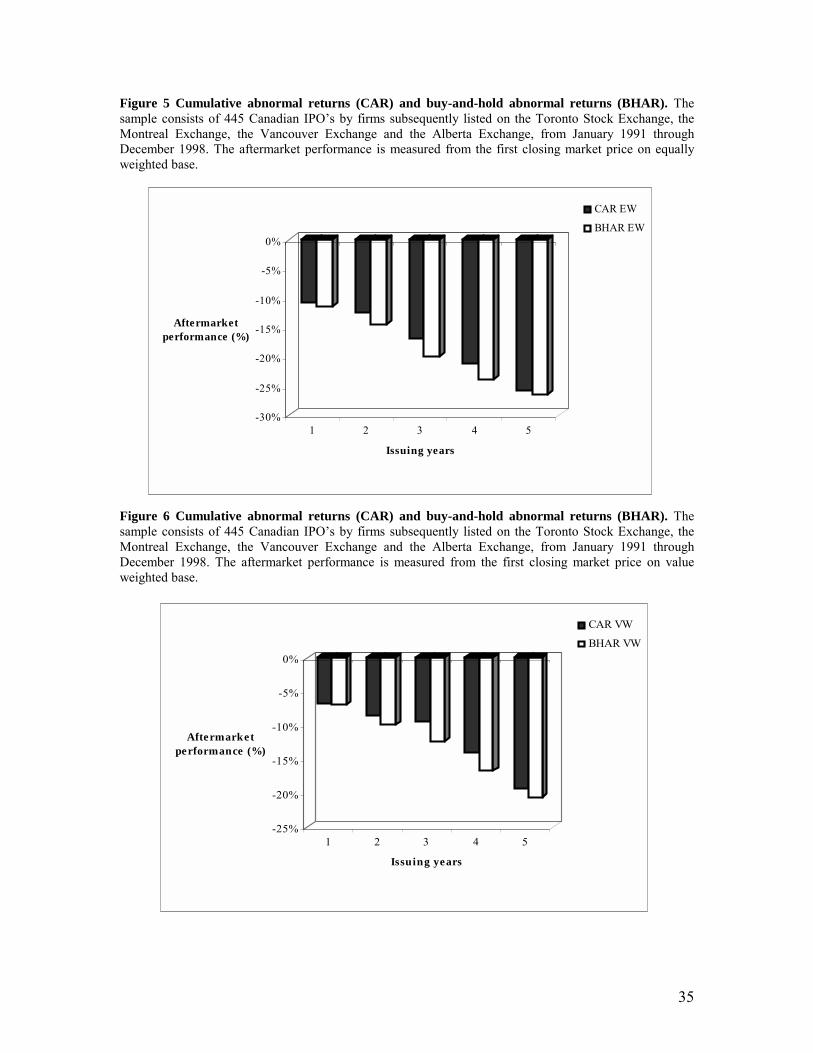
3.1- LONG-TERM PERFORMANCE MEASURED FROM THE FIRST CLOSING MARKET PRICE
Figure 4 provides evidence on relative performance with respect to our sample of control
firms while table 6 provides a summary of results of cumulative abnormal returns
(CARs), over 60-month for 445 Canadian IPO�s between January 1991 and December
1998. It is clear from these results that IPO underperformed by approximately 10,79% as
measured by EW CAR over the first 12 months of listing in comparison to the non-
issuing matching firms, and this underperformance was significant. From this point on,
the underperformance, as well as its significance, declined. At 36 months, the CAR was -
16,85% (t-statistic = -1,28). At 60 months, the CAR was -25,68% (t-statistic = -1,04).
The VW CAR are smaller in magnitude than EW CAR. At 36 months, the VW CAR was
-9,39% (t-statistic = -2,45). At 60 months, the VW CAR was -19,23% (t-statistic = -2,68).
The magnitude of underperformance in the Canadian IPO market is found to be different
than the results reported by Jog (1997). In particular, our cumulative abnormal residual
for Canadian sample by month 36 is �9,65% compared to �41.02% for Jog (1997). This
difference may be explained by the fact that Jog considered only companies listed on the
Toronto Stock Exchange (TSE), which limits the introduction to the larger firms.
However, in this context, we expect to see smaller underperformance for the TSE IPO�s.
The most likely explanation for the differences in results may be the selection of a
benchmark portfolio. Jog used two benchmarks : the TSE 300 Composite Index and the
value-weighted index of TSE-Western Database which gives more weight to larger
stocks.
Table 7 provides the summary of results using the BHAR as a second measure of
aftermarket performance. Clearly, on EW basis, a zero initial investment in the new
issues would have resulted in a loss for the investor of 19,96% by the end of 36 months
and 26,5% by the end of 60 months in the post-IPO period. On VW basis, the
underperformance is less important. A zero initial investment in the new issues would
have resulted in an investor�s loss of 12,32% by the end of 36 months and 20,61% by the
end of 60 months. Brav and al. (2000) confirm these results using a sample of US IPO�s
and different benchmarks.
21
The results from the CTAR analysis show that on EW basis, the mean monthly calendar-
time abnormal return is �0,42% ( t-statistic = -2,00) which corresponds to �15,5%
underperformance for the three years after the issue or to �25,6% underperformance for
the five years after the issue. On VW basis, the mean monthly calendar-time abnormal
return is �0,32% ( t-statistic = -1,38) which corresponds to �11,53% underperformance
for the three years after the issue or to �19,22% underperformance for the five years after
the issue.
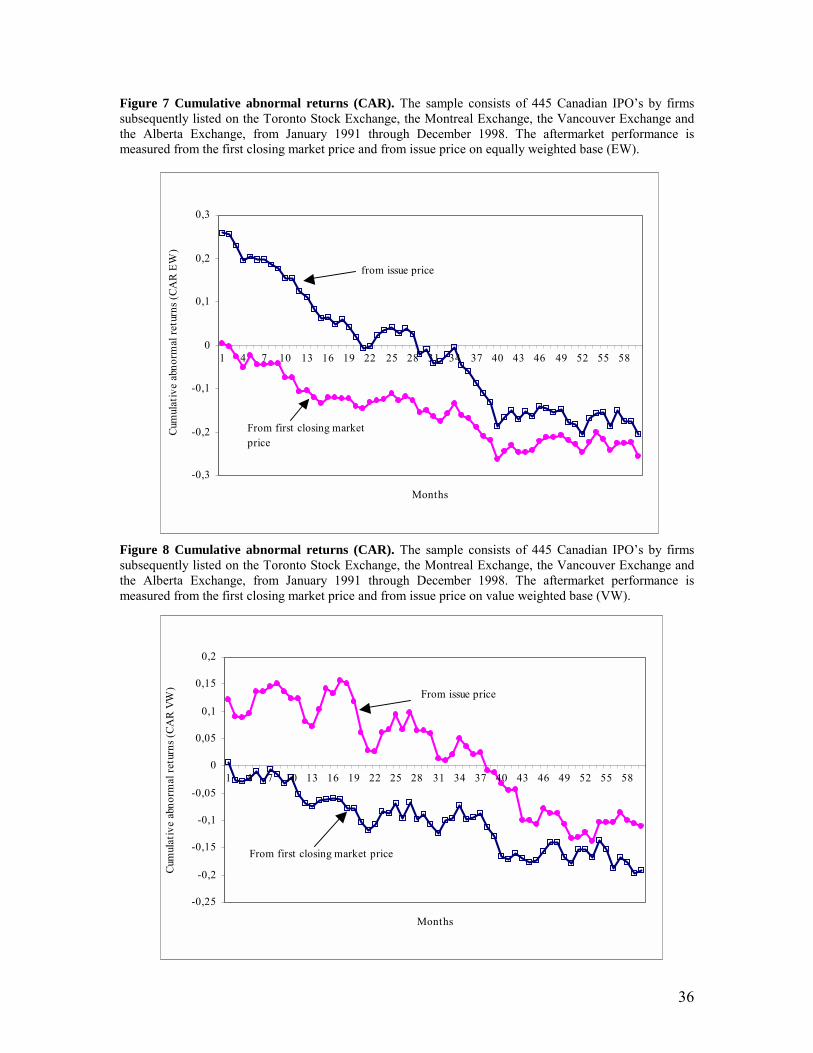
The main conclusion from this section is that the aftermarket performance measured from
the issue price is smaller than the one measured from the first closing market price. This
difference is mainly explained by the relatively high underpricing of Canadian IPO�s.
Investors who are not willing to buy stocks at issue prices, mostly individual investors,
don�t benefit from the high initial returns and they earn substantial losses, starting from
the second month after the issue. Nevertheless, the institutional investors who generally
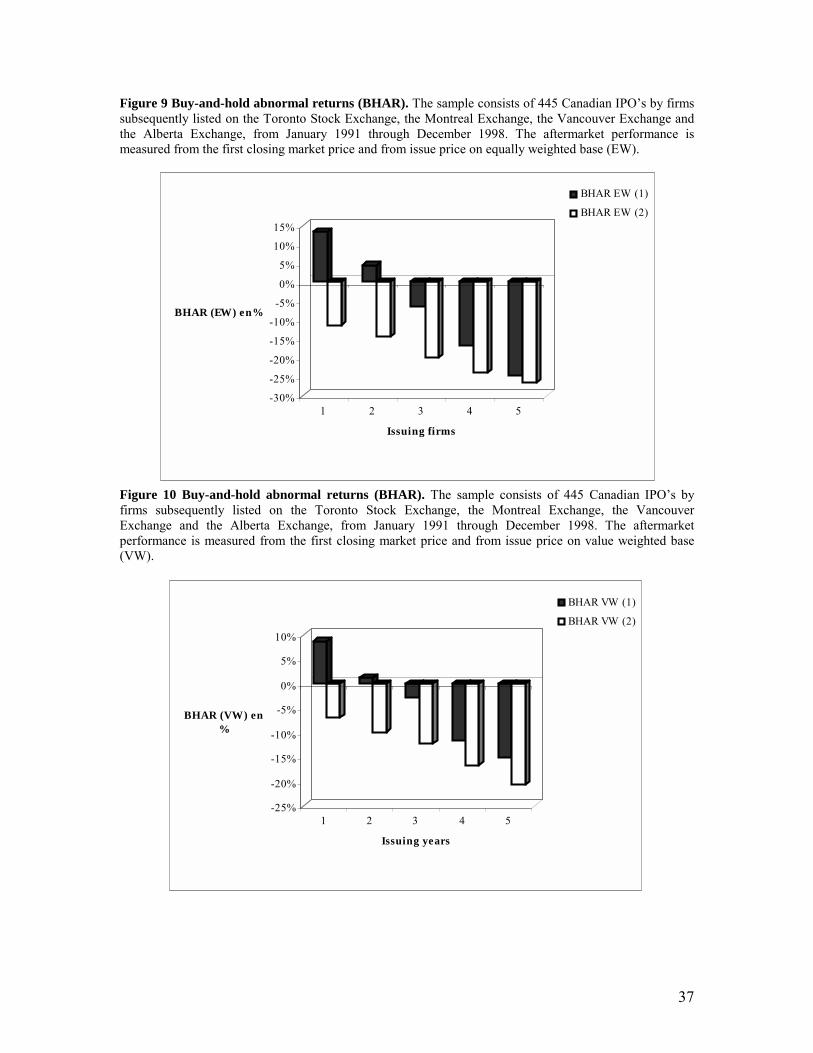
buy stocks at issue prices earn profits up until the 20th month after the issue. Figures 7, 8,
9 and 10 confirm this observation. Our results also confirm the fact that the choice of a
performance measurement methodology directly determines both the size and power of
statistical test. For the overall period, it is obvious that the portfolio of IPO�s
underperform the sample of the matching firms for 60 months following the IPO listing.
Undoubtedly, Canadian IPO�s aren�t a good long-term investment. But why do investors
still buy newly issued stocks ? We still have to find a plausible explanation for the
underperformance of IPO�s in Canada and to analyse the relation between the aftermarket
performance and sample characteristics.
3.2- CROSS-SECTIONAL PATTERNS
We now turn to the cross-sectional analysis of the long-run performance of the IPO�s.
Table 8 shows BHAR by proceeds, initial return, and industry sectors. While both issues
with gross proceeds smaller than $10 million and those with $10 million and more,
underperform in the aftermarket, the first ones perform worse than the latter ones on the
60 months. This corroborates the hypothesis that the ex-ante uncertainty is related
positively with the underperformance.
22
Other results in table 8 suggest that the underpriced stocks perform better than overpriced
stocks over the first 36 moths. Beyond month 36, this trend seems to reverse itself and the
overpriced stocks perform better than the underpriced stocks. This confirms the existing
U.S evidence, which indicates that underpriced stocks show a more negative long-term
performance. This result is mildly supportive of the overreaction or fads hypothesis.
DeBondt and Thaler (1985, 1987) have also presented evidence that, at least for low-
capitalization stocks, there is a negative relation between past and subsequent abnormal
returns on individual securities using holding periods of a year or more.
When the sample is segmented by industry, we notice that the long-run performance of
IPO�s varies widely in different industries. For example, financial IPO�s outperform at
12, 24, 36, 48 and 60 month. Mining IPO�s outperform at 12 months and underperform at
24, 36, 48 and 60 months. The performance of the first year may be explained by the high
initial returns for this sector (35,71%). We also observe that mining IPO�s perform worse
than those of other sectors (-40,66% at 60 months). Oil and gas IPO�s show the same
pattern as mining IPO�s but the underperformance at 60 months is not statistically
significant. Also, Ritter (1991) found that oil and gas IPO�s in the U.S. had high initial
returns but very poor aftermarket performance. He reports that American financial
company IPO�s had better three-year stock return performance than those in other
sectors.
Technology IPO�s outperform at 12 and 36 months and underperform over the rest of the
period. Technology IPO�s had among the highest aftermarket underperformance.
Real estate, biotechnology and pharmaceutical products sector underperformance begins
at the first year after the issue. Communications and media and merchandising IPO�s are
overpriced and also underperform after the first year. At 48 and 60 months,
communications and media IPO�s outperform the matching control firms.
Overall, the 3-year underperformance of IPO�s is present in all but one of the 10 industry
groupings. Also, the 5-year underperformance of IPO�s is present in all but two of the 10
industry groupings.
23
We also segmented the sample in two periods in terms of number and volume of issues.
1993, 1994, 1996 and 1997 present the hot period and 1991, 1992, 1995 and 1998 present
the cold period. This segmentation shows that the underperformance of Canadian IPO�s
is not a general phenomena. At 36 months, the BHAR is �24,06% for hot issues and �
8,06% for cold issues. At 60 months, the BHAR is �40,06% for hot issues and �11,47%
for cold issues.
In table 9, firms are categorized by their year of issue. The negative relation between
annual volume and aftermarket performance, which is evident in table 11, fits with the
fact that firms choose to go public when investors are willing to pay high multiples
(prices-earnings or market-to-book) reflecting the optimistic assessments of the net
present value of growth opportunities. Ritter (1991) documents that �investors are
periodically overoptimistic about the earnings potential of young growth companies�. He
also finds that �If there are periods when investors are especially optimistic about the
growth potential of companies going public, the large cycles in volume may represent a
response by firms attempting to time their IPO�s to take advantage of these swings in
investors� sentiment �. This explanation is consistent with the window of opportunity
hypothesis.
The subsequent negative aftermarket performance observed is then due to the loss of
optimism of investors, who recognize that the earnings are not maintaining their
momentum. All things equal, the greater the disappointing realizations of the net cash
flows are, the larger the ultimate correction price correction will be. Teoh and al. (1998)
observe that issuers of IPO�s can report earnings in excess of cash flows by taking
positive accruals. They also provide the evidence that issuers with unusually high
accruals in the IPO year experienced poor stock return performance in the three years
thereafter.
Overall, it is apparent that IPO�s underperform a sample matching firms with the same
market capitalization. We can also conclude that the underperformance varies across
industries and the period of issue. The high initial return of Canadian IPO�s may also
explain the aftermarket underperformance.
24
3.3- RESULTS OF MULTIPLE REGRESSIONS
In this section, five ordinary least square regressions were performed. BHARs are
estimated after 12, 24, 36, 48 and 60 months respectively in order to assess the
relationship between BHARs and issue-specific factors in multivariate context. The
regression model has the following form: BHARi
1,s =
αααα0 + αααα1 MININGi + αααα2 O&Gi + αααα3 Ti + αααα4 UNDi + αααα5 Log (Proceeds) i+αααα5 HOT/COLD +εεεεis (5)
Where s takes on a value of 12, 24, 36, 48 or 60, MININGi takes a value of 1 for mining
issues and zero otherwise, OIL&GASi takes a value of 1 for oil and gas issues and zero
otherwise, T takes a value of 1 for technology issues and zero otherwise, UNDi is the
underpricing in stock i, HOT/COLD takes a value of 1 for hot issues and 0 otherwise
and Log denotes the natural logarithm. The proceed of the issue is used as a proxy for ex-
ante uncertainty.
The results of multiple regression tests based on t-statistics on iα� are provided in table
10. At first glance, it becomes evident that no statistically significant relationship which
is stable in time emerges between the underpricing and BHARs or between the proceeds
and BHARs. According to Shiller (1990), the long-run performance of IPO�s should be
negatively related to the short-run underpricing. While according to Miller (1977), IPO�s
long-run return should be negatively related with its ex-ante uncertainty (i.e., positive
relationship between long-run performance and Log (proceeds) because the ex-ante
uncertainty is inversely related to a firm�s size). Our results suggest that neither investor�s
overreactions hypothesis nor divergence of opinions hypothesis explain the aftermarket
performance of Canadian IPO�s.
The first significant negative relation between BHARS and MINING can be observed for
BHARs at 24, 36, 48 and 60 months. This confirms the fact that the mining IPO�s
underperform the matching control firms. The second significant negative relation
between BHARS and HOT/COLD can be observed for BHARs at 12, 24, 36, 48 and 60
months. This confirms the window of opportunity hypothesis.
25
A negative relation between BHARs and proceed variable can be observed at 12, 48 and
60 months. This relation is significant only for the 12 months. This confirms the intuition
that the ex-ante uncertainty may explain the aftermarket underperformance for IPO�s15.
According to the five regressions, OIL&GAS has a negative coefficient reflecting the
poor performance of the oil and gas IPO�s but the relation is not significant. The
relationship between the technology variable and BHAR is not stable over time and is not
significant.
A positive relation between BHARs and UND can be observed when BHAR is estimated
at the 12, 24 and 60 months. The high underpricing (20,57%) may explain the
performance for the first two years after the issue. At 48 and 60 months, this relation
become negative and it seems that the underperformance washes out the initial high
returns earned on the first trading day.
Overall, these results clearly indicate that the firms going public during hot issues market
underperform in the long-run. This is consistent with the windows of opportunity
hypothesis (Ritter (1991) and Loughran and Ritter (1995)). We also conclude that the
underperformance varies across industries and that the ex-ante uncertainty may explain
our results.
4. CONCLUSION
The paper examines the stock market performance of Canadian initial public offerings
during the period 1991 to 1998. The initial returns on the first trading day have averaged
a 20,57%. The high initial prices on the first day of listing may be due to the myopia of
investors, who are unable to fully understand the extent to which IPO firm engage in
earnings management ( Teoh et al. 1998). To examine whether the choice of a
performance measurement methodology directly determines both the size and power of
statistical test, as documented in previous studies (Mitchell and Stafford, 2000; Loughran
and Ritter, 2000; and Brav, Geczy and Gompers, 2000), we used different approaches.
15 Hong et Stein (1999) point out that « Both short-run continuation and long-run reversals should be more pronounced in those (small, low-analyst-coverge) stocks where information diffuses more slowly ».
26
Using cumulative abnormal returns as an abnormal performance measure, we find that
the Canadian IPO�s underperform significantly in comparison to the sample of seasoned
firms with the same market capitalization. The underperformances on 36 and 60 months
are statistically significant (on value weighted basis). Moreover, using the buy-and hold
returns as an alternative measurement for long-run performance, we found that investors
who buy immediately after listing and hold shares for five years will make a 24,66% (on
equally weighted basis) and 15,16% (on value weighted basis) losses on an investment in
one of the control firms. Using the calendar-time returns method, we found that the 5
years underperformance of the IPO�s is �25,6% (on equally weighted basis) and
�19,22% (on value weighted basis).
When the sample is segmented by industry, we noticed that the long-run performance of
IPO�s varies widely in different industries. Mining, oil & gas and technology issues
perform worse than those of other sectors.
We have entertained a number of possible explanations for the poor subsequent
performance of issuing firms. Despite the fact that, the fads or investor�s overreactions
and divergence of opinions hypothesis do not apply in explaining the aftermarket
performance of Canadian IPO�s, our evidence is consistent with a market where firms
take advantage of windows of opportunity by issuing equity during hot issues markets.
Some other studies have confirmed the window of opportunity hypothesis as a viable
explanation of the aftermarket underperformance of IPO�s (Ritter 1991, Loughran and
Ritter 1995).
Among those firms that do go public, investors must be able to fully distinguish the high-
value firms from low-value firms, otherwise wealth transfers will result. On the other
hand, issuers of IPO�s or the high-value firms have incentives to differentiate themselves,
in order to raise capital on more favourable terms.
27
REFERENCES
Affleck-Graves, J., Hegde S., Miller, E., « Conditional price trends in the aftermarket for
initial public offerings », Financial Management 25, p. 25-40, 1996.
Aggarwal, R., Leal, R., Hernandez, F., « The aftermarket performance of initial public
offerings in Latin America », Financial Management 22, p. 42-53, 1993
Aggarwal, R., Rivoli, P., « Fads in the initial public offering market ? », Financial
Management 19, p. 45-57, 1990.
Allen, F., Faulhaber, G.R., « Signalling by underpricing in the IPO market», Journal of
financial Economics 23, p. 303-323, 1989.
Aussenegg, W., « Short and long-run performance of initial public offerings in the
Austrian stock market », Unpublished Vienna University of Technology working
paper, 1997.
Barber, B., Lyon, J., « Detecting abnormal operating performance : The empirical power
and specification of test statistics », Journal of Finance 41, p. 359-399, 1996.
Barber, B., Lyon, J., « Detecting long-run abnormal stock returns: the empirical power
and specification of test statistics », Journal of Financial Economics 43, p. 341-372,
1997.
Barber, B., Lyon, J., «How can long-run abnormal stock returns be both positively and
negatively biased? », SSRN working Paper, 1998,
Barberis, N., Shleifer, A., Vishny, R., « A model of investor sentiment », Journal of
Financial Economics 49, p. 307�343, 1998.
Biais, B., Faugeron, A., « IPO auctions :English, Dutch, �, French and Internet»,
University of Toulouse working paper, 2000.
Brav, A., « Inferences in long-horizon event studies: A Bayesian approach with
applications to initial public offerings», Journal of Finance 55, p. 1979-2016, 2000.
Brav, A., Geczy, C., Gompers, P., « Is the abnormal return following equity issuance
anomalous? » Journal of Financial Economics 56, p. 209-249, 2000.
Brav, A., Gompers, P., « Myth or reality? The long-run underperformance of initial
public offerings: Evidence from venture and non venture capital-backed companies »,
Journal of Finance 52, p. 1791-1821, 1997.

28
Brown, S., Warner, J., « Measuring security price performance », Journal of Finance
Economics 8(3), p. 205-258, 1980.
Brown, S., Warner, J., « Using daily stock returns: the case of event studies », Journal of
Finance Economics 14(3), p. 491-495, 1985.
Buser, S., Chan, K., « NASDAQ/NMS Qualification stand, Ohio registration experience
and the price performance of initial public offerings », Ohio Department of Commerce
and national Association of Securities Dealers Inc., Columbus, 1987.
Cai, J., Wei, K., « The investment and operating performance of Japanese IPO», Pacific-
Basin Finance Journal 5, p. 389-417, 1997.
Chen, A., Pan. K., « An answer to the long-run performance puzzle of IPO�s in Taiwan:
An application of the Fama-French model », National Sun Yat-Sen University working
paper, 1998.
Daniel, K., Titman, S., « Evidence on the characteristics of cross-sectional variation in
stock returns », Journal of Finance 52(1), p. 1�33, 1997.
Daniel, K., Hirshleifer, D., Subrahmanyam, A., « Investor psychology and security
market under- and overreactions », Journal of Finance 53, p. 1839�1885, 1998.
Davis, J., Fama, E., French, K., « Covariances and average returns: 1929-1997 », Journal
of Finance 55(1), p. 389�406, 2000.
De Bondt, W., Thaler, R., « Does the stock market overreact? », Journal of Finance 40,
p. 793-808, 1985.
Eckbo, B, Norli, O., « Leverage, liquidity and long-run IPO returns », SSRN working
paper, février 2000.
Fama, E., « Market efficiency, long-term returns, and behavioural finance » Journal of
Financial Economics 49, p. 283-306, 1998.
Fama, E., French, K., « Common risk factors in returns on stocks and bonds » Journal of
Financial Economics 33, p. 3-56, 1993.
Field, L.C., « Is institutional investment in initial public offerings related to long-run
performance of these firms? », Pennsylvania State University working paper, , 1995.
Finn, F, Higham, R., « The performance of unseasoned new equity-issues-cum-stock
exchange listings in Australia», Journal of Banking and Finance 12, p. 333-351, 1988.

29
Firth, M., « An analysis of the stock market performance of new issues in New Zealand»,
Pacific-Basin Finance Journal 5, p. 63-85, 1997.
Friedlan J., Maynes, E. et Verma, S., « The Long Run Performance of Canadian Initial
Public Offerings », Schulisch School of Business, York University working paper,
Toronto, 1994.
Goergen, M., « Insider retention and long-run performance in German and UK IPO�s »,
School of management, UMIST working paper, décembre 1998.
Holhausen, R., Larcker, D., « The financial performance of reverse leveraged buyouts »,
Journal of Financial Economics 42, p. 293-332, 1996.
Hong, H., Stein, J., «A unified theory of under-reaction, momentum trading and
overreaction in asset markets» , Journal of Finance 54, p. 2143�2184, 1999.
Ibbotson, R., « Price performance of common stock new issues », Journal of Financial
Economics 2, p. 235-272, 1975.
Ibbotson, R., « Price performance of common stock new issues », Journal of Financial
Economics 2, p. 235-272, 1975.
Ikenberry, D., Lakonishock, J., Vermaelen, T., « Market under-reaction to open market
share repurchases », Journal of Financial Economics 39, p. 181-208, 1995.
Jegadeesh, N., « Long-term performance of seasoned equity offerings: Benchmark errors
and biases in expectations », Financial Management, p. 5-30, 2000.
Jensen, M., Meckling, W., « Theory of the firm: Managerial behaviour, agency costs and
ownership structure», Journal of Financial Economics 3, p. 306-360, 1976.
Jog, V., « The climate for Canadian initial public offerings », Financing Growth in
Canada, ed. P. Halpern, University of Calgary press, p. 357-401, 1997.
Jog, V., McConnomy, B., «Voluntary disclosure of management earnings forecasts in
IPO�s and the impact on underpricing and post-issue return performance», SSRN
working paper, February 1999,
Keloharju, M. « The winner's curse, legal liability, and the long-run price performance of
initial public offerings in the Finland », Journal of Financial Economics 34, p. 251-
277, 1993.
Kim, J., Krinsky, I., Lee, J., « The aftermarket performance of initial public offerings in
Korea», Pacific-Basin Finance Journal 3, p. 429-448, 1995.
30
Kim, M., Ritter, J., « Valuing IPO�s », Journal of Financial Economics 53:3, p. 409-437,
1999.
Kothari, S., Warner, J., « Measuring long-horizon security price performance », Journal
of Financial Economics 43, p. 301-339, 1997.
Krigman, L., Shaw, W., Womack, K., « The persistence of IPO Mispricing and the
predictive power of flipping », unpublished Dartmouth College working paper, 1997.
Kunz, R., Aggarwal, R., « Explaining the underpricing of initial public offerings:
Evidence from Switzerland », Journal of Banking and Finance 18, p. 705-723, 1994.
Lee, I., « Do managers knowingly sell overvalued equity ?», Journal of Finance 52(4), p.
1439-1466, 1997.
Lee, P., Taylor. S., Walter, T., « Australian IPO underpricing in the short and long run »,
Journal of Banking and Finance 20, p. 1189-1210, 1996.
Levis, M., « The long-run performance of initial public offerings: The UK experience
1980-1988 », Financial Management 22, 28-41,1993.
Ljungqvist, A.P., « Pricing initial public offerings : Further evidence from Germany »,
European Economic Review 41, p. 1309-1320, 1997.
Loughran, T., « Book-to-market across firm size, exchange, and seasonality: Is there an
effect ?», Journal of Financial and Quantitative Analysis 32, p. 249-268, 1995.
Loughran, T., Ritter, J., « The new issues puzzle », Journal of Finance 50, p. 23-51,
1995.
Loughran, T., Ritter, J., « Uniformly least powerful tests of market efficiency »,
Unpublished manuscript, University of Florida, 1998.
Loughran, T., Ritter, J., Rydqvist, K., « Initial public offerings: international insights »,
Pacific-Basin Finance Journal 2, p. 165-199, 1994.
Lowry M., Schwert, G., « IPO market cycles: an explanatory investigation », SSRN
working paper, 2000.
Lowry M., Schwert, G., « Biases in the IPO pricing process », NBER working paper,
2001.
Lyon, J., Barber, B., Tsai, C., « Improved methods for tests of long-run abnormal stock
returns », Journal of Finance 54, p. 165-201, 1999.
31
MacKinlay, A., « Event studies in economics and finance », Journal of Economic
Literature, p. 13-39, 1997.
McGuinness, P., « An examination of the underpricing of initial public offerings in Hong
Kong », Journal of Business Finance and Accounting 19, p. 165-186, 1992.
Mikkelson, W., Partch, M., Shah, K., « Ownership and operating performance of
companies that go public », Journal of Financial Economics 44, p. 281-307, 1997.
Miller, E., « Risk, uncertainty and divergence of opinion», Journal of Finance, p. 1151-
1168, 1977.
Miller, E., « Long run underperformance of initial public offerings: An explanation »,
University of New Orleans working paper, 2000.
Mitchell, M., Stafford, E., « Managerial decisions and long-term stock price
performance », Journal of Business 73, p. 287-329, 2000.
Neyman, J., Pearson, E., « On the use and interpretation of certain test criteria for
purposes of statistical inference, part I », Biometrica 20A, p. 175-240, 1928.
Paudyal, K., Saadouni, B., Briston, R., « Privatisation initial public offerings in Malaysia:
Initial premium and long-term performance», Pacific-Basin Finance Journal 6, p.
427-451, 1998.
Rajan, R., Servaes, H., « Analyst following of initial public offerings », Journal of
Finance 52, p. 507-529, 1997.
Ritter, J., « Initial public offerings», Contemporary Finance Digest, Vol. 2, No. 1, p. 5-
30, Spring 1998.
Ritter, J., « The hot issue market of 1980 », Journal of Business 32, p. 215-240, 1984.
Ritter, J., « The long-run performance of initial public offerings », Journal of Finance 46,
p. 3-27, 1991.
Ritter, J., « The costs of going public », Journal of Financial Economics 19, p. 269-281,
1987.
Ritter, J., « Investment banking and securities issuance », chapter 9 of North-Holland
Handbook of the Economics of Finance, ed. George Constantinides, Milton Harris et
René Stulz, (à paraître 2002), version 7 mars 2001.
Roll, R., « On computing mean returns and small firm premium », Journal of Financial
Economics 12, p. 371-386, 1983.
32
Rydqvist, K., Häogholm, K., « Going public in the 1980s: evidence from Sweden »,
European Financial Management 1, p. 287-315, 1995.
Shiller, R., « Do stock prices move too much to b justified by subsequent changes in
dividend?», American Economics Review, p. 421-436, June 1981.
Shiller, R., « Speculative prices and popular models», Journal of Economic perspectives
4, p. 55-65, 1990.
Schwert, G., « Anomalies and market efficiency», chapter 17 of North-Holland
Handbook of the Economics of Finance, ed. George Constantinides, Milton Harris et
René Stulz, (à paraître 2002), version janvier 2001.
Teoh, S., Welch, I., Wong, T., « Earnings management and the post-issue
underperformance in seasoned equity offerings », Journal of Financial Economics 50,
p. 63-99, 1998.
Teoh, S., Welch, I., Wong, T., « Earnings management and the long-run market
performance of initial public offerings », Journal of Finance 53, p. 1935-1974, 1998.
Uhler, H., « Going public in the F.R.G », R. Guimaraes, B. Kingsman and S. Taylor, eds.,
A reappraisal of the efficiency of financial markets (Springer-Verlag, Berlin), p. 369-
393, 1989.
Welch, I., « Seasoned offerings, imitation costs and the underpricing of initial public
offerings », Journal of Finance 44, p. 421-449, July 1989.
De Bondt, W., Thaler, R., « Does the stock market overreact? », Journal of Finance 40,
p. 793-808, 1985.
.
33
Figure 1 Cumulative abnormal returns (CAR). The sample consists of 445 Canadian IPO�s by firms subsequently listed on the Toronto Stock Exchange, the Montreal Exchange, the Vancouver Exchange and the Alberta Exchange, from January 1991 through December 1998. The aftermarket performance is measured from the issue price. CAR VW is the weighted value cumulative abnormal returns and the CAR EW is the equally weighted cumulative abnormal returns.
Figure 2 Cumulative abnormal returns (CAR) and buy-and-hold abnormal returns(BHAR). The sample consists of 445 Canadian IPO�s by firms subsequently listed on the Toronto Stock Exchange, the Montreal Exchange, the Vancouver Exchange and the Alberta Exchange, from January 1991 through December 1998. The aftermarket performance is measured from the issue price on equally weighted base.
-0,3
-0,2
-0,1
0
0,1
0,2
0,3
1 4 7 10 13 16 19 22 25 28 31 34 37 40 43 46 49 52 55 58
Month
Cum
ulat
ive
abno
rmal
retu
rns (
CAR)
CAR VW
CAR EW
-0,30
-0,25
-0,20
-0,15
-0,10
-0,05
0,00
0,05
0,10
0,15
Aftermarket performance
1 2 3 4 5
Issuing years
CAR EW
BHAR EW
34
Figure 3 Cumulative abnormal returns (CAR) and buy-and-hold abnormal returns(BHAR). The sample consists of 445 Canadian IPO�s by firms subsequently listed on the Toronto Stock Exchange, the Montreal Exchange, the Vancouver Exchange and the Alberta Exchange, from January 1991 through December 1998. The aftermarket performance is measured from the issue price on value weighted base.
Figure 4 Cumulative abnormal returns (CAR). The sample consists of 445 Canadian IPO�s by firms subsequently listed on the Toronto Stock Exchange, the Montreal Exchange, the Vancouver Exchange and the Alberta Exchange, from January 1991 through December 1998. The aftermarket performance is measured from the first closing market price. CAR VW is the weighted value cumulative abnormal returns and the CAR EW is the equally weighted cumulative abnormal returns.
-0,30
-0,25
-0,20
-0,15
-0,10
-0,05
0,00
0,05
0,10
Aftermarket performance
1 2 3 4 5
Issuing years
CAR VW
BHAR VW
-0,3
-0,25
-0,2
-0,15
-0,1
-0,05
0
0,05
1 4 7 10 13 16 19 22 25 28 31 34 37 40 43 46 49 52 55 58
Month
Cum
ulat
ive
abno
rmal
retu
rns (
CAR)
CAR EW
CAR VW
35
Figure 5 Cumulative abnormal returns (CAR) and buy-and-hold abnormal returns (BHAR). The sample consists of 445 Canadian IPO�s by firms subsequently listed on the Toronto Stock Exchange, the Montreal Exchange, the Vancouver Exchange and the Alberta Exchange, from January 1991 through December 1998. The aftermarket performance is measured from the first closing market price on equally weighted base.
Figure 6 Cumulative abnormal returns (CAR) and buy-and-hold abnormal returns (BHAR). The sample consists of 445 Canadian IPO�s by firms subsequently listed on the Toronto Stock Exchange, the Montreal Exchange, the Vancouver Exchange and the Alberta Exchange, from January 1991 through December 1998. The aftermarket performance is measured from the first closing market price on value weighted base.
-30%
-25%
-20%
-15%
-10%
-5%
0%
Aftermarket performance (%)
1 2 3 4 5
Issuing years
CAR EW
BHAR EW
-25%
-20%
-15%
-10%
-5%
0%
Aftermarket performance (%)
1 2 3 4 5
Issuing years
CAR VW
BHAR VW
36
Figure 7 Cumulative abnormal returns (CAR). The sample consists of 445 Canadian IPO�s by firms subsequently listed on the Toronto Stock Exchange, the Montreal Exchange, the Vancouver Exchange and the Alberta Exchange, from January 1991 through December 1998. The aftermarket performance is measured from the first closing market price and from issue price on equally weighted base (EW).
Figure 8 Cumulative abnormal returns (CAR). The sample consists of 445 Canadian IPO�s by firms subsequently listed on the Toronto Stock Exchange, the Montreal Exchange, the Vancouver Exchange and the Alberta Exchange, from January 1991 through December 1998. The aftermarket performance is measured from the first closing market price and from issue price on value weighted base (VW).
-0,3
-0,2
-0,1
0
0,1
0,2
0,3
1 4 7 10 13 16 19 22 25 28 31 34 37 40 43 46 49 52 55 58
Months
Cum
ulat
ive
abno
rmal
retu
rns (
CAR
EW)
From first closing market price
from issue price
-0,25
-0,2
-0,15
-0,1
-0,05
0
0,05
0,1
0,15
0,2
1 4 7 10 13 16 19 22 25 28 31 34 37 40 43 46 49 52 55 58
Months
Cum
ulat
ive
abno
rmal
retu
rns (
CAR
VW)
From first closing market price
From issue price
37
Figure 9 Buy-and-hold abnormal returns (BHAR). The sample consists of 445 Canadian IPO�s by firms subsequently listed on the Toronto Stock Exchange, the Montreal Exchange, the Vancouver Exchange and the Alberta Exchange, from January 1991 through December 1998. The aftermarket performance is measured from the first closing market price and from issue price on equally weighted base (EW).
Figure 10 Buy-and-hold abnormal returns (BHAR). The sample consists of 445 Canadian IPO�s by firms subsequently listed on the Toronto Stock Exchange, the Montreal Exchange, the Vancouver Exchange and the Alberta Exchange, from January 1991 through December 1998. The aftermarket performance is measured from the first closing market price and from issue price on value weighted base (VW).
-30%
-25%
-20%
-15%
-10%
-5%
0%
5%
10%
15%
BHAR (EW) en%
1 2 3 4 5
Issuing firms
BHAR EW (1)
BHAR EW (2)
-25%
-20%
-15%
-10%
-5%
0%
5%
10%
BHAR (VW) en %
1 2 3 4 5
Issuing years
BHAR VW (1)
BHAR VW (2)
38
Table 1
International Evidence on the aftermarket performance of IPO’s. The aftermarket performance is measured from the first closing market price following the formula : 100*[(1+R ipo,T)/(1+R m,T)] - 100, where R ipo,T is the average total return on the IPO�s from from the market price shortly after trading commences until the earlier of the de-listing date or 3 years; R m,T is the average of either the market return or matching-firm returns over the same interval. a Jog use two reference portfolios : TSE 300 Index and TSE-Western Index. b t=21days. This first month consists of event days 2-22, etc.
Country Author (s) Number of IPO�s Issuing years Aftermarket performance*
Germany Ljungqvist 145 1970-90 -12,1% Australia
Lee, Taylor & Walter
266 1976-89 -46,5%
Austria Aussenegg 57 1965-93 -27,3% Brazil
Aggarwal, Leal & Hernandez
62 1980-90 -47,0%
Canadab Joga Our analysis
130 445
1971-92 1991-98
-35,15% -43,66% -16,86%
Chili
Aggarwal, Leal & Hernandez
28 1982-90 -23,7%
Korea Kim, Krinsky & Lee 99 1985-88 +2,0% United-States Loughran & Ritter 4,753 1970-90 -20,0% Finland Keloharju 79 1984-89 -21,1% Japan Cai & Wei 172 1971-90 -27,0% United Kingdom Levis 712 1980-88 -8,1% New Zealand Michael Firth 143 1979-87 -10,00% Sweden Loughran, Ritter &
Rydqvist 162 1980-90 +1,2%
Table 2
Distribution of IPO’s by year. The sample consists of 445 Canadian IPO�s by firms subsequently listed on the Toronto Stock Exchange, the Montreal Exchange, the Vancouver Exchange and the Alberta Exchange, from January 1991 through December 1998.
Year Number of IPO�s Proceeds (millions $) 1991 11 1 044,6$ 1992 25 1 437,47$ 1993 78 2 451,4$ 1994 70 2 203,7$ 1995 41 442,8$ 1996 85 1 754,4$ 1997 88 3 297,83$ 1998 47 2 025,6$ Total 445 14 657,9$
39
Table 3 Distribution of IPO’s by province. The sample consists of 445 Canadian IPO�s by firms subsequently listed on the Toronto Stock Exchange, the Montreal Exchange, the Vancouver Exchange and the Alberta Exchange, from January 1991 through December 1998. **Others present the following provinces: Manitoba, Saskatchewan, Prince Edward�s Islands, Newfoundland and Yukon. We excluded the Junior Capital Pool IPO�s.
Province Number of IPO�s Proceeds (millions $) Alberta 76 1 016,3$ Ontario 170 8 148,3$ British-Columbia 127 1 160,3$ Québec 48 2 196,3$ Autres** 24 2 072,7$ Total 445 14 657,9$
Table 4
Distribution of IPO’s by industry. The sample consists of 445 Canadian IPO�s by firms subsequently listed on the Toronto Stock Exchange, the Montreal Exchange, the Vancouver Exchange and the Alberta Exchange, from January 1991 through December 1998. **Others present the following sectors or industries : public services, transport, agriculture, conglomerates, film production and other.
Industry or secteur Number of IPO�s Proceeds (millions $)
Mining 102 1 644,1$ Oil & gas 54 1 604,55$ Production 84 3 927,98$ Technology 86 2 838,06$ Financial services 18 590,27$ Real estate 11 537,8$ Biotech/Pharmaceutical products 22 423,15$ Communications and media 17 1 254,4$ Merchandising 14 445,06$ Other** 37 1 393$ Full sample 445 14 657,9$
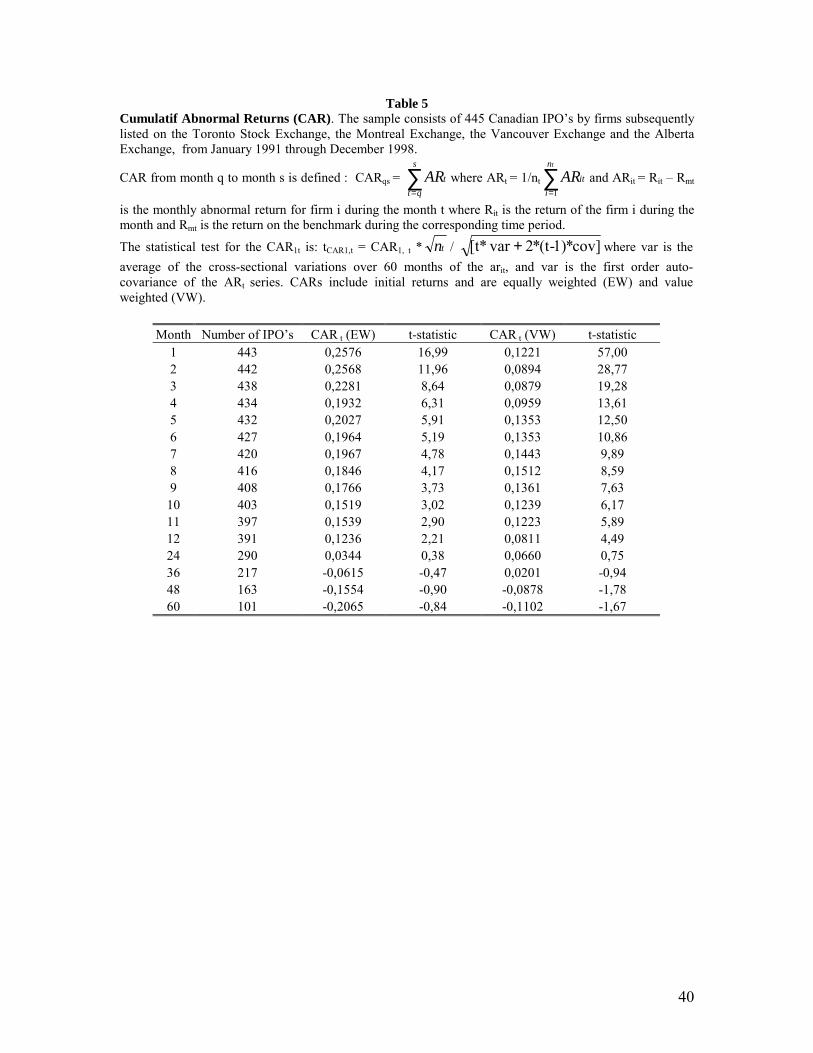
40
Table 5 Cumulatif Abnormal Returns (CAR). The sample consists of 445 Canadian IPO�s by firms subsequently listed on the Toronto Stock Exchange, the Montreal Exchange, the Vancouver Exchange and the Alberta Exchange, from January 1991 through December 1998.
CAR from month q to month s is defined : CARqs = ∑=
s
qttAR where ARt = 1/nt ∑
=
tn
iitAR
1and ARit = Rit � Rmt
is the monthly abnormal return for firm i during the month t where Rit is the return of the firm i during the month and Rmt is the return on the benchmark during the corresponding time period.
The statistical test for the CAR1t is: tCAR1,t = CAR1, t * tn / cov]*1)-(t*2 var *[t + where var is the average of the cross-sectional variations over 60 months of the arit, and var is the first order auto-covariance of the ARt series. CARs include initial returns and are equally weighted (EW) and value weighted (VW).
Month Number of IPO�s CAR t (EW) t-statistic CAR t (VW) t-statistic 1 443 0,2576 16,99 0,1221 57,00 2 442 0,2568 11,96 0,0894 28,77 3 438 0,2281 8,64 0,0879 19,28 4 434 0,1932 6,31 0,0959 13,61 5 432 0,2027 5,91 0,1353 12,50 6 427 0,1964 5,19 0,1353 10,86 7 420 0,1967 4,78 0,1443 9,89 8 416 0,1846 4,17 0,1512 8,59 9 408 0,1766 3,73 0,1361 7,63
10 403 0,1519 3,02 0,1239 6,17 11 397 0,1539 2,90 0,1223 5,89 12 391 0,1236 2,21 0,0811 4,49 24 290 0,0344 0,38 0,0660 0,75 36 217 -0,0615 -0,47 0,0201 -0,94 48 163 -0,1554 -0,90 -0,0878 -1,78 60 101 -0,2065 -0,84 -0,1102 -1,67
41
Table 6
Cumulatif Abnormal Returns (CAR). The sample consists of 445 Canadian IPO�s by firms subsequently listed on the Toronto Stock Exchange, the Montreal Exchange, the Vancouver Exchange and the Alberta Exchange, from January 1991 through December 1998. CAR from month q to month s is defined : CARqs
= ∑=
s
qttAR where ARt = 1/nt ∑
=
tn
iitAR
1and ARit = Rit � Rmt is the monthly abnormal return for firm i during
the month t where Rit is the return of the firm i during the month and Rmt is the return on the benchmark during the corresponding time period.
the statistical test for the CAR1t is: tCAR1,t = CAR1, t * tn / cov]*1)-(t*2 var *[t + where var is the average of the cross-sectional variations over 60 months of the arit, and var is the first order auto-covariance of the ARt series. CARs exclude the initial returns and equally weighted (EW) and value weighted (VW).
Month Number of IPO�s CAR t (EW) t-statistic CAR t (VW) t-statistic 1 442 0,0042 0,28 0,0065 2,46 2 438 -0,0040 -0,19 -0,0269 -5,25 3 434 -0,0275 -1,05 -0,0290 -4,26 4 432 -0,0520 -1,72 -0,0230 -2,82 5 426 -0,0251 -0,74 -0,0110 -1,18 6 419 -0,0455 -1,21 -0,0287 -2,76 7 415 -0,0456 -1,12 -0,0071 -0,62 8 408 -0,0425 -0,97 -0,0155 -1,25 9 403 -0,0431 -0,92 -0,0319 -2,40
10 397 -0,0756 -1,52 -0,0217 -1,53 11 391 -0,0737 -1,40 -0,0528 -3,52 12 381 -0,1079 -1,96 -0,0684 -4,30 24 281 -0,1243 -1,35 -0,0868 -3,27 36 205 -0,1686 -1,28 -0,0939 -2,45 48 159 -0,2120 -1,23 -0,1402 -2,79 60 98 -0,2568 -1,04 -0,1923 -2,68
42
Table 9 Buy-and-hold abnormal returns (BHARs). The sample consists of 445 Canadian IPO�s by firms subsequently listed on the Toronto Stock Exchange, the Montreal Exchange, the Vancouver Exchange and the Alberta Exchange, from January 1991 through December 1998. The buy-and-hold abnormal return (BHAR) is defined as follows:
BHARi,T =
−+=∏ 1)1(1 itrT
t -
−+=∏ 1)1(1 mtrT
t where T=60 months or the delisted date of the stock, rit is the
return of the firm i during the month and rmt is the return on the benchmark during the corresponding time period. BHAR(1) is measured from the issue price and BHAR(2) is measured from the first closing market price. EW is equally weighted base and VW is value weighted base. To test the null hypothesis of zero mean buy-and-hold return, we use the skewness-adjusted t statistic. The t statistic is defined as:
t = n × ( )γ�6n1 γ� 3
1S S2++ where S = t
t
(BHAR) Mean(BHAR)
σ ; t = 12, 24, 36, 48 et 60 months and �γ is an
estimate of the coefficient of skewness. * significant at 1%, ** significant at 5% and *** significant at 10%.
Method BHAR (1) BHAR (2) Years post-IPO EW VW EW VW
1 year 0,1334 0,0861*** -0,1145 -0,0697*** 2 year 0,0456 0,0113 -0,1441 -0,099* 3 year -0,0659 -0,0277 -0,1996 -0,1232 4 year -0,1681 -0,1163 -0,2394 -0,1669 5 year -0,2466 -0,1516 -0,265 -0,2061
43
Table 10
BHARs and subsample characteristics. The sample consists of 445 Canadian IPO�s by firms subsequently listed on the Toronto Stock Exchange, the Montreal Exchange, the Vancouver Exchange and the Alberta Exchange, from January 1991 through December 1998.+Other present the following sectors or industries : public services, transport, agriculture, film production, conglomerates and other. BHARs include initial returns and are equally weighted. Underpricing is calculated as : (mean of the closing market price of the five first days of trading - issue price)/ issue price. * significant at 1%, ** significant at 5% and *** significant at 10%
Échantillon Mois 12
(%) Mois 24
(%) Mois 36
(%) Mois 48
(%) Mois 60
(%) Underpricing
(%) BHAR 13,34 4,56 -6,58 -16,81 -24,65 20,57%
Full sample 442 387 282 209 173 445 Biotech / pharmaceutical products -10,97 -47,56* -41,63* -30,63 -21,91 17,03%
Number 22 20 16 9 9 Communications and média -26,31 -21,19 -17,99 4,09 2,03 -4,66%
Number 17 16 9 12 11 Financial services 19,83 7,39 4,75 6,56 11,75 1,31%
Number 19 14 10 7 6 Mining 30,79* -0,02 -36,29* -49,51* -40,66* 35,71%*
Number 101 89 61 47 34 Oil & gas 8,14 -12,02 -32,74 -40,21 -32,85 29,04%*
Number 54 50 33 24 19 Other+ 15,67 9,25 -0,29 -26,96 -31,08*** 22,37%*
Number 36 29 24 11 8 Production -1,89 -6,08 -6,23 -22,27 -21,78 11,11%
Number 84 77 60 48 41 Real estate -0,13 -3,19 -21,93 -12,06 -23,58 16,9%
Observations 11 8 5 4 2 Merchandising -8,89 3,30 -11,67 -10,64 -10,56 -1,9%
Number 14 13 12 12 12 Technology 15,58 18,47 -14,40 -39,16 -31,13 19,77%*
Number 84 71 49 35 31 Proceeds ≤10M$ 19,54 20,47 -15,11 -43,39 -39,13 38,56%*
Number 236 209 141 96 73 Proceeds >10M$ 3,31 -13,84 -14,88 -16,22 -13,23 0,06%
Number 206 178 141 113 100 Hot period 8,79 -12,73 -24,06 -37,70 -40,38 22,03%*
Number 320 311 209 142 140 Cold period 22,17 0,24 -8,06 -4,67 -11,47 16,77%*
Number 122 76 73 67 33 Overpriced IPO�s -20,77 -22,76 -25,66 -16,54 -17,55 -25,44%*
Number 121 112 88 65 55 Underpriced IPO�s 25,16 -2,13 -3,39 -25 -35,73 41,79%*
Number 321 275 194 144 118
44
Table 9
Performance categorized by the year of issue. The sample consists of 445 Canadian IPO�s by firms subsequently listed on the Toronto Stock Exchange, the Montreal Exchange, the Vancouver Exchange and the Alberta Exchange, from January 1991 through December 1998. BHARs include initial returns and are equally weighted.
Year Number of
IPO�s Proceed
(in millions $CAN) BHAR 1-year
BHAR 2-year
BHAR 3-year
BHAR 4-year
BHAR 5-year
1991 11 1 044, 6$ -13,75% -8,26% 1,55% 4,88% 1,65% 1992 25 1 437,47$ 13,38% -13,79% -14,17% -6,11% -16,39% 1993 78 2 451,4$ -24,10% -22,68% -33,13% -46,78% -44,21% 1994 70 2 203,7$ 17,68% -12,64% -26,44% -26,63% -35,56% 1995 41 442,8$ -21,06% 10,75% -5,96% -6,51% 1996 85 1 754,4$ 42,93% -8,07% -10,53% 1997 88 3 297,8$ -2,23% -8,04% 1998 47 2 025,6$ 37,84%
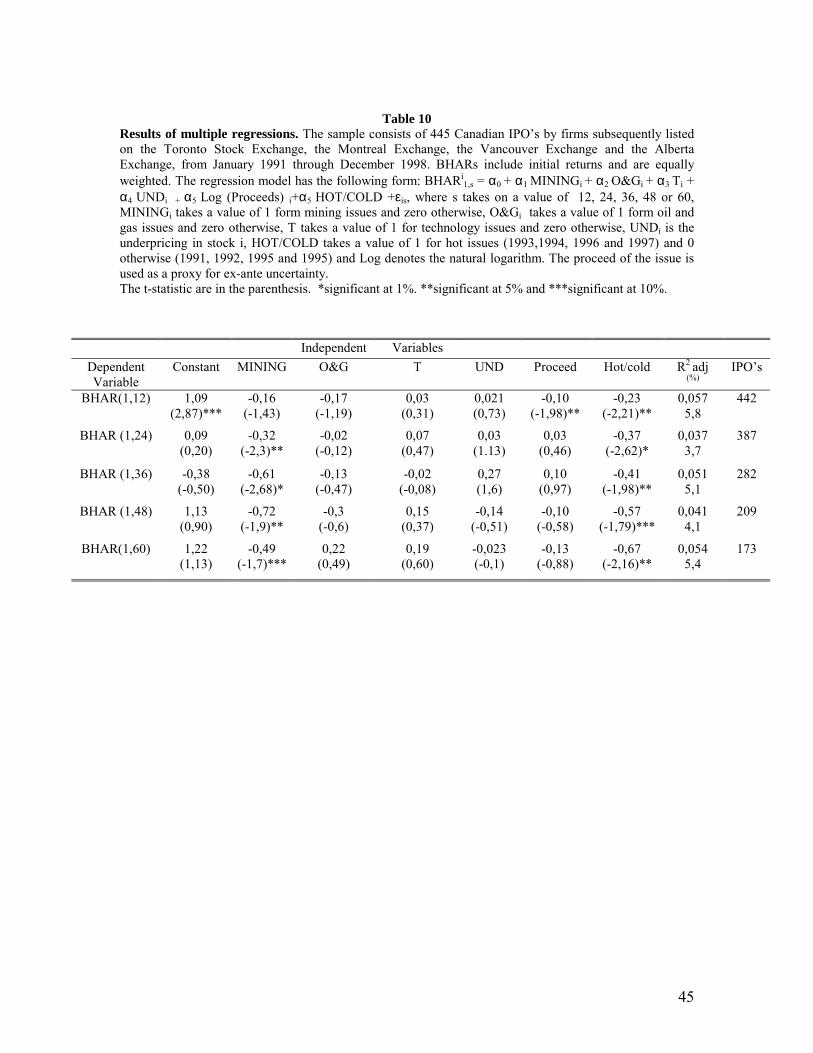
45
Table 10
Results of multiple regressions. The sample consists of 445 Canadian IPO�s by firms subsequently listed on the Toronto Stock Exchange, the Montreal Exchange, the Vancouver Exchange and the Alberta Exchange, from January 1991 through December 1998. BHARs include initial returns and are equally weighted. The regression model has the following form: BHARi
1,s = α0 + α1 MININGi + α2 O&Gi + α3 Ti + α4 UNDi + α5 Log (Proceeds) i+α5 HOT/COLD +εis, where s takes on a value of 12, 24, 36, 48 or 60, MININGi takes a value of 1 form mining issues and zero otherwise, O&Gi takes a value of 1 form oil and gas issues and zero otherwise, T takes a value of 1 for technology issues and zero otherwise, UNDi is the underpricing in stock i, HOT/COLD takes a value of 1 for hot issues (1993,1994, 1996 and 1997) and 0 otherwise (1991, 1992, 1995 and 1995) and Log denotes the natural logarithm. The proceed of the issue is used as a proxy for ex-ante uncertainty. The t-statistic are in the parenthesis. *significant at 1%. **significant at 5% and ***significant at 10%.
Independent Variables Dependent Variable
Constant MINING O&G T UND Proceed Hot/cold R2 adj
(%) IPO�s
BHAR(1,12) 1,09 (2,87)***
-0,16 (-1,43)
-0,17 (-1,19)
0,03 (0,31)
0,021 (0,73)
-0,10 (-1,98)**
-0,23 (-2,21)**
0,057 5,8
442
BHAR (1,24) 0,09 (0,20)
-0,32 (-2,3)**
-0,02 (-0,12)
0,07 (0,47)
0,03 (1.13)
0,03 (0,46)
-0,37 (-2,62)*
0,037 3,7
387
BHAR (1,36) -0,38 (-0,50)
-0,61 (-2,68)*
-0,13 (-0,47)
-0,02 (-0,08)
0,27 (1,6)
0,10 (0,97)
-0,41 (-1,98)**
0,051 5,1
282
BHAR (1,48) 1,13 (0,90)
-0,72 (-1,9)**
-0,3 (-0,6)
0,15 (0,37)
-0,14 (-0,51)
-0,10 (-0,58)
-0,57 (-1,79)***
0,041 4,1
209
BHAR(1,60) 1,22 (1,13)
-0,49 (-1,7)***
0,22 (0,49)
0,19 (0,60)
-0,023 (-0,1)
-0,13 (-0,88)
-0,67 (-2,16)**
0,054 5,4
173