The Acoustic Correlates of Stress-Shifting Suffixes in ...
167
St. Cloud State University theRepository at St. Cloud State Culminating Projects in English Department of English 5-2014 e Acoustic Correlates of Stress-Shiſting Suffixes in Native and Nonnative English Paul R. Keyworth St. Cloud State University Follow this and additional works at: hps://repository.stcloudstate.edu/engl_etds Part of the First and Second Language Acquisition Commons is esis is brought to you for free and open access by the Department of English at theRepository at St. Cloud State. It has been accepted for inclusion in Culminating Projects in English by an authorized administrator of theRepository at St. Cloud State. For more information, please contact [email protected]. Recommended Citation Keyworth, Paul R., "e Acoustic Correlates of Stress-Shiſting Suffixes in Native and Nonnative English" (2014). Culminating Projects in English. 4. hps://repository.stcloudstate.edu/engl_etds/4
Transcript of The Acoustic Correlates of Stress-Shifting Suffixes in ...
St. Cloud State UniversitytheRepository at St. Cloud State
Culminating Projects in English Department of English
5-2014
The Acoustic Correlates of Stress-Shifting Suffixesin Native and Nonnative EnglishPaul R. KeyworthSt. Cloud State University
Follow this and additional works at: https://repository.stcloudstate.edu/engl_etds
Part of the First and Second Language Acquisition Commons
This Thesis is brought to you for free and open access by the Department of English at theRepository at St. Cloud State. It has been accepted forinclusion in Culminating Projects in English by an authorized administrator of theRepository at St. Cloud State. For more information, please [email protected].
Recommended CitationKeyworth, Paul R., "The Acoustic Correlates of Stress-Shifting Suffixes in Native and Nonnative English" (2014). Culminating Projectsin English. 4.https://repository.stcloudstate.edu/engl_etds/4
The Acoustic Correlates of Stress-Shifting Suffixes in
Native and Nonnative English
by
Paul R. Keyworth
A Thesis
Submitted to the Graduate Faculty
of St. Cloud State University
in Partial Fulfillment of the Requirements
for the Degree of
Master of Arts in English: TESL
March, 2014
Thesis Committee:
Ettien Koffi, Chairperson
Michael Schwartz
Monica Devers
2
Abstract
Although laboratory phonology techniques have been widely employed to discover the
interplay between the acoustic correlates of English Lexical Stress (ELS)–fundamental
frequency, duration, and intensity - studies on ELS in polysyllabic words are rare, and cross-
linguistic acoustic studies in this area are even rarer. Consequently, the effects of language
experience on L2 lexical stress acquisition are not clear. This investigation of adult Arabic (Saudi
Arabian) and Mandarin (Mainland Chinese) speakers analyzes their ELS production in tokens
with seven different stress-shifting suffixes; i.e., Level 1 [+cyclic] derivations to phonologists.
Stress productions are then systematically analyzed and compared with those of speakers of
Midwest American English using the acoustic phonetic software, Praat. In total, one hundred
subjects participated in the study, spread evenly across the three language groups, and 2,125
vowels in 800 spectrograms were analyzed (excluding stress placement and pronunciation
errors). Nonnative speakers completed a sociometric survey prior to recording so that statistical
sampling techniques could be used to evaluate acquisition of accurate ELS production. The
speech samples of native speakers were analyzed to provide norm values for cross-reference and
to provide insights into the proposed Salience Hierarchy of the Acoustic Correlates of Stress
(SHACS). The results support the notion that a SHACS does exist in the L1 sound system, and
that native-like command of this system through accurate ELS production can be acquired by
proficient L2 learners via increased L2 input. Other findings raise questions as to the accuracy of
standard American English dictionary pronunciations as well as the generalizability of claims
made about the acoustic properties of tonic accent shift.
3
Acknowledgements
Whilst this thesis may bear my name, the credit belongs to so many others as well. The
research process has been a long and often arduous journey interspersed with moments of joy
and wonder. My heartfelt thanks goes to each and every person who has helped me along the
way.
First and foremost, I thank the many participants who gave up their free time to be
recorded for my study. Without their contributions, this project literally would not have been
possible. Also, I would like to extend my sincerest appreciation to the members of my thesis
committee: Drs. Ettien Koffi (Linguistics), Michael Schwartz (TESL), and Monica Devers
(Communication Disorders). Their invaluable comments, suggestions, and constructive
criticisms have guided me through throughout my investigations. I admire them for their
professionalism and am deeply appreciative of their keen insight and unwavering encouragement.
In particular, I must thank my committee chair, Dr. Koffi, who first gave me the idea of
analyzing the acoustical properties of words with stress-shifting suffixes. His passionate teaching
style and personal mentoring have always been a great resource for me.
Additionally, I wish to give the Office of Sponsored Programs a special mention for
graciously awarding this research a grant through the university’s Student Research Fund. Also,
thank you to Sara Broudeur and Joseph Sipe from the Statistics Consulting Center, led by Dr.
Randal Kolb, for tolerating my often last-minute requests for help. A huge thank you also goes
out to all my wonderful colleagues in the MA TESL program, particularly Erko Abdullahi for
suggesting that I use Praat scripts, and Benjamin Kohler for his formatting expertise.
Most of all though, I dedicate this thesis to my beloved betrothed, Chin-Yu (Vivian), for
without her love, support, and kindness, I could never imagine completing this work.
4
“Nothing will ever be attempted if all possible objections must first be overcome.”
Samuel Johnson—Rasselas, 1759
5
Table of Contents
Page
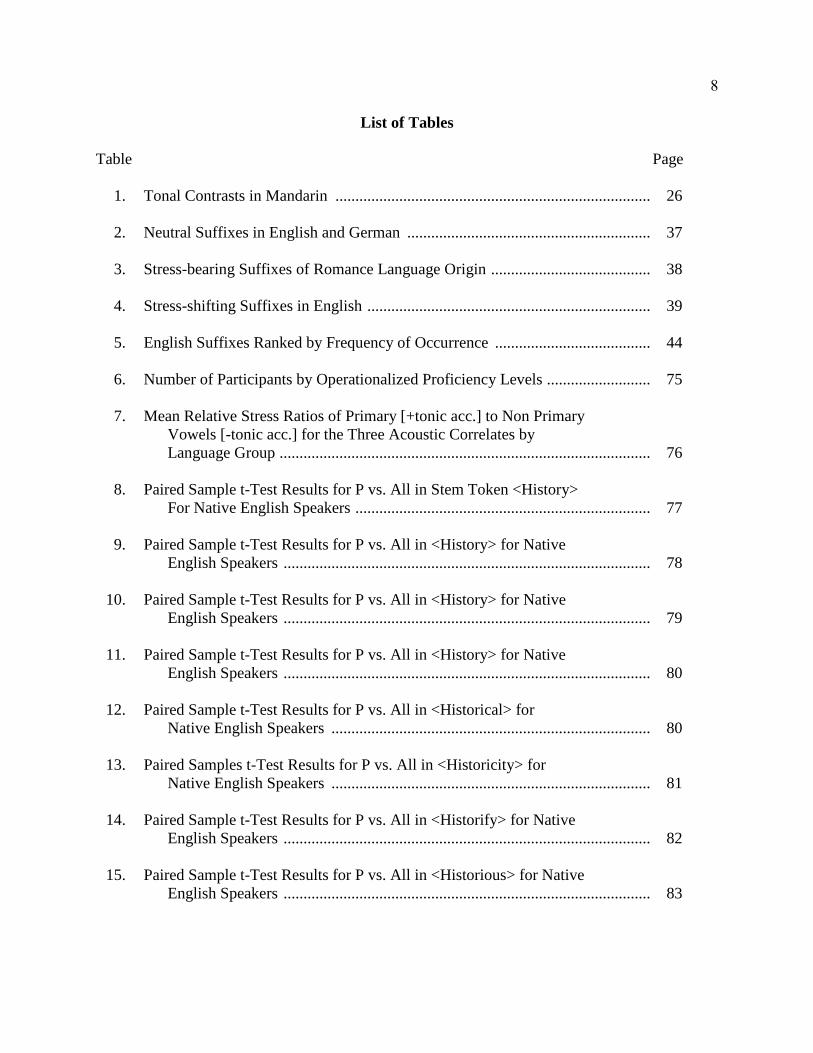
List of Tables ................................................................................................................... 8
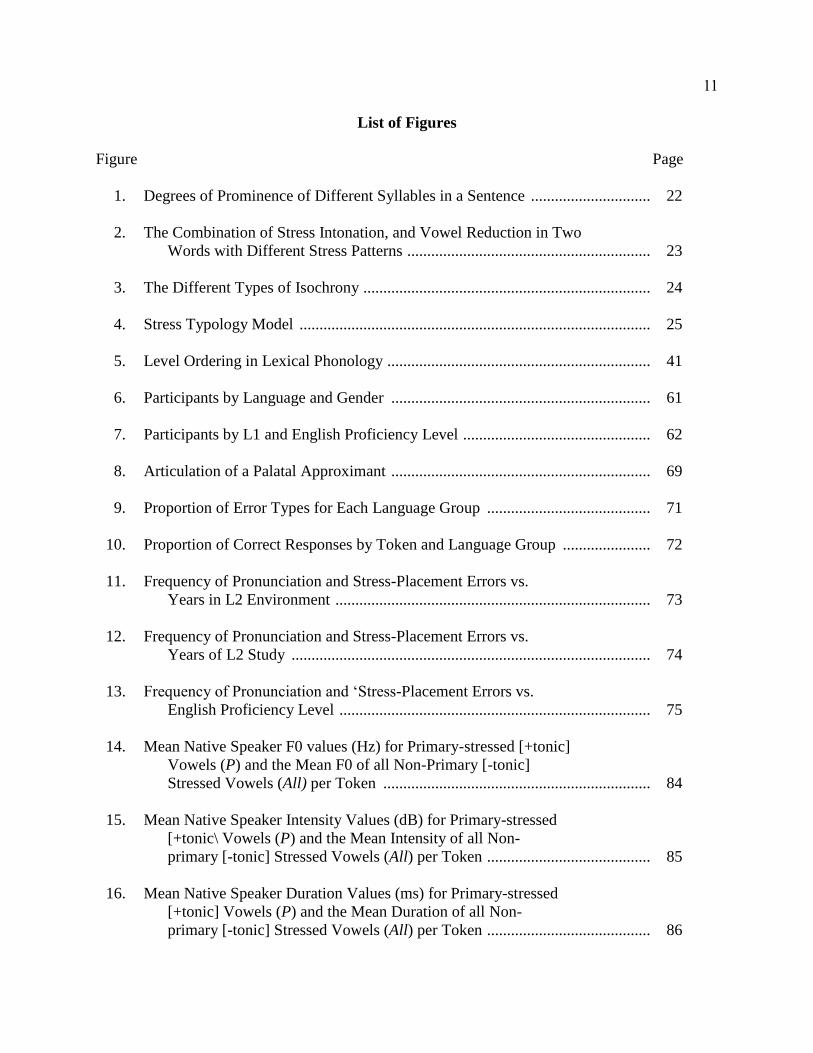
List of Figures .................................................................................................................. 11
Chapter
I. Introduction .......................................................................................................... 15
Statement of Problem ..................................................................................... 15
Background and Need for the Study .............................................................. 15
Purpose of the Study ...................................................................................... 19
Research Questions ........................................................................................ 20
II. Review of the Literature ...................................................................................... 21
Significance of Lexical Stress in English ...................................................... 21
Implications of Isochrony to English L2
Learners .................................................................................................... 23
Role of Lexical Stress in Intelligibility and
Comprehensibility .................................................................................... 27
Prosodic Information in the Lexicon ............................................................. 29
Physiology of Stress Production and
Perception ................................................................................................ 31
Acoustical Phonetic Correlates of Stress in
English ..................................................................................................... 33
Morphophonemic Attributes of English
Derivational Suffixes ............................................................................... 36
A Generative Account of Stress-Shifting
Suffixes .................................................................................................... 40
Corpus Frequencies of Stress-Shifting Suffixes ............................................ 43
6
Chapter Page
Previous and Related Studies on Stress-Shifting
Suffixes .................................................................................................... 43
Acoustic Studies on Mandarin L1 Nnes’
Productions of Stress ................................................................................ 52
Acoustic Studies on Arabic L1 Nnes’ Productions
Of Stress ................................................................................................... 57
III. Methodology ........................................................................................................ 60
Restatement of Research Questions ............................................................... 60
Participants ..................................................................................................... 61
Materials ........................................................................................................ 62
Stimuli ...................................................................................................... 62
Recording Equipment and Environment .................................................. 63
Procedure ....................................................................................................... 64
Data Collection ........................................................................................ 64
Data Analysis ........................................................................................... 64
IV. Results .................................................................................................................. 71
Pronunciation and Stress Placement Errors ................................................... 71
Research Question 5a ............................................................................... 71
Main Dataset .................................................................................................. 76
Research Questions 1, 2, 3, and 4 ............................................................ 76
Research Questions 3 and 4 ..................................................................... 107
Research Question 5b .............................................................................. 110
Research Question 6 ................................................................................ 120
7
Chapter Page
Research Question 7 ................................................................................. 122
Summary ................................................................................................... 129
V. Discussion ............................................................................................................ 132
Limitations of the Study ................................................................................. 143
VI. Conclusion ........................................................................................................... 146
References ................................................................................................................... 148
Appendices
A. Sociometric Background Questionnaire .............................................................. 158
B. Ladefogedian Stress Patterns of the Stimuli ........................................................ 159
C. Sample Spectrogram Illustrating Vowel Delineation Procedure ......................... 160
D. Sample Data Log for a Chinese Male Speaker .................................................... 161
E. Examples of the Error Types: Stress Placement and Pronunciation .................... 162
F. Evidence of Palatal Approximant Epenthesis ...................................................... 163
8
List of Tables
Table Page
1. Tonal Contrasts in Mandarin ............................................................................... 26
2. Neutral Suffixes in English and German ............................................................. 37
3. Stress-bearing Suffixes of Romance Language Origin ........................................ 38
4. Stress-shifting Suffixes in English ....................................................................... 39
5. English Suffixes Ranked by Frequency of Occurrence ....................................... 44
6. Number of Participants by Operationalized Proficiency Levels .......................... 75
7. Mean Relative Stress Ratios of Primary [+tonic acc.] to Non Primary
Vowels [-tonic acc.] for the Three Acoustic Correlates by
Language Group ............................................................................................. 76
8. Paired Sample t-Test Results for P vs. All in Stem Token <History>
For Native English Speakers .......................................................................... 77
9. Paired Sample t-Test Results for P vs. All in <History> for Native
English Speakers ............................................................................................ 78
10. Paired Sample t-Test Results for P vs. All in <History> for Native
English Speakers ............................................................................................ 79
11. Paired Sample t-Test Results for P vs. All in <History> for Native
English Speakers ............................................................................................ 80
12. Paired Sample t-Test Results for P vs. All in <Historical> for
Native English Speakers ................................................................................ 80
13. Paired Samples t-Test Results for P vs. All in <Historicity> for
Native English Speakers ................................................................................ 81
14. Paired Sample t-Test Results for P vs. All in <Historify> for Native
English Speakers ............................................................................................ 82
15. Paired Sample t-Test Results for P vs. All in <Historious> for Native
English Speakers ............................................................................................ 83
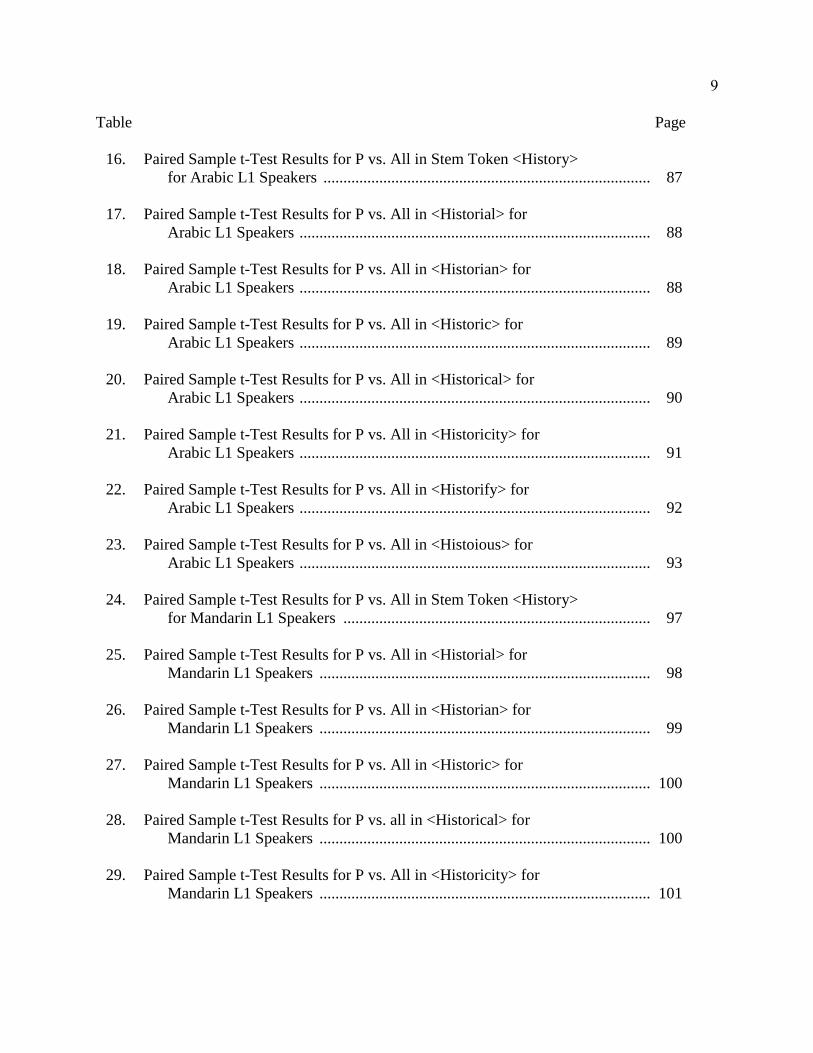
9
Table Page
16. Paired Sample t-Test Results for P vs. All in Stem Token <History>
for Arabic L1 Speakers .................................................................................. 87
17. Paired Sample t-Test Results for P vs. All in <Historial> for
Arabic L1 Speakers ........................................................................................ 88
18. Paired Sample t-Test Results for P vs. All in <Historian> for
Arabic L1 Speakers ........................................................................................ 88
19. Paired Sample t-Test Results for P vs. All in <Historic> for
Arabic L1 Speakers ........................................................................................ 89
20. Paired Sample t-Test Results for P vs. All in <Historical> for
Arabic L1 Speakers ........................................................................................ 90
21. Paired Sample t-Test Results for P vs. All in <Historicity> for
Arabic L1 Speakers ........................................................................................ 91
22. Paired Sample t-Test Results for P vs. All in <Historify> for
Arabic L1 Speakers ........................................................................................ 92
23. Paired Sample t-Test Results for P vs. All in <Histoious> for
Arabic L1 Speakers ........................................................................................ 93
24. Paired Sample t-Test Results for P vs. All in Stem Token <History>
for Mandarin L1 Speakers ............................................................................. 97
25. Paired Sample t-Test Results for P vs. All in <Historial> for
Mandarin L1 Speakers ................................................................................... 98
26. Paired Sample t-Test Results for P vs. All in <Historian> for
Mandarin L1 Speakers ................................................................................... 99
27. Paired Sample t-Test Results for P vs. All in <Historic> for
Mandarin L1 Speakers ................................................................................... 100
28. Paired Sample t-Test Results for P vs. all in <Historical> for
Mandarin L1 Speakers ................................................................................... 100
29. Paired Sample t-Test Results for P vs. All in <Historicity> for
Mandarin L1 Speakers ................................................................................... 101
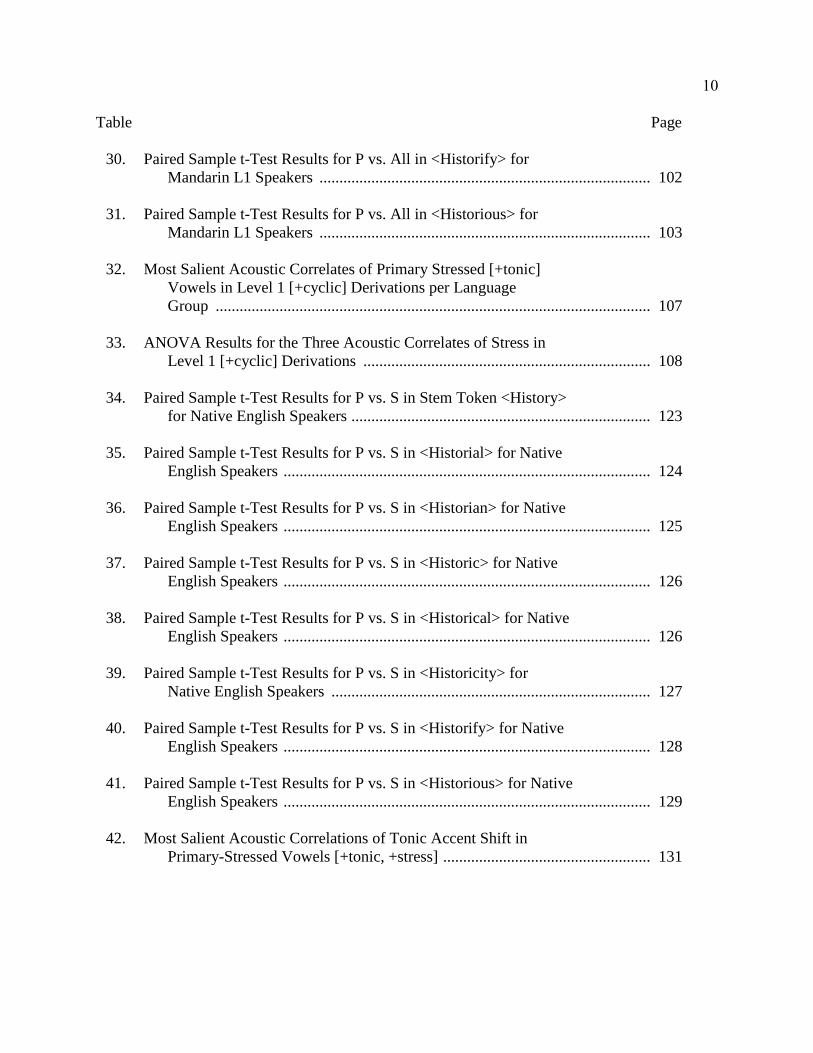
10
Table Page
30. Paired Sample t-Test Results for P vs. All in <Historify> for
Mandarin L1 Speakers ................................................................................... 102
31. Paired Sample t-Test Results for P vs. All in <Historious> for
Mandarin L1 Speakers ................................................................................... 103
32. Most Salient Acoustic Correlates of Primary Stressed [+tonic]
Vowels in Level 1 [+cyclic] Derivations per Language
Group ............................................................................................................. 107
33. ANOVA Results for the Three Acoustic Correlates of Stress in
Level 1 [+cyclic] Derivations ........................................................................ 108
34. Paired Sample t-Test Results for P vs. S in Stem Token <History>
for Native English Speakers ........................................................................... 123
35. Paired Sample t-Test Results for P vs. S in <Historial> for Native
English Speakers ............................................................................................ 124
36. Paired Sample t-Test Results for P vs. S in <Historian> for Native
English Speakers ............................................................................................ 125
37. Paired Sample t-Test Results for P vs. S in <Historic> for Native
English Speakers ............................................................................................ 126
38. Paired Sample t-Test Results for P vs. S in <Historical> for Native
English Speakers ............................................................................................ 126
39. Paired Sample t-Test Results for P vs. S in <Historicity> for
Native English Speakers ................................................................................ 127
40. Paired Sample t-Test Results for P vs. S in <Historify> for Native
English Speakers ............................................................................................ 128
41. Paired Sample t-Test Results for P vs. S in <Historious> for Native
English Speakers ............................................................................................ 129
42. Most Salient Acoustic Correlations of Tonic Accent Shift in
Primary-Stressed Vowels [+tonic, +stress] .................................................... 131
11
List of Figures
Figure Page
1. Degrees of Prominence of Different Syllables in a Sentence .............................. 22
2. The Combination of Stress Intonation, and Vowel Reduction in Two
Words with Different Stress Patterns ............................................................. 23
3. The Different Types of Isochrony ........................................................................ 24
4. Stress Typology Model ........................................................................................ 25
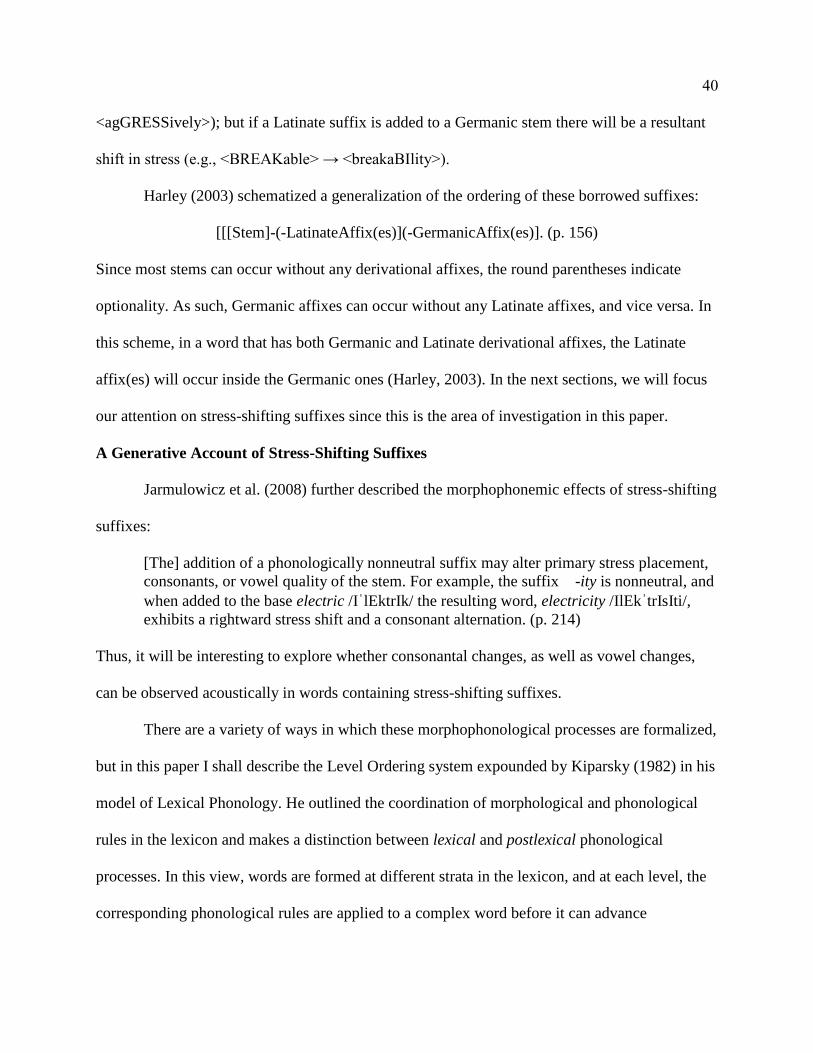
5. Level Ordering in Lexical Phonology .................................................................. 41
6. Participants by Language and Gender ................................................................. 61
7. Participants by L1 and English Proficiency Level ............................................... 62
8. Articulation of a Palatal Approximant ................................................................. 69
9. Proportion of Error Types for Each Language Group ......................................... 71
10. Proportion of Correct Responses by Token and Language Group ...................... 72
11. Frequency of Pronunciation and Stress-Placement Errors vs.
Years in L2 Environment ............................................................................... 73
12. Frequency of Pronunciation and Stress-Placement Errors vs.
Years of L2 Study .......................................................................................... 74
13. Frequency of Pronunciation and ‘Stress-Placement Errors vs.
English Proficiency Level .............................................................................. 75
14. Mean Native Speaker F0 values (Hz) for Primary-stressed [+tonic]
Vowels (P) and the Mean F0 of all Non-Primary [-tonic]
Stressed Vowels (All) per Token ................................................................... 84
15. Mean Native Speaker Intensity Values (dB) for Primary-stressed
[+tonic\ Vowels (P) and the Mean Intensity of all Non-
primary [-tonic] Stressed Vowels (All) per Token ......................................... 85
16. Mean Native Speaker Duration Values (ms) for Primary-stressed
[+tonic] Vowels (P) and the Mean Duration of all Non-
primary [-tonic] Stressed Vowels (All) per Token ......................................... 86
12
Figure Page
17. Mean Arabic L1 Speaker F0 values (Hz) for Primary-stressed
[+tonic] Vowels (P) and the Mean F0 of all Non-primary
[-tonic] Stressed Vowels (All) per Token ...................................................... 94
18. Mean Arabic L1 Speaker Intensity Values (dB) for Primary-stressed
[+tonic] Vowels (P) and the Mean Intensity of all Non-primary
[-tonic] Stressed Vowels (All) per Token ...................................................... 95
19. Mean Arabic L1 Speaker Duration Values (ms) for Primary-stressed
[+tonic] Vowels (P) and the Mean Duration of all Non-primary
[-tonic] Stressed Vowels (All) per Token ...................................................... 96
20. Mean Mandarin L1 Speaker F0 Values (Hz) for Primary-stressed
[+tonic] Vowels (P) and the Mean F0 of all Non-primary
[-tonic] Stressed Vowels (All) per Token ...................................................... 104
21. Mean Mandarin L1 Speaker Intensity Values (dB) for Primary-stressed
[+tonic] Vowels (P) and the Mean Intensity of all Non-primary
[-tonic] Stressed Vowels (All) per Token ...................................................... 105
22. Mean Mandarin L1 Speaker Duration Values (ms) for Primary-stressed
[+tonic] Vowels (P) and the Mean Duration of all Non-primary
[-tonic] Stressed Vowels (All) per Token ...................................................... 106
23. Comparative Usage of F0 as an Acoustic Cue to ELS I Level 1
[+cyclic] Derivations ..................................................................................... 108
24. Comparative Usage of Intensity as an Acoustic Cue to ESL in
Level 1 [+cyclic] Derivations ........................................................................ 109
25. Comparative Usage of Duration as an Acoustic Cue to ELS in
Level 1 [+cyclic\ Derivations ........................................................................ 110
26. Difference of Mean Arabic L1 Speaker Ratio of F0 from Mean Native
Speaker Ratio of F0 vs. Years of L2 English Study ...................................... 111
27. Difference of Mean Mandarin L1 Speaker Ratio of F0 from Mean
Native Speaker Ratio of F0 vs. Years of L2 English Study ........................... 111
28. Difference of Mean Arabic L1 Speaker Ratio of Duration from Mean
Native Speaker Ratio of Duration vs. Years of L2 English Study ................. 112
13
Figure Page
29. Difference of Mean Mandarin L1 Speaker Ratio of Duration from
Mean Native Speaker Ratio of Duration vs. Years of L2
English Study ................................................................................................. 113
30. Difference of Mean Arabic L2 Speaker Ratio of Intensity from Mean
Native Speaker Ratio of Intensity vs. Years of L2 English Study ................. 114
31. Difference of Mean Mandarin L1 Speaker Ratio of Intensity from
Mean Native Speaker Ratio of Intensity vs. Years of L2
English Study ................................................................................................. 114
32. Difference of Mean Arabic L1 Speaker Ratio of F0 from Mean
Native Speaker Ratio of Duration vs. English Proficiency
Level .............................................................................................................. 115
33. Difference of Mean Mandarin L1 Speaker Ratio of F0 from Mean
Native Speaker Ratio of Duration vs. English Proficiency
Level .............................................................................................................. 116
34. Difference of Mean Arabic L2 Speaker Ratio of Duration from Mean
Native Speaker Ratio of Duration vs. English Proficiency Level ................. 117
35. Difference of Mean Mandarin L1 Speaker Ratio of Duration from
Mean Native Speaker Ratio of Duration vs. English
Proficiency Level ........................................................................................... 118
36. Difference of Mean Arabic L1 Speaker Ratio of Intensity from Mean
Native Speaker Ratio of Duration vs. English Proficiency Level ................. 119
37. Difference of Mean Mandarin L1 Speaker Ratio of Intensity from
Mean Native Speaker Ratio of Duration vs. English
Proficiency Level ........................................................................................... 119
38. Proportion of Standard American English Dictionary Pronunciations
vs. Proportion of Alternative Pronunciations with Epenthetic
Palatal Glide by MWAE NES ........................................................................ 120
39. Proportion of Standard American English Dictionary Pronunciations
vs. Proportion of Alternative Pronunciations with Epenthetic
Palatal Glide by Mandarin L1 NNES ............................................................ 121
14
Figure Page
40. Proportion of Standard American English Dictionary Pronunciations
vs. Proportion of Alternative Pronunciations with Epenthetic
Palatal Glide by Arabic L1 NNES ................................................................. 122
41. Mean Native Speaker F0 values (dB) for Primary [+tonic, +stress]
(P) and Secondary [-tonic, +stress] (S) Stressed Vowels per
Token ....................................................................................................... 129
42. Mean Native Speaker Intensity Values (dB) for Primary [+tonic,
+stress] (P) and Secondary [-tonic, +stress] (S) Stressed
Vowels per Token .......................................................................................... 130
43. Mean Native Speaker Duration Values (ms) for Primary [+tonic,
+stress] (P) and Secondary [-tonic, +stress] (S) Stressed
Vowels per Token .......................................................................................... 131
15
Chapter I: Introduction
Statement of Problem
It is widely accepted that certain suffixes in English cause a shift in stress in the root
morpheme to the syllable directly preceding the suffix (Celce-Murcia, Brinton, & Goodwin,
1996; Kreidler, 2004). These stress-shifting suffixes have been labeled Level 1 [+cyclic] suffixes
by generative phonologists (Halle and Kenstowicz, 1991; Kiparsky, 1982). Pronunciation
experts, including Celce-Murcia et al. (1996), have claimed that the resultant shift in stress in
turn causes a change in the neutralization or vowel reduction in the unstressed syllable. Koffi
(personal communication, September 11, 2012) has affirmed that these claims about lexical
stress shifts have not yet been supported quantitatively by the subfield of laboratory phonology.
In addition to this concern about validity, although various studies on the acoustic
properties of English word stress do exist, the results are somewhat contradictory with regards to
which of the three acoustic correlates of stress is most salient–i.e., fundamental frequency (F0),
duration, or intensity.
Furthermore, there is a lack of information in the literature about the word frequency of
individual stress-shifting suffixes in the corpus. Additionally, there is a dearth of cross-linguistic
acoustic data on comparisons of productions of Level 1 [+cyclic] derivations by native speakers
of English (NES) and nonnative speakers of English (NNES) of different proficiencies and first
language (L1) backgrounds.
Background and Need for the Study
Laboratory phonology is a relatively new field that serves as the interface between
phonetics and phonology. It seeks to test the validity of claims made by phonologists using
instrumental phonetic methods as opposed to solely impressionistic judgments (Cohn, Fougeron,
16
& Huffman, 2012). According to Prieto (2012), production studies have been employed
extensively for phonological and phonetic investigations of prosody, and “[T]here is a long
tradition of using acoustic analysis of speech productions under various elicitation conditions in
the field or in the laboratory” (p. 528). Ladefoged (2001a) has iterated that these types of
acoustic analyses are “the most scientific way of describing speech” (p. 10).
Although various laboratory phonology studies have been conducted on English word
stress in general, they have not explored the acoustic properties of the full range of Level 1
[cyclic] suffixes in the lexicon. In fact, studies on English Lexical Stress (ELS) in polysyllabic
words in general have largely been ignored in favor of disyllabic minimal stress pairs, as in Fry’s
original studies (1955, 1958).
As mentioned, there is also a lack of consensus in the literature as to the relative
importance of the acoustic correlates of stress—F0, duration, intensity, and spectral reduction.1
Indeed, various contrasting versions of what the author hereby coins the Salience Hierarchy of
the Acoustic Correlates of Stress (SHACS) have been proposed: F0 > duration > intensity (e.g.,
Fry, 1955, 1958; Ladefoged, 2003), duration > F0 > intensity (e.g., Adams & Munro, 1978), and
duration > intensity > F0 (e.g., Beckman & Edwards, 1994). The latter have reasoned that F0 is
only a relevant acoustic correlate of stress with regards to sentential pitch accent.
Sabater (1991) also suggested that there is an additional cue for stress in English which is
equally important–i.e., reduced vowel quality in the unstressed syllable. In concordance with this
view, many researchers have proposed that the distinction between stressed and unstressed
1 According to Ladefoged (2006), for all intents and purposes, F0 is synonymous with pitch (measured in
Hertz, Hz), duration means vowel length (measured in milliseconds, ms), intensity equates to loudness (measured in
Decibels, db), and spectral reduction refers to changes in vowel quality (i.e., tense to lax). Frequency is the number
17
syllables in English depends upon vowel quality in addition to the three aforementioned acoustic
correlates of stress (Fear, Cutler, & Butterfield, 1995; Edmunds, 2009; Hillenbrand, Getty, Clark,
& Wheeler, 1995). Specifically, at the word level, the unstressed vowels tend to be produced as
the mid-central reduced vowel known as the schwa /ə/, the most common sound in the English
language (Celce-Murcia et al., 1996). In a more recent study by T. M. Adams (2006), the results
indicated that F0, duration, and intensity “participate in a form of
Cue trading to signify stress in different contexts” (p. 3087). However, Ladefoged (2003) has
cautioned that “there is no known algorithm that enables an observer to measure these three
quantities and use them as a measure of stress” (p. 94).
Moreover, since most studies have been conducted in the field of first language (L1)
acquisition, there is only a limited number of cross-language acoustic case studies on the
productions of Level 1 [+cyclic] suffix derivations by NES and NNES, and the effects of L1
background and amount of L2 exposure/input on pronunciation accuracy have not been fully
explored.
In their landmark study of foreign accent, comprehensibility, and intelligibility, Munro
and Derwing (1995) emphasized the need for further studies on the features of L2 pronunciation
that have the most significant effect on intelligibility in English. They have recommended that
these should be studies that “include a variety of accents produced by speakers with differing
levels of proficiency, and … [that] help to elucidate the relative contributions to intelligibility of
specific elements (subsegmental, segmental, prosodic) of pronunciation” (p. 306). Furthermore,
of cycles of variations in air pressure in one second, and pitch is the auditory feature that allows listeners to perceive
a sound on a low-high spectrum where a sound with high frequency is realized as high pitched (Ladefoged, 2006).
18
Ramus, Nespor, and Mehler (1999) have reiterated the demand for a more determined approach
from acoustic phoneticians in order to ascertain the properties of stress in different languages:
Phonetic science has attempted to capture the intuitive notion that spoken languages have
characteristic underlying rhythmic patterns. Languages have accordingly been classified
on the basis of their rhythm type. However, although many characteristics of the speech
signal have been measured, reliable acoustic characteristics of language classes have not
been identified. Measurements estimating the periodicity of either inter-stress intervals or
syllables have not helped capturing these intuitive categories, and attempts to classify
languages on the basis of acoustic measures have mostly been abandoned. (p. 287)
Although the extent of L2 accentedness is related to many determinants, including
language environment and age of speakers, the main mediator of individual differences in L2
accents is the “sound system” of their L1 (Zhang, Nissen, & Francis, 2008, p. 4498). For
example, there is growing evidence to suggest that Mandarin L1 speakers have problems
pronouncing L2 English stress contrasts because of “strong interference from the Mandarin tonal
system” (Zhang et al., 2008, p. 4500). As Zhang et al. have stated, even when syllabic stress is
placed appropriately by Mandarin NNES, they have problems manipulating the acoustic
correlates of stress in a native-like manner.
Conversely, various phonetic studies on rhythmic typology strongly indicate that Arabic
is a stress-timed language that is “a very likely language to exhibit the same correlates to stress
as does English” (de Jong & Zawaydeh, 1999, p. 5). For these reasons, it is edifying to
investigate whether Arabic L1 NNES typically produce the acoustic correlates of Level 1
[+cyclic] derivations more accurately than Mandarin L1 NNES. Notwithstanding, Shemshadsara
(2011) has provided statistical empirical evidence that Iranian Arabic speakers have more
difficulty placing stress in words with stress-shifting suffixes (i.e., Level 1 [+cyclic] derivations)
than words with neutral-suffixes (i.e., Level 2 [-cyclic] derivations (Burzio, 1994)). Thus, these
data further necessitate the need for a thorough acoustic analysis of stress-shifting suffixes.
19
Purpose of the Study
Part of the rationale for this project is to validate the widely-held impressionistic
assertions in the literature about the morphophonemic properties Level 1 [+cyclic] suffixes by
providing quantifiable data. Therefore, the current study is based on quantitative acoustic
analyses of the data using laboratory phonology techniques which have the advantage of
“replicability and robustness” (Post & Nolan, 2012, p. 544) if suitable sampling and statistical
methods are employed.
In addition, this project investigates the dichotomous claims made my acoustical
phonetics experts about SHACS. To do this, syllabic F0, duration, and intensity productions are
analyzed in Level 1 [+cyclic] derivations by native speakers of Midwestern American English
(MWAE) dialect. Due to limitations of time, the researcher does not measure the acoustic
correlate of vowel quality (i.e., first and second formants (F1 and F2), which is in accordance with
Lieberman’s study (1960).
From a second language acquisition (SLA) research perspective, the other purpose of this
study is to observe whether there is a correlation between exposure to the L2 and/or L1
background and production accuracy of Level 1 [+cyclic] suffix derivations. As Zhang et al.
(2008) have succinctly noted, most research in the area of English lexical stress “confound the
phonological issue of stress placement with the phonetic problem of native-like stress
production” (p. 4498). Thus, production accuracy here refers to a twofold distinction: 1) L2
knowledge of where to place the stress in derived words, and 2) native-like production of the
acoustic correlates of stress. More specifically, this study examines the acoustic correlates of
productions of English Level 1 [+cyclic] derivations by Arabic L1 and Mandarin L1 NNES.
20
Research Questions
1) Do English Level 1 [+cyclic] suffixes such as <ious>, <ial>, <ian>, <ic>, <ical>, <ity>,
and <ify> cause a shift in stress when spoken by native speakers of MWAE, and can this be
observed quantitatively using acoustic measurements of F0, duration, and intensity?
2) What is the salience hierarchy of the three acoustic correlates of stress (SHACS) in
productions of polysyllabic Level 1 [+cyclic] derivations by native speakers of MWAE?
3) How do NNES of different L1 backgrounds (i.e., Arabic and Mandarin) order the correlates
of stress similarly or differently to NES?
4) Which acoustic correlates are problematic for Arabic L1 and Mandarin L1 speakers when
producing lexical stress contrasts in Level 1 [+cyclic] derivations?
5) Is there a correlation between amount of L2 exposure (years of residence in L2
environment) and/or amount of L2 input (years of L2 study) and accurate production of the
three acoustic cues? I.e., do these variables show a large effect in:
a) Accurate placement of stress in Level 1 [+cyclic] derivations.
b) Native-like2 production of the acoustic correlates of stress in Level 1 [+cyclic]
derivations.
6) Do some stress-shifting suffixes behave idiosyncratically with regards to standard
American English dictionary pronunciations?
7) Is there a major pitch change (i.e., a shift in tonic accent) from the secondary stressed
syllable (i.e., the primary stressed syllable in the stem word) to the primary stressed
syllable in Level 1 [+cyclic] derivations as claimed by Ladefoged and Johnson (2010)?
2 Hereinafter, native-like refers to similarity to Midwest American English.
21
Chapter II: Review of the Literature
Significance of Lexical Stress in English
It is well-established that the English language can be dissected into segmental features
and suprasegmental features. Segments are the inventories of individual sounds that occur in a
language (i.e., vowels and consonants), whereas suprasegmentals comprise prosodic elements
such as pitch, length, and stress which in turn affect the characteristics of word stress, sentence
stress, and rhythm, as well as modifications in the pronunciation of connected speech (Celce-
Murcia et al, 1996). In non-tonal languages, suprasegmentals are used to deliver meaning at
different levels of conversation, including the discourse, phrase, and word level (Fromkin,
Rodman, & Hyams, 2011). Therefore, Beckman and Edwards (1994) suggested that the prosodic
composition of an utterance is a means of organizing and conveying the content of a message. In
this paper, it is the suprasegmental feature of word stress that is of interest.
Word stress, hereinafter referred to as lexical stress, can be defined as “prosodic
prominence within a word,” and prosody as “a time series of speech-related information that is
not predictable from the simple sequence of phonemes” (Okobi, 2006, p.11). Thus, lexical stress
is detectable when linguistic components stand out from their environment; that is, when one
syllable is perceived as being more prominent than the others. Sluijter and Van Heuven (1996)
defined lexical stress as an abstract property of a word that serves as an indicator to the syllable
within the word that has a potential to receive an accent.
It is important to note that in some English words more than one syllable is stressed (e.g.,
one vowel receives secondary stress); however, one syllable will always receive greater stress
than the others. This is because English is a stress-timed language that specifies one syllable in a
content word to carry main word stress. This is also known as primary stress (Fromkin et al.,
22
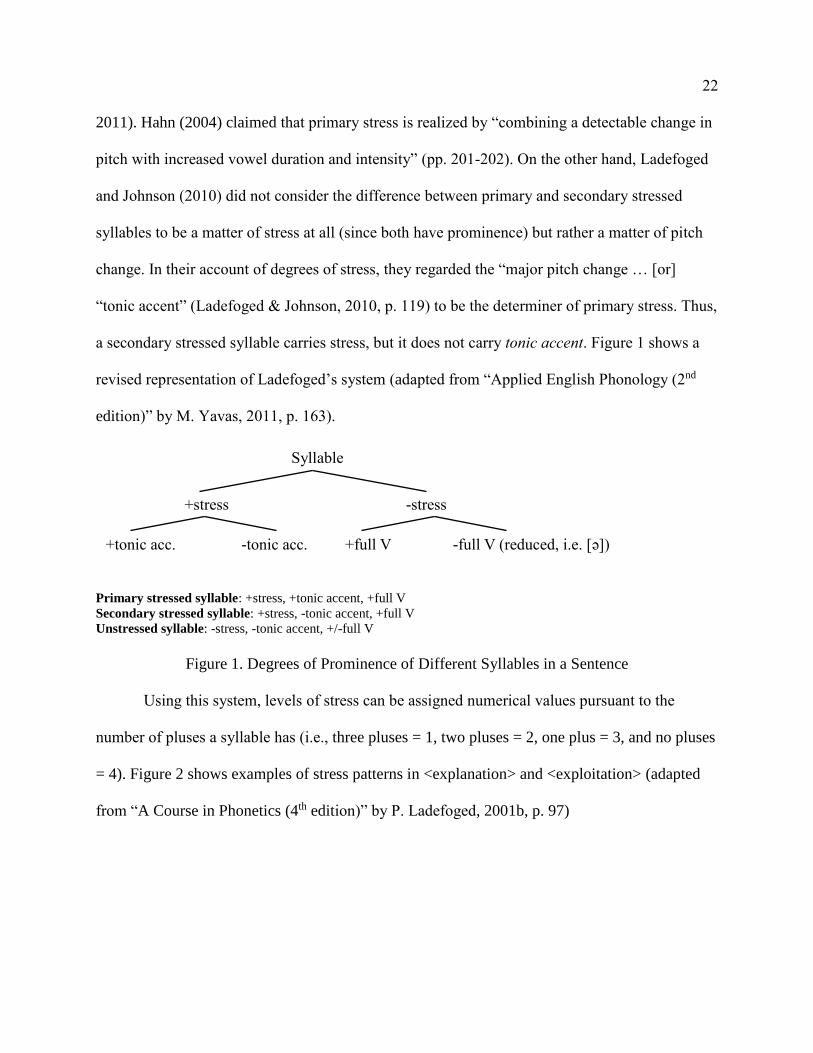
2011). Hahn (2004) claimed that primary stress is realized by “combining a detectable change in
pitch with increased vowel duration and intensity” (pp. 201-202). On the other hand, Ladefoged
and Johnson (2010) did not consider the difference between primary and secondary stressed
syllables to be a matter of stress at all (since both have prominence) but rather a matter of pitch
change. In their account of degrees of stress, they regarded the “major pitch change … [or]
“tonic accent” (Ladefoged & Johnson, 2010, p. 119) to be the determiner of primary stress. Thus,
a secondary stressed syllable carries stress, but it does not carry tonic accent. Figure 1 shows a
revised representation of Ladefoged’s system (adapted from “Applied English Phonology (2nd
edition)” by M. Yavas, 2011, p. 163).
Primary stressed syllable: +stress, +tonic accent, +full V
Secondary stressed syllable: +stress, -tonic accent, +full V
Unstressed syllable: -stress, -tonic accent, +/-full V
Figure 1. Degrees of Prominence of Different Syllables in a Sentence
Using this system, levels of stress can be assigned numerical values pursuant to the
number of pluses a syllable has (i.e., three pluses = 1, two pluses = 2, one plus = 3, and no pluses
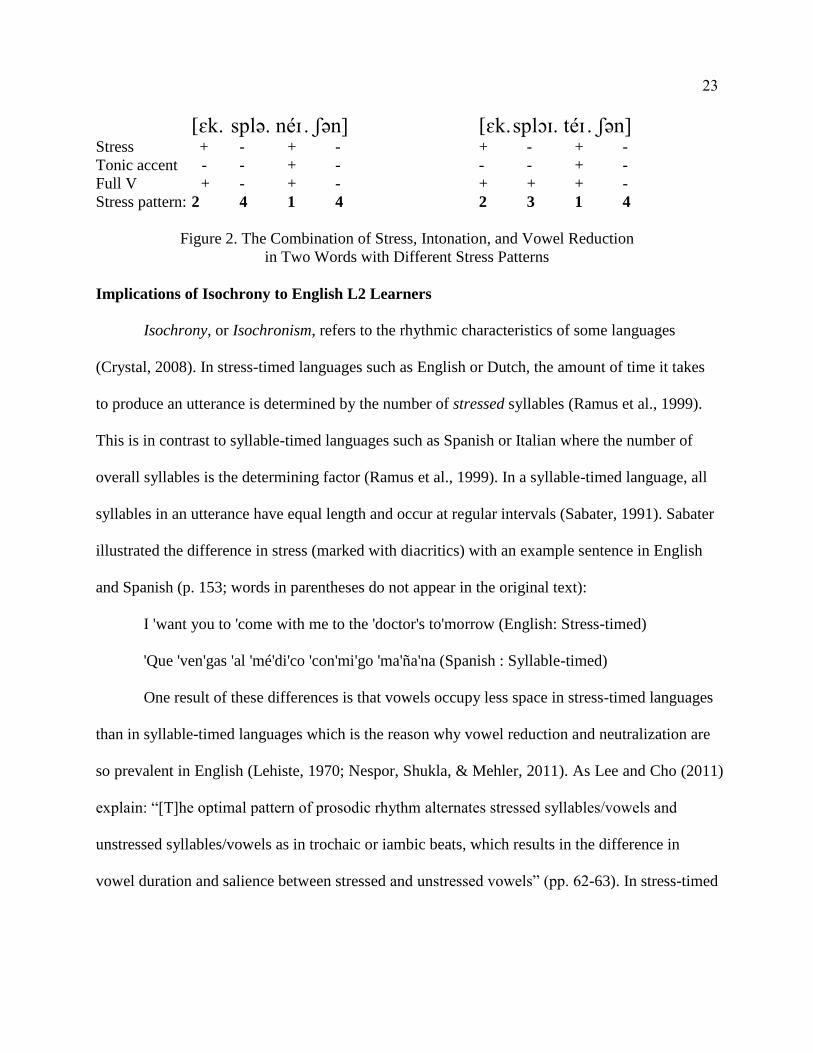
= 4). Figure 2 shows examples of stress patterns in <explanation> and <exploitation> (adapted
from “A Course in Phonetics (4th edition)” by P. Ladefoged, 2001b, p. 97)
Syllable
+stress -stress
+tonic acc. -tonic acc. +full V -full V (reduced, i.e. [ə])
23
[ɛk. splə. neɪ . ʃən] [ɛk.splɔɪ. teɪ . ʃən] Stress + - + - + - + -
Tonic accent - - + - - - + -
Full V + - + - + + + -
Stress pattern: 2 4 1 4 2 3 1 4
Figure 2. The Combination of Stress, Intonation, and Vowel Reduction
in Two Words with Different Stress Patterns
Implications of Isochrony to English L2 Learners
Isochrony, or Isochronism, refers to the rhythmic characteristics of some languages
(Crystal, 2008). In stress-timed languages such as English or Dutch, the amount of time it takes
to produce an utterance is determined by the number of stressed syllables (Ramus et al., 1999).
This is in contrast to syllable-timed languages such as Spanish or Italian where the number of
overall syllables is the determining factor (Ramus et al., 1999). In a syllable-timed language, all
syllables in an utterance have equal length and occur at regular intervals (Sabater, 1991). Sabater
illustrated the difference in stress (marked with diacritics) with an example sentence in English
and Spanish (p. 153; words in parentheses do not appear in the original text):
I 'want you to 'come with me to the 'doctor's to'morrow (English: Stress-timed)
'Que 'ven'gas 'al 'mé'di'co 'con'mi'go 'ma'ña'na (Spanish : Syllable-timed)
One result of these differences is that vowels occupy less space in stress-timed languages
than in syllable-timed languages which is the reason why vowel reduction and neutralization are
so prevalent in English (Lehiste, 1970; Nespor, Shukla, & Mehler, 2011). As Lee and Cho (2011)
explain: “[T]he optimal pattern of prosodic rhythm alternates stressed syllables/vowels and
unstressed syllables/vowels as in trochaic or iambic beats, which results in the difference in
vowel duration and salience between stressed and unstressed vowels” (pp. 62-63). In stress-timed
24
languages, according to Okobi (2006), “in general it is the primary stressed syllable that is pitch
accented when the word of interest is the focus of a phrase (i.e., high focal pitch accent)” (p. 11).
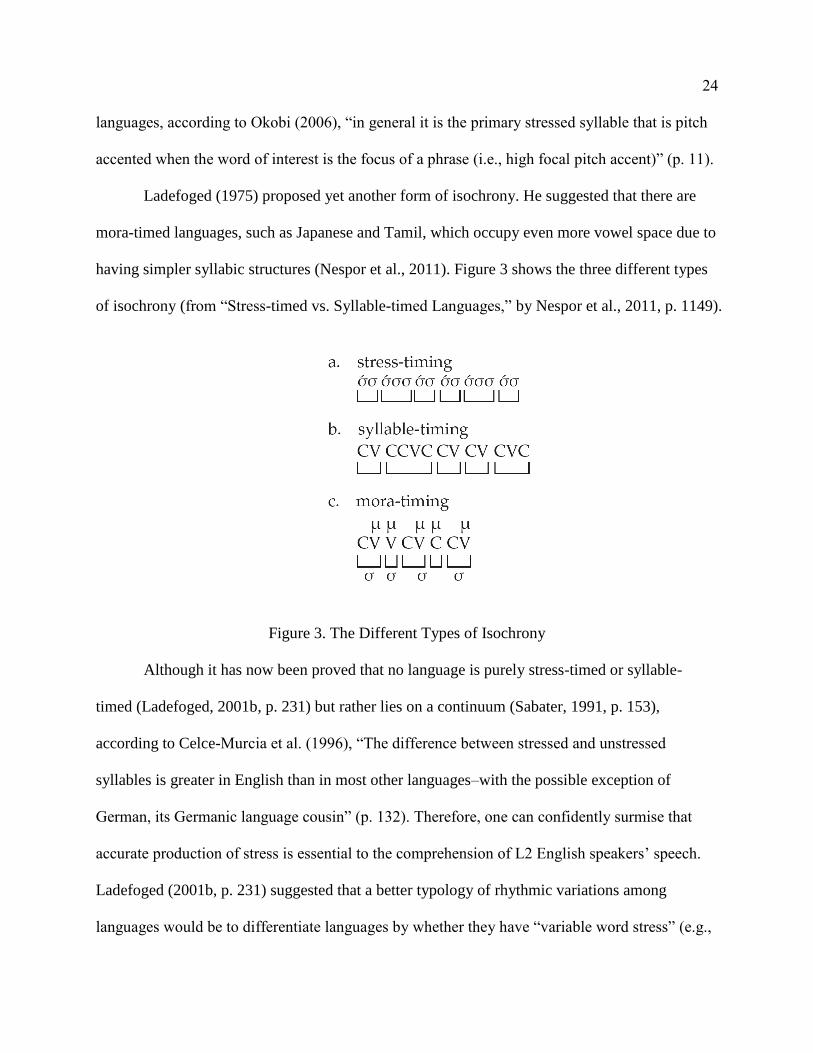
Ladefoged (1975) proposed yet another form of isochrony. He suggested that there are
mora-timed languages, such as Japanese and Tamil, which occupy even more vowel space due to
having simpler syllabic structures (Nespor et al., 2011). Figure 3 shows the three different types
of isochrony (from “Stress-timed vs. Syllable-timed Languages,” by Nespor et al., 2011, p. 1149).
Figure 3. The Different Types of Isochrony
Although it has now been proved that no language is purely stress-timed or syllable-
timed (Ladefoged, 2001b, p. 231) but rather lies on a continuum (Sabater, 1991, p. 153),
according to Celce-Murcia et al. (1996), “The difference between stressed and unstressed
syllables is greater in English than in most other languages–with the possible exception of
German, its Germanic language cousin” (p. 132). Therefore, one can confidently surmise that
accurate production of stress is essential to the comprehension of L2 English speakers’ speech.
Ladefoged (2001b, p. 231) suggested that a better typology of rhythmic variations among
languages would be to differentiate languages by whether they have “variable word stress” (e.g.,
25
unpredictable lexical stress in English) or “fixed phrase stress” (e.g., predictable lexical stress in
Arabic), as proposed in Altmann and Vogel’s (2002) Stress Typology Model (STM) (cited in
Altmann, 2006).
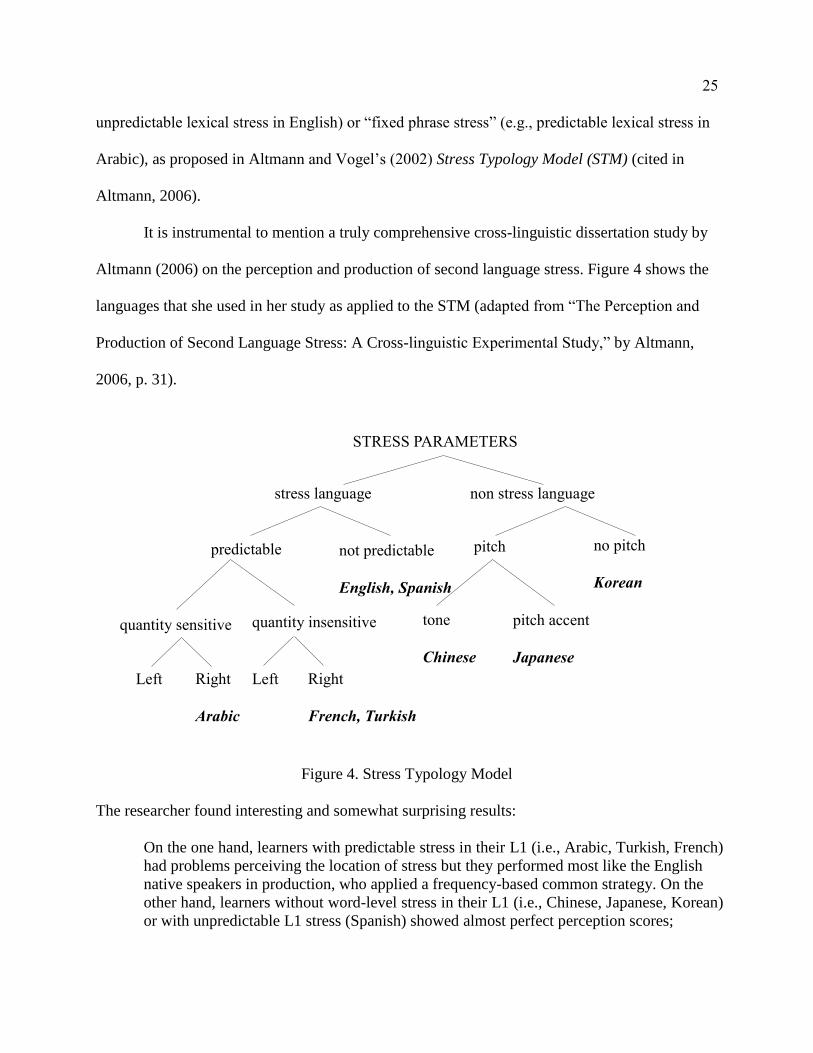
It is instrumental to mention a truly comprehensive cross-linguistic dissertation study by
Altmann (2006) on the perception and production of second language stress. Figure 4 shows the
languages that she used in her study as applied to the STM (adapted from “The Perception and
Production of Second Language Stress: A Cross-linguistic Experimental Study,” by Altmann,
2006, p. 31).
Figure 4. Stress Typology Model
The researcher found interesting and somewhat surprising results:
On the one hand, learners with predictable stress in their L1 (i.e., Arabic, Turkish, French)
had problems perceiving the location of stress but they performed most like the English
native speakers in production, who applied a frequency-based common strategy. On the
other hand, learners without word-level stress in their L1 (i.e., Chinese, Japanese, Korean)
or with unpredictable L1 stress (Spanish) showed almost perfect perception scores;
STRESS PARAMETERS
stress language non stress language
predictable pitch no pitch
Korean
tone
Chinese
pitch accent
Japanese
quantity sensitive quantity insensitive
Left Right
Arabic
Left Right
French, Turkish
not predictable
English, Spanish
26
however, their productions were quite different from the control group’s. Thus, it was
found that good perception does not necessarily underlie good production and vice versa.
(pp. xii-xiii)
Clearly, the perception study results from Altmann (2006) are not what one might expect. This,
however, is not the end of the matter. So far we have only discussed intonation languages. The
opposite of an intonation language is a tone language such as Chinese or Thai. In these
languages, pitch is used to provide contrast at the syllable or word level rather than the phrase or
sentence level (Fromkin et al., 2011).
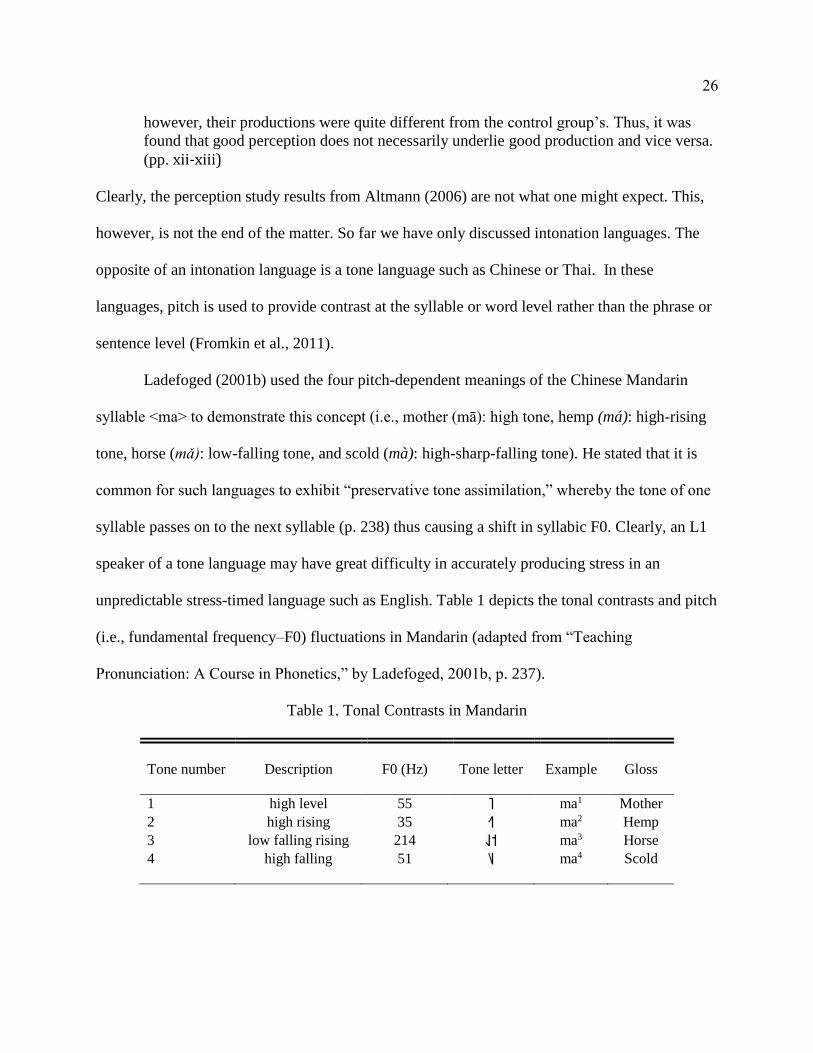
Ladefoged (2001b) used the four pitch-dependent meanings of the Chinese Mandarin
syllable <ma> to demonstrate this concept (i.e., mother (mā): high tone, hemp (má): high-rising
tone, horse (mǎ): low-falling tone, and scold (mà): high-sharp-falling tone). He stated that it is
common for such languages to exhibit “preservative tone assimilation,” whereby the tone of one
syllable passes on to the next syllable (p. 238) thus causing a shift in syllabic F0. Clearly, an L1
speaker of a tone language may have great difficulty in accurately producing stress in an
unpredictable stress-timed language such as English. Table 1 depicts the tonal contrasts and pitch
(i.e., fundamental frequency–F0) fluctuations in Mandarin (adapted from “Teaching
Pronunciation: A Course in Phonetics,” by Ladefoged, 2001b, p. 237).
Table 1. Tonal Contrasts in Mandarin
Tone number
Description
F0 (Hz)
Tone letter
Example
Gloss
1 high level 55 ˥ ma1 Mother
2 high rising 35 ˧˥ ma2 Hemp
3 low falling rising 214 ˨˩˦ ma3 Horse
4 high falling 51 ˥˩ ma4 Scold

27
Role of Lexical Stress in
Intelligibility and Comprehensibility
The construct of intelligibility has been around for many years, and yet it is only recently
that it has been acknowledged as the fundamental goal in the teaching of L2 pronunciation. Field
(2005) provided a brief history of this concept:
In 1949, Abercrombie famously remarked that “language learners need no more than a
comfortably intelligible pronunciation” (p. 120). The idea was slow to feed through to
practice, but in the 1970s many English language teachers worldwide came to recognize
that it was unrealistic, time-consuming, and potentially inhibitory to aim for a native-like
accent, and that such a goal might not necessarily represent the learners' wishes. They
abandoned traditional checklist approaches to pronunciation instruction and instead
adopted intelligibility as their criterion. (p. 400)
The leading proponents of L2 intelligibility research are unquestionably Murray Munro
and Tracey Derwing. According to these two researchers, “Intelligibility may be broadly defined
as the extent to which a speaker’s message is actually understood by a listener” (Munro &
Derwing, 1995, p. 289). This expansive definition entails, at a minimum, two different types of
understanding: (1) The successful identification of words and (2) Understanding the intended
meaning of a speaker.
The flip side of the coin, so to speak, is comprehensibility. Munro and Derwing (1995)
described comprehensibility as the perception of how easy it is to understand a speaker while
Hahn (2004) operationalized this variable as the accuracy with which the intended meaning of a
speaker is perceived. The former is a more global view, while the latter implies that
comprehensibility can be measured. Both views, however, regard native-like pronunciation as
unimportant, unrealistic, and outdated with regards to ‘World Englishes’ or ‘Multiple Englishes’.
Many pronunciation experts believe that a learner's command of suprasegmental features
is more essential to communicative competence than his/her command of segmental features.
28
Therefore, it is claimed that nonnative English speakers (NNES) who do not use native-like
stress patterns are more likely to be misunderstood than those who use nonnative-like vowel or
consonant sounds (Celce-Murcia et al., 1996). Likewise, McNerney and Mendelsohn (1992)
stated that “…a short-term pronunciation course should focus first and foremost on
suprasegmentals, as they have the greatest impact on the comprehensibility of learners’ English”
(p. 186). In addition, Hahn’s (2004) study examined the reactions of native English speakers
(NES) to nonnative primary stress in English discourse. Her findings reveal the extent to which
using primary stress affects the intelligibility of international teaching assistants (ITAs). The
results provide unequivocal, empirical support for pronunciation pedagogy that prioritizes
suprasegmentals.
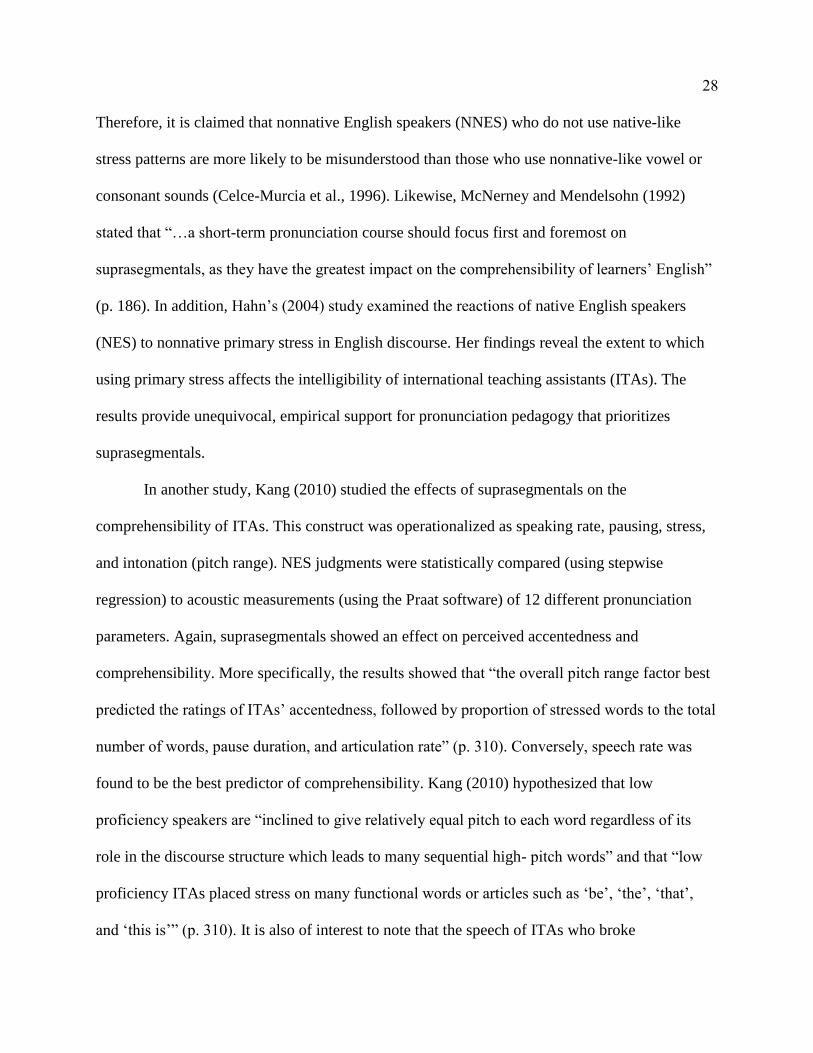
In another study, Kang (2010) studied the effects of suprasegmentals on the
comprehensibility of ITAs. This construct was operationalized as speaking rate, pausing, stress,
and intonation (pitch range). NES judgments were statistically compared (using stepwise
regression) to acoustic measurements (using the Praat software) of 12 different pronunciation
parameters. Again, suprasegmentals showed an effect on perceived accentedness and
comprehensibility. More specifically, the results showed that “the overall pitch range factor best
predicted the ratings of ITAs’ accentedness, followed by proportion of stressed words to the total
number of words, pause duration, and articulation rate” (p. 310). Conversely, speech rate was
found to be the best predictor of comprehensibility. Kang (2010) hypothesized that low
proficiency speakers are “inclined to give relatively equal pitch to each word regardless of its
role in the discourse structure which leads to many sequential high- pitch words” and that “low
proficiency ITAs placed stress on many functional words or articles such as ‘be’, ‘the’, ‘that’,
and ‘this is’” (p. 310). It is also of interest to note that the speech of ITAs who broke
29
suprasegmental rules were rated as “monotonous”, “frustrating’, “boring” and “not at all
attractive” (p. 310).
Clearly, these studies highlight the importance of teaching suprasegmentals to L2 learners
if English. It is informative to note, however, that Levis (2012) cautions against taking such a
biased approach to pronunciation teaching. He argues that segmentals are equally important as
suprasegmentals, and that the debate is not useful because “you can’t have one without the other”
(¶13). Levis provides the examples of ‘rhythmic structure (a suprasegmental) and vowel quality
(a segmental)” which are interdependent, and the close association of “rhythmic structure with
consonant clarity” (¶13)”. These arguments notwithstanding, lexical stress is indubitably a
salient feature in accentedness, comprehensibility, and intelligibility. Therefore, it must be
emphasized in ESL pronunciation courses so that learners can acquire prosodic competence.
Prosodic Information in the Lexicon
Research suggests that the type of prosodic information mentioned thus far (i.e., lexical
stress) is included in the entry of every English content word in the lexicon (Fromkin et al., 2011;
Okobi, 2006; Sabater, 1991). That is, native speakers of a language generally know, as part of
their linguistic competence, which syllable receives primary stress, which receives secondary
stress, and which are not stressed at all (Fromkin et al., 2011). Although word stress is not
usually a distinctive feature in English, it is distinctive in the case of noun-verb minimal stress
pairs (Okobi, 2006). These are pairs of words with the same spelling and similar pronunciations,
but different meanings. For instance, the word <present> which can function both as a noun and
as a verb depending on where stress falls in the word; i.e., <PREsent>: noun vs. <preSENT>:
verb (Lee & Cho, 2011, p. 63). For this reason, noun-verb minimal stress pairs have been used as
30
the tokens in a number of acoustic studies on word stress, most notably in Fry’s (1955, 1958) and
Beckman’s (1986) seminal works.
In addition to these distinctive or contrastive properties, prominent syllables within an
utterance more often act as signals to listeners that signify which words one may potentially
encounter in the dialogue. Okobi (2006) attested that a number of studies reveal that stressed
syllables are used to infer words in the speech-path. Consequently, he states that, “knowing the
stress pattern of a word can greatly reduce the number of competing word candidates” (Okobi,
2006, p. 12). Thus, listeners find it problematic to interpret a word mispronounced with the
incorrect stress pattern. As Sabater (1991) explained:
[I]n processing this word we begin to look up possible words under this wrong stress
pattern which will fit the context, and we might arrive at the wrong interpretation or we
might not find an appropriate word and we may start wondering about the stress pattern.
(p. 151)
Further evidence for the storage of syllabic stress rules in the lexicon comes from
experimental research on spoonerisms, or the slip-of-the-tongue phenomenon (Fromkin et al.,
2011; Ladefoged, 2001a; Okobi, 2006; Sabater, 1991). In these cases, a speaker can produce the
appropriate stress pattern and number of syllables of the intended word, but cannot articulate the
correct phonemic segments of the word. Studies reveal that the most common type of tongue slip
involves the transposition of stressed syllables (Ladefoged, 2001a; Sabater, 1991). For example,
“He was on the nerve of a vergeous breakdown instead of: He was on the verge of a nervous
breakdown” (Sabater, 1991, p. 151). Ladefoged (2001a) concluded that, “It seems probable that
we organize our speech production much as we organize our perception of speech, in terms of
units more like syllables than individual speech sounds” (p. 188). We shall now turn our
attention to the articulatory mechanisms of syllabic stress production.
31
Physiology of Stress Production and Perception
A stressed syllable is generally articulated by expelling more air out of the lungs and
increasing laryngeal activity in relation to unstressed syllables, thereby expending a larger
quantity of respiratory energy (Ladefoged, 2001b, p. 231). This muscular energy may be spent
contracting the rib cage, elevating the diaphragm using the abdominal muscles, activating the
laryngeal muscles (to open and close the vocal cords in the larynx) to increase the pitch, and
even adjusting the articulatory motions of the lips and tongue (Ladefoged, 2001a, p. 231). The
expulsion of air that is the source of almost all speech sounds is known as the pulmonic
airstream mechanism (Ladefoged & Johnson, 2010, p. 136). Ladefoged and Johnson (2010)
described how these physiological mechanisms work together to produce what we perceive as a
stressed syllable:
When there is an increase in the amount of air being pushed out of the lungs, there is an
increase in the loudness of the sound produced. Some books define stress simply in terms
of loudness, but this is not a very useful definition is loudness is considered to be simply
a matter of the amount of the acoustic energy involved. We have already noted that some
sounds have more acoustic energy than others because of factors such as the degree of
mouth opening. A much more important indication of stress is the rise in pitch, which
may or may not be due to laryngeal action. (p. 250)
The pitch of a sound corresponds to the F0, which is “the number of complete repetitions
(cycles) of variations in air pressure occurring in a second” (Ladefoged, 2001b, p. 164). If this
involves laryngeal activity, it is analogous to the frequency of vibrations of the vocal cords
(Ladefoged, 2001b). The mass of the vocal cords greatly influences the pitch range capabilities
of a speaker (e.g., between the sexes). However, pitch can be manipulated by adjusting the
tension of the vocal cords using a trilateral muscle in the larynx known as the cricothyroid
muscle (Munro, 2012). By increasing vocal cord tension, as speaker can produce a higher-
pitched sound (Munro, 2012).
32
In terms of acoustic analysis, one can determine the F0 of a sound by computing the
number of peaks of air pressure in its waveform, using a software program (such as Praat) which
will automatically measure this value in Hz (Ladefoged, 2001b, p. 164). It is essential to
understand that there is not a linear relationship between the auditory perception of pitch change
and the frequency of an utterance, as Ladefoged (2001b) explicated:
A pitch change from 100 to 300Hz is perceived as being the same (within small limits) as
one from 300 to 500 Hz, so we can regard frequency as being equivalent to pitch when
discussing the pitch of the voice. At frequencies above 1,000 Hz equal increases in
frequency are not perceived as equal increases in pitch. The interval from 1,000 to 2,000
Hz is judged to be more like the interval between 2,000 and 4,000 Hz, a doubling of the
frequency. (pp. 166-167)
In sum, differences in F0 are perceived as being greater when lower frequencies are involved (see
also Baart, 2010, p. 67). This proportional relationship between pitch perception and acoustic
frequency has been empirically calculated and can be determined using an auditory frequency
scale known as the Bark Scale (Johnson, 2012).
The intensity of a sound, which closely equates to the perceptive quality of “loudness”, is
proportional to the amplitude (or average size) of the fluctuations in air pressure in the pulmonic
airstream (Ladefoged, 2001b, p. 165). Thus, an increase in air pressure leads to a sound of
greater intensity (Munro, 2012). According to Ladefoged (2001b):
[Intensity] is usually measured in decibels (dB) relative to the amplitude of some other
sounds. Technically, to get the dB difference one has to compare the power ratio, where
the power is defined as the square of the mean amplitude (the mean variation in air
pressure). The difference in dB is 10 times the common logarithm of the power ratio of
the two sounds or 20 times the log of the amplitude ratio. (p. 165)
With these physiological factors in mind, the following section discusses the various correlates
of stress in the English language with regards to acoustical phonetic analysis.
33
Acoustical Phonetic Correlates of Stress in English
The physical parameters of stress are duration, pitch, and loudness (Sabater, 1991). In
acoustic terms, stress is manifested multi-dimensionally with respect to the three corresponding
correlates of duration, F0, and intensity (Fry, 1955, 1958; McClean & Tiffany, 1973; Redford,
2007). Native English speakers tend to produce stressed syllables with longer duration, higher F0,
and greater intensity than unstressed syllables (Zhang et al., 2008). Thus, from a SLA
perspective, errors in some or all of these correlates could impede perception of stress contrast in
NNES’ speech.
In his seminal works on homographs, Fry (1958) claimed that F0 is the most important
acoustic cue in a stressed syllable. In this view, it is the dynamic change of pitch or the
intonation of an utterance that is most perceptual (Fry, 1958, p. 151). According to Fry (1955, p.
765), the second most important acoustic cue is duration, followed by intensity. Indeed, he
argues that intensity is the weakest of the acoustic cues (Fry, 1955, p. 765, 1958, p. 151). The
findings from Morton and Jassem’s (1965) study also corroborated Fry’s assertion that F0 is the
most salient acoustic parameter of stress. In their innovative experiment, they systematically
altered the properties of F0, duration, and intensity in nonsense syllables (i.e., /sisi/, /sɔsɔ/ and
/sasa/). These stimuli were then played to participants (naïve to the synthetic nature of the tokens)
who were instructed to judge the position of the stress. Morton and Jassem (1965) claimed that,
“Variations in fundamental frequency produced far greater effects than variations in either
intensity or duration, a syllable being marked as stressed if it differed from the ‘context’
fundamental. A raised fundamental was more efficient than a lowered one” (p. 159).
However, as Beckman and Edwards (1994) contended, “[…] investigations of physical
and perceptual correlates of stress have produced many seemingly conflicting results, at least in
34
part because of confusion concerning the phonological categories and structures involved” (p. 7).
Conversely, they claimed that F0 is the least salient cue, and that duration and intensity are
relatively more salient acoustic cues to stress. They reasoned that F0 is only a relevant acoustic
correlate of stress with regards to sentential pitch accent. This assertion only partly agrees with
Barto-Sisamout’s (2011) claims that the English intonation system uses F0 contours not only to
signify word prominence within a phrase, but also to denote syllabic prominence in a word and
to differentiate between statements and questions.
To add more confusion to the debate; in an earlier investigation, by Adams and Munro
(1978), of the parameters of stress in native and nonnative connected utterances, “duration was
by far the most frequently used cue and that amplitude was the least used” (p. 125). Although
they reported that NES and NNES did differ significantly in the placement of stress as one would
expect, analysis of the data suggests that the two groups do not routinely utilize different acoustic
correlates to communicate stress at the sentence level. Ladefoged (2003, p. 90) partly agrees with
this ordering of acoustic correlates claiming that duration and pitch are both more reliable cues to
syllabic stress than intensity (i.e., F0 ≥ duration > intensity). Indeed he adamantly claimed that,
“Intensity is a seldom one of the distinguishing phonetic characteristics of a language despite
what you may read” (p. 93). In a more recent study by T. M. Adams (2006), the results indicated
that F0, duration, and intensity “participate in a form of cue trading to signify stress in different
contexts” (p. 3087). However, Ladefoged (2003) cautioned that “there is no known algorithm
that enables an observer to measure these three quantities and use them as a measure of stress” (p.
94).
It is also important to note that while it is true that the pitch of a stressed vowel is
generally higher than that of an unstressed vowel, a syllable with a lower pitch than the other
35
syllables is also likely to be perceived as being stressed (Sabater, 1991). Therefore, the primary
cue for stress perception appears to be that the pitch of a stressed syllable is markedly different
from the other syllables in an utterance, as well as having a longer duration and greater intensity
(Sabater, 1991). Similarly, in Morton and Jassem’s (1965) study, it is reported that while longer
and more intense syllables are more readily marked as being stressed, if a syllable is reduced in
duration by 40%, it is perceived as being stressed by some listeners.
Sabater (1991) also suggested that there is an additional cue for stress in English which is
equally important–i.e., reduced vowel quality in the unstressed syllable. In concordance with this
view, many researchers have proposed that the distinction between stressed and unstressed
syllables in English depends upon vowel quality in addition to the three aforementioned acoustic
correlates of stress (Edmunds, 2009; Fear et al., 1995; Hillenbrand et al., 1995). Specifically, at
the word level in English, the unstressed vowels tend to be produced as the mid-central reduced
vowel known as the schwa /ə/ (Celce-Murcia et al., 1996). Indeed, it is the most common sound
in English. Linblom’s (1963) spectrographic studies reveal that the degree of neutralization
towards schwa (spectral reduction) is proportional to vowel duration. His model of vowel
reduction is fundamentally motivated by “undershoot” in short unstressed syllables (p. 1779).
Short duration of unstressed vowels results in a greater effort required to achieve distinct vowel
qualities, especially for low vowels. Since contrasts are bound by constraints of distinctiveness,
neutralization occurs as opposed to phonetic reduction which would otherwise render vowels
unintelligible (Flemming, 2009).
In addition, Gay (1978) found that the first (F1) and second formants (F2) are the best
indicators of spectral reduction. However, more recently, Flemming (2009) reported that the F1
and F2 values for schwa are highly variable as systematically conditioned on its context within a

36
word (i.e., word-final versus word-nonfinal). Nevertheless, Fleming (2009) and Fear et al. (1995)
maintained that the distinction between stressed and unstressed syllables in English can be
acoustically determined by measuring the three acoustic correlates of stress and/or the quality of
a reduced vowel.
Thus, to provide a brief summary of this section: Stress is a relational feature, and a
syllable is perceived as being stressed when its acoustic properties are relatively more prominent
than the other syllables in an utterance.
Morphophonemic Attributes of
English Derivational Suffixes
In the English language, there are a variety of phonological relationships that exist
between stem words and derived forms. These suffixal variations did not escape the attention of
Chomsky and Halle (1968) in their classic work, The Sound Pattern of English. According to
Jarmulowicz (2002), “Within the English derivational system, there are suffixes that have very
predictable effects on the primary stress of the word stems to which they attach” (p. 193). Celce-
Murcia et al. (1996) listed the three ways in which they do this:
1. They may have no effect on the stress pattern of the root word.
2. They may receive strong stress themselves.
3. They may cause the stress pattern in the stem to shift from one syllable to another. (p.
136)
The suffixes in the first category are known as neutral suffixes, and they are primarily of
Germanic origin (Celce-Murcia et al., 1996). Jarmulowicz, Taran, and Hay (2008) provided the
following definition:
For derived words with phonologically neutral suffixes (e.g., -ness and -er), no change in
the stem’s primary stress, consonants, or vowels occurs after the suffix has been added.
For example, the addition of the neutral suffix -ness on the stem happy ["hæpi] results in
the derived word happiness ["hæpinɪs], which exhibits no stem-internal phonological
alternations. (p. 214)
37
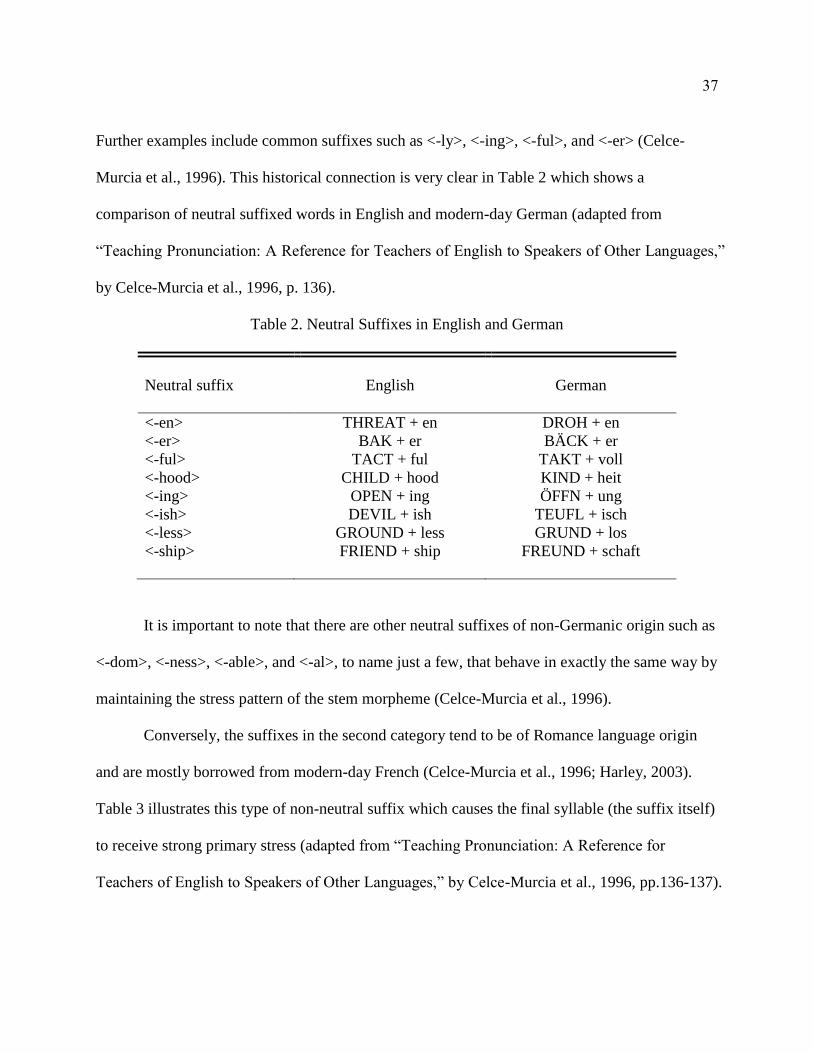
Further examples include common suffixes such as <-ly>, <-ing>, <-ful>, and <-er> (Celce-
Murcia et al., 1996). This historical connection is very clear in Table 2 which shows a
comparison of neutral suffixed words in English and modern-day German (adapted from
“Teaching Pronunciation: A Reference for Teachers of English to Speakers of Other Languages,”
by Celce-Murcia et al., 1996, p. 136).
Table 2. Neutral Suffixes in English and German
Neutral suffix
English
German
<-en> THREAT + en DROH + en
<-er> BAK + er BÄCK + er
<-ful> TACT + ful TAKT + voll
<-hood> CHILD + hood KIND + heit
<-ing> OPEN + ing ÖFFN + ung
<-ish> DEVIL + ish TEUFL + isch
<-less> GROUND + less GRUND + los
<-ship> FRIEND + ship FREUND + schaft
It is important to note that there are other neutral suffixes of non-Germanic origin such as
<-dom>, <-ness>, <-able>, and <-al>, to name just a few, that behave in exactly the same way by
maintaining the stress pattern of the stem morpheme (Celce-Murcia et al., 1996).
Conversely, the suffixes in the second category tend to be of Romance language origin
and are mostly borrowed from modern-day French (Celce-Murcia et al., 1996; Harley, 2003).
Table 3 illustrates this type of non-neutral suffix which causes the final syllable (the suffix itself)
to receive strong primary stress (adapted from “Teaching Pronunciation: A Reference for
Teachers of English to Speakers of Other Languages,” by Celce-Murcia et al., 1996, pp.136-137).
38
Table 3. Stress-bearing Suffixes of Romance Language Origin
Suffix
Word
<-aire> millionaire
questionnaire
doctrinaire
<-ee> refugee
tutee
trustee
<-eer> engineer
mountaineer
volunteer
<-oon> balloon
saloon
bassoon
<-esque> grotesque
arabesque
picturesque
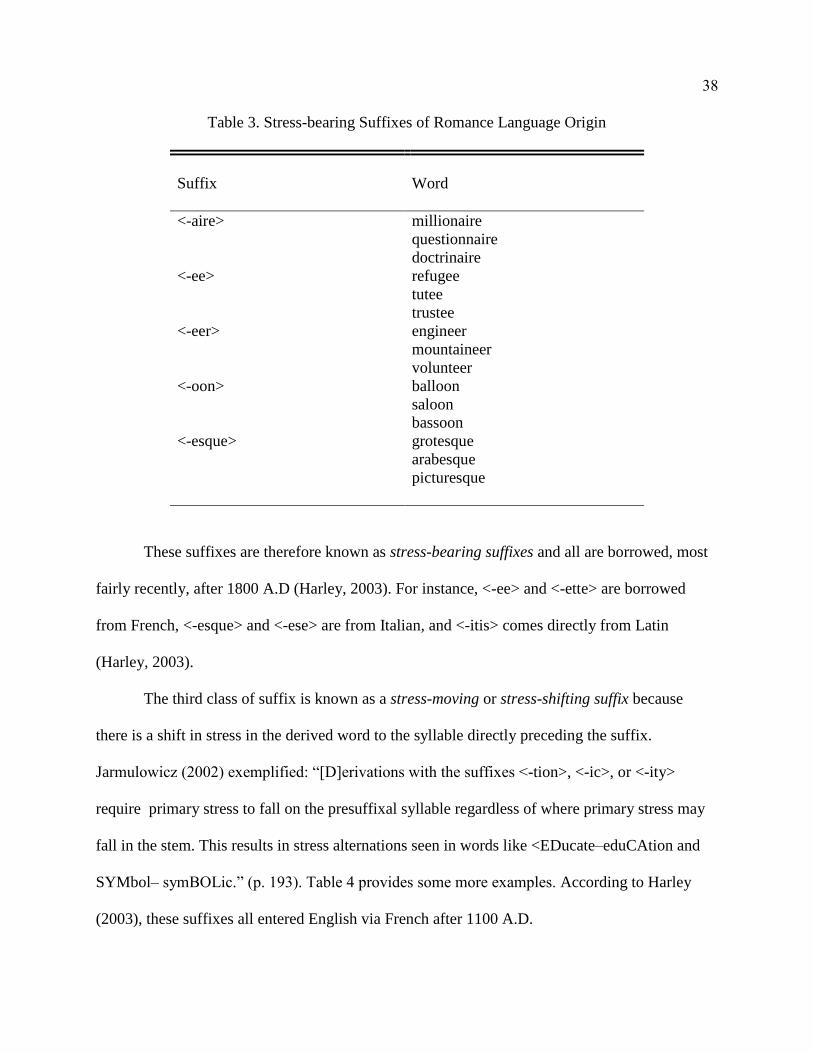
These suffixes are therefore known as stress-bearing suffixes and all are borrowed, most
fairly recently, after 1800 A.D (Harley, 2003). For instance, <-ee> and <-ette> are borrowed
from French, <-esque> and <-ese> are from Italian, and <-itis> comes directly from Latin
(Harley, 2003).
The third class of suffix is known as a stress-moving or stress-shifting suffix because
there is a shift in stress in the derived word to the syllable directly preceding the suffix.
Jarmulowicz (2002) exemplified: “[D]erivations with the suffixes <-tion>, <-ic>, or <-ity>
require primary stress to fall on the presuffixal syllable regardless of where primary stress may
fall in the stem. This results in stress alternations seen in words like <EDucate–eduCAtion and
SYMbol– symBOLic.” (p. 193). Table 4 provides some more examples. According to Harley
(2003), these suffixes all entered English via French after 1100 A.D.
39
Table 4. Stress-shifting Suffixes in English
Suffix
Root Word
Root with suffix
<-eous> advantage advanTAgeous
<-ial> PROVerb proverbial
<-ian> PARis PaRIsian
<-ic> CLImate climatic
<-ical> eCOLogy ECOLOGical
<-ious> Injure injurious
<-ity> TRANquil tranquility
<-ion> EDuCATE EDUCAtion
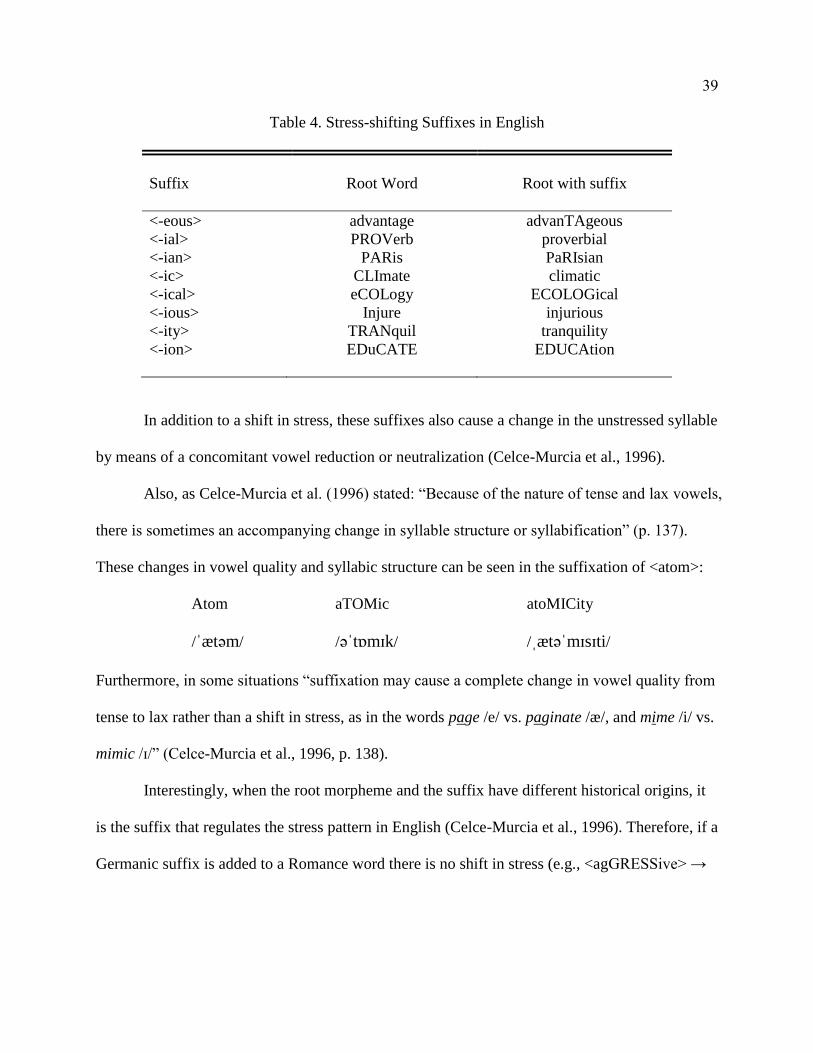
In addition to a shift in stress, these suffixes also cause a change in the unstressed syllable
by means of a concomitant vowel reduction or neutralization (Celce-Murcia et al., 1996).
Also, as Celce-Murcia et al. (1996) stated: “Because of the nature of tense and lax vowels,
there is sometimes an accompanying change in syllable structure or syllabification” (p. 137).
These changes in vowel quality and syllabic structure can be seen in the suffixation of <atom>:
Atom aTOMic atoMICity
/ˈætəm/ /əˈtɒmɪk/ /ˌætəˈmɪsɪti/
Furthermore, in some situations “suffixation may cause a complete change in vowel quality from
tense to lax rather than a shift in stress, as in the words page /e/ vs. paginate /æ/, and mime /i/ vs.
mimic /ɪ/” (Celce-Murcia et al., 1996, p. 138).
Interestingly, when the root morpheme and the suffix have different historical origins, it
is the suffix that regulates the stress pattern in English (Celce-Murcia et al., 1996). Therefore, if a
Germanic suffix is added to a Romance word there is no shift in stress (e.g., <agGRESSive> →
40
<agGRESSively>); but if a Latinate suffix is added to a Germanic stem there will be a resultant
shift in stress (e.g., <BREAKable> → <breakaBIlity>).
Harley (2003) schematized a generalization of the ordering of these borrowed suffixes:
[[[Stem]-(-LatinateAffix(es)](-GermanicAffix(es)]. (p. 156)
Since most stems can occur without any derivational affixes, the round parentheses indicate
optionality. As such, Germanic affixes can occur without any Latinate affixes, and vice versa. In
this scheme, in a word that has both Germanic and Latinate derivational affixes, the Latinate
affix(es) will occur inside the Germanic ones (Harley, 2003). In the next sections, we will focus
our attention on stress-shifting suffixes since this is the area of investigation in this paper.
A Generative Account of Stress-Shifting Suffixes
Jarmulowicz et al. (2008) further described the morphophonemic effects of stress-shifting
suffixes:
[The] addition of a phonologically nonneutral suffix may alter primary stress placement,
consonants, or vowel quality of the stem. For example, the suffix -ity is nonneutral, and
when added to the base electric /IˈlEktrIk/ the resulting word, electricity /IlEkˈtrIsIti/,
exhibits a rightward stress shift and a consonant alternation. (p. 214)
Thus, it will be interesting to explore whether consonantal changes, as well as vowel changes,
can be observed acoustically in words containing stress-shifting suffixes.
There are a variety of ways in which these morphophonological processes are formalized,
but in this paper I shall describe the Level Ordering system expounded by Kiparsky (1982) in his
model of Lexical Phonology. He outlined the coordination of morphological and phonological
rules in the lexicon and makes a distinction between lexical and postlexical phonological
processes. In this view, words are formed at different strata in the lexicon, and at each level, the
corresponding phonological rules are applied to a complex word before it can advance
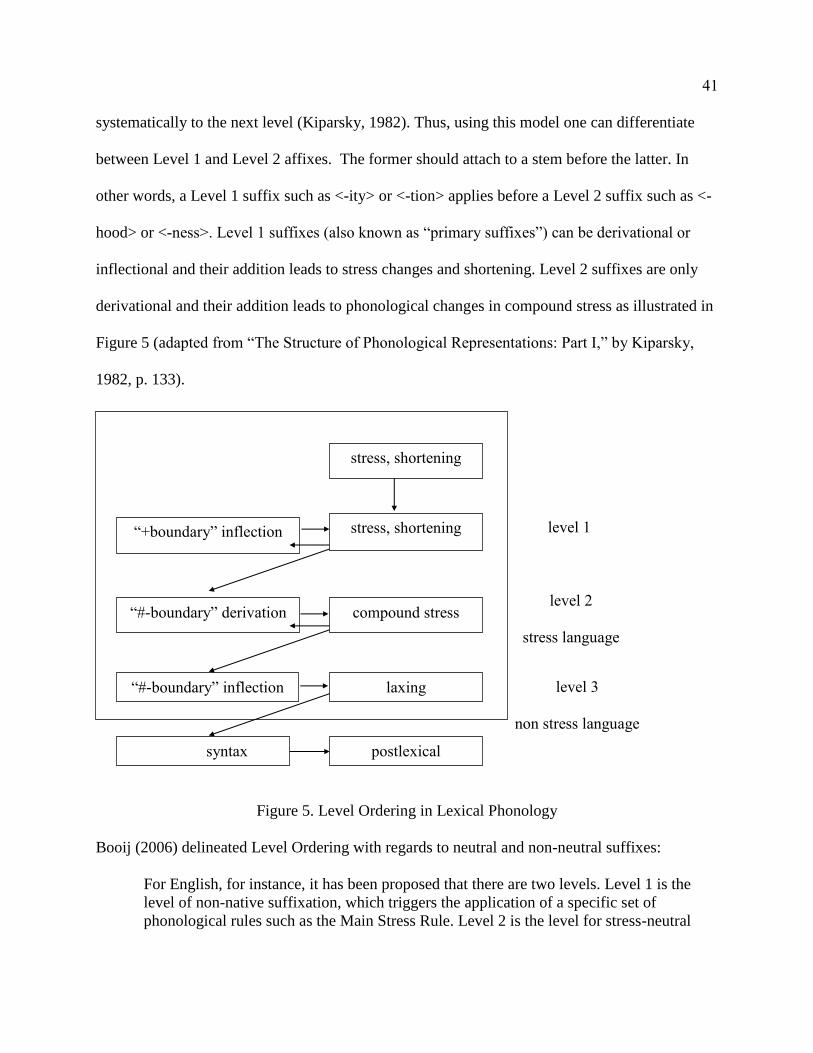
41
systematically to the next level (Kiparsky, 1982). Thus, using this model one can differentiate
between Level 1 and Level 2 affixes. The former should attach to a stem before the latter. In
other words, a Level 1 suffix such as <-ity> or <-tion> applies before a Level 2 suffix such as <-
hood> or <-ness>. Level 1 suffixes (also known as “primary suffixes”) can be derivational or
inflectional and their addition leads to stress changes and shortening. Level 2 suffixes are only
derivational and their addition leads to phonological changes in compound stress as illustrated in
Figure 5 (adapted from “The Structure of Phonological Representations: Part I,” by Kiparsky,
1982, p. 133).
Figure 5. Level Ordering in Lexical Phonology
Booij (2006) delineated Level Ordering with regards to neutral and non-neutral suffixes:
For English, for instance, it has been proposed that there are two levels. Level 1 is the
level of non-native suffixation, which triggers the application of a specific set of
phonological rules such as the Main Stress Rule. Level 2 is the level for stress-neutral
“#-boundary” inflection laxing
“+boundary” inflection stress, shortening
stress, shortening
syntax postlexical
“#-boundary” derivation compound stress
level 1
level 2
stress language
level 3
non stress language
42
(native derivational and inflectional) suffixes. At this level, the Main Stress Rule no
longer applies, thus accounting for the stress-neutrality of these suffixes. This level
ordering hypothesis also predicts that stress-neutral suffixes are peripheral to those that
influence the stress patterns of words, such as the stress-bearing non-native (Romance)
suffixes of English. For instance, in the complex noun contrastiveness the stress-shifting
suffix –ive precedes the stress-neutral suffix –ness. (pp. 96-97)
There is, however, a problem with this model. Aronoff (1976) showed it to be empirically invalid
(after it was first proposed by Siegel), and called it the “Boundary Paradox” (p. 84). He provided
counterexamples to this hypothesis whereby there is a shift in stress even when a Level 2 suffix
applies to a complex word after a Level 1 suffix has been affixed. For example, when Level 1 <-
ity> is applied after Level 2 <-able> to the word <anaLYZable>, it results in <analyzaBIlity>
(Aranoff, 1976, p. 84 (emphasis added by author)).
Consequently, Halle and Kenstowicz (1991) later revised Kiparsky’s model of lexical
phonology by suggesting that morphophonemic features (such as primary or “main” stress)
generated at Level 1 are filtered back through cyclical phonological rules. Thus, in this cyclical
framework, hierarchy of rule application does not dictate phonological outcome. Instead it is
dependent upon whether a particular suffix is marked in the lexicon as phonologically cyclic, or
[+cyclic] or noncyclic [-cyclic]. Hale and Kenstowicz (1991) provided the following illustrative
example:
To illustrate this approach, the word patentability is derived as follows. On the first cycle,
stress is assigned to the root to yield [patent]. Being [-cyclic], the -able suffix does not
activate the stress rule. However, the next suffix -ity is [ + cyclic] and the stress rule
therefore applies to yield patent-abil-ity. Another key feature of our framework is that
cyclic (that is, stress-sensitive) affixes trigger a convention of Universal Grammar that
deletes the stresses assigned on earlier passes through the rules of the cyclic block […].
(p. 460)
Hence, the following stress-shifting suffixes mentioned by Celce-Murcia et al. (1996),
<eous>, <-ial>, <-ian>, <-ic>, <-ical>, <ious>, <-ity>, and <-ion>, would be stored as Level 1-
43
type [+cyclic] in the lexicon. In the literature, cyclic vs. noncyclic suffixes have also been
labeled phonologically nonneutral vs. neutral and phonologically opaque vs. transparent.
(Jarmulowicz, 2002).
Corpus Frequencies of Stress-Shifting Suffixes
Table 5 shows the 20 most frequent English suffixes in 2, 167 suffixed words appearing
in 60 randomly selected pages of The American Heritage Word Frequency Book (Carroll, Davies,
& Richman, 1971). The list was compiled by White, Sowell, and Yanagihara (1989) and applied
to third grade research. To be expected, the inflectional suffixes <-s>, -<es>, <-ed>, and <-ing>
account for almost two-thirds of the words. In Table 5, the most frequent stress-shifting suffixes
are shaded in gray. The most frequent stress shifting suffix by far is the <-ion, -tion, -ation, -ition>
morpheme which constitutes around four percent of suffixes in the corpus. Interestingly, the
other stress-shifting suffixes (i.e., <-al, -ial>, <-ity, -ty>, <-ic>, <-ous, -eous, ious>, each account
for approximately one percent of the suffixes used in American English. All other suffixes, not in
the list, constitute just seven percent of the corpus.
Previous and Related Studies on
Stress-Shifting Suffixes
Jarmulowicz (2002) hypothesized that native English speaking children’s acquisition of
morphophonologically conditioned stress changes would be influenced by the frequency of
occurrence in the input of the various Level 1 [+cyclic] suffixes. In particular, she was interested
in determining when in a child’s development does he/she learn that English has cyclic
suffixes,when does he/she know when a suffix is cyclic, and when does he/she know that stress
is predictable. Jarmulowicz (2002) conducted two studies in order to answer these questions
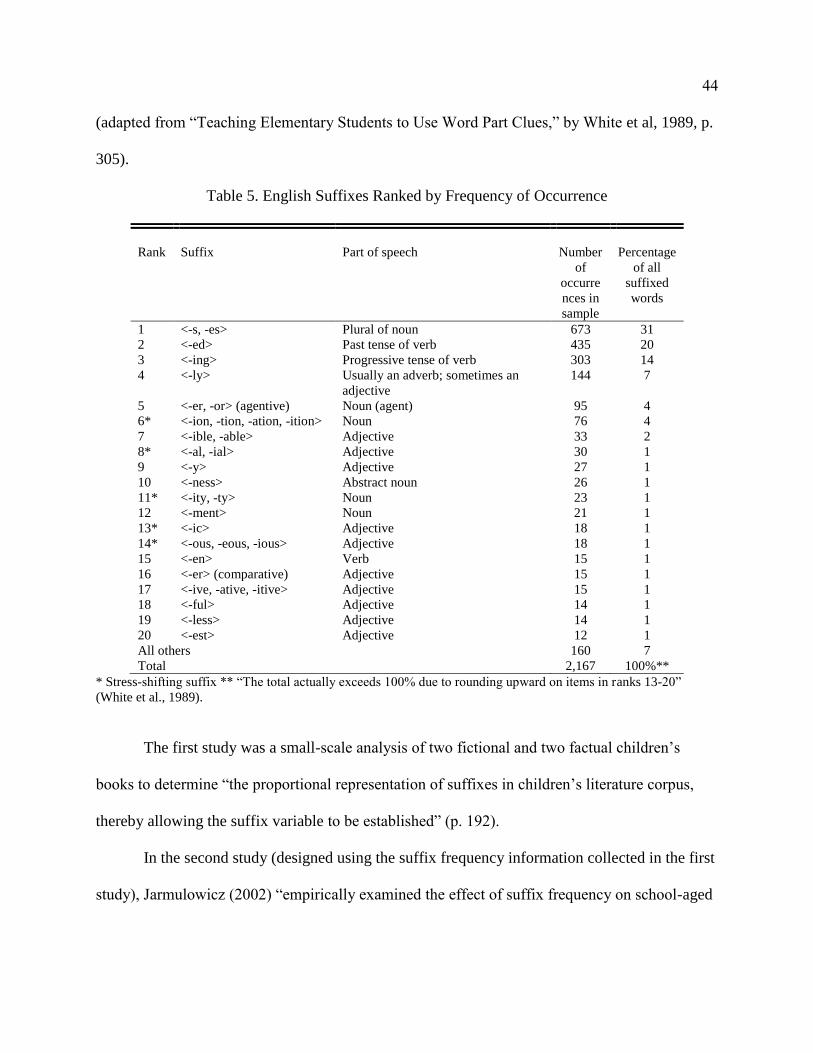
44
(adapted from “Teaching Elementary Students to Use Word Part Clues,” by White et al, 1989, p.
305).
Table 5. English Suffixes Ranked by Frequency of Occurrence
Rank
Suffix
Part of speech
Number
of
occurre
nces in
sample
Percentage
of all
suffixed
words
1 <-s, -es> Plural of noun 673 31
2 <-ed> Past tense of verb 435 20
3 <-ing> Progressive tense of verb 303 14
4 <-ly> Usually an adverb; sometimes an
adjective
144 7
5 <-er, -or> (agentive) Noun (agent) 95 4
6* <-ion, -tion, -ation, -ition> Noun 76 4
7 <-ible, -able> Adjective 33 2
8* <-al, -ial> Adjective 30 1
9 <-y> Adjective 27 1
10 <-ness> Abstract noun 26 1
11* <-ity, -ty> Noun 23 1
12 <-ment> Noun 21 1
13* <-ic> Adjective 18 1
14* <-ous, -eous, -ious> Adjective 18 1
15 <-en> Verb 15 1
16 <-er> (comparative) Adjective 15 1
17 <-ive, -ative, -itive> Adjective 15 1
18 <-ful> Adjective 14 1
19 <-less> Adjective 14 1
20 <-est> Adjective 12 1
All others 160 7
Total 2,167 100%**
* Stress-shifting suffix ** “The total actually exceeds 100% due to rounding upward on items in ranks 13-20”
(White et al., 1989).
The first study was a small-scale analysis of two fictional and two factual children’s
books to determine “the proportional representation of suffixes in children’s literature corpus,
thereby allowing the suffix variable to be established” (p. 192).
In the second study (designed using the suffix frequency information collected in the first
study), Jarmulowicz (2002) “empirically examined the effect of suffix frequency on school-aged
45
children’s judgments of primary stress placement” (p. 192). To do this, she used two groups of
20 children with mean ages of 7:3 (years: months) and 9:5 (years: months), and one
“performance ceiling” group of ten adults with a mean age of 36 years (p. 197). The stimuli used
were one list of 12 real English derivations and another list of 12 nonsense derivations of stem
words containing two syllables and affixed with the following [+cyclic] suffixes: the highest
frequency suffix <-tion>, the mid-frequency suffix <-ity>, and the lower frequency suffix <-ic>.
Each list also contained filler words that used [-cyclic] suffixes. The lists were recorded onto
audiotape in sets of minimal stress pairs. The children listened to the real words first, followed
by the nonsense words. They were then “required to make a binary choice indicating their
preference for one member of a minimal stress pair” (p. 197).
It is interesting to note how Jarmulowicz (2002) handled the data. First, the proportions
were recalibrated using an arcsine transformation (2*(arcsin(sqrt(X))) in order to make the data
more salient for linear statistics. Then mean proportions and standard deviations for all the
groups were calculated. This clearly demonstrated the adults’ ability to accurately assess primary
stress on real and nonsense derived words, thus indicating that they were relying on the [+cyclic]
phonological features of the suffix. It also showed that the children did not complete the tasks to
the same degree of accuracy as the adults. A two-way ANOVA was conducted in order to
conclude whether there were significant differences between the 7 and 9 years olds and the
suffixes <-tion>, <-ity>, and <-ic>. A main effect of age group was found; as Jarmulowicz (2002)
states, “The 9-year-old children were more proficient judges of primary stress than the 7-year-old
children” (p. 198). A main effect of suffix was also found, although there was no observable
relationship between suffix and age. In Jarmulowicz’s (2002) words:
46
Children in both groups performed at ceiling levels when judging stress placement on
real -tion derivations, thereby making further contrasts with these cells impossible.
Therefore, a 2 X 2 X 2 ANOVA was used, with age group (7- and 9-year-olds) as the between-
subjects variable and suffix (-ity and -ic) and word stem (real and nonsense) as the within-subject
variables (p. 198). The results showed that both groups performed better on real <-ity>
derivations than nonsense <–ity> derivations while only the 9-year-old group performed
significantly better on the real than the nonsense <-ic> derivations.
Overall, the findings from this study indicated that the two independent variables of age
and suffix frequency both had an effect on children’s acquisition of stress-placement awareness.
As Jarmulowicz (2002) summarized:
The hypothesis that suffix frequency would affect children’s suffix knowledge was
supported. Despite the fact that the judgments on derivations with the two suffixes of lesser
frequency (i.e., -ity and -ic) were not significantly different from each other statistically, the most
frequent suffix of the three (-tion) had a very robust advantage regardless of whether it was
attached to a real or nonsense stem (p. 200). She also advised that further studies be conducted
across a broader range of suffixes and ages in order to “clarify the role of frequency in the
development of English derivation” (p. 232).
Although this study is derived from the field of child language acquisition, it raises many
interesting questions for SLA research. What is the rank order of Level 1 [+cyclic] suffix
frequency in the Academic Word List? What are the most frequent stress-shifting suffixes that
ESL/EFL learners are exposed to in their course books? Is suffix frequency an important variable
in L2 learners’ ability to judge where primary stress falls in Level 1 [+cyclic] derivations? If so,
is there an accessibility hierarchy of suffix acquisition? Moreover, would proficiency level
47
and/or time spent in an ESL environment (i.e., amount of input) show a main effect in accurate
stress placement and production? The latter are questions that I intend to explore in this paper
while keeping the variable of suffix frequency as a constant.
In a follow-up study by Jarmulowicz et al. (2008), they investigated “the effects of lexical
frequency on children’s production of accurate primary stress in words derived with nonneutral
English suffixes” (p. 213). They gave “Berko-like” (p. 217) elicited derived word tasks to 44
third-graders so that this time they could observe children’s production of stress-shifting suffixes.
The same [+cyclic] stress-shifting suffixes (i.e., <-tion>, <-ic>, <-ity>), as in the previous
study, were used to create high frequency, low frequency and nonsense derived words. However,
because the original suffix corpus was too small, the researchers used an additional method for
evaluating suffix frequency using the MRC Psycholinguistic Database (Jarmulowicz et al., 2008,
p. 219). The final order of suffix frequency was <-tion>, <-ity> then <-ic> and therefore, the
latter two suffixes had switched positions from the previous study.
The researchers used impressionistic techniques to assess the accuracy of children’s
productions by employing judges trained in phonetics to listen to and evaluate the utterances
based on certain criteria. Overall the results of the study indicated that derived word frequency
affects stress production accuracy, and that the individual suffix also has a significant role in
stress placement since <tion> productions were more accurate than either <-ic> or <-ity>
productions. Interestingly, a relationship between stem word and suffix was found as Jarmulowic
et al. (2008) report:
[D]erived word frequency relative to stem frequency was related to performance. Stress
was less accurate on derived words that were much lower in frequency than their stems (e.g.,
48
tranquil/tranquility) and more accurate on derived words that approximated or exceeded their
stem frequency (e.g., motivate/ motivation). (p. 213)
This study provides useful data about ranking stress-shifting suffixes into corpus
frequency bands. It would be instructive to investigate whether similar findings can be attained
by analyzing the speech of NNES. Moreover, it would be beneficial to future language research
to develop methodologies to acoustically analyze the productions of words with stress-shifting
suffixes so that findings are not based solely on impressionistic judgments.
In the field of SLA research, Flege and Bohn’s (1989) oft-cited study explored the
patterns of English stress placement and vowel reduction in productions of four pairs of
morphologically related words by NES and Spanish L1 NNES. The tokens consisted of base and
derived words (i.e., <able>/<ability>, <Satan>/<Satanic>, <application>/<apply>,
<botany>/<botanical>) where the first word in each pair had a stressed first syllable, and the
second word had an unstressed first syllable. These were specifically selected as they were
“illustrative of the phenomenon of vowel reduction” according to Stockwell and Bowen’s (1965)
study (cited in Flege & Bohn, 1989, p. 41). It is useful to note that one of each pair of words
contains a stress-shifting suffix, although this was not specifically mentioned by the authors.
The researchers transcribed the data by marking stress or lack thereof on the first syllable
of each word and then measured the acoustic correlates of duration and intensity between
stressed and unstressed vowels. In addition, they also used an optoelectronic instrumental
technique known as glossometry to measure vowel qualities by calculating the tongue heights of
the speakers (Flege & Bohn, 1989, p. 42).
The findings of three-way ANOVAs in which the repeated measure was stress (stressed
vs. unstressed) showed that both NES and Spanish L1 NNES were able to produce significant
49
contrasts in duration and intensity between stressed and unstressed vowels. One-way ANOVAs
revealed that duration ratios were significantly greater for NES than Spanish L1 NNES, whereas
intensity ratios were not significantly different. Furthermore, while the Spanish L1 NNEs were
relatively native-like with regards to the acoustic correlates of duration and intensity, they were
not native-like with regards to vowel quality. That is, they did not produce reduced vowels with
native-like tongue configurations. These results supported the researchers’ hypothesis that “stress
placement poses less of a problem [to English L2 learners] than vowel reduction” (Flege & Bohn,
1989, p. 59).
Another recent SLA study of major relevance to this thesis is Lee and Cho’s (2011)
investigation of the acoustic properties of English stressed and unstressed vowels. In a similar
methodology to Jarmulowicz et al. (2008), they conducted production experiments, in which 5
Japanese, 5 Korean, and 4 American speakers of English were asked to join Level 1 and Level 2
suffixes to corresponding stem words that were given aurally. The rationale behind this
procedure was that participants would have to “tap into their phonological knowledge of suffix
types in assigning stress, without having recourse to the spelling of the target stimulus” (p. 79).
All the Japanese and Korean subjects had spent less than one year in an English-speaking
country. 16 tokens were constructed; that is, eight Level 1 stress-shifting suffixes using <-ation>
and < -ity> and eight Level 2 stress non-shifting suffixes using <-ness> and <ment>. Each token
was given a rating of at least 3 out of 5 based on its frequency according to the online portal site,
Naver (www. Naver.com) (p. 71). Nonsense words were not used. The researchers conjectured
that these words would be familiar to the Korean and Japanese participants.
Acoustic analyses were conducted on the digitally recorded production data using the
open source acoustic analysis software Praat, Version 4.4.30. According to Lee and Cho (2011):
50
Four phonetically trained research assistants measured vowel duration, fundamental
frequency, and intensity of each word separately and then the results of the measurements
were cross-checked by the researchers and the research assistants. When there were
disagreements among the measurements, the research team jointly analyzed the
spectrograms of the targets until the disagreements were all resolved. In addition, all the
stimuli were transcribed by the researchers and a native English speaker with phonetic
training in transcription. (pp. 71-72)
More specifically, they measured the ratios of stressed to unstressed vowels for duration, F0, and
intensity. To determine whether there was statistical significance in the differences between the
mean ratios of stressed to unstressed vowels for the 3 independent variables, the mean ratio of
each factor was entered into an ANOVA, in addition to post hoc (Tukey HSD) tests.
Lee and Cho (2011) summarized their findings:
[N]ative English speakers and Korean speakers were significantly different with regard to
duration whereas native English speakers and Japanese speakers with respect to intensity
(all, p<.05). The results reveal that native English speakers tended to produce stressed
vowels significantly longer than unstressed vowels but they did not show much
difference between stressed and unstressed vowels in terms of fundamental frequency or
intensity. On the contrary, Japanese speakers showed a different pattern from native
English speakers in that they produced stressed vowels with greater intensity than
unstressed vowels. Korean speakers also showed a similar pattern to Japanese speakers
for the three factors, especially with respect to duration and intensity, although somewhat
different statistical results were obtained between the two groups. (pp. 73-74)
Interestingly, no significant ratio difference for F0 was found between stressed and
unstressed vowels among the 3 language groups. Therefore, Lee and Cho (2011) suggested that
Korean and Japanese speakers are only dissimilar to American English speakers with respect to
duration and intensity when differentiating between stressed and unstressed vowels. These
findings seem to support Beckman and Edwards’ (1994) and Beckman and Pierrehumbert’s
(1986) assertion (and thus reject Fry’s (1958) hypothesis) that F0 is the least salient cue to stress.
Of further interest to this thesis, Lee and Cho (2011) reported:
[S]uffix type played a significant role with respect to duration as the participants across
language backgrounds showed higher duration ratios of stressed to unstressed
51
vowels before stress shifting suffixes (-ity, -ation) than before stress non-shifting suffixes
(-ness, -ment). Yet, there was no main effect of suffix type irrespective of stress shifting
or non- shifting suffixes with regards to fundamental frequency and intensity. Also, the
patterns of suffix types varied depending on individual suffixes and language groups. (pp.
61-62)
In Lee and Cho’s (2011) discussion of their results, they suggested possible reasons for
their findings in relation to cross-language characteristics. First, they hypothesized that Korean
speakers are fairly similar to NES with regards to F0 because “Korean prosody is mainly
characterized in terms of a phrase-level pitch accent where F0 patterns are associated with
particular syllables within a phrase” and (p. 80). Furthermore, they suggested that since duration
and intensity are of little importance in the modern Korean prosodic system (except for a few
regional dialects), Korean speakers tend to produce these acoustic correlates in a “nonnative-like
fashion” (p. 81). Second, they conjecture that the reason Japanese speakers also did not show
much difference to NES in terms of F0 is because in Japanese, as in Korean, F0 patterns are the
most salient feature of the prosodic system (i.e., it has “word-level pitch accent”) (Lee and Cho,
2011, p. 81). Dissimilarly to Korean though, according to Lee and Cho (2011), Japanese has
“mora-timed rhythms in which duration is the most important acoustic cue” and so they argue
that this may be the reason why “Japanese speakers were more similar to English speakers than
Korean speakers with respect to duration” (p. 81).
As a final note Lee and Cho (2011) claimed that all NES lengthen the final lax vowel in
all words with stress-shifting suffixes that contain a non-stress-bearing, syllable-final [ɪ] or [ə]
regardless of word length, whereas NNEs tend to lengthen these vowels only in 3-syllable words.
They stated that this phenomenon has been widely acknowledged in the literature (Lee & Cho,
2011).
52
It would be edifying to see whether similar cross-language acoustic studies of Level 1
[+cyclic] suffixes would bear similar results with regards to the hierarchy of salient acoustic
correlates. The aforementioned study did not clearly differentiate between amounts of exposure
to L2 of NNES, only that they had all spent less than one year in an English-speaking country.
Clearly, there would be a large disparity between, for example, a speaker who has spent one
week in the target language environment versus a speaker who has spent 11 months in one. Also,
only English intermediate-level Korean L1 speakers and only English high-intermediate-level
Japanese L1 speakers were used in the study, and these proficiency levels were based on
interviews and self-reports. Therefore, it would be interesting to conduct a study to observe
whether number of years spent in the L2 country would should a main effect on native-like
pronunciation of Level 1 [+cyclic]-suffixed words. Also, only a limited number of stress-shifting
suffixes (<-tion>, <-ity>, and <-ic>) were used in the studies mentioned thus far. For that reason,
it would be valuable to explore whether different Level 1 [+cyclic] suffixes, such as <-eous>, <-
ial>, <-ian>, <-ical>, and <-ious>, have similar acoustic properties in both native and nonnative
speech. Finally, in the interests of generalizability, it would be of considerable import to conduct
replication studies to determine whether the same hierarchy of salient acoustic correlates (i.e.,
duration > intensity > F0) are found for these and other languages.
Acoustic Studies on Mandarin L1
Nnes’ Productions of Stress
Since it is well known that Chinese speakers of English have difficulty producing native-
like lexical stress contrasts, Zhang et al. (2008) conducted a study to determine which correlates
are most problematic for Mandarin speakers. They hypothesized that the tonal phonetic
categories of Mandarin would interfere with the ordering of these correlates. The rationale for
53
their study is comparable to the justification provided for the investigation described in this
thesis:
Here we attempt to dissociate the question of whether, or to what degree, non-native
speakers are able to apply phonological rules of stress placement, in order to focus on the
question of whether they are able to correctly produce the phonetic properties that
correlate with the English stress contrast under conditions in which they know
unambiguously where stress is to be placed. (p. 4498)
They compared the use of F0, duration, intensity, and vowel quality in the production of
lexical stress contrasts by ten Mandarin (five male, five female) and ten native English speakers
(five male, five female). The Mandarin speakers were all originally from the People’s Republic
of China (PRC) and had resided in the U.S. for three to four years, while the English speakers
were all native residents of the U.S. Only subjects who self-reported having normal hearing,
speech, and language faculties were selected. Also, for the purposes of detailed data analysis,
subjects were asked to complete a “language background questionnaire” prior to experimentation
(Zhang et al., 2008, p. 4501).
Using the classic methodology of Fry (1955, 1958), Lieberman (1960), and Beckman
(1986), Zhang et al.’s (2008) stimuli consisted of seven disyllabic minimal noun-verb stress pairs
(i.e., <contract>, <desert>, <object>, <permit>, <rebel>, <record>, and <subject>). The stimuli
were presented to participants on file cards, and tokens were elicited in isolation; however, only
after subjects ‘practiced’ pronouncing the target words in specifically created context sentences,
and the semantically neutral frame sentence “I said ________ this time”, as well as receiving
‘training’ on the role of stress shift in minimal stress pairs (For further details, read Zhang et al.,
2008, .4501). This yielded 560 tokens (14 words x 2 repetitions x 20 subjects) to be analyzed
instrumentally and perceptually. In addition, Zhang et al. collected and compared acoustic vowel
space data using an adaptation of Peterson and Barney’s (1952) data collection approach of
54
measuring F1 and F2 values. The procedures for this portion of their study will not be discussed
as they are beyond the scope of this thesis. The precise details of the recording equipment and
environment used by Zhang et al. are, however, of relevance to this paper. The researchers
indicated that:
All recordings took place in a single-walled sound-attenuated booth and were made using
a digital audio recorder (SONY DAT, TCD-D8), Studio V3 amplifier, and a
unidirectional Hypercardiod dynamic microphone (Audio-Technica D1000HE). The
microphone was placed approximately 20 cm from the speaker’s lips at an angle of 45°
(horizontal) during recording. The speech tokens were sampled at a rate of 44.1 kHz with
a quantization of 16 bits and low-pass filtered at 22.05 kHz. Each token was then saved
as an individual sound file and normalized to a RMS amplitude of 70 dB using Praat 4.3
[…]. (p. 4501)
Although Zhang et al. (2008) also used subjective acceptability ratings of accentedness, in this
paper the interest is focused on how they performed their acoustic measurements of the
parameters of stress using the Praat acoustic analysis software. Unlike in the previously
described study by Lee and Cho (2011) where the correlates of intensity and F0 were measured
within a vowel, Zhang et al. (2008) measured them within a syllable. Therefore, it is useful to
know how Zhang et al. used spectrogram and waveform cues to segment syllable boundaries
according to Peterson and Lehiste’s (1960) segmentation criteria:
Syllable (and vowel) boundaries were segmented according to the following criteria: (1)
word/syllable 1 onset: The first upward-going zero crossing at the beginning of the
waveform; (2_) word/syllable 2 offset: The ending point of the sound waveform at the
last downward-going zero crossing; (3) syllable 1 offset/syllable 2 onset: In words with a
stop consonant as the onset of the second syllable (such as rebel, contract, object, subject,
record), this was defined at the beginning of the silence of the stop gap. In words with no
medial stop consonant (permit, desert), then the boundary was marked as the transition
between the acoustic (spectrographic) pattern of the initial consonant of the second
syllable and the segment immediately preceding it. (p. 4503)
Zhang et al. (2008) then explained how they measured the three correlates of stress based upon
these syllabic segmentations:
55
[S]yllable (and vowel) durations were calculated in millisecond increments […]. The
average intensity measure was calculated as the mean of multiple intensity values extracted
and smoothed over the number of time points necessary to capture the minimum predicted
pitch of each individual participant. F0 measures were measured as the average value over
the entire syllable, and were computed using a Hanning analysis window and the
autocorrelation method described in Boersma (1993). When measuring F0, the pitch range
for female talkers was set to 100–500 Hz and 75–300 Hz for male talkers, as recommended
in the Praat manual. (p. 4503)
In their acoustic data analysis of the measured variables, Zhang et al. (2008) used similar
statistical techniques to Lee and Cho (2011). A mixed factorial ANOVA was performed with
stress (stressed vs. unstressed) as the within-subjects variable, and L1 and gender as the between-
subjects variables. Then post hoc (Tukey HSD) tests were performed, all with a critical p value
of 0.05.
The results of Zhang et al.’s (2008) study indicated that while Mandarin speakers did
utilize all four acoustic correlates of duration, intensity, F0, and vowel quality, to differentiate
between stressed and unstressed syllables, they exhibited significantly less native-like stress
patterns. Interestingly, Mandarin and English speakers’ use of duration and intensity were found
to be similar for both stressed and unstressed syllables, but Mandarin L1 speakers produced
stressed syllables with a higher F0 than NES. With respect to their acoustic vowel space study,
Zhang et al. report that there were “significant differences in formant patterns across groups,
such that Mandarin speakers produced English-like vowel reduction in certain unstressed
syllables, but not in others” (p. 4498). In their conclusion, the researchers propose that both L1
experience with Mandarin lexical tones and various dissimilarities in Mandarin and English
vowel inventories may adversely affect Mandarin speakers’ productions of English lexical stress
contrasts.
56
Another study, by Keating and Kuo (2012), also found F0 profiles to differ between
English and Mandarin although this was dependent upon speech context. While Mandarin
speakers’ usage of F0 in simulated “tone sweeps” (p. 1051) was very similar to NES, their usage
of F0 in one-word utterances was markedly different. That is, Mandarin speakers produced
higher F0 and larger ranges of F0 than NES. Also, although the two language groups were closer
in their productions of read prose passages, Mandarin speakers had a higher mean value of F0.
Barto-Sisamout (2011) highlighted another difference between English and Mandarin
usage of F0 contours. She states that in English, there is a “pitch peak delay where the F0 peak
occurs after the stressed syllable in two-syllable stress-initial words” (p. 2553), whereas in
Mandarin, the F0 peak actually falls on the stressed syllable. According to Barto-Sisamout, this
is owing to the fact that tone languages use F0 contours lexically. With this in mind, it will be
interesting to observe whether the presence and absence of a pitch peak delay can be detected in
productions of the stem-word token <HIStory> (See Method section) by NES and Mandarin L1
NNES, respectively.
Li and Shuai (2011) examined the suprasegmental features of Chinese-accented English
by examining the prosodic correlates of syllable duration and F0 in read speech. They found that
mean syllable duration of Mandarin L1 speakers was greater than for NES, while NES produced
a much wider pitch (F0) range. This is seemingly in conflict with Keating and Kuo’s (2012)
findings that showed Mandarin L1 speakers to have a larger pitch range than NES. In congruence
with other researchers, Li and Shuai propose that the tone systems of Mandarin and Cantonese
are responsible for the prosodic deviations in Chinese learners’ English. Incidentally, Mandarin
speakers were found to be more similar to NES than Cantonese speakers.
57
Finally, the results of Jia, Strange, Wu, Collado, and Guan’s (2006) study of Mandarin L1
speakers’ imitations of American vowels in disyllabic elicitation tokens suggest that age and
amount of L2 immersion both impact production accuracy. The researchers maintained that their
findings can be explained by a combination of the “Environmental and L1 Interference/Transfer
theory” which postulates a “long-term younger-learner advantage in mastering L2 phonology” (p.
1128).
In this paper, the researcher intends to explore whether amounts of L2 input and exposure
show any correlation with accuracy of stress placement and/or acoustic correlate production in
the data collected in this thesis.
Acoustic Studies on Arabic L1
Nnes’ Productions of Stress
Zuraiq and Sereno (2005) analyzed the production of lexical stress by NES and Jordanian
Arabic L1 speakers by conducting two experiments. The first experiment followed Fry’s (1955,
1958) methodology by inspecting acoustic cues to lexical stress in recordings of English
minimal-stress pairs. In accordance with other studies mentioned thus far, stressed vowels were
compared to unstressed reduced vowels. Zuraiq and Sereno (2005) selected four acoustic
correlates to examine; i.e., F0, duration, intensity, F2. A Two-way Repeated Measures ANOVA
was administered to examine the factors of stress (first syllable vs. second syllable stress)
and speaker (NES vs. Arabic L1 NNES) for each of the four acoustic cues.
The results showed that NES consistently employ all four correlates to signal stress, with
reduced F0, duration, intensity, and vowel quality for unstressed syllables. Intriguingly, although
Arabic L1 NNES were similar to NES in their usage of duration and intensity parameters, they

58
(like Mandarin speakers) used a larger range of F0 contours to differentiate lexical stress. In
addition, F2 value analysis revealed that Arabic L1 NNES did not reduce unstressed vowels.
Zuraiq and Sereno (2005) conducted a second experiment, this time using Arabic
disyllabic minimal stress pairs, with the purpose of examining the acoustic correlates of
stress used by Arabic speakers in their L1. Their findings indicated that Jordanian Arabic
speakers consistently use F0, duration, and intensity to cue stress in Arabic words, but do
not reduce vowels in their L1 either. The researchers therefore hypothesized that Arab
learners of English “over-use fundamental frequency cues” to compensate for not reducing
vowels in unstressed syllables (p. 4).
Bouchhioua’s (2008) study, which also used minimal-stress pairs, found that duration is
not an important correlate of lexical stress in Tunisian Arabic as it is in English. In this language,
duration appears only to signify accent. However, this difference in native system stress
properties did not seem to result in negative transfer. Bouchhioua (2008) reported that Tunisian
Arabic speakers produced significant and contextually appropriate durational contrasts between
stressed and unstressed syllables in English words. That said, there was evidence to explain
nonnative accentedness. Seemingly, participants did routinely produce longer English segments
and words than NES, which as Bouchhioua (2008) suggests, “may reveal their non-nativeness”
(p. 535).
From the studies mentioned in the previous two sections, it would appear that, unlike
Korean L1 and Japanese L1 NNES who respectively produce the acoustic correlates of duration
and intensity in a nonnative-like manner, Mandarin L1 and Arabic L1 NNES produce F0 in a
nonnative-like manner. That is, the production of the acoustic cues of duration and intensity do
59
not seem to be so problematic for these two groups of NNES. Therefore, this study seeks to
observe whether similar results can be obtained in the productions of stress in polysyllabic Level
1 [+cyclic] derivations.
60
Chapter III: Methodology
Restatement of Research Questions
1) Do English Level 1 [+cyclic] suffixes such as <ious>, <ial>, <ian>, <ic>, <ical>, <ity>,
and <ify> cause a shift in stress when spoken by native speakers of MWAE, and can this be
observed quantitatively using acoustic measurements of F0, duration, and intensity?
2) What is the salience hierarchy of the three acoustic correlates of stress (SHACS) in
productions of polysyllabic Level 1 [+cyclic] derivations by native speakers of MWAE?
3) How do NNES of different L1 backgrounds (i.e., Arabic and Mandarin) order the correlates
of stress similarly or differently to NES?
4) Which acoustic correlates are problematic for Arabic L1 and Mandarin L1 speakers when
producing lexical stress contrasts in Level 1 [+cyclic] derivations?
5) Is there a correlation between amount of L2 exposure (years of residence in L2
environment) and/or amount of L2 input (years of L2 study) and accurate production of the
three acoustic cues? I.e., do these variables show a large effect in:
a) Accurate placement of stress in Level 1 [+cyclic] derivations.
b) Native-like production of the acoustic correlates of stress in Level 1 [+cyclic]
derivations.
6) Do some stress-shifting suffixes behave idiosyncratically with regards to standard
American English dictionary pronunciations?
7) Is there a major pitch change (i.e., a shift in tonic accent) from the secondary stressed
syllable (i.e., the primary stressed syllable in the stem word) to the primary stressed
syllable in Level 1 [+cyclic] derivations as claimed by Ladefoged and Johnson (2010,
p.119)?
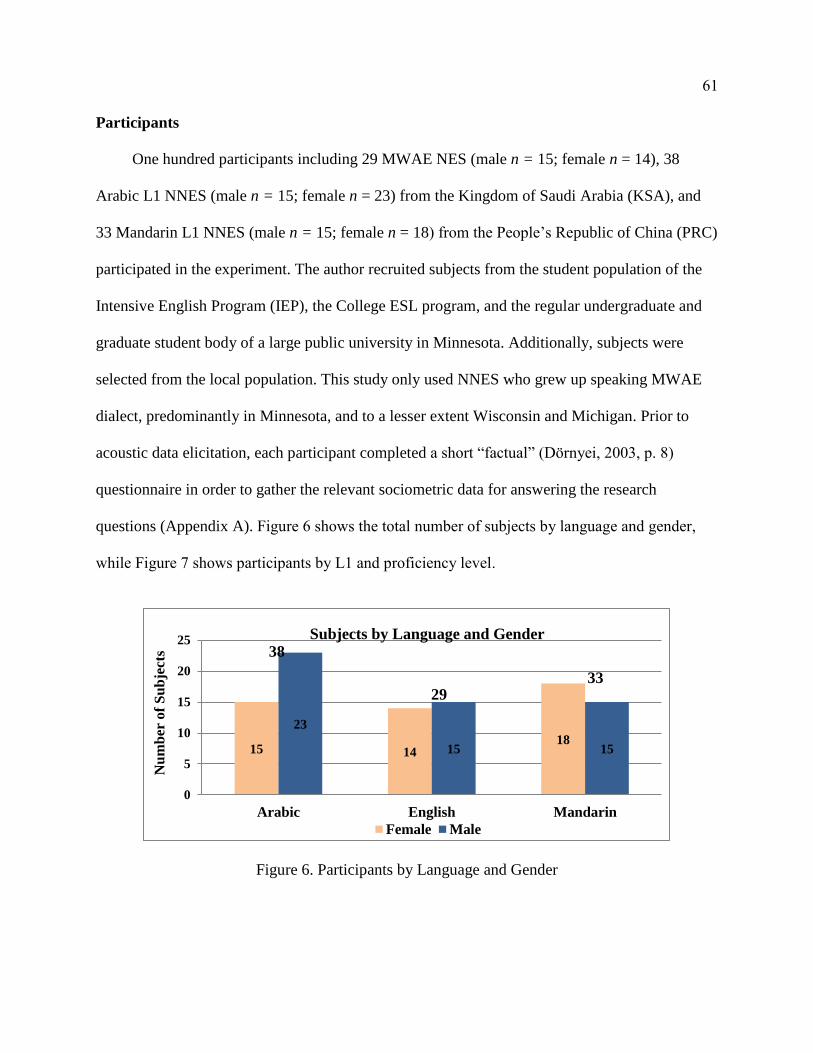
61
Participants
One hundred participants including 29 MWAE NES (male n = 15; female n = 14), 38
Arabic L1 NNES (male n = 15; female n = 23) from the Kingdom of Saudi Arabia (KSA), and
33 Mandarin L1 NNES (male n = 15; female n = 18) from the People’s Republic of China (PRC)
participated in the experiment. The author recruited subjects from the student population of the
Intensive English Program (IEP), the College ESL program, and the regular undergraduate and
graduate student body of a large public university in Minnesota. Additionally, subjects were
selected from the local population. This study only used NNES who grew up speaking MWAE
dialect, predominantly in Minnesota, and to a lesser extent Wisconsin and Michigan. Prior to
acoustic data elicitation, each participant completed a short “factual” (Dörnyei, 2003, p. 8)
questionnaire in order to gather the relevant sociometric data for answering the research
questions (Appendix A). Figure 6 shows the total number of subjects by language and gender,
while Figure 7 shows participants by L1 and proficiency level.
Figure 6. Participants by Language and Gender
15 1418
23
15 15
0
5
10
15
20
25
Arabic English Mandarin
Nu
mb
er o
f S
ub
ject
s
Subjects by Language and Gender
Female Male
38
2933
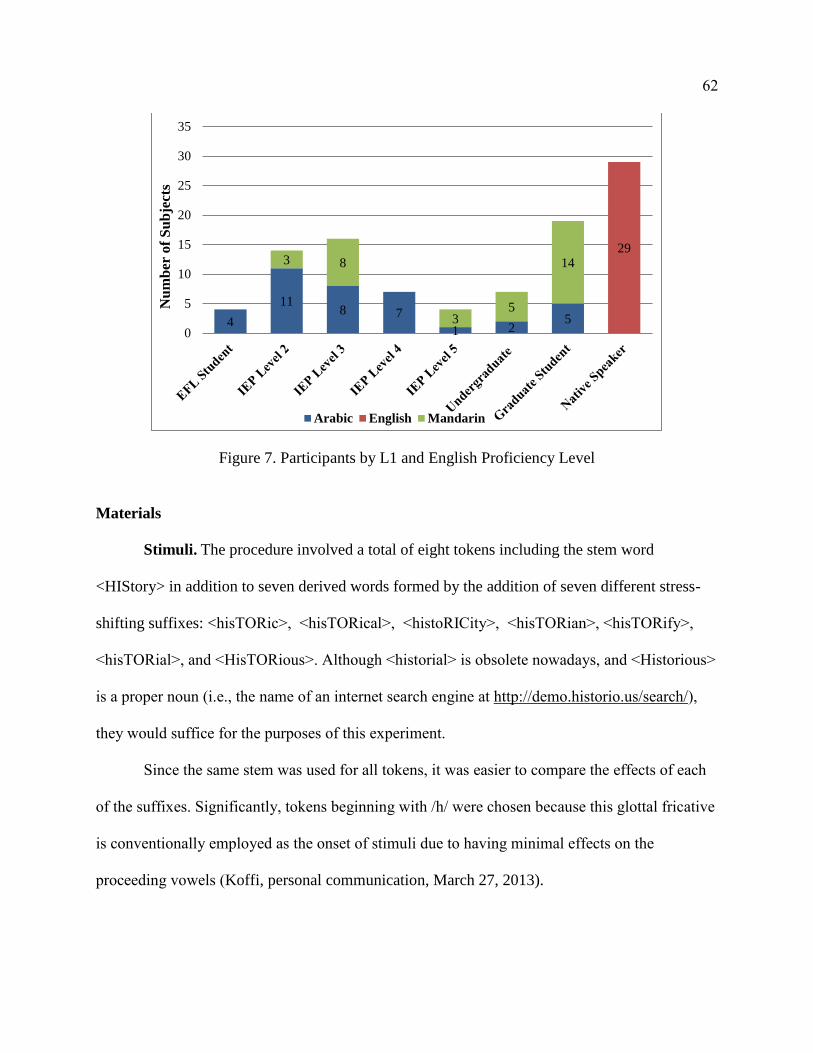
62
Figure 7. Participants by L1 and English Proficiency Level
Materials
Stimuli. The procedure involved a total of eight tokens including the stem word
<HIStory> in addition to seven derived words formed by the addition of seven different stress-
shifting suffixes: <hisTORic>, <hisTORical>, <histoRICity>, <hisTORian>, <hisTORify>,
<hisTORial>, and <HisTORious>. Although <historial> is obsolete nowadays, and <Historious>
is a proper noun (i.e., the name of an internet search engine at http://demo.historio.us/search/),
they would suffice for the purposes of this experiment.
Since the same stem was used for all tokens, it was easier to compare the effects of each
of the suffixes. Significantly, tokens beginning with /h/ were chosen because this glottal fricative
is conventionally employed as the onset of stimuli due to having minimal effects on the
proceeding vowels (Koffi, personal communication, March 27, 2013).
4
118 7
1 25
293 8
35
14
0
5
10
15
20
25
30
35
Nu
mb
er o
f S
ub
ject
s
Arabic English Mandarin

63
Additionally, Post and Nolan (2012) state: “For data to be quantifiable, any variation that
is extraneous to the question at hand needs to be factored out or controlled for” (p. 543).
Therefore, to control for the moderator variable of suffix frequency, each of the Level 1 [+cyclic]
suffixes used has approximately the same corpus frequency of around one percent or less
(Carroll et al., 1971; White et al., 1989). Consequently, <-tion>, which has a frequency of around
four percent (White et al., 1989) was not used in this study.
Participants produced the eight tokens randomly from the list in the carrier phrase “Say
__________ again”. The carrier phrase was designed so that the words did not carry an onset
rise or a pitch accent. According to Maeda (1976), an onset rise occurs at the start of a prosodic
phrase, and a pitch accent denotes the main stress in the prosodic phrase. The latter’s location
can vary depending on whether there is contrastive or emphatic stress. In this case, “Say” carries
the onset rise, and “again” carries the pitch accent.
Recording equipment and environment. The author made all recordings with an
Olympus WS-710M Digital Voice Recorder inside a quiet room on campus3. In accordance with
Zhang et al.’s procedure (2008), the recorder’s microphone was situated roughly 20 cm from the
informants’ lips at an angle of 45 degrees.
Each of the tokens was recorded as an individual sound file. These files were converted
from stereo .mp3 files into mono .wav files using Switch Sound File Converter Plus, Version
4.27 by NCH Software at a sampling rate of 44.1 kHz and quantization of 16 bits – the norm
criteria for microphone speech in acoustic phonetic studies (Jurafsky & Martin, 2008).
3 Although the university has a sound-attenuated booth, it was not practicable to use this due to the large
number of participants and its distance from the main recruitment location. However, following the
recommendations of Plichta (2004), low-frequency noise was reduced as much as possible in the recording room by
switching off all electrical appliances that would otherwise cause background hum.
64
Procedure
Data collection. The procedure used in this study followed the elicitation techniques
employed in the classic experiments of Fry (1955, 1958) and Liberman and Pierrehumbert
(1984). As Post and Nolan (2012) attest, “Read utterances have been widely used in prosodic
research as they allow complete control over parameters relevant to discourse status and number
of pitch accents, down to the segmental constituency of relevant syllables, and they facilitate
auditory and acoustic analysis” (p. 546). In addition, Ladefoged and Johnson (2010) advise that
stress is more readily identifiable in “citation forms” (p. 111).
The researcher showed the eight tokens to the participants on eight separate cards. These
cards were shuffled before each elicitation session to eliminate any potential ordering effects.
Cowart (1997) provides details on the necessity of randomization and test order in experimental
design in applied linguistics. Prior to recording, the participants did not receive any training on
the pronunciations of the tokens. The rationale is that they would have to rely upon their
phonological knowledge of where to shift the primary stress in the derived tokens.
Data analysis. Acoustic phonetic analyses of the productions were performed in a similar
methodology to Flege and Bohn (1989), Zhang et al. (2008), and Lee and Cho (2011) using
Praat (Version 5.3.31). However, to the best of the author’s knowledge, the proposed method of
comparing vowels was novel in that the acoustic correlates in vowels with primary stress were
examined in relation to those of all the other vowels in the utterance–as opposed to just one of
the unstressed vowels (e.g., Flege & Bohn, 1989; Lee & Cho, 2011). In other words, the [+tonic
acc.] vowel in each token was acoustically compared to the [-tonic acc.] vowel (Ladefoged,
2001a; See Appendix B). The rationale being, that if a vowel has primary stress, the acoustic
cues should be prominent to all the other vowels in word.
65
Praat scripts were used to semi-automate delineation of vowels (Ryan, 2005) and retrieve
the relevant stress analysis data (Yoon, 2008). In total, 2125 vowels were analyzed (excluding
errors). First, the grid-maker script was run and vowel segments were defined in the series of
spectrogram using an expanded time scale by utilizing Praat’s zoom manipulation tool
(Appendix C). According to Zhang et al.’s (2008) methodology, when measuring F0, the pitch
range for female and male subjects was set to 100–500 Hz and 75–300 Hz, respectively. As Bird
and Wang (2012) prescribe, adjusting the pitch settings has the advantage of producing a “much
clearer pitch contour” (p. 61).
Once all the spectrograms had been annotated, Yoon’s stress analysis script (2008) was
run to collect the vocalic mean F0, mean intensity, and duration values. The script utilizes the
autocorrelation function of Hanning windows to calculate the mean value over the whole vowel
(Boersma & Weenink, 2013). Thus, each individual production was measured for the mean F0 of
the primary stressed vowel and the mean of the mean F0 values for all the other vowels (i.e.,
secondary stressed and unstressed). Similarly, the mean intensity of the stressed vowel and the
average of the mean intensity values of all the remaining vowels were measured. Finally, the
duration of the primary stressed vowel versus the mean duration of the other vowels were
measured. Table D1 shows a sample data log for one Chinese male speaker (Appendix D).
Then, in order to answer Research Questions 1 and 2, the corresponding primary stressed
to unstressed/secondary-stressed vowel ratios (i.e., [+tonic acc.] : [-tonic. acc] ratio) were
calculated for each token to provide vocalic relative stress values for duration, intensity, and F0.
This concurs with McClean and Tiffany (1973), Flege and Bohn (1989), and Lee and Cho’s
methodology (2011). As McClean and Tiffany stated:
66
In reporting the effects of loudness and rate on the acoustic nature of stress, the primary
concern is with the degree of contrast between stressed and unstressed syllables. Thus
data is reported [here] in simple ratios of the stressed to unstressed syllabic acoustic
magnitudes. (p. 288)
Then paired sample t-tests with a significance level of p < 0.05 were used to statistically
compare the mean F0, duration, and intensity values within each speaker group for the primary-
stressed [+tonic] vowels in each token (P) to the mean average of the values for all the other [-
tonic] vowels (All). P vs. All t-tests were conducted for each token individually and for all the
Level 1 [+cyclic] derivations combined in one group. In addition, Cohen’s d effect sizes were
calculated using the mean scores and standard deviations for each group, since paired t-test
values cannot be used for computing effect sizes (Becker, 2000). Oswald and Plonsky (2010)
recommend the following criteria for interpreting effect sizes in the field of applied linguistics: d
= .4 is small, d = .7 is medium, and d = 1.0 is large. The formula used for computing Cohen’s d
effect sizes was:
Cohen's d = M1 - M2 / spooled
where spooled =√[(s 12+ s 2
2) / 2]
rYl = d / √(d<sup>2</sup> + 4)
Note. d and rYl are positive if the mean difference is in the predicted direction (Becker,
2000, ¶2).
The purpose of these t-tests was to determine whether there was a statistically significant
difference between P and All with regards to the three acoustic cues to stress. Any significance
would signify that a stress-shift had indeed occurred and also provide insight into the nature of
SHACS (i.e., Research Questions 1 and 2).
67
In order to answer Research Question 2, 3, 4, and 5b, the researcher followed the
statistical methods employed by Zhang et al. (2008) and Lee and Cho (2011). To determine
whether there was a statistical significance in the differences between the mean ratios of stressed
to unstressed vowels for the independent variable of L1 background, the mean ratio of each
acoustic factor was submitted to one-way ANOVAs. In addition, Tukey HSD tests were
performed with a critical p value of 0.05.
At this point, it is important to note that not all of the data collected were included in the
aforementioned calculations. If a token was mispronounced by a subject, it was categorized as
either a stress placement error or a pronunciation error and entered into a separate data pool.
The latter error type may also include stress placement errors but is deemed more serious with
regards to intelligibility as it (also) includes a deletion, and/or addition, and /or substitution of a
segment or cluster of segments. Appendix E provides examples of these two different error types.
Naturally, any productions containing errors had to be excluded from the main dataset as it
would not be a fair test to compare the vocalic relative stress values in words which have been
pronounced differently. However, this data was useful to answer Research Question 5a. Pearson
Product-Moment Correlations were used to determine the strength of relations and effect sizes (r
values) (Mackey & Gass, 2005) for the operationalized variables of L2 exposure (Years of
residency in L2 environment) and L2 input (Years of L2 study). The results from these tests can
be triangulated to draw conclusions about possible relationships between native-like stress
production and L2 learner experience.
Research Question 6 asks whether any Level 1 [+cyclic] derivations behave
idiosyncratically with regards to standard pronunciations given in dictionaries. While analyzing
the spectrograms, the acoustic phonetic researcher became aware of a ubiquitous deviation from
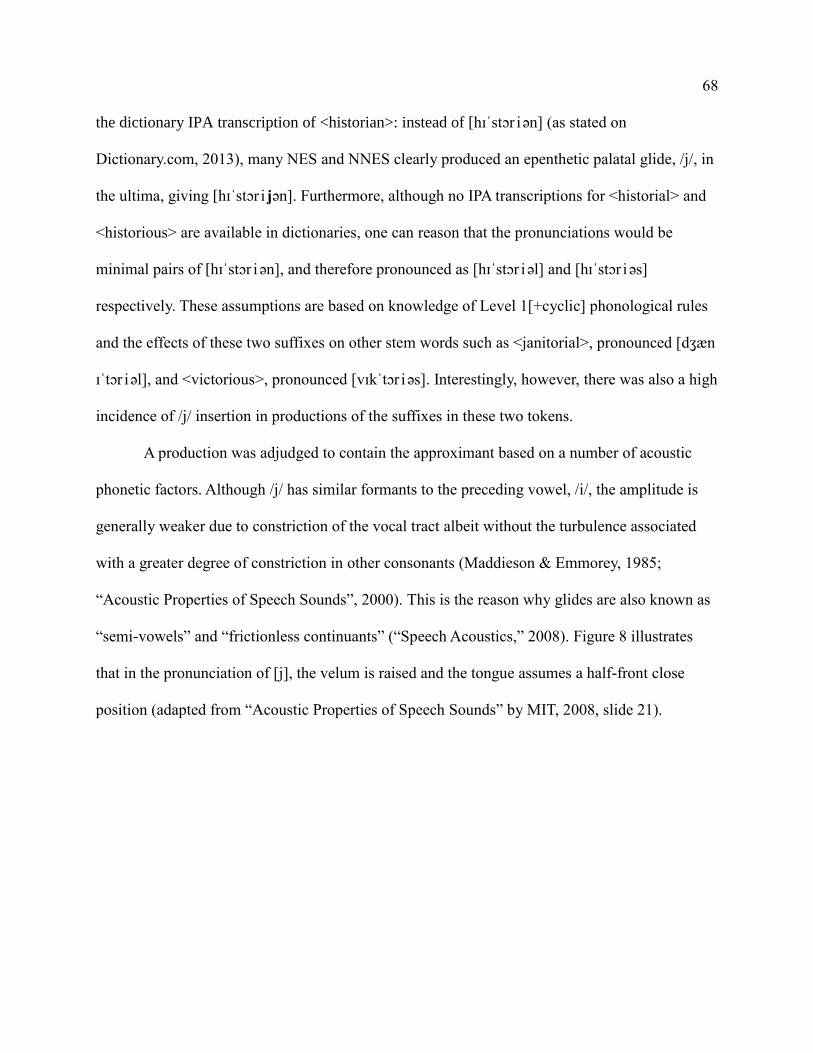
68
the dictionary IPA transcription of <historian>: instead of [hɪˈstɔr iən] (as stated on
Dictionary.com, 2013), many NES and NNES clearly produced an epenthetic palatal glide, /j/, in
the ultima, giving [hɪˈstɔr i jən]. Furthermore, although no IPA transcriptions for <historial> and
<historious> are available in dictionaries, one can reason that the pronunciations would be
minimal pairs of [hɪˈstɔr iən], and therefore pronounced as [hɪˈstɔr iəl] and [hɪˈstɔr iəs]
respectively. These assumptions are based on knowledge of Level 1[+cyclic] phonological rules
and the effects of these two suffixes on other stem words such as <janitorial>, pronounced [dʒæn
ɪˈtɔr iəl], and <victorious>, pronounced [vɪkˈtɔr iəs]. Interestingly, however, there was also a high
incidence of /j/ insertion in productions of the suffixes in these two tokens.
A production was adjudged to contain the approximant based on a number of acoustic
phonetic factors. Although /j/ has similar formants to the preceding vowel, /i/, the amplitude is
generally weaker due to constriction of the vocal tract albeit without the turbulence associated
with a greater degree of constriction in other consonants (Maddieson & Emmorey, 1985;
“Acoustic Properties of Speech Sounds”, 2000). This is the reason why glides are also known as
“semi-vowels” and “frictionless continuants” (“Speech Acoustics,” 2008). Figure 8 illustrates
that in the pronunciation of [j], the velum is raised and the tongue assumes a half-front close
position (adapted from “Acoustic Properties of Speech Sounds” by MIT, 2008, slide 21).
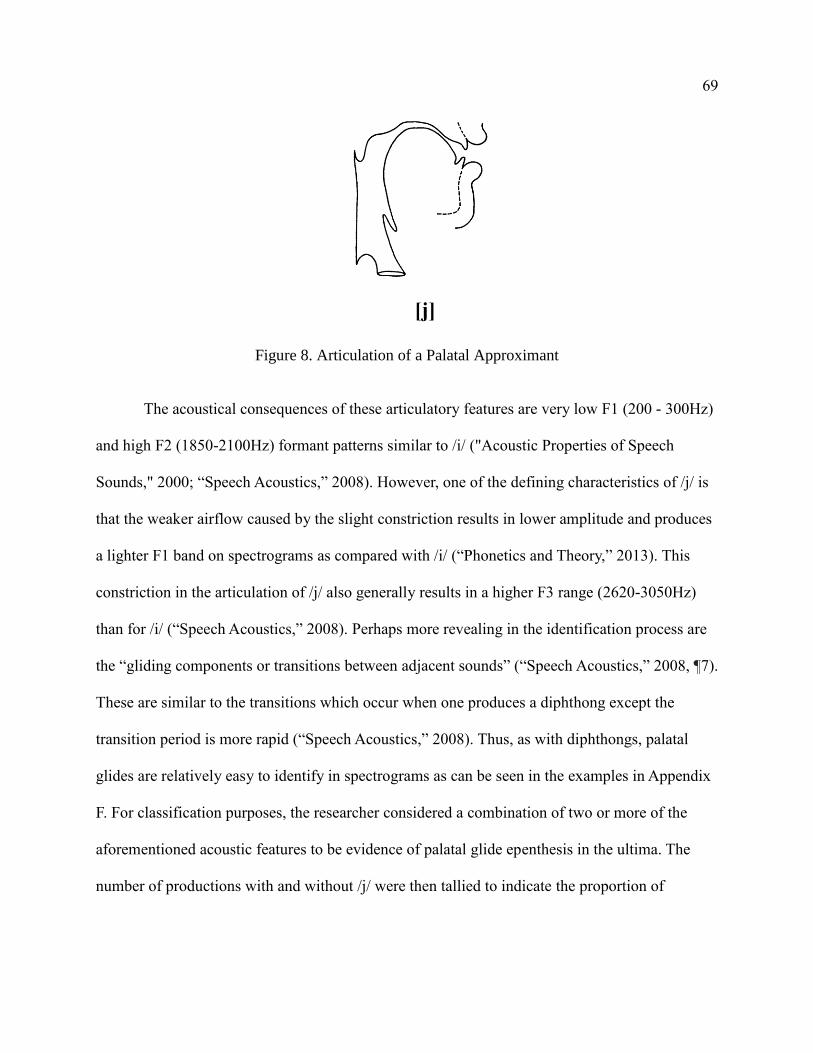
69
[j]
Figure 8. Articulation of a Palatal Approximant
The acoustical consequences of these articulatory features are very low F1 (200 - 300Hz)
and high F2 (1850-2100Hz) formant patterns similar to /i/ ("Acoustic Properties of Speech
Sounds," 2000; “Speech Acoustics,” 2008). However, one of the defining characteristics of /j/ is
that the weaker airflow caused by the slight constriction results in lower amplitude and produces
a lighter F1 band on spectrograms as compared with /i/ (“Phonetics and Theory,” 2013). This
constriction in the articulation of /j/ also generally results in a higher F3 range (2620-3050Hz)
than for /i/ (“Speech Acoustics,” 2008). Perhaps more revealing in the identification process are
the “gliding components or transitions between adjacent sounds” (“Speech Acoustics,” 2008, ¶7).
These are similar to the transitions which occur when one produces a diphthong except the
transition period is more rapid (“Speech Acoustics,” 2008). Thus, as with diphthongs, palatal
glides are relatively easy to identify in spectrograms as can be seen in the examples in Appendix
F. For classification purposes, the researcher considered a combination of two or more of the
aforementioned acoustic features to be evidence of palatal glide epenthesis in the ultima. The
number of productions with and without /j/ were then tallied to indicate the proportion of
70
productions with /j/ epenthesis in contrast to those with ‘regular,’ standard dictionary
pronunciation (without /j/) for <historian>, <historial>, and <historious>.
Finally, in order to answer Research Question 7 about the role of “tonic accent shift”
(Ladefoged & Johnson, 2010, p. 119), the values of mean F0, intensity, and duration were
gathered for both the [+tonic, +stress] primary-stressed vowel (P) and the [-tonic, +stress]
secondary-stressed vowel (S) in each token using the acoustic correlate data already retrieved
from running the aforementioned stress-analysis Praat script (Yoon, 2008). Then P was
statistically compared to S for each token within the MWAE NES group with regards to the three
acoustic correlates using post-hoc paired samples t-tests with a significance level of p < 0.05.
In the proceeding results section, the subcategorized pronunciation and stress placement
error dataset used to answer Research Question 5a shall be dealt with first.
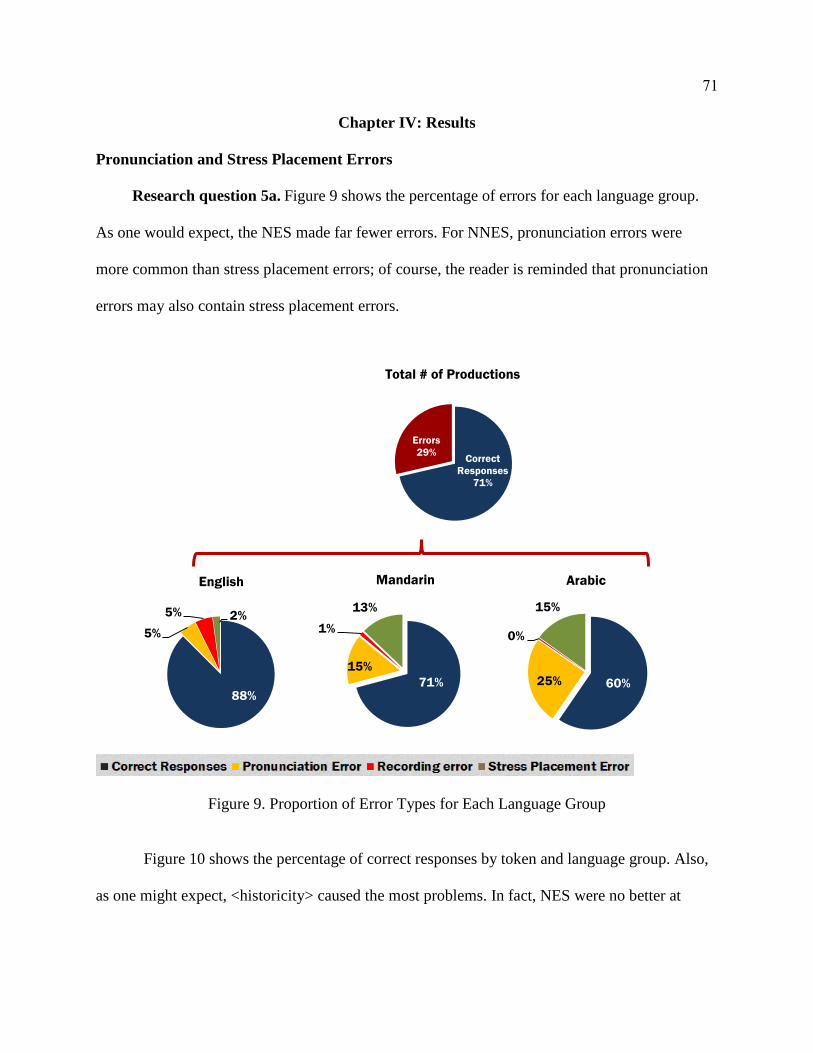
71
Chapter IV: Results
Pronunciation and Stress Placement Errors
Research question 5a. Figure 9 shows the percentage of errors for each language group.
As one would expect, the NES made far fewer errors. For NNES, pronunciation errors were
more common than stress placement errors; of course, the reader is reminded that pronunciation
errors may also contain stress placement errors.
Figure 9. Proportion of Error Types for Each Language Group
Figure 10 shows the percentage of correct responses by token and language group. Also,
as one might expect, <historicity> caused the most problems. In fact, NES were no better at
Correct
Responses
71%
Errors
29%
Total # of Productions
88%
5%
5% 2%
English
71%
15%
1%
13%
Mandarin
60%25%
0%
15%
Arabic
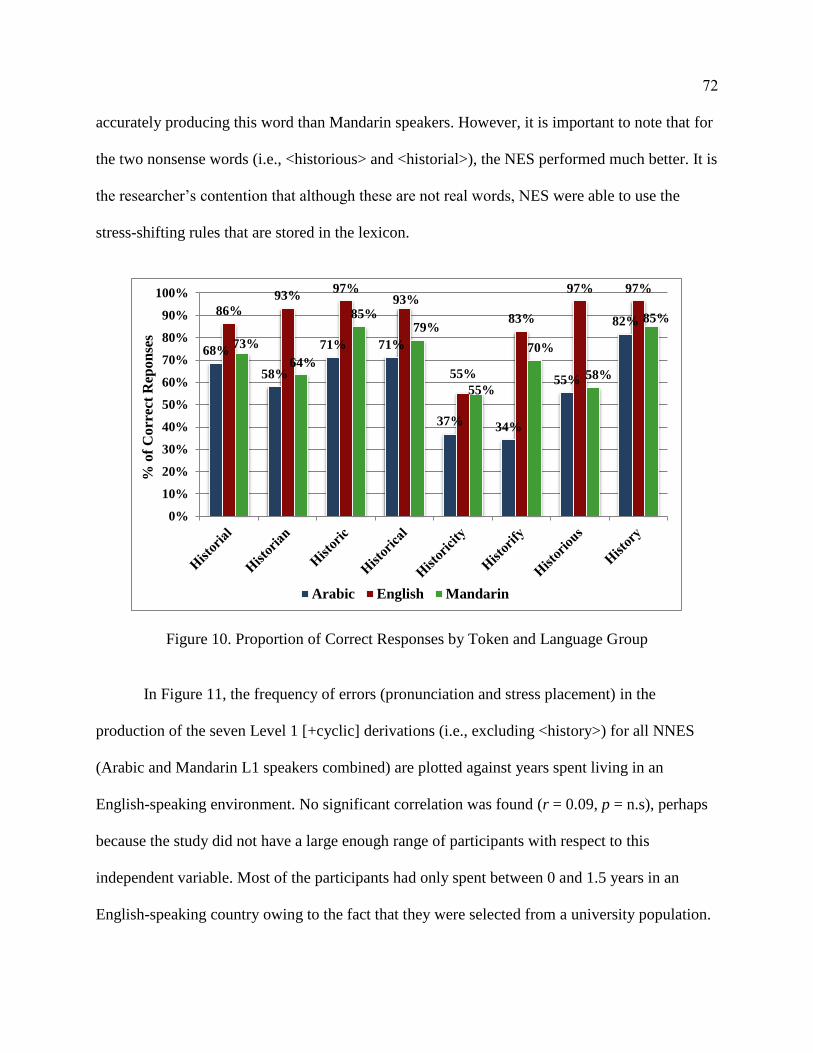
72
accurately producing this word than Mandarin speakers. However, it is important to note that for
the two nonsense words (i.e., <historious> and <historial>), the NES performed much better. It is
the researcher’s contention that although these are not real words, NES were able to use the
stress-shifting rules that are stored in the lexicon.
Figure 10. Proportion of Correct Responses by Token and Language Group
In Figure 11, the frequency of errors (pronunciation and stress placement) in the
production of the seven Level 1 [+cyclic] derivations (i.e., excluding <history>) for all NNES
(Arabic and Mandarin L1 speakers combined) are plotted against years spent living in an
English-speaking environment. No significant correlation was found (r = 0.09, p = n.s), perhaps
because the study did not have a large enough range of participants with respect to this
independent variable. Most of the participants had only spent between 0 and 1.5 years in an
English-speaking country owing to the fact that they were selected from a university population.
68%
58%
71% 71%
37% 34%
55%
82%86%
93%97%
93%
55%
83%
97% 97%
73%
64%
85%79%
55%
70%
58%
85%
0%
10%
20%
30%
40%
50%
60%
70%
80%
90%
100%
% o
f C
orr
ect
Rep
on
ses
Arabic English Mandarin
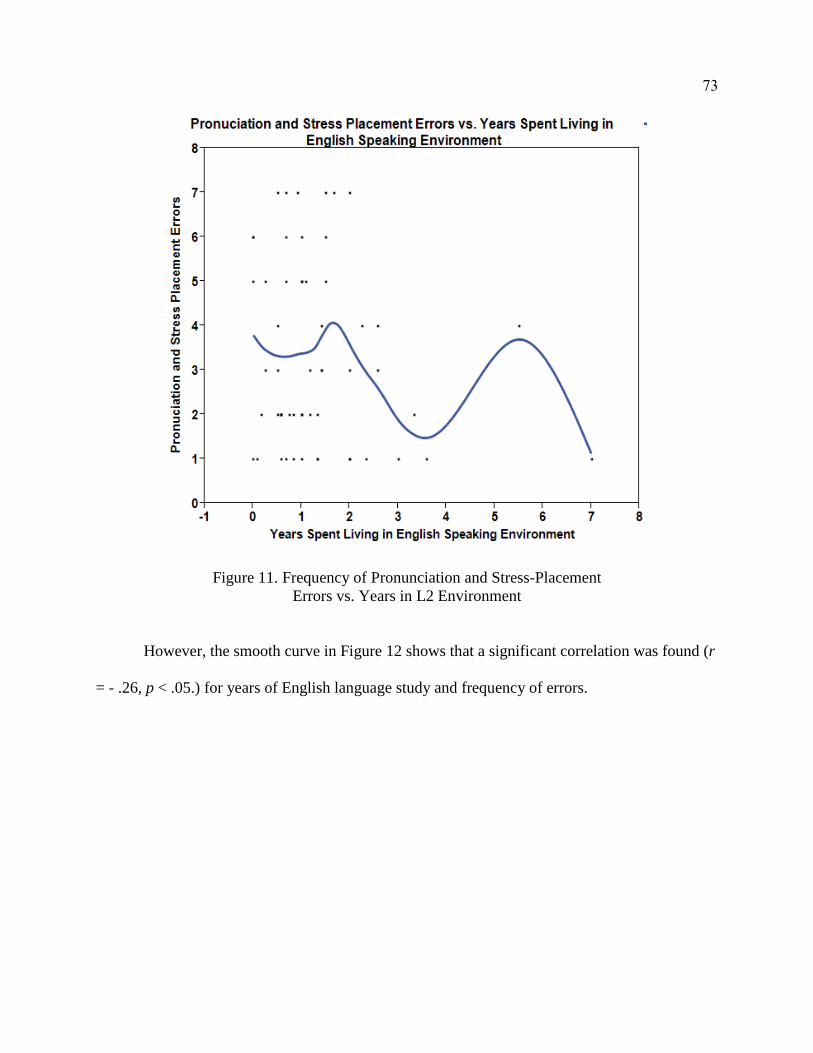
73
Figure 11. Frequency of Pronunciation and Stress-Placement
Errors vs. Years in L2 Environment
However, the smooth curve in Figure 12 shows that a significant correlation was found (r
= - .26, p < .05.) for years of English language study and frequency of errors.
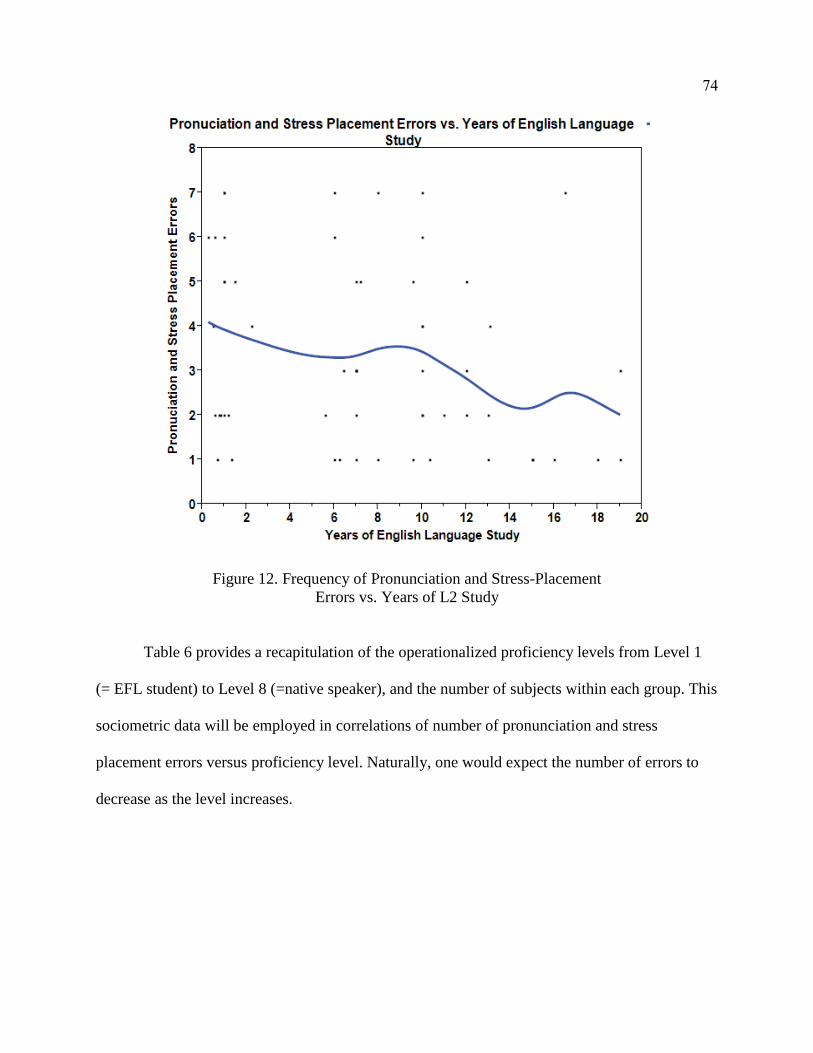
74
Figure 12. Frequency of Pronunciation and Stress-Placement
Errors vs. Years of L2 Study
Table 6 provides a recapitulation of the operationalized proficiency levels from Level 1
(= EFL student) to Level 8 (=native speaker), and the number of subjects within each group. This
sociometric data will be employed in correlations of number of pronunciation and stress
placement errors versus proficiency level. Naturally, one would expect the number of errors to
decrease as the level increases.
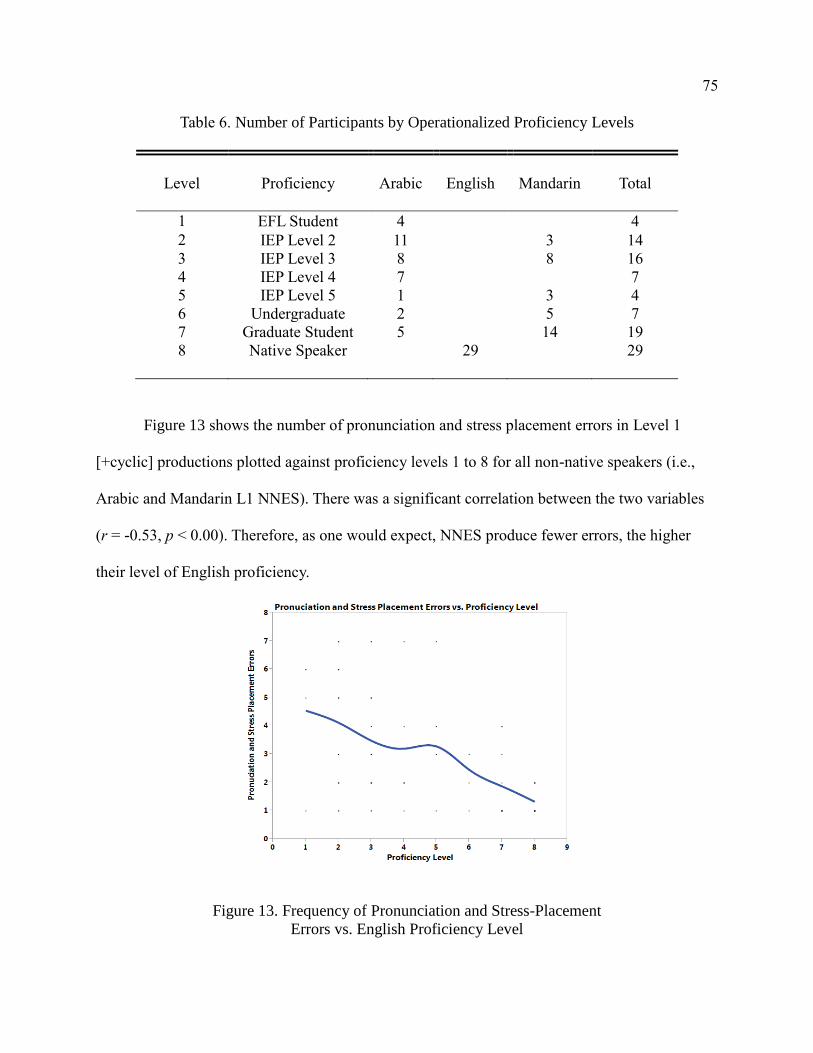
75
Table 6. Number of Participants by Operationalized Proficiency Levels
Level
Proficiency
Arabic
English
Mandarin
Total
1 EFL Student 4 4
2 IEP Level 2 11 3 14
3 IEP Level 3 8 8 16
4 IEP Level 4 7 7
5 IEP Level 5 1 3 4
6 Undergraduate 2 5 7
7 Graduate Student 5 14 19
8 Native Speaker 29 29
Figure 13 shows the number of pronunciation and stress placement errors in Level 1
[+cyclic] productions plotted against proficiency levels 1 to 8 for all non-native speakers (i.e.,
Arabic and Mandarin L1 NNES). There was a significant correlation between the two variables
(r = -0.53, p < 0.00). Therefore, as one would expect, NNES produce fewer errors, the higher
their level of English proficiency.
Figure 13. Frequency of Pronunciation and Stress-Placement
Errors vs. English Proficiency Level
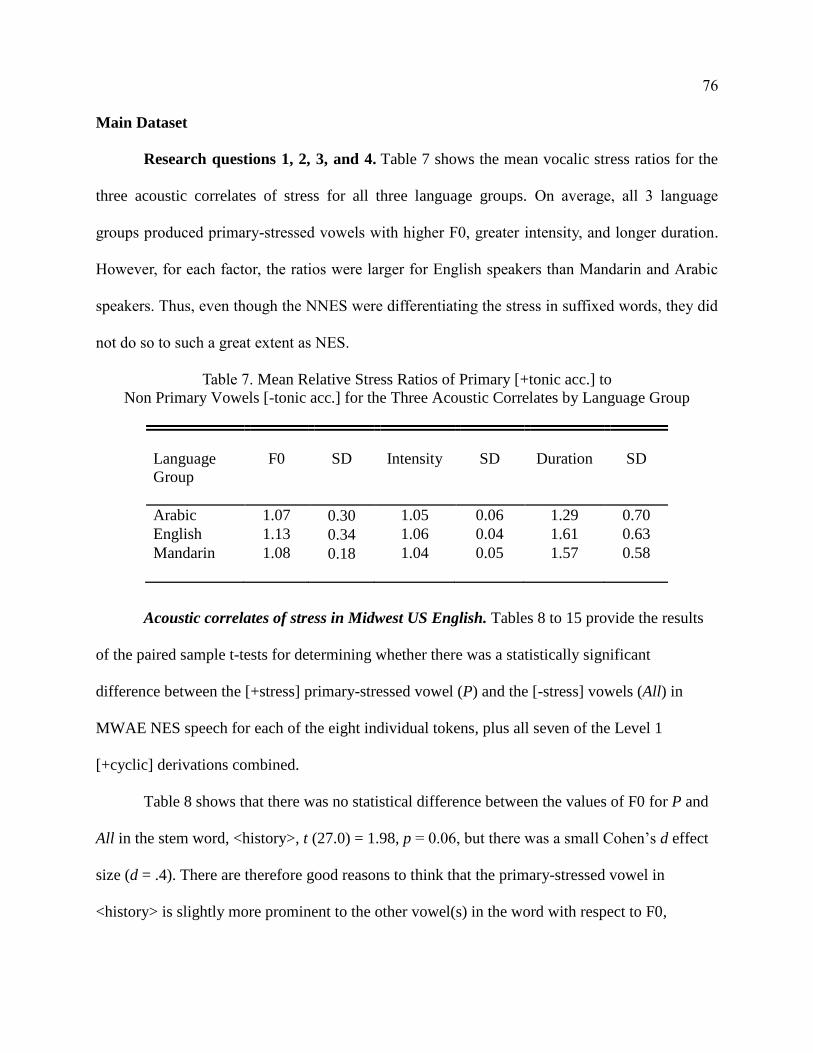
76
Main Dataset
Research questions 1, 2, 3, and 4. Table 7 shows the mean vocalic stress ratios for the
three acoustic correlates of stress for all three language groups. On average, all 3 language
groups produced primary-stressed vowels with higher F0, greater intensity, and longer duration.
However, for each factor, the ratios were larger for English speakers than Mandarin and Arabic
speakers. Thus, even though the NNES were differentiating the stress in suffixed words, they did
not do so to such a great extent as NES.
Table 7. Mean Relative Stress Ratios of Primary [+tonic acc.] to
Non Primary Vowels [-tonic acc.] for the Three Acoustic Correlates by Language Group
Acoustic correlates of stress in Midwest US English. Tables 8 to 15 provide the results
of the paired sample t-tests for determining whether there was a statistically significant
difference between the [+stress] primary-stressed vowel (P) and the [-stress] vowels (All) in
MWAE NES speech for each of the eight individual tokens, plus all seven of the Level 1
[+cyclic] derivations combined.
Table 8 shows that there was no statistical difference between the values of F0 for P and
All in the stem word, <history>, t (27.0) = 1.98, p = 0.06, but there was a small Cohen’s d effect
size (d = .4). There are therefore good reasons to think that the primary-stressed vowel in
<history> is slightly more prominent to the other vowel(s) in the word with respect to F0,
Language
Group
F0
SD
Intensity
SD
Duration
SD
Arabic 1.07 0.30 1.05 0.06 1.29 0.70
English 1.13 0.34 1.06 0.04 1.61 0.63
Mandarin 1.08 0.18 1.04 0.05 1.57 0.58
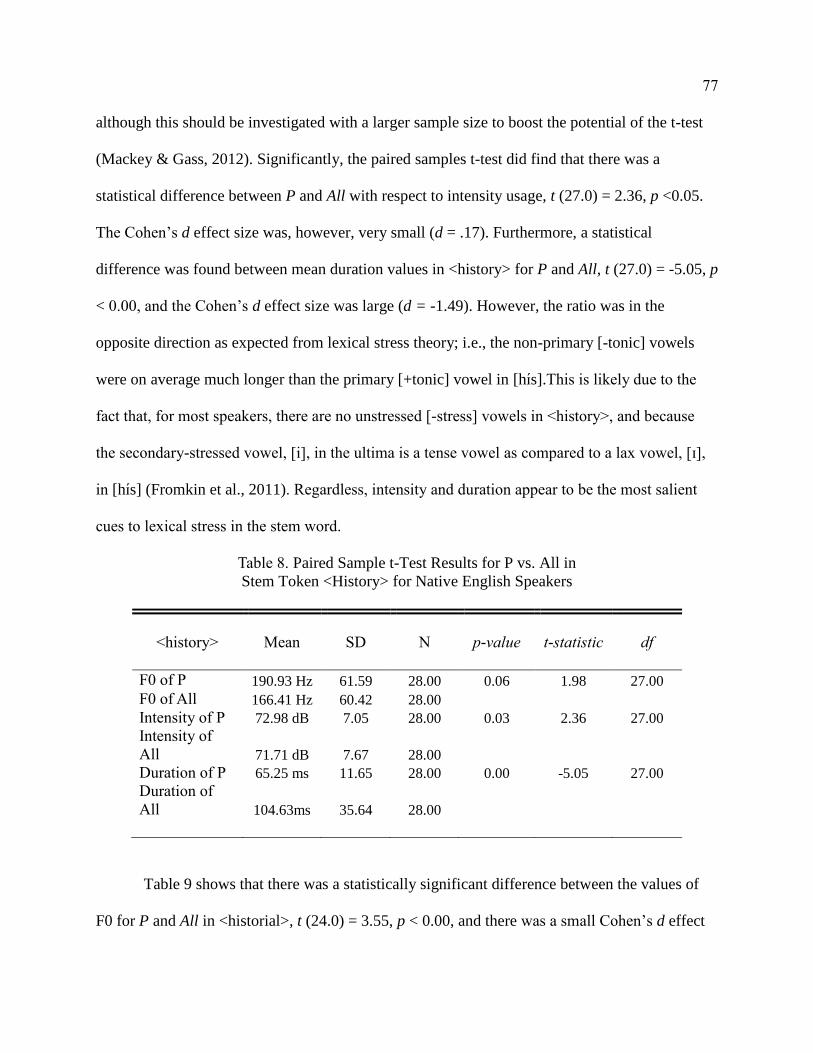
77
although this should be investigated with a larger sample size to boost the potential of the t-test
(Mackey & Gass, 2012). Significantly, the paired samples t-test did find that there was a
statistical difference between P and All with respect to intensity usage, t (27.0) = 2.36, p <0.05.
The Cohen’s d effect size was, however, very small (d = .17). Furthermore, a statistical
difference was found between mean duration values in <history> for P and All, t (27.0) = -5.05, p
< 0.00, and the Cohen’s d effect size was large (d = -1.49). However, the ratio was in the
opposite direction as expected from lexical stress theory; i.e., the non-primary [-tonic] vowels
were on average much longer than the primary [+tonic] vowel in [hɪs].This is likely due to the
fact that, for most speakers, there are no unstressed [-stress] vowels in <history>, and because
the secondary-stressed vowel, [i], in the ultima is a tense vowel as compared to a lax vowel, [ɪ],
in [hɪs] (Fromkin et al., 2011). Regardless, intensity and duration appear to be the most salient
cues to lexical stress in the stem word.
Table 8. Paired Sample t-Test Results for P vs. All in
Stem Token <History> for Native English Speakers
<history>
Mean
SD
N
p-value
t-statistic
df
F0 of P 190.93 Hz 61.59 28.00 0.06 1.98 27.00
F0 of All 166.41 Hz 60.42 28.00
Intensity of P 72.98 dB 7.05 28.00 0.03 2.36 27.00
Intensity of
All 71.71 dB 7.67 28.00
Duration of P 65.25 ms 11.65 28.00 0.00 -5.05 27.00
Duration of
All 104.63ms 35.64 28.00
Table 9 shows that there was a statistically significant difference between the values of
F0 for P and All in <historial>, t (24.0) = 3.55, p < 0.00, and there was a small Cohen’s d effect
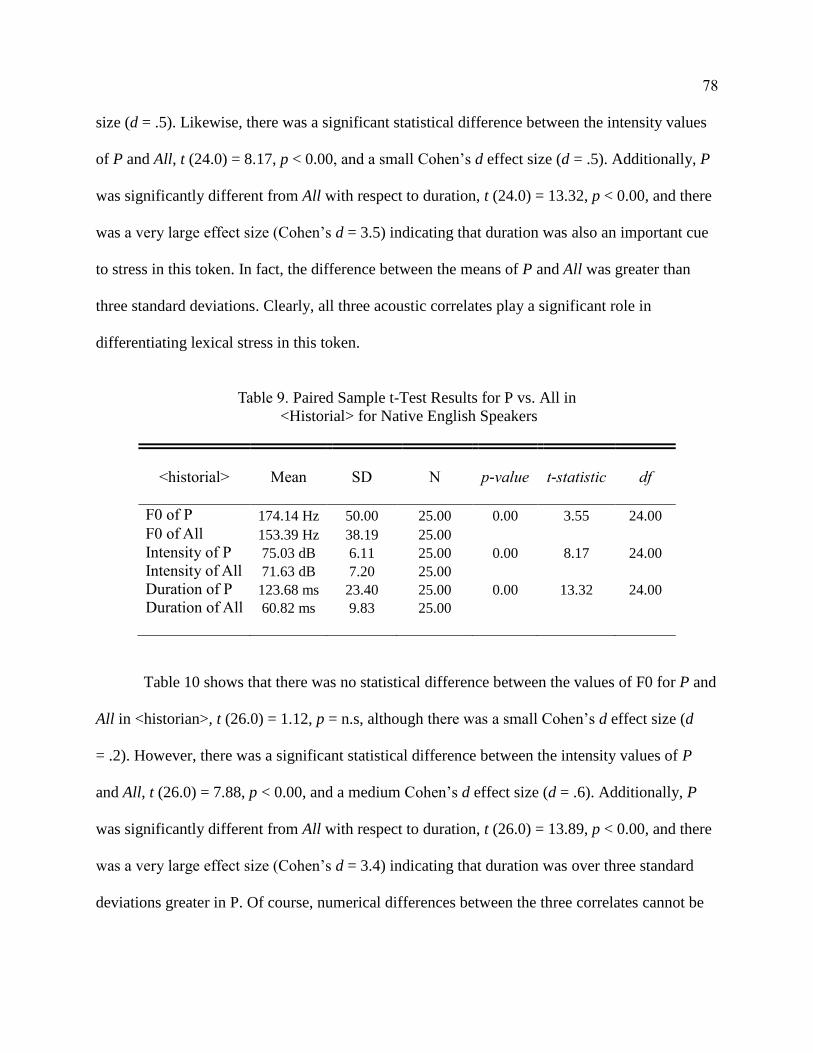
78
size (d = .5). Likewise, there was a significant statistical difference between the intensity values
of P and All, t (24.0) = 8.17, p < 0.00, and a small Cohen’s d effect size (d = .5). Additionally, P
was significantly different from All with respect to duration, t (24.0) = 13.32, p < 0.00, and there
was a very large effect size (Cohen’s d = 3.5) indicating that duration was also an important cue
to stress in this token. In fact, the difference between the means of P and All was greater than
three standard deviations. Clearly, all three acoustic correlates play a significant role in
differentiating lexical stress in this token.
Table 9. Paired Sample t-Test Results for P vs. All in
<Historial> for Native English Speakers
<historial>
Mean
SD
N
p-value
t-statistic
df
F0 of P 174.14 Hz 50.00 25.00 0.00 3.55 24.00
F0 of All 153.39 Hz 38.19 25.00
Intensity of P 75.03 dB 6.11 25.00 0.00 8.17 24.00
Intensity of All 71.63 dB 7.20 25.00
Duration of P 123.68 ms 23.40 25.00 0.00 13.32 24.00
Duration of All 60.82 ms 9.83 25.00
Table 10 shows that there was no statistical difference between the values of F0 for P and
All in <historian>, t (26.0) = 1.12, p = n.s, although there was a small Cohen’s d effect size (d
= .2). However, there was a significant statistical difference between the intensity values of P
and All, t (26.0) = 7.88, p < 0.00, and a medium Cohen’s d effect size (d = .6). Additionally, P
was significantly different from All with respect to duration, t (26.0) = 13.89, p < 0.00, and there
was a very large effect size (Cohen’s d = 3.4) indicating that duration was over three standard
deviations greater in P. Of course, numerical differences between the three correlates cannot be
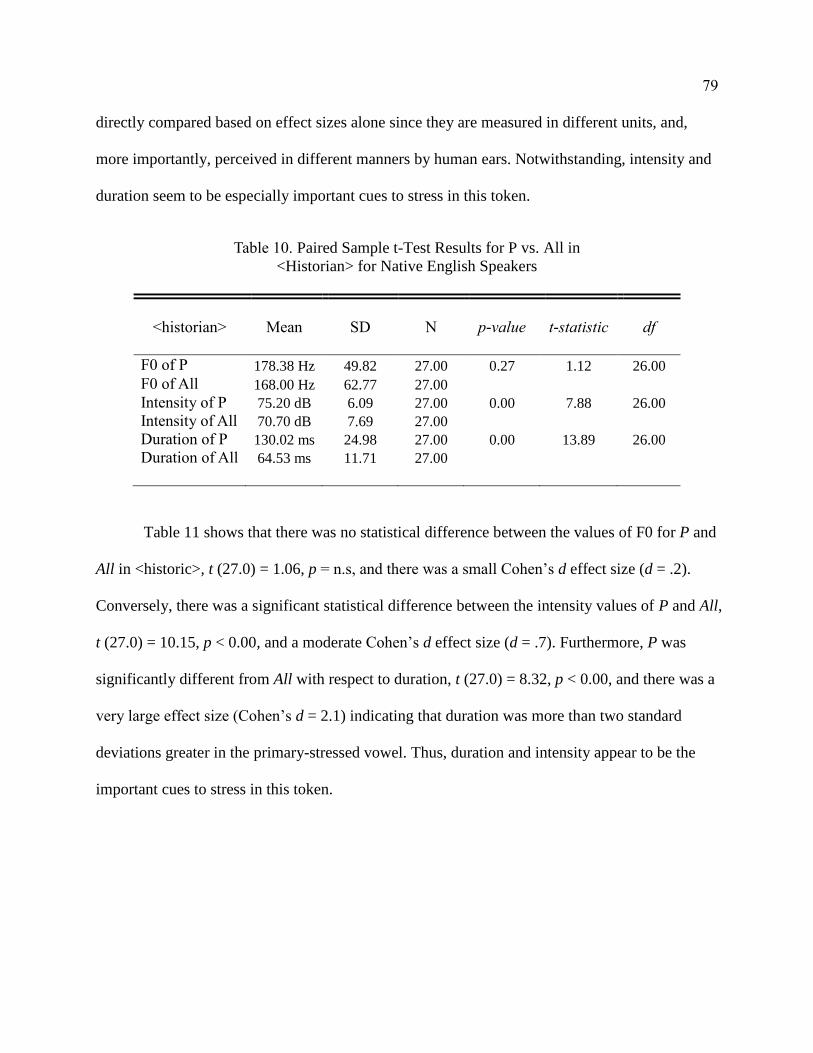
79
directly compared based on effect sizes alone since they are measured in different units, and,
more importantly, perceived in different manners by human ears. Notwithstanding, intensity and
duration seem to be especially important cues to stress in this token.
Table 10. Paired Sample t-Test Results for P vs. All in
<Historian> for Native English Speakers
<historian>
Mean
SD
N
p-value
t-statistic
df
F0 of P 178.38 Hz 49.82 27.00 0.27 1.12 26.00
F0 of All 168.00 Hz 62.77 27.00
Intensity of P 75.20 dB 6.09 27.00 0.00 7.88 26.00
Intensity of All 70.70 dB 7.69 27.00
Duration of P 130.02 ms 24.98 27.00 0.00 13.89 26.00
Duration of All 64.53 ms 11.71 27.00
Table 11 shows that there was no statistical difference between the values of F0 for P and
All in <historic>, t (27.0) = 1.06, p = n.s, and there was a small Cohen’s d effect size (d = .2).
Conversely, there was a significant statistical difference between the intensity values of P and All,
t (27.0) = 10.15, p < 0.00, and a moderate Cohen’s d effect size (d = .7). Furthermore, P was
significantly different from All with respect to duration, t (27.0) = 8.32, p < 0.00, and there was a
very large effect size (Cohen’s d = 2.1) indicating that duration was more than two standard
deviations greater in the primary-stressed vowel. Thus, duration and intensity appear to be the
important cues to stress in this token.
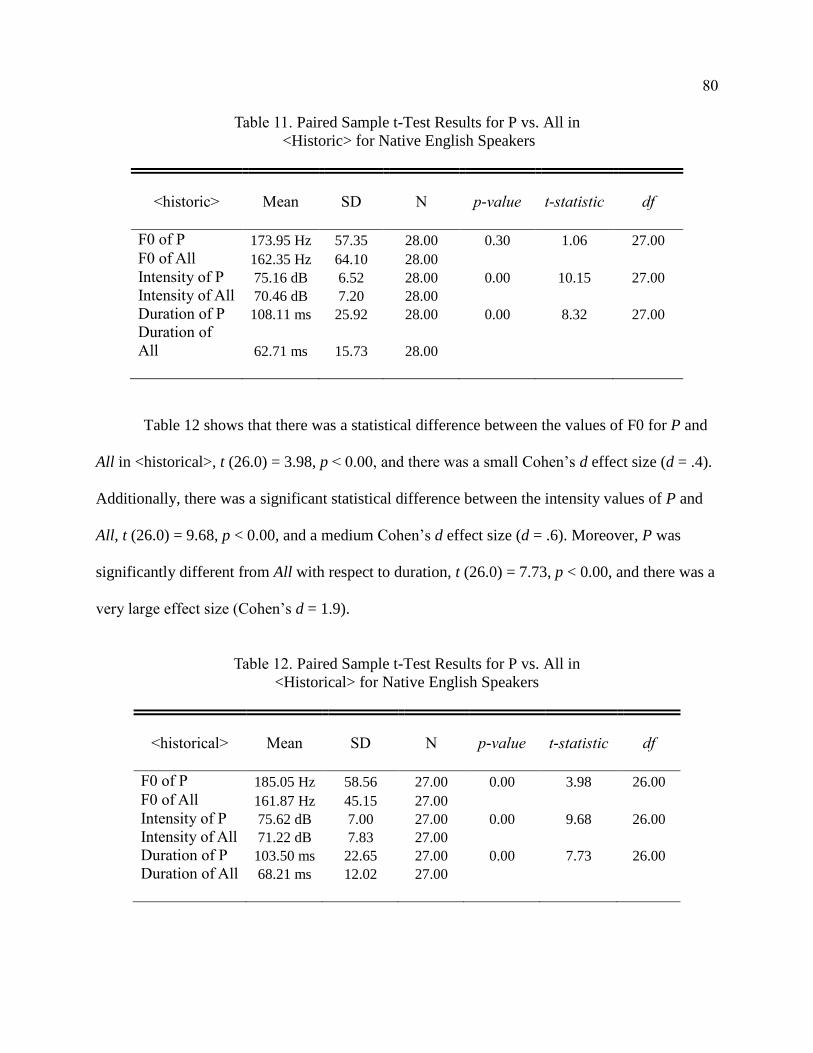
80
Table 11. Paired Sample t-Test Results for P vs. All in
<Historic> for Native English Speakers
<historic>
Mean
SD
N
p-value
t-statistic
df
F0 of P 173.95 Hz 57.35 28.00 0.30 1.06 27.00
F0 of All 162.35 Hz 64.10 28.00
Intensity of P 75.16 dB 6.52 28.00 0.00 10.15 27.00
Intensity of All 70.46 dB 7.20 28.00
Duration of P 108.11 ms 25.92 28.00 0.00 8.32 27.00
Duration of
All 62.71 ms 15.73 28.00
Table 12 shows that there was a statistical difference between the values of F0 for P and
All in <historical>, t (26.0) = 3.98, p < 0.00, and there was a small Cohen’s d effect size (d = .4).
Additionally, there was a significant statistical difference between the intensity values of P and
All, t (26.0) = 9.68, p < 0.00, and a medium Cohen’s d effect size (d = .6). Moreover, P was
significantly different from All with respect to duration, t (26.0) = 7.73, p < 0.00, and there was a
very large effect size (Cohen’s d = 1.9).
Table 12. Paired Sample t-Test Results for P vs. All in
<Historical> for Native English Speakers
<historical>
Mean
SD
N
p-value
t-statistic
df
F0 of P 185.05 Hz 58.56 27.00 0.00 3.98 26.00
F0 of All 161.87 Hz 45.15 27.00
Intensity of P 75.62 dB 7.00 27.00 0.00 9.68 26.00
Intensity of All 71.22 dB 7.83 27.00
Duration of P 103.50 ms 22.65 27.00 0.00 7.73 26.00
Duration of All 68.21 ms 12.02 27.00
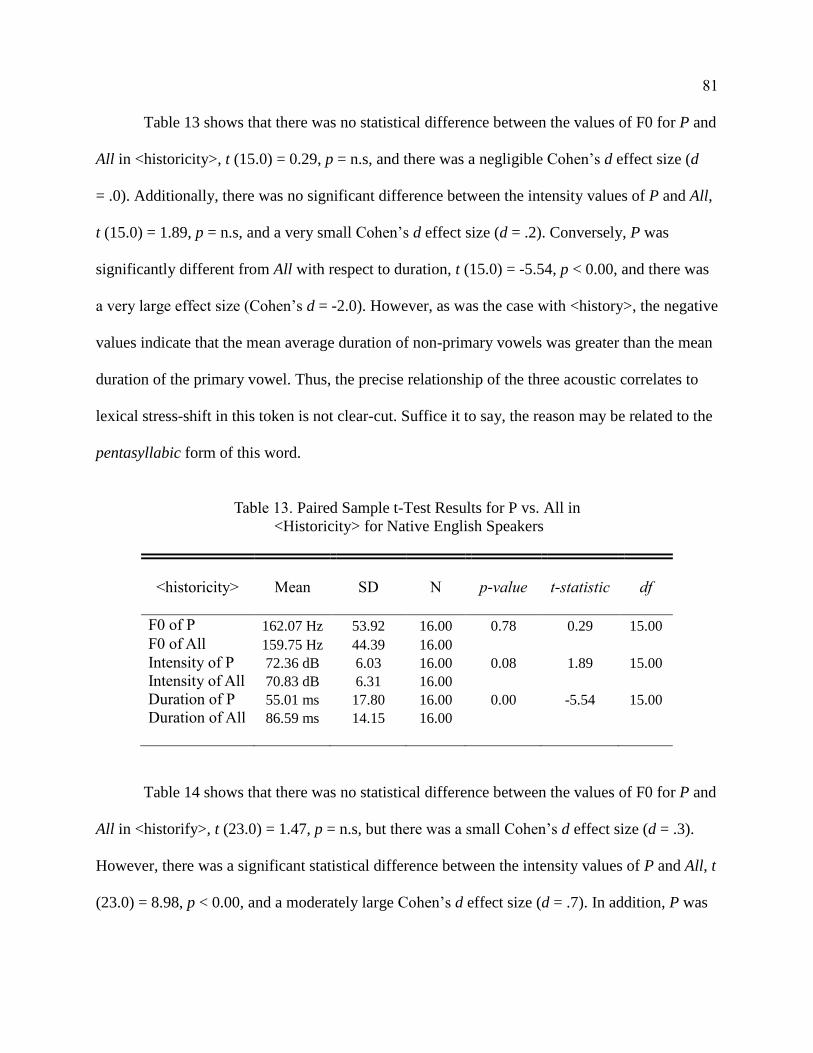
81
Table 13 shows that there was no statistical difference between the values of F0 for P and
All in <historicity>, t (15.0) = 0.29, p = n.s, and there was a negligible Cohen’s d effect size (d
= .0). Additionally, there was no significant difference between the intensity values of P and All,
t (15.0) = 1.89, p = n.s, and a very small Cohen’s d effect size (d = .2). Conversely, P was
significantly different from All with respect to duration, t (15.0) = -5.54, p < 0.00, and there was
a very large effect size (Cohen’s d = -2.0). However, as was the case with <history>, the negative
values indicate that the mean average duration of non-primary vowels was greater than the mean
duration of the primary vowel. Thus, the precise relationship of the three acoustic correlates to
lexical stress-shift in this token is not clear-cut. Suffice it to say, the reason may be related to the
pentasyllabic form of this word.
Table 13. Paired Sample t-Test Results for P vs. All in
<Historicity> for Native English Speakers
<historicity>
Mean
SD
N
p-value
t-statistic
df
F0 of P 162.07 Hz 53.92 16.00 0.78 0.29 15.00
F0 of All 159.75 Hz 44.39 16.00
Intensity of P 72.36 dB 6.03 16.00 0.08 1.89 15.00
Intensity of All 70.83 dB 6.31 16.00
Duration of P 55.01 ms 17.80 16.00 0.00 -5.54 15.00
Duration of All 86.59 ms 14.15 16.00
Table 14 shows that there was no statistical difference between the values of F0 for P and
All in <historify>, t (23.0) = 1.47, p = n.s, but there was a small Cohen’s d effect size (d = .3).
However, there was a significant statistical difference between the intensity values of P and All, t
(23.0) = 8.98, p < 0.00, and a moderately large Cohen’s d effect size (d = .7). In addition, P was
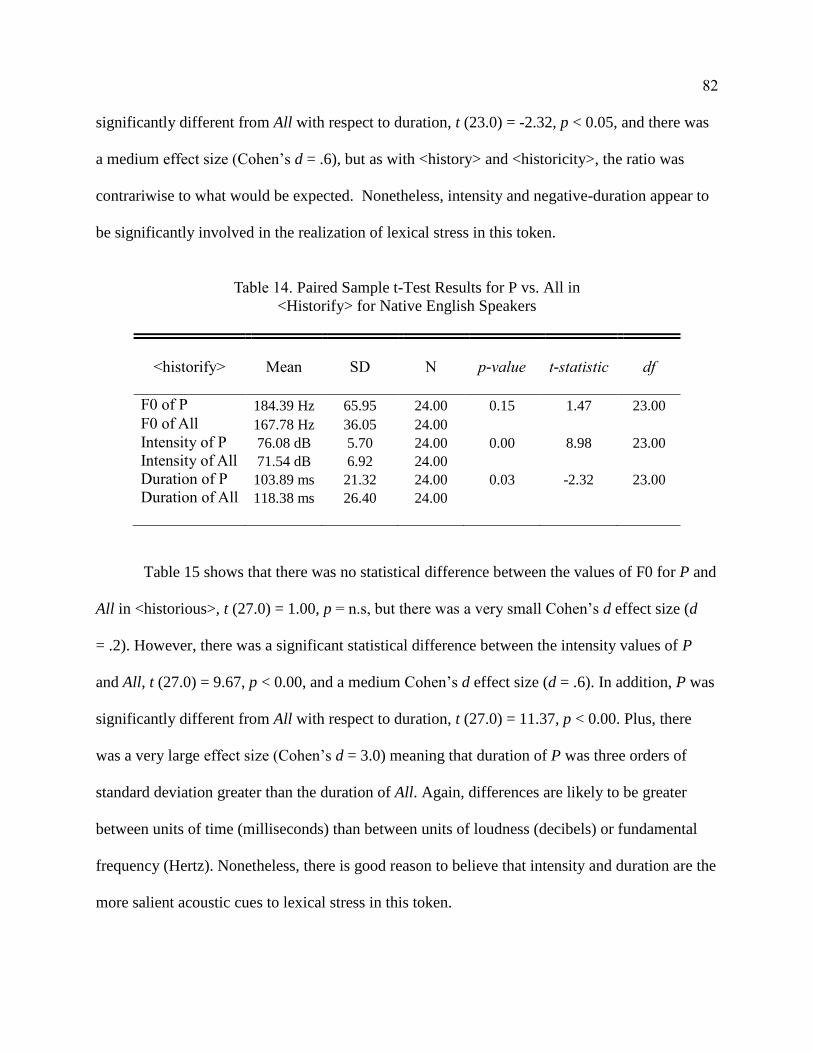
82
significantly different from All with respect to duration, t (23.0) = -2.32, p < 0.05, and there was
a medium effect size (Cohen’s d = .6), but as with <history> and <historicity>, the ratio was
contrariwise to what would be expected. Nonetheless, intensity and negative-duration appear to
be significantly involved in the realization of lexical stress in this token.
Table 14. Paired Sample t-Test Results for P vs. All in
<Historify> for Native English Speakers
<historify>
Mean
SD
N
p-value
t-statistic
df
F0 of P 184.39 Hz 65.95 24.00 0.15 1.47 23.00
F0 of All 167.78 Hz 36.05 24.00
Intensity of P 76.08 dB 5.70 24.00 0.00 8.98 23.00
Intensity of All 71.54 dB 6.92 24.00
Duration of P 103.89 ms 21.32 24.00 0.03 -2.32 23.00
Duration of All 118.38 ms 26.40 24.00
Table 15 shows that there was no statistical difference between the values of F0 for P and
All in <historious>, t (27.0) = 1.00, p = n.s, but there was a very small Cohen’s d effect size (d
= .2). However, there was a significant statistical difference between the intensity values of P
and All, t (27.0) = 9.67, p < 0.00, and a medium Cohen’s d effect size (d = .6). In addition, P was
significantly different from All with respect to duration, t (27.0) = 11.37, p < 0.00. Plus, there
was a very large effect size (Cohen’s d = 3.0) meaning that duration of P was three orders of
standard deviation greater than the duration of All. Again, differences are likely to be greater
between units of time (milliseconds) than between units of loudness (decibels) or fundamental
frequency (Hertz). Nonetheless, there is good reason to believe that intensity and duration are the
more salient acoustic cues to lexical stress in this token.
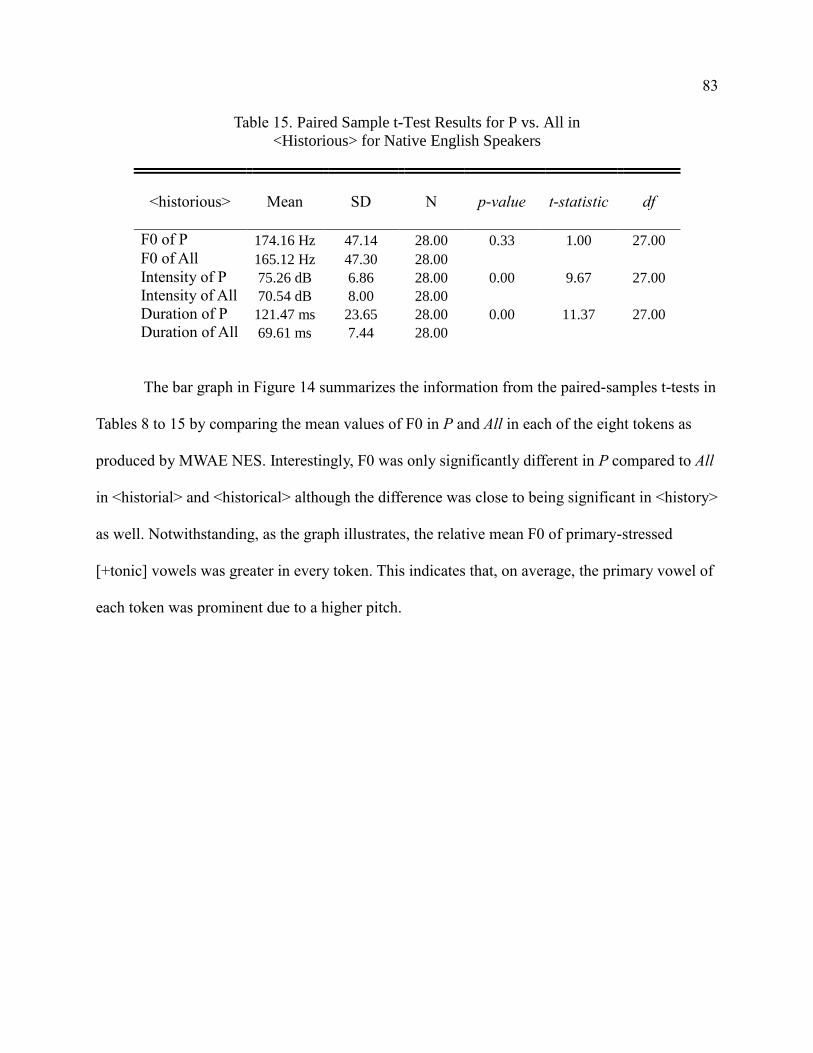
83
Table 15. Paired Sample t-Test Results for P vs. All in
<Historious> for Native English Speakers
<historious>
Mean
SD
N
p-value
t-statistic
df
F0 of P 174.16 Hz 47.14 28.00 0.33 1.00 27.00
F0 of All 165.12 Hz 47.30 28.00
Intensity of P 75.26 dB 6.86 28.00 0.00 9.67 27.00
Intensity of All 70.54 dB 8.00 28.00
Duration of P 121.47 ms 23.65 28.00 0.00 11.37 27.00
Duration of All 69.61 ms 7.44 28.00
The bar graph in Figure 14 summarizes the information from the paired-samples t-tests in
Tables 8 to 15 by comparing the mean values of F0 in P and All in each of the eight tokens as
produced by MWAE NES. Interestingly, F0 was only significantly different in P compared to All
in <historial> and <historical> although the difference was close to being significant in <history>
as well. Notwithstanding, as the graph illustrates, the relative mean F0 of primary-stressed
[+tonic] vowels was greater in every token. This indicates that, on average, the primary vowel of
each token was prominent due to a higher pitch.
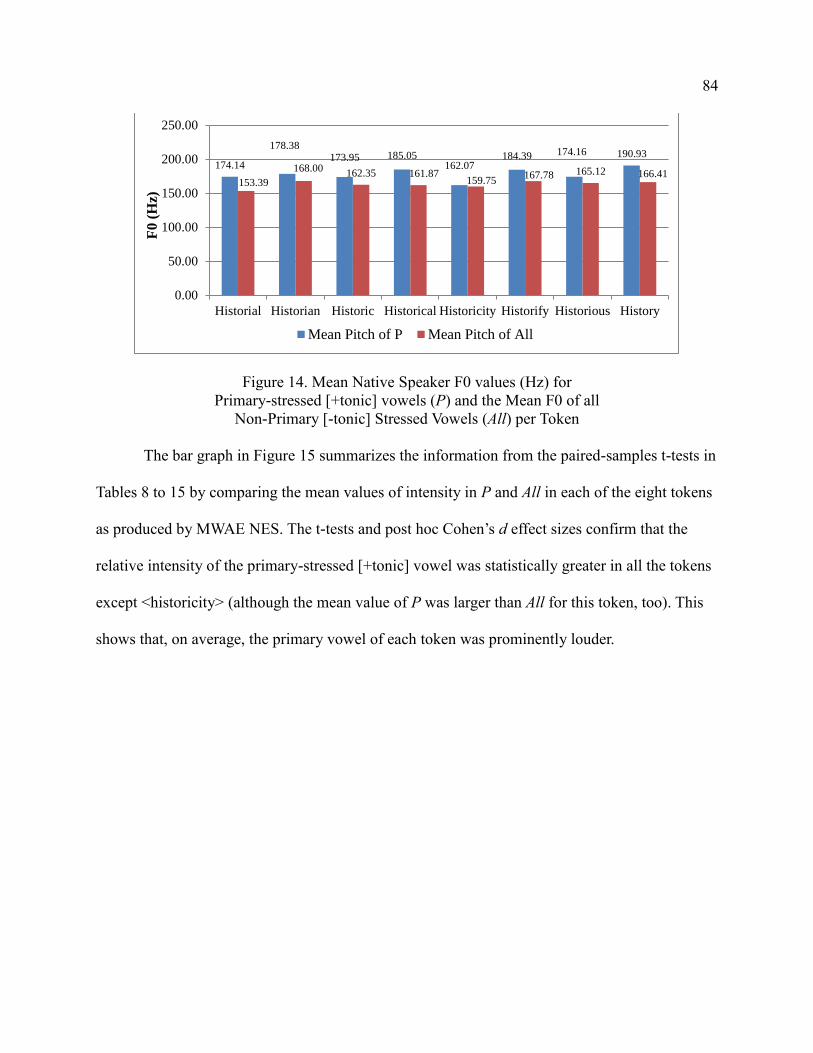
84
Figure 14. Mean Native Speaker F0 values (Hz) for
Primary-stressed [+tonic] vowels (P) and the Mean F0 of all
Non-Primary [-tonic] Stressed Vowels (All) per Token
The bar graph in Figure 15 summarizes the information from the paired-samples t-tests in
Tables 8 to 15 by comparing the mean values of intensity in P and All in each of the eight tokens
as produced by MWAE NES. The t-tests and post hoc Cohen’s d effect sizes confirm that the
relative intensity of the primary-stressed [+tonic] vowel was statistically greater in all the tokens
except <historicity> (although the mean value of P was larger than All for this token, too). This
shows that, on average, the primary vowel of each token was prominently louder.
174.14
178.38173.95 185.05
162.07184.39 174.16 190.93
153.39
168.00162.35 161.87
159.75167.78 165.12 166.41
0.00
50.00
100.00
150.00
200.00
250.00
Historial Historian Historic Historical Historicity Historify Historious History
F0
(H
z)
Mean Pitch of P Mean Pitch of All
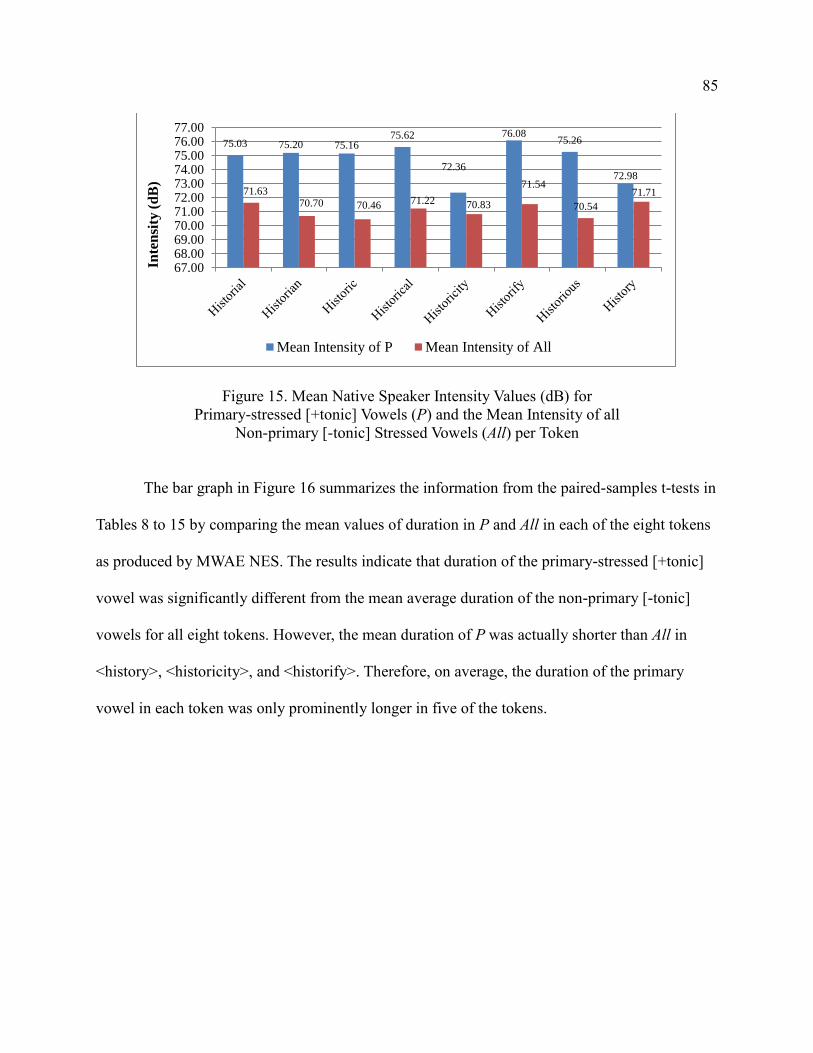
85
Figure 15. Mean Native Speaker Intensity Values (dB) for
Primary-stressed [+tonic] Vowels (P) and the Mean Intensity of all
Non-primary [-tonic] Stressed Vowels (All) per Token
The bar graph in Figure 16 summarizes the information from the paired-samples t-tests in
Tables 8 to 15 by comparing the mean values of duration in P and All in each of the eight tokens
as produced by MWAE NES. The results indicate that duration of the primary-stressed [+tonic]
vowel was significantly different from the mean average duration of the non-primary [-tonic]
vowels for all eight tokens. However, the mean duration of P was actually shorter than All in
<history>, <historicity>, and <historify>. Therefore, on average, the duration of the primary
vowel in each token was only prominently longer in five of the tokens.
75.03 75.20 75.1675.62
72.36
76.0875.26
72.98
71.6370.70 70.46 71.22 70.83
71.54
70.54
71.71
67.0068.0069.0070.0071.0072.0073.0074.0075.0076.0077.00
Inte
nsi
ty (
dB
)
Mean Intensity of P Mean Intensity of All
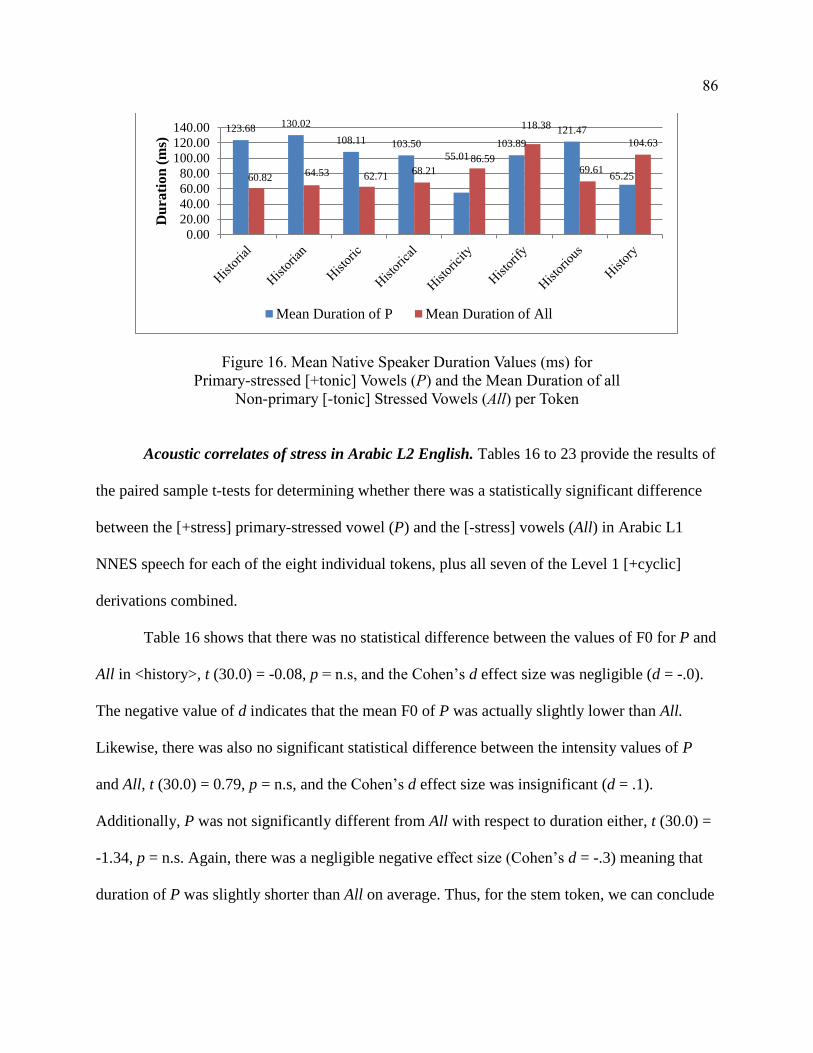
86
Figure 16. Mean Native Speaker Duration Values (ms) for
Primary-stressed [+tonic] Vowels (P) and the Mean Duration of all
Non-primary [-tonic] Stressed Vowels (All) per Token
Acoustic correlates of stress in Arabic L2 English. Tables 16 to 23 provide the results of
the paired sample t-tests for determining whether there was a statistically significant difference
between the [+stress] primary-stressed vowel (P) and the [-stress] vowels (All) in Arabic L1
NNES speech for each of the eight individual tokens, plus all seven of the Level 1 [+cyclic]
derivations combined.
Table 16 shows that there was no statistical difference between the values of F0 for P and
All in <history>, t (30.0) = -0.08, p = n.s, and the Cohen’s d effect size was negligible (d = -.0).
The negative value of d indicates that the mean F0 of P was actually slightly lower than All.
Likewise, there was also no significant statistical difference between the intensity values of P
and All, t (30.0) = 0.79, p = n.s, and the Cohen’s d effect size was insignificant (d = .1).
Additionally, P was not significantly different from All with respect to duration either, t (30.0) =
-1.34, p = n.s. Again, there was a negligible negative effect size (Cohen’s d = -.3) meaning that
duration of P was slightly shorter than All on average. Thus, for the stem token, we can conclude
123.68 130.02
108.11 103.50
55.01
103.89
121.47
65.2560.8264.53 62.71
68.2186.59
118.38
69.61
104.63
0.00
20.00
40.00
60.00
80.00
100.00
120.00
140.00
Du
rati
on
(m
s)
Mean Duration of P Mean Duration of All
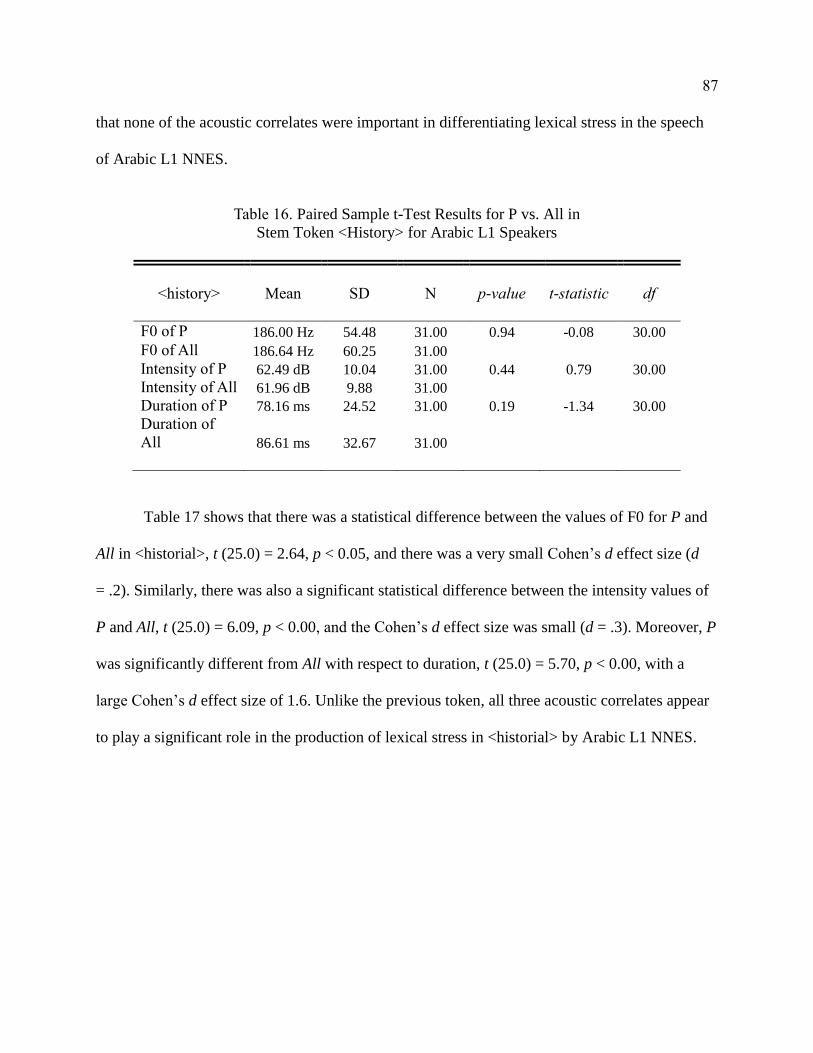
87
that none of the acoustic correlates were important in differentiating lexical stress in the speech
of Arabic L1 NNES.
Table 16. Paired Sample t-Test Results for P vs. All in
Stem Token <History> for Arabic L1 Speakers
<history>
Mean
SD
N
p-value
t-statistic
df
F0 of P 186.00 Hz 54.48 31.00 0.94 -0.08 30.00
F0 of All 186.64 Hz 60.25 31.00
Intensity of P 62.49 dB 10.04 31.00 0.44 0.79 30.00
Intensity of All 61.96 dB 9.88 31.00
Duration of P 78.16 ms 24.52 31.00 0.19 -1.34 30.00
Duration of
All 86.61 ms 32.67 31.00
Table 17 shows that there was a statistical difference between the values of F0 for P and
All in <historial>, t (25.0) = 2.64, p < 0.05, and there was a very small Cohen’s d effect size (d
= .2). Similarly, there was also a significant statistical difference between the intensity values of
P and All, t (25.0) = 6.09, p < 0.00, and the Cohen’s d effect size was small (d = .3). Moreover, P
was significantly different from All with respect to duration, t (25.0) = 5.70, p < 0.00, with a
large Cohen’s d effect size of 1.6. Unlike the previous token, all three acoustic correlates appear
to play a significant role in the production of lexical stress in <historial> by Arabic L1 NNES.
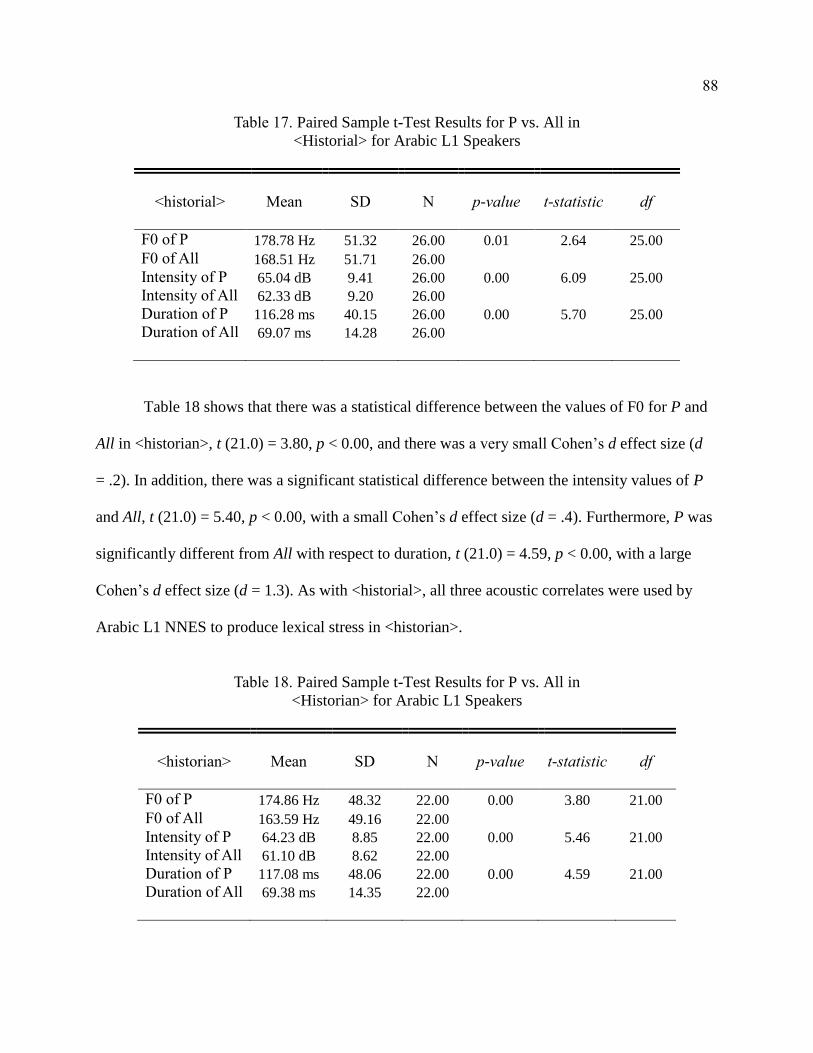
88
Table 17. Paired Sample t-Test Results for P vs. All in
<Historial> for Arabic L1 Speakers
<historial>
Mean
SD
N
p-value
t-statistic
df
F0 of P 178.78 Hz 51.32 26.00 0.01 2.64 25.00
F0 of All 168.51 Hz 51.71 26.00
Intensity of P 65.04 dB 9.41 26.00 0.00 6.09 25.00
Intensity of All 62.33 dB 9.20 26.00
Duration of P 116.28 ms 40.15 26.00 0.00 5.70 25.00
Duration of All 69.07 ms 14.28 26.00
Table 18 shows that there was a statistical difference between the values of F0 for P and
All in <historian>, t (21.0) = 3.80, p < 0.00, and there was a very small Cohen’s d effect size (d
= .2). In addition, there was a significant statistical difference between the intensity values of P
and All, t (21.0) = 5.40, p < 0.00, with a small Cohen’s d effect size (d = .4). Furthermore, P was
significantly different from All with respect to duration, t (21.0) = 4.59, p < 0.00, with a large
Cohen’s d effect size (d = 1.3). As with <historial>, all three acoustic correlates were used by
Arabic L1 NNES to produce lexical stress in <historian>.
Table 18. Paired Sample t-Test Results for P vs. All in
<Historian> for Arabic L1 Speakers
<historian>
Mean
SD
N
p-value
t-statistic
df
F0 of P 174.86 Hz 48.32 22.00 0.00 3.80 21.00
F0 of All 163.59 Hz 49.16 22.00
Intensity of P 64.23 dB 8.85 22.00 0.00 5.46 21.00
Intensity of All 61.10 dB 8.62 22.00
Duration of P 117.08 ms 48.06 22.00 0.00 4.59 21.00
Duration of All 69.38 ms 14.35 22.00
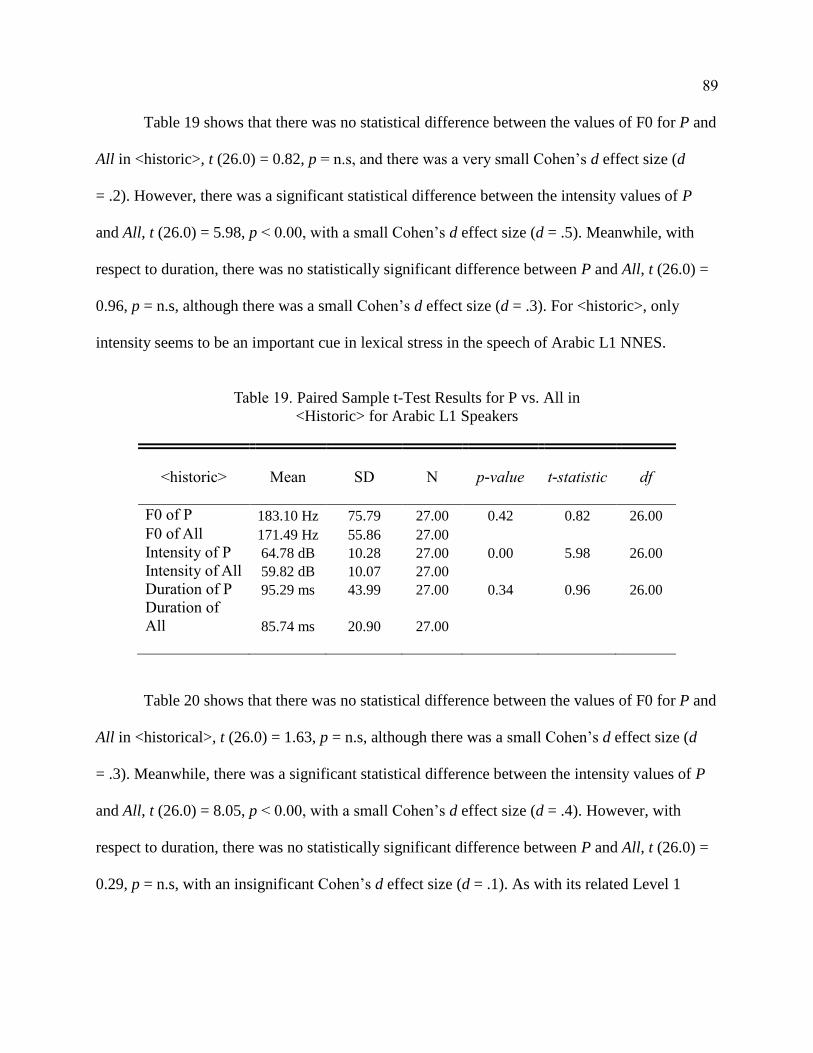
89
Table 19 shows that there was no statistical difference between the values of F0 for P and
All in <historic>, t (26.0) = 0.82, p = n.s, and there was a very small Cohen’s d effect size (d
= .2). However, there was a significant statistical difference between the intensity values of P
and All, t (26.0) = 5.98, p < 0.00, with a small Cohen’s d effect size (d = .5). Meanwhile, with
respect to duration, there was no statistically significant difference between P and All, t (26.0) =
0.96, p = n.s, although there was a small Cohen’s d effect size (d = .3). For <historic>, only
intensity seems to be an important cue in lexical stress in the speech of Arabic L1 NNES.
Table 19. Paired Sample t-Test Results for P vs. All in
<Historic> for Arabic L1 Speakers
<historic>
Mean
SD
N
p-value
t-statistic
df
F0 of P 183.10 Hz 75.79 27.00 0.42 0.82 26.00
F0 of All 171.49 Hz 55.86 27.00
Intensity of P 64.78 dB 10.28 27.00 0.00 5.98 26.00
Intensity of All 59.82 dB 10.07 27.00
Duration of P 95.29 ms 43.99 27.00 0.34 0.96 26.00
Duration of
All 85.74 ms 20.90 27.00
Table 20 shows that there was no statistical difference between the values of F0 for P and
All in <historical>, t (26.0) = 1.63, p = n.s, although there was a small Cohen’s d effect size (d
= .3). Meanwhile, there was a significant statistical difference between the intensity values of P
and All, t (26.0) = 8.05, p < 0.00, with a small Cohen’s d effect size (d = .4). However, with
respect to duration, there was no statistically significant difference between P and All, t (26.0) =
0.29, p = n.s, with an insignificant Cohen’s d effect size (d = .1). As with its related Level 1
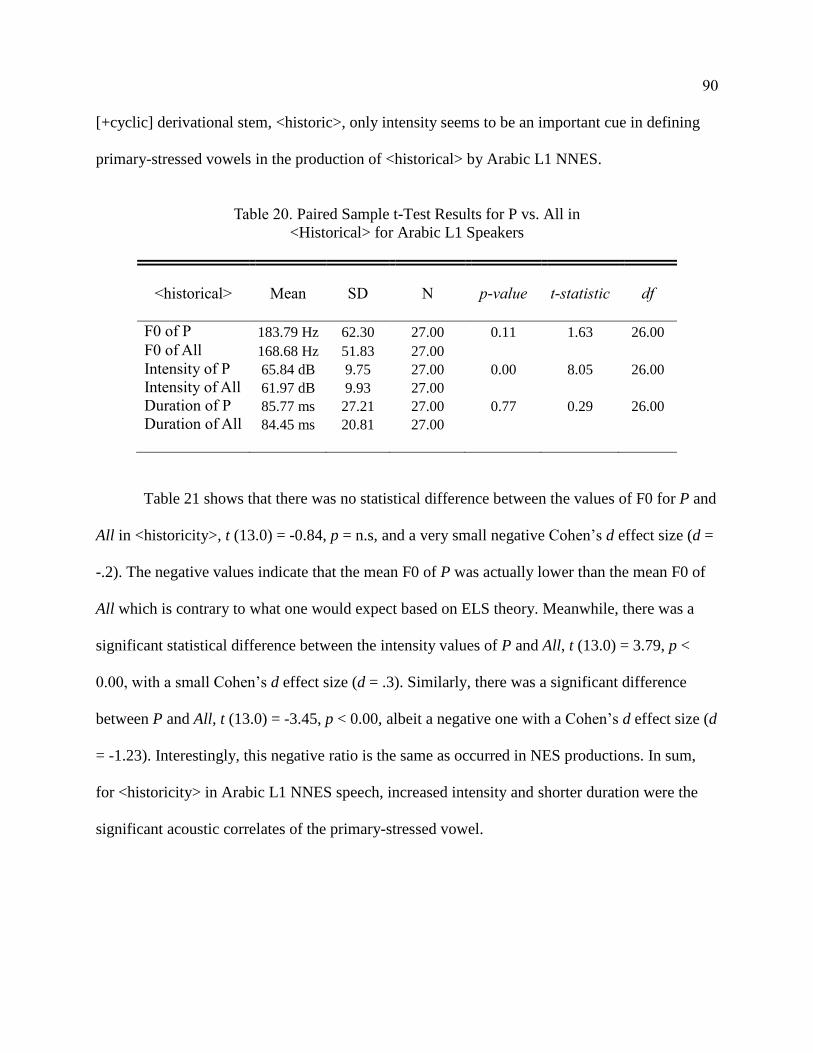
90
[+cyclic] derivational stem, <historic>, only intensity seems to be an important cue in defining
primary-stressed vowels in the production of <historical> by Arabic L1 NNES.
Table 20. Paired Sample t-Test Results for P vs. All in
<Historical> for Arabic L1 Speakers
<historical>
Mean
SD
N
p-value
t-statistic
df
F0 of P 183.79 Hz 62.30 27.00 0.11 1.63 26.00
F0 of All 168.68 Hz 51.83 27.00
Intensity of P 65.84 dB 9.75 27.00 0.00 8.05 26.00
Intensity of All 61.97 dB 9.93 27.00
Duration of P 85.77 ms 27.21 27.00 0.77 0.29 26.00
Duration of All 84.45 ms 20.81 27.00
Table 21 shows that there was no statistical difference between the values of F0 for P and
All in <historicity>, t (13.0) = -0.84, p = n.s, and a very small negative Cohen’s d effect size (d =
-.2). The negative values indicate that the mean F0 of P was actually lower than the mean F0 of
All which is contrary to what one would expect based on ELS theory. Meanwhile, there was a
significant statistical difference between the intensity values of P and All, t (13.0) = 3.79, p <
0.00, with a small Cohen’s d effect size (d = .3). Similarly, there was a significant difference
between P and All, t (13.0) = -3.45, p < 0.00, albeit a negative one with a Cohen’s d effect size (d
= -1.23). Interestingly, this negative ratio is the same as occurred in NES productions. In sum,
for <historicity> in Arabic L1 NNES speech, increased intensity and shorter duration were the
significant acoustic correlates of the primary-stressed vowel.
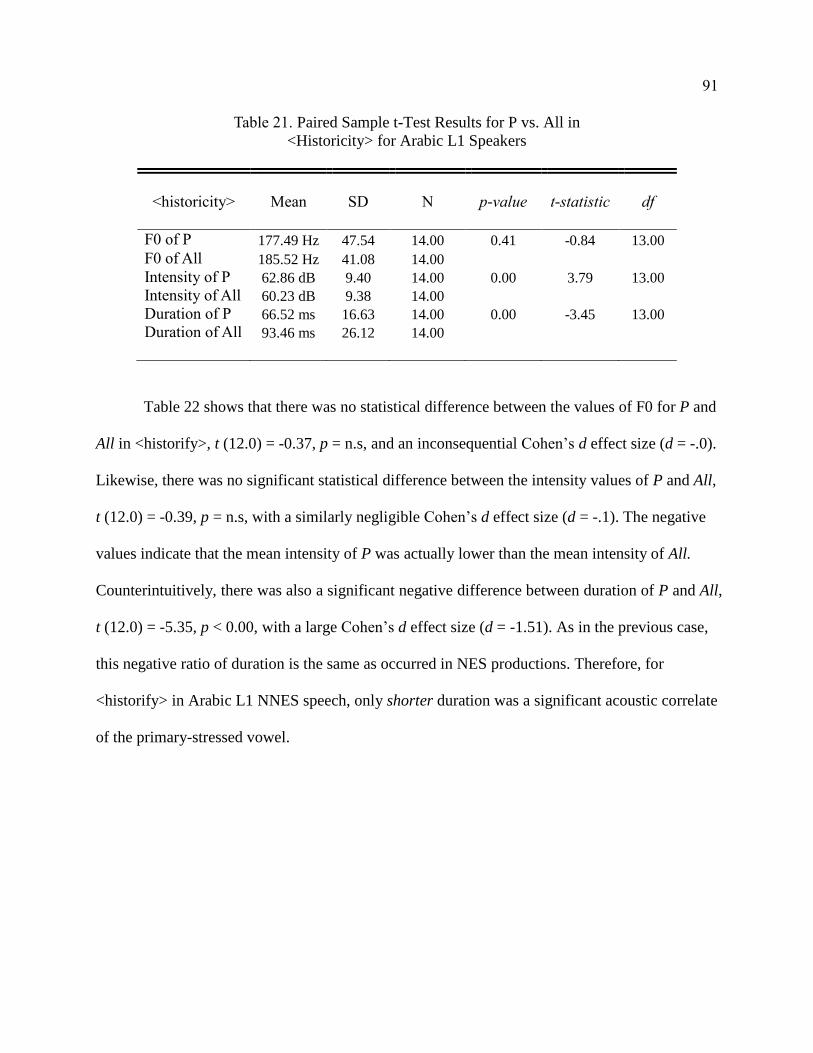
91
Table 21. Paired Sample t-Test Results for P vs. All in
<Historicity> for Arabic L1 Speakers
<historicity>
Mean
SD
N
p-value
t-statistic
df
F0 of P 177.49 Hz 47.54 14.00 0.41 -0.84 13.00
F0 of All 185.52 Hz 41.08 14.00
Intensity of P 62.86 dB 9.40 14.00 0.00 3.79 13.00
Intensity of All 60.23 dB 9.38 14.00
Duration of P 66.52 ms 16.63 14.00 0.00 -3.45 13.00
Duration of All 93.46 ms 26.12 14.00
Table 22 shows that there was no statistical difference between the values of F0 for P and
All in <historify>, t (12.0) = -0.37, p = n.s, and an inconsequential Cohen’s d effect size (d = -.0).
Likewise, there was no significant statistical difference between the intensity values of P and All,
t (12.0) = -0.39, p = n.s, with a similarly negligible Cohen’s d effect size (d = -.1). The negative
values indicate that the mean intensity of P was actually lower than the mean intensity of All.
Counterintuitively, there was also a significant negative difference between duration of P and All,
t (12.0) = -5.35, p < 0.00, with a large Cohen’s d effect size (d = -1.51). As in the previous case,
this negative ratio of duration is the same as occurred in NES productions. Therefore, for
<historify> in Arabic L1 NNES speech, only shorter duration was a significant acoustic correlate
of the primary-stressed vowel.
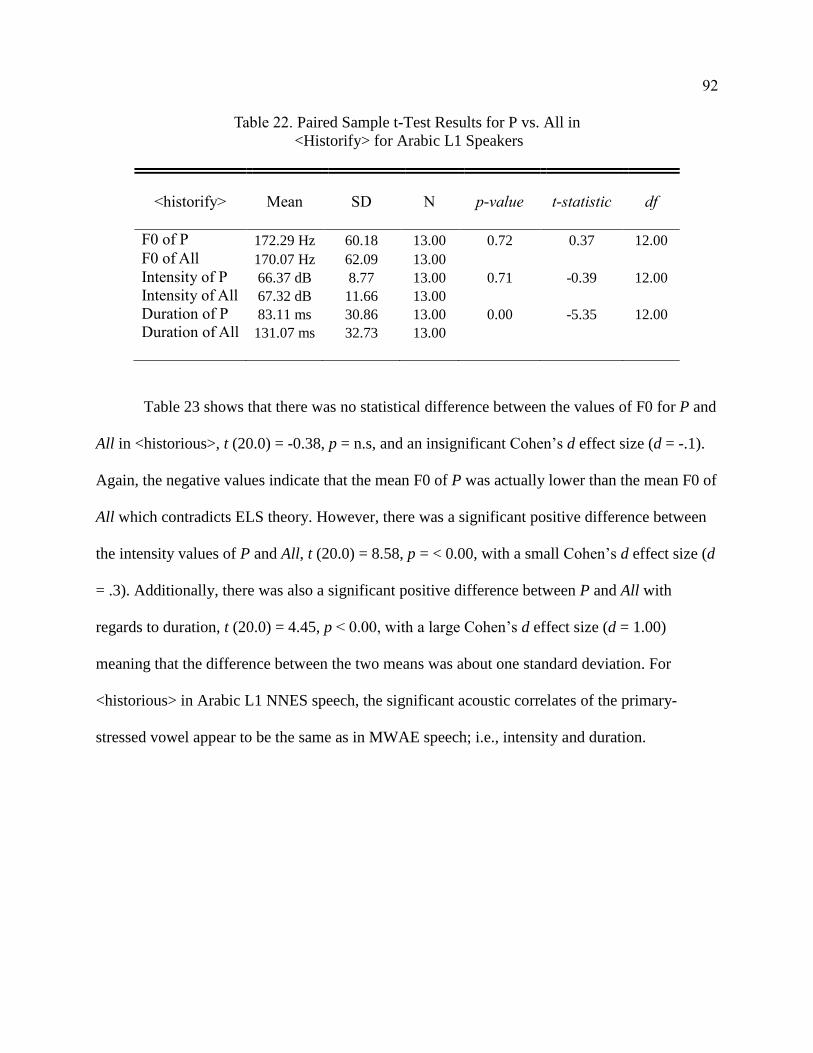
92
Table 22. Paired Sample t-Test Results for P vs. All in
<Historify> for Arabic L1 Speakers
<historify>
Mean
SD
N
p-value
t-statistic
df
F0 of P 172.29 Hz 60.18 13.00 0.72 0.37 12.00
F0 of All 170.07 Hz 62.09 13.00
Intensity of P 66.37 dB 8.77 13.00 0.71 -0.39 12.00
Intensity of All 67.32 dB 11.66 13.00
Duration of P 83.11 ms 30.86 13.00 0.00 -5.35 12.00
Duration of All 131.07 ms 32.73 13.00
Table 23 shows that there was no statistical difference between the values of F0 for P and
All in <historious>, t (20.0) = -0.38, p = n.s, and an insignificant Cohen’s d effect size (d = -.1).
Again, the negative values indicate that the mean F0 of P was actually lower than the mean F0 of
All which contradicts ELS theory. However, there was a significant positive difference between
the intensity values of P and All, t (20.0) = 8.58, p = < 0.00, with a small Cohen’s d effect size (d
= .3). Additionally, there was also a significant positive difference between P and All with
regards to duration, t (20.0) = 4.45, p < 0.00, with a large Cohen’s d effect size (d = 1.00)
meaning that the difference between the two means was about one standard deviation. For
<historious> in Arabic L1 NNES speech, the significant acoustic correlates of the primary-
stressed vowel appear to be the same as in MWAE speech; i.e., intensity and duration.
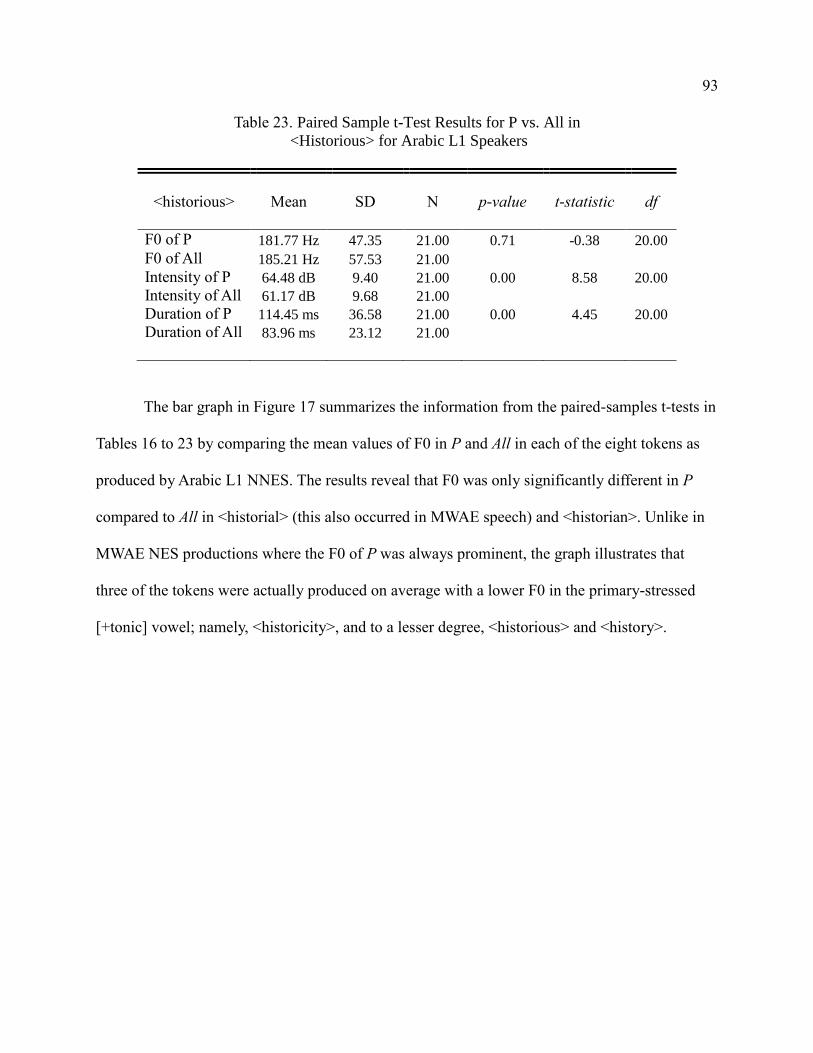
93
Table 23. Paired Sample t-Test Results for P vs. All in
<Historious> for Arabic L1 Speakers
<historious>
Mean
SD
N
p-value
t-statistic
df
F0 of P 181.77 Hz 47.35 21.00 0.71 -0.38 20.00
F0 of All 185.21 Hz 57.53 21.00
Intensity of P 64.48 dB 9.40 21.00 0.00 8.58 20.00
Intensity of All 61.17 dB 9.68 21.00
Duration of P 114.45 ms 36.58 21.00 0.00 4.45 20.00
Duration of All 83.96 ms 23.12 21.00
The bar graph in Figure 17 summarizes the information from the paired-samples t-tests in
Tables 16 to 23 by comparing the mean values of F0 in P and All in each of the eight tokens as
produced by Arabic L1 NNES. The results reveal that F0 was only significantly different in P
compared to All in <historial> (this also occurred in MWAE speech) and <historian>. Unlike in
MWAE NES productions where the F0 of P was always prominent, the graph illustrates that
three of the tokens were actually produced on average with a lower F0 in the primary-stressed
[+tonic] vowel; namely, <historicity>, and to a lesser degree, <historious> and <history>.
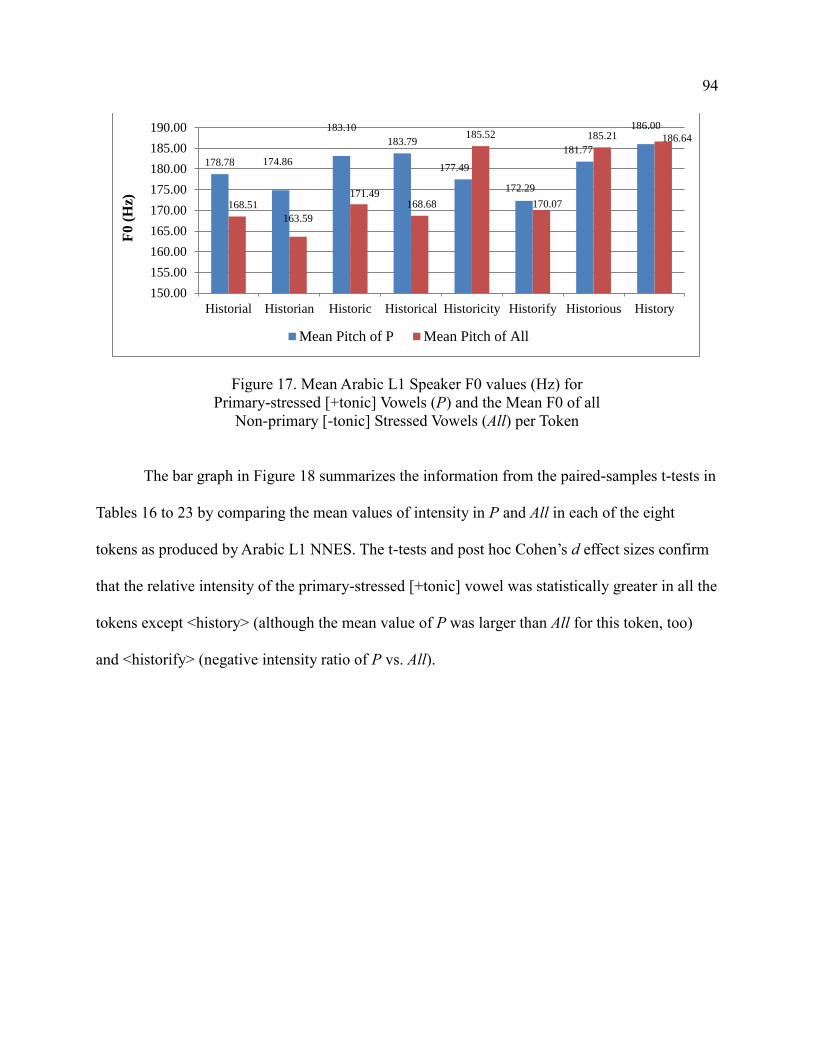
94
Figure 17. Mean Arabic L1 Speaker F0 values (Hz) for
Primary-stressed [+tonic] Vowels (P) and the Mean F0 of all
Non-primary [-tonic] Stressed Vowels (All) per Token
The bar graph in Figure 18 summarizes the information from the paired-samples t-tests in
Tables 16 to 23 by comparing the mean values of intensity in P and All in each of the eight
tokens as produced by Arabic L1 NNES. The t-tests and post hoc Cohen’s d effect sizes confirm
that the relative intensity of the primary-stressed [+tonic] vowel was statistically greater in all the
tokens except <history> (although the mean value of P was larger than All for this token, too)
and <historify> (negative intensity ratio of P vs. All).
178.78 174.86
183.10
183.79
177.49
172.29
181.77
186.00
168.51
163.59
171.49168.68
185.52
170.07
185.21 186.64
150.00
155.00
160.00
165.00
170.00
175.00
180.00
185.00
190.00
Historial Historian Historic Historical Historicity Historify Historious History
F0
(H
z)
Mean Pitch of P Mean Pitch of All
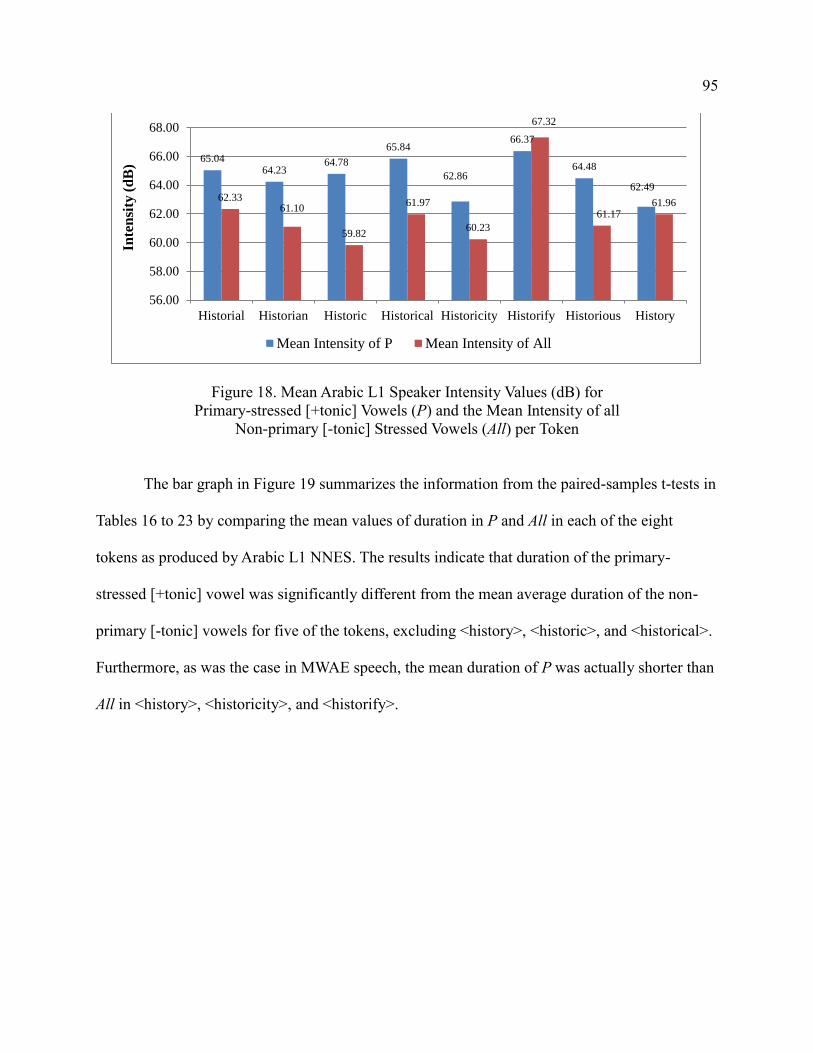
95
Figure 18. Mean Arabic L1 Speaker Intensity Values (dB) for
Primary-stressed [+tonic] Vowels (P) and the Mean Intensity of all
Non-primary [-tonic] Stressed Vowels (All) per Token
The bar graph in Figure 19 summarizes the information from the paired-samples t-tests in
Tables 16 to 23 by comparing the mean values of duration in P and All in each of the eight
tokens as produced by Arabic L1 NNES. The results indicate that duration of the primary-
stressed [+tonic] vowel was significantly different from the mean average duration of the non-
primary [-tonic] vowels for five of the tokens, excluding <history>, <historic>, and <historical>.
Furthermore, as was the case in MWAE speech, the mean duration of P was actually shorter than
All in <history>, <historicity>, and <historify>.
65.0464.23
64.78
65.84
62.86
66.37
64.48
62.4962.33
61.10
59.82
61.97
60.23
67.32
61.1761.96
56.00
58.00
60.00
62.00
64.00
66.00
68.00
Historial Historian Historic Historical Historicity Historify Historious History
Inte
nsi
ty (
dB
)
Mean Intensity of P Mean Intensity of All
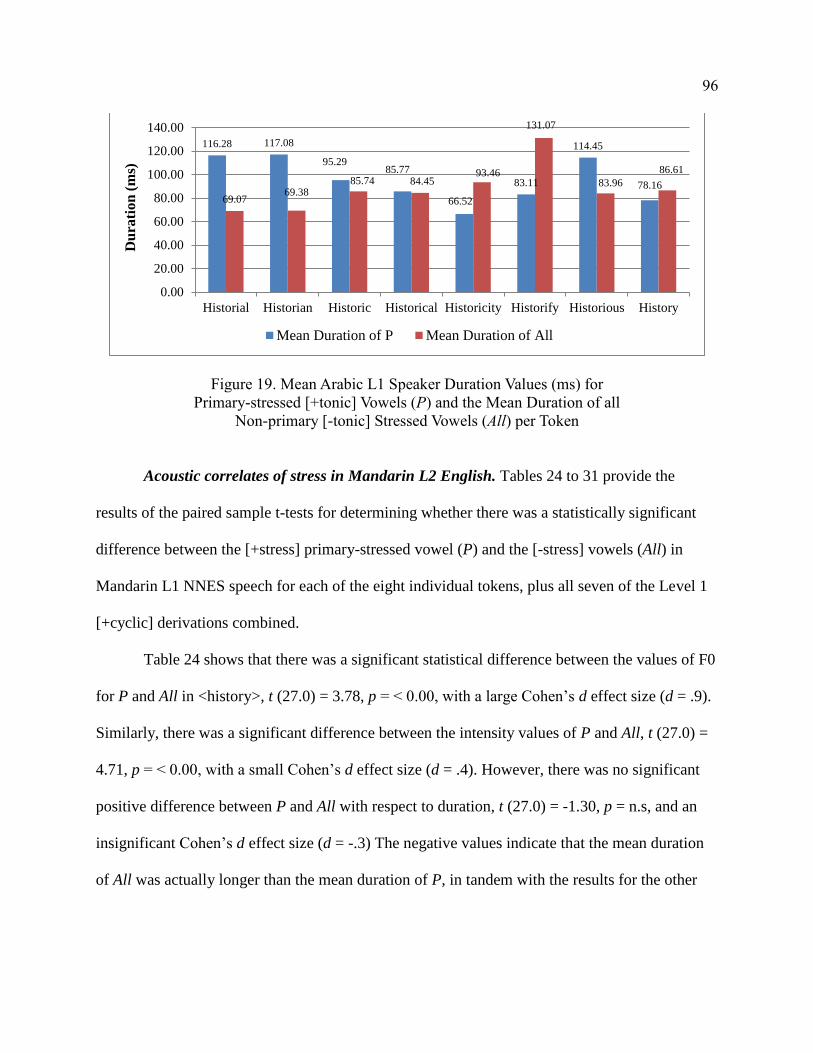
96
Figure 19. Mean Arabic L1 Speaker Duration Values (ms) for
Primary-stressed [+tonic] Vowels (P) and the Mean Duration of all
Non-primary [-tonic] Stressed Vowels (All) per Token
Acoustic correlates of stress in Mandarin L2 English. Tables 24 to 31 provide the
results of the paired sample t-tests for determining whether there was a statistically significant
difference between the [+stress] primary-stressed vowel (P) and the [-stress] vowels (All) in
Mandarin L1 NNES speech for each of the eight individual tokens, plus all seven of the Level 1
[+cyclic] derivations combined.
Table 24 shows that there was a significant statistical difference between the values of F0
for P and All in <history>, t (27.0) = 3.78, p = < 0.00, with a large Cohen’s d effect size (d = .9).
Similarly, there was a significant difference between the intensity values of P and All, t (27.0) =
4.71, p = < 0.00, with a small Cohen’s d effect size (d = .4). However, there was no significant
positive difference between P and All with respect to duration, t (27.0) = -1.30, p = n.s, and an
insignificant Cohen’s d effect size (d = -.3) The negative values indicate that the mean duration
of All was actually longer than the mean duration of P, in tandem with the results for the other
116.28 117.08
95.2985.77
66.52
83.11
114.45
78.16
69.0769.38
85.74 84.4593.46
131.07
83.96
86.61
0.00
20.00
40.00
60.00
80.00
100.00
120.00
140.00
Historial Historian Historic Historical Historicity Historify Historious History
Du
rati
on
(m
s)
Mean Duration of P Mean Duration of All
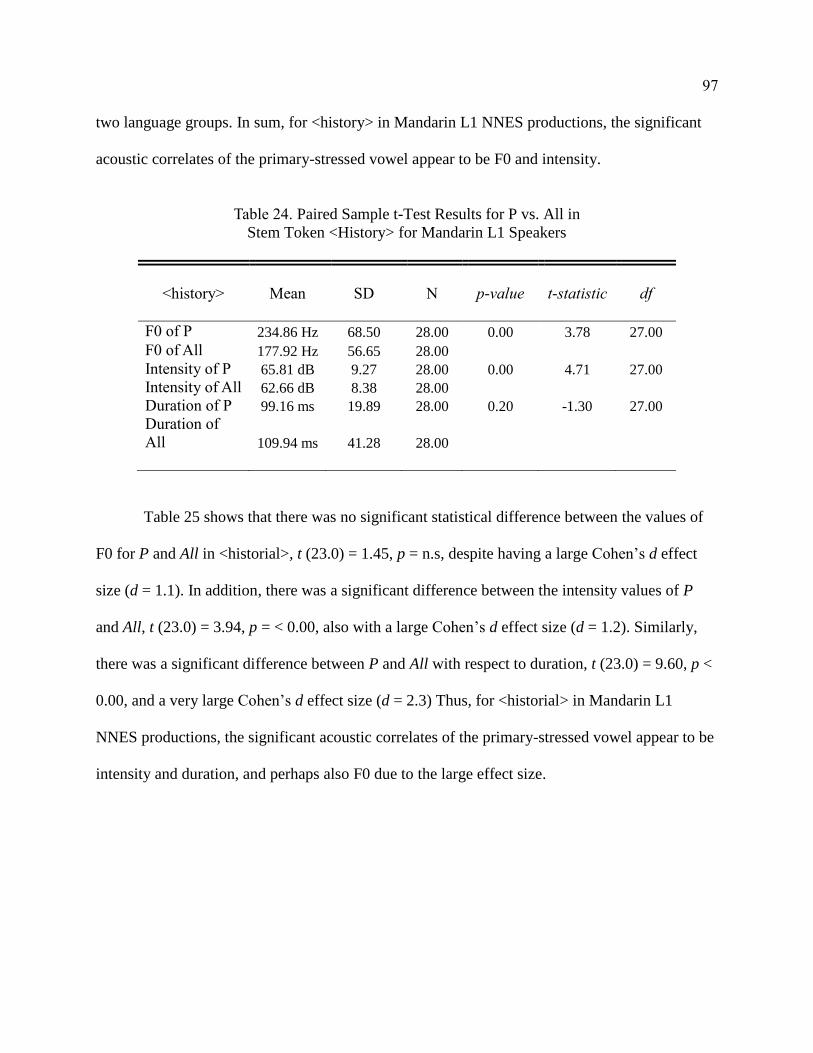
97
two language groups. In sum, for <history> in Mandarin L1 NNES productions, the significant
acoustic correlates of the primary-stressed vowel appear to be F0 and intensity.
Table 24. Paired Sample t-Test Results for P vs. All in
Stem Token <History> for Mandarin L1 Speakers
<history>
Mean
SD
N
p-value
t-statistic
df
F0 of P 234.86 Hz 68.50 28.00 0.00 3.78 27.00
F0 of All 177.92 Hz 56.65 28.00
Intensity of P 65.81 dB 9.27 28.00 0.00 4.71 27.00
Intensity of All 62.66 dB 8.38 28.00
Duration of P 99.16 ms 19.89 28.00 0.20 -1.30 27.00
Duration of
All 109.94 ms 41.28 28.00
Table 25 shows that there was no significant statistical difference between the values of
F0 for P and All in <historial>, t (23.0) = 1.45, p = n.s, despite having a large Cohen’s d effect
size (d = 1.1). In addition, there was a significant difference between the intensity values of P
and All, t (23.0) = 3.94, p = < 0.00, also with a large Cohen’s d effect size (d = 1.2). Similarly,
there was a significant difference between P and All with respect to duration, t (23.0) = 9.60, p <
0.00, and a very large Cohen’s d effect size (d = 2.3) Thus, for <historial> in Mandarin L1
NNES productions, the significant acoustic correlates of the primary-stressed vowel appear to be
intensity and duration, and perhaps also F0 due to the large effect size.
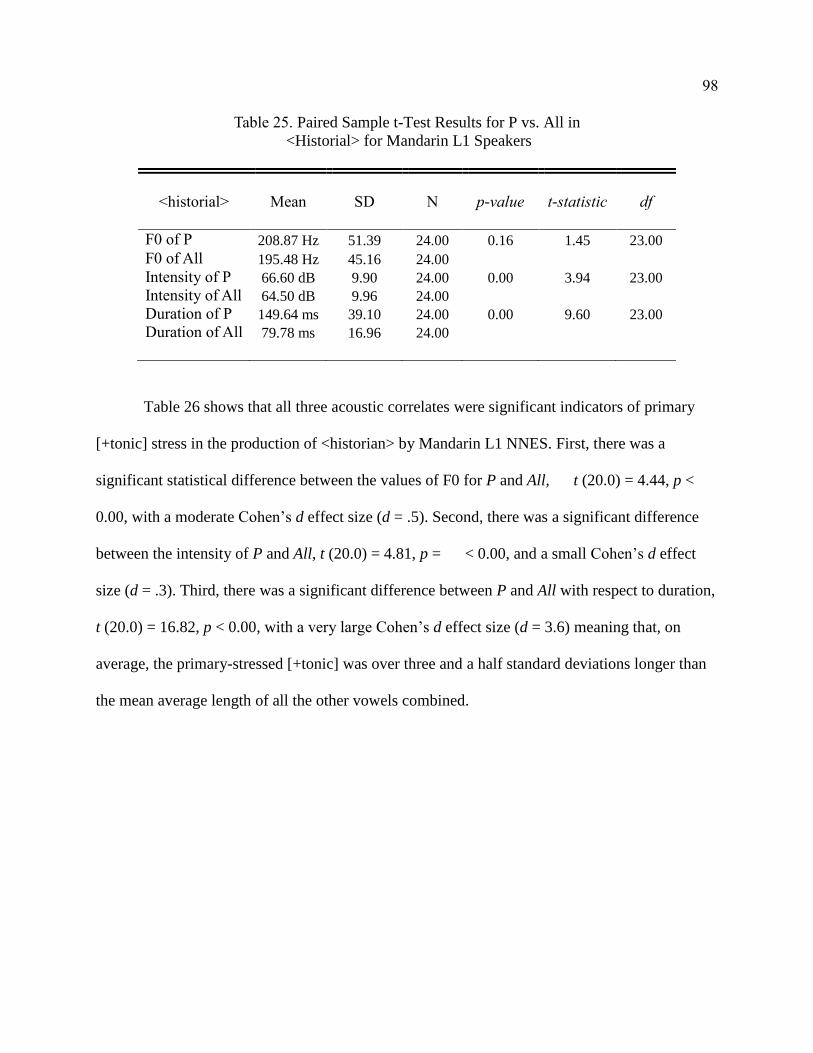
98
Table 25. Paired Sample t-Test Results for P vs. All in
<Historial> for Mandarin L1 Speakers
<historial>
Mean
SD
N
p-value
t-statistic
df
F0 of P 208.87 Hz 51.39 24.00 0.16 1.45 23.00
F0 of All 195.48 Hz 45.16 24.00
Intensity of P 66.60 dB 9.90 24.00 0.00 3.94 23.00
Intensity of All 64.50 dB 9.96 24.00
Duration of P 149.64 ms 39.10 24.00 0.00 9.60 23.00
Duration of All 79.78 ms 16.96 24.00
Table 26 shows that all three acoustic correlates were significant indicators of primary
[+tonic] stress in the production of <historian> by Mandarin L1 NNES. First, there was a
significant statistical difference between the values of F0 for P and All, t (20.0) = 4.44, p <
0.00, with a moderate Cohen’s d effect size (d = .5). Second, there was a significant difference
between the intensity of P and All, t (20.0) = 4.81, p = < 0.00, and a small Cohen’s d effect
size (d = .3). Third, there was a significant difference between P and All with respect to duration,
t (20.0) = 16.82, p < 0.00, with a very large Cohen’s d effect size (d = 3.6) meaning that, on
average, the primary-stressed [+tonic] was over three and a half standard deviations longer than
the mean average length of all the other vowels combined.
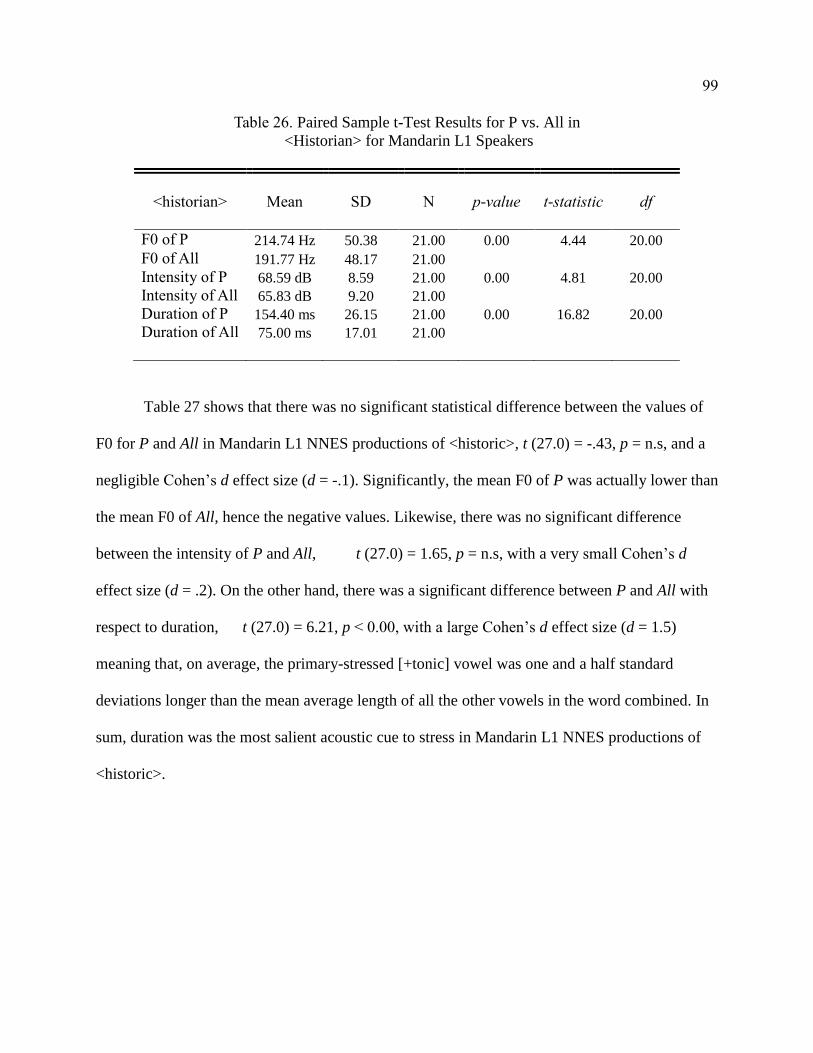
99
Table 26. Paired Sample t-Test Results for P vs. All in
<Historian> for Mandarin L1 Speakers
<historian>
Mean
SD
N
p-value
t-statistic
df
F0 of P 214.74 Hz 50.38 21.00 0.00 4.44 20.00
F0 of All 191.77 Hz 48.17 21.00
Intensity of P 68.59 dB 8.59 21.00 0.00 4.81 20.00
Intensity of All 65.83 dB 9.20 21.00
Duration of P 154.40 ms 26.15 21.00 0.00 16.82 20.00
Duration of All 75.00 ms 17.01 21.00
Table 27 shows that there was no significant statistical difference between the values of
F0 for P and All in Mandarin L1 NNES productions of <historic>, t (27.0) = -.43, p = n.s, and a
negligible Cohen’s d effect size (d = -.1). Significantly, the mean F0 of P was actually lower than
the mean F0 of All, hence the negative values. Likewise, there was no significant difference
between the intensity of P and All, t (27.0) = 1.65, p = n.s, with a very small Cohen’s d
effect size (d = .2). On the other hand, there was a significant difference between P and All with
respect to duration, t (27.0) = 6.21, p < 0.00, with a large Cohen’s d effect size (d = 1.5)
meaning that, on average, the primary-stressed [+tonic] vowel was one and a half standard
deviations longer than the mean average length of all the other vowels in the word combined. In
sum, duration was the most salient acoustic cue to stress in Mandarin L1 NNES productions of
<historic>.
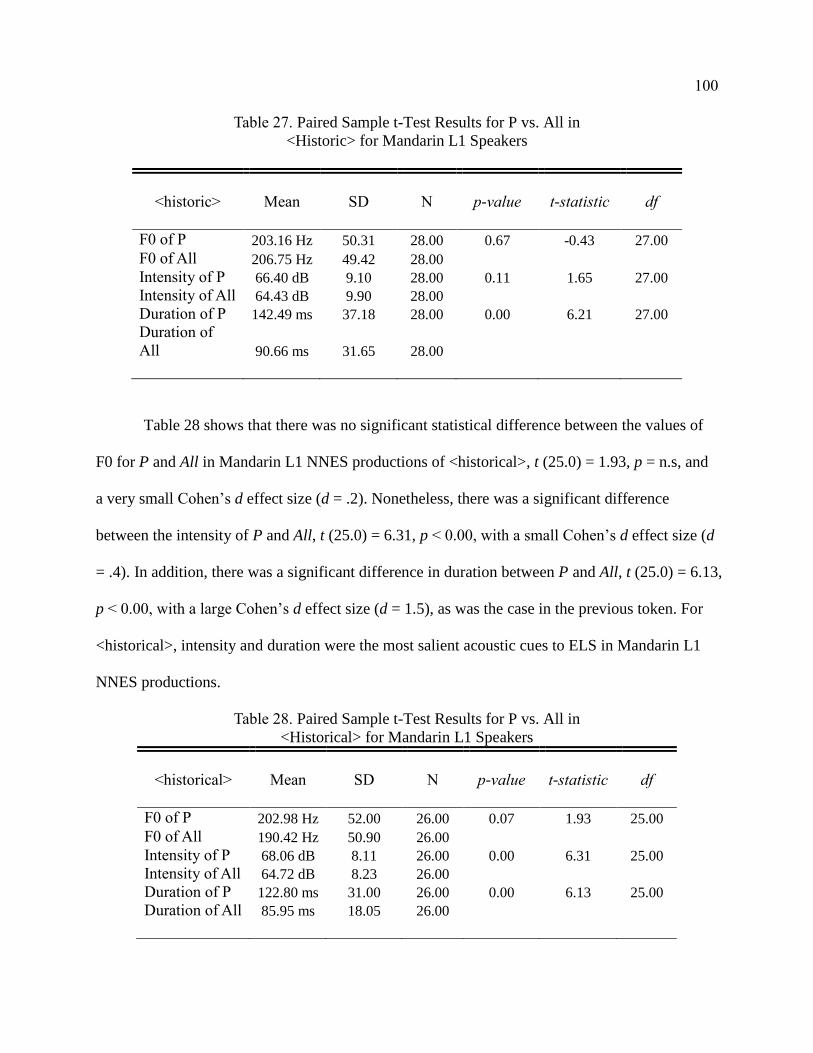
100
Table 27. Paired Sample t-Test Results for P vs. All in
<Historic> for Mandarin L1 Speakers
<historic>
Mean
SD
N
p-value
t-statistic
df
F0 of P 203.16 Hz 50.31 28.00 0.67 -0.43 27.00
F0 of All 206.75 Hz 49.42 28.00
Intensity of P 66.40 dB 9.10 28.00 0.11 1.65 27.00
Intensity of All 64.43 dB 9.90 28.00
Duration of P 142.49 ms 37.18 28.00 0.00 6.21 27.00
Duration of
All 90.66 ms 31.65 28.00
Table 28 shows that there was no significant statistical difference between the values of
F0 for P and All in Mandarin L1 NNES productions of <historical>, t (25.0) = 1.93, p = n.s, and
a very small Cohen’s d effect size (d = .2). Nonetheless, there was a significant difference
between the intensity of P and All, t (25.0) = 6.31, p < 0.00, with a small Cohen’s d effect size (d
= .4). In addition, there was a significant difference in duration between P and All, t (25.0) = 6.13,
p < 0.00, with a large Cohen’s d effect size (d = 1.5), as was the case in the previous token. For
<historical>, intensity and duration were the most salient acoustic cues to ELS in Mandarin L1
NNES productions.
Table 28. Paired Sample t-Test Results for P vs. All in
<Historical> for Mandarin L1 Speakers
<historical>
Mean
SD
N
p-value
t-statistic
df
F0 of P 202.98 Hz 52.00 26.00 0.07 1.93 25.00
F0 of All 190.42 Hz 50.90 26.00
Intensity of P 68.06 dB 8.11 26.00 0.00 6.31 25.00
Intensity of All 64.72 dB 8.23 26.00
Duration of P 122.80 ms 31.00 26.00 0.00 6.13 25.00
Duration of All 85.95 ms 18.05 26.00
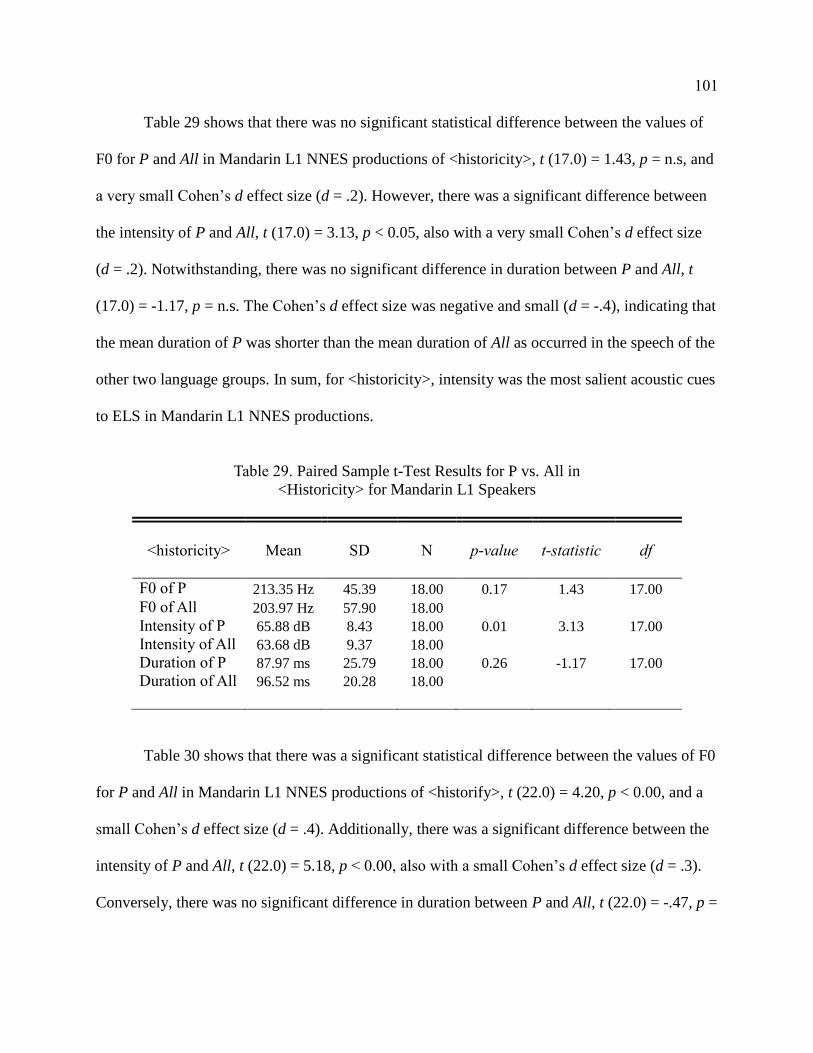
101
Table 29 shows that there was no significant statistical difference between the values of
F0 for P and All in Mandarin L1 NNES productions of <historicity>, t (17.0) = 1.43, p = n.s, and
a very small Cohen’s d effect size (d = .2). However, there was a significant difference between
the intensity of P and All, t (17.0) = 3.13, p < 0.05, also with a very small Cohen’s d effect size
(d = .2). Notwithstanding, there was no significant difference in duration between P and All, t
(17.0) = -1.17, p = n.s. The Cohen’s d effect size was negative and small (d = -.4), indicating that
the mean duration of P was shorter than the mean duration of All as occurred in the speech of the
other two language groups. In sum, for <historicity>, intensity was the most salient acoustic cues
to ELS in Mandarin L1 NNES productions.
Table 29. Paired Sample t-Test Results for P vs. All in
<Historicity> for Mandarin L1 Speakers
<historicity>
Mean
SD
N
p-value
t-statistic
df
F0 of P 213.35 Hz 45.39 18.00 0.17 1.43 17.00
F0 of All 203.97 Hz 57.90 18.00
Intensity of P 65.88 dB 8.43 18.00 0.01 3.13 17.00
Intensity of All 63.68 dB 9.37 18.00
Duration of P 87.97 ms 25.79 18.00 0.26 -1.17 17.00
Duration of All 96.52 ms 20.28 18.00
Table 30 shows that there was a significant statistical difference between the values of F0
for P and All in Mandarin L1 NNES productions of <historify>, t (22.0) = 4.20, p < 0.00, and a
small Cohen’s d effect size (d = .4). Additionally, there was a significant difference between the
intensity of P and All, t (22.0) = 5.18, p < 0.00, also with a small Cohen’s d effect size (d = .3).
Conversely, there was no significant difference in duration between P and All, t (22.0) = -.47, p =
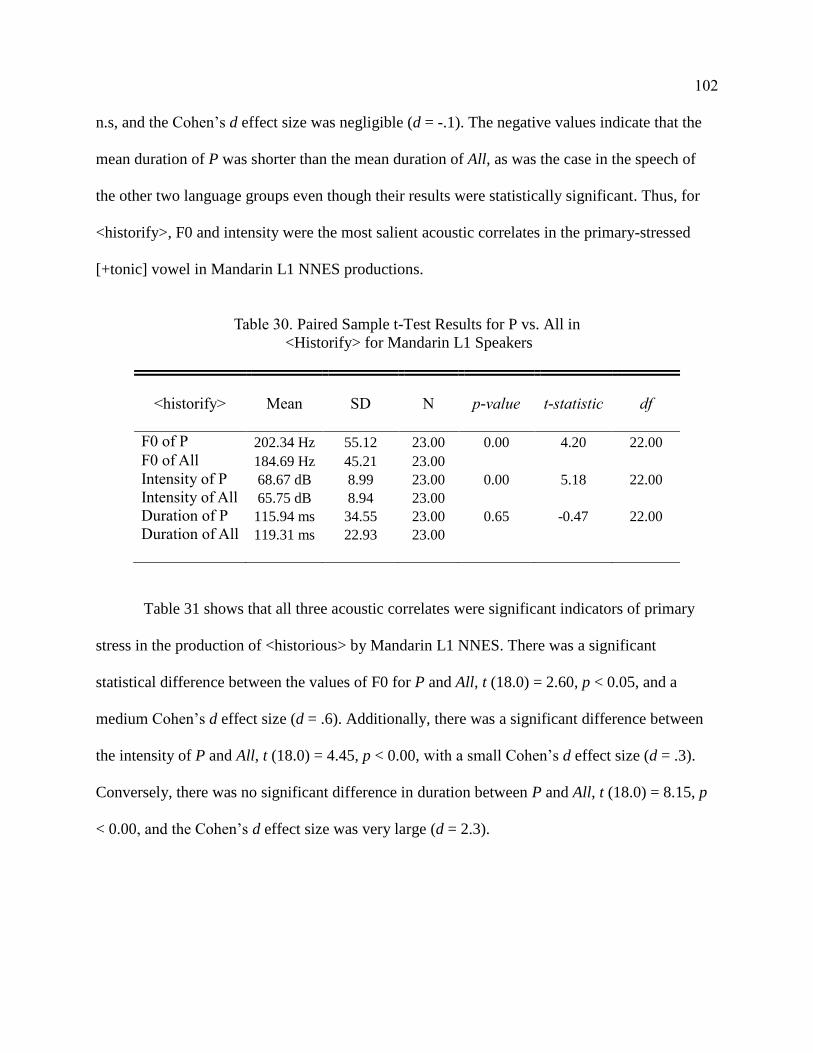
102
n.s, and the Cohen’s d effect size was negligible (d = -.1). The negative values indicate that the
mean duration of P was shorter than the mean duration of All, as was the case in the speech of
the other two language groups even though their results were statistically significant. Thus, for
<historify>, F0 and intensity were the most salient acoustic correlates in the primary-stressed
[+tonic] vowel in Mandarin L1 NNES productions.
Table 30. Paired Sample t-Test Results for P vs. All in
<Historify> for Mandarin L1 Speakers
<historify>
Mean
SD
N
p-value
t-statistic
df
F0 of P 202.34 Hz 55.12 23.00 0.00 4.20 22.00
F0 of All 184.69 Hz 45.21 23.00
Intensity of P 68.67 dB 8.99 23.00 0.00 5.18 22.00
Intensity of All 65.75 dB 8.94 23.00
Duration of P 115.94 ms 34.55 23.00 0.65 -0.47 22.00
Duration of All 119.31 ms 22.93 23.00
Table 31 shows that all three acoustic correlates were significant indicators of primary
stress in the production of <historious> by Mandarin L1 NNES. There was a significant
statistical difference between the values of F0 for P and All, t (18.0) = 2.60, p < 0.05, and a
medium Cohen’s d effect size (d = .6). Additionally, there was a significant difference between
the intensity of P and All, t (18.0) = 4.45, p < 0.00, with a small Cohen’s d effect size (d = .3).
Conversely, there was no significant difference in duration between P and All, t (18.0) = 8.15, p
< 0.00, and the Cohen’s d effect size was very large (d = 2.3).
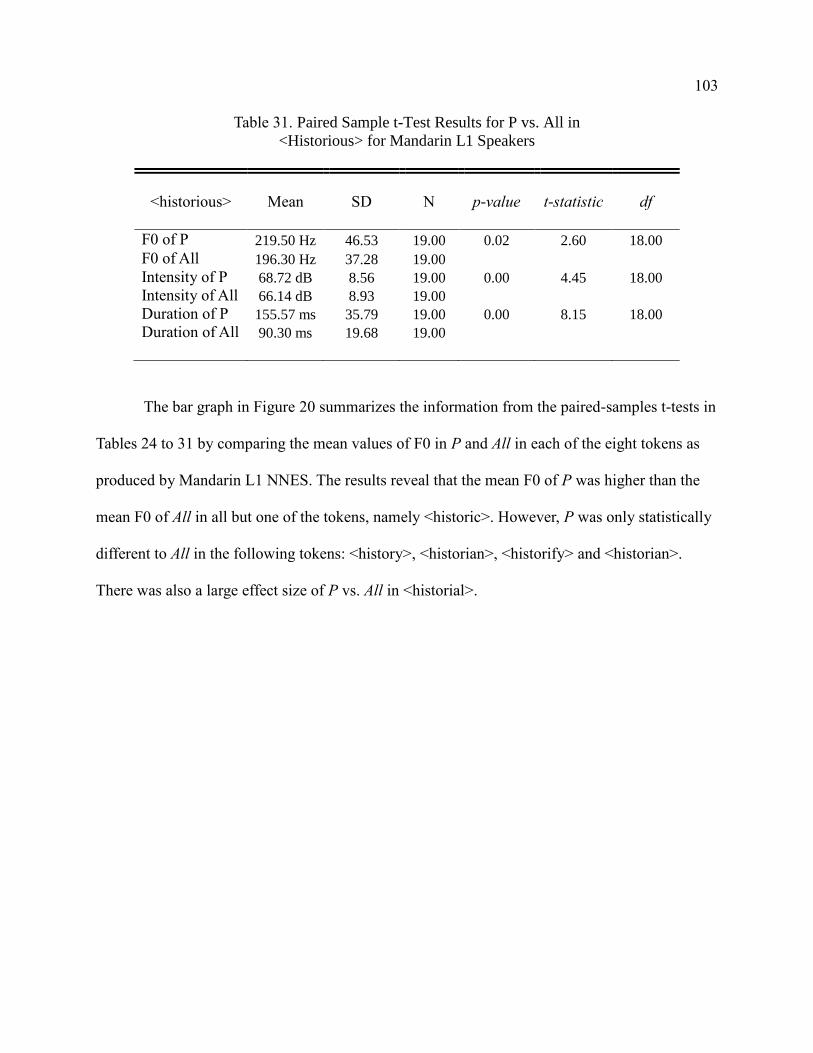
103
Table 31. Paired Sample t-Test Results for P vs. All in
<Historious> for Mandarin L1 Speakers
<historious>
Mean
SD
N
p-value
t-statistic
df
F0 of P 219.50 Hz 46.53 19.00 0.02 2.60 18.00
F0 of All 196.30 Hz 37.28 19.00
Intensity of P 68.72 dB 8.56 19.00 0.00 4.45 18.00
Intensity of All 66.14 dB 8.93 19.00
Duration of P 155.57 ms 35.79 19.00 0.00 8.15 18.00
Duration of All 90.30 ms 19.68 19.00
The bar graph in Figure 20 summarizes the information from the paired-samples t-tests in
Tables 24 to 31 by comparing the mean values of F0 in P and All in each of the eight tokens as
produced by Mandarin L1 NNES. The results reveal that the mean F0 of P was higher than the
mean F0 of All in all but one of the tokens, namely <historic>. However, P was only statistically
different to All in the following tokens: <history>, <historian>, <historify> and <historian>.
There was also a large effect size of P vs. All in <historial>.
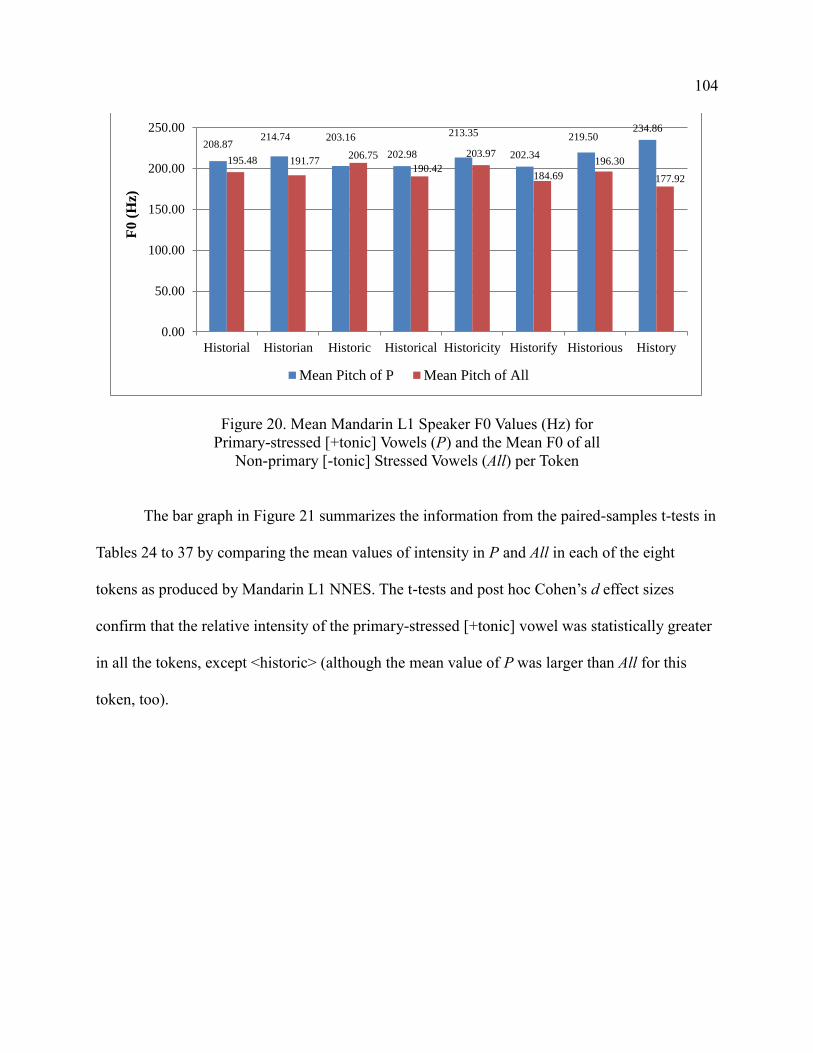
104
Figure 20. Mean Mandarin L1 Speaker F0 Values (Hz) for
Primary-stressed [+tonic] Vowels (P) and the Mean F0 of all
Non-primary [-tonic] Stressed Vowels (All) per Token
The bar graph in Figure 21 summarizes the information from the paired-samples t-tests in
Tables 24 to 37 by comparing the mean values of intensity in P and All in each of the eight
tokens as produced by Mandarin L1 NNES. The t-tests and post hoc Cohen’s d effect sizes
confirm that the relative intensity of the primary-stressed [+tonic] vowel was statistically greater
in all the tokens, except <historic> (although the mean value of P was larger than All for this
token, too).
208.87214.74 203.16
202.98
213.35
202.34
219.50234.86
195.48 191.77206.75
190.42
203.97
184.69
196.30
177.92
0.00
50.00
100.00
150.00
200.00
250.00
Historial Historian Historic Historical Historicity Historify Historious History
F0
(H
z)
Mean Pitch of P Mean Pitch of All
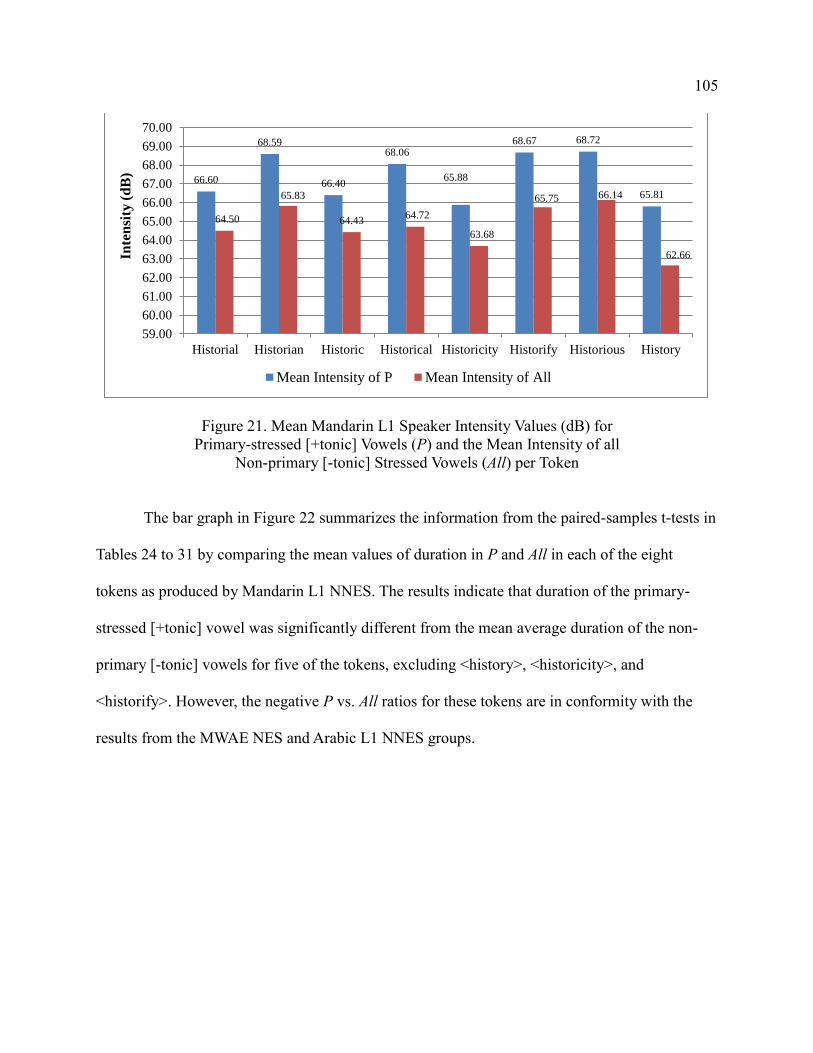
105
Figure 21. Mean Mandarin L1 Speaker Intensity Values (dB) for
Primary-stressed [+tonic] Vowels (P) and the Mean Intensity of all
Non-primary [-tonic] Stressed Vowels (All) per Token
The bar graph in Figure 22 summarizes the information from the paired-samples t-tests in
Tables 24 to 31 by comparing the mean values of duration in P and All in each of the eight
tokens as produced by Mandarin L1 NNES. The results indicate that duration of the primary-
stressed [+tonic] vowel was significantly different from the mean average duration of the non-
primary [-tonic] vowels for five of the tokens, excluding <history>, <historicity>, and
<historify>. However, the negative P vs. All ratios for these tokens are in conformity with the
results from the MWAE NES and Arabic L1 NNES groups.
66.60
68.59
66.40
68.06
65.88
68.67 68.72
65.81
64.50
65.83
64.4364.72
63.68
65.75 66.14
62.66
59.00
60.00
61.00
62.00
63.00
64.00
65.00
66.00
67.00
68.00
69.00
70.00
Historial Historian Historic Historical Historicity Historify Historious History
Inte
nsi
ty (
dB
)
Mean Intensity of P Mean Intensity of All
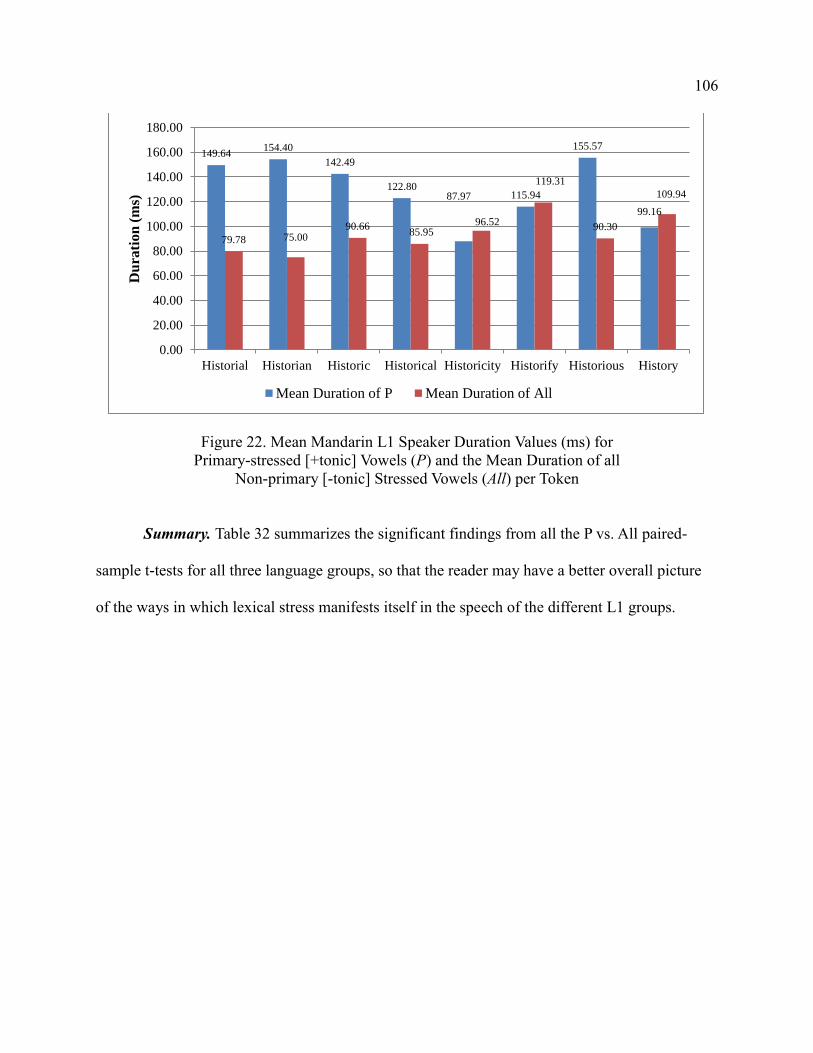
106
Figure 22. Mean Mandarin L1 Speaker Duration Values (ms) for
Primary-stressed [+tonic] Vowels (P) and the Mean Duration of all
Non-primary [-tonic] Stressed Vowels (All) per Token
Summary. Table 32 summarizes the significant findings from all the P vs. All paired-
sample t-tests for all three language groups, so that the reader may have a better overall picture
of the ways in which lexical stress manifests itself in the speech of the different L1 groups.
149.64154.40
142.49
122.8087.97 115.94
155.57
99.16
79.78 75.0090.66
85.9596.52
119.31
90.30
109.94
0.00
20.00
40.00
60.00
80.00
100.00
120.00
140.00
160.00
180.00
Historial Historian Historic Historical Historicity Historify Historious History
Du
rati
on
(m
s)
Mean Duration of P Mean Duration of All
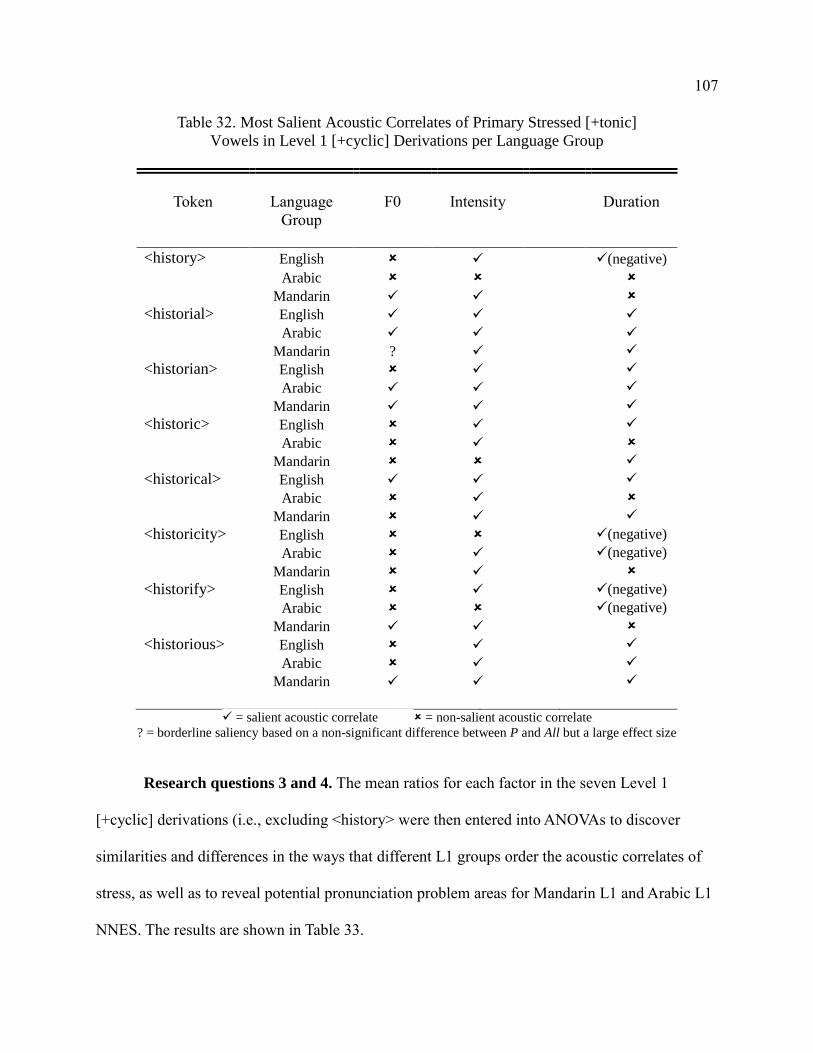
107
Table 32. Most Salient Acoustic Correlates of Primary Stressed [+tonic]
Vowels in Level 1 [+cyclic] Derivations per Language Group
Token
Language
Group
F0
Intensity
Duration
<history> English (negative)
Arabic
Mandarin
<historial> English
Arabic
Mandarin ?
<historian> English
Arabic
Mandarin
<historic> English
Arabic
Mandarin
<historical> English
Arabic
Mandarin
<historicity> English (negative)
Arabic (negative)
Mandarin
<historify> English (negative)
Arabic (negative)
Mandarin
<historious> English
Arabic
Mandarin
= salient acoustic correlate = non-salient acoustic correlate
? = borderline saliency based on a non-significant difference between P and All but a large effect size
Research questions 3 and 4. The mean ratios for each factor in the seven Level 1
[+cyclic] derivations (i.e., excluding <history> were then entered into ANOVAs to discover
similarities and differences in the ways that different L1 groups order the acoustic correlates of
stress, as well as to reveal potential pronunciation problem areas for Mandarin L1 and Arabic L1
NNES. The results are shown in Table 33.
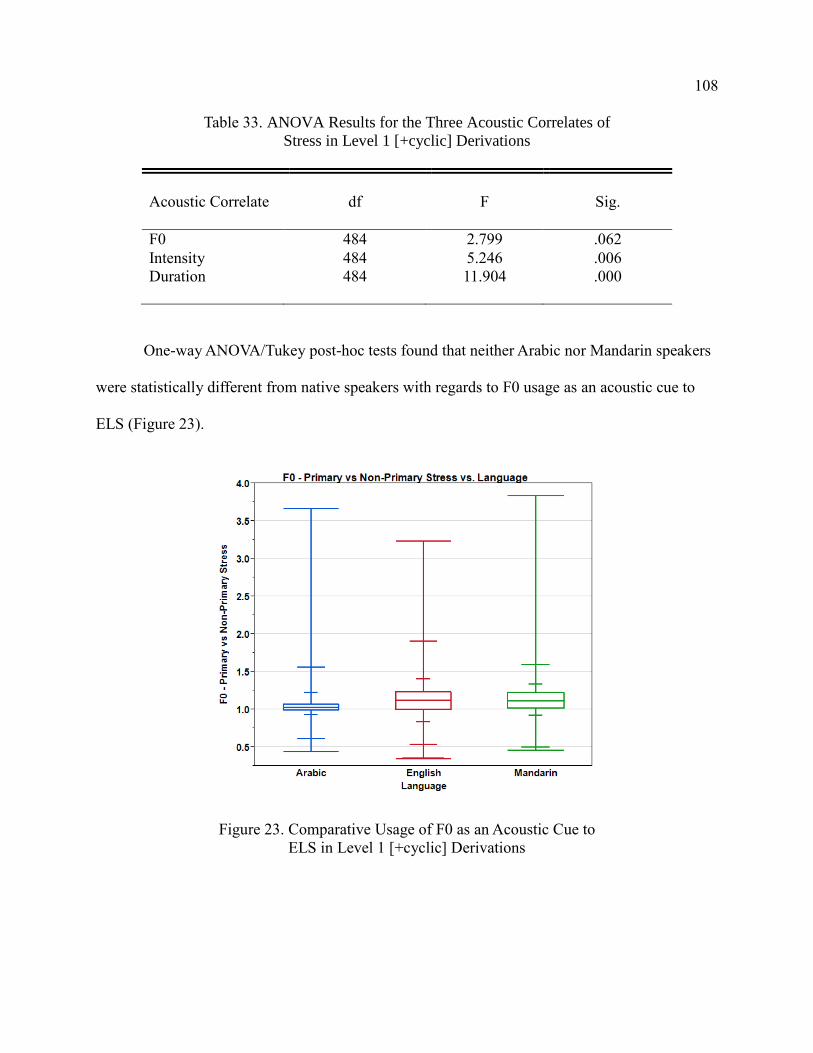
108
Table 33. ANOVA Results for the Three Acoustic Correlates of
Stress in Level 1 [+cyclic] Derivations
Acoustic Correlate
df
F
Sig.
F0 484 2.799 .062
Intensity 484 5.246 .006
Duration
484 11.904 .000
One-way ANOVA/Tukey post-hoc tests found that neither Arabic nor Mandarin speakers
were statistically different from native speakers with regards to F0 usage as an acoustic cue to
ELS (Figure 23).
Figure 23. Comparative Usage of F0 as an Acoustic Cue to
ELS in Level 1 [+cyclic] Derivations
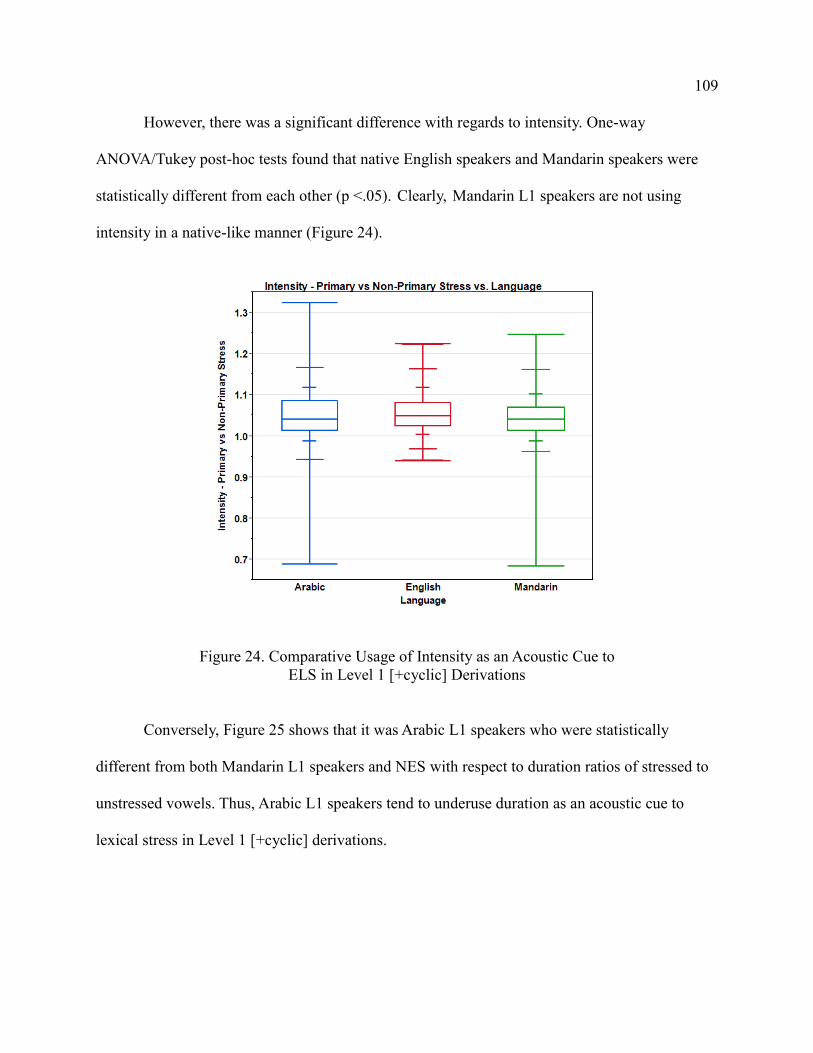
109
However, there was a significant difference with regards to intensity. One-way
ANOVA/Tukey post-hoc tests found that native English speakers and Mandarin speakers were
statistically different from each other (p <.05). Clearly, Mandarin L1 speakers are not using
intensity in a native-like manner (Figure 24).
Figure 24. Comparative Usage of Intensity as an Acoustic Cue to
ELS in Level 1 [+cyclic] Derivations
Conversely, Figure 25 shows that it was Arabic L1 speakers who were statistically
different from both Mandarin L1 speakers and NES with respect to duration ratios of stressed to
unstressed vowels. Thus, Arabic L1 speakers tend to underuse duration as an acoustic cue to
lexical stress in Level 1 [+cyclic] derivations.
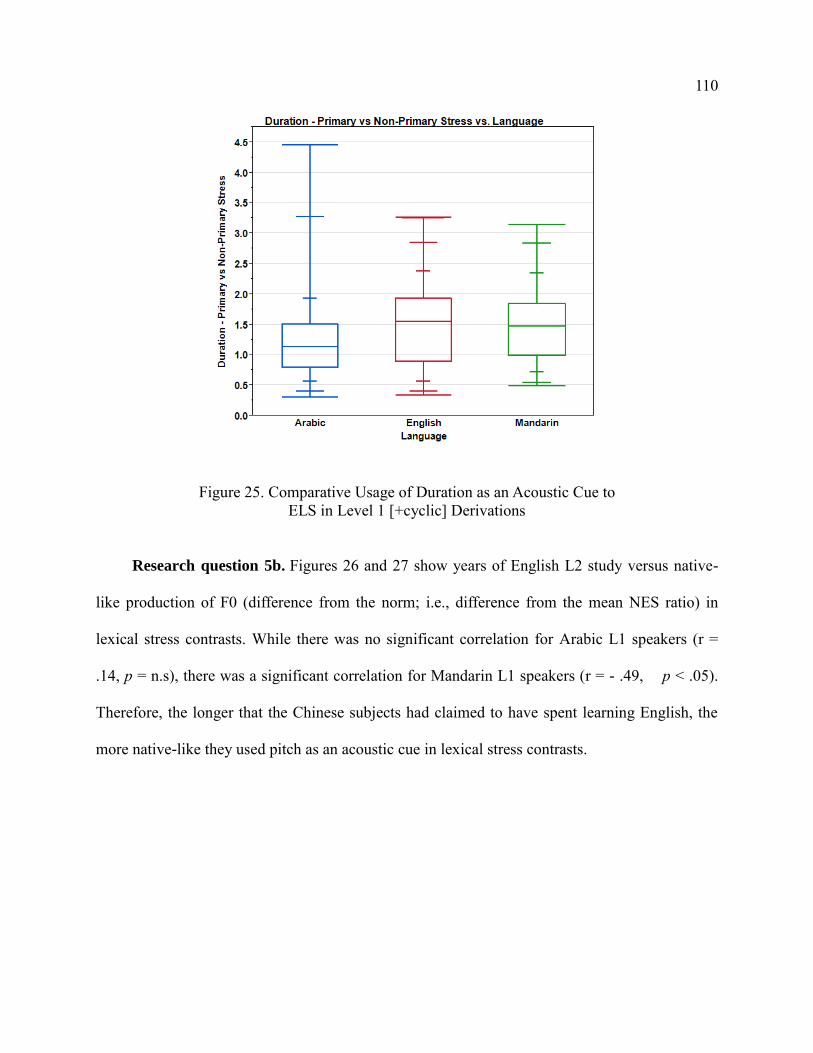
110
Figure 25. Comparative Usage of Duration as an Acoustic Cue to
ELS in Level 1 [+cyclic] Derivations
Research question 5b. Figures 26 and 27 show years of English L2 study versus native-
like production of F0 (difference from the norm; i.e., difference from the mean NES ratio) in
lexical stress contrasts. While there was no significant correlation for Arabic L1 speakers (r =
.14, p = n.s), there was a significant correlation for Mandarin L1 speakers (r = - .49, p < .05).
Therefore, the longer that the Chinese subjects had claimed to have spent learning English, the
more native-like they used pitch as an acoustic cue in lexical stress contrasts.
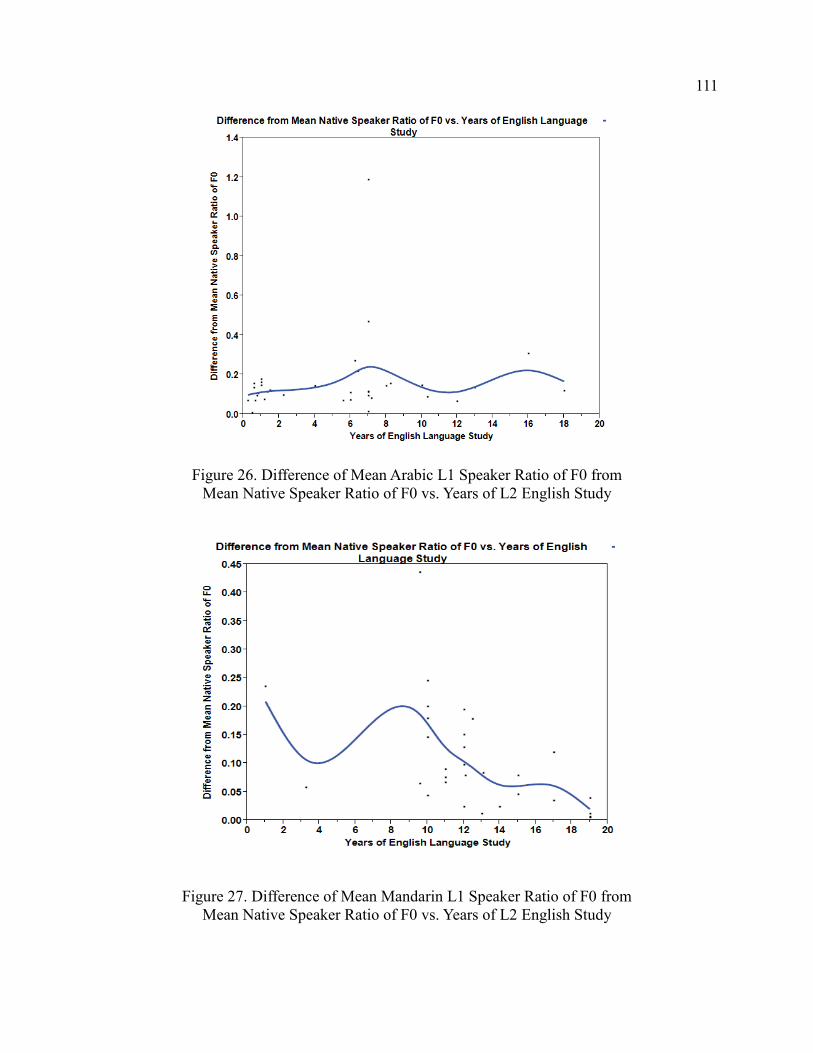
111
Figure 26. Difference of Mean Arabic L1 Speaker Ratio of F0 from
Mean Native Speaker Ratio of F0 vs. Years of L2 English Study
Figure 27. Difference of Mean Mandarin L1 Speaker Ratio of F0 from
Mean Native Speaker Ratio of F0 vs. Years of L2 English Study
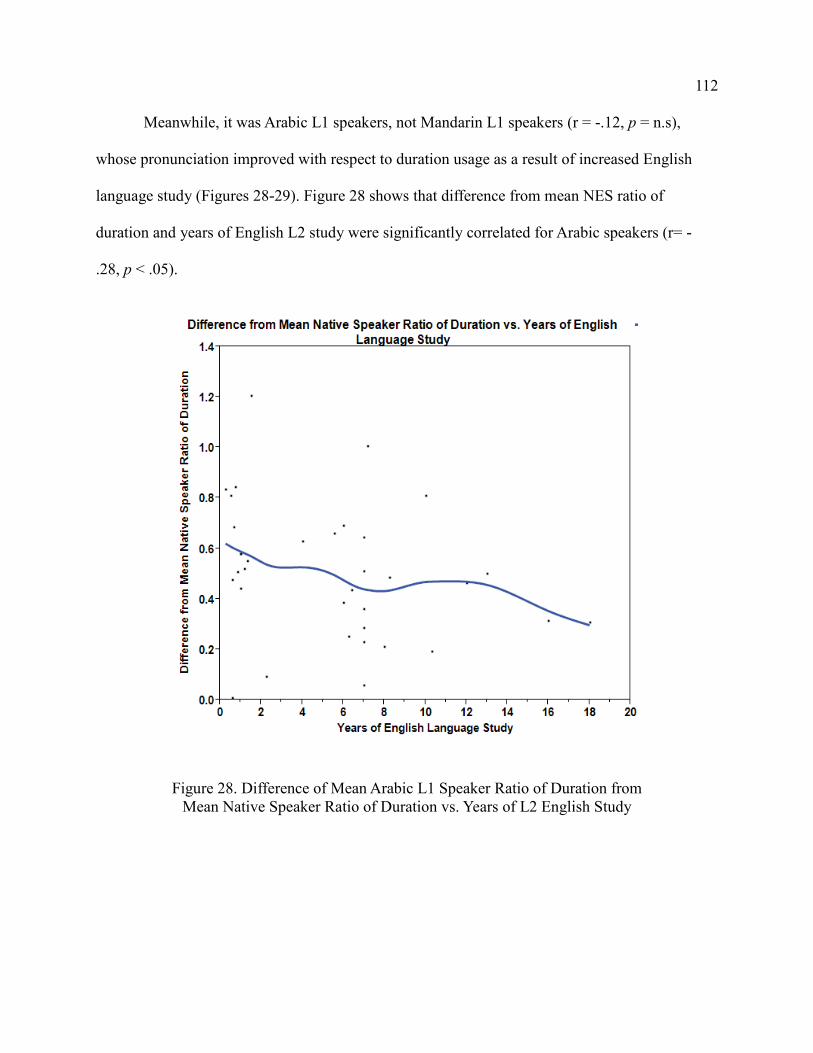
112
Meanwhile, it was Arabic L1 speakers, not Mandarin L1 speakers (r = -.12, p = n.s),
whose pronunciation improved with respect to duration usage as a result of increased English
language study (Figures 28-29). Figure 28 shows that difference from mean NES ratio of
duration and years of English L2 study were significantly correlated for Arabic speakers (r= -
.28, p < .05).
Figure 28. Difference of Mean Arabic L1 Speaker Ratio of Duration from
Mean Native Speaker Ratio of Duration vs. Years of L2 English Study
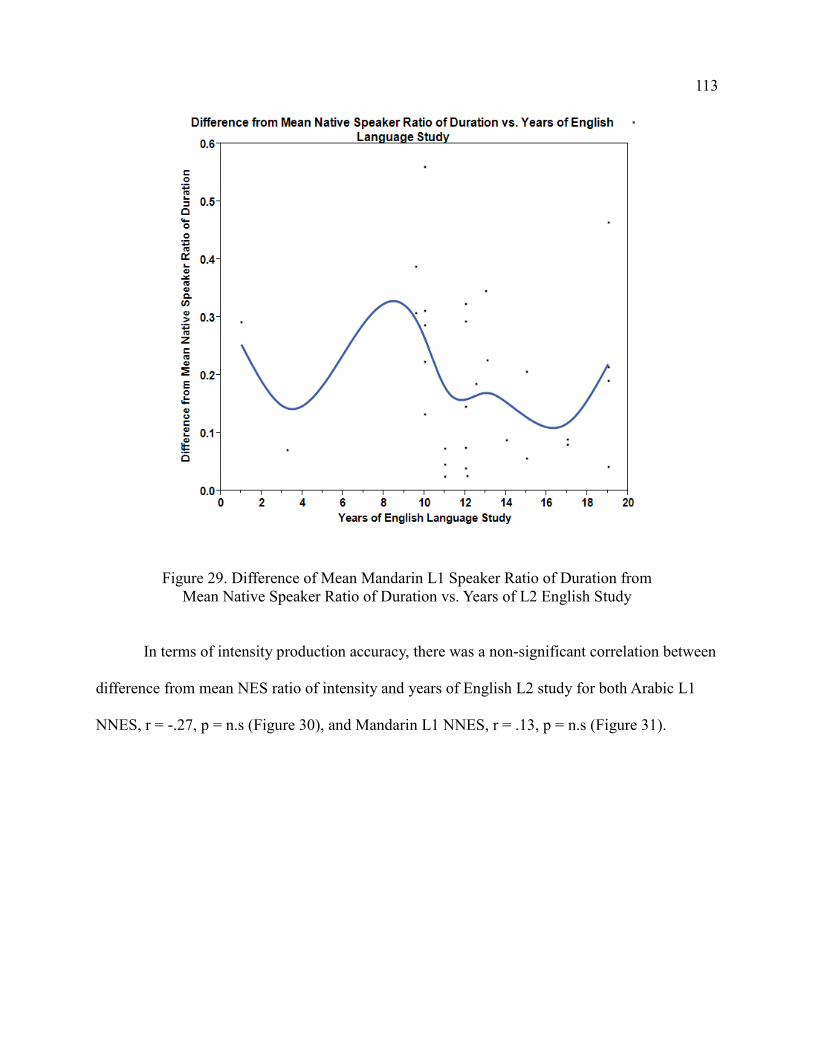
113
Figure 29. Difference of Mean Mandarin L1 Speaker Ratio of Duration from
Mean Native Speaker Ratio of Duration vs. Years of L2 English Study
In terms of intensity production accuracy, there was a non-significant correlation between
difference from mean NES ratio of intensity and years of English L2 study for both Arabic L1
NNES, r = -.27, p = n.s (Figure 30), and Mandarin L1 NNES, r = .13, p = n.s (Figure 31).
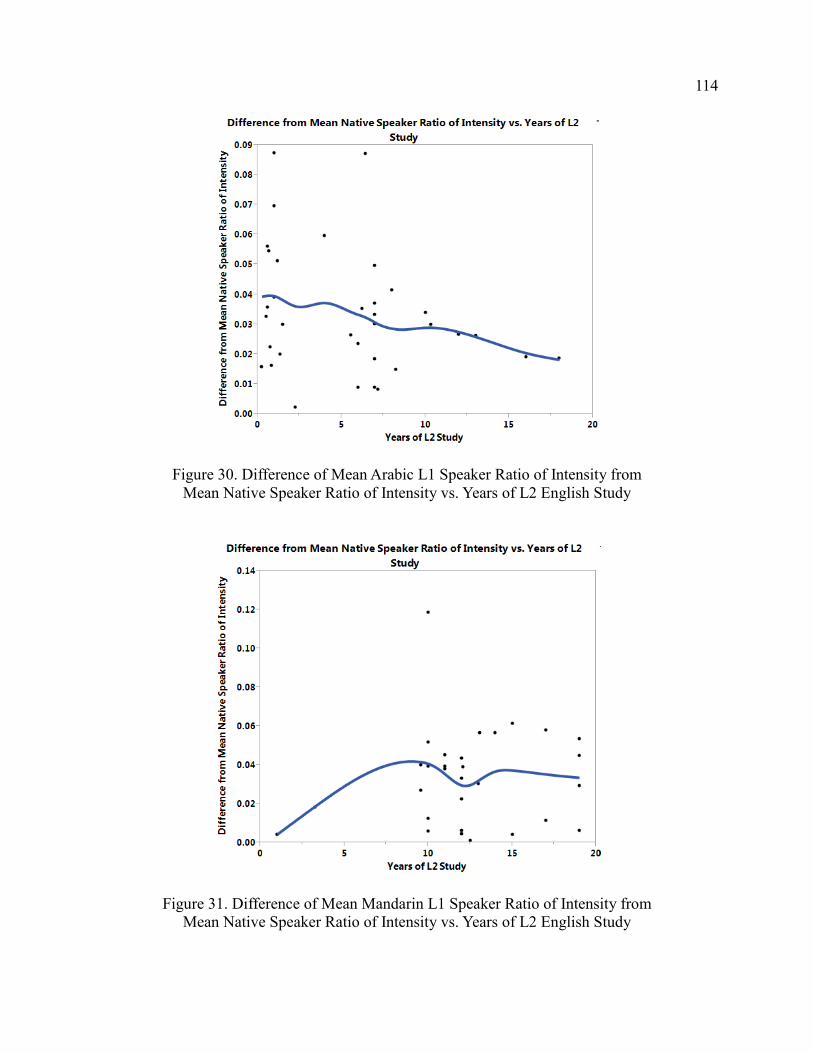
114
Figure 30. Difference of Mean Arabic L1 Speaker Ratio of Intensity from
Mean Native Speaker Ratio of Intensity vs. Years of L2 English Study
Figure 31. Difference of Mean Mandarin L1 Speaker Ratio of Intensity from
Mean Native Speaker Ratio of Intensity vs. Years of L2 English Study
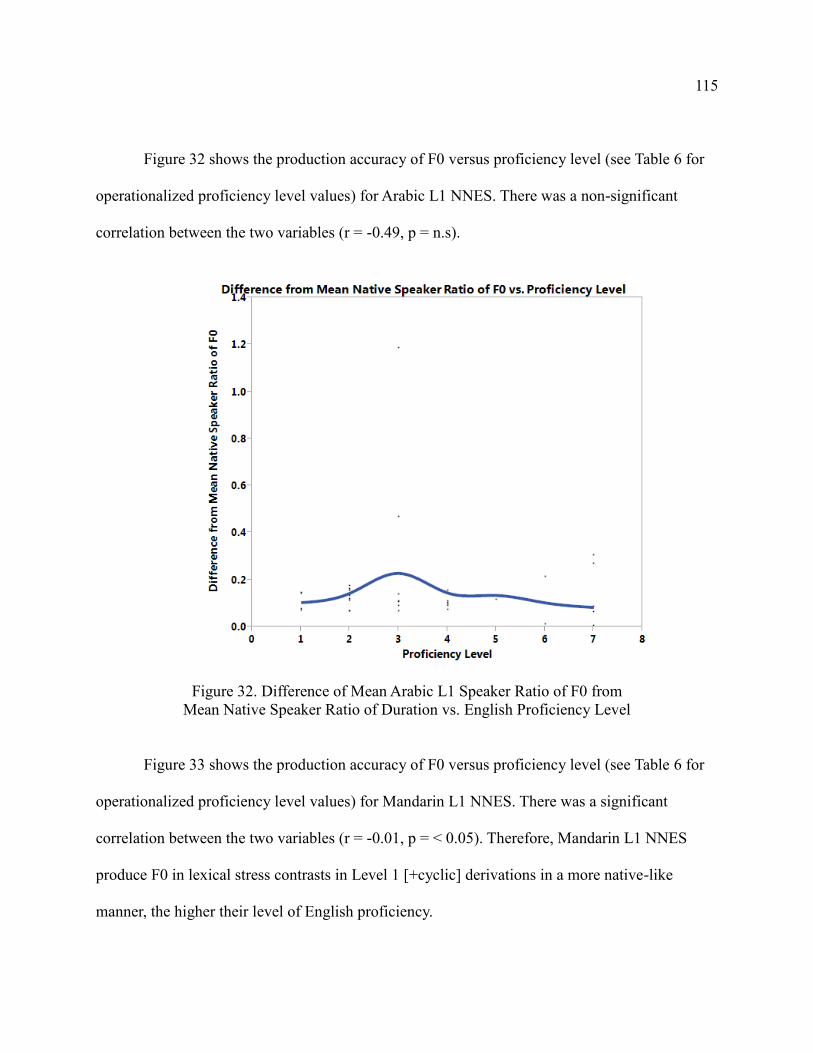
115
Figure 32 shows the production accuracy of F0 versus proficiency level (see Table 6 for
operationalized proficiency level values) for Arabic L1 NNES. There was a non-significant
correlation between the two variables (r = -0.49, p = n.s).
Figure 32. Difference of Mean Arabic L1 Speaker Ratio of F0 from
Mean Native Speaker Ratio of Duration vs. English Proficiency Level
Figure 33 shows the production accuracy of F0 versus proficiency level (see Table 6 for
operationalized proficiency level values) for Mandarin L1 NNES. There was a significant
correlation between the two variables (r = -0.01, p = < 0.05). Therefore, Mandarin L1 NNES
produce F0 in lexical stress contrasts in Level 1 [+cyclic] derivations in a more native-like
manner, the higher their level of English proficiency.
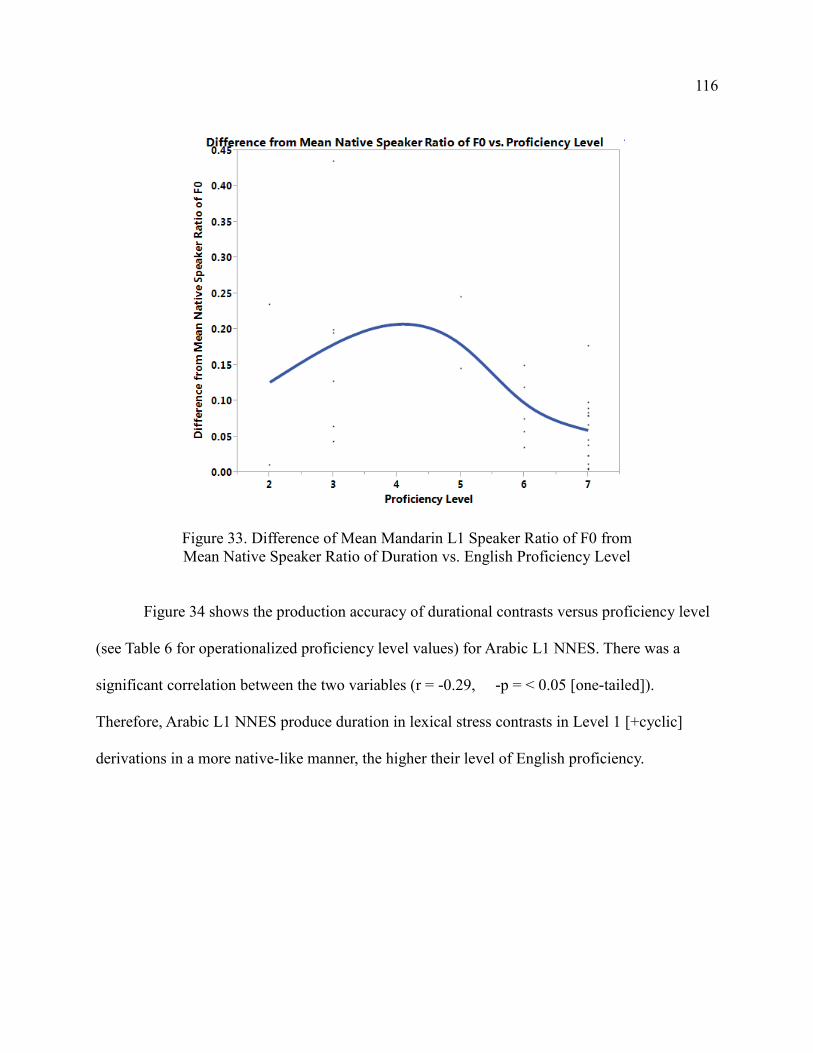
116
Figure 33. Difference of Mean Mandarin L1 Speaker Ratio of F0 from
Mean Native Speaker Ratio of Duration vs. English Proficiency Level
Figure 34 shows the production accuracy of durational contrasts versus proficiency level
(see Table 6 for operationalized proficiency level values) for Arabic L1 NNES. There was a
significant correlation between the two variables (r = -0.29, -p = < 0.05 [one-tailed]).
Therefore, Arabic L1 NNES produce duration in lexical stress contrasts in Level 1 [+cyclic]
derivations in a more native-like manner, the higher their level of English proficiency.
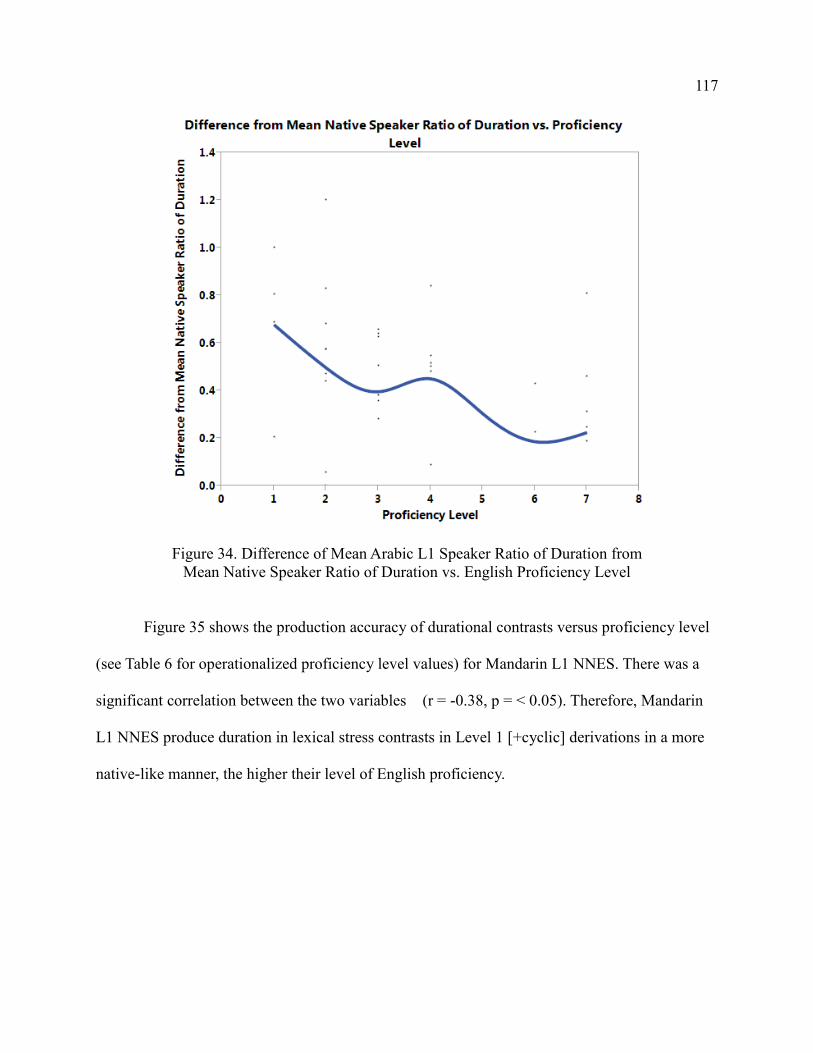
117
Figure 34. Difference of Mean Arabic L1 Speaker Ratio of Duration from
Mean Native Speaker Ratio of Duration vs. English Proficiency Level
Figure 35 shows the production accuracy of durational contrasts versus proficiency level
(see Table 6 for operationalized proficiency level values) for Mandarin L1 NNES. There was a
significant correlation between the two variables (r = -0.38, p = < 0.05). Therefore, Mandarin
L1 NNES produce duration in lexical stress contrasts in Level 1 [+cyclic] derivations in a more
native-like manner, the higher their level of English proficiency.
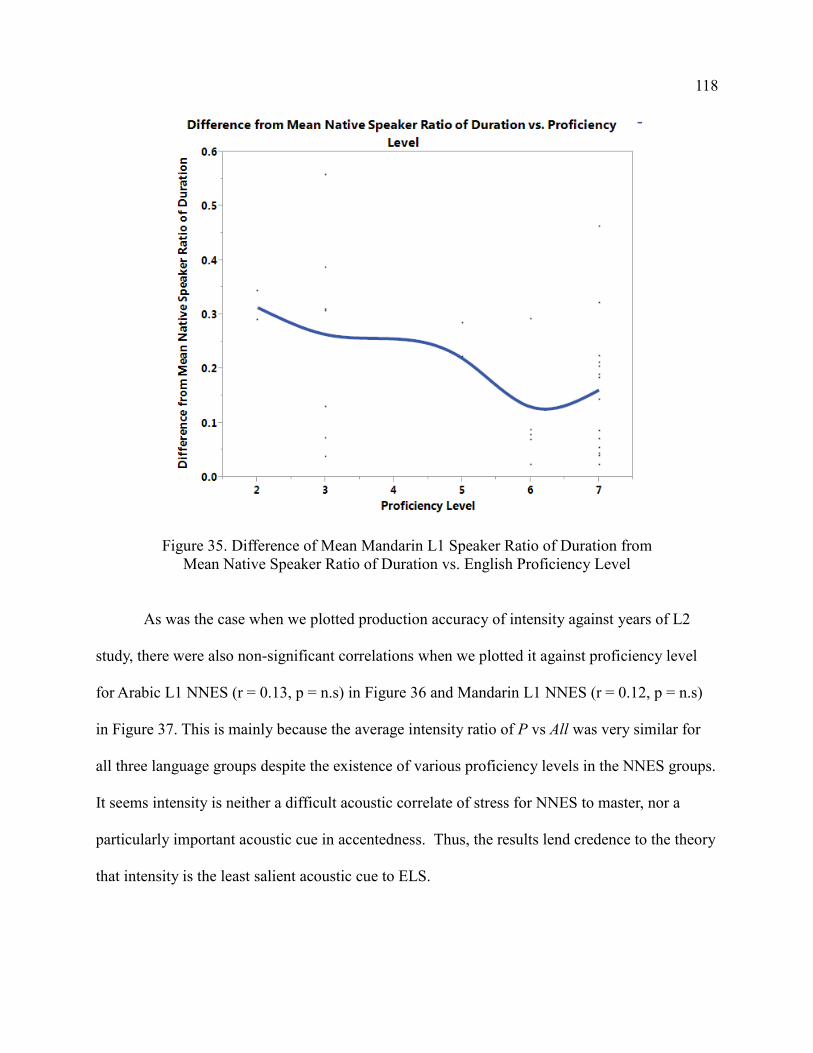
118
Figure 35. Difference of Mean Mandarin L1 Speaker Ratio of Duration from
Mean Native Speaker Ratio of Duration vs. English Proficiency Level
As was the case when we plotted production accuracy of intensity against years of L2
study, there were also non-significant correlations when we plotted it against proficiency level
for Arabic L1 NNES (r = 0.13, p = n.s) in Figure 36 and Mandarin L1 NNES (r = 0.12, p = n.s)
in Figure 37. This is mainly because the average intensity ratio of P vs All was very similar for
all three language groups despite the existence of various proficiency levels in the NNES groups.
It seems intensity is neither a difficult acoustic correlate of stress for NNES to master, nor a
particularly important acoustic cue in accentedness. Thus, the results lend credence to the theory
that intensity is the least salient acoustic cue to ELS.
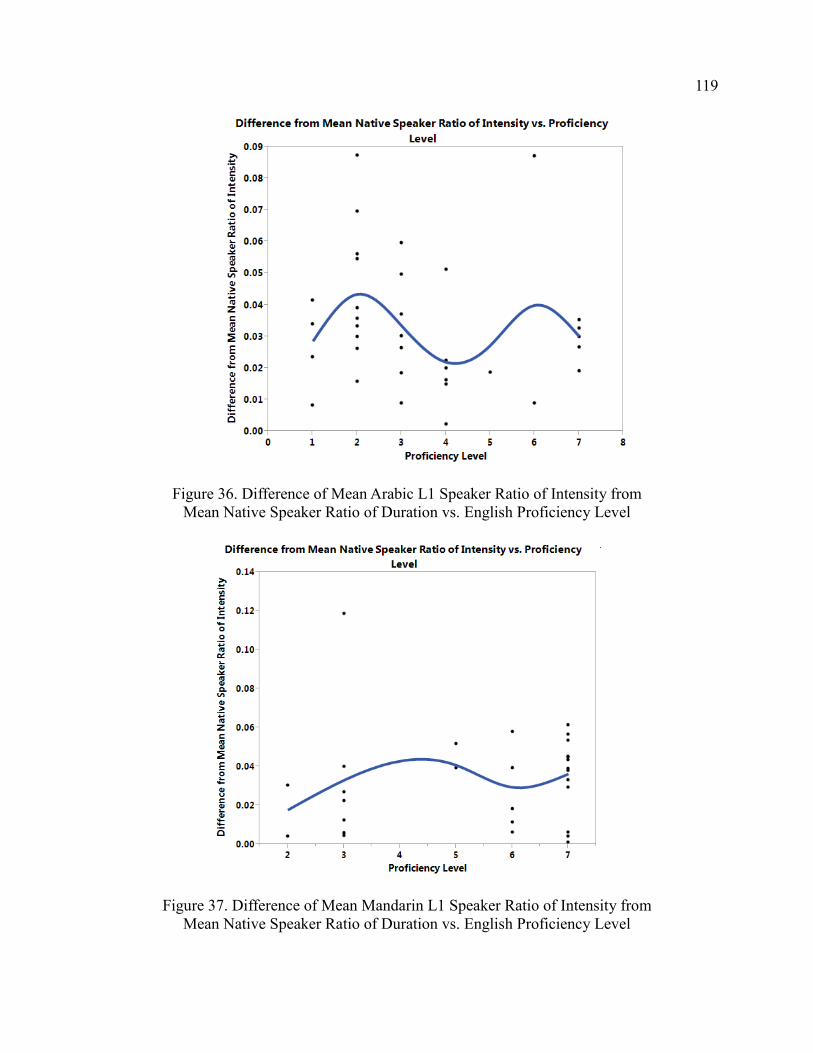
119
Figure 36. Difference of Mean Arabic L1 Speaker Ratio of Intensity from
Mean Native Speaker Ratio of Duration vs. English Proficiency Level
Figure 37. Difference of Mean Mandarin L1 Speaker Ratio of Intensity from
Mean Native Speaker Ratio of Duration vs. English Proficiency Level
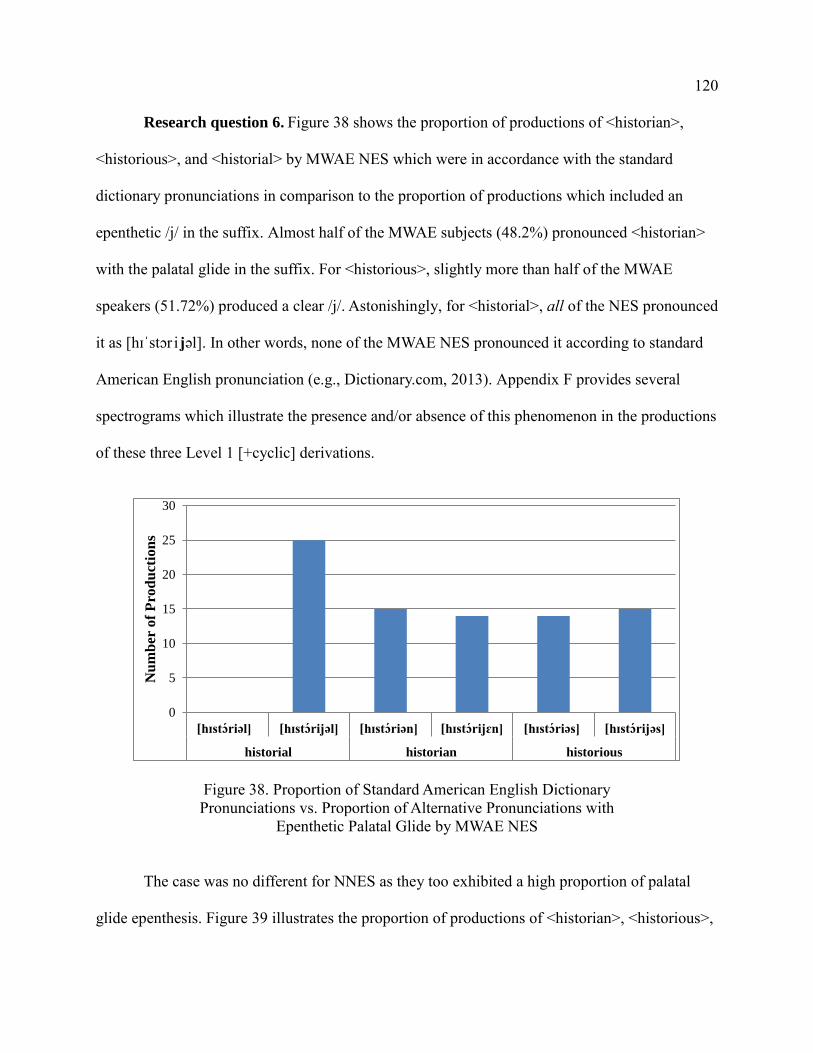
120
Research question 6. Figure 38 shows the proportion of productions of <historian>,
<historious>, and <historial> by MWAE NES which were in accordance with the standard
dictionary pronunciations in comparison to the proportion of productions which included an
epenthetic /j/ in the suffix. Almost half of the MWAE subjects (48.2%) pronounced <historian>
with the palatal glide in the suffix. For <historious>, slightly more than half of the MWAE
speakers (51.72%) produced a clear /j/. Astonishingly, for <historial>, all of the NES pronounced
it as [hɪˈstɔr i jəl]. In other words, none of the MWAE NES pronounced it according to standard
American English pronunciation (e.g., Dictionary.com, 2013). Appendix F provides several
spectrograms which illustrate the presence and/or absence of this phenomenon in the productions
of these three Level 1 [+cyclic] derivations.
Figure 38. Proportion of Standard American English Dictionary
Pronunciations vs. Proportion of Alternative Pronunciations with
Epenthetic Palatal Glide by MWAE NES
The case was no different for NNES as they too exhibited a high proportion of palatal
glide epenthesis. Figure 39 illustrates the proportion of productions of <historian>, <historious>,
0
5
10
15
20
25
30
[hɪstɔriəl] [hɪstɔrijəl] [hɪstɔriən] [hɪstɔrijɛn] [hɪstɔriəs] [hɪstɔrijəs]
historial historian historious
Nu
mb
er o
f P
rod
uct
ion
s
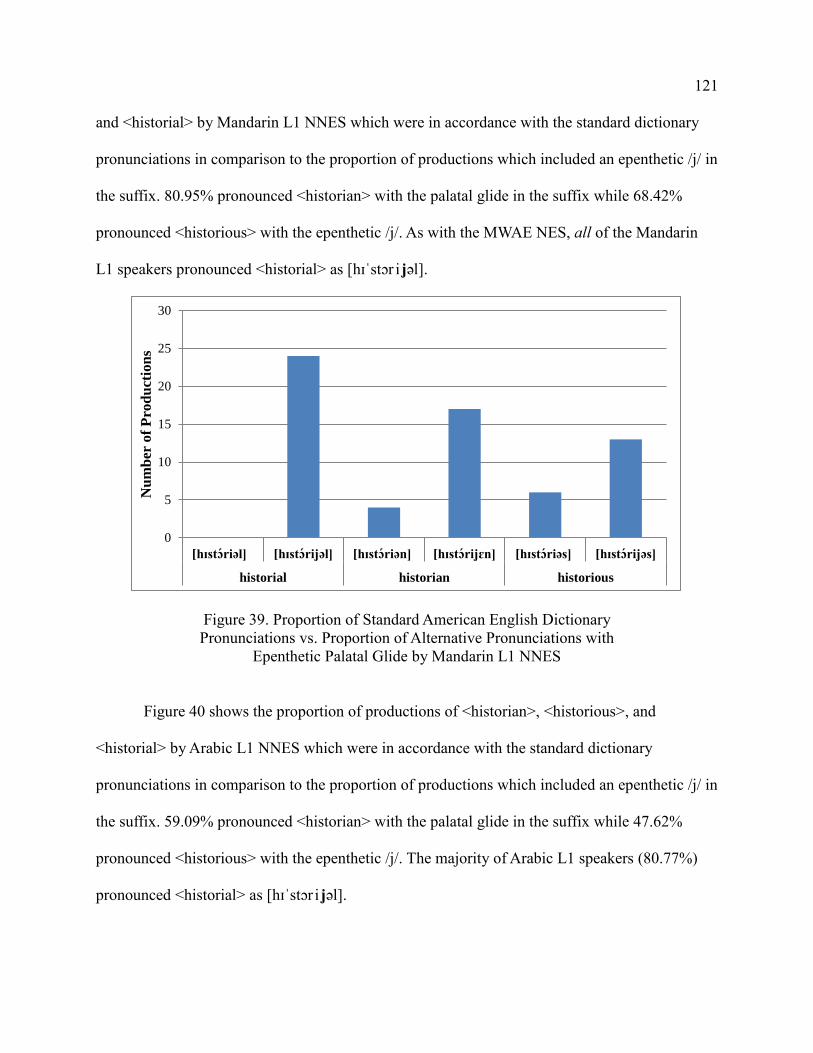
121
and <historial> by Mandarin L1 NNES which were in accordance with the standard dictionary
pronunciations in comparison to the proportion of productions which included an epenthetic /j/ in
the suffix. 80.95% pronounced <historian> with the palatal glide in the suffix while 68.42%
pronounced <historious> with the epenthetic /j/. As with the MWAE NES, all of the Mandarin
L1 speakers pronounced <historial> as [hɪˈstɔr i jəl].
Figure 39. Proportion of Standard American English Dictionary
Pronunciations vs. Proportion of Alternative Pronunciations with
Epenthetic Palatal Glide by Mandarin L1 NNES
Figure 40 shows the proportion of productions of <historian>, <historious>, and
<historial> by Arabic L1 NNES which were in accordance with the standard dictionary
pronunciations in comparison to the proportion of productions which included an epenthetic /j/ in
the suffix. 59.09% pronounced <historian> with the palatal glide in the suffix while 47.62%
pronounced <historious> with the epenthetic /j/. The majority of Arabic L1 speakers (80.77%)
pronounced <historial> as [hɪˈstɔr i jəl].
0
5
10
15
20
25
30
[hɪstɔriəl] [hɪstɔrijəl] [hɪstɔriən] [hɪstɔrijɛn] [hɪstɔriəs] [hɪstɔrijəs]
historial historian historious
Nu
mb
er o
f P
rod
uct
ion
s
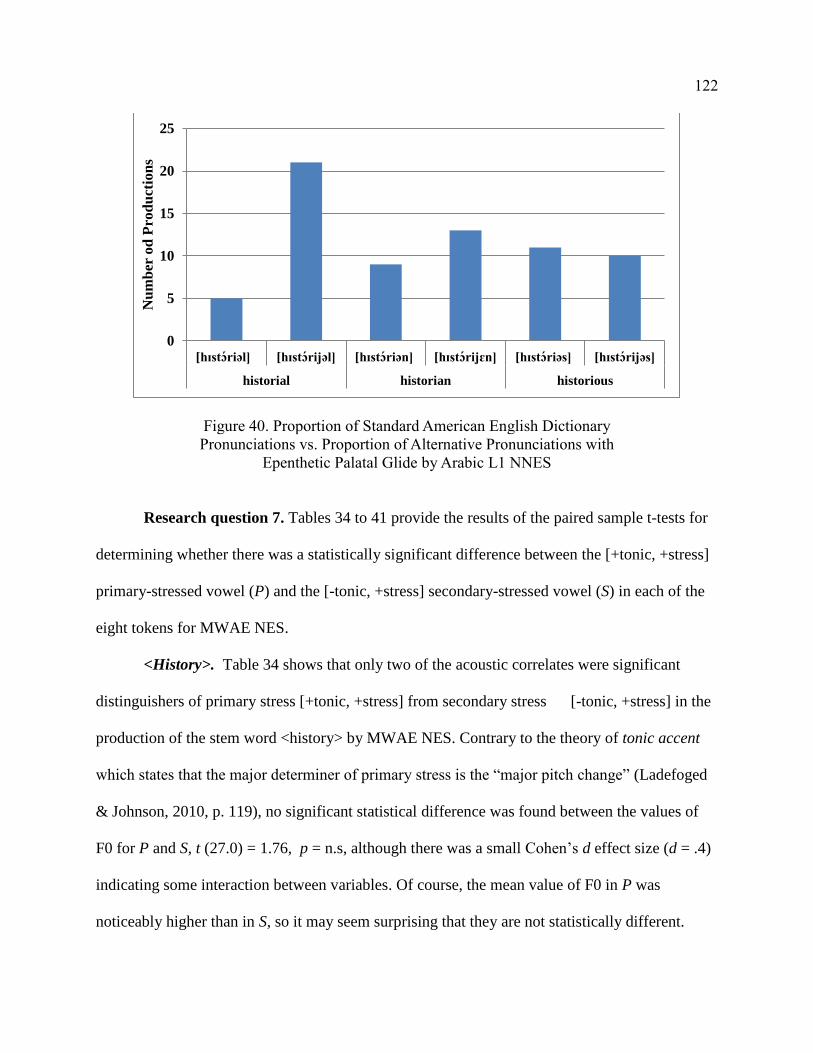
122
Figure 40. Proportion of Standard American English Dictionary
Pronunciations vs. Proportion of Alternative Pronunciations with
Epenthetic Palatal Glide by Arabic L1 NNES
Research question 7. Tables 34 to 41 provide the results of the paired sample t-tests for
determining whether there was a statistically significant difference between the [+tonic, +stress]
primary-stressed vowel (P) and the [-tonic, +stress] secondary-stressed vowel (S) in each of the
eight tokens for MWAE NES.
<History>. Table 34 shows that only two of the acoustic correlates were significant
distinguishers of primary stress [+tonic, +stress] from secondary stress [-tonic, +stress] in the
production of the stem word <history> by MWAE NES. Contrary to the theory of tonic accent
which states that the major determiner of primary stress is the “major pitch change” (Ladefoged
& Johnson, 2010, p. 119), no significant statistical difference was found between the values of
F0 for P and S, t (27.0) = 1.76, p = n.s, although there was a small Cohen’s d effect size (d = .4)
indicating some interaction between variables. Of course, the mean value of F0 in P was
noticeably higher than in S, so it may seem surprising that they are not statistically different.
0
5
10
15
20
25
[hɪstɔriəl] [hɪstɔrijəl] [hɪstɔriən] [hɪstɔrijɛn] [hɪstɔriəs] [hɪstɔrijəs]
historial historian historious
Nu
mb
er o
d P
rod
uct
ion
s
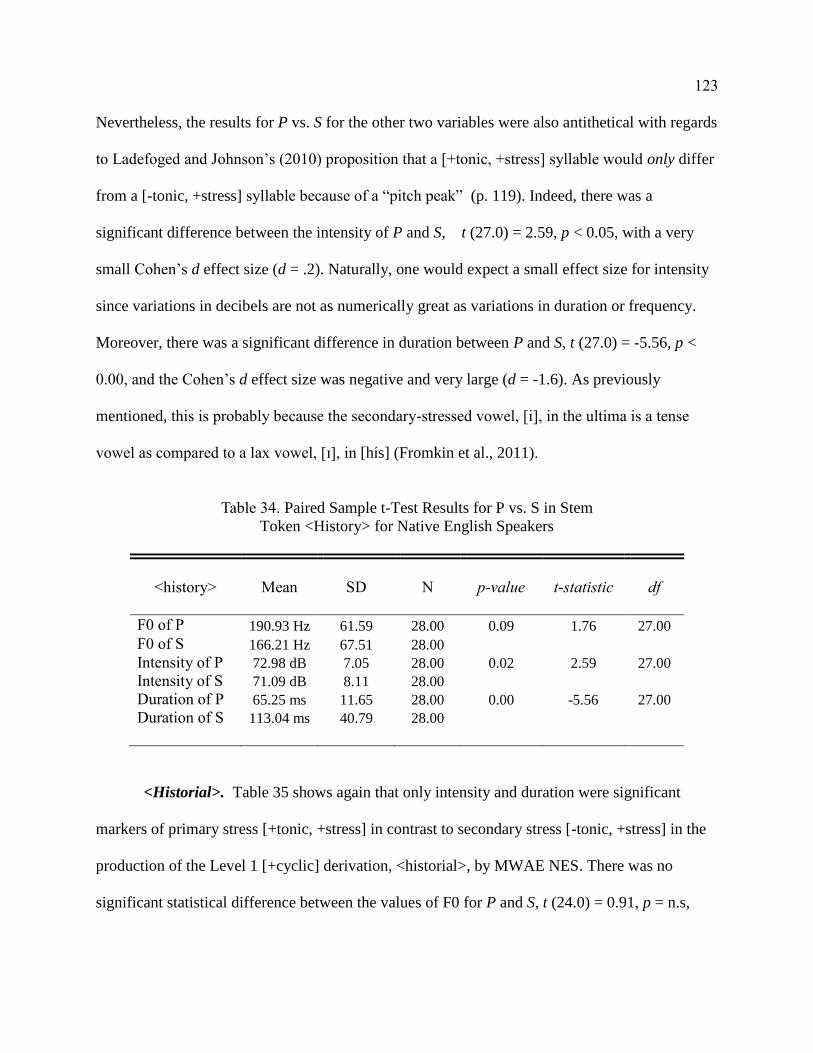
123
Nevertheless, the results for P vs. S for the other two variables were also antithetical with regards
to Ladefoged and Johnson’s (2010) proposition that a [+tonic, +stress] syllable would only differ
from a [-tonic, +stress] syllable because of a “pitch peak” (p. 119). Indeed, there was a
significant difference between the intensity of P and S, t (27.0) = 2.59, p < 0.05, with a very
small Cohen’s d effect size (d = .2). Naturally, one would expect a small effect size for intensity
since variations in decibels are not as numerically great as variations in duration or frequency.
Moreover, there was a significant difference in duration between P and S, t (27.0) = -5.56, p <
0.00, and the Cohen’s d effect size was negative and very large (d = -1.6). As previously
mentioned, this is probably because the secondary-stressed vowel, [i], in the ultima is a tense
vowel as compared to a lax vowel, [ɪ], in [hɪs] (Fromkin et al., 2011).
Table 34. Paired Sample t-Test Results for P vs. S in Stem
Token <History> for Native English Speakers
<history>
Mean
SD
N
p-value
t-statistic
df
F0 of P 190.93 Hz 61.59 28.00 0.09 1.76 27.00
F0 of S 166.21 Hz 67.51 28.00
Intensity of P 72.98 dB 7.05 28.00 0.02 2.59 27.00
Intensity of S 71.09 dB 8.11 28.00
Duration of P 65.25 ms 11.65 28.00 0.00 -5.56 27.00
Duration of S 113.04 ms 40.79 28.00
<Historial>. Table 35 shows again that only intensity and duration were significant
markers of primary stress [+tonic, +stress] in contrast to secondary stress [-tonic, +stress] in the
production of the Level 1 [+cyclic] derivation, <historial>, by MWAE NES. There was no
significant statistical difference between the values of F0 for P and S, t (24.0) = 0.91, p = n.s,
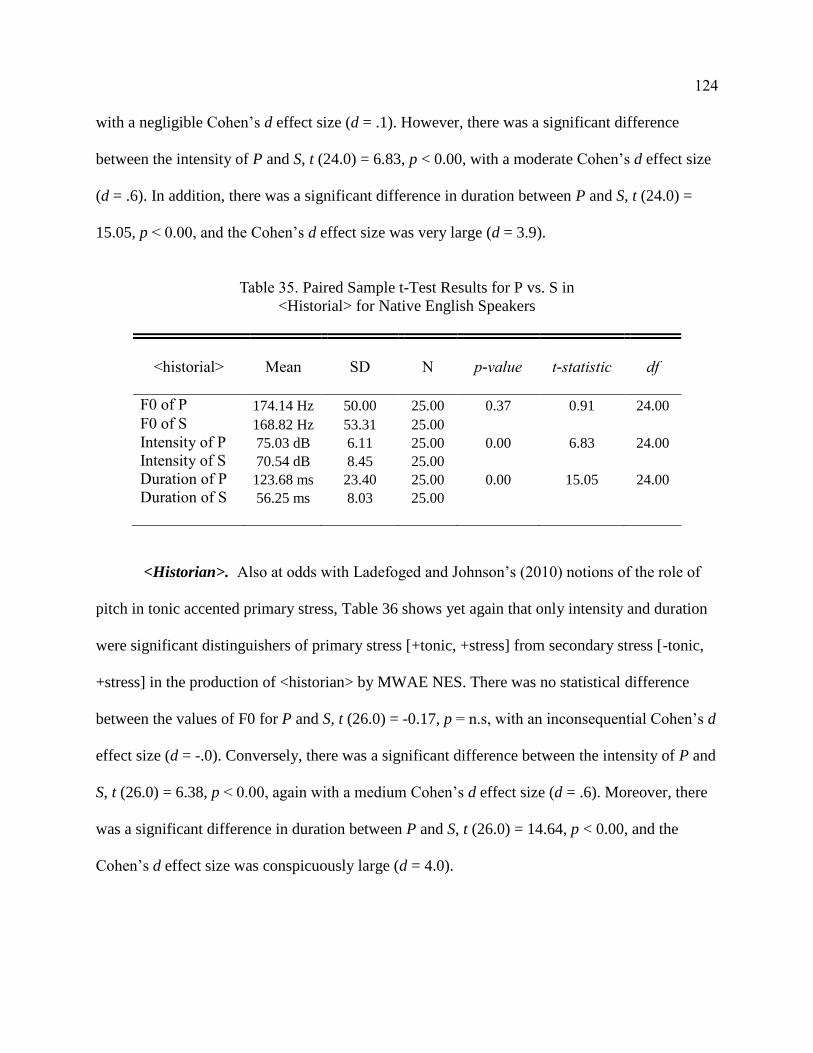
124
with a negligible Cohen’s d effect size (d = .1). However, there was a significant difference
between the intensity of P and S, t (24.0) = 6.83, p < 0.00, with a moderate Cohen’s d effect size
(d = .6). In addition, there was a significant difference in duration between P and S, t (24.0) =
15.05, p < 0.00, and the Cohen’s d effect size was very large (d = 3.9).
Table 35. Paired Sample t-Test Results for P vs. S in
<Historial> for Native English Speakers
<historial>
Mean
SD
N
p-value
t-statistic
df
F0 of P 174.14 Hz 50.00 25.00 0.37 0.91 24.00
F0 of S 168.82 Hz 53.31 25.00
Intensity of P 75.03 dB 6.11 25.00 0.00 6.83 24.00
Intensity of S 70.54 dB 8.45 25.00
Duration of P 123.68 ms 23.40 25.00 0.00 15.05 24.00
Duration of S 56.25 ms 8.03 25.00
<Historian>. Also at odds with Ladefoged and Johnson’s (2010) notions of the role of
pitch in tonic accented primary stress, Table 36 shows yet again that only intensity and duration
were significant distinguishers of primary stress [+tonic, +stress] from secondary stress [-tonic,
+stress] in the production of <historian> by MWAE NES. There was no statistical difference
between the values of F0 for P and S, t (26.0) = -0.17, p = n.s, with an inconsequential Cohen’s d
effect size (d = -.0). Conversely, there was a significant difference between the intensity of P and
S, t (26.0) = 6.38, p < 0.00, again with a medium Cohen’s d effect size (d = .6). Moreover, there
was a significant difference in duration between P and S, t (26.0) = 14.64, p < 0.00, and the
Cohen’s d effect size was conspicuously large (d = 4.0).
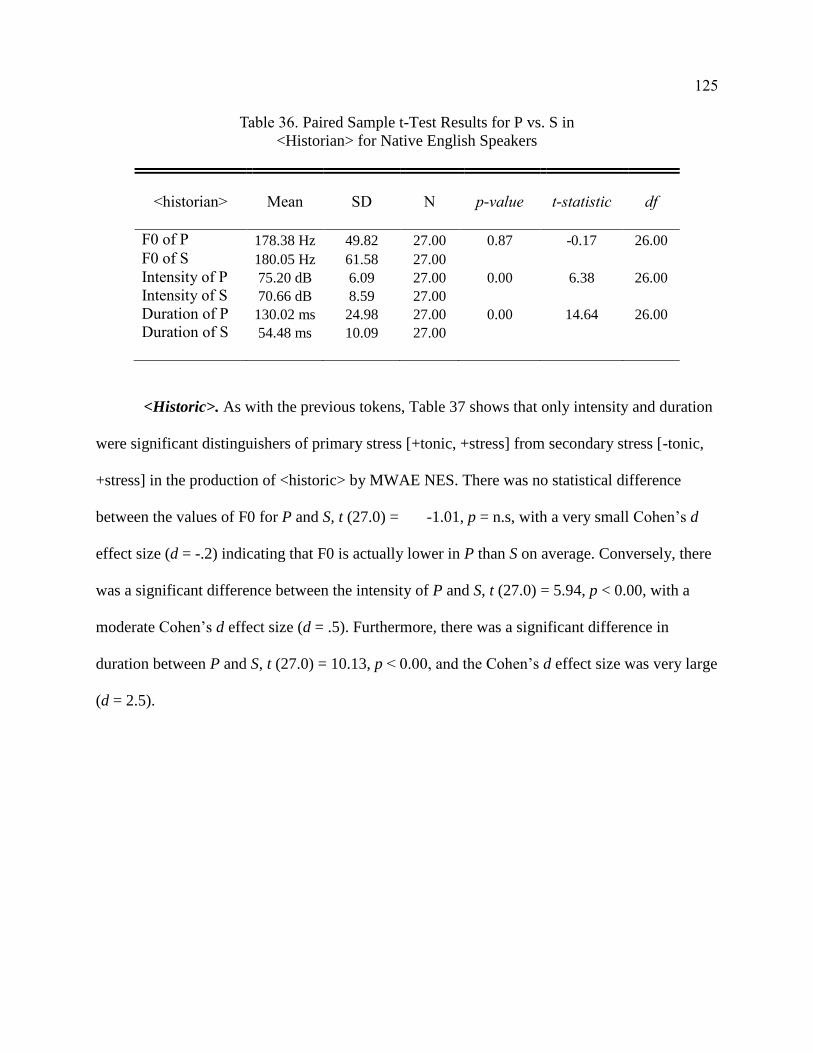
125
Table 36. Paired Sample t-Test Results for P vs. S in
<Historian> for Native English Speakers
<historian>
Mean
SD
N
p-value
t-statistic
df
F0 of P 178.38 Hz 49.82 27.00 0.87 -0.17 26.00
F0 of S 180.05 Hz 61.58 27.00
Intensity of P 75.20 dB 6.09 27.00 0.00 6.38 26.00
Intensity of S 70.66 dB 8.59 27.00
Duration of P 130.02 ms 24.98 27.00 0.00 14.64 26.00
Duration of S 54.48 ms 10.09 27.00
<Historic>. As with the previous tokens, Table 37 shows that only intensity and duration
were significant distinguishers of primary stress [+tonic, +stress] from secondary stress [-tonic,
+stress] in the production of <historic> by MWAE NES. There was no statistical difference
between the values of F0 for P and S, t (27.0) = -1.01, p = n.s, with a very small Cohen’s d
effect size (d = -.2) indicating that F0 is actually lower in P than S on average. Conversely, there
was a significant difference between the intensity of P and S, t (27.0) = 5.94, p < 0.00, with a
moderate Cohen’s d effect size (d = .5). Furthermore, there was a significant difference in
duration between P and S, t (27.0) = 10.13, p < 0.00, and the Cohen’s d effect size was very large
(d = 2.5).
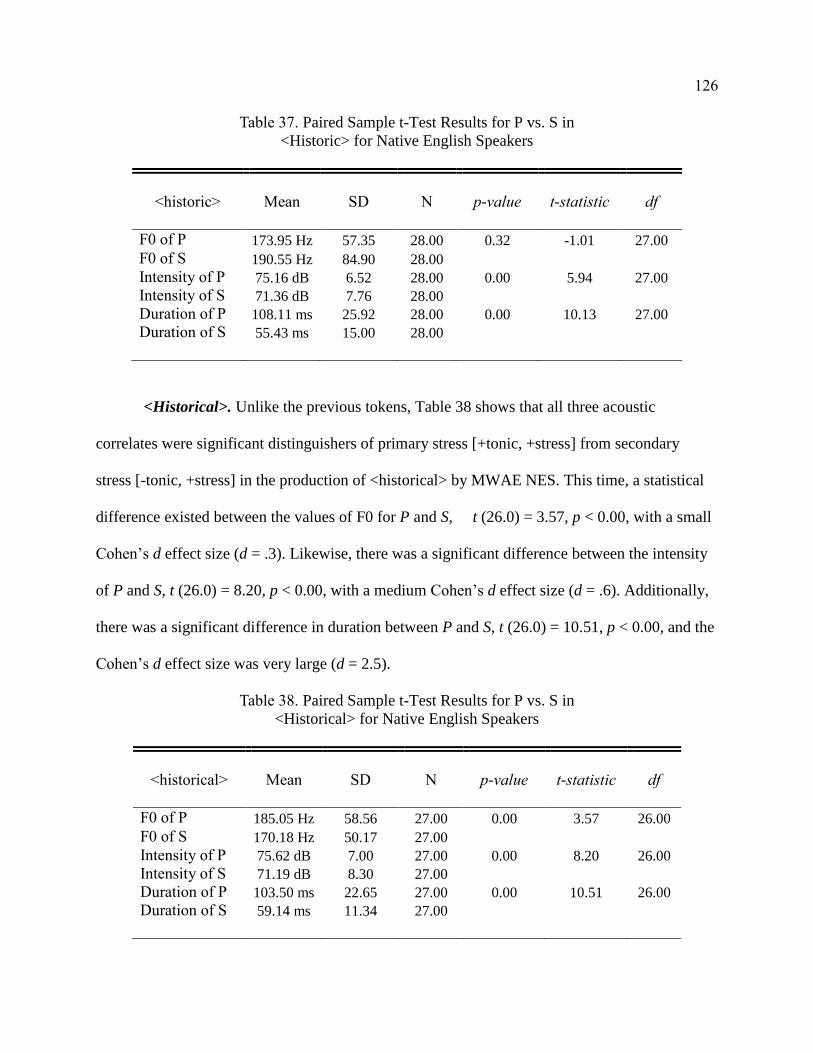
126
Table 37. Paired Sample t-Test Results for P vs. S in
<Historic> for Native English Speakers
<historic>
Mean
SD
N
p-value
t-statistic
df
F0 of P 173.95 Hz 57.35 28.00 0.32 -1.01 27.00
F0 of S 190.55 Hz 84.90 28.00
Intensity of P 75.16 dB 6.52 28.00 0.00 5.94 27.00
Intensity of S 71.36 dB 7.76 28.00
Duration of P 108.11 ms 25.92 28.00 0.00 10.13 27.00
Duration of S 55.43 ms 15.00 28.00
<Historical>. Unlike the previous tokens, Table 38 shows that all three acoustic
correlates were significant distinguishers of primary stress [+tonic, +stress] from secondary
stress [-tonic, +stress] in the production of <historical> by MWAE NES. This time, a statistical
difference existed between the values of F0 for P and S, t (26.0) = 3.57, p < 0.00, with a small
Cohen’s d effect size (d = .3). Likewise, there was a significant difference between the intensity
of P and S, t (26.0) = 8.20, p < 0.00, with a medium Cohen’s d effect size (d = .6). Additionally,
there was a significant difference in duration between P and S, t (26.0) = 10.51, p < 0.00, and the
Cohen’s d effect size was very large (d = 2.5).
Table 38. Paired Sample t-Test Results for P vs. S in
<Historical> for Native English Speakers
<historical>
Mean
SD
N
p-value
t-statistic
df
F0 of P 185.05 Hz 58.56 27.00 0.00 3.57 26.00
F0 of S 170.18 Hz 50.17 27.00
Intensity of P 75.62 dB 7.00 27.00 0.00 8.20 26.00
Intensity of S 71.19 dB 8.30 27.00
Duration of P 103.50 ms 22.65 27.00 0.00 10.51 26.00
Duration of S 59.14 ms 11.34 27.00
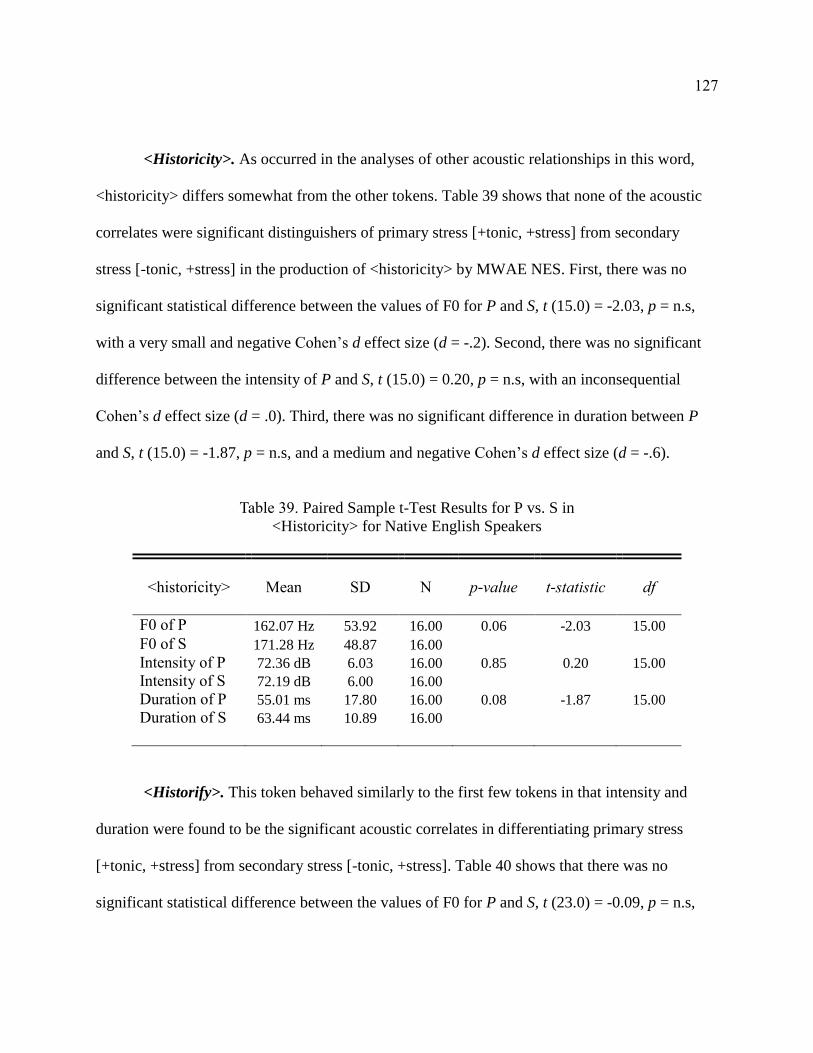
127
<Historicity>. As occurred in the analyses of other acoustic relationships in this word,
<historicity> differs somewhat from the other tokens. Table 39 shows that none of the acoustic
correlates were significant distinguishers of primary stress [+tonic, +stress] from secondary
stress [-tonic, +stress] in the production of <historicity> by MWAE NES. First, there was no
significant statistical difference between the values of F0 for P and S, t (15.0) = -2.03, p = n.s,
with a very small and negative Cohen’s d effect size (d = -.2). Second, there was no significant
difference between the intensity of P and S, t (15.0) = 0.20, p = n.s, with an inconsequential
Cohen’s d effect size (d = .0). Third, there was no significant difference in duration between P
and S, t (15.0) = -1.87, p = n.s, and a medium and negative Cohen’s d effect size (d = -.6).
Table 39. Paired Sample t-Test Results for P vs. S in
<Historicity> for Native English Speakers
<historicity>
Mean
SD
N
p-value
t-statistic
df
F0 of P 162.07 Hz 53.92 16.00 0.06 -2.03 15.00
F0 of S 171.28 Hz 48.87 16.00
Intensity of P 72.36 dB 6.03 16.00 0.85 0.20 15.00
Intensity of S 72.19 dB 6.00 16.00
Duration of P 55.01 ms 17.80 16.00 0.08 -1.87 15.00
Duration of S 63.44 ms 10.89 16.00
<Historify>. This token behaved similarly to the first few tokens in that intensity and
duration were found to be the significant acoustic correlates in differentiating primary stress
[+tonic, +stress] from secondary stress [-tonic, +stress]. Table 40 shows that there was no
significant statistical difference between the values of F0 for P and S, t (23.0) = -0.09, p = n.s,
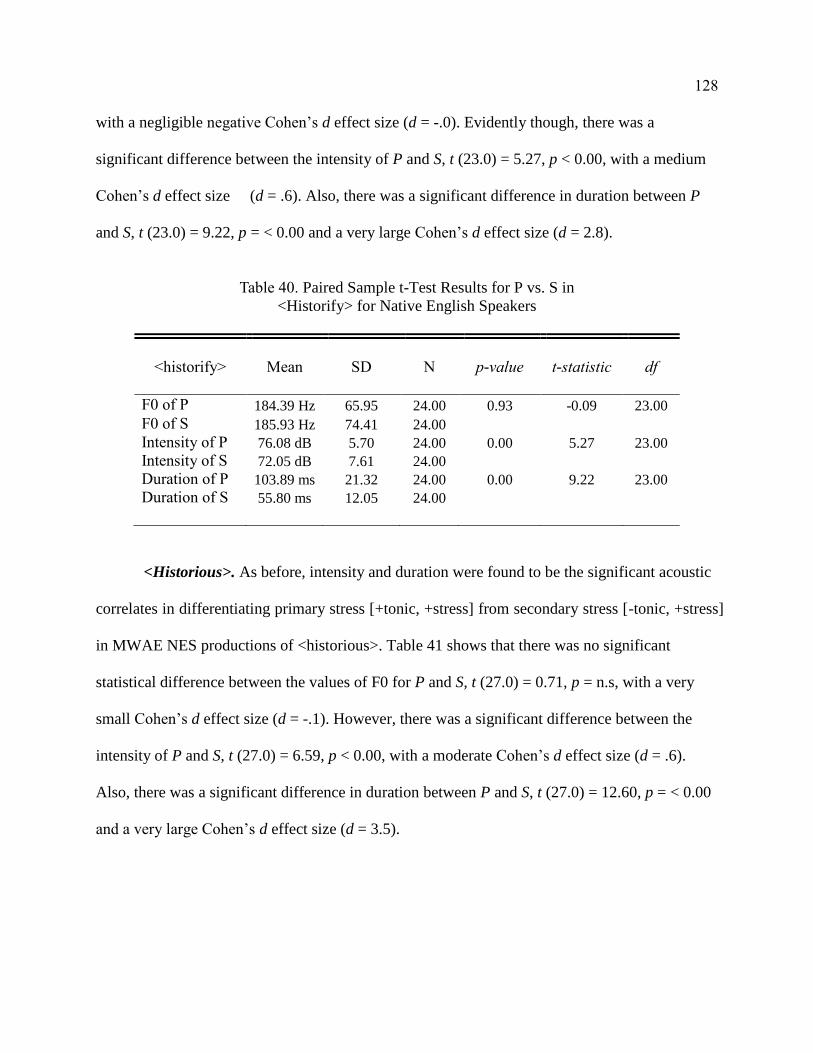
128
with a negligible negative Cohen’s d effect size (d = -.0). Evidently though, there was a
significant difference between the intensity of P and S, t (23.0) = 5.27, p < 0.00, with a medium
Cohen’s d effect size (d = .6). Also, there was a significant difference in duration between P
and S, t (23.0) = 9.22, p = < 0.00 and a very large Cohen’s d effect size (d = 2.8).
Table 40. Paired Sample t-Test Results for P vs. S in
<Historify> for Native English Speakers
<historify>
Mean
SD
N
p-value
t-statistic
df
F0 of P 184.39 Hz 65.95 24.00 0.93 -0.09 23.00
F0 of S 185.93 Hz 74.41 24.00
Intensity of P 76.08 dB 5.70 24.00 0.00 5.27 23.00
Intensity of S 72.05 dB 7.61 24.00
Duration of P 103.89 ms 21.32 24.00 0.00 9.22 23.00
Duration of S 55.80 ms 12.05 24.00
<Historious>. As before, intensity and duration were found to be the significant acoustic
correlates in differentiating primary stress [+tonic, +stress] from secondary stress [-tonic, +stress]
in MWAE NES productions of <historious>. Table 41 shows that there was no significant
statistical difference between the values of F0 for P and S, t (27.0) = 0.71, p = n.s, with a very
small Cohen’s d effect size (d = -.1). However, there was a significant difference between the
intensity of P and S, t (27.0) = 6.59, p < 0.00, with a moderate Cohen’s d effect size (d = .6).
Also, there was a significant difference in duration between P and S, t (27.0) = 12.60, p = < 0.00
and a very large Cohen’s d effect size (d = 3.5).
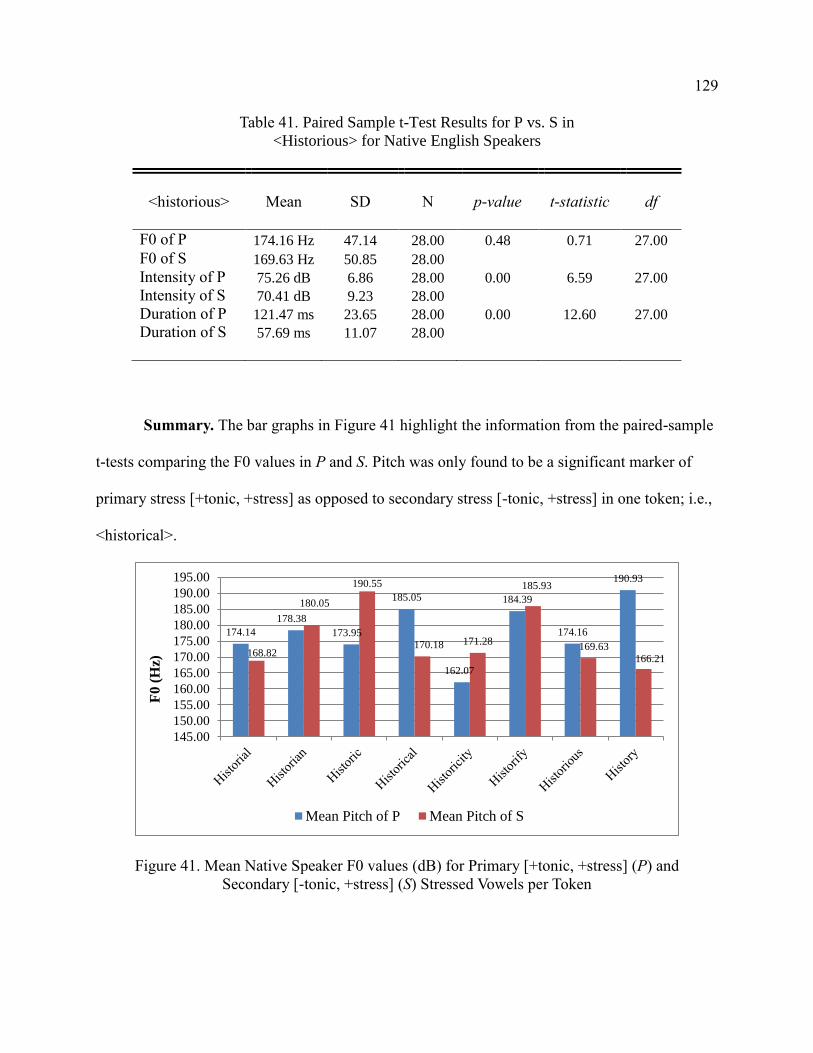
129
Table 41. Paired Sample t-Test Results for P vs. S in
<Historious> for Native English Speakers
<historious>
Mean
SD
N
p-value
t-statistic
df
F0 of P 174.16 Hz 47.14 28.00 0.48 0.71 27.00
F0 of S 169.63 Hz 50.85 28.00
Intensity of P 75.26 dB 6.86 28.00 0.00 6.59 27.00
Intensity of S 70.41 dB 9.23 28.00
Duration of P 121.47 ms 23.65 28.00 0.00 12.60 27.00
Duration of S 57.69 ms 11.07 28.00
Summary. The bar graphs in Figure 41 highlight the information from the paired-sample
t-tests comparing the F0 values in P and S. Pitch was only found to be a significant marker of
primary stress [+tonic, +stress] as opposed to secondary stress [-tonic, +stress] in one token; i.e.,
<historical>.
Figure 41. Mean Native Speaker F0 values (dB) for Primary [+tonic, +stress] (P) and
Secondary [-tonic, +stress] (S) Stressed Vowels per Token
174.14
178.38
173.95
185.05
162.07
184.39
174.16
190.93
168.82
180.05
190.55
170.18 171.28
185.93
169.63
166.21
145.00
150.00
155.00
160.00
165.00
170.00
175.00
180.00
185.00
190.00
195.00
F0 (
Hz)
Mean Pitch of P Mean Pitch of S
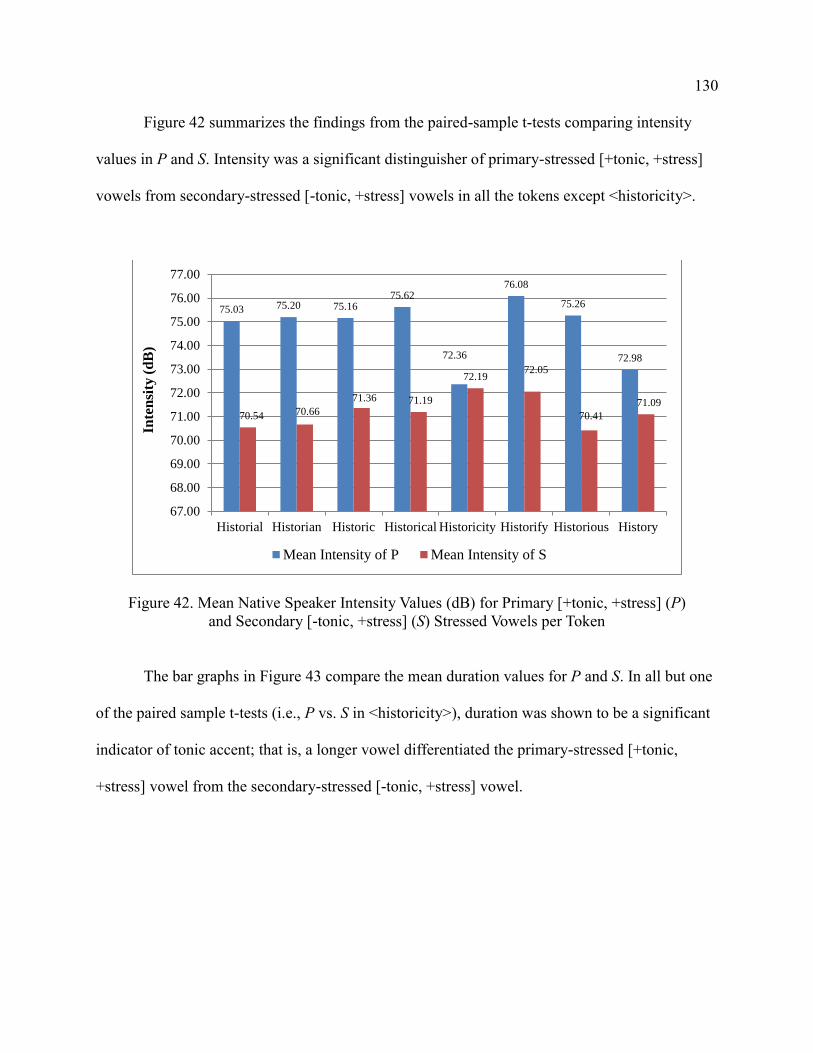
130
Figure 42 summarizes the findings from the paired-sample t-tests comparing intensity
values in P and S. Intensity was a significant distinguisher of primary-stressed [+tonic, +stress]
vowels from secondary-stressed [-tonic, +stress] vowels in all the tokens except <historicity>.
Figure 42. Mean Native Speaker Intensity Values (dB) for Primary [+tonic, +stress] (P)
and Secondary [-tonic, +stress] (S) Stressed Vowels per Token
The bar graphs in Figure 43 compare the mean duration values for P and S. In all but one
of the paired sample t-tests (i.e., P vs. S in <historicity>), duration was shown to be a significant
indicator of tonic accent; that is, a longer vowel differentiated the primary-stressed [+tonic,
+stress] vowel from the secondary-stressed [-tonic, +stress] vowel.
75.03 75.20 75.1675.62
72.36
76.08
75.26
72.98
70.54 70.66
71.36 71.19
72.1972.05
70.41
71.09
67.00
68.00
69.00
70.00
71.00
72.00
73.00
74.00
75.00
76.00
77.00
Historial Historian Historic Historical Historicity Historify Historious History
Inte
nsi
ty (
dB
)
Mean Intensity of P Mean Intensity of S
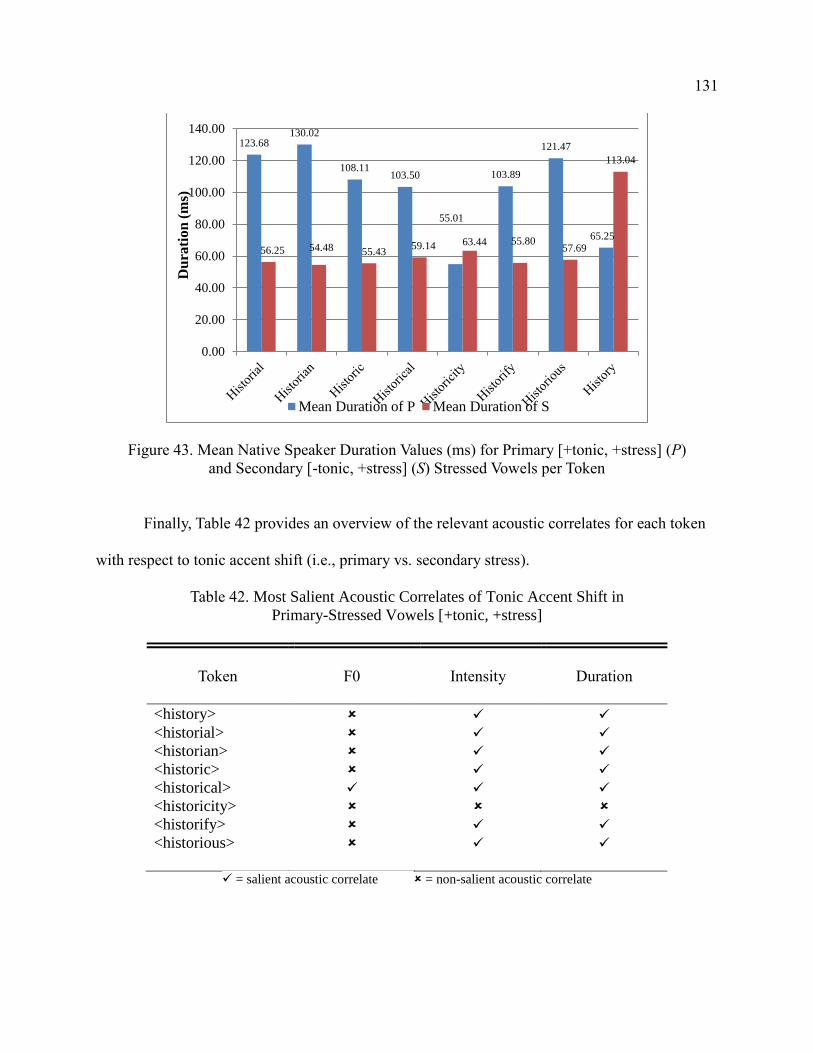
131
Figure 43. Mean Native Speaker Duration Values (ms) for Primary [+tonic, +stress] (P)
and Secondary [-tonic, +stress] (S) Stressed Vowels per Token
Finally, Table 42 provides an overview of the relevant acoustic correlates for each token
with respect to tonic accent shift (i.e., primary vs. secondary stress).
Table 42. Most Salient Acoustic Correlates of Tonic Accent Shift in
Primary-Stressed Vowels [+tonic, +stress]
Token
F0
Intensity
Duration
<history>
<historial>
<historian>
<historic>
<historical>
<historicity>
<historify>
<historious>
= salient acoustic correlate = non-salient acoustic correlate
123.68130.02
108.11103.50
55.01
103.89
121.47
65.25
56.25 54.48 55.4359.14 63.44 55.80
57.69
113.04
0.00
20.00
40.00
60.00
80.00
100.00
120.00
140.00
Du
rati
on
(m
s)
Mean Duration of P Mean Duration of S
132
Chapter V: Discussion
With the study’s research questions in mind, one can make the following observations.
1) Quantitative observation of stress-shifts in NES Level 1 [+cyclic] word
productions
In accordance with the pronunciations stated in common textbooks and dictionaries, at
least 90% of native speakers of MWAE placed the primary stress on the vowel preceding the
suffix in the Level 1 [+cyclic] derivations (Figure 9), and 97% (3% were miscellaneous
recording errors) placed it on the first vowel in <history> (Figure 10). For these accurate
productions, native speakers of MWAE on average produced primary-stressed vowels with
higher F0, greater intensity, and longer duration than the average of the rest of the vowels
combined as indicated by the positive vocalic relative stress ratios in Table 7. More conclusively,
Table 32 shows that for each token, at least one correlate had a significantly different value in the
primary-stressed vowel than in the mean of all the other vowels combined. In other words, the
primary vowel was prominent due to the contrast in one or more acoustic features, we can
conclude that stress-shifts in Level 1 [+cyclic] derivations can be observed quantitatively, at least
for the words used in this study.
It should be noted, however, that in some cases the length of the primary-stressed vowel
was significantly shorter than the mean of all the other vowels, namely in <history>,
<historicity>, and <historify>. When one examines these tokens, the reason for this anomaly
becomes clear: these three tokens all have a tense vowel, [i] (or diphthong in the case of
<historify>, in the ultima which is inherently longer than the lax vowel, [ɪ] (or [ɔ] in <historify>),
in the primary-stressed vowel. Although comparing the primary vowel with one reduced vowel
as in Lee and Cho’s investigations (2011) would indubitably yield positive durational contrasts,
133
the author maintains that the P vs. All method used in this study is beneficial. The reason being,
it highlights the fact that duration may not be a useful indicator of primary stress if the word
contains unstressed vowels which are [+tense]. Notwithstanding, the [+tonic,+stress] vowels in
<history> and <historify> were still positively prominent with regards to intensity, and thus,
quantifying stress-shifts only becomes problematic in <historicity> (see Table 32). It is the
contention of this researcher that this may be due to the pentasyllabic nature of this token, and
thus more research is needed on the acoustic correlates of English lexical stress (ELS) in five-
syllable words.
2) Salience Hierarchy of the Acoustic Correlates of Stress (SHACS)
Table 7 shows the mean vocalic relative stress ratios for duration, F0, and intensity which
are 1.61, 1.13, and 1.06, respectively. It is important to note that this information alone is not
sufficient to determine the SHACS in Level 1 [+cyclic] derivations since the ratios for each
acoustic cue are measured in different units (i.e., Hertz, decibels, and milliseconds) which are not
calibrated to be perceptively equivalent or directly comparable. For example, we often see a
larger Cohen’s d effect size for duration in P vs All than for intensity; however, this does not
mean that intensity is a less salient cue. Obviously, the amount of decibels, or fundamental
frequency for that matter, cannot increase by the same numerical value as say the difference in
milliseconds between a long and short vowel. As M. J. Munro elucidated, the auditory system
does not interpret pitch, intensity, and duration in such a linear fashion (personal communication,
September 21, 2013). That is, a small vocalic relative stress ratio of F0 may be perceptually
equivalent to a much larger ratio of stressed vs. unstressed vowel duration values. For these
reasons, a better way to identify the most salient acoustic cues to lexical stress might be to use
some form of acoustic correlate weighting scale which equates the different unit measurements
134
as in more robust stress analysis methods such as Linear Predictive Coding (LPC) (e.g., Silva,
Macedo, & Barreto, 2011) or other techniques which employ probabilistic algorithms (e.g., Freij
& Fallside, 1988). Unfortunately, delving into the realm of perceptual psychoacoustics is beyond
the scope of this paper.
Nevertheless, the results of the paired sample t-tests on the P vs. All analyses of MWAE
NES productions do provide a more convincing description of SHACS than the mean vocalic
relative stress ratios alone (Table 32). Antithetically, at least with regards to many of the leading
theories on SHACS (e.g., Adams & Munro, 1978; Fry, 1955, 1958), the results from this study
suggest that intensity is at least the most reliable, if not the most salient, cue to ELS. Indeed, the
intensity of the primary-stressed [+tonic, +stress] vowel was statistically greater than the mean
intensity of the non-primary [-tonic, +stress] vowels in all eight tokens (Table 32). Based on
frequency of significances, duration was the next most salient cue to ELS as it was also
statistically different in P vs. All in all the tokens, albeit with a shorter duration in three of the
tokens as previously discussed. Surprisingly, fundamental frequency (F0) was the least salient
acoustic correlate as it was only statistically higher in P in two of the tokens, namely <historial>
and <historical>. It would be interesting to conduct further research to see whether the final
segment, [l], has any bearing on the prominence of F0 in these two tokens.
Based on these findings, one could reasonably argue that the SHACS in Level 1
[+cyclic] derivations is: intensity > duration > F0. Is this a characteristic of words with stress-
shifting suffixes, or even polysyllabic words in general? It is not possible to tell at this point, but
suffice it to say, more acoustic investigations of ELS in polysyllabic words are needed,
particularly with other tokens containing stress-shifting suffixes. Moreover, these studies should
develop or utilize existing acoustic cue weighting scales so that the vocalic relative stress ratios
135
for the three correlates can be compared as equivalently as possible. For now, it appears that the
results in this study most closely support the findings of Beckman and Edwards (1994) that F0 is
the least salient cue to stress as it is only important in defining sentential pitch accent. Their
notion of SHACS (i.e., duration > intensity > F0) most closely resembles the hierarchy proposed
here.
In the meantime, it is evident that speakers are able to utilize any or all of the three
acoustic correlates to mark lexical stress in a particular word. In the speech of MWAE NES, only
two of the tokens, <historial> and <historical>, were produced with significantly greater values
of all three correlates. Therefore, perhaps T.M. Adams (2006) described it best when he posited
that the three acoustic signals “participate in a form of cue trading to signify stress in different
contexts” (p. 3087).
3) Nonnative ordering of the acoustic correlates of stress
On average, both Arabic L1 NNES and Mandarin L1 NNES produced primary-stressed
vowels with higher F0, greater intensity, and longer duration, albeit with smaller vocalic relative
stress ratios for each of the acoustic correlates than NES (Table 7). It is noteworthy that these
ratios were in roughly the same proportions as for NES; i.e., duration > F0 > intensity. However,
as previously explained, due to perceptual dissimilarities, one cannot assert that this is the
SHACS for these speakers.
Nonetheless, the paired sample t-test analyses of P vs. All do provide insight into the
SHACS for each NNES group, both of which differ from the NES model. Clearly, there are some
similarities and differences in the ways that different L1 speakers produce lexical stress contrasts
in different contexts, with considerable overlap between the three groups (Table 32). Let us now
examine the NNES groups independently.
136
Mandarin English L2 speakers perhaps deviated more from the NES norm in that they
tended to use F0 as a salient acoustic cue to ELS more often. In four of the tokens (i.e.,
<history>, <historian>, <historify>, and <historious>) they used a statistically higher F0 in P
than in All (Table 32). Additionally, there was a large effect size of F0 in their productions of
<historial> as signified by the question mark in Table 32. Thus, the results seem to concur with
earlier studies which indicate that Chinese speakers of English over-use F0 as an acoustic cue to
ELS (e.g., Keating & Kuo, 2012; Zhang et al., 2008).
Encouragingly, the results in this study also support the findings of Zhang et al. (2008) in
that Mandarin and English speakers’ use of duration and intensity were similar. For intensity,
only <historic> yielded no significances in Mandarin L1 NNES productions, whereas for
duration, P was not statistically different from All in only <history>, <historicity>, and <historify>
(Table 32). Interestingly, these were the same three tokens which NES (and Arabic speakers for
the latter two) produced a negative ratio of duration in P vs. All. Previously, the author posited
that this was due to the tense vowel or diphthong in the ultima which is longer than the lax vowel
in the primary-stressed vowel. When one listens to the recordings and views the spectrograms of
Mandarin L1 NNES productions of these tokens, the reason that Chinese speakers do not
produce such negative durational contrasts become clear. It is very common for Mandarin
English L2 speakers to clip the final syllable or segment in an utterance. This can mean vowel
reduction and/or consonant deletion in the ultima in Mandarin-accented English. For example,
instead of /hɪstərɪsɪti/, they may say [hɪstərɪsɪtə]–reducing the tense vowel to a schwa. Another
frequent example of clipping is the deletion of the alveolar liquid, /l/, and alveolar nasal, /n/,
when they occur as the final phoneme. In many cases, the acoustic phonetic researcher could not
tell the difference between a Chinese speaker’s production of [hɪˈstɔr i ən] and [hɪˈstɔr i əl]. It was
137
decided that these would not be counted as pronunciation errors because a) there would not be
enough data left in the main dataset to analyze, b) they did not affect any of the [+stress] vowels,
and more importantly c) they were regarded as innate characteristics of Mandarin-accented
English–a legitimate dialect of English when one considers World Englishes.
Despite the differences mentioned thus far, Mandarin English L2 speakers were actually
similar to MWAE NES with regards to the SHACS in that intensity seemed to be the most salient
correlate. However, it is hard to gauge which is the more important cue out of duration and F0.
Therefore, based on these results, the SHACS for Mandarin English L2 speakers appears to be:
intensity > F0 ≥ duration.
Meanwhile, although Arabic English L2 speakers did differ from native speakers as to the
exact combination of significant acoustic correlates with individual tokens, overall they produced
ELS more similarly to NES than Mandarin English L2 speakers. That is, intensity appears to be
the most salient cue to stress for Arabic English L2 speakers and F0 is relatively unimportant.
Durational contrasts between P and All were not as numerous as they were for NES although
Arabic English L2 speakers also produced negative duration ratios for <historicity> and
<historify> (Table 32). They did not, however, produce any significant contrasts in duration
between P and All in <history>, <historic>, and <historical>. Curiously, for <history>, no
statistical differences at all were found for any of the acoustic correlates in Arabic English L2
speech (Table 32).
Unlike Chinese speakers who did not produce any token with exactly the same
combination of salient acoustic correlates as NES, Saudi speakers produced <historial> and
<historious> with the same combination; i.e., F0, intensity, and duration for <historial> and
intensity and duration for <historious> (Table 32). To conclude this section, the SHACS for
138
Arabic L1 NNES in Level 1 [+cyclic] productions seems to be the same as NES: intensity >>
duration > F0.
4) Problematic acoustic correlates for Arabic L1 and Mandarin L1 speakers
We have already discussed the fact that, based on the paired sample t-tests of P vs. All,
Chinese subjects tend to use more pitch contrasts than NES to differentiate ELS, which almost
certainly leads to accentedness. Somewhat surprising then, Figure 23 shows that one-way
ANOVA and posthoc Tukey tests of the P vs. All dataset found that neither Mandarin nor Arabic
L1 speakers were statistically different from NES with regards to F0 usage as an acoustic
correlate of ELS in Level 1 [+cyclic] derivations (<history> productions were excluded). That
said, the p value was close to being significant (p = 0.6). Therefore, we can surmise that the
differences in relative vocalic stress ratios of F0 production in P vs. All were very small. Table 7
shows that the mean ratio of F0 for NES was actually higher than Mandarin L1 NNES, but
Figure 23 shows that the maximum F0 ratio in P vs. All was higher for the Chinese subjects.
Meanwhile, the boxplots in Figure 23 do tell us that MWAE NES use a wider range of F0 to
discriminate ELS than NNES. Mandarin L1 speakers use a slightly smaller F0 range which
seems to confirm the findings of Li and Shuai (2011), while disagreeing with those of Keating
and Kuo (2012). The latter, however, did note that the large F0 ranges were more evident in one-
word utterances, and the stimuli used in this study were in carrier phrases. Regardless, based on
the t-tests and ANOVAs, there are clearly differences in the ways in which Mandarin L1 NNES
and NES use F0 in ELS. For Arabic L1 speakers, the boxplot in Figure 23 indicates that they use
a much more limited range of F0 as the 25% and 75% percentile lines are close to the median.
This limited F0 range may also account for Arabic-accented English.
139
With regards to nonnative production of intensity, the results from ANOVA/Tukey
posthoc tests found that Mandarin L1 NNES were significantly different from NES. This was
somewhat unexpected based on previous studies of Mandarin English L2. From table 7 though, it
is clear that Mandarin L1 subjects used a lower ratio of intensity and so underuse this prosodic
correlate. Thus, although t-tests reveal that intensity was significantly different in P vs. All in all
but one of the tokens, Mandarin L1 NNES still do not employ this cue in a native-like manner.
Also relevant to the question of problematic prosodic correlates, Figure 25 illustrates that
on average Arabic L1 NNES significantly under-use durational contrasts between P and All to
emphasize primary stress. This may be due to the fact that Arabic English L2 speakers tend not
to reduce vowels as suggested by Zuraiq and Sereno (2005). Not reducing the unstressed vowels
in a token would certainly result in smaller durational contrasts between the primary [+tonic] and
non-primary [-tonic] vowels. The ANOVA results also support Bouchhioua’s (2008) study
which found that duration is not an important correlate of lexical stress in Tunisian Arabic as it is
in English and negative transfer may lead to non-native accentedness, if not unintelligibility.
This would explain why the acoustic phonetic researcher had a hard time aurally adjudicating
whether many of the Arabic L1 NNES productions contained stress-placement error, or not.
In sum, Arabic L1 NNES tend not to reduce unstressed vowels in Level 1 [+cyclic]
derivations and use a limited F0 range to differentiate stress-shifts. Conversely, Mandarin L1
NNES use F0 more as a salient marker of primary stress while under-using intensity contrasts.
5) Correlation between amount of L2 exposure and/or amount of L2 input and:
a) Accurate placement of stress in Level 1 [+cyclic] derivations
Figure 12 illustrates that the longer learners of English have spent studying the language
(i.e., increased L2 input), the fewer pronunciation and stress-placement errors they make in
140
stress-suffixed words (p < 0.05). Naturally, one would expect this result, but when L2 exposure
(i.e., years of residence in L2 country) was plotted against number of errors, it did not yield
significant correlations (Figure 11). The author contests that this was due to the fact that there
was a very limited range of the independent variable; that is, as the scatter plots in Figure 11
indicate, the vast majority of participants in this study had only spent between one and two years
in an English-speaking country. For this variable to produce significant results, a study with a
much larger range of L2 residency values would be needed. Of course, it would be difficult to
collect this sort of data in a university setting as most international students are only short-term
residents.
It would be edifying to note at this point that the author was not expecting the variable of
“Years of L2 Study” to yield significantly correlated results. Actually, I had thought that the
questionnaire was poorly constructed since any answer to the question is ambiguous. That is, 10
years of English L2 study could mean any number of actual learning hours. For example, one
subject may have studied English for 10 years but only for two 45-minute sessions per week,
while another may have studied intensively every day for 2 years. In addition, the author is aware
that some of the Saudi participants, in particular, indicated that they had begun studying English
since their arrival in the US, when in fact they had begun learning English in elementary school.
They confided that they did not feel that their English education in their home country was
adequate enough. Indeed, they were quite adamant about this. Therefore, what is interesting from
a psychological viewpoint, is that this strong correlation relates to how many years of English L2
education subjects feel they have received.
Regardless of discrepancies in the preceding sociometric data collection methods, the
results in Figure 13 remove all doubt on the matter. It clearly shows that Arabic and Mandarin
141
L1 NNES produce fewer errors the higher the level of their English L2 proficiency with a
significance of p < 0.00 and a medium effect size of r = -.05.
b) Native-like production of the acoustic correlates of stress in Level 1 [+cyclic]
derivations
According to Figure 27, there is a statistically significant correlation (p < 0.05) and a
moderate effect size (r = -.5) between amount of L2 input (i.e,, years of English L2 study) and
Mandarin L1 NNES’ ability to produce native-like F0 contours in lexical stress contrasts.
Furthermore, Figure 33 shows that there was also a significant correlation when native-like
production of F0 was correlated with English L2 proficiency level, albeit with a very small effect
size (r = -0.0, p < 0.05). These correlations are particularly interesting since the t-tests on
Mandarin English L2 productions revealed an over-usage of F0 as a prosodic correlate, and the
ANOVAs revealed that Chinese speakers use a smaller range of F0 than NES. Therefore, the
results of this correlation encouragingly suggest that Chinese learners of English are able to
overcome their innate difficulties when producing ELS through increased L2 study.
Similarly, while the aforementioned ANOVAs revealed that Arabic L1 speakers were
statistically different from NES with regards to duration usage as a prosodic cue, correlations of
production accuracy of duration versus amount of L2 study (Figure 28) and proficiency level
(Figure 34) both yielded significances, approximately r = -.3, p < 0.05 in each case. Therefore,
through increased acquisition of the English language, Saudi learners are also able to vanquish
the detrimental effects of negative transfer from their L1 sound system.
To conclude the answer to this research question, correlations did not find any significant
relationship between any of the independent variables and native-like production of intensity.
Partly, this is not surprising because from the summarized information in Table 32, we can
142
deduce that intensity is already employed as a prosodic correlate in almost every token by both
groups of NNES. . Even though ANOVAs did reveal that Mandarin L1 NNES significantly
under-used intensity (p < 0.05), the Cohen’s d effect size was very small (d = .1). As conjectured
earlier, the lack of correlations may be because the average intensity ratio if P vs. All was very
similar for all three language groups and that intensity was not a difficult acoustic stress cue to
master. Perhaps that is why previous studies have claimed that it is the least important cue to
ELS; in other words, because it is not hard for NNES to manipulate, it is not a determiner of
accentedness, comprehensibility, or intelligibility
6) Palatal glide epenthesis in the stress-shifting suffixes: <ian>, <ious>, and <ial>
One of the unexpected findings of this study was the high incidence of /j/ epenthesis in
the tokens <historian>, <historious>, and <historial> (Figures 38-40). Indeed, the results suggest
that [hɪˈstɔr i jən] be included as an alternative pronunciation to [hɪˈstɔr iən] in standard American
English dictionaries since almost half of the MWAE NES subjects pronounced it this way.
Although no IPA transcription is available for <historial> since it is an archaic word
(Dictionary.com, 2014), or for <historious> since it is a proper noun (Historious.us, 2014), one
can infer that dictionary pronunciation entries for words containing the Level 1 [+cyclic]
suffixes, <-ial> and <-ious>, such as <ministerial> and <glorious>, may need to be revised. In
fact, it may be the case that the inclusion of /j/ be considered the main pronunciation of words
containing these suffixes as the vast majority of MWAE NES produced the palatal glide in this
study.
143
7) Lack of evidence for “tonic accent shift” in polysyllabic Level 1 [+cyclic]
derivations
T-tests failed to support Ladefoged and Johnson’s (2010) notion that tonic accent shift
(i.e., the differentiator between primary (P) and secondary-stressed (S) syllables) is caused by a
“major pitch change” (p. 119) in the primary-stressed vowel, at least with respect to polysyllabic
Level 1 [+cyclic] derivations (Tables 34-41). In fact, the only token where F0 distinguished P
from S was <historical>, and even then, intensity and duration were also significantly greater
(Table 42).
Contrarily, the results reveal that intensity and duration are the relevant prosodic
correlates in assigning primary status to a vowel (Table 42). Even in the disyllabic stem word,
<historic>, these two correlates were the most salient. Thus, more studies on the features of tonic
accent shift in polysyllabic words should be conducted to determine whether the theory holds
true.
Limitations of the Study
The most obvious limitation of this study is that none of the data were cross-checked by
another researcher. Ideally, a random sample of 20% of the acoustic measurements (i.e.,
spectrogram textgrid delineations) would have been re-annotated by an independent acoustic
phonetician who was blind to the purpose of the study as per Zhang et al. (2008). Cohen’s kappa
could then be used to check for inconsistencies in the data coding system by cross-referencing
the stress analysis data (Mackey & Gass, 2005). Unfortunately, this was not feasible given that
the author is not a professional researcher, and his colleagues (fellow graduate students) did not
have sufficient time to spare. At least, the stress analysis data itself was collected automatically
using a Praat script (Yoon, 2008), thus reducing the possibility of human error.
144
Another limitation is that only one example of each Level 1 [+cyclic] suffix was used
(each with the same stem), which limits the generalizability of the results in this study.
Therefore, it would be informative for further studies to be conducted using a wider range of
stems so that the acoustic properties of individual suffixes can be investigated. Likewise, more
combinations of polysyllabic words could be used as tokens. For instance, <historicity> was
observed to have somewhat idiosyncratic characteristics with regards to SHACS which
highlights the need for more studies on words with five or more syllables.
In addition, the researcher only investigated the acoustic correlates of fundamental
frequency, intensity, and duration, omitting another important acoustic cue–vowel quality. As
Levis (2012) affirms, the suprasegmental feature - prosodic structure - and the segmental
feature–vowel quality–are “interdependent” (¶13). Many other researchers attest to the
significance of vowel reductions in lexical stress (Celce-Murcia et al., 1996; Edmunds, 2009;
Fear et al., 1995; Field, 2005; Hillenbrand et al., 1995). For example, it would be advantageous
for other studies to measure F1 and F2 values to observe whether Arabic L1 speakers’ under-use
of duration as a salient acoustic cue is indeed due to a deficiency in vowel neutralizations in
unstressed vowels as hypothesized.
Furthermore, the evidence provided in this paper in relation to /j/ epenthesis in words
with <ial> <ian>, and <ious> demands further research before standard dictionary
pronunciations of words with these suffixes are revised. Approximants are notoriously difficult to
acoustically distinguish from vowels, and sometimes must be identified by phonological rather
than articulatory means (“Speech Acoustics,” 2008). This is not to suggest that the data presented
here is not valuable or even valid; however, it is important to build upon this research by
145
investigating the issues further “using more objective spectral measurement techniques” (Hunt,
2009, p. 18).
Lastly, this research focused on one dialect of English–Midwest American English–and
so it would be edifying for future studies to test the replicability of the findings in this study in
other varieties of English with regards to ELS production, tonic accent shift, and palatal glide
epenthesis in Level 1 [+cyclic] derivations.
146
Chapter VI: Conclusion
The results presented in this paper yield insight into several interdependent issues related
to lexical stress in polysyllabic English words containing stress-shifting suffixes. First and
foremost, this study provides support to the view that the acoustic correlates of stress do indeed
have a hierarchy of relative salience, hereinafter named SHACS. The SHACS proposed here is
intensity > duration > fundamental frequency (F0). While this does not exactly match any of the
schemes described in the literature, it most closely resembles the SHACS postulated by Beckman
and Edwards (1994): duration > intensity > F0. Most likely, SHACS is context dependent. For
instance, Fry’s (1955, 1958) notion of SHACS (i.e., F0 > duration > intensity>) may only be
relevant to disyllabic homographs while intensity may only be the most salient acoustic cue in
three and four syllable words. Clearly, more studies on English lexical stress (ELS) in a wide
range of polysyllabic words are needed to validate this hypothesis.
What is certain though is that relative vocalic stress ratios of the three acoustic cues play
an important role in differentiating lexical stress patterns, and there does appear to be a native-
norm for ordering these acoustic signals. Indeed, the various significant correlations described in
this paper support this notion.
From a second language acquisition perspective, there is good evidence to suggest that
native-like command of the acoustic correlates is attainable for English language learners.
Although speakers with different inherent L1 sound systems encounter different problems when
trying to acquire native-like stress production, encouragingly, it appears that they can overcome
these difficulties through increased input of the L2. Not only do experienced English language
learners produce fewer pronunciation errors, they also produce prosodic contrasts in a more
native-like manner. For instance, although Saudi speakers inherently under-use duration as
147
acoustic cue to ELS (perhaps by not fully reducing vowels), they are able to use this acoustic
correlate more accurately as their language skills progress. Similarly, Chinese learners of English
are able to overcome the negative transfer of their tonal system by producing pitch in a more
native-like manner as they advance in their studies.
Furthermore, the present results do not support Ladefoged and Johnson’s (2010) theory
of tonic accent shift. Instead, the results actually suggest the opposite; that is, intensity and
duration appear to be responsible for contrasts between primary and secondary stressed vowels.
It will be interesting to observe whether these findings can be replicated, and whether the
variables of token length (disyllabic vs. polysyllabic words) and/or token delivery method (read
utterances vs. natural speech) have any effect.
Finally, with regards to pronunciation, this investigation provides convincing evidence
for a possible revision of standard American English dictionary IPA transcriptions. At least for
the words in this study, the suffixes <-ial>, <-ian>, and <-ious> were more commonly
pronounced by native and nonnative speakers with the epenthetical insertion of a palatal glide, [j].
Thus, future studies should explore the presence or absence of this phenomenon in other dialects
of English, both native and nonnative.
148
References
Abercrombie, D. (1949). Teaching pronunciation. English Language Teaching, 3, 113- 122.
Acoustic properties of speech sounds: CLSP workshop. (2000). Retrieved August 19, 2013, from
John Hopkins University, Center for Language and Speech Processing Online Web site:
http://old-site.clsp.jhu.edu/ws2000/presentations/ preliminary/victor_zue/Zue-
lecture2.pdf.
Adams, C., & Munro, R. (1978). In search of the acoustic correlates of stress: Fundamental
frequency, amplitude, and duration in the connected utterance of some native and non-
native speakers of English. Phonetica, 35, 125-156.
Adams, T. M. (2006). The acoustic correlates of stress in compounds. Journal of the Acoustical
Society of America, 120, 3087.
Altmann, H. (2006). The perception and production of second language stress: A cross-linguistic
experimental study. (Unpublished doctoral dissertation). University of Delaware, St.
Newark, DE.
Aronoff, M. (1976). Word formation in generative grammar. Cambridge, MA: MIT Press.
Baart, J. (2010). A field manual of acoustic phonetics. Dallas, TX: SIL International.
Barto-Sisamout, K. (2011). Intonation of Mandarin speakers in their English as a foreign
language. Journal of the Acoustical Society of America, 130, 2553.
Becker, L. A. (2000). Effect size calculators. Retrieved from University of Colorado Colorado
Springs website: http://www.uccs.edu/lbecker/index.html#Calculate d and r using t
values (separate groups).
Beckman, M. E. (1986). Stress and non-stress accent. Dordrecht: Foris Publications.
149
Beckman, M. E., & Edwards, J. (1994). Articulatory evidence for differentiating stress categories.
In P. Keating (Ed.), Phonological structure and phonetic form. Papers in Laboratory
Phonology III (pp. 7-33). Cambridge: Cambridge University Press.
Beckman, M. E., & Pierrehumbert, J. B. (1986). Intonational structure in Japanese and English.
Phonology Yearbook, 3, 255-309.
Bird, S., & Wang, Q. (2012, December 6). LING 380: Acoustic phonetics lab manual
[PowerPoint slides]. Retrieved from University of Victoria website:
http://web.uvic.ca/ling/resources/Lab_all_i.pdf.
Boersma, P., & Weenink, D. (2013). Praat: Doing phonetics by computer (Version 5.3.32)
[computer program], < http://www.fon.hum.uva.nl/praat/>. Amsterdam: University of
Amsterdam.
Booij, G. (2006). Lexical phonology and morphology. In K. Brown (Ed.), Encyclopedia of
Language & Linguistics, Second Edition (Vol. 7, pp. 94-97). Oxford: Elsevier.
Bouchhioua, N. (2008). Duration as a cue to stress and accent in Tunisian Arabic, native English,
and L2 English. Proceedings from Speech Prosody 2008: The Fourth International
Conference on Speech Prosody (pp. 535-538). Campinas: Brazil.
Burzio, L. (1994). Principles of English Stress: Cambridge Studies in Linguistics #72, 1st edition.
Cambridge: Cambridge University Press.
Carroll, J. B., Davies, P., & Richman, B. (1971). The American heritage word frequency book.
New York: Houghton Mifflin.

150
Celce-Murcia, M., Brinton, D., & Goodwin, J. M. (1996). Teaching pronunciation: A reference
for teachers of English to speakers of other languages. Cambridge: Cambridge
University Press.
Chomsky, N., & Halle, M. (1968). The sound pattern of English. New York: Harper and Row.
Cohn, A.B, Fougeron, C., & Huffman, M. (Eds.). (2012). The Oxford handbook of laboratory
phonology. New York: Oxford University Press.
Cowart, W. (1997). Experimental syntax. Thousand Oaks: Sage.
Crystal, D. (2008). A dictionary of linguistics and phonetics (6th ed.). Oxford: Blackwell
Publishing.
de Jong, K., & Zawaydeh, B. A. (1999). Stress, duration, and intonation in Arabic word-level
prosody. Journal of Phonetics, 27, 3-22.
Dörnyei, Z. (2003). Questionnaires in second language research: Construction, administration,
and processing (1st ed.). Mahwah, NJ: Lawrence Erlbaum Associates, Inc., Publishers.
Edmunds, P. (2009). ESL speaker’s production of English lexical stress: The effect of variation
in acoustic correlates on perceived intelligibility and nativeness. (Unpublished doctoral
dissertation). University of New Mexico: Albuquerque, NM.
Fear, B. D., Cutler, A., & Butterfield, S. (1995). The strong/weak syllable distinction in English.
Journal of the Acoustical Society of America, 97, 1893-1904.
Field, J. (2005). Intelligibility and the listener: The role of lexical stress. TESOL Quarterly, 39,
399-423.
Flege, J. E., & Bohn, O. S. (1989). An instrumental study of vowel reduction and stress
placement in Spanish-accented English. Studies in Second Language Acquisition, 11, 35-
62.
151
Flemming, E. (2009). The phonetics of schwa vowels. In D. Minkova (Ed.), Phonological
weakness in English: From old to present-day English (pp. 78-98). Palgrave Macmillan.
Freij, G. J., & Fallside, F. (1988). Lexical stress recognition using hidden Markov models.
Proceedings from International Conference: Acoustics, Speech and Signal Processing (pp.
135-138). New York, NY.
Fromkin, V., Rodman, R., & Hyams, N. (2011). An introduction to language (9th ed.). Boston,
MA: Wadsworth CENGAGE Learning.
Fry, D. B. (1955). Duration and intensity as physical correlates of linguistic stress. Journal of the
Acoustical Society of America, 27, 765-768.
Fry, D. B. (1958). Experiments in the perception of stress. Language & Speech, 1:2, 126-152.
Gay, T. (1978). The physiological and acoustic correlates of perceived stress. Language and
Speech, 21:4, 347-353.
Hahn, L. D. (2004). Primary stress and intelligibility: Research to motivate the teaching of
suprasegmentals. TESOL Quarterly, 38, 201-223.
Halle, M., & Kenstowicz, M. (1991). The free element condition and cyclic versus noncyclic
stress. Linguistic Inquiry, 22, 457-501.
Harley, H. (2003). A linguistic introduction to English words. Malden, MA: Blackwell.
Hillenbrand, J., Getty, L. A., Clark, M. J., & Wheeler, K. (1995). Acoustic characteristics of
American English vowels. Journal of the Acoustical Society of America, 97, 3099-3111.
Hunt, E. H. (2009). Acoustic characterization of the glides /j/ and /w/ in American English.
(Unpublished doctoral dissertation). Massachusetts Institute of Technology: Cambridge:
MA.
152
Jarmulowicz, L. D. (2002). English derivational suffix frequency and children’s stress judgments.
Brain and Language, 81, 192-204.
Jarmulowicz, L. D., Taran, V. L., & Hay, S. E. (2008). Lexical frequency and third graders’
stress accuracy in derived English word production. Applied Psycholinguistics, 29, 213-
235.
Jia, G., Strange, W., Wu, W., Collado, J., & Guan, Q. (2006). Perception and production of
English vowels by Mandarin speakers: Age-related differences vary with amount of L2
exposure. Journal of the Acoustical Society of America, 119, 1118-1130.
Johnson, K. (2012). Acoustic and auditory phonetics (3rd ed.). Malden, MA: Wiley-Blackwell.
Jurafsky, D., & Martin, J. H. (2008). Speech and language processing: An introduction to
natural language processing, computational linguistics, and speech recognition (2nd ed.).
Upper Saddle River, NJ: Pearson Prentice-Hall.
Kang, O. (2010). Relative salience of suprasegmental features on judgments of L2
comprehensibility and accentedness. System, 38, 301-315.
Keating, P., & Kuo, G. (2012). Comparison of speaking fundamental frequency in English and
Mandarin. Journal of the Acoustical Society of America, 132, 1050-1060.
Kiparsky, P. (1982). From cyclic phonology to lexical phonology. In H. van der Hulst & N.
Smith (Eds.), The structure of phonological representations I (pp. 131-175). Dordrecht:
Foris.
Kreidler, C. W. (2004). The pronunciation of English: A course book (2nd ed.). Malden, MA:
Blackwell.
Ladefoged, P. (1975). A course in phonetics. Orlando: Harcourt Brace.
153
Ladefoged, P. (2001a). Vowels and consonants: An introduction to the sounds of language.
Malden, MA: Blackwell.
Ladefoged, P. (2001b). A course in phonetics (4th ed.). New York: Thomson-Wadsworth.
Ladefoged, P. (2003). Phonetic data analysis: An introduction to fieldwork and instrumental
techniques. Malden, MA: Blackwell.
Ladefoged, P., & Johnson, K. (2010). A course in phonetics (6th ed.). New York: Thomson-
Wadsworth.
Lee, S., & Cho, M. (2011). An acoustic analysis of stressed and unstressed vowels in English
nouns: A cross-language case study. Korean Journal of English Language and
Linguistics, 17, 61-88.
Lehiste, I. (1970). Suprasegmentals (1st ed.). MA: MIT Press.
Levis, J. M. (2012). Guidelines for promoting intelligibility [PowerPoint slides]. Retrieved from
Iowa State University website: jlevis.public.iastate.edu/ intelligibility.ppt.
Li, B., & Shuai, L. (2011). Suprasegmental features of Chinese-accented English. Journal of the
Acoustical Society of America, 129, 2453.
Lieberman, P. (1960). Some acoustic correlates of word stress in American English. Journal of
the Acoustical Society of America, 32, 451-454.
Liberman, M. Y., & Pierrehumbert, J. B. (1984). Intonational invariance under changes in pitch
range and length. In M. Aranoff & R. T. Öhrle (Eds.), Language sound structure (pp.
157-233). Cambridge, MA: MIT Press.
Lindblom, B. (1963). Spectrographic study of vowel reduction. Journal of the Acoustical Society
of America, 35, 1773-1781.
154
Mackey, A., & Gass, S. M. (2005). Second language research: Methodology and design. NJ:
Lawrence Erlbaum Associates.
Mackey, A., & Gass, S. M. (2012). Research methods in second language acquisition: A
practical guide. MA: Wiley-Blackwell.
Maddieson, I., & Emmorey, K. (1985). Relationship between semivowels and vowels: Cross-
linguistic investigations of acoustic difference and coarticulation. Phonetica, 42, 163-174.
Maeda, S. (1976): A characterization of American English intonation. (Unpublished doctoral
dissertation). MIT: Cambridge, MA.
McClean, M. D., & Tiffany, W. R. (1973). The acoustic parameters of stress in relation to
syllable position, speech loudness and rate. Language and Speech, 16:3, 283-290.
McNerney, M., & Mendelsohn, D. (1992) Suprasegmentals in the pronunciation class: Setting
priorities. In P. Avery & S. Ehrlich (Eds.), Teaching American English pronunciation (pp.
185-196). Oxford: Oxford University Press.
Morton, J. J., & Jassem, W. W. (1965). Acoustic correlates of stress. Language and Speech, 8,
159-181.
Munro, M. (2012, November). Suprasegmentals: Stress, rhythm, and intonation. Retrieved
November 26, 2012, from Simon Frasier University Web site:
http://www.sfu.ca/~mjmunro/L290H5.pdf.
Munro, M. & Derwing, T. (1995). Foreign accent, comprehensibility, and intelligibility in the
speech of second language learners. Language Learning, 45(1), 73-97.
155
Nespor, M., Shukla, M., & Mehler, J. (2011). Stress-timed vs. syllable timed languages. In M.
Van Ooostendorp, C. J. Ewen, E. Hume, & K. Rice (Eds.), The Blackwell companion to
phonology (Vol. 48, pp. 1147-1159). Wiley-Blackwell.
Okobi, A.O. (2006). Acoustic correlates of word stress in American English. (Unpublished
doctoral dissertation). MIT: Cambridge, MA.
Oswald, F. L., & Plonsky, L. (2010). Meta-analysis in second language research: Choices and
challenges. Annual Review of Applied Linguistics, 30, 85-110.
Peterson, G., & Barney, L. (1952). Control methods in a study of the vowels. Journal of the
Acoustical Society of America, 24, 176-84.
Peterson, G. E., & Lehiste, L. (1960). Duration of syllable nuclei in English. Journal of the
Acoustical Society of America, 32, 693-703.
Phonetics and theory of speech production. Retrieved August 22, 2013, from Helsinki University
of Technology, Laboratory of Acoustics and Audio Signal Processing Online Web site:
http://www.acoustics.hut.fi/publications/files/ theses/lemmetty_mst/chap3.html.
Plitcha, B. (2004). Best practices in the acquisition, processing, and analysis of acoustic speech
signals. Retrieved October 12, 2012, from Michigan State University Web site:
http://flint.matrix.msu.edu/extras/Audio-technology.pdf.
Post, B., & Nolan, F. (2012). Data collection for prosodic analysis of continuous speech and
dialectal varaiation. In A. C. Cohn, C. Fougeron, & M. K. Huffman (Eds.), The Oxford
handbook of laboratory phonology (pp. 538-547). NY: Oxford University Press.
156
Prieto, P. (2012). Experimental methods and paradigms for prosodic analysis. In A. C. Cohn, C.
Fougeron, & M. K. Huffman (Eds.), The Oxford handbook of laboratory phonology (pp.
528-538). NY: Oxford University Press.
Ramus, F., Nespor, M., & Mehler, J. (1999). Correlates of linguistic rhythm in the speech signal.
Cognition, 73, 265-292.
Redford, M. A. (2007). Word-internal versus word-peripheral consonantal duration patterns in
three languages. Journal of the Acoustical Society of America, 121:3, 1665-1678.
Ryan, K. (2005). Grid-maker.praat [Praat script]. Available from
http://www.linguistics.ucla.edu/faciliti/facilities/acoustic/praat.html.
Sabater, M. S. (1991). Stress and rhythm in English. Revista Alicantina de Estudios Ingleses, 4,
145-62.
Shemshadsara, Z.G. (2011). EFL learner’s awareness of stress-moving vs. neutral suffixes.
English Language Teaching, 4:4, 146-153.
Silva, A., Macedo, A., & Barreto, G. & (2011). A SOM-based analysis of early prosodic
acquisition of English by Brazilian learners: Preliminary results. In J. Laaksonen & T.
Honkela (Eds.), Advances in Self-Organizing Maps: 8th International Workshop, WSOM
2011, Espoo, Finland, June 13-15, 2011. Proceedings (pp. 267-276). Espoo: Springer.
Sluijter, A.M.C., & Van Heuven, V. (1996). Spectral balance as an acoustic correlate of
linguistic stress. Journal of the Acoustical Society of America, 100, 2471-2485.
Speech acoustics: The acoustic characteristics of approximant consonants. (2008). Retrieved
August 10, 2013, from Macquarie University, Department of Linguistics Online Web site:
http://clas.mq.edu.au/acoustics/ consonants/approxweb.html.
157
White, T. G., Sowell, J., & Yanagihara, A. (1989). Teaching elementary students to use word
part clues. The Reading Teacher, 42, 302-308.
Yavas, M. (2011). Applied English phonology (2nd ed.). Malden, MA: Wiley-Blackwell.
Yoon, T. (2008). Stress analysis script [Praat script]. Available from
http://web.uvic.ca/~tyoon/resource/vq.praat.
Zhang, Y., Nissen. S. L., & Francis, A. L. (2008). Acoustic characteristics of English lexical
stress produced by Mandarin speakers. Journal of the Acoustical Society of America,
123:6, 4498-4513.
Zuraiq, W., & Sereno, J. E. (2005). The production of lexical stress by native speakers of Arabic
and English and by Arab learners of English. (Unpublished doctoral dissertation). The
University of Kansas: Lawrence, KS.
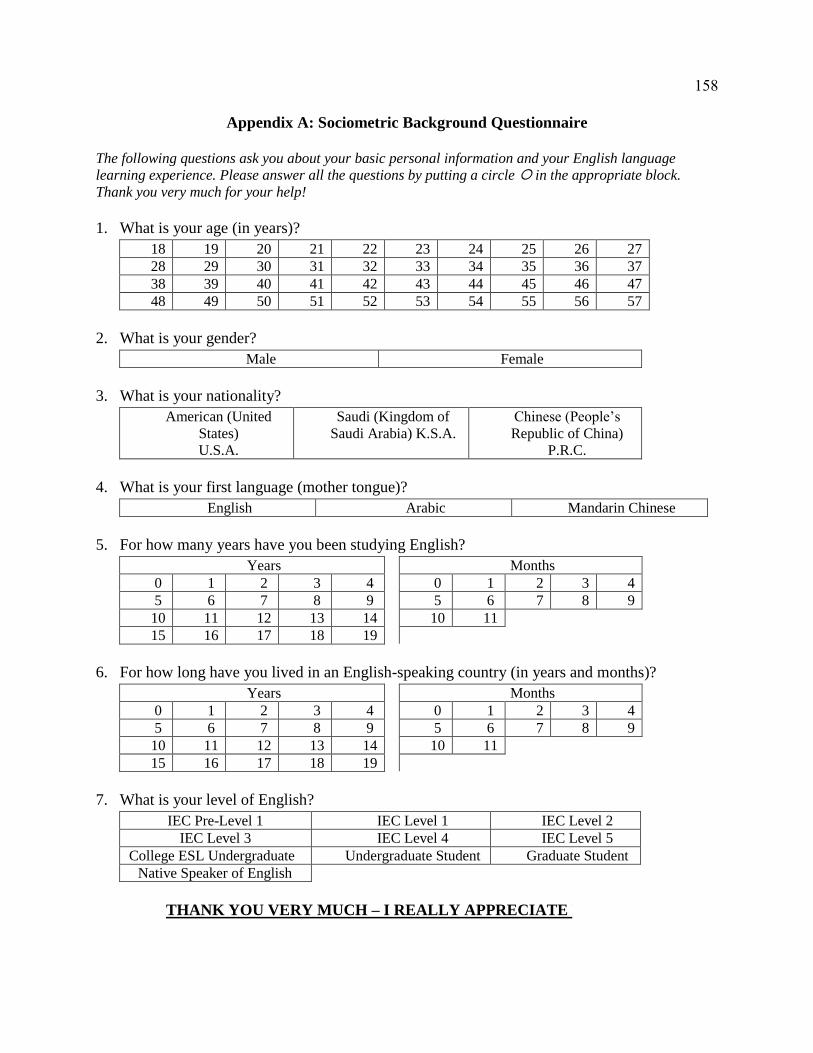
158
Appendix A: Sociometric Background Questionnaire
The following questions ask you about your basic personal information and your English language
learning experience. Please answer all the questions by putting a circle in the appropriate block.
Thank you very much for your help!
1. What is your age (in years)?
18 19 20 21 22 23 24 25 26 27
28 29 30 31 32 33 34 35 36 37
38 39 40 41 42 43 44 45 46 47
48 49 50 51 52 53 54 55 56 57
2. What is your gender?
Male Female
3. What is your nationality?
American (United
States)
U.S.A.
Saudi (Kingdom of
Saudi Arabia) K.S.A.
Chinese (People’s
Republic of China)
P.R.C.
4. What is your first language (mother tongue)?
English Arabic Mandarin Chinese
5. For how many years have you been studying English?
Years Months
0 1 2 3 4 0 1 2 3 4
5 6 7 8 9 5 6 7 8 9
10 11 12 13 14 10 11
15 16 17 18 19
6. For how long have you lived in an English-speaking country (in years and months)?
Years Months
0 1 2 3 4 0 1 2 3 4
5 6 7 8 9 5 6 7 8 9
10 11 12 13 14 10 11
15 16 17 18 19
7. What is your level of English?
IEC Pre-Level 1 IEC Level 1 IEC Level 2
IEC Level 3 IEC Level 4 IEC Level 5
College ESL Undergraduate Undergraduate Student Graduate Student
Native Speaker of English
THANK YOU VERY MUCH – I REALLY APPRECIATE YOUR HELP!
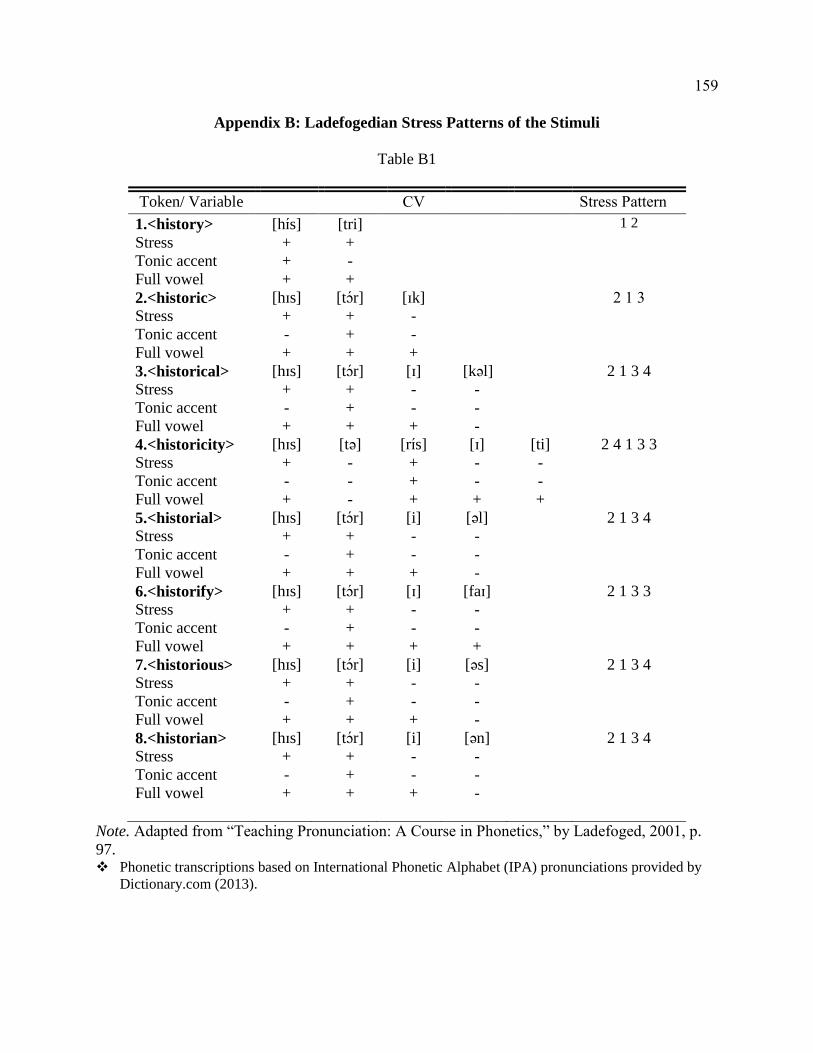
159
Appendix B: Ladefogedian Stress Patterns of the Stimuli
Table B1
Token/ Variable CV Stress Pattern
1.<history> [hɪs] [tri] 1 2
Stress + +
Tonic accent + -
Full vowel + +
2.<historic> [hɪs] [tɔr] [ɪk] 2 1 3
Stress + + -
Tonic accent - + -
Full vowel + + +
3.<historical> [hɪs] [tɔr] [ɪ] [kəl] 2 1 3 4
Stress + + - -
Tonic accent - + - -
Full vowel + + + -
4.<historicity> [hɪs] [tə] [rɪs] [ɪ] [ti] 2 4 1 3 3
Stress + - + - -
Tonic accent - - + - -
Full vowel + - + + +
5.<historial> [hɪs] [tɔr] [i] [əl] 2 1 3 4
Stress + + - -
Tonic accent - + - -
Full vowel + + + -
6.<historify> [hɪs] [tɔr] [ɪ] [faɪ] 2 1 3 3
Stress + + - -
Tonic accent - + - -
Full vowel + + + +
7.<historious> [hɪs] [tɔr] [i] [əs] 2 1 3 4
Stress + + - -
Tonic accent - + - -
Full vowel + + + -
8.<historian> [hɪs] [tɔr] [i] [ən] 2 1 3 4
Stress + + - -
Tonic accent - + - -
Full vowel + + + -
Note. Adapted from “Teaching Pronunciation: A Course in Phonetics,” by Ladefoged, 2001, p.
97. Phonetic transcriptions based on International Phonetic Alphabet (IPA) pronunciations provided by
Dictionary.com (2013).
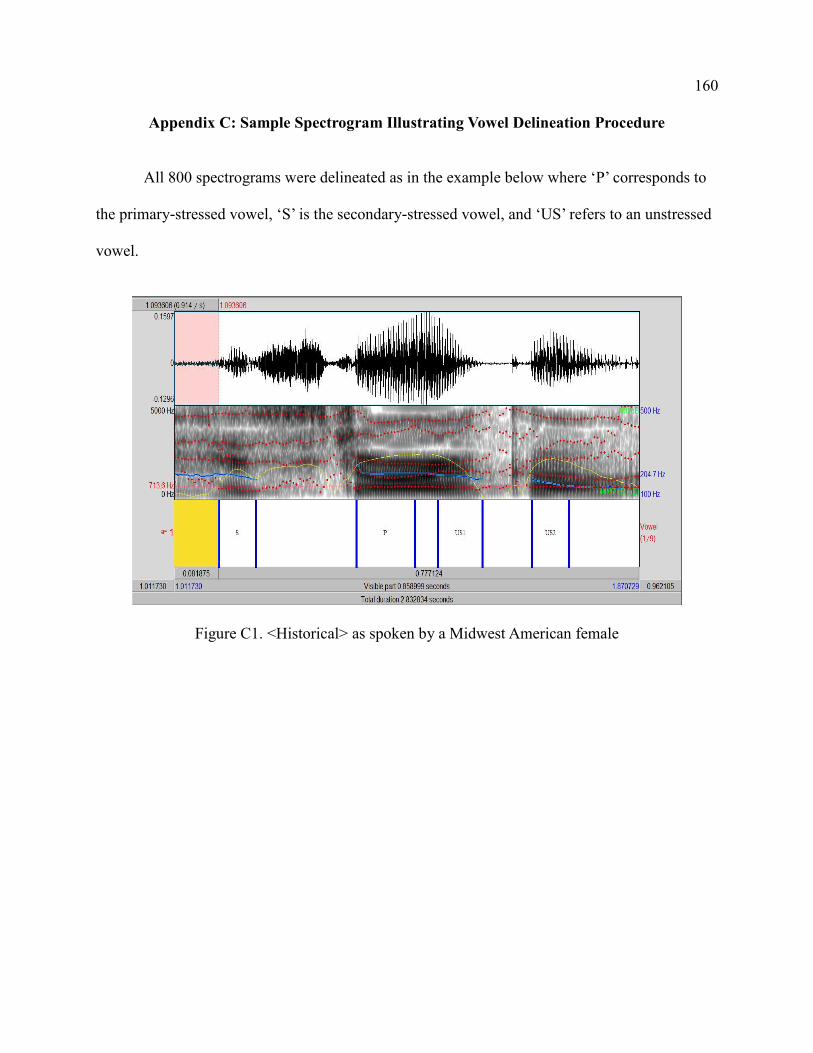
160
Appendix C: Sample Spectrogram Illustrating Vowel Delineation Procedure
All 800 spectrograms were delineated as in the example below where ‘P’ corresponds to
the primary-stressed vowel, ‘S’ is the secondary-stressed vowel, and ‘US’ refers to an unstressed
vowel.
Figure C1. <Historical> as spoken by a Midwest American female
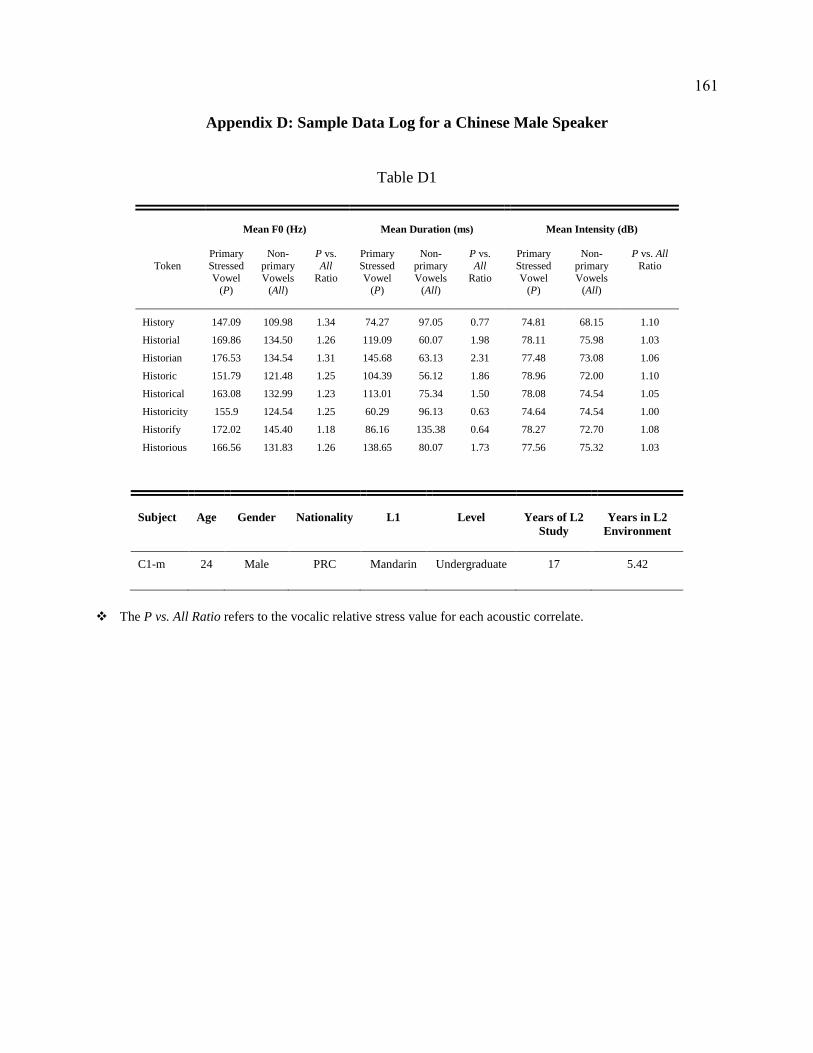
161
Appendix D: Sample Data Log for a Chinese Male Speaker
Table D1
Mean F0 (Hz)
Mean Duration (ms)
Mean Intensity (dB)
Token
Primary
Stressed
Vowel (P)
Non-
primary
Vowels (All)
P vs.
All
Ratio
Primary
Stressed
Vowel (P)
Non-
primary
Vowels (All)
P vs.
All
Ratio
Primary
Stressed
Vowel (P)
Non-
primary
Vowels (All)
P vs. All
Ratio
History 147.09 109.98 1.34 74.27 97.05 0.77 74.81 68.15 1.10
Historial 169.86 134.50 1.26 119.09 60.07 1.98 78.11 75.98 1.03
Historian 176.53 134.54 1.31 145.68 63.13 2.31 77.48 73.08 1.06
Historic 151.79 121.48 1.25 104.39 56.12 1.86 78.96 72.00 1.10
Historical 163.08 132.99 1.23 113.01 75.34 1.50 78.08 74.54 1.05
Historicity 155.9 124.54 1.25 60.29 96.13 0.63 74.64 74.54 1.00
Historify 172.02 145.40 1.18 86.16 135.38 0.64 78.27 72.70 1.08
Historious 166.56 131.83 1.26 138.65 80.07 1.73 77.56 75.32 1.03
Subject
Age
Gender
Nationality
L1
Level
Years of L2
Study
Years in L2
Environment
C1-m 24 Male PRC Mandarin Undergraduate 17 5.42
The P vs. All Ratio refers to the vocalic relative stress value for each acoustic correlate.
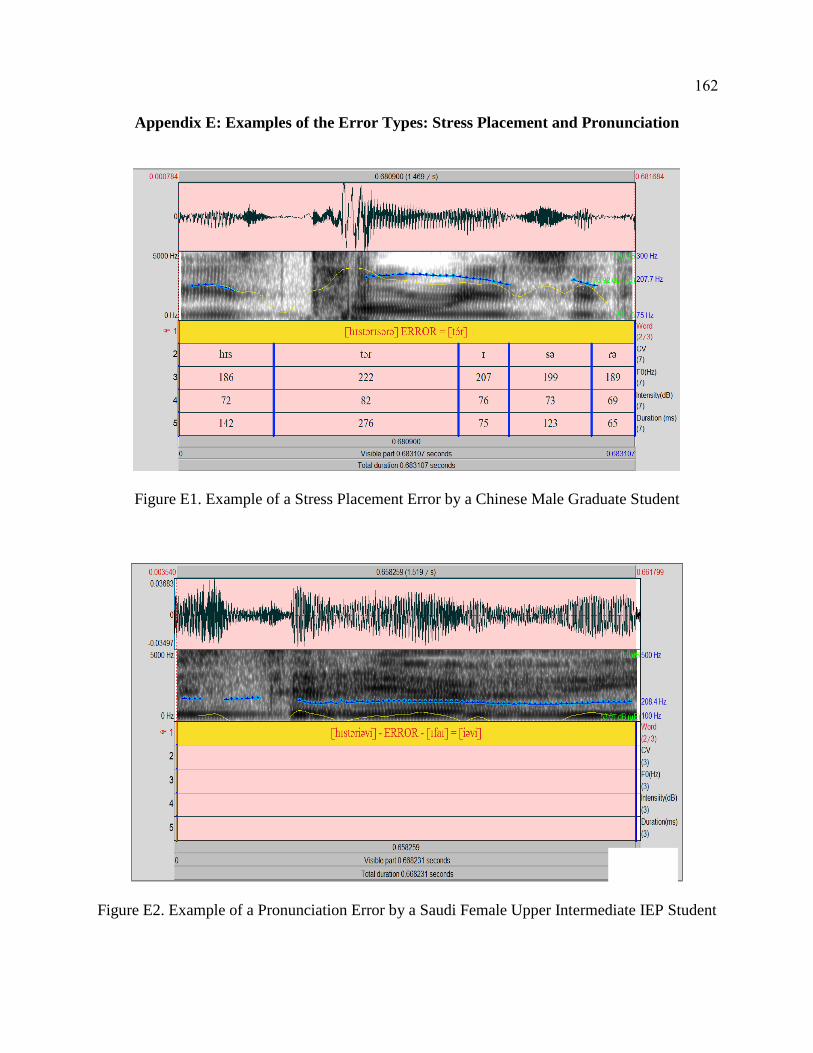
162
Appendix E: Examples of the Error Types: Stress Placement and Pronunciation
Figure E1. Example of a Stress Placement Error by a Chinese Male Graduate Student
Figure E2. Example of a Pronunciation Error by a Saudi Female Upper Intermediate IEP Student
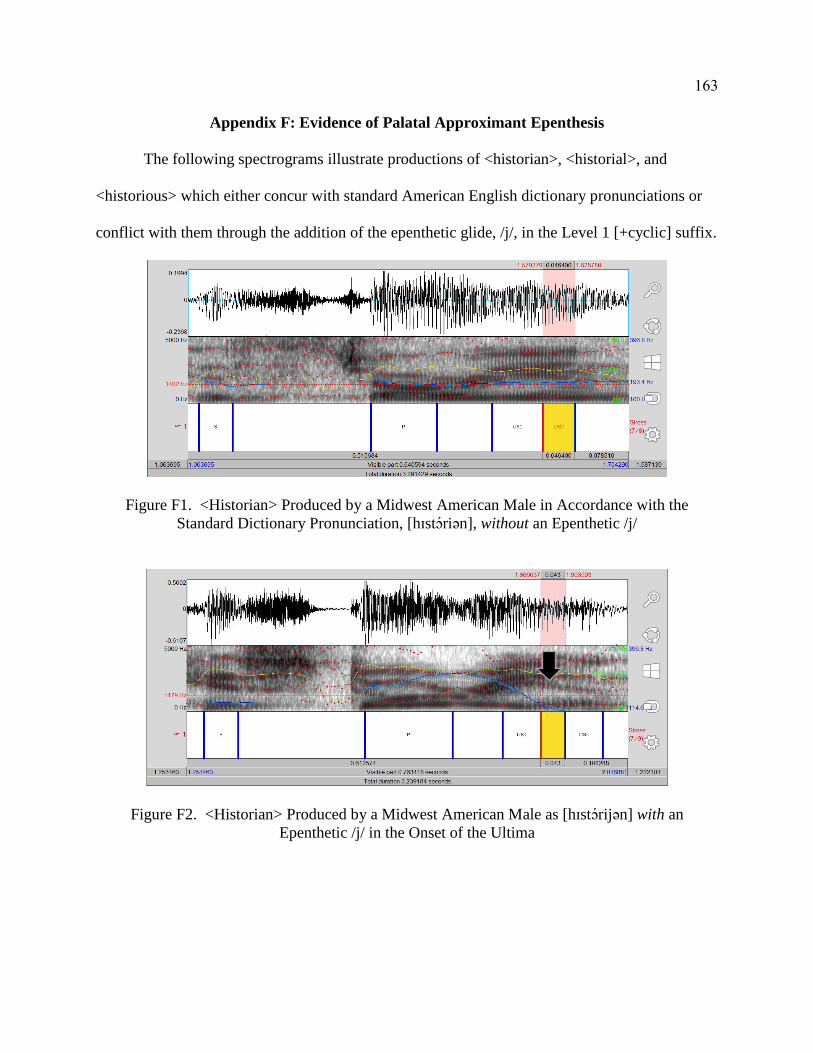
163
Appendix F: Evidence of Palatal Approximant Epenthesis
The following spectrograms illustrate productions of <historian>, <historial>, and
<historious> which either concur with standard American English dictionary pronunciations or
conflict with them through the addition of the epenthetic glide, /j/, in the Level 1 [+cyclic] suffix.
Figure F1. <Historian> Produced by a Midwest American Male in Accordance with the
Standard Dictionary Pronunciation, [hɪstɔriən], without an Epenthetic /j/
Figure F2. <Historian> Produced by a Midwest American Male as [hɪstɔrijən] with an
Epenthetic /j/ in the Onset of the Ultima
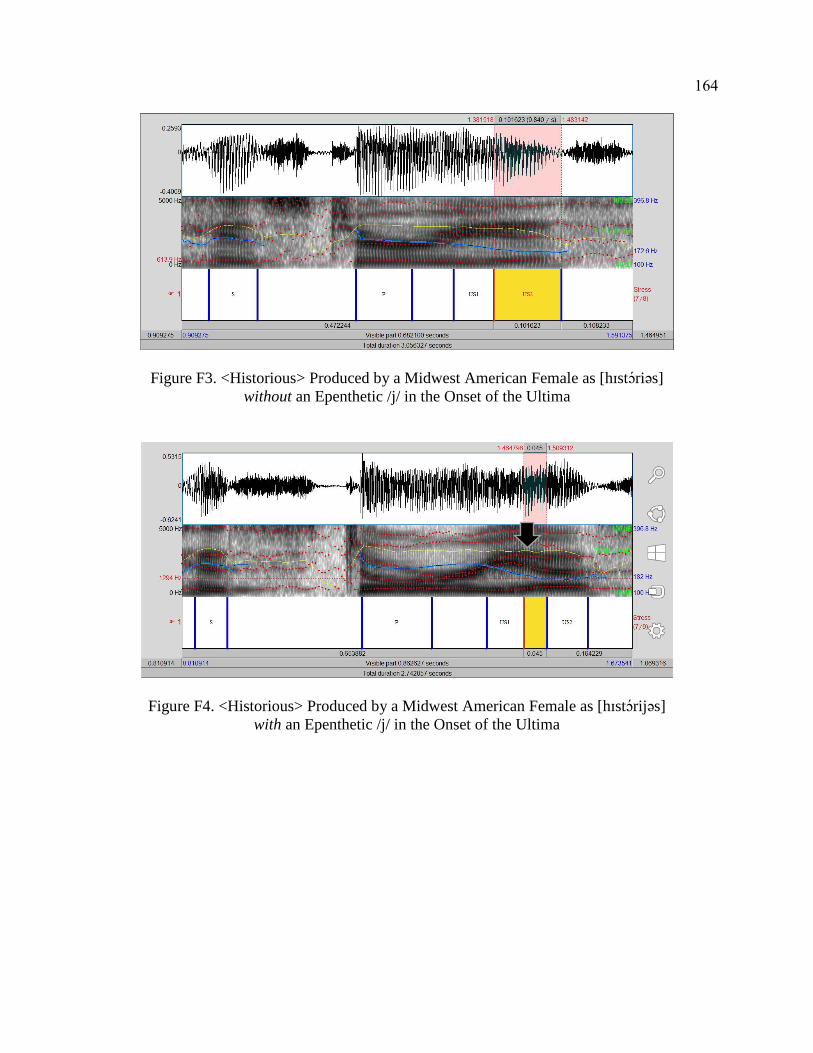
164
Figure F3. <Historious> Produced by a Midwest American Female as [hɪstɔriəs]
without an Epenthetic /j/ in the Onset of the Ultima
Figure F4. <Historious> Produced by a Midwest American Female as [hɪstɔrijəs]
with an Epenthetic /j/ in the Onset of the Ultima
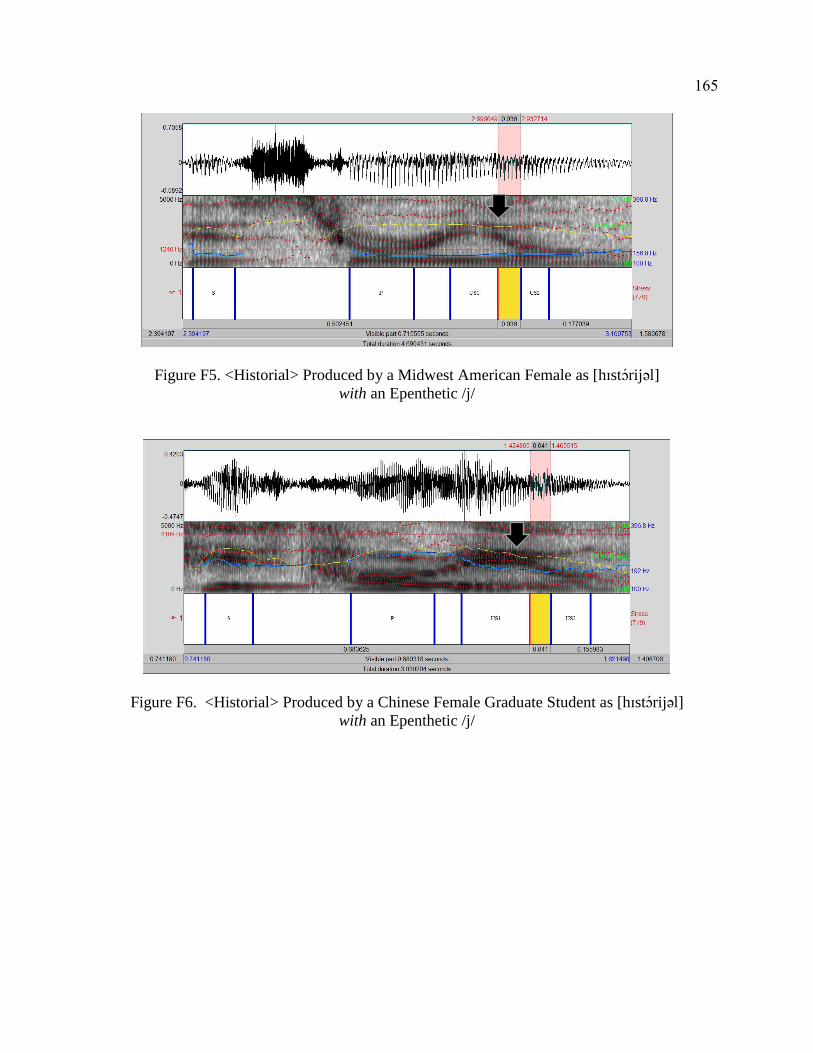
165
Figure F5. <Historial> Produced by a Midwest American Female as [hɪstɔrijəl]
with an Epenthetic /j/
Figure F6. <Historial> Produced by a Chinese Female Graduate Student as [hɪstɔrijəl]
with an Epenthetic /j/
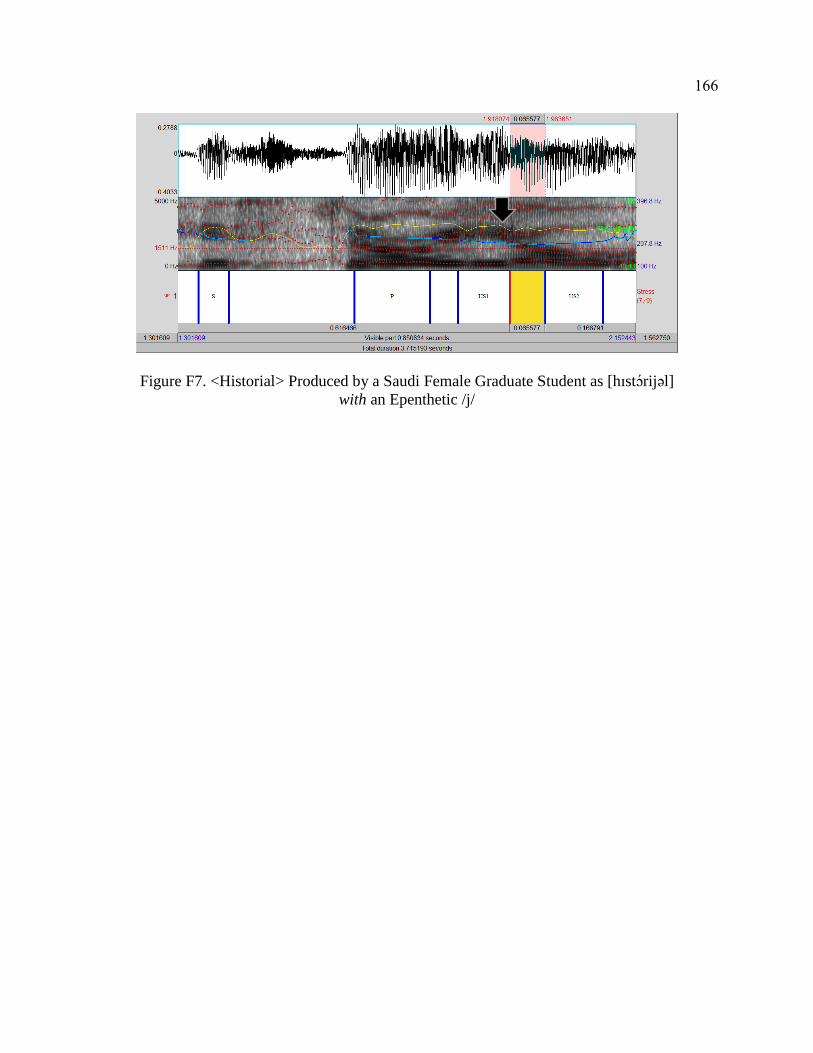
166
Figure F7. <Historial> Produced by a Saudi Female Graduate Student as [hɪstɔrijəl]
with an Epenthetic /j/


![[CATEGORIZED] in other words, into grammatical … [FORMING PARTS OF SPEECH] ... -ant -ed -fy-fully ... Noun Suffixes Adjective Suffixes Verb Suffixes Adverb Suffixes-ability-ful -able-ite-ows-ate](https://static.fdocuments.net/doc/165x107/5ad529437f8b9a6d708c8b88/categorized-in-other-words-into-grammatical-forming-parts-of-speech-.jpg)


![SUFFIXES in English · Word formation – English suffixes 1 SUFFIXES in English NOUN suffixes STATES Suffix Mainly added to Usual meaning Examples -dom [NOUNS] [VERBS] the condition](https://static.fdocuments.net/doc/165x107/5fdbbc0ae57015529348d091/suffixes-in-word-formation-a-english-suffixes-1-suffixes-in-english-noun-suffixes.jpg)