THE ACCOUNTING REVIEW American Accounting …faculty.washington.edu/smcvay/DLLM_TAR.pdf · THE...
37
THE ACCOUNTING REVIEW American Accounting Association Vol. 88, No. 2 DOI: 10.2308/accr-50318 2013 pp. 463–498 Managerial Ability and Earnings Quality Peter R. Demerjian Emory University Baruch Lev New York University Melissa F. Lewis University of Utah Sarah E. McVay University of Washington ABSTRACT: We examine the relation between managerial ability and earnings quality. We find that earnings quality is positively associated with managerial ability. Specifically, more able managers are associated with fewer subsequent restatements, higher earnings and accruals persistence, lower errors in the bad debt provision, and higher quality accrual estimations. The results are consistent with the premise that managers can and do impact the quality of the judgments and estimates used to form earnings. Keywords: managerial ability; managerial efficiency; earnings quality; accruals quality. Data Availability: Data are publicly available from the sources identified in the text. I. INTRODUCTION W e examine the relation between managerial ability and earnings quality. We anticipate that superior managers are more knowledgeable of their business, leading to better judgments and estimates and, thus, higher quality earnings. 1 Alternatively, the benefit We thank two anonymous reviewers, Asher Curtis, Patty Dechow, Ilia Dichev, Weili Ge, Marlene Plumlee, Phil Shane, Terry Shevlin, Wayne Thomas (editor), Ben Whipple, and workshop participants at the 2010 Kapnick Accounting Conference at the University of Michigan, the 2010 Western Region Meeting, the 2010 FEA Conference, Emory University, Florida International University, University of Illinois, The University of Texas at Arlington, and the Wednesday group at The University of Utah for their helpful comments. An earlier version of this paper benefited from comments by Carol Anilowski Cain, Brian Cadman, Asher Curtis, Patty Dechow, Paul Michaud, Venky Nagar, Larry Seiford, Ram Venkataraman, Norman White, and workshop participants at the 2006 AAA Annual Meeting, Harvard University, University of California, Berkeley, and Indiana University. Editor’s note: Accepted by Wayne Thomas. Submitted: July 2010 Accepted: August 2012 Published Online: October 2012 1 Following Dechow and Schrand (2004), we consider high-quality earnings to be those that accurately reflect companies’ current operating performance, and assume that managers take a shareholder/analyst perspective when determining the desired attributes of earnings (see Dechow et al. 2010). As we discuss further below, the managers we focus on are CFOs and their delegates, as we are interested in the accuracy of accrual estimations. 463
Transcript of THE ACCOUNTING REVIEW American Accounting …faculty.washington.edu/smcvay/DLLM_TAR.pdf · THE...

THE ACCOUNTING REVIEW American Accounting AssociationVol. 88, No. 2 DOI: 10.2308/accr-503182013pp. 463–498
Managerial Ability and Earnings Quality
Peter R. Demerjian
Emory University
Baruch Lev
New York University
Melissa F. Lewis
University of Utah
Sarah E. McVay
University of Washington
ABSTRACT: We examine the relation between managerial ability and earnings quality.
We find that earnings quality is positively associated with managerial ability. Specifically,
more able managers are associated with fewer subsequent restatements, higher
earnings and accruals persistence, lower errors in the bad debt provision, and higher
quality accrual estimations. The results are consistent with the premise that managerscan and do impact the quality of the judgments and estimates used to form earnings.
Keywords: managerial ability; managerial efficiency; earnings quality; accruals quality.
Data Availability: Data are publicly available from the sources identified in the text.
I. INTRODUCTION
We examine the relation between managerial ability and earnings quality. We anticipate
that superior managers are more knowledgeable of their business, leading to better
judgments and estimates and, thus, higher quality earnings.1 Alternatively, the benefit
We thank two anonymous reviewers, Asher Curtis, Patty Dechow, Ilia Dichev, Weili Ge, Marlene Plumlee, Phil Shane,Terry Shevlin, Wayne Thomas (editor), Ben Whipple, and workshop participants at the 2010 Kapnick AccountingConference at the University of Michigan, the 2010 Western Region Meeting, the 2010 FEA Conference, EmoryUniversity, Florida International University, University of Illinois, The University of Texas at Arlington, and theWednesday group at The University of Utah for their helpful comments. An earlier version of this paper benefited fromcomments by Carol Anilowski Cain, Brian Cadman, Asher Curtis, Patty Dechow, Paul Michaud, Venky Nagar, LarrySeiford, Ram Venkataraman, Norman White, and workshop participants at the 2006 AAA Annual Meeting, HarvardUniversity, University of California, Berkeley, and Indiana University.
Editor’s note: Accepted by Wayne Thomas.
Submitted: July 2010Accepted: August 2012
Published Online: October 2012
1 Following Dechow and Schrand (2004), we consider high-quality earnings to be those that accurately reflectcompanies’ current operating performance, and assume that managers take a shareholder/analyst perspectivewhen determining the desired attributes of earnings (see Dechow et al. 2010). As we discuss further below, themanagers we focus on are CFOs and their delegates, as we are interested in the accuracy of accrual estimations.
463

of higher quality earnings may not be sufficient to warrant the time and attention of skilled
management, especially if the variance of feasible estimates is small, in which case we may not find
an association between managerial ability and earnings quality.2
While the archival literature in the area of earnings quality has largely focused on firm-specific
characteristics, such as firm size and board independence (Dechow and Dichev 2002; Klein 2002),
we examine the manager-specific aspect of earnings quality. Our study is in the vein of Bertrand
and Schoar (2003), who find that managers have an effect on firm choices such as acquisitions or
research and development expenditures; Aier et al. (2005), who document that CFOs with more
accounting expertise have fewer restatements; and Francis et al. (2008), who document that
earnings quality varies inversely with CEO reputation.3
Our main measure of managerial ability (hereafter, the MA-Score) is developed in Demerjian
et al. (2012), although we perform robustness checks using historical returns, media citations, and
manager fixed effects (e.g., Fee and Hadlock 2003; Milbourn 2003; Francis et al. 2008; Dyreng et
al. 2010). Demerjian et al. (2012) first estimate total firm efficiency, where efficient firms are those
that generate more revenues from a given set of inputs. Total firm efficiency is influenced by both
the manager, who can, to varying degrees, predict future demand and understand industry trends,
and the firm, because (for example) managers in larger firms can negotiate better terms. Thus,
Demerjian et al. (2012) partition total efficiency between the firm and the manager, and verify that
the component attributed to the manager is associated with a variety of characteristics, including
managerial pay and the price reaction to management departures from the firm.4 Prior research is
limited to measures such as media coverage and historical returns, which are difficult to attribute
solely to the manager versus the firm (Francis et al. 2008), or manager fixed effects, where there is
evidence of a manager-specific effect, but the quantifiable effect is limited to managers who switch
firms (e.g., Bertrand and Schoar 2003; Bamber et al. 2010; Ge et al. 2011). The MA-Score allows
us to better distinguish the effect of the manager from the effect of the firm and to retain an ordinal
ranking of quality for a large sample of firms.5
We expect a more able management team to estimate accruals more accurately. For example,
we expect more able managers to be more knowledgeable of their client base and macro-economic
conditions when estimating bad debt expense, be more knowledgeable of the expected future
benefits of recorded assets, and to be more able to understand and apply complex standards (e.g.,
McNichols 2002; Plumlee and Yohn 2010).
2 Costs of poor earnings quality include higher cost of capital (Francis et al. 2004) and economically significantnegative price reactions to the announcement of earnings restatements (Palmrose et al. 2004).
3 We hypothesize a positive relation between ability and earnings quality, which is opposite to the relationdocumented in Francis et al. (2008). Francis et al. (2008) measure CEO reputation with the number of articlesmentioning the executive and document a negative association between the number of news articles pertaining tothe company’s CEO and earnings quality based on the Dechow and Dichev (2002) accruals quality measure. Wefind that this negative relation in Francis et al. (2008) appears to be due, at least in part, to measurement error inthe accruals quality measure (see Section IV).
4 As we clarify in the following sections, Demerjian et al. (2012) estimate total firm efficiency using dataenvelopment analysis, a type of frontier analysis that measures relative efficiency (see also Knechel et al. 2009).They then remove identifiable firm characteristics, such as size, that affect the firm’s relative efficiency but areunlikely to be a direct result of the quality of management. They attribute the unexplained portion of total firmefficiency to the management team. They document that their measure outperforms existing measures of abilitysuch as historical stock returns and media citations.
5 The ability score is for the management team. In our setting we would like to determine the quality of CFOs andtheir delegates, as we focus on the estimation of accruals, whereas CEOs are more focused on the overall strategyof the firm. Although we cannot disentangle the ability score by CEO and CFO, the ability score does encompassCFOs and their delegates, whereas media citations are, by definition, focused on the CEO. We also identify, inSection V, CFOs who switch firms within our sample to document CFO-specific fixed effects on accruals qualityand correlate the CFOs’ scores from their old firms with the accruals quality after their arrival in their new firms.
464 Demerjian, Lev, Lewis, and McVay
The Accounting ReviewMarch 2013

We consider four measures of earnings quality: the existence of an earnings restatement
(Anderson and Yohn 2002), the persistence of earnings (Richardson et al. 2005), errors in the bad
debt provision (McNichols and Wilson 1988), and the extent to which accruals map into cash flows
(Dechow and Dichev 2002).6 In general, we find that earnings quality is positively associated with
managerial ability. This finding is consistent with the premise that more capable managers are better
able to estimate accruals, which results in a more precise measure of earnings.
We contribute to both the earnings quality literature and the managerial ability literature by
establishing a positive and significant relation between managerial ability and earnings quality,
which suggests a means of improving earnings quality. Many of the factors associated with
earnings quality, such as firm size, industry, or operating cycle, result from strategic goals and
competitive advantages of the firm. Consequently, it may not be advantageous to improve earnings
quality by changing these characteristics. In contrast, we conclude that given the set of
earnings-estimation challenges resulting from the firm’s operating decisions, higher ability
managers will be able to better deal with these complexities and report higher quality earnings
relative to similar firms operating in similar environments. This finding is important for board
members when considering the costs and benefits of managers because managerial ability affects
not only the operations of the firm, but also the quality of its reported earnings and, in turn, its
share-price attributes and litigation exposure.
Our results also help reconcile the counter-intuitive prior findings that more reputable managers
are associated with lower accruals quality (Francis et al. 2008). We find that this relation appears to
be due, in part, to the impact of fundamental firm characteristics on the accruals quality measure. As
noted by Dechow and Dichev (2002), the accruals quality measure is influenced by both intentional
and unintentional errors, and many unavoidable unintentional errors stem from complex operating
environments (Dechow and Dichev 2002). Following the spirit of Ball and Shivakumar (2006), we
modify the Dechow and Dichev model to allow the coefficients of the model to vary with firm
fundamentals. This allows the model to incorporate variations in the expected relation between
accruals and cash flows across firms (see also Wysocki 2009). Our modifications allow us to
document a positive and significant association between managerial ability and accruals quality.
In the next section, we develop our hypothesis with a review of the literature. In Section III we
describe our sample, test variables, and descriptive statistics. In Section IV we present the main
results, and in Section V we consider alternative ability measures and conduct a change analysis for
a subset of managers in our sample who switch firms. We conclude the study in the final section.
II. HYPOTHESIS DEVELOPMENT AND RELATED LITERATURE
Earnings quality is an important characteristic of financial reports that affects the efficient
allocation of resources. Because earnings are the main input to investors’ and analysts’ valuation
models, firms with poor earnings quality tend to have higher costs of capital (e.g., Francis et al.
2004) and those experiencing restatements or SEC enforcement actions tend to experience an
economically significant negative price reaction to the announcement (Feroz et al. 1991; Palmrose
et al. 2004). Following Dechow and Schrand (2004), we define high-quality earnings to be those
that accurately reflect companies’ current operating performance.
We expect managers’ ability to form accurate judgments and estimates to vary across
individuals. We expect more able managers to be more knowledgeable about the firm and the
industry, as well as to be better able to synthesize information into reliable forward-looking
6 We use the term ‘‘earnings quality’’ to capture the general construct of higher quality reported earnings, while weuse the term ‘‘accruals quality’’ to discuss the Dechow and Dichev measure of earnings quality based on themapping of accruals to cash flows.
Managerial Ability and Earnings Quality 465
The Accounting ReviewMarch 2013

estimates with which to report higher quality earnings (e.g., Libby and Luft 1993). Specifically, we
expect accruals estimated by high-ability managers to be more accurate than those estimated by
low-ability managers. For example, consider the allowance for bad debt estimate. A less able
manager might apply the historical rate of bad debt for the firm, while a more able manager might
adjust the historical rate by considering the macro-economic and industry trends, as well as changes
in the firm’s customer base. Similarly, we expect more able managers to report more accurate and
justifiable depreciation rates, fair values, and other accrual estimates. Thus, holding the firm
constant, we expect a more able manager to report higher quality earnings.
H1: Managerial ability is positively associated with earnings quality.
It is possible that the majority of the variation in earnings quality is driven by innate firm
characteristics that managers cannot affect, in which case we will not find an association between
the ability of managers and the quality of earnings. It is also possible that the benefits to the
incremental improvement in earnings quality resulting from the intervention by an able manager do
not exceed the cost of that manager’s time, in which case, again, we will not find an association
between the manager’s ability and the firm’s earnings quality.
To date, the bulk of the literature on earnings quality has examined firm-specific characteristics.
For example, Dechow and Dichev (2002) document that earnings quality is poorer for firms that are
smaller, are experiencing losses, have greater sales and cash flow volatility, and have longer
operating cycles. Each of these innate firm characteristics makes accruals more difficult to estimate.
In addition to these innate characteristics, earnings quality has been found to vary with firm
infrastructure, such as internal control quality (Doyle et al. 2007; Ashbaugh-Skaife et al. 2008) and
monitors such as auditors (e.g., Becker et al. 1998) and boards (Klein 2002).
With respect to the effect of managers on the firm, Bamber et al. (2010) find that individual
managers appear to have particular ‘‘styles’’ that are associated with their propensity to issue
guidance and the characteristics of the resulting guidance (e.g., the precision of the guidance). In a
similar vein, both Ge et al. (2011) and DeJong and Ling (2010) examine manager fixed effects on
certain financial reporting policies and, similar to Bamber et al. (2010), document that individual
managers matter because firms’ accounting and disclosure policies vary with manager fixed effects.
As previously noted, this approach allows researchers to document a manager-specific effect, but it
is constrained to managers who switch employers among the sample firms. Fixed effects are also
usually limited to larger firms as executives within smaller firms often switch to private firms (Ge et
al. 2011).
Of particular relevance for our study, both Aier et al. (2005) and Francis et al. (2008) examine
whether earnings quality varies with managerial characteristics. Aier et al. (2005) document an
association between CFO expertise (years worked as CFO, experience at another company,
advanced degrees, and professional certifications) and restatements, concluding that firms
employing CFOs who have greater expertise have fewer restatements. Francis et al. (2008)
examine the relation between earnings quality and CEO reputation, measured by the number of
business press articles mentioning each CEO. They find a negative relation between CEO reputation
and earnings quality. They conclude that ‘‘boards of directors hire specific managers due to the
reputation and expertise these individuals bring to managing the more complex and volatile
operating environments of these firms’’ Francis et al. (2008).
In sum, there is mixed archival evidence on the impact of managers on earnings quality.
Although there is some evidence that managers with greater expertise are associated with fewer
earnings restatements, Francis et al. (2008) document that more reputable managers are associated
with lower earnings quality. The latter association is consistent with some firms having less
predictable, and thus lower quality, earnings by the nature of their business (Dechow and Schrand
2004; LaFond 2008) and these firms hiring better managers. Although it is more difficult to estimate
466 Demerjian, Lev, Lewis, and McVay
The Accounting ReviewMarch 2013

accruals within certain environments, such as more volatile firms, we expect that better managers
can estimate accruals more accurately for a given environment, for example, within loss firms.
We consider four earnings quality measures. The first is earnings restatements, which are defacto evidence of inaccurate earnings (Dechow et al. 2010).7 The second is earnings persistence,
where we partition earnings into accrual and cash flow components to examine accruals persistence
more directly (Sloan 1996; Richardson et al. 2005). Our third earnings quality measure is the
accuracy of the bad debt provision (McNichols and Wilson 1988). Finally, we examine the
mapping of working capital accruals into cash from operations, based on Dechow and Dichev
(2002).
Each of these measures is affected by both unintentional errors and intentional errors, and more
able managers may be more likely to introduce intentional errors, either to signal their private
information about the firm or to extract perquisites from the firm and the shareholders. We focus on
earnings quality measures that capture estimation errors in accruals, but do not attempt to
distinguish between intentional and unintentional errors.8
III. DATA, VARIABLE DEFINITIONS, AND DESCRIPTIVE STATISTICS
We obtain our data from the 2010 Annual Compustat File for the bulk of our earnings quality
variables and controls; from CRSP to form historical returns, an alternate managerial ability
measure; from ExecuComp to track CFOs across firms; from IRRC to obtain board independence
data; and from Audit Analytics for recent years of restatements and internal control opinions. We
also obtain several datasets made available by researchers, including managerial ability from
Demerjian et al. (2012), media citations from Baik et al. (2011), restatements from Hennes et al.
(2008) and Plumlee and Yohn (2010), and internal control quality data from Doyle et al. (2007).
We begin with all firms with managerial ability data and at least one of our earnings quality
variables. We then exclude firm-years with acquisition activity in excess of 5 percent of assets,
resulting in a maximum of 78,423 firm-year observations from 1989–2009. The period begins with
1989 because 1988 is the first year for which firms widely reported cash flow statements, and the
Dechow and Dichev accruals quality variable requires one year of historical cash flow data. The
sample ends in 2009 because our earnings quality variables described in the following section
require at least one year of future realizations. We exclude firms with material acquisition activity as
it could unduly affect both the measure of managerial ability and our earnings quality measures.
7 Some erroneous estimates of accruals are corrected prospectively, in that adjustments are made going forward,but prior earnings are not restated. In these cases, restatements offer an arguably weaker measure of earningsquality than the other measures we examine. Many erroneous judgments and estimates, however, areretrospectively restated. For example, when marking-to-market, managers must determine whether to rely ontraded prices or other valuations when traded prices do not appear to be reflective of the fair value. Further,managers must determine whether to write-down assets based on their judgment of whether the assets will berealized as future benefits. In their appendix, Plumlee and Yohn (2010) highlight restatements for both of thesesettings in which managers’ judgments were ex post deemed to be wrong. We corroborate in subsequent analysesthat a large number of restatements are attributable to managerial judgments and estimates, and that these are thetypes of restatements that are associated with managerial ability.
8 Because we examine a broad cross-section, we do not expect to find strong evidence of earnings management, onaverage (Dechow and Skinner 2000). It is possible that better managers are more likely to smooth earnings orotherwise use earnings management as a signaling mechanism (Tan and Jamal 2006), but it is also possible thatthey can more effectively use earnings management to extract personal benefits. Our measure of managerialability is based on efficiency, and does not incorporate ethical considerations (Kim et al. 2012). In the event ofearnings management, however, we expect more able managers to be better able to manage earnings successfully,for example, accelerating sales only if they know there will be sufficient sales in the next period to cover theacceleration, thereby avoiding large accrual reversals and restatements. We leave a direct examination of theinteraction between managerial ability and earnings management for future research.
Managerial Ability and Earnings Quality 467
The Accounting ReviewMarch 2013

Variable Definitions
Managerial Ability Measure
Our main measure of managerial ability, the MA-Score, is developed by Demerjian et al.
(2012), who generate an estimate of how efficiently managers use their firms’ resources. All firms
use capital, labor, and innovative assets to generate revenues. High-quality managers will generate a
higher rate of output from given inputs than lower quality managers, for example by applying
superior business systems and processes, such as supply chains and compensation systems.
Demerjian et al. (2012) use data envelopment analysis (DEA) to estimate firm efficiency within
industries, comparing the sales generated by each firm, conditional on the following inputs used by
the firm: Cost of Goods Sold, Selling and Administrative Expenses, Net PP&E, Net Operating
Leases, Net Research and Development, Purchased Goodwill, and Other Intangible Assets.9 Thus,
the measured resources reflect tangible and intangible assets, innovative capital (R&D), and other
inputs that are not reported separately in the financial statements, such as labor and consulting
services, but whose costs are included in cost of sales and SG&A. We provide the motivation and
definition for each of these variables in Appendix A.
Demerjian et al. (2012) use DEA to solve the following optimization problem:
maxvh ¼Sales
v1CoGSþ v2SG&Aþ v3PPEþ v4OpsLeaseþ v5R&Dþ v6Goodwillþ v7OtherIntan:
The optimization finds the firm-specific vector of optimal weights on the seven inputs, v, by
comparing each of the input choices of an individual firm to those of the other firms in its estimation
group. The efficiency measure that DEA produces, h, takes a value between 0 and 1, reflecting
constraints in the optimization program. Observations with a value of 1 are the most efficient and
the set of firms with efficiency equal to 1 trace a frontier through the efficient set of possible input
combinations. Observations with efficiency measures less than 1 fall below the frontier. A firm’s
DEA score indicates the degree to which the firm is efficient. A firm with a score of less than 1
would need to reduce costs or increase revenues to achieve efficiency.
The efficiency measure generated by the DEA estimation is attributable to both the firm and the
manager, similar to other measures of managerial ability such as historical returns and media
coverage. For example, a more able manager will be better able to predict trends, regardless of the
size of the firm, while a manager in a larger firm will, on average, be better able to negotiate terms
with suppliers, regardless of his or her quality. Demerjian et al. (2012) therefore modify the DEA-
generated firm efficiency measure by purging it of key firm-specific characteristics expected to aid
or hinder management’s efforts, including firm size, market share, positive free cash flow, and firm
age, which aid management, and complex multi-segment and international operations, which
challenge management.10 They estimate the following Tobit regression model by industry:
9 DEA is a frontier analysis that calculates efficiency as the ratio of weighted outputs to weighted inputs. DEA usesan optimization program to determine the firm-specific optimal or ‘‘implicit’’ weights on the inputs and outputs.The implicit weights capture the efficiency of the firm based on the selected inputs and outputs, allowing theoptimal mix of inputs and outputs to vary by firm. This differs from other efficiency measures, such as ROA orROE, that require an explicit set of weights, generally equal to 1. Since Demerjian et al. (2012) have only oneoutput, sales, its weight is standardized to 1 across observations. For the general DEA model, please see AppendixA.
10 To the extent that managers also affect some of the independent variables in Equation (1), such as free cash flow,the MA-Score is a conservative (understated) measure of managerial efficiency. We also supplement Demerjianet al.’s (2012) estimation by including risk as an additional independent variable, measured using leverage andbeta. We control for risk because superior operating performance that results from riskier operations is notnecessarily indicative of higher ability managers. We find similar results when we control for risk, indicating thatthe ability measure is not simply picking up firms with riskier operations.
468 Demerjian, Lev, Lewis, and McVay
The Accounting ReviewMarch 2013
Firm Efficiency ¼ a0 þ a1LnðTotal AssetsÞ þ a2Market Shareþ a3Positive Free Cash Flowþ a4LnðAgeÞ þ a5BusinessSegmentConcentrationþ a6Foreign Currency Indicator þ Year Indicators þ e: ð1Þ
The residual from the estimation is the MA-Score, which we attribute to the management team
and rely on as our main measure of managerial ability (MgrlAbility).11 We create decile ranks of
MgrlAbility by year and industry to make the score more comparable across time and industries and
to mitigate the influence of extreme observations. Untabulated analyses indicate that results are
similar using a continuous variable.
Demerjian et al. (2012) corroborate this measure by performing a number of validity tests.
First, the MA-Score is strongly associated with manager fixed effects, suggesting it reflects manager
characteristics, not just firm characteristics omitted from Equation (1). Second, they document a
negative (positive) stock price reaction when high-ability (low-ability) CEOs announce they are
leaving the firm. Third, they find that replacing CEOs with new CEOs of higher ability (lower
ability) is associated with improvements (declines) in subsequent firm performance. The MA-Score
is also positively correlated with CEO pay and historical returns and outperforms historical returns,
historical ROA, compensation, tenure, and media citations in each of their tests. Together, their
validity tests provide strong evidence that the MA-Score reflects managerial talent that is distinct
from the firm.
While the MA-Score is our main measure of managerial ability, it has several possible sources
of error in its measurement. First, Demerjian et al. (2012) acknowledge that in the first-stage DEA
estimation the inputs and output are measured with noise. For example, accounting variables, such
as sales and cost of goods sold, can be manipulated by management and can be measured
differently across firms, and some variables of interest, such as advertising or purchased research
and development are not available for most firm-year observations. To the extent that certain input
data are not available or are measured with error, the production function underlying the DEA
estimation is potentially incomplete or inaccurate. In addition, the second-stage estimation attributes
any firm efficiency outside of the set of the identified firm features, which are the explanatory
variables in Equation (1), to managerial ability. If the set of firm features is incomplete, then the
measure may overstate managerial ability by attributing efficiency inherent to the firm to the
manager. Thus, in Section V we also consider alternative measures of managerial ability, including
media citations, historical stock returns, and manager fixed effects.
Earnings Quality Measures
Dechow et al. (2010) note that there are a multitude of earnings quality measures used in the
literature. To examine the impact of managers on accrual estimation, we select earnings
restatements, earnings persistence, errors in the bad debt provision, and the mapping of accruals
into cash flows as our four measures of earnings quality. We select these measures because
increased correspondence between accruals and the associated economic activity likely reduces
earnings restatements, increases earnings persistence, and lowers the likelihood of errors in
accruals. Because we expect that better managers are able to report accruals that more closely
correspond to the underlying economic activity, we expect the earnings quality metrics that are
affected by judgments and accrual estimation to vary with managerial ability. For each of these
measures, we consider earnings quality in year tþ1 onward, i.e., in periods subsequent to year t,when managerial ability is measured. This reduces the likelihood that an economic shock
11 The MA-Score data are available at https://community.bus.emory.edu/personal/PDEMERJ/Pages/Home.aspx.
Managerial Ability and Earnings Quality 469
The Accounting ReviewMarch 2013

concurrently affects both our measurement of ability and earnings quality. We discuss each
earnings quality metric in greater detail in Section IV.12
Control Variables
Our main set of control variables is based on the firm-specific determinants of earnings quality
noted in Dechow and Dichev (2002) and Hribar and Nichols (2007), including firm size, proportion
of losses, sales volatility, cash flow volatility, and operating cycle. We also control for whether the
company’s auditor is a national audit firm, which is associated with earnings quality (Becker et al.
1998). Finally, we control for change in sales growth and abnormal returns to control for growth and
economic shocks to performance, both of which could potentially impact our measures of managerial
ability and earnings quality. We provide variable definitions and measurement periods in Table 1.
Descriptive Statistics
For each of our transformed variables (MgrlAbility, Historical Ret, Media Citations, AQ [and
modifications thereof], Firm Size, and Operating Cycle), we present the untransformed variable for
ease of interpretation in Table 1. By construction, managerial ability has a mean and median close
to 0, as this is a residual from Equation (1). The five-year historical return has a mean of
approximately 6 percent and, on average, CEOs are cited by the media approximately 44 times per
year or 219 times over five years. Approximately 13 percent of firms experience a restatement in the
next three years, and firm-specific earnings persistence averages approximately 0.23.13 The error in
the provision for bad debt as a percentage of sales (BDE Error) has a mean and median of 0.01.
Mean (median) AQ is�0.03 (�0.03), similar to that in Francis et al. (2004) and Dechow and Dichev
(2002), where we have multiplied the standard deviation by �1.
In Panel B of Table 1 we partition our earnings quality measures by managerial ability, where
low-quality (high-quality) managers are those in the bottom (top) quintile of managerial ability,
where quintiles are formed by industry-year. Historical returns are significantly higher among high-
quality managers, consistent with Fee and Hadlock (2003) and Demerjian et al. (2012), although
media citations are significantly lower for managers with higher ability, a relation we explore in
Section V. Restatements are more prevalent among low-quality managers, median firm-specific
earnings persistence is higher among high-quality managers, and errors in the provision for bad
12 We do not consider the absolute value of discretionary accruals, earnings smoothness and benchmarking, as therelation between improved accruals estimation and these metrics is not clear. For example, abnormally highaccruals may be high-quality accruals that are associated with cash flows, while abnormally low accruals mayreflect extreme negative performance, which also reflects the underlying economics of the firm. Neither of these‘‘abnormal’’ accruals provides information on the manager’s ability to appropriately estimate accruals, as themeasure does not incorporate ex post realizations. We do not consider timely loss recognition, as it is notapparent whether more or less timely loss recognition better reflects the underlying economics of the firm. Asnoted in Dechow et al. (2010), ERCs are a poor measure of earnings quality because much of the earningsinformation can be voluntarily disclosed prior to the earnings announcement. Finally, of the three externalindicators of earnings quality—restatements, AAERs, and internal control disclosures—we consider onlyrestatements. We do not consider AAERs because these tend to be more fraudulent than basic errors in estimation(Hennes et al. 2008). We do not consider internal control deficiencies as an outcome because the determinants ofinternal control problems are largely firm-specific, such as having adequate resources to establish and maintainthese controls. The role of an able manager in the determination of strong internal controls is less clear, and doesnot speak to management’s ability to estimate accruals.
13 We identify the firm-specific persistence in order to have a stand-alone measure of persistence. The 0.23 firm-specific persistence coefficient is lower than the typical coefficient for cross-sectional persistence because it is atime-series, firm-specific coefficient, based on quarterly observations of earnings per share rather than the moretraditional annual observations of ROA. When we estimate a cross-sectional regression by year, we find a meanearnings per share persistence coefficient of 1 and an ROA persistence coefficient of about 0.70.
470 Demerjian, Lev, Lewis, and McVay
The Accounting ReviewMarch 2013

TABLE 1
Descriptive Statistics
Panel A: Descriptive Statistics for the Full Sample (1989–2009)
Variable n Mean MedianStd.Dev. 25% 75%
MgrlAbilitya 78,423 0.00 �0.01 0.15 �0.09 0.07
Historical Reta 40,871 0.06 �0.35 2.17 �1.00 0.50
Media Citationsa 10,110 219.11 93.00 693.55 46.00 180.00
Restate 46,022 0.13 0.00 0.33 0.00 0.00
F.S. EarnPer 68,447 0.23 0.18 0.40 �0.02 0.48
BDE Error 1,124 0.01 0.01 0.05 0.00 0.01
AQa 51,925 �0.03 �0.03 0.03 �0.05 �0.01
Modified AQLOSS%a 52,316 �0.05 �0.03 0.05 �0.07 �0.02
Modified AQSI_LOSS%a 52,316 �0.05 �0.04 0.05 �0.07 �0.02
Modified AQNEGCFO%a 52,317 �0.05 �0.04 0.05 �0.07 �0.02
TotalEarnQuality 17,128 0.91 1.00 0.56 0.55 1.33
DWC 78,423 0.01 0.01 0.12 �0.03 0.05
CFO 78,423 �0.01 0.06 0.32 �0.03 0.13
FirmSizea 78,423 1,134.66 84.80 4,645.46 17.92 423.29
Loss% 73,231 0.40 0.33 0.37 0.00 0.80
SalesVolatility 68,152 0.23 0.16 0.23 0.09 0.30
CashFlowVolatility 65,641 0.10 0.06 0.14 0.04 0.12
OperCyclea 77,444 158.72 112.65 281.68 68.01 174.53
DSalesGrowth 67,849 �0.05 0.00 3.14 �0.15 0.31
AbnormalReturn 62,928 0.02 �0.11 0.73 �0.39 0.23
FutureEarnings 78,423 �0.12 0.02 0.73 �0.10 0.08
a For each of our transformed variables (MgrlAbility, Historical Ret, Media Citations, AQ, Modified AQ, FirmSize, andOperCycle), we present the untransformed variable for ease of interpretation.
Panel B: Accruals Quality Variables by Managerial Ability
Variable
Lowest Quintile ofMgrlAbility
Highest Quintile ofMgrlAbility
Diff.Mean
Diff.Med.Mean Median Mean Median
MgrlAbilitya �0.18 �0.17 0.20 0.18 *** ***
Historical Reta �0.42 �0.65 0.79 0.09 *** ***
Media Citationsa 278.48 107.00 151.07 79.00 *** ***
Restate 0.14 0.00 0.12 0.00 *** ***
F.S. EarnPer 0.21 0.15 0.25 0.20 ***
BDE Error 0.02 0.01 0.00 0.01 *** ***
AQa �0.036 �0.025 �0.037 �0.028 *** ***
TotalEarnQuality 0.82 0.89 0.93 1.00 *** ***
*** Denotes a difference in the mean (median) under a t-test (Chi-square test) with a two-tailed p-value of less than 0.01.a For each of our transformed variables (MgrlAbility, Historical Ret, Media Citations, AQ, Modified AQ, Firm Size, and
OperCycle), we present the untransformed variable for ease of interpretation.All continuous variables are winsorized at the extreme 1 percent. All variables are reported as of year t in this table only.
(continued on next page)
Managerial Ability and Earnings Quality 471
The Accounting ReviewMarch 2013
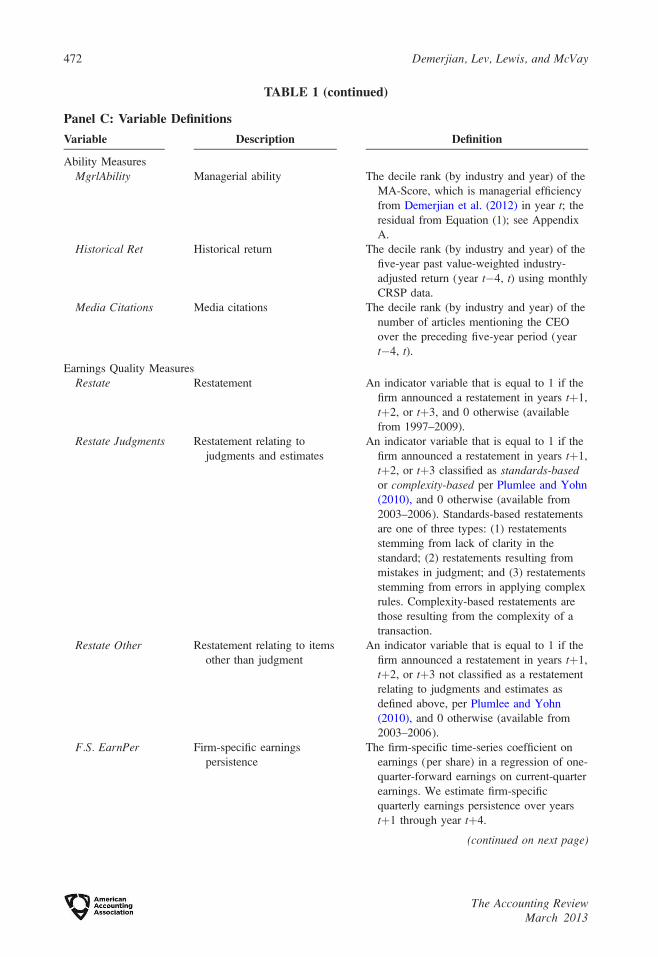
TABLE 1 (continued)
Panel C: Variable Definitions
Variable Description Definition
Ability Measures
MgrlAbility Managerial ability The decile rank (by industry and year) of the
MA-Score, which is managerial efficiency
from Demerjian et al. (2012) in year t; the
residual from Equation (1); see Appendix
A.
Historical Ret Historical return The decile rank (by industry and year) of the
five-year past value-weighted industry-
adjusted return (year t�4, t) using monthly
CRSP data.
Media Citations Media citations The decile rank (by industry and year) of the
number of articles mentioning the CEO
over the preceding five-year period (year
t�4, t).
Earnings Quality Measures
Restate Restatement An indicator variable that is equal to 1 if the
firm announced a restatement in years tþ1,
tþ2, or tþ3, and 0 otherwise (available
from 1997–2009).
Restate Judgments Restatement relating to
judgments and estimates
An indicator variable that is equal to 1 if the
firm announced a restatement in years tþ1,
tþ2, or tþ3 classified as standards-basedor complexity-based per Plumlee and Yohn
(2010), and 0 otherwise (available from
2003–2006). Standards-based restatements
are one of three types: (1) restatements
stemming from lack of clarity in the
standard; (2) restatements resulting from
mistakes in judgment; and (3) restatements
stemming from errors in applying complex
rules. Complexity-based restatements are
those resulting from the complexity of a
transaction.
Restate Other Restatement relating to items
other than judgment
An indicator variable that is equal to 1 if the
firm announced a restatement in years tþ1,
tþ2, or tþ3 not classified as a restatement
relating to judgments and estimates as
defined above, per Plumlee and Yohn
(2010), and 0 otherwise (available from
2003–2006).
F.S. EarnPer Firm-specific earnings
persistence
The firm-specific time-series coefficient on
earnings (per share) in a regression of one-
quarter-forward earnings on current-quarter
earnings. We estimate firm-specific
quarterly earnings persistence over years
tþ1 through year tþ4.
(continued on next page)
472 Demerjian, Lev, Lewis, and McVay
The Accounting ReviewMarch 2013

TABLE 1 (continued)
Variable Description Definition
BDE Error Unexplained bad debt
expense
The absolute value of the residual (ut) from
Equation (4) where three industries are
considered: printing and publishing,
nondurable wholesale goods, and business
services.
AQ Standard deviation of accrual
errors
The decile rank (by industry and year) of �1
3 Standard Deviation (etþ1, etþ2, etþ3,
etþ4), where etþn is the residual from
Equation (6) estimated by industry-year,
where industries are defined per Fama and
French (1997).
Modified AQLoss% Modified standard deviation
of accrual errors
The decile rank (by industry and year) of �1
3 Standard Deviation (etþ1, etþ2, etþ3,
etþ4), where etþn is the residual from
Equation (8) estimated by industry and the
quintile rank of Loss%, where ranks are
assigned annually by industry. Industries
are defined per Fama and French (1997).
Modified AQSI_Loss% Modified standard deviation
of accrual errors
The decile rank (by industry and year) of �1
3 Standard Deviation (etþ1, etþ2, etþ3,
etþ4), where etþn is the residual from
Equation (8) estimated by industry and the
quintile rank of Loss% Before SpecialItems, where ranks are assigned annually
by industry. Industries are defined per
Fama and French (1997).
Loss% Before SpecialItems
Loss percentage before
special items
The percentage of years reporting losses in
net income (IBC) excluding the impact of
special items over at least three of the last
five years (t–4, t). We exclude the impact
of special items by subtracting positive
special items from IBC and adding back
negative special items to IBC.
Modified AQNegCFO% Modified standard deviation
of accrual errors
The decile rank (by industry and year) of �1
3 Standard Deviation (etþ1, etþ2, etþ3,
etþ4), where etþn is the residual from
Equation (8) estimated by industry and the
quintile rank of Negative CFO% where
ranks are assigned annually by industry.
Industries are defined per Fama and French
(1997).
Negative CFO% Negative CFO percentage The percentage of years reporting negative
cash flows from operations over at least
three of the last five years (t–4, t).TotalEarnQuality Earnings quality summation
variable
The sum of three earnings quality variables:
(1) the rank of estimation accruals quality
(Modified AQLoss%); (2) the rank of firm-
specific earnings persistence; and (3) �1
3 Restate. Thus, the variable ranges from
a low of �1 to a high of 2.
(continued on next page)
Managerial Ability and Earnings Quality 473
The Accounting ReviewMarch 2013

TABLE 1 (continued)
Variable Description Definition
TotalEarnQuality2 Earnings quality summation
variable
The sum of three earnings quality variables:
(1) the rank of estimation accruals quality
using the annual AQ metric (ModifiedAQLoss%Ann); (2) the rank of firm-specific
earnings persistence; and (3) �1 3
Restate. Thus, the variable ranges from a
low of �1 to a high of 2.
Control Variables
FirmSize Firm size The natural log of the firm’s assets (AT)
reported at the end of year t.SalesVolatility Sales volatility The standard deviation of sales [(SALE)/
average assets (AT)] over at least three of
the last five years (t–4, t).CashFlowVolatility Cash flow volatility The standard deviation of cash from
operations [(OANCF)/average assets (AT)]
over at least three of the last five years (t–4, t).
OperCycle Operating cycle The natural log of the length of the firm’s
operating cycle, defined as sales turnover
plus days in inventory [(SALE/360)/
(average RECT) þ (COGS/360)/(average
INVT)] and is averaged over at least three
of the last five years (t–4, t).Loss% Loss history The percentage of years reporting losses in
net income (IBC) over at least three of the
last five years (t–4, t).National Auditor National auditor indicator An indicator variable set equal to 1 for firms
audited by national audit firms in year t, 0
otherwise.
DSalesGrowth One-year change in % sales
growth
The one-year change in sales growth defined
as current year’s sales growth (DSALEt/
SALEt�1) less prior year’s sales growth
(DSALEt�1/SALEt�2).
AbnormalReturn Abnormal return One-year market-adjusted buy-and-hold
return for year t where market returns are
value-weighted.
PctInd Board independence The percentage of board members classified
as independent based on IRRC’s
classification (available from 1996–2007).
ICW Internal control weakness An indicator variable for firms reporting
material weaknesses in internal control
(available from 2002–2007).
Other Variables
FutureEarnings Future net income Future earnings (IBC) scaled by average total
assets (AT).
Earnings Net income Earnings (IBC) scaled by average total assets
(AT).
(continued on next page)
474 Demerjian, Lev, Lewis, and McVay
The Accounting ReviewMarch 2013

debt are larger among low-quality managers, providing initial support for our hypothesis. We do not
find consistent evidence when examining earnings quality based on the Dechow and Dichev
measure, and explore this further in our multivariate analysis.
In Table 2 we find that managerial ability, measured with the MA-Score, is positively
correlated with future earnings and negatively correlated with historical losses. Managerial ability is
negatively correlated with restatements and errors in the provision for bad debt, and positively
correlated with firm-specific earnings persistence. The Dechow and Dichev accruals quality
measure, however, is negatively associated with the managerial ability, consistent with Francis et al.
(2008) and our results in Panel B of Table 1.
IV. TEST DESIGN AND RESULTS
Earnings Restatements
Our first measure of earnings quality is earnings restatements, which are ex post evidence of
erroneous reported earnings and thus have been used as a signal of poor earnings quality (Dechow
et al. 2010). Although restatements can occur for reasons other than errors in accrual estimation,
this earnings quality measure is the least reliant on an estimation procedure and, thus, provides a
relatively unambiguous signal of earnings quality. Moreover, we expect restatements to be
associated with errors in accrual estimation, as most restatements impact an accrual account
(Palmrose and Shultz 2004). This assertion is supported by Plumlee and Yohn (2010), who find that
a large number of restatements are a result of management’s judgments and estimates.14
TABLE 1 (continued)
Variable Description Definition
DWC Working capital accruals The change in working capital scaled by
average total assets, where working capital
is defined as follows: [� (RECCH þINVCH þ APALCH þ TXACH þAOLOCH)].
DREV Change in sales Current year change in sales (SALE) scaled
by average total assets (AT).
PPE Property, plant, and
equipment
Current year level of property, plant, and
equipment (PPENT) scaled by average
total assets (AT).
CFO Cash from operations Cash from operations (OANCF) scaled by
average total assets (AT).
Accruals Accruals Accruals (scaled by average total assets
(AT)), where Accruals ¼ Earnings �CFO.
Subscripts in Panel C correspond to the timing of the variable in all subsequent tables.
14 Although some accrual errors will result in prospective adjustments, other mistakes in judgments and estimateswill result in retroactive restatements (Plumlee and Yohn 2010). Plumlee and Yohn (2010) provide examples ofhow complexity and mistakes in judgments result in restatements. For example, firms have restated earningswhen they chose to rely on their own estimate of fair value for a security whose last traded price was notnecessarily indicative of fair value and ex post the SEC disagreed with the judgment made by management. Asanother example, firms have been required to restate earnings when subsequent information differs frommanagement’s expectations at the end of the fiscal year.
Managerial Ability and Earnings Quality 475
The Accounting ReviewMarch 2013

TA
BL
E2
Un
iva
ria
teC
orr
ela
tio
ns
Mg
rl-
Ab
ilit
yH
isto
rica
lR
etM
edia
Cit
ati
on
sF
utu
reE
arn
ing
sL
oss
%F
irm
Siz
eR
esta
teF
.S.
Ea
rnP
erB
DE
Err
or
AQ
Mo
difi
edA
QL
OS
S
Mo
difi
edA
QS
I
Mo
difi
edA
QC
FO
Mgr
lAbi
lity
0.2
3�
0.1
00
.27
�0
.22
0.0
0�
0.0
20
.04�
0.2
2�
0.0
20
.03
0.0
30
.00
His
tori
cal
Ret
0.2
4�
0.0
20
.41
�0
.44
0.2
2�
0.0
30
.13�
0.0
50
.16
0.2
30
.22
0.2
0M
edia
Cit
atio
ns�
0.0
9�
0.0
1�
0.1
00
.02
0.5
20
.01
�0
.10�
0.0
30
.11
0.0
70
.08
0.1
0F
utur
eEar
ning
s0
.08
0.2
6�
0.0
2�
0.5
60
.29
�0
.02
0.1
2�
0.1
70
.23
0.3
30
.32
0.2
9L
oss%
�0
.21
�0
.43
0.0
0�
0.3
3�
0.4
50
.01
�0
.07
0.3
2�
0.3
1�
0.4
2�
0.4
1�
0.3
7F
irm
Size
�0
.02
0.2
10
.53
0.3
0�
0.4
50
.06
0.0
2�
0.1
80
.41
0.4
20
.42
0.4
3R
esta
te�
0.0
2�
0.0
30
.01
�0
.01
0.0
10
.06
�0
.03�
0.0
30
.00
�0
.02
�0
.01
0.0
0
F.S
.E
arnP
er0
.04
0.1
3�
0.1
00
.03
�0
.06
0.0
2�
0.0
30
.09
0.0
20
.04
0.0
30
.02
BD
EE
rror
�0
.16
�0
.13
0.1
1�
0.1
30
.32
�0
.18
0.0
00
.07
0.0
20
.04
0.0
40
.06
AQ
�0
.02
0.1
70
.11
0.1
8�
0.3
10
.41
0.0
00
.01
0.0
20
.79
0.7
90
.83
Mod
ified
AQ
LO
SS
%0
.03
0.2
30
.08
0.2
2�
0.4
10
.42
�0
.02
0.0
3�
0.0
50
.78
0.9
20
.87
Mod
ified
AQ
SI_
Lo
ss%
0.0
30
.23
0.0
80
.22
�0
.41
0.4
3�
0.0
10
.03�
0.0
70
.79
0.9
20
.87
Mod
ified
AQ
Neg
CF
O%
0.0
00
.20
0.1
00
.21
�0
.37
0.4
4�
0.0
10
.02�
0.0
20
.83
0.8
70
.87
Bold
den
ote
ssi
gnifi
cant
corr
elat
ion
coef
fici
ents
atth
e10
per
cent
alpha
level
.T
his
table
report
sP
ears
on
corr
elat
ion
coef
fici
ents
bel
ow
the
dia
gonal
and
Spea
rman
corr
elat
ion
coef
fici
ents
above
the
dia
gonal
.W
edec
ile
rank
Mgrl
Abil
ity,
His
tori
cal
Ret
,M
edia
Cit
atio
ns,
F.S
.E
arnP
er,
AQ
,an
dA
Qm
odifi
cati
ons
by
indust
ry-y
ear.
See
Tab
le1,
Pan
elC
for
var
iable
defi
nit
ions.
476 Demerjian, Lev, Lewis, and McVay
The Accounting ReviewMarch 2013

Restate is an indicator variable that is equal to 1 if there is an announcement of a financial
restatement in years tþ1, 2, or 3. In our main analysis, we use the restatement data from Hennes et
al. (2008) for restatements announced from 1997–2006 and from Audit Analytics for restatements
announced from 2007–2010.15 We then supplement our main analysis with those restatements
identified as due to management’s judgments and estimates per Plumlee and Yohn (2010), using the
sample from their study.16
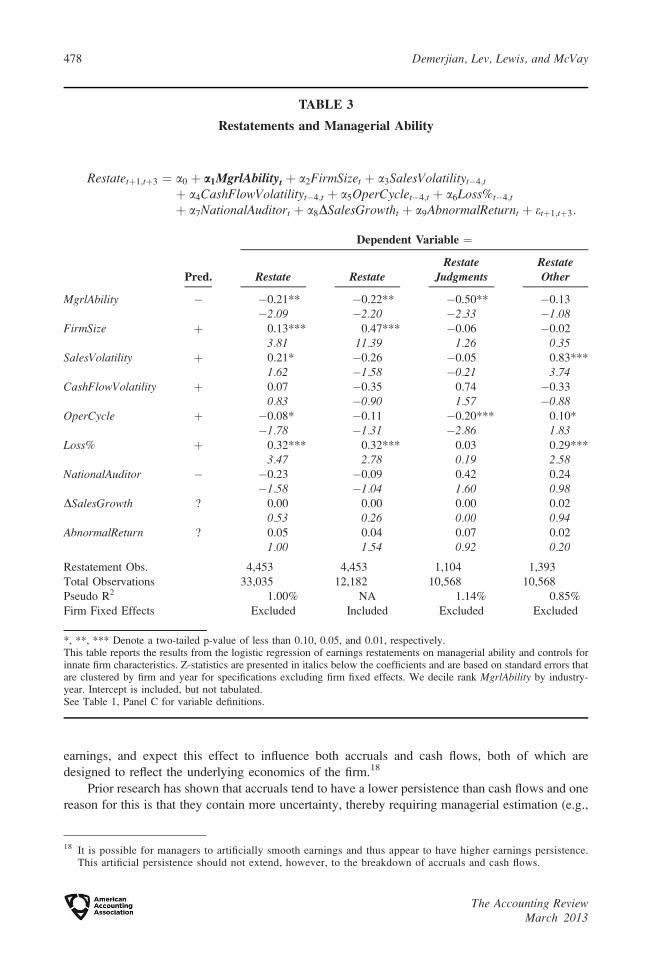
To determine whether managerial ability varies with earnings restatements, we estimate the
following equation using a pooled logistic regression:
Restatetþ1;tþ3 ¼ a0 þ a1MgrlAbilityt þ a2FirmSizet þ a3SalesVolatiltyt�4;t
þ a4CashFlowVolatilityt�4;t þ a5OperCyclet�4;t þ a6Loss%t�4;t
þ a7NationalAuditort þ a8DSalesGrowtht þ a9AbnormalReturnt þ etþ1;tþ3:
ð2Þ
We include each of the control variables discussed above. Because our tests rely on panel data,
standard errors may be correlated within years and across time by firm. Thus, unless otherwise
noted, in this and all subsequent estimations we either cluster our standard errors by firm and year
(Petersen 2009) or include firm fixed effects.
In Table 3 the first (second) estimation considers all restatements, and excludes (includes) firm
fixed effects. As in our univariate analysis, we document a negative relation between managerial
ability and restatements, supporting our hypothesis that more able managers are associated with
higher quality earnings. The more efficient the manager, the less likely the firm is to restate (a1¼�0.21; p , 0.05). Given that the unconditional likelihood of having a restatement is 13 percent,
untabulated results indicate that the marginal effect is economically significant at �2.4 percent.
In the second set of estimations in Table 3, we examine the restatements from 2003–2006
considered in Plumlee and Yohn (2010) and partition the sample between those restatements
associated with management’s judgments and estimates in column 3 and all other restatements in
column 4. We find that only those restatements associated with management’s judgments and
estimates are associated with managerial ability.17 These findings support our use of Restate as an
earnings quality metric affected by managers’ judgments and estimates. Again, however, a
limitation of Restate as a measure of earnings quality is that many errors in judgments and accruals
estimates will not result in a retrospective restatement, illustrating the importance of considering
multiple earnings quality measures. We expect each of our remaining earnings quality measures to
be lower in the presence of errors in judgments and estimates, even when these errors do not result
in a restatement of previously issued financial statements.
Earnings Persistence
Our second measure of earnings quality is earnings persistence, which is frequently discussed
as a measure of earnings quality (e.g., Dechow et al. 2010). We expect higher ability managers to
choose better projects, have an improved understanding of risk, and manage the firm’s operations
more efficiently (by construction). Thus, we expect more able managers to have more persistent
15 We thank the authors for the GAO-based dataset, which is available at http://sbaleone.bus.miami.edu/.16 We thank the authors for providing us both the restatement data and their coding of the restatements between
those related to judgments and estimates and other restatements.17 Other restatements include internal errors and manipulation. We do not estimate these specifications with firm
fixed effects, which require variation in the dependent variable for estimation and, thus, result in a sample size ofonly 1,834 of the 10,568 observations.
Managerial Ability and Earnings Quality 477
The Accounting ReviewMarch 2013
earnings, and expect this effect to influence both accruals and cash flows, both of which are
designed to reflect the underlying economics of the firm.18
Prior research has shown that accruals tend to have a lower persistence than cash flows and one
reason for this is that they contain more uncertainty, thereby requiring managerial estimation (e.g.,
TABLE 3
Restatements and Managerial Ability
Restatetþ1;tþ3 ¼ a0 þ a1MgrlAbilityt þ a2FirmSizet þ a3SalesVolatilityt�4;t
þ a4CashFlowVolatilityt�4;t þ a5OperCyclet�4;t þ a6Loss%t�4;t
þ a7NationalAuditort þ a8DSalesGrowtht þ a9AbnormalReturnt þ etþ1;tþ3:
Pred.
Dependent Variable ¼
Restate RestateRestate
JudgmentsRestateOther
MgrlAbility � �0.21** �0.22** �0.50** �0.13
�2.09 �2.20 �2.33 �1.08FirmSize þ 0.13*** 0.47*** �0.06 �0.02
3.81 11.39 1.26 0.35SalesVolatility þ 0.21* �0.26 �0.05 0.83***
1.62 �1.58 �0.21 3.74CashFlowVolatility þ 0.07 �0.35 0.74 �0.33
0.83 �0.90 1.57 �0.88OperCycle þ �0.08* �0.11 �0.20*** 0.10*
�1.78 �1.31 �2.86 1.83Loss% þ 0.32*** 0.32*** 0.03 0.29***
3.47 2.78 0.19 2.58NationalAuditor � �0.23 �0.09 0.42 0.24
�1.58 �1.04 1.60 0.98DSalesGrowth ? 0.00 0.00 0.00 0.02
0.53 0.26 0.00 0.94AbnormalReturn ? 0.05 0.04 0.07 0.02
1.00 1.54 0.92 0.20
Restatement Obs. 4,453 4,453 1,104 1,393
Total Observations 33,035 12,182 10,568 10,568
Pseudo R2 1.00% NA 1.14% 0.85%
Firm Fixed Effects Excluded Included Excluded Excluded
*, **, *** Denote a two-tailed p-value of less than 0.10, 0.05, and 0.01, respectively.This table reports the results from the logistic regression of earnings restatements on managerial ability and controls forinnate firm characteristics. Z-statistics are presented in italics below the coefficients and are based on standard errors thatare clustered by firm and year for specifications excluding firm fixed effects. We decile rank MgrlAbility by industry-year. Intercept is included, but not tabulated.See Table 1, Panel C for variable definitions.
18 It is possible for managers to artificially smooth earnings and thus appear to have higher earnings persistence.This artificial persistence should not extend, however, to the breakdown of accruals and cash flows.
478 Demerjian, Lev, Lewis, and McVay
The Accounting ReviewMarch 2013
Richardson et al. 2005). Thus, in addition to more persistent accruals and cash flows related to
operations, we expect an incremental effect of managerial ability on the persistence of the accrual
component of earnings. In sum, we have two expectations related to our hypothesis that higher
ability managers report higher quality earnings: (1) earnings reported by higher ability managers are
more persistent than earnings reported by lower ability managers due to both superior operations
and superior accrual estimation, and (2) higher ability managers’ impact on accruals exceeds their
impact on cash flows because the former reflects both operational efficiency and superior accrual
estimation. We examine earnings persistence using the following model:
Earningstþ1;tþn ¼ a0 þ a1Earningst þ a2Earningst 3 MgrlAbilityt þ a3MgrlAbilityt
þ a4FirmSizet þ a5SalesVolatilityt�4;t þ a6CashFlowVolatilityt�4;t
þ a7OperCyclet�4;t þ a8Loss%t�4;t þ a9NationalAuditort
þ a10DSalesGrowtht þ a11AbnormalReturnt þ etþ1;tþn: ð3Þ
We calculate earnings as earnings before extraordinary items (Xpressfeed [hereafter ‘‘XFN’’]
variable¼ IBC) scaled by average total assets (XFN¼AT) and then separate earnings into accruals
and cash flow components. Because earnings persistence is not desirable for loss firms, we estimate
profit and loss firms separately and only tabulate results for profit firms.19
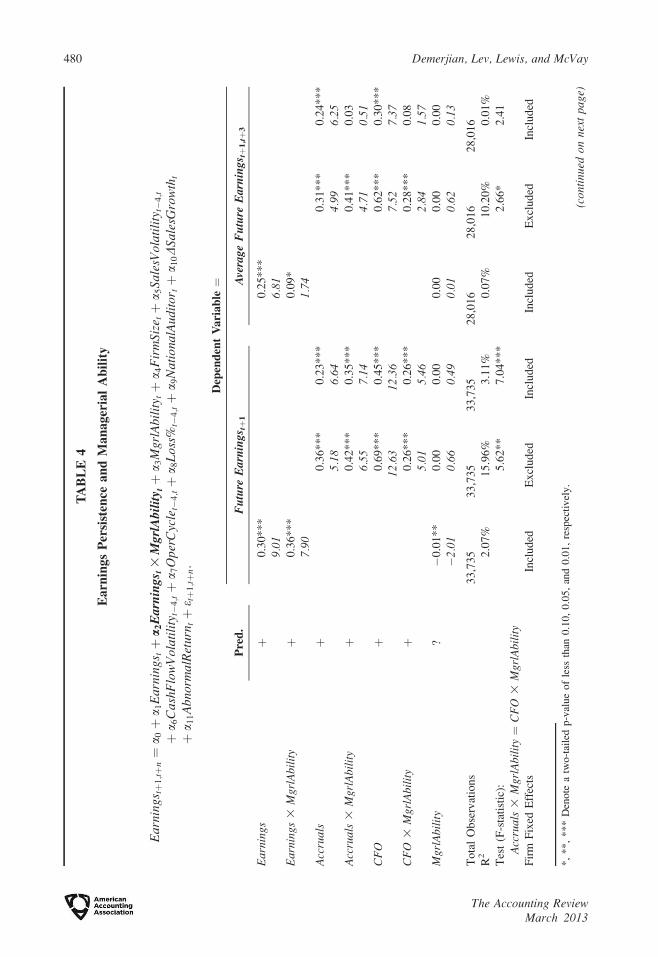
In Table 4 we examine the impact of managerial ability on earnings persistence and then more
formally examine our hypothesis by investigating the relative impact of ability on the persistence of
accruals and cash flows. In the first column of estimates, which control for firm fixed effects, the
base persistence is 0.30 and is increasing with managerial ability. Earnings persistence is expected
to increase from 0.30 to 0.66 (0.30þ 0.36) for firms with positive earnings when moving from the
lowest to the highest decile of managerial ability. Although not tabulated, we find similar results
when firm fixed effects are excluded.
When we partition earnings into accruals and cash flows, managerial ability increases the
persistence of both components, but increases the accrual component more than the cash flow
component. The accruals reported by positive earnings firms have a base persistence of 0.36 when
firm fixed effects are excluded. The incremental coefficient on accruals for firms with higher ability
managers is 0.42 (p , 0.01). In comparison, the base persistence of cash flows is 0.69, and the
incremental coefficient on cash flows for firms with higher ability managers is 0.26 (p , 0.01), and
this incremental effect is statistically smaller than that of accruals (p , 0.05). We find similar
results when we include firm fixed effects in the model. These findings support our hypothesis that
higher quality managers are better able to estimate accruals, resulting in higher earnings quality, and
also support our prediction that higher quality managers operate their businesses more effectively.
We also replace one-year-forward earnings with average earnings from year tþ1 to tþ3 in order
to reduce the impact of economic shocks occurring in any particular year. Results are similar,
although the interaction between managerial ability and accruals becomes insignificant when firm
fixed effects are included.
McNichols and Wilson (1988) Error in the Provision for Bad Debt
Our third measure of earnings quality is the provision for bad debt, modeled in McNichols and
Wilson (1988), as follows:
19 For this test, in order to continue to present the dependent variable in year tþ1, we include earnings in year t, thesame period in which managerial ability is estimated. Results are not sensitive to this timing choice. For example,untabulated results indicate that conclusions remain unchanged if we continue to measure managerial ability attime t, but consider how much of year tþ1 earnings persists into year tþ2.
Managerial Ability and Earnings Quality 479
The Accounting ReviewMarch 2013
TA
BL
E4
Earn
ings
Per
sist
ence
an
dM
an
ager
ial
Ab
ilit
y
Ear
ning
s tþ
1;tþ
n¼
a 0þ
a 1E
arni
ngs tþ
a2E
arn
ing
s t3
Mg
rlA
bil
ity tþ
a 3M
grlA
bili
tytþ
a 4F
irm
Size
tþ
a 5Sa
lesV
ola
tili
tyt�
4;t
þa 6
Cas
hFlo
wV
olat
ilit
y t�
4;tþ
a 7O
perC
ycle
t�4;tþ
a 8L
oss%
t�4;tþ
a 9N
atio
nalA
udit
ortþ
a 10D
Sa
lesG
row
tht
þa 1
1A
bnor
mal
Ret
urn
tþ
e tþ
1;tþ
n:
Pre
d.
Dep
end
ent
Va
ria
ble¼
Fu
ture
Ea
rnin
gs tþ
1A
vera
ge
Fu
ture
Ea
rnin
gs tþ
1,tþ
3
Ear
ning
sþ
0.3
0*
**
0.2
5*
**
9.01
6.81
Ear
ning
s3
Mgr
lAbi
lity
þ0
.36
**
*0
.09
*
7.90
1.74
Acc
rual
sþ
0.3
6*
**
0.2
3*
**
0.3
1*
**
0.2
4*
**
5.18
6.64
4.99
6.2
5A
ccru
als
3M
grlA
bili
tyþ
0.4
2*
**
0.3
5*
**
0.4
1*
**
0.0
3
6.55
7.14
4.71
0.5
1C
FO
þ0
.69
**
*0
.45
**
*0
.62
**
*0
.30
**
*
12.6
312
.36
7.52
7.3
7C
FO
3M
grlA
bili
tyþ
0.2
6*
**
0.2
6*
**
0.2
8*
**
0.0
8
5.01
5.46
2.84
1.5
7M
grlA
bili
ty?
�0
.01
**
0.0
00
.00
0.0
00
.00
0.0
0
�2.
010.
660.
490.
010.
620
.13
To
tal
Ob
serv
atio
ns
33
,73
53
3,7
35
33
,73
52
8,0
16
28
,01
62
8,0
16
R2
2.0
7%
15
.96
%3
.11
%0
.07
%1
0.2
0%
0.0
1%
Tes
t(F
-sta
tist
ic):
Acc
rual
s3
Mgr
lAbi
lity¼
CF
O3
Mgr
lAbi
lity
5.6
2*
*7
.04
**
*2
.66
*2
.41
Fir
mF
ixed
Eff
ects
Incl
uded
Excl
uded
Incl
uded
Incl
uded
Excl
uded
Incl
uded
*,
**,
***
Den
ote
atw
o-t
aile
dp-v
alue
of
less
than
0.1
0,
0.0
5,
and
0.0
1,
resp
ecti
vel
y.
(con
tinu
edo
nn
ext
pa
ge)
480 Demerjian, Lev, Lewis, and McVay
The Accounting ReviewMarch 2013

TA
BL
E4
(co
nti
nu
ed)
This
table
pre
sents
the
OL
Sre
gre
ssio
nre
sult
sin
ves
tigat
ing
the
rela
tion
bet
wee
nm
anag
eria
lab
ilit
yan
dea
rnin
gs
per
sist
ence
for
firm
sw
ith
posi
tive
earn
ings
inyea
rt.
t-st
atis
tics
are
pre
sente
din
ital
ics
bel
ow
the
coef
fici
ents
and
are
bas
edon
stan
dar
der
rors
that
are
clust
ered
by
firm
and
yea
rin
spec
ifica
tions
excl
udin
gfi
rmfi
xed
effe
cts.
We
dec
ile
rank
Mgr
lAbi
lity
by
indust
ry-y
ear.
Our
mai
nse
tof
contr
ol
var
iable
s(F
irm
Size
,Sa
lesV
olat
ilit
y,C
ashF
low
Vol
atil
ity,
Oper
Cyc
le,
Loss
%,
DSale
sGro
wth
,A
bnorm
alR
eturn
,an
dN
atio
nalA
udit
or)
are
incl
uded
inth
em
odel
.F
or
succ
inct
nes
s,how
ever
,re
sult
sfo
rth
eco
ntr
ol
var
iable
sar
enot
tabula
ted.
Inte
rcep
tis
incl
uded
,but
not
tabula
ted
.S
eeT
able
1,
Pan
elC
for
var
iable
defi
nit
ions.
Managerial Ability and Earnings Quality 481
The Accounting ReviewMarch 2013

Bad Debt Expenset ¼ a0 þ a1Allowance for Doubtful Accountst�1 þ a2Write-Offst
þ a3Write-Offstþ1 þ ut; ð4Þ
where Bad Debt Expense and Write-Offs are hand-collected from the firm’s SEC filings and
Allowance for Doubtful Accounts is available from Xpressfeed (XFN¼ RECD). All variables are
deflated by sales in year t. Implicit in our use of this model is a balance sheet perspective to
estimating bad debt, adherence to GAAP, and perfect foresight of future write-offs.
The error (ut) has two components: a discretionary ‘‘earnings management’’ component and a
forecast error component (McNichols and Wilson 1988). If managers’ estimates are unbiased, on
average, then errors in the bad debt accrual will vary with forecast accuracy, and we expect this
error (ut) to decrease with managerial ability. Jackson and Liu (2010), however, present evidence
that the mean earnings management portion of ut is positive; specifically, they find that managers
tend to overstate the allowance for doubtful accounts that they can later reverse into income. Under
the assumption that all managers engage in the same degree of earnings management, the variation
in the bad debt error will be driven by variation in accrual-estimation quality, and thus we continue
to expect the error to decrease with managerial ability.20
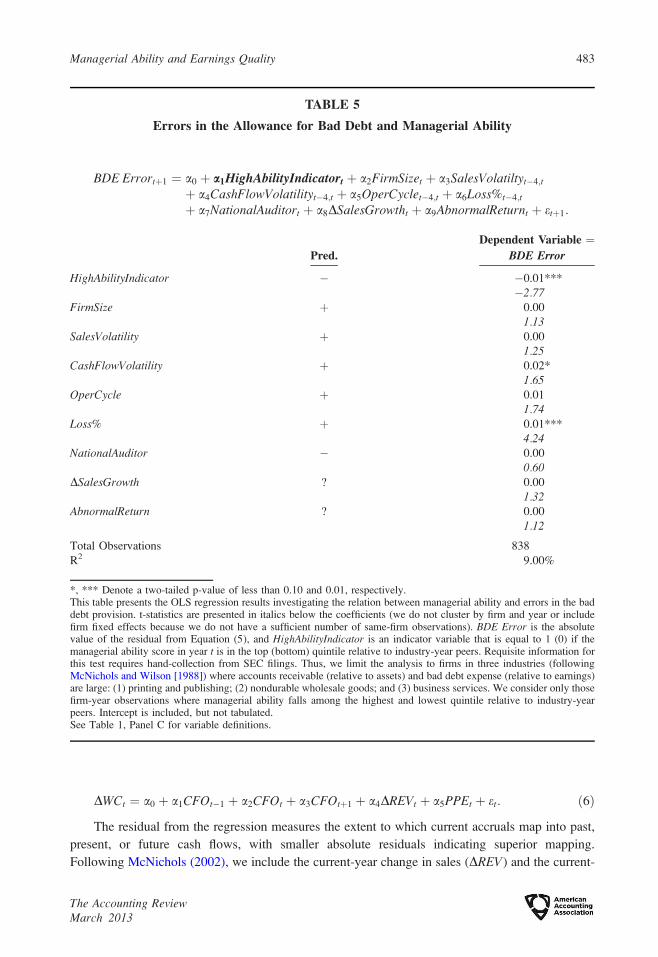
Because the data for this analysis must be hand-collected from SEC filings, we limit the
analysis to firms with managers in the top or bottom quintiles of managerial ability and, following
McNichols and Wilson (1988), to three accounts-receivable-intensive industries: (1) printing and
publishing, (2) nondurable wholesale goods, and (3) business services, to estimate:
BDE Errortþ1 ¼ a0 þ a1HighAbilityIndicatort þ a2FirmSizet þ a3SalesVolatilityt�4;t
þ a4CashFlowVolatilityt�4;t þ a5OperCyclet�4;t þ a6Loss%t�4;t
þ a7NationalAuditort þ a8DSalesGrowtht þ a9AbnormalReturnt þ etþ1; ð5Þ
where BDE Error is the absolute value of the residual from Equation (4), and HighAbilityIndicatoris an indicator variable that is equal to 1 (0) if the managerial ability score in year t is in the top
(bottom) quintile relative to industry-year peers. A negative coefficient on HighAbilityIndicator is
consistent with more able managers forming better estimates of bad debt provisions. Results are
presented in Table 5. In support of our hypothesis, a1 is�0.01 (p , 0.01), consistent with managers
with higher ability scores producing higher quality bad debt provisions.21
The Dechow and Dichev Measure of Accruals Quality
Our final measure of earnings quality follows Dechow and Dichev (2002), who posit that high-
quality accruals are eventually realized as cash flows. Incorrectly estimated accruals are less likely
to be realized as cash flows. We hypothesize that the better managers know their business, the less
likely they are to have erroneous accruals. We determine how well a firm’s accruals map into cash
flows by estimating the following regression by industry (Fama and French 1997) and year:22
20 Alternatively, if higher ability managers engage in more earnings management, then our tests are conservative.Only if higher ability managers engage in less earnings management would the findings of Jackson and Liu(2010) weaken the basis for our conclusions. In this setting, the negative relation between managerial ability andthe bad debt error (ut) could result from better estimations, less earnings management, or both. In this latter case,the bad debt error analysis is a weak test of the relation between managerial ability and estimation quality, butcontinues to speak to the broader conclusions regarding earnings quality.
21 Because our sample selection procedure for this analysis results in a small sample of firm-years that do notnecessarily contain the same firm over multiple years (i.e., we do not have panel data), we do not cluster standarderrors by firm and year, nor do we estimate a firm fixed effects specification. In untabulated results, however, wecontinue to observe a negative and significant relation between managerial ability and BDE Error when wecluster standard errors by year or include year fixed effects.
22 We delete those observations for which the industry group has less than 20 observations in any given year.
482 Demerjian, Lev, Lewis, and McVay
The Accounting ReviewMarch 2013
DWCt ¼ a0 þ a1CFOt�1 þ a2CFOt þ a3CFOtþ1 þ a4DREVt þ a5PPEt þ et: ð6Þ
The residual from the regression measures the extent to which current accruals map into past,
present, or future cash flows, with smaller absolute residuals indicating superior mapping.
Following McNichols (2002), we include the current-year change in sales (DREV) and the current-
TABLE 5
Errors in the Allowance for Bad Debt and Managerial Ability
BDE Errortþ1 ¼ a0 þ a1HighAbilityIndicatort þ a2FirmSizet þ a3SalesVolatiltyt�4;t
þ a4CashFlowVolatilityt�4;t þ a5OperCyclet�4;t þ a6Loss%t�4;t
þ a7NationalAuditort þ a8DSalesGrowtht þ a9AbnormalReturnt þ etþ1:
Pred.
Dependent Variable ¼BDE Error
HighAbilityIndicator � �0.01***
�2.77FirmSize þ 0.00
1.13SalesVolatility þ 0.00
1.25CashFlowVolatility þ 0.02*
1.65OperCycle þ 0.01
1.74Loss% þ 0.01***
4.24NationalAuditor � 0.00
0.60DSalesGrowth ? 0.00
1.32AbnormalReturn ? 0.00
1.12
Total Observations 838
R2 9.00%
*, *** Denote a two-tailed p-value of less than 0.10 and 0.01, respectively.This table presents the OLS regression results investigating the relation between managerial ability and errors in the baddebt provision. t-statistics are presented in italics below the coefficients (we do not cluster by firm and year or includefirm fixed effects because we do not have a sufficient number of same-firm observations). BDE Error is the absolutevalue of the residual from Equation (5), and HighAbilityIndicator is an indicator variable that is equal to 1 (0) if themanagerial ability score in year t is in the top (bottom) quintile relative to industry-year peers. Requisite information forthis test requires hand-collection from SEC filings. Thus, we limit the analysis to firms in three industries (followingMcNichols and Wilson [1988]) where accounts receivable (relative to assets) and bad debt expense (relative to earnings)are large: (1) printing and publishing; (2) nondurable wholesale goods; and (3) business services. We consider only thosefirm-year observations where managerial ability falls among the highest and lowest quintile relative to industry-yearpeers. Intercept is included, but not tabulated.See Table 1, Panel C for variable definitions.
Managerial Ability and Earnings Quality 483
The Accounting ReviewMarch 2013
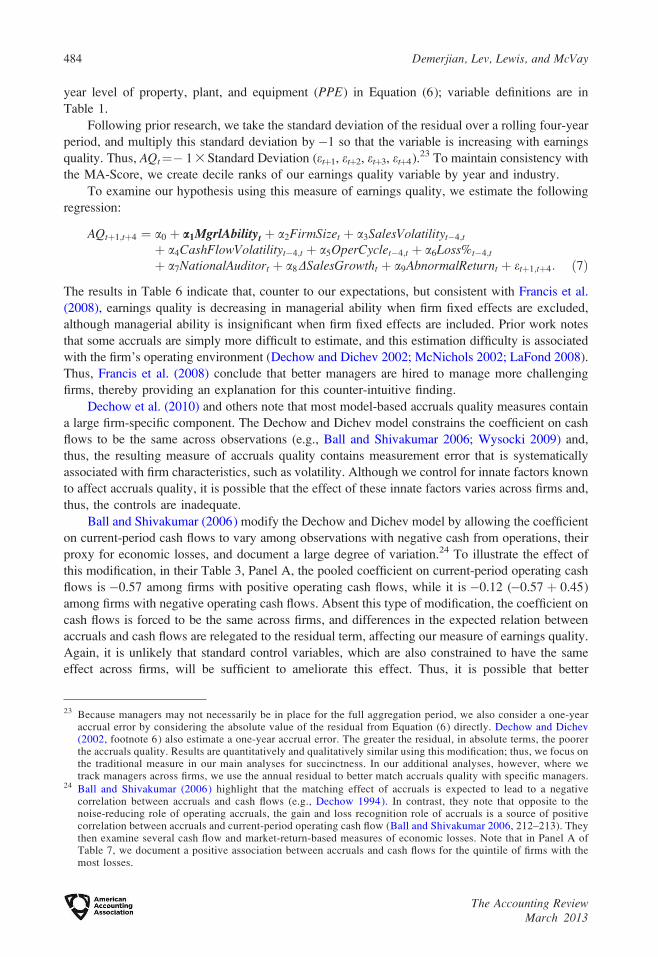
year level of property, plant, and equipment (PPE) in Equation (6); variable definitions are in
Table 1.
Following prior research, we take the standard deviation of the residual over a rolling four-year
period, and multiply this standard deviation by�1 so that the variable is increasing with earnings
quality. Thus, AQt¼� 1 3 Standard Deviation (etþ1, etþ2, etþ3, etþ4).23 To maintain consistency with
the MA-Score, we create decile ranks of our earnings quality variable by year and industry.
To examine our hypothesis using this measure of earnings quality, we estimate the following
regression:
AQtþ1;tþ4 ¼ a0 þ a1MgrlAbilityt þ a2FirmSizet þ a3SalesVolatilityt�4;t
þ a4CashFlowVolatilityt�4;t þ a5OperCyclet�4;t þ a6Loss%t�4;t
þ a7NationalAuditort þ a8DSalesGrowtht þ a9AbnormalReturnt þ etþ1;tþ4: ð7Þ
The results in Table 6 indicate that, counter to our expectations, but consistent with Francis et al.
(2008), earnings quality is decreasing in managerial ability when firm fixed effects are excluded,
although managerial ability is insignificant when firm fixed effects are included. Prior work notes
that some accruals are simply more difficult to estimate, and this estimation difficulty is associated
with the firm’s operating environment (Dechow and Dichev 2002; McNichols 2002; LaFond 2008).
Thus, Francis et al. (2008) conclude that better managers are hired to manage more challenging
firms, thereby providing an explanation for this counter-intuitive finding.
Dechow et al. (2010) and others note that most model-based accruals quality measures contain
a large firm-specific component. The Dechow and Dichev model constrains the coefficient on cash
flows to be the same across observations (e.g., Ball and Shivakumar 2006; Wysocki 2009) and,
thus, the resulting measure of accruals quality contains measurement error that is systematically
associated with firm characteristics, such as volatility. Although we control for innate factors known
to affect accruals quality, it is possible that the effect of these innate factors varies across firms and,
thus, the controls are inadequate.
Ball and Shivakumar (2006) modify the Dechow and Dichev model by allowing the coefficient
on current-period cash flows to vary among observations with negative cash from operations, their
proxy for economic losses, and document a large degree of variation.24 To illustrate the effect of
this modification, in their Table 3, Panel A, the pooled coefficient on current-period operating cash
flows is �0.57 among firms with positive operating cash flows, while it is �0.12 (�0.57 þ 0.45)
among firms with negative operating cash flows. Absent this type of modification, the coefficient on
cash flows is forced to be the same across firms, and differences in the expected relation between
accruals and cash flows are relegated to the residual term, affecting our measure of earnings quality.
Again, it is unlikely that standard control variables, which are also constrained to have the same
effect across firms, will be sufficient to ameliorate this effect. Thus, it is possible that better
23 Because managers may not necessarily be in place for the full aggregation period, we also consider a one-yearaccrual error by considering the absolute value of the residual from Equation (6) directly. Dechow and Dichev(2002, footnote 6) also estimate a one-year accrual error. The greater the residual, in absolute terms, the poorerthe accruals quality. Results are quantitatively and qualitatively similar using this modification; thus, we focus onthe traditional measure in our main analyses for succinctness. In our additional analyses, however, where wetrack managers across firms, we use the annual residual to better match accruals quality with specific managers.
24 Ball and Shivakumar (2006) highlight that the matching effect of accruals is expected to lead to a negativecorrelation between accruals and cash flows (e.g., Dechow 1994). In contrast, they note that opposite to thenoise-reducing role of operating accruals, the gain and loss recognition role of accruals is a source of positivecorrelation between accruals and current-period operating cash flow (Ball and Shivakumar 2006, 212–213). Theythen examine several cash flow and market-return-based measures of economic losses. Note that in Panel A ofTable 7, we document a positive association between accruals and cash flows for the quintile of firms with themost losses.
484 Demerjian, Lev, Lewis, and McVay
The Accounting ReviewMarch 2013

managers can improve the estimation quality of accruals, but the resulting accruals quality still falls
below that of a firm with closer-to-average associations between accruals and cash flows.
Although Ball and Shivakumar (2006) focus on the effect of economic losses, Wysocki (2009)
notes that a number of different innate factors affect the relation between accruals and cash. Thus,
rather than focusing solely on differences in current-period cash flows, we investigate a broader
range of firm characteristics. In Panel A of Table 7 we examine the correlation between working
capital accruals and current-period cash from operations for each quintile rank of the ‘‘innate’’ firm
characteristics from Francis et al. (2004), such as firm size, losses, and operating volatility, as well
TABLE 6
Accruals Quality and Managerial Ability
AQtþ1;tþ4 ¼ a0 þ a1MgrlAbilityt þ a2FirmSizet þ a3SalesVolatilityt�4;t
þ a4CashFlowVolatilityt�4;t þ a5OperCyclet�4;t þ a6Loss%t�4;t
þ a7NationalAuditort þ a8DSalesGrowtht þ a9AbnormalReturnt þ etþ1;tþ4:
Pred.
Dependent Variable ¼
AQ
MgrlAbility þ �0.03*** 0.00
�3.39 0.52FirmSize þ 0.04*** 0.02***
17.11 7.63SalesVolatility � �0.14*** 0.05***
�8.53 4.48CashFlowVolatility � �0.42*** 0.15***
�8.08 4.94OperCycle � 0.00 0.00
0.04 0.13Loss% � �0.11*** �0.04***
�8.17 �4.56NationalAuditor þ 0.02*** 0.02***
2.66 3.28DSalesGrowth ? �0.01* 0.00
�1.64 0.15AbnormalReturn ? 0.01*** 0.00
4.57 0.83
Total Observations 31,957
R2 18.93% 9.83%
Firm Fixed Effects Excluded Included
*, *** Denote a two-tailed p-value of less than 0.10 and 0.01, respectively.This table reports the results from the OLS regression of accruals quality on managerial ability and controls for innatefirm characteristics. t-statistics are presented in italics below the coefficients and are based on standard errors that areclustered by firm and year in specifications excluding firm fixed effects. We decile rank MgrlAbility and AQ, by industry-year. Intercept is included, but not tabulated.See Table 1, Panel C for variable definitions.
Managerial Ability and Earnings Quality 485
The Accounting ReviewMarch 2013
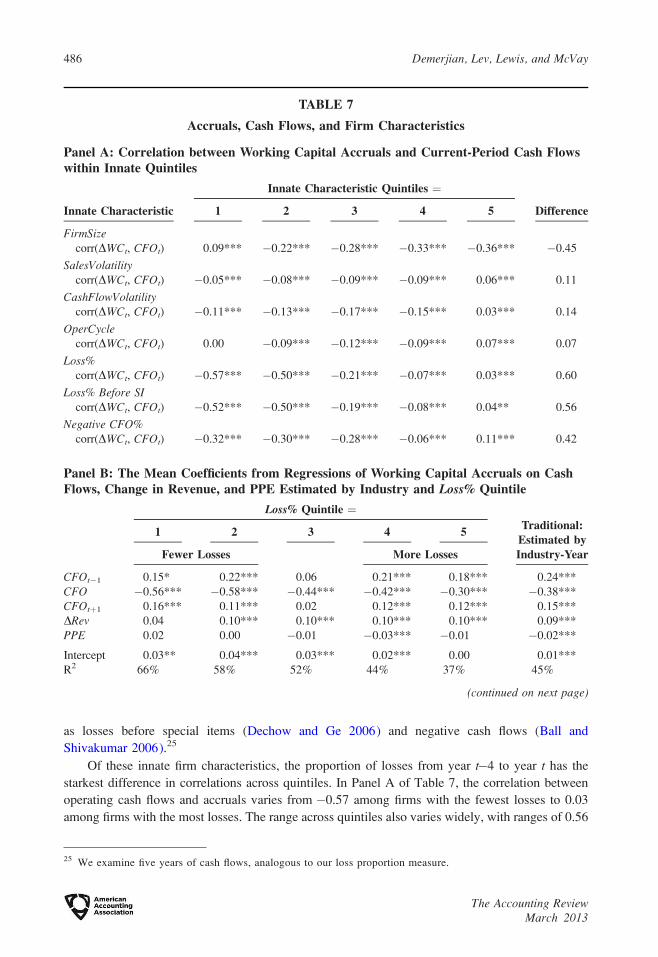
as losses before special items (Dechow and Ge 2006) and negative cash flows (Ball and
Shivakumar 2006).25
Of these innate firm characteristics, the proportion of losses from year t�4 to year t has the
starkest difference in correlations across quintiles. In Panel A of Table 7, the correlation between
operating cash flows and accruals varies from �0.57 among firms with the fewest losses to 0.03
among firms with the most losses. The range across quintiles also varies widely, with ranges of 0.56
TABLE 7
Accruals, Cash Flows, and Firm Characteristics
Panel A: Correlation between Working Capital Accruals and Current-Period Cash Flowswithin Innate Quintiles
Innate Characteristic
Innate Characteristic Quintiles ¼
1 2 3 4 5 Difference
FirmSizecorr(DWCt, CFOt) 0.09*** �0.22*** �0.28*** �0.33*** �0.36*** �0.45
SalesVolatilitycorr(DWCt, CFOt) �0.05*** �0.08*** �0.09*** �0.09*** 0.06*** 0.11
CashFlowVolatilitycorr(DWCt, CFOt) �0.11*** �0.13*** �0.17*** �0.15*** 0.03*** 0.14
OperCyclecorr(DWCt, CFOt) 0.00 �0.09*** �0.12*** �0.09*** 0.07*** 0.07
Loss%corr(DWCt, CFOt) �0.57*** �0.50*** �0.21*** �0.07*** 0.03*** 0.60
Loss% Before SIcorr(DWCt, CFOt) �0.52*** �0.50*** �0.19*** �0.08*** 0.04** 0.56
Negative CFO%corr(DWCt, CFOt) �0.32*** �0.30*** �0.28*** �0.06*** 0.11*** 0.42
Panel B: The Mean Coefficients from Regressions of Working Capital Accruals on CashFlows, Change in Revenue, and PPE Estimated by Industry and Loss% Quintile
Loss% Quintile ¼Traditional:
Estimated byIndustry-Year
1 2 3 4 5
Fewer Losses More Losses
CFOt�1 0.15* 0.22*** 0.06 0.21*** 0.18*** 0.24***
CFO �0.56*** �0.58*** �0.44*** �0.42*** �0.30*** �0.38***
CFOtþ1 0.16*** 0.11*** 0.02 0.12*** 0.12*** 0.15***
DRev 0.04 0.10*** 0.10*** 0.10*** 0.10*** 0.09***
PPE 0.02 0.00 �0.01 �0.03*** �0.01 �0.02***
Intercept 0.03** 0.04*** 0.03*** 0.02*** 0.00 0.01***
R2 66% 58% 52% 44% 37% 45%
(continued on next page)
25 We examine five years of cash flows, analogous to our loss proportion measure.
486 Demerjian, Lev, Lewis, and McVay
The Accounting ReviewMarch 2013

for the proportion of losses before special items,�0.45 for firm size, and 0.42 for the proportion of
negative cash flows. In subsequent analyses discussed below, we exclude firm size as a partitioning
variable for two reasons. First, the variation in firm size is driven almost entirely by the smallest size
quintile, while the other partitioning variables have more monotonic changes in the association
between accruals and cash flows. Second, in our setting, we are concerned with systematic biases in
the accruals quality measure that are associated with managerial ability, but from Table 2,
managerial ability and firm size are not associated.26
For three partitioning variables (Loss%, Loss% Before SI, and Negative CFO%), we re-
estimate Equation (6) and allow the coefficients on each of the variables to vary by each of these
quintiles, i.e., to vary with the magnitude of the negative relation between accruals and cash flows
TABLE 7 (continued)
Panel C: The Mean Coefficients from Regressions of Working Capital Accruals on CashFlows, Change in Revenue, and PPE Estimated by Industry and Loss% Adjusted for SIQuintile
Loss% before SI Quintile ¼Traditional:
Estimated byIndustry-Year
1 2 3 4 5
Fewer Losses More Losses
CFOt–1 0.22*** 0.19*** 0.13*** 0.18*** 0.16*** 0.24***
CFO �0.63*** �0.55*** �0.50*** �0.43*** �0.22*** �0.38***
CFOtþ1 0.15*** 0.10*** 0.08*** 0.13*** 0.11*** 0.15***
DRev 0.08*** 0.06*** 0.11*** 0.10*** 0.09*** 0.09***
PPE 0.03** �0.01 0.00 �0.03*** 0.00 �0.02***
Intercept 0.03*** 0.04*** 0.02*** 0.02*** �0.01 0.01***
R2 62% 55% 53% 45% 36% 45%
Panel D: The Mean Coefficients from Regressions of Working Capital Accruals on CashFlows, Change in Revenue and PPE Estimated by Industry and Negative CFO% Quintile
Negative CFO% Quintile ¼Traditional:
Estimated byIndustry-Year
1 2 3 4 5
Positive CFO Negative CFO
CFOt–1 0.18*** 0.22*** 0.19*** 0.16*** 0.21*** 0.24***
CFO �0.53*** �0.49*** �0.53*** �0.45*** �0.25*** �0.38***
CFOtþ1 0.18*** 0.13*** 0.17*** 0.12*** 0.14*** 0.15***
DRev �0.09 0.08*** 0.10*** 0.11*** 0.09*** 0.09***
PPE 0.01 0.00 �0.01 �0.02* �0.03* �0.02***
Intercept 0.02*** 0.02*** 0.02* 0.02*** 0.03*** 0.01***
R2 50% 43% 54% 49% 37% 45%
*, **, *** Denote a Fama-MacBeth p-value of less than 0.10, 0.05, and 0.01, respectively.Year indicator variables are included in models estimated by industry and innate firm characteristic rank, but coefficientsare not tabulated.See Table 1, Panel C for variable definitions.
26 Results are not affected by our treatment of firm size. Untabulated results are similar if we exclude the smallestsize quintile from our sample, and are also similar within the smallest size quintile.
Managerial Ability and Earnings Quality 487
The Accounting ReviewMarch 2013

as measured by the quintile rank of the firm’s fundamentals. Thus, we estimate a modification of
Equation (6):
DWCt ¼ a0 þ a1CFOt�1 þ a2CFOt þ a3CFOtþ1 þ a4DREVt þ a5PPEt þ Year Indicatorsþ et:
ð8Þ
We estimate Equation (8) by the various quintiles and industry, and include year fixed effects.
As illustrated in Panel B of Table 7, allowing the coefficients on the independent variables to vary
with Loss% results in large differences across the estimations. For example, the mean R2 falls from
66 percent in the group with the fewest losses to 37 percent in the group with the most losses. With
particular reference to the preceding measurement error, the coefficient on current-period cash flows
varies from a mean of�0.56 to a mean of�0.30, while the traditional estimation procedure restricts
the mean coefficient to be approximately �0.38.27
Results are similar for the proportion of losses before special items, with the coefficient on
current-year operating cash flows ranging from�0.63 to�0.22. Finally, the coefficients on current-
period operating cash flows range from �0.53 to �0.25 across negative cash flows quintiles.
We next explore the extent to which these modifications are associated with (1) other measures
of earnings quality and (2) managerial ability. The ModifiedAQLoss% accruals quality measure
appears to be more correlated with our other measures of earnings quality than the traditional
Dechow and Dichev accruals quality measure. For example, while AQ is not correlated with
restatements, ModifiedAQLoss% is negatively correlated with restatements, as we would expect. Of
particular interest for our study, ModifiedAQLoss% is positively associated with managerial ability, in
contrast to the traditional model of accruals quality that exhibits a negative association with
managerial ability.
The correlations for ModifiedAQSI_Loss% are similar to those of ModifiedAQLoss%, which is not
surprising as these two measures are correlated at 0.92. Our third modification, ModifiedAQNeg_CFO%,
does not appear to be as strongly associated with the other measures of earnings quality. Like the
traditional measure, it is not associated with restatements, and the association with earnings persistence
is the same as the traditional measure. Finally, the association with managerial ability is not significant.
We explore the relation between the modified measures of accruals quality and managerial
ability more formally in Table 8.28 In five of the six estimations, we find that managerial ability is
positively associated with accruals quality, consistent with the relations with restatements, earnings
persistence, and bad debt expense. Thus, it appears that the counter-intuitive result in our Table 6
and in Francis et al. (2008) reflects measurement error in the Dechow and Dichev accruals quality
measure. In sum, we find that higher ability managers report lower accruals quality errors relative to
industry-peers with similar operating environments.
V. ADDITIONAL ANALYSES
In this section we discuss three sets of results aimed at corroborating the conclusions from our
main analyses. First, we explore the robustness of our results to alternative measures of managerial
ability. Second, we investigate whether earnings quality increases when a new CFO of superior
27 All coefficients are the mean coefficient across estimations; for the traditional model, regressions are estimatedby industry and year; for the modified model, regressions are estimated by industry and Loss% quintile, and weinclude year fixed effects. Estimating the modified model by industry, Loss% quintile, and year results in a severeloss of observations.
28 Because we condition on losses in our estimation of two of the modifications, we do not include losses as acontrol variable.
488 Demerjian, Lev, Lewis, and McVay
The Accounting ReviewMarch 2013

ability is hired. Third, we investigate the sensitivity of our results to the inclusion of additional
control variables in our models.
Alternative Managerial Ability Measures
Our main managerial ability measure, the MA-Score, is the managerial efficiency metric
developed by Demerjian et al. (2012). In this section we investigate historical returns, following Fee
and Hadlock (2003), and media citations, following Francis et al. (2008); definitions are provided in
Panel C of Table 1.29 We begin by examining the correlations among the variables (see Table 2).
Managerial ability and historical returns are correlated at 0.23, consistent with these two variables
measuring different aspects of ‘‘ability,’’ while there is a negative correlation between media
citations and ability and no relation between media citations and historical returns. Consistent with
historical returns and media citations containing a large firm component, they are correlated with
firm size at 0.22 and 0.52, respectively, based on Spearman correlation coefficients, while
managerial ability is not correlated with firm size. Interestingly, both ability and historical returns
are negatively correlated with losses and positively correlated with future earnings; however, these
associations do not extend to media citations. Generally, the correlations suggest that historical
returns and the MA-Score have the expected associations with perceptions of managerial ability.
To examine the association between earnings quality and managerial ability, we consider a
composite measure of total earnings quality, which is the sum of (1) the rank of one modified
accruals quality measure (ModifiedAQLoss%), (2) the rank of firm-specific earnings persistence, and
(3)�13Restate.30 Thus, the variable ranges from a low of�1 to a high of 2. In Table 9, we consider
the associations between total earnings quality and each of the three ability measures.31 For the MA-
Score, more able managers have higher total earnings quality, as was the case with the individual
components. Next, we find that the greater the historical returns, the greater total earnings quality,
consistent with our hypothesis. Untabulated results indicate that our inferences remain unchanged if
we use historical returns as an alternate ability measure in each of our tests in the paper. However, as
previously noted, the MA-Score allows us to better separate the manager from the firm.
Media citations, however, are negatively associated with earnings quality. Perhaps media
interest increases as restatements and other negative earnings-related items occur. One difficulty in
comparing results across measures is that media citations are available only for a small subset of our
sample; thus, we next consider all three measures simultaneously for the reduced sample. The
coefficient on Media Citations remains negative and significant, while the coefficients on HistoricalRet and MgrlAbility remain positive and significant in the reduced sample.
CFO-Specific Analysis
Although our results are similar using historical returns, both the MA-Score and historical
returns likely contain a firm-specific element. To better control for the effect of the firm, we next
consider how earnings quality changes across different CFO regimes. We first explore whether
there are CFO fixed effects, following Dyreng et al. (2010) and others. We then explore whether the
CFO’s ability at his/her initial firm is associated with the accruals quality at the subsequent firm.
Together, these analyses provide evidence on the CFO-specific effect on accruals quality.
29 Following our examination of these alternate measures, we also examine manager fixed effects.30 We exclude the bad debt expense error as it severely limits the available observations.31 Untabulated results are similar when we consider the individual components of total earnings quality, with the
exception that the relation between historical returns and firm-specific earnings persistence is not significant. Aswith the results reported in Table 8, we exclude Loss% as a control variable because it is used to calculateModifiedAQLoss%. Results are similar if we include Loss% as an additional control variable.
Managerial Ability and Earnings Quality 489
The Accounting ReviewMarch 2013
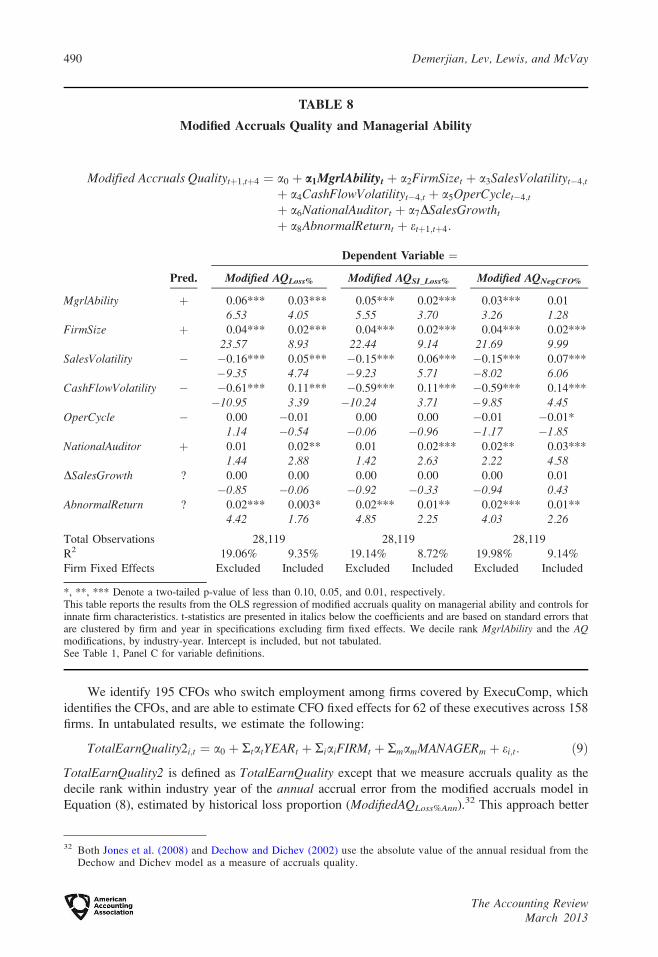
We identify 195 CFOs who switch employment among firms covered by ExecuComp, which
identifies the CFOs, and are able to estimate CFO fixed effects for 62 of these executives across 158
firms. In untabulated results, we estimate the following:
TotalEarnQuality2i;t ¼ a0 þ RtatYEARt þ RiaiFIRMt þ RmamMANAGERm þ ei;t: ð9Þ
TotalEarnQuality2 is defined as TotalEarnQuality except that we measure accruals quality as the
decile rank within industry year of the annual accrual error from the modified accruals model in
Equation (8), estimated by historical loss proportion (ModifiedAQLoss%Ann).32 This approach better
TABLE 8
Modified Accruals Quality and Managerial Ability
Modified Accruals Qualitytþ1;tþ4 ¼ a0 þ a1MgrlAbilityt þ a2FirmSizet þ a3SalesVolatilityt�4;t
þ a4CashFlowVolatilityt�4;t þ a5OperCyclet�4;t
þ a6NationalAuditort þ a7DSalesGrowtht
þ a8AbnormalReturnt þ etþ1;tþ4:
Pred.
Dependent Variable ¼
Modified AQLoss% Modified AQSI_Loss% Modified AQNegCFO%
MgrlAbility þ 0.06*** 0.03*** 0.05*** 0.02*** 0.03*** 0.01
6.53 4.05 5.55 3.70 3.26 1.28FirmSize þ 0.04*** 0.02*** 0.04*** 0.02*** 0.04*** 0.02***
23.57 8.93 22.44 9.14 21.69 9.99SalesVolatility � �0.16*** 0.05*** �0.15*** 0.06*** �0.15*** 0.07***
�9.35 4.74 �9.23 5.71 �8.02 6.06CashFlowVolatility � �0.61*** 0.11*** �0.59*** 0.11*** �0.59*** 0.14***
�10.95 3.39 �10.24 3.71 �9.85 4.45OperCycle � 0.00 �0.01 0.00 0.00 �0.01 �0.01*
1.14 �0.54 �0.06 �0.96 �1.17 �1.85NationalAuditor þ 0.01 0.02** 0.01 0.02*** 0.02** 0.03***
1.44 2.88 1.42 2.63 2.22 4.58DSalesGrowth ? 0.00 0.00 0.00 0.00 0.00 0.01
�0.85 �0.06 �0.92 �0.33 �0.94 0.43AbnormalReturn ? 0.02*** 0.003* 0.02*** 0.01** 0.02*** 0.01**
4.42 1.76 4.85 2.25 4.03 2.26
Total Observations 28,119 28,119 28,119
R2 19.06% 9.35% 19.14% 8.72% 19.98% 9.14%
Firm Fixed Effects Excluded Included Excluded Included Excluded Included
*, **, *** Denote a two-tailed p-value of less than 0.10, 0.05, and 0.01, respectively.This table reports the results from the OLS regression of modified accruals quality on managerial ability and controls forinnate firm characteristics. t-statistics are presented in italics below the coefficients and are based on standard errors thatare clustered by firm and year in specifications excluding firm fixed effects. We decile rank MgrlAbility and the AQmodifications, by industry-year. Intercept is included, but not tabulated.See Table 1, Panel C for variable definitions.
32 Both Jones et al. (2008) and Dechow and Dichev (2002) use the absolute value of the annual residual from theDechow and Dichev model as a measure of accruals quality.
490 Demerjian, Lev, Lewis, and McVay
The Accounting ReviewMarch 2013

matches specific managers with the years they managed the firm. The average manager fixed effect
increases by 1.92 when moving from the lowest to the highest quartile of manager fixed effects.
For comparison purposes, the average firm fixed effect increases by 2.25 when moving from the
lowest to the highest quartile of firm fixed effects. Although fixed effects are quantifiable only for
TABLE 9
Earnings Quality and Alternative Proxies for Managerial Ability
TotalEarnQualitytþ1;tþ4 ¼ a0 þ a1MgrlAbilityt þ a2FirmSizet þ a3SalesVolatilityt�4;t
þ a4CashFlowVolatilityt�4;t þ a5OperCyclet�4;t
þ a6NationalAuditort þ a7DSalesGrowtht þ a8AbnormalReturnt
þ etþ1;tþ4:
Pred.
Dependent Variable ¼
TotalEarnQuality
MgrlAbility þ 0.44*** 0.38***
6.07 2.58Historical Ret þ 0.69*** 0.83***
12.29 5.94Media Citations þ �0.42*** �0.28*
2.76 �1.78FirmSize þ 0.08*** 0.06*** 0.08** 0.07*
5.64 3.72 2.23 1.92SalesVolatility � �0.49*** �0.73*** �0.66** �0.87***
�4.77 �4.93 �2.19 �2.52CashFlowVolatility � �1.57*** �1.56*** �2.15*** �2.45***
5.99 �4.42 �2.55 �2.56OperCycle � �0.04 �0.07 �0.07 �0.07
�1.29 �1.86 �1.06 �1.01NationalAuditor þ 0.19*** 0.04 0.33 0.06
3.08 0.56 1.13 0.22DSalesGrowth ? �0.01* �0.03* 0.01 0.04
�1.65 �1.75 0.21 0.65AbnormalReturn ? 0.09*** 0.04* 0.17*** 0.09**
5.29 1.82 4.53 2.19
Total Observations 13,157 9,673 3,770 3,348
Pseudo R2 0.80% 1.09% 0.40% 0.88%
*, **, *** Denote a two-tailed p-value of less than 0.10, 0.05, and 0.01, respectively.This table reports the results from the ordered logistic regression of total earnings quality (TotalEarnQuality) onmanagerial ability and controls. TotalEarnQuality is the sum of three earnings quality variables: (1) the rank ofestimation accruals quality (ModifiedAQLoss%), (2) the rank of firm-specific earnings persistence, and (3)�1 3 Restate.Thus, the variable ranges from a low of �1 to a high of 2. We decile rank MgrlAbility, Historical Ret, and MediaCitations by industry-year. The sample size is reduced for specifications including Media Citations as this variable islimited to ExecuComp firms from 1995–2005. Intercept is included, but not tabulated. Z-statistics are presented in italicsbelow the coefficients and are based on standard errors that are clustered by firm. We find similar results when we clusterby year.See Table 1, Panel C for variable definitions.
Managerial Ability and Earnings Quality 491
The Accounting ReviewMarch 2013

CFOs switching firms within our sample, clearly manager-specific effects are economically
significant.33
We next investigate if the CFO’s score from his/her initial firm is associated with accruals
quality at the subsequent firm. We expect firms that hire a more efficient CFO to experience an
improvement in their earnings quality, and firms that hire a less efficient CFO to experience a decline
in their earnings quality. Thus, using the sample of the 195 CFOs examined above who switched
across our sample firms, we identify 116 with sufficient information to estimate the following:
DModifiedAQLoss%Ann ¼ a0 þ a1DMgrlAbilityþ a2DFirmSizeþ a3DSalesVolatiltyþ a4DCashFlowVolatility þ a5DOperCycleþ a6DSalesGrowtht
þ a7DAbnormalReturnt þ e;
ð10Þ
where the change in earnings quality, as well as the change in each of the control variables, is
measured from year Variablecþ1� Variablec�1, where c is the year in which the CFO changed.34
Thus, a positive value of DModifiedAQLoss%Ann signifies an improvement in earnings quality
following the new CFO appointment.35 The change in managerial ability reflects the difference
between the newly appointed CFO’s score from his or her prior firm and the departing CFO’s score
from the current firm, MgrlAbilityj,b,c�1� MgrlAbilityi,a,c�1, where manager b was hired by firm iand was previously employed by firm j. A positive value of DMgrlAbility signifies that the incoming
manager is deemed more efficient than the outgoing manager. Thus, we expect a1 to be positive.Table 10 reports the expected positive and significant coefficient on DMgrlAbility. Finding that the
association between ability and earnings quality spans firms helps to alleviate the general concern
that the documented associations are attributable to the firm, rather than the manager.
Additional Control Variables
We consider two infrastructure-related control variables that have been shown to be associated
with earnings quality: governance (Klein 2002) and internal control quality (Doyle et al. 2007). We
measure governance with the percentage of independent board members, obtained from IRRC from
1996–2007, ranked by year and industry (PctInd), and proxy for internal control quality with the
disclosure of material weaknesses in internal control (ICW). We obtain internal control data from
Doyle et al. (2007) for 2002–2004 and from Audit Analytics from 2005–2007.36 We find
qualitatively similar results to those reported when models include these two additional controls.
We also explore the sensitivity of our results to using abnormal performance variables other
than the change in sales growth. When we replace the change in sales growth with the level of sales
growth and with historical three-year average change in sales growth, we find results similar to
those reported.
VI. CONCLUSION
We examine the relation between managerial ability and earnings quality. While empirical
literature in the area of earnings quality has largely focused on firm-specific characteristics, such as
33 Untabulated results indicate that the MA-Score is also positively correlated with the CFO-specific fixed effects.34 We exclude Loss% as a control variable because it is used to identify ModifiedAQLoss%. Results are similar if we
include Loss% as an additional control variable.35 As with the prior analysis, we use the annual accrual error, the absolute value of the error term from Equation (8),
for this analysis to better match the accruals quality with the specific manager in place at that time.36 The Doyle et al. (2007) data are available at: http://faculty.washington.edu/geweili/ICdata.html. We end the
analysis in 2007 because of limitations in our board independence data.
492 Demerjian, Lev, Lewis, and McVay
The Accounting ReviewMarch 2013

firm size and board independence (Dechow and Dichev 2002; Klein 2002), we investigate
manager-specific effects using the MA-Score, a measure of managerial ability developed in
Demerjian et al. (2012). Our study is in the vein of Bertrand and Schoar (2003), who find that
managers have an effect on firm choices such as acquisitions or research and development
expenditures, and Francis et al. (2008), who find that earnings quality appears to vary with CEO
reputation. Using the four alternative earnings quality measures of restatements, earnings
persistence, error in the bad debt provision, and modified accruals quality, we find that more
able managers report higher quality earnings.
TABLE 10
Change in Accruals Quality and Change in Managerial Ability
DModifiedAQLoss%Ann ¼ a0 þ a1DMgrlAbilityþ a2DFirmSizeþ a3DSalesVolatiltyþ a4DCashFlowVolatilityþ a5DOperCycleþ a6DSalesGrowthþ a7DAbnormalReturnþ e:
Pred.
Dependent Variable ¼DModifiedAQLoss%Ann
DMgrlAbility þ 0.04**
1.98DFirmSize þ 0.00
0.49DSalesVolatility � �0.02
�0.77DCashFlowVolatility � �0.02
�0.19DOperCycle � 0.01
0.39DSalesGrowth ? 0.02***
2.60DAbnormalReturn ? �0.01**
�2.40
Total Observations 123
R2 10.55%
**, *** Denote a two-tailed p-value of less than 0.05 and 0.01, respectively.This table presents the OLS regression of changes in accruals quality on changes in managerial ability and changes incontrol variables. t-statistics are presented in italics below the coefficients. As our measure of managerial ability, weexamine an annual version of the modified accruals quality measure examined in Table 8 (Modified AQLoss%). Thechange in earnings quality, as well as the change in each of the control variables, is measured from year Variablecþ1�Variablec�1, where c is the year in which the CFO changed. Thus, a positive value of DModifiedAQLoss%Ann signifies animprovement in earnings quality following the new CFO appointment. The change in managerial ability reflects thedifference between the newly appointed CFO’s score from his or her prior firm and the departing CFO’s score from thecurrent firm (i.e., MgrlAbilityj,b,c�1 � MgrlAbilityi,a,c�1, where manager b was hired by firm i and was previouslyemployed by firm j). A positive value of DMgrlAbility signifies that the incoming manager is deemed more efficient thanthe outgoing manager. We do not include DNationalAuditor as a control variable due to lack of variation. Intercept isincluded, but not tabulated.See Table 1, Panel C for variable definitions.
Managerial Ability and Earnings Quality 493
The Accounting ReviewMarch 2013

Our study contributes to the earnings quality and managerial ability literatures. We document a
positive association between managerial ability and earnings quality. We find that higher quality
managers are associated with higher quality earnings. This finding is consistent with the premise
that the more capable the manager, the better able he or she is to estimate accruals, and it suggests
that firms can improve their earnings quality by employing higher ability managers. We also
contribute to the earnings quality literature by offering a modification of the Dechow and Dichev
accruals quality measure that more effectively partitions accruals quality from firms’ underlying
earnings processes.
Our study’s first limitation is that our evidence relies on proxies for both managerial ability and
earnings quality. Although we attempt to control for correlated variables such as economic shocks,
the possibility of correlated omitted variables remains. Second, the ability score we examine is for
the entire management team, while our focus in on the effect of CFOs and their delegates. We
mitigate this concern to some extent by documenting economically significant CFO fixed effects on
earnings quality—a methodology that does not rely on a specific managerial ability measure. We
further corroborate our analysis by tracking CFOs across firms and documenting that hiring a higher
ability CFO is associated with an improvement in the firm’s earnings quality. Finally, our focus is
on accrual estimation, and as such we abstract away from the decision to manage earnings. Future
researchers might explore the association between managerial ability and earnings management,
and similarly, the inter-relations between ability and infrastructure choices that have been shown to
improve earnings quality, such as governance and internal control quality.
REFERENCES
Aier, J., J. Comprix, M. Gunlock, and D. Lee. 2005. The financial expertise of CFOs and accounting
restatements. Accounting Horizons 19 (3): 123–135.
Anderson, K., and T. Yohn. 2002. The Effect of 10-K Restatements on Firm Value, InformationAsymmetries, and Investors’ Reliance on Earnings. Working paper, Georgetown University.
Ashbaugh-Skaife, H., D. Collins, W. Kinney, and R. LaFond. 2008. Internal control deficiencies,
remediation and accrual quality. The Accounting Review 83 (1): 217–250.
Baik, B., D. Farber, and S. Lee. 2011. CEO ability and management earnings forecasts. Contemporary
Accounting Research 28 (5): 1645–1668.
Ball, R., and L. Shivakumar. 2006. The role of accruals in asymmetrically timely gain and loss recognition.
Journal of Accounting Research 44 (2): 207–242.
Bamber, L., J. Jiang, and I. Wang. 2010. What’s my style? The influence of top managers on voluntary
corporate financial disclosure. The Accounting Review 85 (4): 1131–1162.
Becker, C., M. DeFond, J. Jiambalvo, and K. R. Subramanyam. 1998. The effect of audit quality on
earnings management. Contemporary Accounting Research 15 (1): 1–24.
Bertrand, M., and A. Schoar. 2003. Managing with style: The effect of managers on firm policies. The
Quarterly Journal of Economics: 1169–1208.
Dechow, P. 1994. Accounting earnings and cash flows as measures of firm performance: The role of
accounting accruals. Journal of Accounting and Economics 18: 3–42.
Dechow, P., and C. Schrand. 2004. Earnings Quality. Charlottesville, VA: The Research Foundation of
CFA Institute.
Dechow, P., and D. Skinner. 2000. Earnings management: Reconciling the views of accounting academics,
practitioners, and regulators. Accounting Horizons 14 (2): 235–250.
Dechow, P., and I. Dichev. 2002. The quality of accruals and earnings: The role of accrual estimation errors.
The Accounting Review 77 (4): 35–59.
Dechow, P., W. Ge, and C. Schrand. 2010. Understanding earnings quality: A review of the proxies, their
determinants and their consequences. Journal of Accounting and Economics 50: 344–401.
494 Demerjian, Lev, Lewis, and McVay
The Accounting ReviewMarch 2013
Dechow, P., and W. Ge. 2006. The persistence of earnings and cash flows and the role of special items:
Implications for the accrual anomaly. Review of Accounting Studies 11 (2/3): 253–296.
DeJong, D., and Z. Ling. 2010. Managers: Their Effects on Accruals and Firm Policies. Working paper,
The University of Iowa.
Demerjian, P., B. Lev, and S. McVay. 2012. Quantifying managerial ability: A new measure and validity
tests. Management Science 58 (7): 1229–1248.
Doyle, J., W. Ge, and S. McVay. 2007. Accruals quality and internal control over financial reporting. TheAccounting Review 82 (5): 1141–1170.
Dyreng, S., M. Hanlon, and E. Maydew. 2010. The effects of executives on corporate tax avoidance. TheAccounting Review 85 (4): 1163–1189.
Fama, E., and K. French. 1997. Industry costs of equity. Journal of Financial Economics 43 (2): 153–193.
Fee, C., and C. Hadlock. 2003. Raids, rewards, and reputations in the market for managerial talent. Reviewof Financial Studies 16 (4): 1315–1357.
Feroz, E., K. Park, and V. Pastena. 1991. The financial and market effects of the SEC’s accounting and
auditing enforcement releases. Journal of Accounting Research 29 (3): 107–142.
Francis, J., A. Huang, S. Rajgopal, and A. Zang. 2008. CEO reputation and earnings quality. ContemporaryAccounting Research 25 (1): 109–147.
Francis, J., R. LaFond, P. Olsson, and K. Schipper. 2004. Costs of equity and earnings attributes. TheAccounting Review 79 (4): 967–1010.
Ge, W., D. Matsumoto, and J. Zhang. 2011. Do CFOs have style? An empirical investigation of the effect of
individual CFOs on accounting practices. Contemporary Accounting Research 28 (4): 1141–1179.
Hennes, K., A. Leone, and B. Miller. 2008. The importance of distinguishing errors from irregularities in
restatement research: The case of restatements and CEO/CFO turnover. The Accounting Review 83
(6): 1487–1519.
Hribar, P., and C. Nichols. 2007. The use of unsigned earnings quality measures in tests of earnings
management. Journal of Accounting Research 45 (5): 1017–1053.
Jackson, S., and X. Liu. 2010. The allowance for uncollectible accounts, conservatism, and earnings
management. Journal of Accounting Research 48 (3): 565–601.
Jones, K., G. Krishnan, and K. Melendrez. 2008. Do models of discretionary accruals detect actual cases of
fraudulent and restated eamings? An empirical analysis. Contemporary Accounting Research 25 (2):
499–531.
Kim, Y., M. Park, and B. Wier, 2012. Is earnings quality associated with corporate social responsibility?
The Accounting Review 87 (3): 761–796.
Klein, A. 2002. Audit committee, board of director characteristics and earnings management. Journal ofAccounting and Economics 33 (3): 375–400.
Knechel, R., P. Rouse, and C. Schelleman. 2009. A modified audit production framework: Evaluating the
relative efficiency of audit engagements. The Accounting Review 84 (5): 1607–1638.
LaFond, R. 2008. Discussion of: CEO reputation and earnings quality. Contemporary Accounting Research25 (1): 149–156.
Lev, B., and T. Sougiannis. 1996. The capitalization, amortization, and value-relevance of R&D. Journal ofAccounting and Economics 21 (1): 107–138.
Libby, R., and J. Luft. 1993. Determinants of judgment performance in accounting settings: Ability,
knowledge, motivation and environment. Accounting, Organizations and Society 18 (5): 425–450.
McNichols, M. 2002. Discussion of: The quality of accruals and earnings: The role of accrual estimation
errors. The Accounting Review 77 (4): 61–69.
McNichols, M., and P. Wilson. 1988. Evidence of earnings management from the provision for bad debts.
Journal of Accounting Research 26 (Supplement): 1–31.
Milbourn, T. 2003. CEO reputation and stock-based compensation. Journal of Financial Economics 68:
233–262.
Palmrose, Z.-V., and S. Shultz. 2004. The circumstances and legal consequences of non-GAAP reporting:
Evidence from restatements. Contemporary Accounting Research 21 (1): 139–180.
Managerial Ability and Earnings Quality 495
The Accounting ReviewMarch 2013
Palmrose, Z.-V., V. Richardson, and S. Shultz. 2004. Determinants of market reactions to restatement
announcements. Journal of Accounting and Economics 37 (1): 59–89.
Petersen, M. 2009. Estimating standard errors in finance panel data sets: Comparing approaches. Review ofFinancial Studies 22 (1): 435–480.
Plumlee, M., and T. Yohn. 2010. An analysis of the underlying causes attributed to restatements.
Accounting Horizons 24 (1): 41–64.
Richardson, S., R. Sloan, M. Soliman, and I. Tuna. 2005. Accrual reliability, earnings persistence and stock
prices. Journal of Accounting and Economics 39 (3): 437–485.
Sloan, R. 1996. Do stock prices fully reflect information in accruals and cash flows about future earnings?
The Accounting Review 71 (3): 289–315.
Tan, H., and K. Jamal. 2006. Effect of accounting discretion on ability of managers to smooth earnings.
Journal of Accounting and Public Policy 25: 554–573.
Wysocki, P. 2009. Assessing Earnings and Accruals Quality: U.S. and International Evidence. Working
paper, University of Miami.
APPENDIX A
ESTIMATION OF TOTAL FIRM EFFICIENCY(Demerjian et al. 2012)
Our main measure of managerial ability, the MA-Score, is the metric developed by Demerjian
et al. (2012), using data envelopment analysis (DEA), a nonlinear optimization program that
calculates unit-specific relative efficiency. The program is as follows:
maxm;uh ¼
Xs
i¼1uiyik
Xm
j¼1vjxjk
: ðA1Þ
Subject to:Xs
i¼1uiyik
Xm
j¼1vjxjk
� 1 ðk ¼ 1; . . . ; nÞ; ðA2Þ
v1; v2; . . . ; vm � 0; ðA3Þ
u1; u2; . . . ; us � 0: ðA4Þ
DEA measures the efficiency of a single unit, here firm k, relative to a set of comparable firms. The
objective function measures efficiency as the weighted outputs scaled by the weighted inputs. There
are s outputs and m inputs, indexed by i and j, respectively. The quantities of each output i and input
j for firm k are yik and xjk, respectively. The optimization program maximizes (A1) by selecting the
weights on each output (ui ) and input (vj). The vectors of weights on the outputs (u) and inputs (v)
are termed implicit weights. Efficiency is based on the level of the weighted outputs to the level of
the weighted inputs. The most efficient firms have the highest level of outputs for a fixed level of
inputs (or equivalently, the lowest level of inputs for a fixed level of outputs). DEA calculates a
unique set of implicit weights for each firm k.
The first constraint, (A2), scales the implicit weights so that the most efficient firm (or firms)
has (have) an efficiency value of 1. The optimal weights for each firm k are tested for all the other
496 Demerjian, Lev, Lewis, and McVay
The Accounting ReviewMarch 2013
comparable firms (1,. . .,n; 6¼k). This calculates what the efficiency would be for each comparable
firm under the implicit weights calculated in (A1) for firm k, allowing for the determination of
relative efficiency. Constraints (A3) and (A4) require implicit weights to be non-negative, which
prevents solutions calling for negative input levels.
Total firm efficiency is estimated using a single output and seven inputs. Total revenue
(‘‘SALE’’) is the output, as the principal objective of the firm is to produce sales. The most
successful firms are those that produce the maximum sales at the lowest cost. The cost of producing
the sales is captured by the seven inputs. The first five correspond to assets the company invests in
that are expected to affect their revenue-generation. Demerjian et al. (2012) consider the beginning-
of-period balance for each of these assets, since managers’ past decisions regarding these assets are
expected to affect current-period revenues.
1. Net Property, Plant, and Equipment (PP&E; ‘‘PPENT’’).2. Capitalized Operating Leases. The discounted present value of the next five years of
required operating lease payments (available in the firm’s footnotes to the financial
statements and on Compustat).37 The inclusion of Net Operating Leases as an input
increases the input comparability among firms that effectively have the same operations, but
either lease or buy their revenue-generating equipment.
3. Net Research and Development (R&D). To calculate net R&D, which is not reported as an
asset on the balance sheet, Demerjian et al. (2012) follow Lev and Sougiannis (1996), who
use a five-year capitalization period of R&D expense (‘‘XRD’’), where the net value (net of
amortization) is:
RDcap ¼X0
t¼�4
ð1þ 0:2tÞ3 RDexp:
Thus, for example, R&D expenditures from five years back receive a weight of 0.2 (they
were already amortized 80 percent), four years back receive a weight of 0.4 (amortized 60
percent), etc., with the prior year’s R&D (t¼�1) receiving full weight.
4. Purchased goodwill, reported on the balance sheet, which is the premium paid over the fair
value of a business acquisition (‘‘GDWL’’). Goodwill generally reflects the value of the
acquired intangible assets.
5. Other acquired and capitalized intangibles (‘‘INTAN’’ less ‘‘GDWL’’), also reported on the
balance sheet, which includes items such as client lists, patent costs, and copyrights.
They also include two year t expenses, Cost of Goods Sold and Selling General and
Administrative Expense, to account for the cost of inventory (Cost of Goods Sold) and sales
generated from advertising and the quality of the sales force (advertising, training costs, and IT
services are included in SG&A).
They estimate DEA efficiency by industry, based on Fama and French (1997), to increase the
likelihood that the peer firms have similar business models and cost structures within the
estimations. The resulting score ranges from 0–1, with 1 being the optimal output for a given mix of
inputs.
Using DEA instead of traditional ratio analysis has several advantages. First, DEA allows the
weightings on each of the inputs to vary, whereas traditional efficiency ratios restrict all weightings
to be equal to 1. For example, within DEA, one dollar at historical cost, such as PP&E, can count
37 Demerjian et al. (2012) use a discount rate of 10 percent per year. Data items for the five lease obligations are‘‘MRC1–MRC5.’’ They note that they would also like to discount the ‘‘thereafter’’ payments; however, this lineitem was not collected by Compustat for the bulk of the sample period. Note that capital leases are included inNet PP&E.
Managerial Ability and Earnings Quality 497
The Accounting ReviewMarch 2013

differently from one dollar at or near replacement cost, such as COGS, but both are weighted
identically in a traditional efficiency ratio. Second, DEA compares each firm within an industry to
the most efficient firm, whereas traditional efficiency analysis compares each firm to the mean or
median firm. Demerjian et al. (2012) provide additional information, explicit comparisons of this
score with a residual from an OLS regression, and a comparison of variable ratios, such as return on
assets.
498 Demerjian, Lev, Lewis, and McVay
The Accounting ReviewMarch 2013

Copyright of Accounting Review is the property of American Accounting Association and its content may not
be copied or emailed to multiple sites or posted to a listserv without the copyright holder's express written
permission. However, users may print, download, or email articles for individual use.