THE ACCOUNTING REVIEW American Accounting Association … · 2014-04-01 · THE ACCOUNTING REVIEW...
29
THE ACCOUNTING REVIEW American Accounting Association Vol. 87, No. 2 DOI: 10.2308/accr-10196 2012 pp. 675–703 Evidence on the Trade-Off between Real Activities Manipulation and Accrual-Based Earnings Management Amy Y. Zang Hong Kong University of Science and Technology ABSTRACT: I study whether managers use real activities manipulation and accrual- based earnings management as substitutes in managing earnings. I find that managers trade off the two earnings management methods based on their relative costs and that managers adjust the level of accrual-based earnings management according to the level of real activities manipulation realized. Using an empirical model that incorporates the costs associated with the two earnings management methods and captures managers’ sequential decisions, I document large-sample evidence consistent with managers using real activities manipulation and accrual-based earnings management as substitutes. Keywords: real activities manipulation; accrual-based earnings management; trade-off. Data Availability: Data are available from public sources indicated in the text. I. INTRODUCTION I study how firms trade off two earnings management strategies, real activities manipulation and accrual-based earnings management, using a large sample of firms over 1987–2008. Prior studies have shown evidence of firms altering real activities to manage earnings (e.g., Roychowdhury 2006; Graham et al. 2005) and evidence that firms make choices between the two earnings management strategies (Cohen et al. 2008; Cohen and Zarowin 2010; Badertscher 2011). My study extends research on the trade-off between real activities manipulation and accrual-based earnings management by documenting a set of variables that explain the costs of both real and I am grateful for the guidance from my dissertation committee members, Jennifer Francis (chair), Qi Chen, Dhananjay Nanda, Per Olsson, and Han Hong. I am also grateful for the suggestions and guidance received from Steven Kachelmeier (senior editor), Dan Dhaliwal, and two anonymous reviewers. I thank Allen Huang, Moshe Bareket, Yvonne Lu, Shiva Rajgopal, Mohan Venkatachalam, and Jerry Zimmerman for helpful comments. I appreciate the comments from the workshop participants at Duke University, University of Notre Dame, The University of Utah, The University of Arizona, The University of Texas at Dallas, Dartmouth College, University of Oregon, Georgetown University, University of Rochester, Washington University in St. Louis, and Hong Kong University of Science and Technology. I gratefully acknowledge the financial support from the Fuqua School of Business at Duke University, the Deloitte Foundation, University of Rochester, and the Hong Kong University of Science and Technology. Errors and omissions are my responsibility. Editor’s note: Accepted by Steven Kachelmeier. Submitted: September 2006 Accepted: July 2011 Published Online: November 2011 675
Transcript of THE ACCOUNTING REVIEW American Accounting Association … · 2014-04-01 · THE ACCOUNTING REVIEW...
THE ACCOUNTING REVIEW American Accounting AssociationVol. 87, No. 2 DOI: 10.2308/accr-101962012pp. 675–703
Evidence on the Trade-Off between RealActivities Manipulation and Accrual-Based
Earnings Management
Amy Y. Zang
Hong Kong University of Science and Technology
ABSTRACT: I study whether managers use real activities manipulation and accrual-
based earnings management as substitutes in managing earnings. I find that managers
trade off the two earnings management methods based on their relative costs and that
managers adjust the level of accrual-based earnings management according to the level
of real activities manipulation realized. Using an empirical model that incorporates the
costs associated with the two earnings management methods and captures managers’
sequential decisions, I document large-sample evidence consistent with managers using
real activities manipulation and accrual-based earnings management as substitutes.
Keywords: real activities manipulation; accrual-based earnings management; trade-off.
Data Availability: Data are available from public sources indicated in the text.
I. INTRODUCTION
Istudy how firms trade off two earnings management strategies, real activities manipulation
and accrual-based earnings management, using a large sample of firms over 1987–2008. Prior
studies have shown evidence of firms altering real activities to manage earnings (e.g.,
Roychowdhury 2006; Graham et al. 2005) and evidence that firms make choices between the two
earnings management strategies (Cohen et al. 2008; Cohen and Zarowin 2010; Badertscher 2011).
My study extends research on the trade-off between real activities manipulation and accrual-based
earnings management by documenting a set of variables that explain the costs of both real and
I am grateful for the guidance from my dissertation committee members, Jennifer Francis (chair), Qi Chen, DhananjayNanda, Per Olsson, and Han Hong. I am also grateful for the suggestions and guidance received from StevenKachelmeier (senior editor), Dan Dhaliwal, and two anonymous reviewers. I thank Allen Huang, Moshe Bareket,Yvonne Lu, Shiva Rajgopal, Mohan Venkatachalam, and Jerry Zimmerman for helpful comments. I appreciate thecomments from the workshop participants at Duke University, University of Notre Dame, The University of Utah, TheUniversity of Arizona, The University of Texas at Dallas, Dartmouth College, University of Oregon, GeorgetownUniversity, University of Rochester, Washington University in St. Louis, and Hong Kong University of Science andTechnology. I gratefully acknowledge the financial support from the Fuqua School of Business at Duke University, theDeloitte Foundation, University of Rochester, and the Hong Kong University of Science and Technology.Errors and omissions are my responsibility.
Editor’s note: Accepted by Steven Kachelmeier.
Submitted: September 2006Accepted: July 2011
Published Online: November 2011
675
accrual earnings management. I provide evidence for the trade-off decision as a function of the
relative costs of the two activities and show that there is direct substitution between them after the
fiscal year-end due to their sequential nature.
Real activities manipulation is a purposeful action to alter reported earnings in a particular
direction, which is achieved by changing the timing or structuring of an operation, investment, or
financing transaction, and which has suboptimal business consequences. The idea that firms engage
in real activities manipulation is supported by the survey evidence in Graham et al. (2005).1 They
report that 80 percent of surveyed CFOs stated that, in order to deliver earnings, they would
decrease research and development (R&D), advertising, and maintenance expenditures, while 55
percent said they would postpone a new project, both of which are real activities manipulation.
Unlike real activities manipulation, which alters the execution of a real transaction taking place
during the fiscal year, accrual-based earnings management is achieved by changing the accounting
methods or estimates used when presenting a given transaction in the financial statements. For
example, changing the depreciation method for fixed assets and the estimate for provision for
doubtful accounts can bias reported earnings in a particular direction without changing the
underlying transactions.
The focus of this study is on how managers trade off real activities manipulation and
accrual-based earnings management. This question is important for two reasons. First, as mentioned
by Fields et al. (2001), examining only one earnings management technique at a time cannot
explain the overall effect of earnings management activities. In particular, if managers use real
activities manipulation and accrual-based earnings management as substitutes for each other, then
examining either type of earnings management activities in isolation cannot lead to definitive
conclusions. Second, by studying how managers trade off these two strategies, this study sheds light
on the economic implications of accounting choices—that is, whether the costs that managers bear
for manipulating accruals affect their decisions about real activities manipulation. As such, the
question has implications about whether enhancing SEC scrutiny or reducing accounting flexibility
in GAAP, for example, might increase the levels of real activities manipulation engaged in by firms.
I start by analyzing the implications for managers’ trade-off decisions due to the different costs
and timing of the two earnings management strategies. First, because both are costly activities,
firms trade off real activities manipulation versus accrual-based earnings management based on
their relative costliness. That is, when one activity is relatively more costly, firms engage in more of
the other. Because firms face different costs and constraints for the two earnings management
approaches, they show differing abilities to use the two strategies. Second, real activities
manipulation must occur during the fiscal year and is realized by the fiscal year-end, after which
managers still have the chance to adjust the level of accrual-based earnings management. This
timing difference implies that managers would adjust the latter based on the outcome of real
activities manipulation. Hence, there is also a direct, substitutive relation between the two; if real
activities manipulation turns out to be unexpectedly high (low), then managers will decrease
(increase) the amount of accrual-based earnings management they carry out.
Following prior studies, I examine real activities manipulation through overproduction and
cutting discretionary expenditures (Roychowdhury 2006; Cohen et al. 2008; Cohen and Zarowin
2010). I test the hypotheses using a sample of firms that are likely to have managed earnings. As
1 In particular, Graham et al. (2005) note that, ‘‘[t]he opinion of 15 of 20 interviewed executives is that everycompany would/should take actions such as these [real activities manipulation] to deliver earnings, as long as theactions are within GAAP and the real sacrifices are not too large.’’ Graham et al. (2005) further conjecture thatexecutives’ greater emphasis on real activities manipulation rather than accrual-based earnings management maybe due to their reluctance to admit to accounting-based earnings management in the aftermath of the Enron andWorldCom accounting scandals.
676 Zang
The Accounting ReviewMarch 2012
suggested by prior research, earnings management is likely to occur when firms just beat/meet an
important earnings benchmark (Burgstahler and Dichev 1997; Degeorge et al. 1999). Using a
sample containing more than 6,500 earnings management suspect firm-years over the period
1987–2008, I show the empirical results that real activities manipulation is constrained by firms’
competitive status in the industry, financial health, scrutiny from institutional investors, and the
immediate tax consequences of manipulation. The results also show that accrual-based earnings
management is constrained by: the presence of high-quality auditors; heightened scrutiny of
accounting practice after the passage of the Sarbanes-Oxley Act (SOX); and firms’ accounting
flexibility, as determined by their accounting choices in prior periods and the length of their
operating cycles. I find significant positive relations between the level of real activities manipulation
and the costs associated with accrual-based earnings management, and also between the level of
accrual-based earnings management and the costs associated with real activities manipulation,
supporting the hypothesis that managers trade off the two approaches according to their relative
costliness. There is a significant and negative relation between the level of accrual-based earnings
management and the amount of unexpected real activities manipulation, consistent with the
hypothesis that managers ‘‘fine-tune’’ accruals after the fiscal year-end based on the realized real
activities manipulation. Additional Hausman tests show results consistent with the decision of real
activities manipulation preceding the decision of accrual-based earnings management.
Two recent studies have examined the trade-off between real activities manipulation and
accrual-based earnings management. Cohen et al. (2008) document that, after the passage of SOX,
the level of accrual-based earnings management declines, while the level of real activities
manipulation increases, consistent with firms switching from the former to the latter as a result of
the post-SOX heightened scrutiny of accounting practice. Cohen and Zarowin (2010) show that
firms engage in both forms of earnings management in the years of a seasoned equity offering
(SEO). They show further that the tendency for SEO firms to use real activities manipulation is
positively correlated with the costs of accrual-based earnings management in these firms.2
Compared to prior studies, this study contributes to the earnings management literature by
providing a more complete picture of how managers trade off real activities manipulation and
accrual-based earnings management. First, it documents the trade-off in a more general setting by
using a sample of firms that are likely to have managed earnings to beat/meet various earnings
targets. The evidence for the trade-off decisions discussed in this study does not depend on a
specific period (such as around the passage of SOX, as in Cohen et al. [2008]) or a significant
corporate event (such as a SEO, as in Cohen and Zarowin [2010]).
Second, to my knowledge, mine is the first study to identify a set of costs for real activities
manipulation and to examine their impact on both real and accrual earnings management activities.
Prior studies (Cohen et al. 2008; Cohen and Zarowin 2010) only examine the costs of accrual-based
earnings management. By including the costs of real activities manipulation, this study provides
evidence for the trade-off as a function of the relative costs of the two approaches. That is, the level
of each earnings management activity decreases with its own costs and increases with the costs of
the other. In this way, I show that firms prefer different earnings management strategies in a
predictive manner, depending on their operational and accounting environment.
Third, I consider the sequential nature of the two earnings management strategies. Most prior
studies on multiple accounting and/or economic choices implicitly assume that managers decide on
multiple choices simultaneously without considering the sequential decision process as an
alternative process (Beatty et al. 1995; Hunt et al. 1996; Gaver and Paterson 1999; Barton 2001;
2 Cohen and Zarowin (2010) do not examine how accrual-based earnings management for SEO firms varies basedon the costs of real and accrual earnings management.
Trade-Off between Real Activities Manipulation and Accrual-Based Earnings Management 677
The Accounting ReviewMarch 2012
Pincus and Rajgopal 2002; Cohen et al. 2008; Cohen and Zarowin 2010). In contrast, my empirical
model explicitly considers the implication of the difference in timing between the two earnings
management approaches. Because real activities manipulation has to occur during the fiscal year,
but accrual manipulation can occur after the fiscal year-end, managers can adjust the extent of the
latter based on the realized outcomes of the former. I show that, unlike the trade-off during the fiscal
year, which is based on the relative costliness of the two strategies, there is a direct substitution
between the two approaches at year-end when real activities manipulation is realized. Unexpectedly
high (low) real activities manipulation realized is directly offset by a lower (higher) amount of
accrual earnings management.
Section II reviews relevant prior studies. Section III develops the hypotheses. Section IV
describes the research design, measurement of real activities manipulation, accrual-based earnings
management, and independent variables. Section V reports sample selection and empirical results.
Section VI concludes and discusses the implications of my results.
II. RELATED LITERATURE
The extensive literature on earnings management largely focuses on accrual-based earnings
management (reviewed by Schipper 1989; Healy and Wahlen 1999; Fields et al. 2001). A smaller
stream of literature investigates the possibility that managers manipulate real transactions to distort
earnings. Many such studies examine managerial discretion over R&D expenditures (Baber et al.
1991; Dechow and Sloan 1991; Bushee 1998; Cheng 2004). Other types of real activities
manipulation that have been explored include cutting advertising expenditures (Cohen et al. 2010),
stock repurchases (Hribar et al. 2006), sales of profitable assets (Herrmann et al. 2003; Bartov
1993), sales price reductions (Jackson and Wilcox 2000), derivative hedging (Barton 2001; Pincus
and Rajgopal 2002), debt-equity swaps (Hand 1989), and securitization (Dechow and Shakespeare
2009).
The prevalence of real activities manipulation as an earnings management tool was not well
understood until recent years. Graham et al. (2005) survey more than 400 executives and document
the widespread use of real activities manipulation. Eighty percent of the CFOs in their survey stated
that, in order to meet an earnings target, they would decrease expenditure on R&D, advertising, and
maintenance, while 55 percent said they would postpone a new project, even if such delay caused a
small loss in firm value. Consistent with this survey, Roychowdhury (2006) documents
large-sample evidence suggesting that managers avoid reporting annual losses or missing analyst
forecasts by manipulating sales, reducing discretionary expenditures, and overproducing inventory
to decrease the cost of goods sold, all of which are deviations from otherwise optimal operational
decisions, with the intention of biasing earnings upward.
Recent research has started to examine the consequence of real activities manipulation. Gunny
(2010) finds that firms that just meet earnings benchmarks by engaging in real activities
manipulation have better operating performance in the subsequent three years than do firms that do
not engage in real activities manipulation and miss or just meet earnings benchmarks. Bhojraj et al.
(2009), on the other hand, show that firms that beat analyst forecasts by using real and accrual
earnings management have worse operating performance and stock market performance in the
subsequent three years than firms that miss analyst forecasts without earnings management.
Most previous research on earnings management examines only one earnings management tool
in settings where earnings management is likely to occur (e.g., Healy 1985; Dechow and Sloan
1991; Roychowdhury 2006). However, given the portfolio of earnings management strategies,
managers probably use multiple techniques at the same time. A few prior studies (Beatty et al.
1995; Hunt et al. 1996; Gaver and Paterson 1999; Barton 2001; Pincus and Rajgopal 2002; Cohen
678 Zang
The Accounting ReviewMarch 2012
et al. 2008; Cohen and Zarowin 2010; Badertscher 2011) examine how managers use multiple
accounting and operating measures to achieve one or more goals.
Beatty et al. (1995) study a sample of 148 commercial banks. They identify two accrual
accounts (loan loss provisions and loan charge-offs) and three operating transactions (pension
settlement transactions, miscellaneous gains and losses due to asset sales, and issuance of new
securities) that these banks can adjust to achieve three goals (optimal primary capital, reported
earnings, and taxable income levels). The authors construct a simultaneous equation system, in
which the banks minimize the sum of the deviations from the three goals and from the optimal
levels of the five discretionary accounts.3 They find evidence that some, but not all, of the
discretionary accounts (including both accounting choices and operating transactions) are adjusted
jointly for some of the objectives identified.
Barton (2001) and Pincus and Rajgopal (2002) study how firms manage earnings volatility
using a sample of Fortune 500 and oil and gas firms, respectively. Both studies use simultaneous
equation systems, in which derivative hedging and accrual management are simultaneously
determined to manage earnings volatility. Barton (2001) suggests that the two activities are used as
substitutes, as evidenced by the negative relation between the two after controlling for the desired
level of earnings volatility. Pincus and Rajgopal (2002) find a similar negative relation, but only in
the fourth quarter.
There are two limitations in the approach taken by the above studies. First, in the empirical
tests, they assume that the costs of adjusting discretionary accounts are constant across all firms
and, hence, do not generate predictions or incorporate empirical proxies for the costs. In other
words, they do not consider that discretion in some accounts is more costly to adjust for some firms.
Hence, these studies fail to consider the trade-off among different tools due to their relative costs.
Second, they assume all decisions are made simultaneously. If some decisions are made before
others, then this assumption can lead to misspecification in their equation system.
Badertscher (2011) examines overvaluation as an incentive for earnings management. He finds
that during the sustained period of overvaluation, managers use accrual earnings management in
early years, real activities manipulation in later years, and non-GAAP earnings management as a
last resort. He claims that the duration of overvaluation is an important determinant in managers’
choice of earnings management approaches, but he does not model the trade-off between real
activities manipulation and accrual-based earnings management based on their relative costliness,
nor does his study examine the implication of the sequential nature of the two activities during the
year.
Two recent studies examine the impact of the costs of accrual-based earnings management on
the choice of earnings management strategies. Cohen et al. (2008) show that, on average,
accrual-based earnings management declines, but real activities manipulation increases, after the
passage of SOX. They focus on one cost of accrual-based earnings management, namely the
heightened post-SOX scrutiny of accounting practice, and its impact on the levels of real and
accrual earnings management. Using a sample of SEO firms, Cohen and Zarowin (2010) examine
several costs of accrual-based earnings management and show that they are positively related to the
tendency to use real activities manipulation in the year of a SEO. Neither study examines the costs
of real activities manipulation or considers the sequential nature of the two strategies. Hence, they
do not show the trade-off decision as a function of the relative costs of the two strategies or the
direct substitution between the two after the fiscal year-end.
3 Hunt et al. (1996) and Gaver and Paterson (1999) follow Beatty et al. (1995) and construct similar simultaneousequation systems.
Trade-Off between Real Activities Manipulation and Accrual-Based Earnings Management 679
The Accounting ReviewMarch 2012
III. HYPOTHESES DEVELOPMENT
Consistent with prior research on multiple earnings management strategies, I predict that
managers use real activities manipulation and accrual-based earnings management as substitutes to
achieve the desired earnings targets. Unlike prior research, however, I investigate the differences in
the costs and timing of real activities manipulation and accrual-based earnings management, and
their implications for managers’ trade-off decisions.
Both real activities manipulation and accrual-based earnings management are costly activities.
Firms are likely to face different levels of constraints for each strategy, which will lead to varying
abilities to use them. A manager’s trade-off decision, therefore, depends on the relative costliness of
the two earnings management methods, which is, in turn, determined by the firm’s operational and
accounting environment. That is, given the desired level of earnings, when discretion is more
constrained for one earnings management tool, the manager will make more use of the other. This
expectation can be expressed as the following hypothesis:
H1: Other things being equal, the relative degree of accrual-based earnings management vis-a-vis real activities manipulation depends on the relative costs of each action.
Accrual-based earnings management is constrained by scrutiny from outsiders and the
available accounting flexibility. For example, a manager might find it harder to convince a
high-quality auditor of his/her aggressive accounting estimates than a low-quality auditor. A
manager might also feel that accrual-based earnings management is more likely to be detected when
regulators heighten scrutiny of firms’ accounting practice. Other than scrutiny from outsiders,
accrual-based earnings management is constrained by the flexibility within firms’ accounting
systems. Firms that are running out of such flexibility due to, for example, having made aggressive
accounting assumptions in the previous periods face an increasingly high risk of being detected by
auditors and violating GAAP with more accrual-based earnings management. Hence, I formulate
the following two subsidiary hypotheses to H1:
H1a: Other things being equal, firms facing greater scrutiny from auditors and regulators have
a higher level of real activities manipulation.
H1b: Other things being equal, firms with lower accounting flexibility have a higher level of
real activities manipulation.
Real activities manipulation, as a departure from optimal operational decisions, is unlikely to
increase firms’ long-term value. Some managers might find it particularly costly because their firms
face intense competition in the industry. Within an industry, firms are likely to face various levels of
competition and, therefore, are under different amounts of pressure when deviating from optimal
business strategies. Management research (as reviewed by Woo [1983]) shows that market leaders
enjoy more competitive advantages than do followers, due to their greater cumulative experience,
ability to benefit from economies of scale, bargaining power with suppliers and customers, attention
from investors, and influence on their competitors. Therefore, managers in market-leader firms may
perceive real activities manipulation as less costly because the erosion to their competitive
advantage is relatively small. Hence, I predict the following:
H1c: Other things being equal, firms without market-leader status have a higher level of
accrual-based earnings management.
For a firm in poor financial health, the marginal cost of deviating from optimal business
strategies is likely to be high. In this case, managers might perceive real activities manipulation as
relatively costly because their primary goal is to improve operations. This view is supported by the
survey evidence documented by Graham et al. (2005), who find that CFOs admit that if the
680 Zang
The Accounting ReviewMarch 2012
company is in a ‘‘negative tailspin,’’ then managers’ efforts to survive will dominate their reporting
concerns. This reasoning leads to the following subsidiary hypothesis to H1:
H1d: Other things being equal, firms with poor financial health have a higher level of accrual-
based earnings management.
Managers might find it difficult to manipulate real activities when their operation is being
monitored closely by institutional investors. Prior studies suggest that institutional investors play a
monitoring role in reducing real activities manipulation.4 Bushee (1998) finds that, when
institutional ownership is high, firms are less likely to cut R&D expenditure to avoid a decline in
earnings. Roychowdhury (2006) also finds a negative relation between institutional ownership and
real activities manipulation to avoid losses. Unlike accrual-based earnings management, real
activities manipulation has real economic consequences for firms’ long-term value. Institutional
investors, being more sophisticated and informed than other investors, are likely to have a better
understanding of the long-term implication of firms’ operating decisions, leading to more effort to
monitor and curtail real activities manipulation than accrual-based earnings management, as
predicted in the following subsidiary hypothesis:
H1e: Other things being equal, firms with higher institutional ownership have a higher level of
accrual-based earnings management.
Real activities manipulation is also costly due to tax incentives. It might be subject to a higher
level of book-tax conformity than accrual-based earnings management, because the former has a
direct cash flow effect in the current period, while the latter does not. Specifically, when firms
increase book income by cutting discretionary expenditures or by overproducing inventory, they
also increase taxable income and incur higher tax costs in the current period.5 In contrast,
management of many accrual accounts increases book income without current-period tax
consequences. For example, increasing the estimated useful lives of long-term assets, decreasing
write-downs for impaired assets, recognizing unearned revenue aggressively, and decreasing bad
debt expense all can increase book income without necessarily increasing current-year taxable
income. Therefore, for firms with higher marginal tax rates, the net present value of the tax costs
associated with real activities manipulation is likely to be higher than that of accrual-based earnings
management, leading to the following prediction:
H1f: Other things being equal, firms with higher marginal tax rates have a higher level of
accrual-based earnings management.
Another difference between the two earnings management strategies that will influence
managers’ trade-off decisions is their different timing. H1 predicts that the two earnings
management strategies are jointly determined and the trade-off depends on their relative costliness.
However, a joint decision does not imply a simultaneous decision. Because real activities
manipulation changes the timing and/or structuring of business transactions, such decisions and
activities have to take place during the fiscal year. Shortly after the year-end, the outcome of the real
activities manipulation is revealed, and managers can no longer engage in it. Note that, when a
manager alters real business decisions to manage earnings, s/he does not have perfect control over
4 However, there is also evidence that ‘‘transient’’ institutions, or those with high portfolio turnover and highlydiversified portfolio holdings, increase managerial myopic behavior (e.g., Porter 1992; Bushee 1998; Bushee2001). In this study, I focus on the average effect of institutional ownership on firms’ earnings managementactivities without looking into the investment horizon of different institutions.
5 Other types of real activities manipulation, such as increasing sales by discounts and price cuts, and sale of long-term assets, are also book-tax-conforming earnings management.
Trade-Off between Real Activities Manipulation and Accrual-Based Earnings Management 681
The Accounting ReviewMarch 2012
the exact amount of the real activities manipulation attained. For example, a pharmaceutical
company cuts current-period R&D expenditure by postponing or canceling development of a
certain drug. This real decision can include a hiring freeze and shutting down the research site. The
manager may be able to make a rough estimate of the dollar amount of the impact on R&D
expenditure from these decisions, but s/he does not have perfect information about it.6 Therefore,
managers face uncertainty when they execute real activities manipulation. After the fiscal year-end,
the realized amount of the real activities manipulation could be higher or lower than the amount
originally anticipated.
On the other hand, after the fiscal year-end but before the earnings announcement date,
managers can still adjust the accruals by changing the accounting estimates or methods. In addition,
unlike real activities manipulation, which distorts earnings by executing transactions differently,
accrual management impacts reported earnings in a more immediate and certain manner. Therefore,
when managers observe the impact of real activities manipulation on earnings at the fiscal year-end,
they can offset an unexpectedly high (low) impact by using less (more) accrual management. This
prediction, which is my next hypothesis, is based on the premise that managers will use the two
earnings management methods as substitutes:
H2: Managers adjust the amount of accrual-based earnings management after real activities
manipulation is realized; the level of accrual-based earnings management is negatively
related to the unexpected amount of real activities manipulation.
IV. RESEARCH DESIGN
Real Activities Manipulation
Following Roychowdhury (2006), I examine the following manipulation of real activities:
increasing earnings by reducing the cost of goods sold by overproducing inventory, and cutting
discretionary expenditures, including R&D, advertising, and selling, general, and administrative
(SG&A) expenditures.7 The former is measured by the abnormal level of production costs, the latter
by the abnormal level of discretionary expenditures. Subsequent studies using the same metrics
(Cohen et al. 2008; Cohen and Zarowin 2010) provide further evidence that these measures capture
real activities manipulation.
I estimate the normal level of production costs following Roychowdhury (2006):
PRODt=At�1 ¼ a0 þ a1ð1=At�1Þ þ a2ðSt=At�1Þ þ a3ðDSt=At�1Þ þ a4ðDSt�1=At�1Þ þ et; ð1Þ
where PRODt is the sum of the cost of goods sold in year t and the change in inventory from t�1 to t;At�1 is the total assets in year t�1; St is the net sales in year t; and DSt is the change in net sales from year
t�1 to t. Equation (1) is estimated cross-sectionally for each industry-year with at least 15 observations,
where industry is defined following Fama and French (1997),8 such that the estimated coefficients vary
6 Another example is reducing traveling expenditures by requiring employees to fly economy class instead ofallowing them to fly business class. This change could be suboptimal because employees might reduce thenumber of visits they make to important clients or because employees’ morale might be adversely impacted,leading to greater turnover. The manager cannot know for certain the exact amount of SG&A being cut, as s/hedoes not know the number of business trips taken by employees during the year.
7 In this study, I do not examine abnormal cash flows from operations because, as discussed in Roychowdhury(2006), real activities manipulation impacts this in different directions and the net effect is ambiguous.Specifically, Roychowdhury (2006) points out that price discount, channel stuffing, and overproduction alldecrease cash flows from operations, while cutting discretionary expenditures increases them.
8 The results are similar if I use the two-digit SIC industry grouping for all the estimation regressions.
682 Zang
The Accounting ReviewMarch 2012
over time and reflect the impact on production costs from industry-wide economic conditions during
the year. The abnormal level of production costs (RMPROD) is measured as the estimated residual from
Equation (1). The higher the residual, the larger is the amount of inventory overproduction, and the
greater is the increase in reported earnings through reducing the cost of goods sold.9
Also following Roychowdhury (2006), I estimate the normal level of discretionary
expenditures using the following equation:
DISXt=At�1 ¼ a0 þ a1ð1=At�1Þ þ a2ðSt�1=At�1Þ þ et; ð2Þ
where DISXt is the discretionary expenditures (i.e., the sum of R&D, advertising, and SG&A
expenditures) in year t. I estimate the above regression cross-sectionally for industry-years with at
least 15 observations. The abnormal level of discretionary expenditures is measured as the
estimated residual from the regression. I multiply the residuals by�1 (denoted as RMDISX) such that
higher values indicate greater amounts of discretionary expenditures cut by firms to increase
reported earnings. I aggregate the two real activities manipulation measures into one proxy, RM, by
taking their sum.
Accrual-Based Earnings Management
Following prior literature, I use discretionary accruals to proxy for accrual-based earnings
management. Discretionary accruals are the difference between firms’ actual accruals and the
normal level of accruals. I estimate the latter using the following modified Jones (1991) model:
Accrualst=At�1 ¼ a0 þ a1ð1=At�1Þ þ a2ðDSt=At�1Þ þ a3ðPPEt=At�1Þ þ et; ð3Þ
where Accrualst is the earnings before extraordinary items and discontinued operations minus the
operating cash flows reported in the statement of cash flows in year t (see Collins and Hribar
1999);10 and PPEt is the gross property, plant, and equipment. I estimate the above regression
cross-sectionally for industry-years with at least 15 observations. The estimated residuals (AM),
capturing discretionary accruals, are my proxy for accrual-based earnings management.11
Earnings Management Suspect Firms and the Correction for Potential Sample Bias
Because the focus of the study is on firms’ trade-off decisions between the two earnings
management approaches, not the decision of whether to engage in earnings management, I test the
hypothesis in a setting in which earnings management is likely to occur. Using such a sample also
increases the power of the tests of the trade-off decisions. Prior literature suggests that firm-years
with earnings right at or just above benchmarks are likely to manage earnings to meet these
important benchmarks (e.g., Burgstahler and Dichev 1997; Degeorge et al. 1999; Bartov et al.
2002). Graham et al. (2005) also provide survey evidence that CFOs find the following earnings
benchmarks the most important: same quarter last year, analyst consensus forecast, zero earnings,
and previous quarter earnings per share (EPS). Accordingly, I define earnings management suspects
as firm-years with earnings just beating/meeting the prior year’s earnings, zero earnings, and analyst
9 I follow Roychowdhury (2006) and include intercepts in the estimation models for the normal levels ofproduction costs, discretionary expenditures, and accruals. The empirical results are similar if I do not includeintercepts in these estimation models.
10 The results are similar if I measure accruals using balance sheet data.11 As a robustness check, I measure real activities manipulation and accrual-based earnings management as
indicator variables that equal 1 if RM and AM are greater than 0, and 0 otherwise. Such measurement addressesthe potential nonlinear relation between manipulation activities and their costs, and yields similar results.
Trade-Off between Real Activities Manipulation and Accrual-Based Earnings Management 683
The Accounting ReviewMarch 2012
consensus forecast. In cases where firms provide management guidance, I also include firm-years
just beating/meeting management forecasts in the earnings management suspect sample.
The hypotheses on the trade-off between real activities manipulation versus accrual-based
earnings management are tested using the earnings management suspect firms. Using a non-
randomly selected sample in the regression estimation creates a potential omitted-variable problem,
which can bias the coefficient estimates of the explanatory variables. To address this, I conduct the
Heckman (1979) two-step procedure to correct for the potential sample selection bias in the main
tests. In the first step, I estimate a selection model using all the sample firms and obtain the inverse
Mills ratio (IMR).12 In the second step, I include IMR in the main tests on the suspect sample as a
control variable to correct for potential selection bias. The following probit model is used in the
Heckman first step to explain earnings management suspect firms:
Prob½Suspectt ¼ 1� ¼ Probitðc0 þ c1Habitual Beatert þ c2Stock Issuancetþ1
þ c3Analyst Followingt þ c4MtoBt�1 þ c5Sharest þ c6ROAt
þX
k
c7;kYear Indicatork;t þ etÞ: ð4Þ
The dependent variable in the selection model is, Suspectt, which equals 1 if a firm just beats/
meets one of the earnings benchmarks discussed above, and 0 otherwise. Selection of the independent
variables builds on prior research that suggests capital market incentives dominate other incentives for
beating/meeting earnings targets. Both Bartov et al. (2002) and Kasznik and McNichols (2002) find
that the market places a greater premium on ‘‘habitual’’ than ‘‘sporadic’’ beaters, implying that firms
that have repeatedly beaten earnings targets have stronger incentives to keep doing so. I use
the number of times of beating/meeting analysts’ forecast consensus in the past four quarters
ðHabitual BeatertÞ to capture this. Teoh et al. (1998) and Rangan (1998) find that managers manage
earnings at the time of SEOs, suggesting stronger incentives to boost their stock prices just before they
issue equity. I measure this incentive using an indicator variable ðStock Issuancetþ1Þ that equals 1 if
the firm issues equity in the next year, and 0 otherwise. Because analyst coverage might create
pressure for managers to issue guidance and beat forecast targets, I include the log of 1 plus the
number of analysts following the firm ðAnalyst FollowingtÞ as an explanatory variable. Both Barth et
al. (1999) and Skinner and Sloan (2002) show that the incentive to report earnings increases is
increasing with firms’ growth opportunities. I include market-to-book ratio at the beginning of the
year (MtoBt�1) to capture firms’ growth opportunities. As earnings benchmarks are often per-share
numbers, one penny short in EPS translates into more dollars of actual earnings for firms with more
shares outstanding. Hence, I include the log number of shares outstanding as a control variable
(Sharest). Firm profitability, (return on assets, ROAt, computed using net income for the rolling four
quarters ending with the third quarter of year t) and year indicators are also included.13,14
12 The inverse Mills ratio is estimated as, u(z)/U(z) where z is the fitted value of the probit regression indexfunction; u is the density function for standard normal distribution; and U is the cumulative density function for astandard normal distribution.
13 I use this measure because the fourth-quarter ROA is the one most likely affected by earnings managementactivities. The empirical results based on the ROA of the four quarters in year t are similar.
14 Managers’ equity compensation also provides an incentive to manage earnings (see Cheng and Warfield 2005).As a sensitivity test, I include equity incentive as defined in Cheng and Warfield (2005) as an additionalexplanatory variable in Equation (4). The estimated coefficient of equity incentive is positive, consistent withequity compensation providing an incentive to manage earnings. However, because the variable requires datafrom Execucomp, the data requirement shrinks the sample size substantially (for the Heckman first step by 82.0percent, from 121,861 to 21,928 firm-year observations). Hence, I exclude equity incentive to avoid thissignificant loss of sample. For the smaller sample where equity incentive data are available, I include thisvariable in the Heckman first stage; the main results are similar.
684 Zang
The Accounting ReviewMarch 2012
The Trade-Off between Real Activities Manipulation and Accrual-Based EarningsManagement
To investigate how managers trade off real versus accrual-based earnings management, I
estimate the following equations using the earnings management suspect sample:
RMt ¼ b0 þX
k
b1;kCost of RMk;t þX
l
b2;lCost of AMl;t þX
m
b3;mControlm;t þ ut: ð5Þ
AMt ¼ c0 þX
k
c1;kCost of AMk;t þX
l
c2;lCost of RMl;t þ c3Unexpected RMt
þX
m
c4;mControlm;t þ vt: ð6Þ
H1 predicts that the trade-off between the two earnings management approaches is determined
by their relative costliness. That is, when the costs associated with accrual-based earnings
management are high, firms use real activities manipulation more, and vice versa. Therefore, b2 in
Equation (5) and c2 in Equation (6) are both expected to be positive. Because each earnings
management approach is constrained by its own costs, b1 in Equation (5) and c1 in Equation (6) are
expected to be negative. As discussed above, real activities manipulation has to be executed and
realized by the fiscal year-end, after which managers can still adjust the extent of accrual-based
earnings management based on the observed impact of real manipulation on earnings (i.e., H2).
Therefore, I use a recursive equation system to capture this sequence of decisions. That is, the
extent of real activities manipulation is determined by the costs of both earnings management tools
and other predetermined firm characteristics, but not by the realized outcome of accrual-based
earnings management. The extent of accrual-based earnings management is determined not only by
the costs of earnings management activities, but also by the unexpected amount of real activities
manipulation realized. H2 predicts that managers increase (decrease) the extent of accrual-based
earnings management when real activities manipulation turns out to be unexpectedly low (high).
The hypothesized direct and substitutive relation between the two earnings management methods
implies a negative sign on c3 in the accrual management equation. Because the dependency
between the two types of earnings management is unidirectional, both regressions in the recursive
equation system can be estimated consistently using OLS estimation. In the accrual-based earnings
management equation, Unexpected RMt is measured as the estimated residual from Equation (5).
Costs Associated with Real Activities Manipulation
In Section III, I identify four types of costs associated with real activities manipulation. The
first is a firm’s market-leader status in the industry at the beginning of the year ðMarket Sharet�1Þ:Market_Share captures the inverse of the costs associated with real activities manipulation. It is
measured as the ratio of a company’s sales to the total sales of its industry. In order to reduce
measurement error in this proxy, I follow Harris (1998) and use a finer industry grouping based on
three-digit SIC codes, which captures industry competition better than the Fama-French
classification.
The second type of cost concerns firms’ financial health. Following prior research, I use a
modified version of Altman’s Z-score (Altman 1968, 2000) to proxy for a firm’s financial health:
ZSCOREt ¼ 0:3NIt
Assettþ 1:0
Salest
Assettþ 1:4
Retained Earningst
Assettþ 1:2
Working CapitaltAssett
þ 0:6Stock Price 3 Shares Outstandingt
Total Liabilitiest:
Trade-Off between Real Activities Manipulation and Accrual-Based Earnings Management 685
The Accounting ReviewMarch 2012
I use financial health at the beginning of the year (ZSCOREt�1) to capture the cost of real activities
manipulation. Higher values of ZSCORE indicate a healthier financial condition and a lower cost
associated with real activities manipulation.
The third type of cost recognizes the influence of institutional ownership on real activities
manipulation. I use the percentage of institutional ownership at the beginning of year t (INSTt�1) as
this measure. The last type of cost is firms’ marginal tax rates (MTRt). The measurement that I use is
developed and provided by Professor John Graham (see Graham and Mills 2008; Graham 1996a,
1996b, http://faculty.fuqua.duke.edu/;jgraham/).15 Higher values of INST and MTR indicate high
costs for real activities manipulation.
Costs Associated with Accrual-Based Earnings Management
In Section III, I identify two types of costs associated with accrual-based earnings
management. I use the following five proxies to capture these costs. The first three concern the
scrutiny of auditors and regulators. The first, Big8t, indicates whether the firm’s auditor is one of the
Big 8.16 Prior research shows that Big 8 audit firms constrain earnings management through
discretionary accruals (e.g., DeFond and Jiambalvo 1991, 1993; Becker et al. 1998; Francis et al.
1999). This is because they are likely to be more experienced, to invest more resources in auditing,
and to have more reputation at risk than smaller audit firms. The second proxy is auditor tenure.
Stice (1991) finds that audit quality increases with tenure and argues that the risk of not detecting
errors due to unfamiliarity decreases with tenure. Myers et al. (2003) document a significant and
negative relation between accrual-based earnings management and auditor tenure after controlling
for auditor type (Big 8 versus non-Big 8). They suggest that on average, auditors place greater
constraints on earnings management through discretionary accruals as their relationship with the
client lengthens. Therefore, I consider auditor tenure ðAudit TenuretÞ as a proxy for auditor
scrutiny and measure it as an indicator variable that equals 1 if the number of years the auditor has
audited the client is above the sample median of six years, and 0 otherwise. The third proxy is
whether the observation is from the post-SOX period, SOXt, measured as an indicator variable that
equals 1 if the fiscal year is after 2003, and 0 otherwise. Aiming at restoring market confidence after
a series of high-profile accounting scandals during 2000–2001, SOX is likely to heighten scrutiny
of firms’ accounting practices from both auditors and regulators. Cohen et al. (2008) find results
consistent with managers decreasing accrual earnings management after the passage of SOX.
The next two proxies measure the flexibility within firms’ accounting systems. The first one
captures accrual-based earnings management in prior years. Due to the limited flexibility within
GAAP and the reversal of accruals, managers’ ability to manipulate accruals upward in the current
period is constrained by accrual management activities in previous periods. I use Barton and
Simko’s (2002) balance sheet measure of previous accounting choices—net operating assets at the
beginning of the year (NOAt�1)—as a proxy for the extent of accrual management in previous
periods. The rationale for this measure is that, because of the articulation between the income
statement and the balance sheet, abnormal accruals reflected in past earnings are also reflected in net
assets; hence, the latter are overstated when firms engage in accrual manipulation in previous
periods. I predict that the cost of accrual management in the current period is positively related to
the extent of overstated net operating assets at the beginning of the year. I measure NOA as an
15 The marginal tax rate developed by Graham (1996a) incorporates information such as a net operating loss (NOL)carryforward. More importantly, his simulated marginal tax rate captures an important dynamic feature of the taxcode such as the effects of NOL carrybacks and carryforwards in the near future (see Graham 1996a; Graham andMills 2007; Shevlin 1990). When using the cruder measure of NOL carryforward, my results remain similar.
16 Or Big 6, Big 5, and Big 4 audit firms in recent years.
686 Zang
The Accounting ReviewMarch 2012
indicator variable that equals 1 if the net operating assets (i.e., shareholders’ equity less cash and
marketable securities plus total debt) at the beginning of the year divided by lagged sales are above
the median of the corresponding industry-year, and 0 otherwise. The second proxy for firms’
accounting flexibility is the length of their operating cycles (Cyclet�1). Firms with longer operating
cycles have greater flexibility for accrual management because they have larger accrual accounts
and a longer period for accruals to reverse. The operating cycle is computed as the days receivable
plus the days inventory less the days payable at the beginning of the year, as defined by Dechow
(1994).
Control Variables
In both equations, I include the inverse Mills ratio (IMR) from the first step of the Heckman
procedure to correct for the potential sample bias;17 ROA, computed using net income for the
rolling four quarters ending with the third quarter of the year, to control for firm performance;
industry-adjusted log value of total assets (Asset) to control for relative firm size in the industry;
market-to-book ratio (MtoB) to control for firms’ growth rate; and year indicators to control for
general economy conditions in each year. Because both real activities manipulation and accrual-
based earnings management are positively related to the amount of total earnings management
activities needed to meet benchmarks, I follow Beatty et al. (1995) and Hunt et al. (1996) and
include in the real activities manipulation equation pre-managed earnings (Earn) to control for the
goal of managing earnings upward. In the accrual management equation, I include the predicted
amount of real activities manipulation from Equation (5) (Pred_RM) to control for the extent of
income-increasing earnings management activities.18
V. SAMPLE SELECTION AND RESULTS
Measures of Real Activities Manipulation and Accrual-Based Earnings Management
I start from the population of the CRSP/Compustat Merged Database 1987–2008, during which
statement of cash flows data are available for calculating accruals (Hribar and Collins 2002). I
exclude financial institutions (SIC 6000–6999) and regulated industries (SIC 4400–5000) from the
sample. Table 1, Panel A reports the estimation results for the normal levels of production costs,
discretionary expenditures, and total accruals (i.e., Equations (1) to (3)). The equations are
estimated cross-sectionally for each industry-year with at least 15 observations. There are more than
820 industry-years available during the sample period for each estimation model. On average, each
industry-year regression contains more than 150 observations. All of the mean coefficients are
significant and comparable to those reported in Roychowdhury (2006). The mean adjusted R2 is
41.97 percent for the total accruals model, 57.55 percent for the discretionary expenditure model,
and 90.61 percent for the production cost model, indicating these models have reasonable to
substantial explanatory power.
The estimated residuals from the relevant estimation models measure the abnormal levels of
production costs, discretionary expenditures, and discretionary accruals. Higher values of abnormal
17 IMR is the nonlinear combination of the first-stage regressors. As a sensitivity test, I estimate the second-stageregression by replacing IMR with the first-stage regressors. The empirical results remain similar.
18 The cross-sectional variation in the desired amount of manipulation among firms explains the extent of income-increasing earnings management activities through both approaches, which is why the simple correlationbetween real and accrual manipulation is positive (also discussed by Cohen and Zarowin [2010] andRoychowdhury [2006]). Equation (6) captures the substitutive relation between real and accrual earningsmanagement after controlling for their positive relation with the extent of income-increasing earningsmanagement activities using Pred_RM.
Trade-Off between Real Activities Manipulation and Accrual-Based Earnings Management 687
The Accounting ReviewMarch 2012
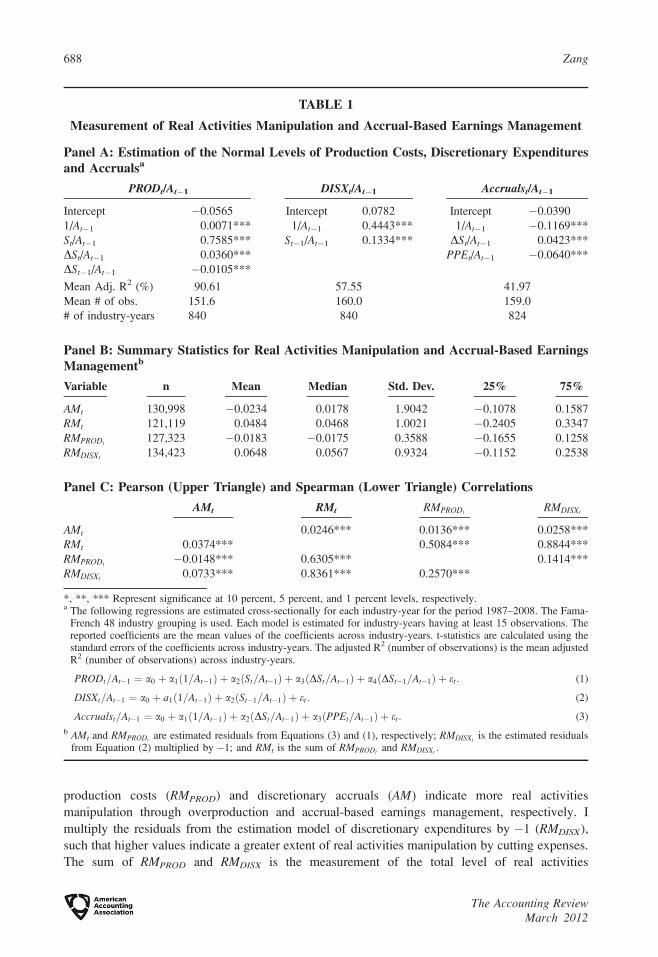
production costs (RMPROD) and discretionary accruals (AM) indicate more real activities
manipulation through overproduction and accrual-based earnings management, respectively. I
multiply the residuals from the estimation model of discretionary expenditures by �1 (RMDISX),
such that higher values indicate a greater extent of real activities manipulation by cutting expenses.
The sum of RMPROD and RMDISX is the measurement of the total level of real activities
TABLE 1
Measurement of Real Activities Manipulation and Accrual-Based Earnings Management
Panel A: Estimation of the Normal Levels of Production Costs, Discretionary Expendituresand Accrualsa
PRODt/At�1 DISXt/At�1 Accrualst/At�1
Intercept �0.0565 Intercept 0.0782 Intercept �0.0390
1/At�1 0.0071*** 1/At�1 0.4443*** 1/At�1 �0.1169***
St/At�1 0.7585*** St�1/At�1 0.1334*** DSt/At�1 0.0423***
DSt/At�1 0.0360*** PPEt/At�1 �0.0640***
DSt�1/At�1 �0.0105***
Mean Adj. R2 (%) 90.61 57.55 41.97
Mean # of obs. 151.6 160.0 159.0
# of industry-years 840 840 824
Panel B: Summary Statistics for Real Activities Manipulation and Accrual-Based EarningsManagementb
Variable n Mean Median Std. Dev. 25% 75%
AMt 130,998 �0.0234 0.0178 1.9042 �0.1078 0.1587
RMt 121,119 0.0484 0.0468 1.0021 �0.2405 0.3347
RMPRODt127,323 �0.0183 �0.0175 0.3588 �0.1655 0.1258
RMDISXt134,423 0.0648 0.0567 0.9324 �0.1152 0.2538
Panel C: Pearson (Upper Triangle) and Spearman (Lower Triangle) Correlations
AMt RMt RMPRODtRMDISXt
AMt 0.0246*** 0.0136*** 0.0258***
RMt 0.0374*** 0.5084*** 0.8844***
RMPRODt�0.0148*** 0.6305*** 0.1414***
RMDISXt0.0733*** 0.8361*** 0.2570***
*, **, *** Represent significance at 10 percent, 5 percent, and 1 percent levels, respectively.a The following regressions are estimated cross-sectionally for each industry-year for the period 1987–2008. The Fama-
French 48 industry grouping is used. Each model is estimated for industry-years having at least 15 observations. Thereported coefficients are the mean values of the coefficients across industry-years. t-statistics are calculated using thestandard errors of the coefficients across industry-years. The adjusted R2 (number of observations) is the mean adjustedR2 (number of observations) across industry-years.
PRODt=At�1 ¼ a0 þ a1ð1=At�1Þ þ a2ðSt=At�1Þ þ a3ðDSt=At�1Þ þ a4ðDSt�1=At�1Þ þ et: (1)
DISXt=At�1 ¼ a0 þ a1ð1=At�1Þ þ a2ðSt�1=At�1Þ þ et: (2)
Accrualst=At�1 ¼ a0 þ a1ð1=At�1Þ þ a2ðDSt=At�1Þ þ a3ðPPEt=At�1Þ þ et: (3)
b AMt and RMPRODtare estimated residuals from Equations (3) and (1), respectively; RMDISXt
is the estimated residualsfrom Equation (2) multiplied by �1; and RMt is the sum of RMPRODt
and RMDISXt:
688 Zang
The Accounting ReviewMarch 2012
manipulation (RM). Panel B of Table 1 reports summary statistics for the proxies of real and accrual
earnings management. I winsorize the proxies at the top and bottom 1 percent to avoid extreme
observations due to noisy estimation. Hence, the means of the proxies are not zero. The Pearson and
Spearman correlations among the variables are shown in Table 1, Panel C. The high correlations
between RMPROD and RM, and between RMDISX and RM are mechanical because RM is the sum of
the two proxies. There is a positive correlation between RMPROD and RMDISX (Pearson correlation
of 0.1414), and a positive correlation between RM and AM (Pearson correlation of 0.0246),
suggesting that firms use both real activities manipulation and accrual-based earnings management.
Suspect Firms Just Beating/Meeting Important Earnings Benchmarks
To test the hypotheses about managers’ trade-off decisions between real activities manipulation
and accrual-based earnings management, I use a sample of earnings management suspect firms to
increase power. Following prior research, I consider firm-years just beating/meeting important
earnings benchmarks the situations in which earnings management is more likely to occur.
Following Roychowdhury (2006), suspects just beating/meeting the zero benchmark are defined as
firm-years with earnings before extraordinary items over lagged assets between 0 and 0.005. I
measure suspects just beating/meeting last-year earnings as firm-years with change in basic EPS
excluding extraordinary items from last year between 0 and 2 cents; and suspects just beating/
meeting analyst forecast consensus (management forecasts) as firm-years with actual EPS less the
last analyst forecast consensus (management forecast) before the fiscal year-end between 0 and 1
cent.19 During the sample period, there are 3,428 firm-years just beating/meeting the zero
benchmark; 7,064 just beating/meeting last-year earnings; and 7,592 and 2,142 just beating/meeting
analyst forecast consensus and management forecasts, respectively.
To compare the suspect firms with a sample of non-suspect firms, I estimate the following
regressions developed by Roychowdhury (2006):
Yt ¼ b0 þ b1MVEt�1 þ b2MtoBt�1 þ b3ROAt þ b4Suspectt þX
j
b5;jYear Indicatort;j þ et;
ð7Þ
where the dependent variables are measures of real activities manipulation and accrual-based
earnings management. Following Roychowdhury (2006), I include the log value of market value of
equity (MVE), the market-to-book ratio (MtoB), and the return on assets (ROA) to control for
systematic variation in abnormal production costs, discretionary expenditures, and accruals related
to firm size, growth opportunities, and current-period firm performance, respectively. Because the
dependent variables are measured as the deviations from industry-year means, the control variables
are also measured in this way. Suspect is an indicator variable that equals 1 if the firm-year just
beats/meets one of the earnings benchmarks, and 0 if it clearly misses or beats all the benchmarks.
Because firm-years close to the important benchmarks might still have incentives to manage
earnings upward, I define firm-years that clearly miss or beat all earnings benchmarks as those that
miss or beat zero earnings by 2.5 percent of lagged total assets, and those that miss or beat analyst
forecast consensus, management forecasts, and last-year EPS by more than 5 cents.20
Table 2 reports the estimation results. Consistent with Roychowdhury (2006), Panel A shows
that, when suspects are firm-years just beating/meeting the zero benchmark, the coefficients on
Suspect are positive for the AM, RM, RMPROD, and RMDISX equations (significant at least at the 10
19 I use the actual EPS and analyst forecast consensus provided by I/B/E/S Database, and the actual EPS andmanagement forecasts provided by First Call Database.
20 Other cutoff points yield similar results.
Trade-Off between Real Activities Manipulation and Accrual-Based Earnings Management 689
The Accounting ReviewMarch 2012
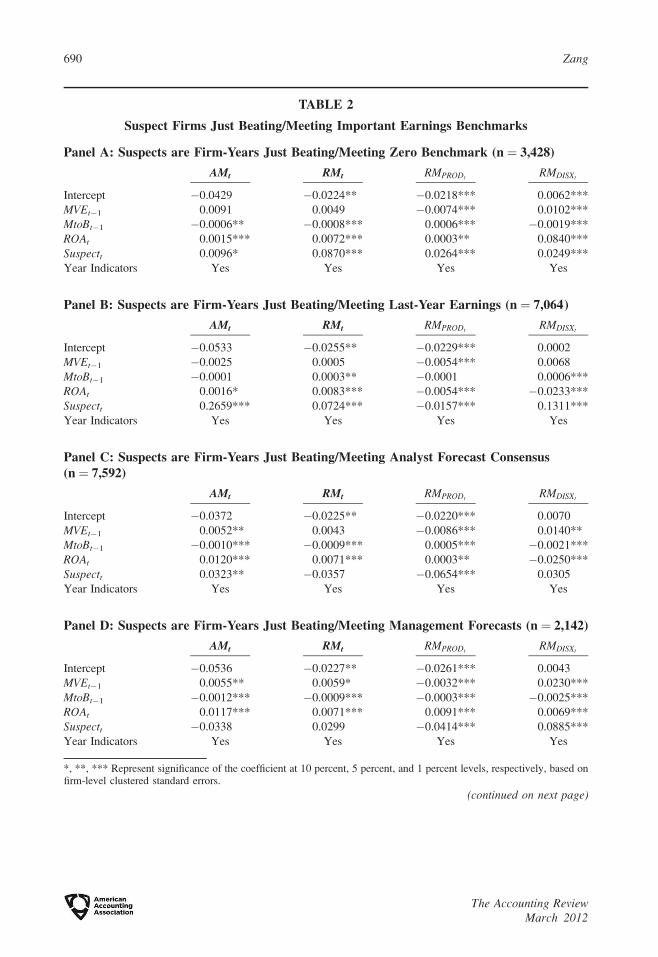
TABLE 2
Suspect Firms Just Beating/Meeting Important Earnings Benchmarks
Panel A: Suspects are Firm-Years Just Beating/Meeting Zero Benchmark (n ¼ 3,428)
AMt RMt RMPRODtRMDISXt
Intercept �0.0429 �0.0224** �0.0218*** 0.0062***
MVEt�1 0.0091 0.0049 �0.0074*** 0.0102***
MtoBt�1 �0.0006** �0.0008*** 0.0006*** �0.0019***
ROAt 0.0015*** 0.0072*** 0.0003** 0.0840***
Suspectt 0.0096* 0.0870*** 0.0264*** 0.0249***
Year Indicators Yes Yes Yes Yes
Panel B: Suspects are Firm-Years Just Beating/Meeting Last-Year Earnings (n ¼ 7,064)
AMt RMt RMPRODtRMDISXt
Intercept �0.0533 �0.0255** �0.0229*** 0.0002
MVEt�1 �0.0025 0.0005 �0.0054*** 0.0068
MtoBt�1 �0.0001 0.0003** �0.0001 0.0006***
ROAt 0.0016* 0.0083*** �0.0054*** �0.0233***
Suspectt 0.2659*** 0.0724*** �0.0157*** 0.1311***
Year Indicators Yes Yes Yes Yes
Panel C: Suspects are Firm-Years Just Beating/Meeting Analyst Forecast Consensus(n¼ 7,592)
AMt RMt RMPRODtRMDISXt
Intercept �0.0372 �0.0225** �0.0220*** 0.0070
MVEt�1 0.0052** 0.0043 �0.0086*** 0.0140**
MtoBt�1 �0.0010*** �0.0009*** 0.0005*** �0.0021***
ROAt 0.0120*** 0.0071*** 0.0003** �0.0250***
Suspectt 0.0323** �0.0357 �0.0654*** 0.0305
Year Indicators Yes Yes Yes Yes
Panel D: Suspects are Firm-Years Just Beating/Meeting Management Forecasts (n¼ 2,142)
AMt RMt RMPRODtRMDISXt
Intercept �0.0536 �0.0227** �0.0261*** 0.0043
MVEt�1 0.0055** 0.0059* �0.0032*** 0.0230***
MtoBt�1 �0.0012*** �0.0009*** �0.0003*** �0.0025***
ROAt 0.0117*** 0.0071*** 0.0091*** 0.0069***
Suspectt �0.0338 0.0299 �0.0414*** 0.0885***
Year Indicators Yes Yes Yes Yes
*, **, *** Represent significance of the coefficient at 10 percent, 5 percent, and 1 percent levels, respectively, based onfirm-level clustered standard errors.
(continued on next page)
690 Zang
The Accounting ReviewMarch 2012
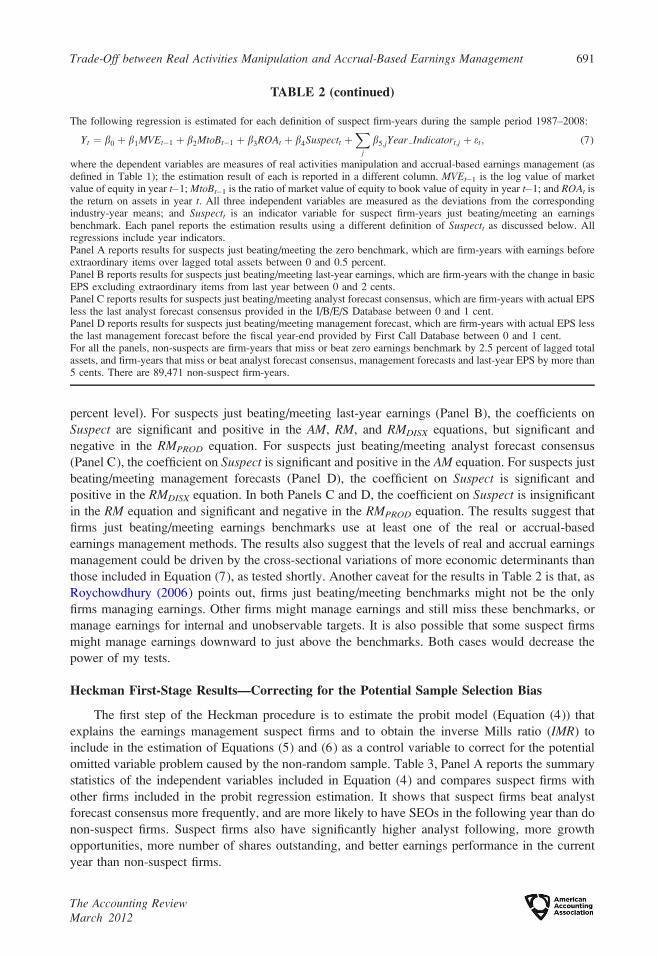
percent level). For suspects just beating/meeting last-year earnings (Panel B), the coefficients on
Suspect are significant and positive in the AM, RM, and RMDISX equations, but significant and
negative in the RMPROD equation. For suspects just beating/meeting analyst forecast consensus
(Panel C), the coefficient on Suspect is significant and positive in the AM equation. For suspects just
beating/meeting management forecasts (Panel D), the coefficient on Suspect is significant and
positive in the RMDISX equation. In both Panels C and D, the coefficient on Suspect is insignificant
in the RM equation and significant and negative in the RMPROD equation. The results suggest that
firms just beating/meeting earnings benchmarks use at least one of the real or accrual-based
earnings management methods. The results also suggest that the levels of real and accrual earnings
management could be driven by the cross-sectional variations of more economic determinants than
those included in Equation (7), as tested shortly. Another caveat for the results in Table 2 is that, as
Roychowdhury (2006) points out, firms just beating/meeting benchmarks might not be the only
firms managing earnings. Other firms might manage earnings and still miss these benchmarks, or
manage earnings for internal and unobservable targets. It is also possible that some suspect firms
might manage earnings downward to just above the benchmarks. Both cases would decrease the
power of my tests.
Heckman First-Stage Results—Correcting for the Potential Sample Selection Bias
The first step of the Heckman procedure is to estimate the probit model (Equation (4)) that
explains the earnings management suspect firms and to obtain the inverse Mills ratio (IMR) to
include in the estimation of Equations (5) and (6) as a control variable to correct for the potential
omitted variable problem caused by the non-random sample. Table 3, Panel A reports the summary
statistics of the independent variables included in Equation (4) and compares suspect firms with
other firms included in the probit regression estimation. It shows that suspect firms beat analyst
forecast consensus more frequently, and are more likely to have SEOs in the following year than do
non-suspect firms. Suspect firms also have significantly higher analyst following, more growth
opportunities, more number of shares outstanding, and better earnings performance in the current
year than non-suspect firms.
TABLE 2 (continued)
The following regression is estimated for each definition of suspect firm-years during the sample period 1987–2008:
Yt ¼ b0 þ b1MVEt�1 þ b2MtoBt�1 þ b3ROAt þ b4Suspectt þX
j
b5;jYear Indicatort;j þ et; (7)
where the dependent variables are measures of real activities manipulation and accrual-based earnings management (asdefined in Table 1); the estimation result of each is reported in a different column. MVEt�1 is the log value of marketvalue of equity in year t�1; MtoBt�1 is the ratio of market value of equity to book value of equity in year t�1; and ROAt isthe return on assets in year t. All three independent variables are measured as the deviations from the correspondingindustry-year means; and Suspectt is an indicator variable for suspect firm-years just beating/meeting an earningsbenchmark. Each panel reports the estimation results using a different definition of Suspectt as discussed below. Allregressions include year indicators.Panel A reports results for suspects just beating/meeting the zero benchmark, which are firm-years with earnings beforeextraordinary items over lagged total assets between 0 and 0.5 percent.Panel B reports results for suspects just beating/meeting last-year earnings, which are firm-years with the change in basicEPS excluding extraordinary items from last year between 0 and 2 cents.Panel C reports results for suspects just beating/meeting analyst forecast consensus, which are firm-years with actual EPSless the last analyst forecast consensus provided in the I/B/E/S Database between 0 and 1 cent.Panel D reports results for suspects just beating/meeting management forecast, which are firm-years with actual EPS lessthe last management forecast before the fiscal year-end provided by First Call Database between 0 and 1 cent.For all the panels, non-suspects are firm-years that miss or beat zero earnings benchmark by 2.5 percent of lagged totalassets, and firm-years that miss or beat analyst forecast consensus, management forecasts and last-year EPS by more than5 cents. There are 89,471 non-suspect firm-years.
Trade-Off between Real Activities Manipulation and Accrual-Based Earnings Management 691
The Accounting ReviewMarch 2012
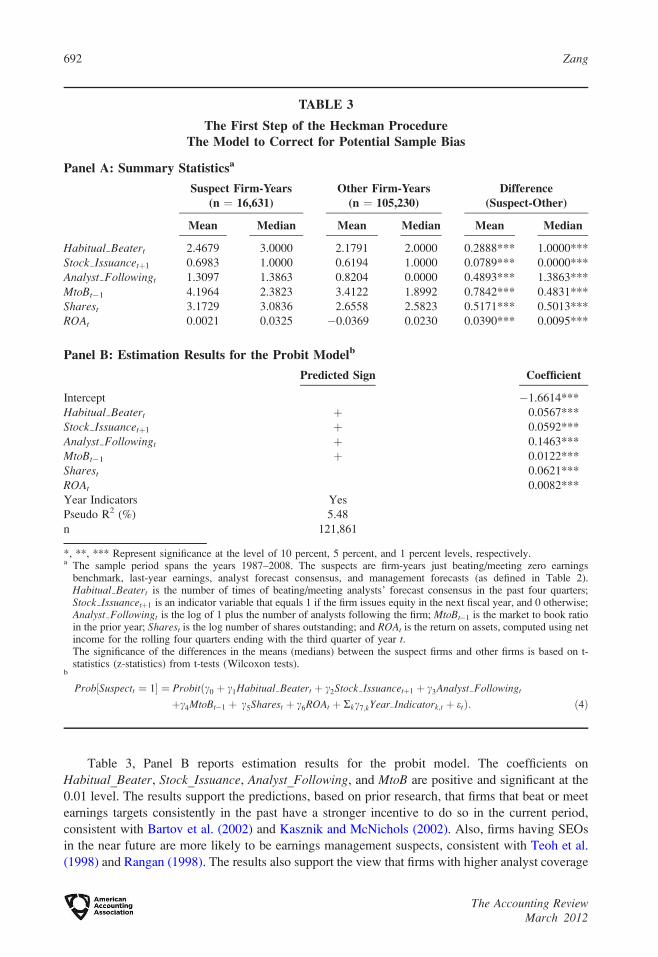
Table 3, Panel B reports estimation results for the probit model. The coefficients on
Habitual_Beater, Stock_Issuance, Analyst_Following, and MtoB are positive and significant at the
0.01 level. The results support the predictions, based on prior research, that firms that beat or meet
earnings targets consistently in the past have a stronger incentive to do so in the current period,
consistent with Bartov et al. (2002) and Kasznik and McNichols (2002). Also, firms having SEOs
in the near future are more likely to be earnings management suspects, consistent with Teoh et al.
(1998) and Rangan (1998). The results also support the view that firms with higher analyst coverage
TABLE 3
The First Step of the Heckman ProcedureThe Model to Correct for Potential Sample Bias
Panel A: Summary Statisticsa
Suspect Firm-Years(n ¼ 16,631)
Other Firm-Years(n ¼ 105,230)
Difference(Suspect-Other)
Mean Median Mean Median Mean Median
Habitual Beatert 2.4679 3.0000 2.1791 2.0000 0.2888*** 1.0000***
Stock Issuancetþ1 0.6983 1.0000 0.6194 1.0000 0.0789*** 0.0000***
Analyst Followingt 1.3097 1.3863 0.8204 0.0000 0.4893*** 1.3863***
MtoBt�1 4.1964 2.3823 3.4122 1.8992 0.7842*** 0.4831***
Sharest 3.1729 3.0836 2.6558 2.5823 0.5171*** 0.5013***
ROAt 0.0021 0.0325 �0.0369 0.0230 0.0390*** 0.0095***
Panel B: Estimation Results for the Probit Modelb
Predicted Sign Coefficient
Intercept �1.6614***
Habitual Beatert þ 0.0567***
Stock Issuancetþ1 þ 0.0592***
Analyst Followingt þ 0.1463***
MtoBt�1 þ 0.0122***
Sharest 0.0621***
ROAt 0.0082***
Year Indicators Yes
Pseudo R2 (%) 5.48
n 121,861
*, **, *** Represent significance at the level of 10 percent, 5 percent, and 1 percent levels, respectively.a The sample period spans the years 1987–2008. The suspects are firm-years just beating/meeting zero earnings
benchmark, last-year earnings, analyst forecast consensus, and management forecasts (as defined in Table 2).Habitual Beatert is the number of times of beating/meeting analysts’ forecast consensus in the past four quarters;Stock Issuancetþ1 is an indicator variable that equals 1 if the firm issues equity in the next fiscal year, and 0 otherwise;Analyst Followingt is the log of 1 plus the number of analysts following the firm; MtoBt�1 is the market to book ratioin the prior year; Sharest is the log number of shares outstanding; and ROAt is the return on assets, computed using netincome for the rolling four quarters ending with the third quarter of year t.The significance of the differences in the means (medians) between the suspect firms and other firms is based on t-statistics (z-statistics) from t-tests (Wilcoxon tests).
b
Prob½Suspectt ¼ 1� ¼ Probitðc0 þ c1Habitual Beatert þ c2Stock Issuancetþ1 þ c3Analyst Followingt
þc4MtoBt�1 þ c5Sharest þ c6ROAt þ Rkc7;kYear Indicatork;t þ etÞ: ð4Þ
692 Zang
The Accounting ReviewMarch 2012
are under more pressure to beat/meet earnings targets. Finally, firms with more growth
opportunities are more likely to beat/meet the earnings benchmarks, consistent with Barth et al.
(1999) and Skinner and Sloan (2002). Overall, the results suggest that capital market incentives are
important factors in predicting earnings management suspects.
Heckman Second-Stage Results—The Trade-Off between Real Activities Manipulation andAccrual-Based Earnings Management
Table 4 reports the descriptive statistics of the variables in the main tests of the trade-off
between real activities manipulation and accrual-based earnings management. Among the 16,631
suspects identified during the sample period 1987–2008 (as reported in Table 3), 13,753 have
measures of real and accrual-based earnings management available. The sample size reduces to
9,826 due to the data requirements of the variables calculated using Compustat data (i.e.,
Market_Share, ZSCORE, Big8, Audit_Tenure, NOA, and Cycle). Finally, the availability of
marginal tax rate (MTR) decreases the suspect sample to 6,680 firm-year observations. The data
requirements are likely to bias the sample toward larger firms. All of the non-indicator variables are
winsorized at the top and bottom 1 percent to eliminate extreme observations. As shown in Panel A,
suspects have 3.78 percent of the market share in their industries on average. They have a ZSCOREof 2.750 at the 25th percentile, which is above the 2.675 cutoff point for financially distressed firms
according to Altman (2000). This suggests that the majority of the sample firms are financially
healthy. On average, they have an institutional ownership of 44.7 percent. Their average marginal
tax rate is 30.3 percent, consistent with most being profitable. The mean value of Big8 shows that
93.7 percent of the sample firms are audited by one of the Big 8. In terms of auditor tenure, 55.9
percent of the sample firms have had a relationship with the same auditors for more than six years.
The post-SOX period accounts for 14.3 percent of the observations. The mean value of NOA is 51.7
percent, suggesting that around half of the sample firms have net operating assets above their
corresponding industry-year median. The suspects on average have an operating cycle of 141.8
days, ROA of 4.44 percent, and market-to-book ratio of 3.58. The majority of the sample have
industry-adjusted log value of assets (Assets) greater than 0, indicating that they are larger than the
corresponding industry-year average.
Table 4, Panel B reports the Pearson and Spearman correlations among the variables in the
main tests. There is a significant and positive correlation between RMPROD and RMDISX (Pearson
correlation of 0.19), suggesting that firms use both types of real activities manipulation at the same
time. Other high and significant correlations include the one between INST and Assets (Pearson
correlation of 0.57), consistent with prior research that shows institutional ownership increases with
firm size (e.g., O’Brien and Bhushan 1990). MTR is positively correlated with ROA (Pearson
correlation of 0.58), consistent with profitable firms having higher marginal tax rates. There is also a
high correlation between Market_Share and Assets (Pearson correlation of 0.43), as larger firms are
likely to enjoy larger market shares in their industries.
Table 5 presents the results of the trade-off between real activities manipulation and accrual-
based earnings management (i.e., Equations (5) and (6)). The estimation of the two equations is the
second step of the Heckman procedure; it contains only the suspect firms and includes the inverse
Mills ratio from the first stage to correct for potential sample selection bias. I use Rogers standard
errors to adjust for heteroscedasticity and possible correlation among the residuals within firm
clusters in estimating Equations (5) and (6) (Petersen 2009; Gow et al. 2010). The reported results
use RM, the sum of RMPROD and RMDISX, as the measure for real activities manipulation.21
21 When RMPROD and RMDISX are used as proxies for real activities manipulation, the results (untabulated) aresimilar to those reported in Table 5.
Trade-Off between Real Activities Manipulation and Accrual-Based Earnings Management 693
The Accounting ReviewMarch 2012
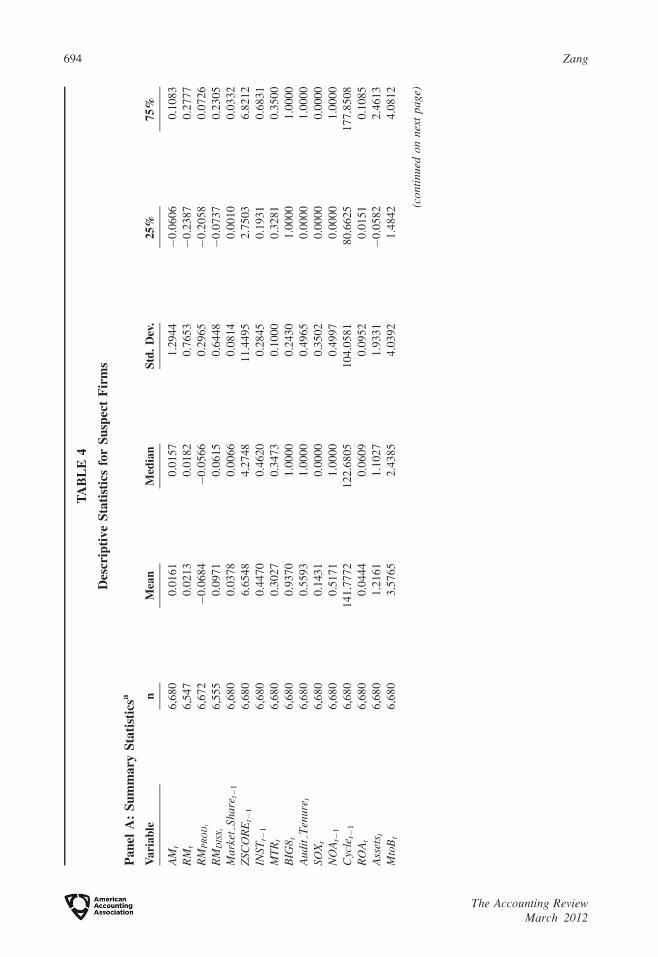
TA
BL
E4
Des
crip
tiv
eS
tati
stic
sfo
rS
usp
ect
Fir
ms
Pa
nel
A:
Su
mm
ary
Sta
tist
icsa
Va
ria
ble
nM
ean
Med
ian
Std
.D
ev.
25
%7
5%
AM
t6
,68
00
.01
61
0.0
15
71
.29
44
�0
.06
06
0.1
08
3
RM
t6
,54
70
.02
13
0.0
18
20
.76
53
�0
.23
87
0.2
77
7
RM
PR
OD
t6
,67
2�
0.0
68
4�
0.0
56
60
.29
65
�0
.20
58
0.0
72
6
RM
DIS
Xt
6,5
55
0.0
97
10
.06
15
0.6
44
8�
0.0
73
70
.23
05
Mar
ket
Shar
e t�
16
,68
00
.03
78
0.0
06
60
.08
14
0.0
01
00
.03
32
ZSC
OR
Et�
16
,68
06
.65
48
4.2
74
81
1.4
49
52
.75
03
6.8
21
2
INST
t�1
6,6
80
0.4
47
00
.46
20
0.2
84
50
.19
31
0.6
83
1
MT
Rt
6,6
80
0.3
02
70
.34
73
0.1
00
00
.32
81
0.3
50
0
BIG
8 t6
,68
00
.93
70
1.0
00
00
.24
30
1.0
00
01
.00
00
Aud
itT
enur
e t6
,68
00
.55
93
1.0
00
00
.49
65
0.0
00
01
.00
00
SOX
t6
,68
00
.14
31
0.0
00
00
.35
02
0.0
00
00
.00
00
NO
At�
16
,68
00
.51
71
1.0
00
00
.49
97
0.0
00
01
.00
00
Cyc
let�
16
,68
01
41
.77
72
12
2.6
80
51
04
.05
81
80
.66
25
17
7.8
50
8
RO
At
6,6
80
0.0
44
40
.06
09
0.0
95
20
.01
51
0.1
08
5
Ass
ets t
6,6
80
1.2
16
11
.10
27
1.9
33
1�
0.0
58
22
.46
13
Mto
Bt
6,6
80
3.5
76
52
.43
85
4.0
39
21
.48
42
4.0
81
2
(con
tinu
edo
nn
ext
pa
ge)
694 Zang
The Accounting ReviewMarch 2012
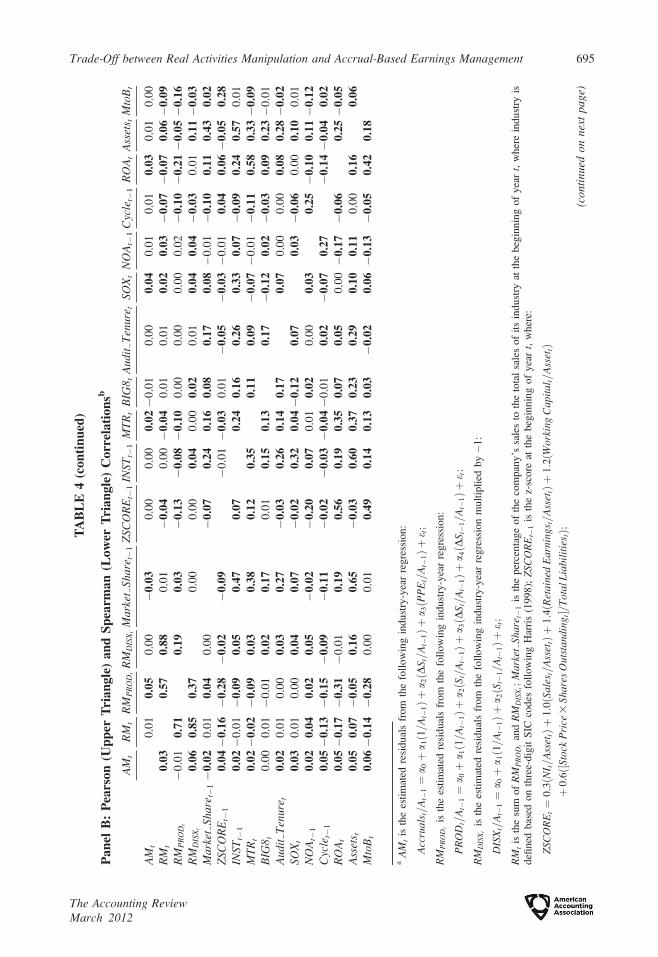
TA
BL
E4
(co
nti
nu
ed)
Pa
nel
B:
Pea
rso
n(U
pp
erT
ria
ng
le)
an
dS
pea
rma
n(L
ow
erT
ria
ng
le)
Co
rrel
ati
on
sb
AM
tR
Mt
RM
PR
OD
tR
MD
ISX
tM
arke
tSh
are t�
1Z
SCO
RE
t�1
INST
t�1
MT
Rt
BIG
8 tA
udit
Ten
ure t
SOX
tN
OA
t�1
Cyc
let�
1R
OA
tA
sset
s tM
toB
t
AM
t0
.01
0.0
50
.00
�0
.03
0.0
00
.00
0.0
2�
0.0
10
.00
0.0
40
.01
0.0
10
.03
0.0
10
.00
RM
t0
.03
0.5
70
.88
0.0
1�
0.0
40
.00�
0.0
40
.01
0.0
10
.02
0.0
3�
0.0
7�
0.0
70
.06�
0.0
9R
MP
RO
Dt
�0
.01
0.7
10
.19
0.0
3�
0.1
3�
0.0
8�
0.1
00
.00
0.0
00
.00
0.0
2�
0.1
0�
0.2
1�
0.0
5�
0.1
6R
MD
ISX
t0
.06
0.8
50
.37
0.0
00
.00
0.0
40
.00
0.0
20
.01
0.0
40
.04�
0.0
30
.01
0.1
1�
0.0
3M
arke
tSh
are t�
1�
0.0
20
.01
0.0
40
.00
�0
.07
0.2
40
.16
0.0
80
.17
0.0
8�
0.0
1�
0.1
00
.11
0.4
30
.02
ZSC
OR
Et�
10
.04�
0.1
6�
0.2
8�
0.0
2�
0.0
9�
0.0
1�
0.0
30
.01
�0
.05
�0
.03�
0.0
10
.04
0.0
6�
0.0
50
.28
INST
t�1
0.0
2�
0.0
1�
0.0
90
.05
0.4
70
.07
0.2
40
.16
0.2
60
.33
0.0
7�
0.0
90
.24
0.5
70
.01
MT
Rt
0.0
2�
0.0
2�
0.0
90
.03
0.3
80
.12
0.3
50
.11
0.0
9�
0.0
7�
0.0
1�
0.1
10
.58
0.3
3�
0.0
9B
IG8 t
0.0
00
.01�
0.0
10
.02
0.1
70
.01
0.1
50
.13
0.1
7�
0.1
20
.02�
0.0
30
.09
0.2
3�
0.0
1
Aud
itT
enur
e t0
.02
0.0
10
.00
0.0
30
.27
�0
.03
0.2
60
.14
0.1
70
.07
0.0
00
.00
0.0
80
.28�
0.0
2SO
Xt
0.0
30
.01
0.0
00
.04
0.0
7�
0.0
20
.32
0.0
4�
0.1
20
.07
0.0
3�
0.0
60
.00
0.1
00
.01
NO
At�
10
.02
0.0
40
.02
0.0
5�
0.0
2�
0.2
00
.07
0.0
10
.02
0.0
00
.03
0.2
5�
0.1
00
.11�
0.1
2C
ycle
t�1
0.0
5�
0.1
3�
0.1
5�
0.0
9�
0.1
1�
0.0
2�
0.0
3�
0.0
4�
0.0
10
.02
�0
.07
0.2
7�
0.1
4�
0.0
40
.02
RO
At
0.0
5�
0.1
7�
0.3
1�
0.0
10
.19
0.5
60
.19
0.3
50
.07
0.0
50
.00�
0.1
7�
0.0
60
.25�
0.0
5A
sset
s t0
.05
0.0
7�
0.0
50
.16
0.6
5�
0.0
30
.60
0.3
70
.23
0.2
90
.10
0.1
10
.00
0.1
60
.06
Mto
Bt
0.0
6�
0.1
4�
0.2
80
.00
0.0
10
.49
0.1
40
.13
0.0
3�
0.0
20
.06�
0.1
3�
0.0
50
.42
0.1
8
aA
Mt
isth
ees
tim
ated
resi
dual
sfr
om
the
foll
ow
ing
indust
ry-y
ear
regre
ssio
n:
Acc
rual
s t=A
t�1¼
a 0þ
a 1ð1=A
t�1Þþ
a 2ðD
S t=A
t�1Þþ
a 3ðP
PE
t=A
t�1Þþ
e t;
RM
PR
OD
tis
the
esti
mat
edre
sidual
sfr
om
the
foll
ow
ing
indust
ry-y
ear
regre
ssio
n:
PR
OD
t=A
t�1¼
a 0þ
a 1ð1=A
t�1Þþ
a 2ðS
t=A
t�1Þþ
a 3ðD
St=
At�
1Þþ
a 4ðD
S t�
1=A
t�1Þþ
e t;
RM
DIS
Xt
isth
ees
tim
ated
resi
dual
sfr
om
the
foll
ow
ing
indust
ry-y
ear
regre
ssio
nm
ult
ipli
edby�
1:
DIS
Xt=
At�
1¼
a 0þ
a 1ð1=
At�
1Þþ
a 2ðS
t�1=A
t�1Þþ
e t;
RM
tis
the
sum
of
RM
PR
OD
tan
dR
MD
ISX
t;
Mar
ket
Shar
e t�
1is
the
per
centa
ge
of
the
com
pan
y’s
sale
sto
the
tota
lsa
les
of
its
indust
ryat
the
beg
innin
gof
yea
rt,
wher
ein
dust
ryis
defi
ned
bas
edon
thre
e-dig
itS
ICco
des
foll
ow
ing
Har
ris
(1998);
ZSC
OR
Et�
1is
the
z-sc
ore
atth
ebeg
innin
gof
yea
rt,
wher
e:
ZSC
OR
Et¼
0:3ðN
I t=A
sset
tÞþ
1:0ðS
ales
t=A
sset
tÞþ
1:4ðR
etai
ned
Ear
ning
s t=
Ass
ettÞþ
1:2ðW
orki
ngC
apit
alt=
Ass
ettÞ
þ0:6ð½S
tock
Pri
ce3
Shar
esO
utst
andi
ngt�=
Tot
alL
iabi
liti
estÞ;
(con
tinu
edo
nn
ext
pa
ge)
Trade-Off between Real Activities Manipulation and Accrual-Based Earnings Management 695
The Accounting ReviewMarch 2012
TA
BL
E4
(co
nti
nu
ed)
INST
t�1
is
the
per
centa
ge
of
inst
ituti
onal
ow
ner
ship
at
the
beg
innin
g o
f yea
r t;
MT
Rt
is t
he
mar
gin
al t
ax r
ates
dev
eloped
and p
rovid
ed b
y P
rofe
ssor
John G
raham
(htt
p:/
/fa
cult
y.f
uqua.
duke.
edu/ ;
jgra
ham
/);
BIG
8tis
anin
dic
ator
var
iable
that
equal
s1
ifth
efi
rm’s
audit
or
isone
of
the
Big
8,
and
0oth
erw
ise;
Audit
Ten
ure
tis
anin
dic
ator
var
iable
that
equal
s1
ifth
enum
ber
of
yea
rsth
eau
dit
or
has
audit
edth
ecl
ient
isab
ove
the
sam
ple
med
ian
of
six
yea
rs,
and
0oth
erw
ise;
SO
Xtis
anin
dic
ator
var
iable
that
equal
s1
ifth
efi
scal
yea
ris
afte
r2003,
and
0oth
erw
ise;
NO
At�
1is
anin
dic
ator
var
iable
that
equal
s1
ifth
enet
oper
atin
gas
sets
(i.e
.,sh
areh
old
ers’
equit
yle
ssca
shan
dm
arket
able
secu
riti
esan
dplu
sto
tal
deb
t)at
the
beg
innin
gof
the
yea
rdiv
ided
by
lagged
sale
sis
above
the
med
ian
of
the
corr
espondin
gin
dust
ry-y
ear,
and
0oth
erw
ise;
Cyc
let�
1is
the
day
sre
ceiv
able
plu
sth
eday
sin
ven
tory
less
the
day
spay
able
atth
ebeg
innin
gof
the
yea
r;R
OA
tis
the
retu
rnon
asse
ts,
com
pute
dusi
ng
net
inco
me
for
the
roll
ing
four
quar
ters
endin
gw
ith
the
thir
dquar
ter
of
yea
rt;
Ass
ets t
isth
ein
dust
ry-a
dju
sted
log
val
ue
of
tota
las
sets
;an
dM
toB
tis
the
mar
ket
-to-b
ook
rati
o.
bB
old
edco
effi
cien
tsar
est
atis
tica
lly
signifi
cant
atth
e0.1
level
.
696 Zang
The Accounting ReviewMarch 2012
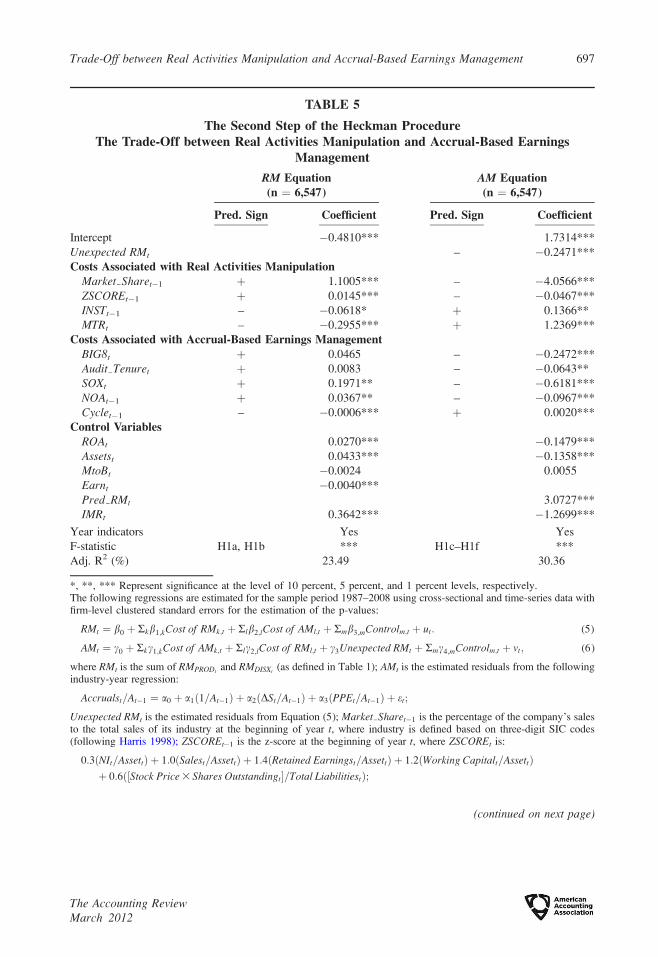
TABLE 5
The Second Step of the Heckman ProcedureThe Trade-Off between Real Activities Manipulation and Accrual-Based Earnings
Management
RM Equation(n ¼ 6,547)
AM Equation(n ¼ 6,547)
Pred. Sign Coefficient Pred. Sign Coefficient
Intercept �0.4810*** 1.7314***
Unexpected RMt – �0.2471***
Costs Associated with Real Activities ManipulationMarket Sharet�1 þ 1.1005*** – �4.0566***
ZSCOREt�1 þ 0.0145*** – �0.0467***
INSTt�1 – �0.0618* þ 0.1366**
MTRt – �0.2955*** þ 1.2369***
Costs Associated with Accrual-Based Earnings ManagementBIG8t þ 0.0465 – �0.2472***
Audit Tenuret þ 0.0083 – �0.0643**
SOXt þ 0.1971** – �0.6181***
NOAt�1 þ 0.0367** – �0.0967***
Cyclet�1 – �0.0006*** þ 0.0020***
Control VariablesROAt 0.0270*** �0.1479***
Assetst 0.0433*** �0.1358***
MtoBt �0.0024 0.0055
Earnt �0.0040***
Pred RMt 3.0727***
IMRt 0.3642*** �1.2699***
Year indicators Yes Yes
F-statistic H1a, H1b *** H1c–H1f ***
Adj. R2 (%) 23.49 30.36
*, **, *** Represent significance at the level of 10 percent, 5 percent, and 1 percent levels, respectively.The following regressions are estimated for the sample period 1987–2008 using cross-sectional and time-series data withfirm-level clustered standard errors for the estimation of the p-values:
RMt ¼ b0 þ Rkb1;kCost of RMk;t þ Rlb2;lCost of AMl;t þ Rmb3;mControlm;t þ ut: (5)
AMt ¼ c0 þ Rkc1;kCost of AMk;t þ Rlc2;lCost of RMl;t þ c3Unexpected RMt þ Rmc4;mControlm;t þ vt; (6)
where RMt is the sum of RMPRODtand RMDISXt
(as defined in Table 1); AMt is the estimated residuals from the followingindustry-year regression:
Accrualst=At�1 ¼ a0 þ a1ð1=At�1Þ þ a2ðDSt=At�1Þ þ a3ðPPEt=At�1Þ þ et;
Unexpected RMt is the estimated residuals from Equation (5); Market Sharet�1 is the percentage of the company’s salesto the total sales of its industry at the beginning of year t, where industry is defined based on three-digit SIC codes(following Harris 1998); ZSCOREt�1 is the z-score at the beginning of year t, where ZSCOREt is:
0:3ðNIt=AssettÞ þ 1:0ðSalest=AssettÞ þ 1:4ðRetained Earningst=AssettÞ þ 1:2ðWorking Capitalt=AssettÞþ 0:6ð½Stock Price 3 Shares Outstandingt�=Total LiabilitiestÞ;
(continued on next page)
Trade-Off between Real Activities Manipulation and Accrual-Based Earnings Management 697
The Accounting ReviewMarch 2012
Although not directly hypothesized, both RM and AM are expected to be negatively related with
their own cost determinants. The results are consistent with this expectation. In the RM equation,
the coefficients on Market_Share and ZSCORE are positive and significant at the 0.01 level,
indicating that firms enjoying larger market shares and better financial health engage in higher
levels of real activities manipulation. This finding is consistent with managers in these firms
perceiving themselves as having more flexibility to deviate from optimal business decisions due to
their competitive advantage in the industry or their healthy financial condition. The coefficient on
INST is negative, as predicted (significant at the 0.1 level), indicating that institutional investors
exert more pressure on firms to constrain real activities manipulation than accrual-based earnings
management. The coefficient on MTR is negative and significant at the 0.01 level, consistent with
firms with higher marginal tax rates finding real activities manipulation more costly.
For the AM equation, the results show that all of the costs associated with accrual-based
earnings management have significant coefficients (at least at the 0.05 level) with the predicted
signs. The coefficients on Big8 and Audit_Tenure are negative, indicating that audit firms with a
higher reputation, and auditors with longer tenure, are more likely to constrain firms’ attempts to
manage earnings with accrual accounts. The coefficient on SOX is negative, suggesting that accrual-
based earnings management decreases in the post-SOX period, probably due to heightened
regulatory scrutiny (Cohen et al. 2008). The negative coefficient on NOA and the positive
coefficient on Cycle indicate that accrual-based earnings management is constrained by firms’
accounting flexibility; that is, firms with a bloated balance sheet due to accrual manipulation in prior
years and firms with shorter operating cycles have less accounting flexibility to inflate accruals and
incur higher costs in doing so.
H1 predicts that the trade-off between real activities manipulation and accrual-based earnings
management is based on the relative costliness of the two activities. Specifically, H1a and H1b
predict that firms with higher costs associated with accrual-based earnings management will make
more use of real activities manipulation. Consistent with H1a, in the RM equation, the coefficient on
SOX is positive and significant at the 0.05 level, suggesting that real activities manipulation
increases due to the higher level of scrutiny of accounting practice after the passage of SOX.
Consistent with H1b, the positive coefficient on NOA (significant at the 0.05 level) and the negative
coefficient on Cycle (significant at the 0.01 level) indicate that firms with less accounting flexibility
due to accrual manipulation in prior years or shorter operating cycles use real activities
manipulation more. The results do not indicate that real activities manipulation increases with Big8
TABLE 5 (continued)
INSTt�1 is the percentage of institutional ownership at the beginning of year t; MTRt is the marginal tax rate, developedand provided by Professor John Graham (http://faculty.fuqua.duke.edu/;jgraham/); BIG8t is an indicator variable thatequals 1 if the firm’s auditor is one of the Big 8, and 0 otherwise; Audit Tenuret is an indicator variable that equals 1 ifthe number of years the auditor has audited the client is above the sample median of six years, and 0 otherwise; SOXt isan indicator variable that equals 1 if the fiscal year is after 2003, and 0 otherwise; NOAt�1 is an indicator variable thatequals 1 if the net operating assets (i.e., shareholders’ equity less cash and marketable securities and plus total debt) at thebeginning of the year divided by lagged sales is above the median of the corresponding industry-year, and 0 otherwise;Cyclet�1 is the days receivable plus the days inventory less the days payable at the beginning of the year; ROAt is thereturn on assets, computed using net income for the rolling four quarters ending with the third quarter of year t; Assetst isthe industry-adjusted log value of total assets; MtoBt is the market-to-book ratio; Earnt is the earnings beforeextraordinary items minus discretionary accruals and production costs, plus discretionary expenditures; PredRMt
is thepredicted values of Equation (5); and IMRt is the estimated as u(z)/U(z), where z is the fitted value of the following probitregression index function, u is the density function for standard normal distribution, and U is the cumulative densityfunction for standard normal distribution:
Prob½Suspectt ¼ 1� ¼ Probitðc0 þ c1Habitual Beatert þ c2Stock Issuancetþ1 þ c3Analyst Followingt þ c4MtoBt�1
þc5Sharest þ c6ROAt þ Rkc7;kYear Indicatork;t þ etÞ:
698 Zang
The Accounting ReviewMarch 2012
and Audit_Tenure. The insignificant coefficient on Big8 could be due to the fact that 93.7 percent of
the sample firms use the Big 8. The insignificant result for Audit_Tenure could be because auditor
independence reduces with tenure, as suggested by Beck et al. (1988) and Lys and Watts (1994). A
partial F-test of H1a and H1b yields the result that the costs associated with accrual-based earnings
management are significant (at the level of 0.01) in explaining the level of real activities
manipulation.
H1c to H1f predict that firms use relatively more accrual-based earnings management when the
costs associated with real activities manipulation are higher. In the AM equation, the coefficients on
the four costs associated with real activities manipulation have the predicted signs and are
significant at least at the level of 0.05. The negative coefficients on Market_Share and ZSCOREsuggest that firms with a leader status in the industry and with a healthy financial condition have
more flexibility for real activities manipulation and, thus, use accrual-based earnings management
less. The positive coefficient on INST is consistent with institutional investors imposing more
constraint and scrutiny over real activities manipulation than accrual-based earnings management,
probably due to the longer-term real consequences of the former on firm values. Hence, firms with
higher institutional ownership use the latter strategy more. Finally, MTR has a positive coefficient,
also consistent with the prediction that when real activities manipulation becomes more costly
because of the greater current-period tax consequences, firms switch to using accrual-based
earnings management. The partial F-test of H1c to H1f also confirms that the costs of real activities
manipulation explain the level of accrual-based earnings management (F-statistic significant at the
0.01 level).
H2 predicts a direct substitutive relation between real and accrual-based earnings management.
This can be observed if managers use less (more) accrual-based earnings management if the real
activities manipulation during the year turns out to be unexpectedly high (low), which implies a
negative relation between accrual-based earnings management and the unexpected amount of real
activities manipulation realized. Consistent with H2, in the AM equation, the coefficient on
Unexpected RM is negative and significant at the 0.01 level. The result for H2, combined with the
results for H1, suggests sequential decisions are being made about the use of the two approaches.
That is, managers determine the level of real activities manipulation based on the cost factors
observable before the fiscal year-end, and adjust the level of accrual-based earnings management
after the fiscal year-end based on the realized level of real activities manipulation.
Finally, Table 5 shows that the coefficients on IMR in the RM and AM equations are significant
at the 0.01 level, confirming the importance of correcting for sample selection bias. The coefficient
on the control variable, Pred_RM, is positive and significant at the 0.01 level, consistent with the
positive correlation between the two activities due to the cross-sectional variation in the total
amount of desired earnings management activities.
In summary, using a sample of earnings management suspects, I find results consistent with
managers trading off the two earnings management strategies in two ways. First, they tradeoff the
two strategies based on the relative costs to their firms. If firms operate in an environment where
real activities manipulation is constrained due to their less-competitive status in the industry, less-
healthy financial condition, higher level of scrutiny from institutional investors, and higher marginal
tax rates, then they will use accrual-based earnings management more and real activities
manipulation less. If firms’ accounting practice is constrained due to heightened regulatory scrutiny,
prior periods’ accrual manipulation, and shorter operating cycles, then the converse will be true.
Second, managers substitute the two strategies directly. The amount of accrual-based earnings
management decreases (increases) when the outcome of real activities manipulation turns out to be
too high (low), supporting the hypothesis that managers adjust the level of accrual-based earnings
management based on the real activities manipulation realized at the fiscal year-end.
Trade-Off between Real Activities Manipulation and Accrual-Based Earnings Management 699
The Accounting ReviewMarch 2012
An Additional Test for the Sequence of the Decisions
The main tests assume that managers can adjust accrual-based earnings management after real
activities manipulation is realized by the fiscal year-end. This assumption is made based on the
different nature of the two strategies. Real activities manipulation changes the execution of a
transaction that takes place during the fiscal year, whereas accrual-based earnings management
changes the presentation of a given transaction in the financial statements, which can be done after
the fiscal year-end.
An alternative assumption is that managers determine the levels of the two earnings
management strategies simultaneously during the fiscal year and do not adjust accrual accounts
after the fiscal year-end. Several prior studies implicitly use this assumption and model multiple
earnings management strategies with simultaneous equation systems (Beatty et al. 1995; Hunt et al.
1996; Gaver and Paterson 1999; Barton 2001; Pincus and Rajgopal 2002). To test whether this
assumption can be applied to managers’ trade-off decisions, I conduct the Hausman test (Hausman
1978) to examine whether the levels of the two earnings management activities behave as
endogenous variables that are simultaneously determined. Specifically, in the first stage, I regress
AM and RM on the exogenous variables (i.e., the costs associated with the two earnings
management approaches and the control variables) in the equation system and obtain instruments
for AM and RM as the predicted values from the first-stage regressions. In the second stage, I
regress AM on the exogenous variables, the instrument of RM and RM itself. If RM is determined
before AM, then it should be exogenous in the AM equation. The untabulated result shows that the
coefficient on the instrument of RM is not significantly different from zero, which means that the
Hausman test fails to reject the exogeneity of RM in the AM equation. In contrast, the Hausman test
rejects the exogeneity of AM in the RM equations. Specifically, when regressing RM on the
exogenous variables, the instrument of AM and AM itself, the coefficient on the instrument of AM is
significant, suggesting that AM is correlated with RM equation’s error term. This finding is
consistent with AM being determined partially by the level of realized real activities manipulation.
In summary, the results from the Hausman test are consistent with that RM and AM are determined
sequentially, with RM preceding AM.
VI. CONCLUSIONS
This study provides large-sample evidence for how managers trade off real activities
manipulation and accrual-based earnings management over the period 1987–2008. The real
activities manipulation I examine includes overproducing inventory and cutting discretionary
expenditures (including R&D, advertising, and SG&A expenditures). I use the cross-sectional
models developed by Roychowdhury (2006) to estimate the abnormal levels of real transactions as
the proxies for real activities manipulation.
I contribute to the earnings management literature by showing that managers’ trade-off
decisions are influenced by the costs and timing of earnings management activities. First, the results
are consistent with managers trading off earnings management methods based on their relative
costliness. I find that, when accrual-based earnings management is constrained due to a higher level
of scrutiny of accounting practice post-SOX, and limited accounting flexibility because of accrual
manipulation in prior years and shorter operating cycles, firms use real activities manipulation
(accrual-based earnings management) to a greater (lesser) extent. The results also indicate that firms
use more accrual-based earnings management and less real activities manipulation when the latter is
more costly for them, due to having a less competitive status in the industry, being in a less healthy
financial condition, experiencing higher levels of monitoring from institutional investors, and
incurring greater tax expenses in the current period. Second, the results indicate a direct substitutive
relation between real activities manipulation and accrual-based earnings management; the level of
700 Zang
The Accounting ReviewMarch 2012
the latter is negatively related to the unexpected amount of the former realized at the fiscal year-end.
This suggests that, after the fiscal year-end, managers fine-tune their accrual accounts based on the
outcomes of real activities manipulation, consistent with the sequential nature of the two activities.
Additional Hausman tests also show results consistent with the sequential decisions.
My finding that managers treat real activities manipulation and accrual-based earnings
management as substitutes has implications for both researchers and regulators. For researchers, this
substitutive relation suggests that focusing on accrual manipulation exclusively does not fully
explain earnings management activities. For regulators, it implies that increasing scrutiny or
constraints over accounting discretion does not eliminate earnings management activities
altogether, but only changes managers’ preference for different earnings management strategies,
some of which (such as real activities manipulation) can be more costly for investors.
REFERENCES
Altman, E. 1968. Financial ratios, discriminate analysis and the prediction of corporate bankruptcy. Journalof Finance 23 (4): 589–609.
Altman, E. 2000. Predicting Financial Distress of Companies: Revisiting the Z-Score and ZETA Models.
Working paper, New York University.
Baber, W., P. Fairfield, and J. Haggard. 1991. The effect of concern about reported income on discretionary
spending decisions: The case of research and development. The Accounting Review 66 (4): 818–829.
Badertscher, B. 2011. Overvaluation and the choice of alternative earnings management mechanisms. TheAccounting Review 86 (September): 1491–1518.
Barth, M. E., J. A. Elliot, and M. W. Finn. 1999. Market rewards associated with patterns of increasing
earnings. Journal of Accounting Research 37 (2): 387–413.
Barton, J. 2001. Does the use of financial derivatives affect earnings management decisions? TheAccounting Review 76 (1): 1–26.
Barton, J., and P. Simko. 2002. The balance sheet as an earnings management constraint. The AccountingReview 77 (Supplement): 1–27.
Bartov, E. 1993. The timing of asset sales and earnings manipulation. The Accounting Review 68 (4): 840–
855.
Bartov, E., D. Givoly, and C. Hayn. 2002. The rewards to meeting or beating earnings expectations. Journalof Accounting and Economics 33 (2): 173–204.
Beatty, A., S. Chamberlain, and J. Magliolo. 1995. Managing financial reports of commercial banks: The
influence of taxes regulatory capital, and earnings. Journal of Accounting Research 33 (2): 231–261.
Beck, P., T. Frecka, and I. Solomon. 1988. An empirical analysis of the relationship between MAS
involvement and auditor tenure: Implications for auditor independence. Journal of AccountingLiterature 7: 65–84.
Becker, C., M. DeFond, J. Jiambalvo, and K. Subramanyam. 1998. The effect of audit quality on earnings
management. Contemporary Accounting Research 15 (1): 1–24.
Bhojraj, S., P. Hribar, M. Picconi, and J. McInnis. 2009. Making sense of cents: An examination of firms
that marginally miss or beat analyst forecasts. The Journal of Finance 64 (5): 2359–2386.
Burgstahler, D., and I. Dichev. 1997. Earnings management to avoid earnings decreases and losses. Journalof Accounting and Economics 24 (1): 99–126.
Bushee, B. 1998. The influence of institutional investors on myopic R&D investment behavior. TheAccounting Review 73 (3): 305–333.
Bushee, B. 2001. Do institutional investors prefer near-term earnings over long-run value? ContemporaryAccounting Research 18 (2): 207–246.
Cheng, Q., and T. D. Warfield. 2005. Equity incentives and earnings management. The Accounting Review80 (2): 441–476.
Cheng, S. 2004. R&D expenditures and CEO compensation. The Accounting Review 79 (2): 305–328.
Trade-Off between Real Activities Manipulation and Accrual-Based Earnings Management 701
The Accounting ReviewMarch 2012
Cohen, D., A. Dey, and T. Lys. 2008. Real and accrual-based earnings management in the pre- and post-
Sarbanes-Oxley period. The Accounting Review 83 (3): 757–787.
Cohen, D., R. Mashruwala, and T. Zach. 2010. The use of advertising activities to meet earnings
benchmarks: Evidence from monthly data. Review of Accounting Studies 15 (4): 808–832.
Cohen, D., and P. Zarowin. 2010. Accrual-based and real earnings management activities around seasoned
equity offerings. Journal of Accounting and Economics 50 (1): 2–19.
Collins, D. W., and P. Hribar. 1999. Earnings-based and accrual-based market anomalies: One effect or
two? Journal of Accounting and Economics 29 (1): 101–123.
Dechow, P., and R. Sloan. 1991. Executive incentives and the horizon problem: An empirical investigation.
Journal of Accounting and Economics 14 (1): 51–89.
Dechow, P. 1994. Accounting earnings and cash flows as measures of firm performance: The role of
accounting accruals. Journal of Accounting and Economics 18 (1): 3–42.
Dechow, P., and C. Shakespeare. 2009. Do managers time securitization transactions for their accounting
benefits? The Accounting Review 84 (1): 99–132.
DeFond, M., and J. Jiambalvo. 1991. Incidence and circumstances of accounting errors. The AccountingReview 66 (3): 643–655.
DeFond, M., and J. Jiambalvo. 1993. Factors related to auditor-client disagreements over income-increasing
accounting methods. Contemporary Accounting Research 9 (2): 415–431.
Degeorge, F., J. Patel, and R. J. Zeckhauser. 1999. Earnings management to exceed thresholds. Journal ofBusiness 72 (1): 1–33.
Fama, E., and K. French. 1997. Industry costs of equity. Journal of Financial Economics 43 (2): 153–193.
Fields, T., T. Lyz, and L. Vincent. 2001. Empirical research on accounting choice. Journal of Accountingand Economics 31 (1–3): 255–308.
Francis, J., E. Maydew, and H. Sparks. 1999. The role of Big Six auditors in the credible reporting of
accruals. Auditing: A Journal of Practice & Theory 18 (2): 17–35.
Gaver, J., and J. Paterson. 1999. Managing insurance company financial statements to meet regulatory and
tax reporting goals. Contemporary Accounting Research 16 (2): 207–241.
Gow, I. D., G. Ormazabal, and D. J. Taylor. 2010. Correcting for cross-sectional and time-series
dependence in accounting research. The Accounting Review 85 (2): 483–512.
Graham, J. 1996a. Debt and the marginal tax rate. Journal of Financial Economics 41 (1): 41–73.
Graham, J. 1996b. Proxies for the corporate marginal tax rate. Journal of Financial Economics 42 (2): 187–
221.
Graham, J., C. Harvey, and S. Rajgopal. 2005. The economic implications of corporate financial reporting.
Journal of Accounting and Economics 40 (1-3): 3–73.
Graham, J., and L. Mills. 2008. Simulating marginal tax rates using tax return data. Journal of Accountingand Economics 46 (2–3): 366–388.
Gunny, K. A. 2010. The relation between earnings management using real activities manipulation and
future performance: Evidence from meeting earnings benchmarks. Contemporary AccountingResearch 27 (3): 855–888.
Hand, J. 1989. Did firms undertake debt-equity swaps for an accounting paper profit or true financial gain?
The Accounting Review 64 (4): 587–623.
Harris, M. 1998. The association between competition and managers’ business segment reporting decisions.
Journal of Accounting Research 36 (1): 111–128.
Hausman, J. A. 1978. Specification tests in econometrics. Econometrica 46 (6): 1251–1271.
Healy, P. M. 1985. The effect of bonus schemes on accounting decisions. Journal of Accounting andEconomics 7 (1-3): 85–107.
Healy, P. M., and J. Wahlen. 1999. A review of the earnings management literature and its implications for
standard setting. Accounting Horizons 13 (4): 365–383.
Heckman, J. J. 1979. Sample selection bias as a specification error. Econometrica 47 (1): 153–161.
Herrmann, D., T. Inoue, and W. Thomas. 2003. The sale of assets to manage earnings in Japan. Journal ofAccounting Research 41 (1): 89–108.
702 Zang
The Accounting ReviewMarch 2012
Hribar, P., and D. Collins. 2002. Errors in estimating accruals: Implication for empirical research. Journal ofAccounting Research 40 (1): 105–134.
Hribar, P., N. Jenkins, and W. Johnson. 2006. Stock repurchases as an earnings management device.
Journal of Accounting and Economics 41 (1): 3–27.
Hunt, A., S. Moyer, and T. Shevlin. 1996. Managing interacting accounting measures to meet multiple
objectives: A study of LIFO firms. Journal of Accounting and Economics 21 (3): 339–374.
Jackson, S., and W. Wilcox. 2000. Do managers grant sales price reductions to avoid losses and declines in
earnings and sales? Quarterly Journal of Business and Economics 39 (4): 3–20.
Jones, J. 1991. Earnings management during import relief investigations. Journal of Accounting Research29 (2): 193–228.
Kasznik, R., and M. McNichols. 2002. Does meeting earnings expectations matter? Evidence from analyst
forecast revisions and share prices. Journal of Accounting Research 40 (3): 727–759.
Lys, T., and R. Watts. 1994. Lawsuits against auditors. Journal of Accounting Research 32 (Supplement):
65–93.
Myers, J. N., L. A. Myers, and T. C. Omer. 2003. Exploring the term of the auditor-client relationship and
the quality of earnings: A case for mandatory auditor rotation? The Accounting Review 78 (3): 779–
799.
O’Brien, P. C., and R. Bhushan. 1990. Analyst following and institutional ownership. Journal ofAccounting Research 28 (Supplement): 55–76.
Petersen, M. A. 2009. Estimating standard errors in finance panel data sets: Comparing approaches. Reviewof Financial Studies 22 (1): 435–466.
Pincus, M., and S. Rajgopal. 2002. The interaction between accrual management and hedging: Evidence
from oil and gas firms. The Accounting Review 77 (1): 127–160.
Porter, M. 1992. Capital Choices: Changing the Way America Invests in Industry. Boston, MA: Council on
Competitiveness/Harvard Business School.
Rangan, S. 1998. Earnings management and the performance of seasoned equity offerings. Journal ofFinancial Economics 50 (1): 101–122.
Roychowdhury, S. 2006. Earnings management through real activities manipulation. Journal of Accountingand Economics 42 (3): 335–370.
Schipper, K. 1989. Commentary on earnings management. Accounting Horizon 3 (4): 91–102.
Shevlin, T. 1990. Estimating corporate marginal tax rates with asymmetric tax treatment of gains and losses.
The Journal of the American Taxation Association 11 (2): 51–67.
Skinner, D., and R. Sloan. 2002. Earnings surprises, growth expectations, and stock returns or don’t let an
earnings torpedo sink your portfolio. Review of Accounting Studies 7 (2–3): 289–312.
Stice, J. 1991. Using financial and market information to identify pre-engagement factors associated with
lawsuits against auditors. The Accounting Review 66 (3): 516–533.
Teoh, S., J. Welch, and T. Wong. 1998. Earnings management and the underperformance of seasoned
equity offerings. Journal of Financial Economics 50 (1): 63–99.
Woo, C. 1983. Evaluation of the strategies and performance of low ROI market share leaders. StrategicManagement Journal 4 (2): 123–135.
Trade-Off between Real Activities Manipulation and Accrual-Based Earnings Management 703
The Accounting ReviewMarch 2012