
The Accounting & Statistical Manual - Facility Association
159
Accounting & Statistical Manual (Updated September 2021)
Transcript of The Accounting & Statistical Manual - Facility Association

Accounting & Statistical Manual
(Updated September 2021)
Facility Association Accounting & Statistical Manual Table of Contents
Table of Contents Page | 1
Table of Contents
INTRODUCTION ................................................................................................................... 1
FACILITY ASSOCIATION RESIDUAL MARKET ...................................................................... 3
Chapter 1 General Description of Data Processing, Accounting and Reporting Responsibilities - FARM ............................................................................ 4
1.1 Facility Association .................................................................................... 4
1.2 Servicing Carriers ....................................................................................... 4
1.3 All Facility Association Members .............................................................. 5
Chapter 2 Collection of Policyholder Premium and Remittance to Facility Association ................................................................................................ 7
Chapter 3 Accounting Procedures for Servicing Carriers ......................................... 9
3.1 Accounting Records ................................................................................... 9
3.2 General Ledger .......................................................................................... 9
3.3 Bank Account(s) ....................................................................................... 10
3.4 Operation of Bank Account(s) ................................................................. 11
3.5 Use of Books of Record ........................................................................... 12
3.6 Supporting Documentation for Books of Record .................................... 13
3.7 Documents for Disbursements ............................................................... 14
3.8 Allocated Claims Expenses Optional Procedure ..................................... 14
3.9 Submission of Accounting Reports ......................................................... 15
3.10 Outstanding Cheques and Drafts ............................................................ 18
3.11 General Ledger Analysis .......................................................................... 19
3.12 Audit ........................................................................................................ 19
3.13 Retention of Records ............................................................................... 19
3.14 Advancement of funds by the Servicing Carrier to the Facility Association ................................................................................................................. 20
3.15 Monthly Reconciliation Report ............................................................... 20
3.16 Reconciliation between sub-ledger and general ledger balances for Accounts Receivable ............................................................................... 20
3.17 Write-off of Accounts Receivable ........................................................... 20
3.18 Accepted Banking Methods .................................................................... 21
3.19 Handling of GST and HST ......................................................................... 21
Chapter 4 Accounting Procedures for Facility Association Central Office ............ 22
4.1 General .................................................................................................... 22
4.2 Books of Original Entry ............................................................................ 22

Facility Association Accounting & Statistical Manual Table of Contents
Table of Contents Page | 2
4.3 Contents of Books of Original Entry ........................................................ 22
4.4 Bank Accounts ......................................................................................... 23
4.5 Cash Flow ................................................................................................ 23
4.6 Use of Cash .............................................................................................. 23
4.7 Preparation of Financial Statements ...................................................... 23
4.8 Reconciliation of the Servicing Carriers' trial balance to their statistical reporting .................................................................................................. 24
Chapter 5 Servicing Carriers' Statistical Data ......................................................... 26
5.1 Submission of Statistical Data ................................................................. 26
5.2 Correction and Resubmission of Invalid Statistical Data ........................ 26
5.3 Other Reports to Statistical Agency ........................................................ 26
Chapter 6 Members' Participation in Facility Association Residual Market Results ..................................................................................................... 27
6.1 Calculation of Members' Share of Facility Association Residual Market (FARM) Results ........................................................................................ 27
6.2 Participation Report ................................................................................ 27
6.3 Government Line Report ......................................................................... 28
6.4 Assessment/Distribution of Funds .......................................................... 28
Chapter 7 Servicing Carrier Claims Expense Allowance - Retroactive Adjustment ............................................................................................. 30
7.1 Introduction............................................................................................. 30
7.2 Basis for Calculation of Loss Ratio ........................................................... 30
7.3 Frequency of Adjustment ........................................................................ 30
7.4 Calculation of Adjustment Amount ........................................................ 31
7.5 Legal and Professional Fees .................................................................... 32
RISK SHARING POOLS........................................................................................................ 33
Overview – Risk Sharing Pools ......................................................................................... 34
Chapter 8 General Description of Data Processing, Accounting and Reporting Responsibilities - RSP.............................................................................. 37
8.1 Facility Association ................................................................................. 37
8.2 All Facility Association Members .......................................................... 37
Chapter 9 Members’ Sharing in Risk Sharing Pools’ Results ................................. 38
9.1 Calculation of Members’ Share of Risk Sharing Pools’ Results ............... 38
9.2 Operational Report ................................................................................. 38
Facility Association Accounting & Statistical Manual Table of Contents
Table of Contents Page | 3
9.3 Government Line Report ......................................................................... 40
9.4 The Management Information Report .................................................... 41
Chapter 10 Miscellaneous ........................................................................................ 44
10.1 Retention of Records ............................................................................... 44
10.2 Special Remittance .................................................................................. 44
10.3 Risk Sharing Pools Expense Allowance ................................................... 44
UNINSURED AUTOMOBILE FUNDS ................................................................................... 46
Overview – Uninsured Automobile Funds ....................................................................... 47
Chapter 11 General Description of Data Processing, Accounting & Reporting Responsibilities - UAF ............................................................................. 49
11.1 Facility Association .................................................................................. 49
11.2 All Facility Association Members ............................................................ 49
Chapter 12 Members’ Participation in Uninsured Automobile Funds’ Results ...... 50
12.1 Calculation of Members’ Share of Uninsured Automobile Funds’ Results ..................................................................................................... 50
12.2 Member Participation Statement ........................................................... 50
Resources available to Servicing Carriers and Members ................................................ 52
EXHIBITS ................................................................................................................. 53

Facility Association Accounting & Statistical Manual Introduction
Revised: September 22, 2021 Page 1
INTRODUCTION
The Facility Association is an unincorporated entity first established pursuant to the provisions of the
Compulsory Automobile Insurance Act in Ontario. Its existence was subsequently recognized by each of
the other provinces and jurisdictions in which it operates, these being Alberta, New Brunswick,
Newfoundland and Labrador, Northwest Territories, Nova Scotia, Nunavut, Ontario, Prince Edward
Islands, and Yukon.
Its purpose is to ensure the availability of automobile insurance to owners, lessees and licensed drivers of
motor vehicles who are eligible.
The Facility Association’s mission is to deliver on our Purpose through the efficient administration of
automobile insurance residual market mechanisms and by providing valued information to our members.
Facility Association strives to enhance market stability through minimizing its market presence and
impact, in an effort to provide consumers with the benefits of a healthy and competitive standard
insurance market.
Every insurer licensed to write automobile insurance in any jurisdiction Facility Association serves is
required to become a member and remain a member of the Association. All members of the Facility
Association must abide by its Plan of Operation.
The Facility Association under the leadership of its Board of Directors (“the Board”) manages and accounts
for the operations of certain insurance pooling mechanisms on behalf of participating member insurance
companies: Facility Association Residual Market (FARM), Risk Sharing Pool (RSPs), and Uninsured
Automobile Funds (UAFs).
The Facility Association also provides and administers an underwriting information plan (“UIP”) to enable
the identification, collection and transformation of data into information to assist the valid and
appropriate risk assessment by members. Such data is then by definition UIP data. Please refer to Plan
of Operation A. Articles of Association Article XIV – Underwriting Information for detailed information.

Facility Association Accounting & Statistical Manual Introduction
Revised: September 22, 2021 Page 2
The Facility Association generates no revenue on its own and has no right to the insurance-related
revenue generated by the insurance pools. It also has no liability for the claims-related expenses
incurred by these pools. All of the Facility Association’s expenses are recovered fully from its members,
and any profit or loss realized on any of the business included in any of the Facility Association’s
insurance pooling mechanisms is allocated to members.
Facility Association Accounting & Statistical Manual Part I FARM
Revised: October 17, 2014
Page 3
PART I
FACILITY ASSOCIATION RESIDUAL MARKET
Facility Association Accounting & Statistical Manual Part I FARM - Chapter 1
Revised: July 28, 2017 Page 4
Chapter 1 General Description of Data Processing,
Accounting and Reporting Responsibilities - FARM
1.1 Facility Association
The Facility Association Residual Market (“FARM”) is managed by the Facility Association. The
following outlines the data processing, accounting and reporting responsibilities of the Facility
Association in managing the FARM:
1. Administer bank accounts for the FARM
2. Manage cash flow and transfer of funds with members
3. Generate monthly Participation Report and Government Line Report for members
4. Report participation experience monthly and update share ratio of the members
annually
5. Maintain necessary controls, books, ledgers
6. Prepare draft monthly and year-end audited Financial Statements
7. Support the preparation of year-end Appointed Actuary’s Report
8. Manage excess funds that are not required to meet Facility Association’s short term cash
flow needs
9. Conduct audits of Servicing Carriers
10. Monitor the effectiveness of internal control procedures
11. Perform valuations and projections
12. Manage risks associated with data processing, accounting and reporting
1.2 Servicing Carriers
Servicing Carriers are member companies of the Facility Association who are authorized to
manage policies and adjudicate claims for the account of the Facility Association. Servicing
Carriers so designated must meet the eligibility requirements for Servicing Carriers as laid out in
the Plan of Operation. Facility Association policies written by the Servicing Carriers are subject to
the rules, rates and classification of the Facility Association. Servicing Carriers receive

Facility Association Accounting & Statistical Manual Part I FARM - Chapter 1
Revised: July 28, 2017 Page 5
compensation for their services are reimbursed for indemnity claims payments, and for certain
legal and claims adjusting expenses (please see the FARM Claims Guides for details). The Facility
Association communicates on any Servicing Carriers’ related matters via bulletins designated with
the prefix “SC” and “PJM” (Project Manager Bulletins).
As addressed in the Servicing Carrier agreement (Exhibit 1-A), the following outlines with respect
to the data processing, accounting and reporting responsibilities of the Servicing Carrier:
1. Provide quality service to Association insureds and appointed agents/brokers.
2. Bill policy holders on a timely basis for premiums.
3. Collect premiums when due.
4. Disburse funds when due.
5. Handle claim transactions including claim payments, recording provisions for
outstanding claims, collecting subrogation/salvage recoveries.
6. Handle intermediary compensation efficiently.
7. Code and prepare data processing input for necessary transactions.
8. Maintain all necessary controls, books, ledgers and data sets as required.
9. Prepare necessary monthly and annual accounting and data processing reports.
1.3 All Facility Association Members
Every insurer licensed to write direct automobile liability insurance in any jurisdiction in which the
Facility Association operates shall become a member by operation of law.
The Facility Association communicates with members via bulletins designated with the prefix “F”
that are also posted on the Facility Association’s website.
The following outlines the responsibilities of the members:
1. Record in their books their share of allocated participation experience as direct business.
Facility Association Accounting & Statistical Manual Part I FARM - Chapter 1
Revised: July 28, 2017 Page 6
2. Pay premium taxes, health levies, Bureau and other association expenses as required.
3. Receive their share of the FARM policyholder reserve-related funds. Reserve-related funds
are the funds not required to be held by Facility Association to meet its current cash flow
needs and therefore transferred to members. These represent the remaining written
premium dollars not yet required to be paid out for paid claims and general expenses.
4. Return FARM policyholder reserve-related funds to pay the policyholder claims when due
and requested by Facility Association.
5. Accurate transmission of data
Facility Association Accounting & Statistical Manual Part I FARM - Chapter 1
Revised: March 23, 2019
Page 7
Chapter 2 Collection of Policyholder Premium and Remittance to Facility Association
1. The Servicing Carrier is responsible for representing the interests of Facility Association with respect to
the collection of premium receivables, and should use the same collection procedures they would for
their “own” premium receivables when dealing with premium receivables of the Facility Association.
Where legal/collection expenses are expected to be incurred on behalf of the Facility Association, these
shall require review by the Provincial Operating Committee for recommendation to the Facility
Association Board of directors or the President for approval.
2. Any Policyholder premium received by the Servicing Carrier is to be remitted to Facility Association within
2 business days of receipt.
3. Any finance fees charged by the Servicing Carrier in relation to any “payment plans” will be retained by
Servicing Carriers. Servicing Carriers are responsible for bad debts associated with the uncollected
premium related to Monthly Payment Plan, and therefore will not be reimbursed for these costs. Any
“not-sufficient-funds” or “NSF” charges will be retained by the Servicing Carrier.
4. Where a Policyholder has paid their premium to the appointed agent/broker of the Servicing Carrier (and
provided that the Policyholder's cheque for payment has been honoured by the bank or that the
Policyholder can present a receipt for cash payment), the Servicing Carrier will properly credit the
Policyholder even if the agent/broker fails to remit the payment to the Servicing Carrier.
5. In the case of a cancelled agent/broker, the Servicing Carrier will:
a) immediately assume responsibility for accounts receivable from, and refunds payable to,
Policyholders, including premium transactions processed after the agent/broker cancellation that
must be invoiced directly to the policyholder; where payment is not received within 30 days, the
policy must be cancelled by registered letter in accordance with the policy terms / conditions;
b) immediately notify Facility Association and the provincial regulatory/licensing authority of the
agent/broker cancellation and the amount of the outstanding debt;
Facility Association Accounting & Statistical Manual Part I FARM - Chapter 1
Revised: March 23, 2019 Page 8
c) as soon as practicable, set up a mechanism to service the business of the cancelled agent/broker,
either through the Servicing Carrier’s own office or through arrangements with another
agent/broker, until the last policy is expired;
d) as soon as practicable, advise each Policyholder of the Servicing Carrier’s intent and method of
providing policy service until expiry;
e) as soon as practicable, give proper notice of non-renewal to Policyholders as required in their
jurisdiction; and
f) as soon as practicable and in the case of any account for which the Servicing Carrier has not been
paid by the agent/broker, obtain proof of payment directly from the Policyholder and, if proof of
payment has not been received within 30 days from the Policyholder, cancel the policy by registered
letter in accordance with the policy terms / conditions.

Facility Association Accounting & Statistical Manual Part I FARM - Chapter 3
Revised: September 22, 2021 Page 9
Chapter 3 Accounting Procedures for Servicing Carriers
3.1 Accounting Records
Each Servicing Carrier is required to maintain the following books of record and reports separately
for its Facility Association business:
1. General Ledger
2. General Journals with supporting documentation
3. Cash Receipts Register/Journals
4. Cash Disbursements Register/Journals
5. Bank Statements
6. Aged Premium Receivable Report (Detailed by broker and insured)
7. Written Premium Bordereau
8. Claims Bordereau (paid and outstanding claims)
3.2 General Ledger
The general ledger for the Facility Association will contain the following accounts:
Account No. Account Title
1000 Bank Balance
1010 Unapplied Premium
1020 Premiums Receivable
1030 Allowance for Doubtful Accounts
1040 Allocated Expense Recovery
1050 Other Assets
2000 Commissions Payable
2010 Outstanding Claims Draft
2020 Uncashed Cheque Reserve
2030 Unearned Premiums
2040 Unpaid Claims
2050 Other Liabilities
Facility Association Accounting & Statistical Manual Part I FARM - Chapter 3
Revised: June 07, 2013 Page 10
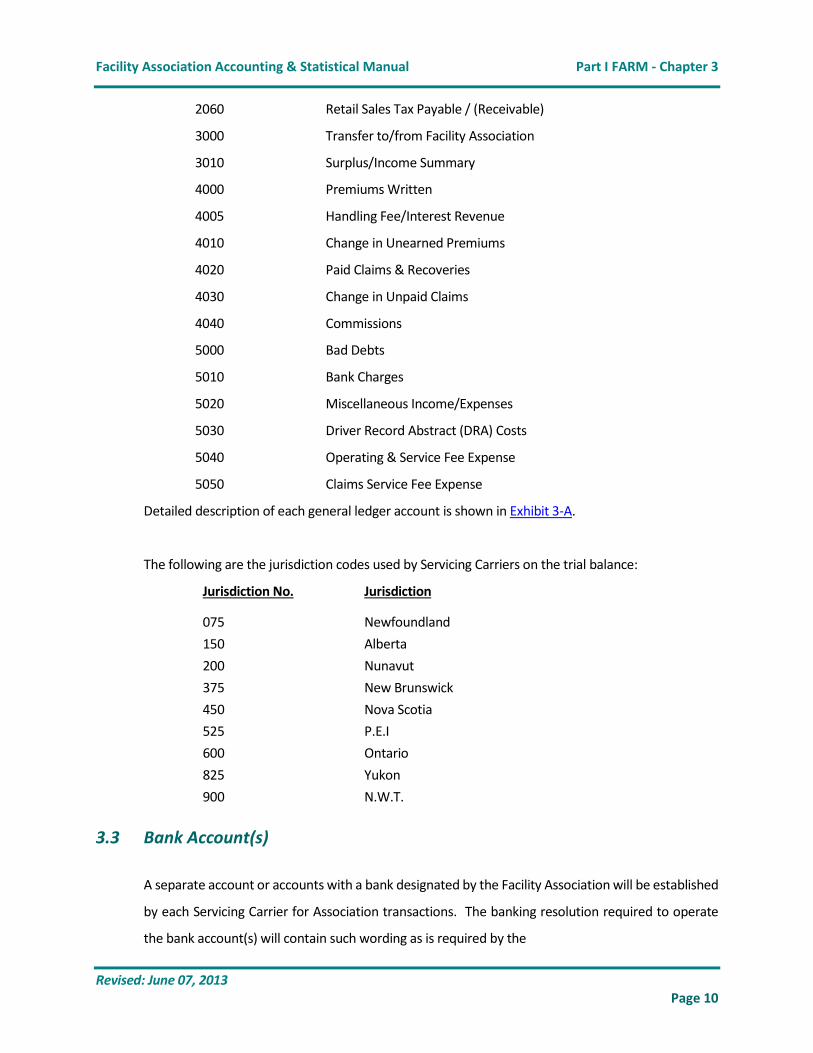
2060 Retail Sales Tax Payable / (Receivable)
3000 Transfer to/from Facility Association
3010 Surplus/Income Summary
4000 Premiums Written
4005 Handling Fee/Interest Revenue
4010 Change in Unearned Premiums
4020 Paid Claims & Recoveries
4030 Change in Unpaid Claims
4040 Commissions
5000 Bad Debts
5010 Bank Charges
5020 Miscellaneous Income/Expenses
5030 Driver Record Abstract (DRA) Costs
5040 Operating & Service Fee Expense
5050 Claims Service Fee Expense
Detailed description of each general ledger account is shown in Exhibit 3-A.
The following are the jurisdiction codes used by Servicing Carriers on the trial balance:
Jurisdiction No. Jurisdiction
075 Newfoundland
150 Alberta
200 Nunavut
375 New Brunswick
450 Nova Scotia
525 P.E.I
600 Ontario
825 Yukon
900 N.W.T.
3.3 Bank Account(s)
A separate account or accounts with a bank designated by the Facility Association will be established
by each Servicing Carrier for Association transactions. The banking resolution required to operate
the bank account(s) will contain such wording as is required by the
Facility Association Accounting & Statistical Manual Part I FARM - Chapter 3
Revised: September 22, 2021 Page 11
designated bank. Provision will be made in the banking resolution for the Facility Association Central
Office to control the account(s). Each Servicing Carrier must ensure daily clearing of deposits from
all of its locations to a central account in the main office of the bank in a designated city. In addition,
all disbursements on behalf of the Facility Association by the Servicing Carrier (all locations) will be
drawn on a central account at the said bank main office. At the end of each business day, the bank
will zero balance Servicing Carrier accounts with Facility Association Central Office bank accounts.
The management of the account(s), as far as making optimum use of the cash balances, is the
responsibility of the Facility Association Central Office.
The Servicing Carrier will designate those individuals who will have authority to disburse and deposit
funds in the bank account(s).
Any banking or transaction costs related to payments (e.g. by credit card) will be borne by the
Servicing Carrier.
3.4 Operation of Bank Account(s)
The Facility Association bank account(s) under the control of the Servicing Carrier will be used for the
following purposes:
1. With regard to deposits
Receipt of premium collections daily
Claims recoveries e.g. salvage and subrogation daily
Funds transferred from Association central bank account
Premiums, claims and commissions related adjustments
Reimbursement from insureds for cost of NSF cheques
2. With regard to disbursements
Payment of claims – by accepted banking methods (please refer to 3.18 Accepted
Banking Methods)
Refund of deductible amounts recovered from subrogation collections
Payment of agents'/brokers’ commissions
Facility Association Accounting & Statistical Manual Part I FARM - Chapter 3
Revised: March 23, 2019 Page 12
Premium refunds
Bank service charges
Funds transferred to The Facility Association Central Office account
Payment for Driver Record Abstracts
Payment of allocated claims expenses (see Section 3.8)
Payment of operating and service fees
Payment of claims service fees
Payment related to salvage and subrogation, e.g. HST, record in Misc Income and Expense
Other expenses maybe permitted (Servicing Carrier must provide details)
3.5 Use of Books of Record
1. Cash Receipts Journal - should include sufficient detail to identify all receipts from Association
agents/brokers and Insureds, receipts on account of salvage and subrogation and other cash
receipts. Deposits of all receipts should be made to the Facility Association bank account(s)
maintained by the Servicing Carrier within 2 business days after receipt. When the cheque
includes salvage and/or subrogation items for both Facility Association and their regular book
of business, the Servicing Carriers are permitted to deposit the cheque no later than the last
workday of the following month in which the cheque was received. (See Section 3.9 for cash
transfer confirmation procedures).
2. Cash Disbursement Journal - should include sufficient detail to identify all disbursements for
losses paid by accepted banking methods (please refer to 3.18 Accepted Banking Methods),
payments of premium refunds, refunds of deductible amounts recovered from subrogation
collections, bank service charges, cost of Driver Record Abstracts, allocated claims expenses,
operating and service fees, claims service fees and other expenses maybe permitted and
Servicing Carrier must provide details. (See Section 3.9 for cash transfer confirmation
procedures.)
Facility Association Accounting & Statistical Manual Part I FARM - Chapter 3
Revised: September 22, 2021 Page 13
3. General Journal – details supporting each journal should be provided as follows:
a) entry date, value date
b) the name and the account number/s used
c) an explanation of the transaction, and
d) debit and credit amounts to be posted to the Facility Association general ledger.
4. Written Premium Bordereau - the Servicing Carrier will be required upon request to provide a
premium bordereau for audit purposes. This report should include sufficient detail to identify
all premium transactions during the month.
5. Claims Bordereau (Paid and Outstanding Claims) - The Servicing Carrier will be required upon
request to provide a claims bordereau for audit purposes. Sufficient detail of all loss payments
and recoveries recorded during the month, and all provisions for outstanding losses as of the
end of the month, must be included.
3.6 Supporting Documentation for Books of Record
All entries in the books of record will require supporting documentation, properly maintained and
filed by the Servicing Carrier for a minimum of 7 years. Required documentation is as follows:
1. Premium records - support at the detailed transaction level for:
a) New business
b) Renewals
c) Endorsements (return and additional premium)
d) Cancellations
2. Claims transaction records - support at the detailed transaction level for:
a) Settlement of losses using Accepted banking methods (please refer to 3.18)
b) Supportable expense for salvage and subrogation recoveries (if not deducted from
settlement of losses as per a) above)
c) Allocated claims expenses recoverable
3. Commission payment records - will be maintained on a monthly basis. The Servicing Carrier

Facility Association Accounting & Statistical Manual Part I FARM - Chapter 3
Revised: September 22, 2021 Page 14
will be required to maintain the commission data on a basis that will facilitate the preparation
of the required government returns (T4's, etc.) to be filed annually by the Servicing Carrier.
Since the agent/broker is deemed to be an independent businessman there is no obligation on
the part of the Servicing Carrier to provide a copy of the required government return to the
agent/broker.
4. Driver record abstract – invoices from and payments to government agency should be on file.
5. Other disbursement records - supporting detail for any Association disbursements to
reimburse Servicing Carriers for incorrect payments that might have been made from the
Servicing Carrier's own bank accounts and for bank service charges.
3.7 Documents for Disbursements
Accepted banking methods (please refer to 3.18) may be used by the Servicing Carrier in settlement
of claims and allocated claims expenses, premium refunds, agents'/brokers’ commissions and other
expenses, where permitted. All draft and related cheque forms will be printed in the name of the
Servicing Carrier in a format selected by the Servicing Carrier. The expense for the preparation and
printing of these forms and other banking related items e.g. deposit books is for the account of the
Servicing Carrier and not to be charged to the Facility Association.
3.8 Allocated Claims Expenses Optional Procedure
Normally, allocated claims expenses will not be paid from the Servicing Carrier's Association bank
account because the claim service fee payable to the Servicing Carrier substitutes for reimbursement
of claim expenses, both allocated and unallocated. As an optional procedure, a Servicing Carrier may
elect to pay allocated claims expenses from the Facility Association bank account and reduce the
amount of the claim service fee reported in the request for service fees which is submitted to Facility
Association head office for approval. In this event, the reimbursement of claims service fees due to
the Servicing Carrier will be net of allocated claims expenses previously paid from the Facility
Association bank account. Supporting detail for allocated claims expenses using Facility Association
cheques must be maintained by the Servicing Carrier.
These allocated claims expenses must be recorded in the general ledger's "Allocated Expense
Facility Association Accounting & Statistical Manual Part I FARM - Chapter 3
Revised: September 22, 2021 Page 15
Recovery" Account No. 1040, not in "Paid Claims and Recoveries" Account No. 4020.
3.9 Submission of Accounting Reports
The Servicing Carrier is required to submit the following reports to the Facility Association Central
Office within 30 days of the applicable month-end.
Trial Balance of Servicing Carrier General Ledger Exhibit 3-B
Cash Analysis and Bank Reconciliation Exhibit 3-C
Request for Service Fees Exhibit 3-D
Aged Premium Receivable Report Exhibit 3-E
Cash Transfer Confirmation Exhibit 3-F
Agent Commission, and Written Premium Report Exhibit 3-G
Commission Adjustment Report by Servicing Carriers Exhibit 3-H
Servicing Carrier Unclaimed Property Exhibit 3-K
Bank account balance verification from General Ledger
In addition, all annual reports as requested are required within 30 days of the year end.
Trial Balance of Servicing Carrier General Ledger Exhibit 3-B
The trial balance is a statement of the Servicing Carrier’s General Ledger of Facility Association
account balances at the close of each accounting month, and are to be maintained at a jurisdiction
level. For those accounts that Servicing Carriers are unable to split directly by jurisdiction, the
accounts may be allocated to jurisdiction using the following prescribed method:
Bank Balance a/c 1000, being a function of outstanding cheques may be allocated based on Paid
Claims for last 6 months (May-Oct) of the previous fiscal year.
Transfers To/From FA a/c 3000 may be allocated based on Surplus/Income Summary as at the
previous year end (e.g. As at October 31, 2017 for November 2017 to October 2018).
Bank Charges a/c 5010 may be allocated based on Paid Claims for the 12 months of the previous
fiscal year.
Facility Association Accounting & Statistical Manual Part I FARM - Chapter 3
Revised: September 22, 2021 Page 16
Monthly Cash Analysis and Bank Reconciliation Exhibit 3-C
The Servicing Carrier will establish a relationship and lines of communication with the Facility
Association's bankers in the same manner as those established for the Carrier's own business.
Controls must be established by the Servicing Carrier to record the daily activity in the bank
account(s) so as to provide the necessary information to complete the schedule of cash analysis
(Exhibit 3-C) and the preparation of bank reconciliation as prescribed by the Facility Association.
Following reasonable attempts to reconcile all differences, Servicing Carriers may write-off
differences less than $50 to clear items in the bank reconciliation each month. Servicing Carriers
should itemize and track all write-off differences for submission to FA annually with the October year-
end trial balance.
Monthly Request For Service Fees Report Exhibit 3-D
Upon receipt and review of the Servicing Carrier's monthly Trial Balance and Request for Service Fees,
the Facility Association Central Office will advise the Servicing Carrier that the reimbursement of the
servicing carrier fees will be provided by accepted banking methods (please refer to 3.18) if so
requested by the carrier for:
1. Operating Service fees for the month;
2. Net Claims Service fees for the month.
Under no circumstances will the Servicing Carrier issue cheques for service fees without prior written
authorization from Facility Association Central Office, Finance team.
The above mentioned disbursements will be recorded as follows:
Debit - Operating and Service Fees G/L #5040
Debit - Claims Service Fees G/L #5050
Credit - Allocated Expense Recovery G/L #1040
Credit - Bank Balance G/L #1000
Aged Premium Receivable Report Exhibit 3-E
All Servicing Carriers must complete a standardized aged premiums receivable report (Exhibit 3-I).
Facility Association Accounting & Statistical Manual Part I FARM - Chapter 3
Revised: September 22, 2021 Page 17
Servicing Carriers must ensure that these numbers reconcile to the premiums receivable reported on
their trial balance. The Servicing Carrier should also comment on the collection status of all overdue
accounts (greater than 90 days past due), including the likelihood of collecting these overdue
accounts. Servicing Carriers are not permitted to provide an allowance for doubtful accounts as the
annual provision at year-end will be estimated by Facility Association central office. Please refer to
section 2.2 Collection of Accounts Receivable and 3.17 Write-off of Accounts Receivable.
It is the responsibility of the Servicing Carriers to clear all their receivables beyond 90 days and if any
outstanding balance remains on the Servicing Carrier's aged trial balance beyond that period (i.e. 90
days) and if the account in question:
a) has not been referred to the Provincial Operating Committee for a ruling, or
b) is not in litigation,
then the Servicing Carrier shall be charged an interest penalty on the outstanding balance by broker
on the aged receivable listing that show debit (positive) balances reported (brokers with credit
(negative) balances are excluded from this calculation) at the Prime Rate charged by Canada’s
chartered banks to their most credit worthy customers, for as long as the account remains
outstanding. Every fiscal quarter, Central Office will provide a worksheet with a detailed breakdown
by month the broker overdue amount and the interest owed to Facility Association. The Servicing
Carrier will remit the interest payment to Central Office upon receipt of the interest charged template
prepared by Central Office. It is recorded to Interest Income-Overdue Broker account a/c 4161.
For broker accounts with an outstanding balance over 150 days, the Servicing Carrier is required to
submit the outstanding amount in full or submit an appeal to the Provincial Operating Committee for
review.
Cash Transfer Confirmation Exhibit 3-F
Balances in the Servicing Carrier's Facility Association Bank account will be automatically transferred
to the Facility Association Central Office bank account by its banker as prescribed by the Facility
Association at the end of each business day.
The Servicing Carrier will be provided with a summary of the cash transfers for the month, as reported
by the Facility Association banker. This summary must be verified against the cash transfers recorded
in the Servicing Carrier's general ledger, and a "confirmed" signed copy is to be returned to the Facility

Facility Association Accounting & Statistical Manual Part I FARM - Chapter 3
Revised: September 22, 2021 Page 18
Association Central Office.
Agent Commission, and Written Premium Report Exhibit 3-G
The Servicing Carrier will be required to submit a monthly commission and written premium report
by jurisdiction and by business segment, which are private passenger and non-private, passenger
automobile insurance.
Commission Adjustment Report by Servicing Carriers Exhibit 3-H
To allow for early detection and correction of Servicing Carrier commission differences by business
segment, the Servicing Carriers are required to reconcile trial balance data with IBC statistical data
and to submit commission adjustments which are to be included with monthly commission as
reported in Agent Commission, and Written Premium Report (Exhibit 3-G). Please refer to Section
4.8 for the reconciliation of the Servicing Carriers’ trial balance to their statistical reporting.
Bank Account Balance Verification from General Ledger
Servicing Carriers are required to submit the General Ledger page confirming the monthly ending
balance of the bank account.
Annual reports
Servicing Carriers may be required to submit various year-end reports to the Facility Association
Central Office as requested at the time of the year-end audit.
Servicing Carriers are required to annually submit information related to structured settlements.
To support this reporting requirement, Servicing Carriers must maintain accurate records on
structured settlements and have controls in place to ensure structured settlements are monitored
and reversionary interest is credited back to Facility Association where applicable.
3.10 Outstanding Cheques and Drafts
At the end of each month all cheques and drafts outstanding for six months or longer from the date
of issue should be transferred to the "Uncashed Cheque Reserve Account". This transfer will be
effected by Journal Voucher and entered on the Cash Analysis Schedule. Listings in support of this

Facility Association Accounting & Statistical Manual Part I FARM - Chapter 3
Revised: September 22, 2021 Page 19
General Ledger account will be maintained by the Servicing Carrier, although it is understood that
the liability will be assumed by the Facility Association. Annually an email from the Senior
Accountant will be sent by the end of January to Servicing Carriers to remind them of this
requirement. Servicing Carriers must remit abandoned property to Alberta Finance by end of
April of every year as per Alberta’s unclaimed property guidelines. Servicing Carriers are required
to provide supporting documentation to Facility Association for payment of unclaimed property
to Alberta Finance. Please refer to Facility Association Unclaimed Property Guidelines and
Procedures (Exhibit 3-J).
3.11 General Ledger Analysis
It is the responsibility of the Servicing Carrier to maintain detailed information including sub-ledgers
and supporting documentation as required for audit purposes which shall be balanced monthly to
the appropriate general ledger control accounts as follows:
Premiums Receivable (GL Account 1020)
Allowance for Doubtful Accounts (GL Account 1030)
Other Assets (GL Account 1050)
Commissions Payable (GL Account 2000)
Outstanding Claims Drafts (GL Account 2010)
Uncashed Cheque Reserve (GL Account 2020)
Other Liabilities (GL Account 2050)
Bad Debts (GL Account 5000)
Miscellaneous Income/Expenses (GL Account 5020)
3.12 Audit
Facility Association books of accounts maintained by the Servicing Carrier will be subject to a year-
end audit by their external auditors and their auditor’s report is to be submitted to the Facility
Association’s external auditor designated by the Board of Directors. Audits may also be conducted
by the Facility Association’s Compliance team during the course of the year.
3.13 Retention of Records
The retention and distribution of records by the Servicing Carrier will follow the statutory
Facility Association Accounting & Statistical Manual Part I FARM - Chapter 3
Revised: September 22, 2021 Page 20
requirements as set out for insurance companies at the Provincial or Federal level. Nevertheless,
records supporting the entries on the books of record shall be retained for the Facility Association
audit purposes for at least a seven-year period.
3.14 Advancement of funds by the Servicing Carrier to the Facility Association
On authority of the Facility Association's Board of Directors, a Servicing Carrier may advance funds
from its own account to its Association bank account. Interest will be payable to the Servicing Carrier
at the then current prime rate.
3.15 Monthly Reconciliation Report
Facility Association requires Servicing Carriers to reconcile transactions reported to the IBC with the
amounts reported on the Carrier’s Trial Balance. As an aid to this reconciliation, Servicing Carriers can
download a copy of the trial balance report which is available on the FA portal.
3.16 Reconciliation between sub-ledger and general ledger balances for
Accounts Receivable
Reconciliation between servicing carrier’s sub-ledger and general ledger balances for Accounts
Receivable must be completed monthly by servicing carrier. Any unexplained differences will not be
eligible for write-off by Facility Association. If the servicing carrier is unable to resolve the differences,
and the general ledger balance is higher than the sub-ledger, the servicing carrier must reimburse
Facility Association to clear the difference.
3.17 Write-off of Accounts Receivable
1. Provided that the Servicing Carrier has followed the procedures set out in 3.9 -- Aged Premium
Receivable Report Exhibit 3-E, any defaults in payment of accounts will be borne by the Facility
Association members. All requests for the write-off of accounts receivable must be fully
documented and submitted to the appropriate Provincial Operating Committee for review and
recommendation to be made to the Board of Directors or the President for final approval.
2. There shall be no write-off of premiums in respect of deferred premium payment plans or
monthly payment plan offered by the Servicing Carrier. Write-off of premiums in respect of

Facility Association Accounting & Statistical Manual Part I FARM - Chapter 3
Revised: September 22, 2021 Page 21
direct billing plans should normally not be necessary. If there are special circumstances,
however, the matter shall be fully documented and submitted to the appropriate Provincial
Operating Committee for review and recommendation be made to the Board of Directors or
the President for final approval.
3.18 Accepted Banking Methods
Cheque, draft, electronic fund transaction (EFT) and email transfers.
3.19 Handling of GST and HST
Salvage collected by Servicing Carriers related to FARM claims must be credited to FARM and should
be exclusive of any applicable GST/HST collected with salvage, since Servicing Carriers are
responsible for remitting GST/HST to the relevant tax authority. Any GST/HST paid by Servicing
Carriers on eligible expenses may be charged to FARM.
Facility Association Accounting & Statistical Manual Part I FARM - Chapter 4
Revised: September 22, 2021 Page 22
Chapter 4 Accounting Procedures for Facility Association
Central Office
4.1 General
Facility Association Central Office is required to maintain the necessary financial records for reporting
to its members. The Facility Association utilizes an accounting software that runs in a Windows
environment.
4.2 Books of Original Entry
The books of original entry required include the following:
1. Accounts Receivable/Cash receipts journal
2. Accounts Payable/Cash disbursements journal
3. General Journals
4. Accounts Payable Subledger
5. Accounts Receivable Sub ledger
6. General Ledger
The support for postings to the General Ledger will be the books of record maintained by The Facility
Association Central Office.
4.3 Contents of Books of Original Entry
Receipts for Member settlement of accounts, Servicing Carriers, Inter Company transactions within
the Facility Association group of entities and any investment income earned are recorded in the cash
receipts and general journals. Disbursements for the operation of The Facility Association Central
Office, including administrative expenses, and Member settlement of accounts and Servicing Carrier
related expenses are recorded in the cash disbursements and general journals. The Accounts Payable
and Accounts Receivable Subledgers maintain balance due to and due from Vendors, Members and
Servicing Carriers.
Facility Association Accounting & Statistical Manual Part I FARM - Chapter 4
Revised: September 22, 2021 Page 23
4.4 Bank Accounts
Bank accounts will be established, as required for the Facility Association Central Office. Such
accounts maybe opened only at the direction of the Board of Directors with the approval by the
Facility Association’s President. As approved by the Facility Association’s Board of Directors, all
disbursements including cheques, drafts and EFT payments requires two signatures. All persons with
responsibility of the Facility Association bank accounts must be bonded in an amount appropriate for
the responsibility.
4.5 Cash Flow
FARM’s cash balance increases by the funds transferred from the Servicing Carriers to Facility
Association for premiums received plus any investment income received by Facility Association on
investments held at the Facility Association.
FARM’s cash balance decreases by funds transferred to the Servicing Carriers for payment of claims,
reimbursement of legal fees, and servicing carrier fees Facility Association’s operating expenses,
claims paid to Ex Servicing Carriers (run-off) and Members in liquidation.
4.6 Use of Cash
Each month, an analysis is performed of Facility Association’s FARM related cash flow needs for the
next eight months. Based upon this estimate, a determination is made regarding the appropriate net
transfer to or from members to be made (if any). This practice places as much of the FARM
policyholder funds with the member companies as possible, while continuing to provide the Facility
Association with the necessary funds to settle FARM policyholder claims on a daily basis.
If not specifically requested by members to receive funds via cheques, the Facility Association will
deposit funds directly to members’ accounts via EFT.
4.7 Preparation of Financial Statements

Facility Association Accounting & Statistical Manual Part I FARM - Chapter 4
Revised: September 22, 2021 Page 24
1. Facility Association Central Office will be responsible for the preparation of unaudited monthly
financial statements and maintains proper detail to support applicable General Ledger
accounts.
2. The Central Office management will be responsible for actuarial provisions (such as IBNR and
actuarial present value adjustments) calculated based on assumptions provided by the Facility
Association’s Appointed Actuary.
3. The Facility Association Central Office will be responsible for the preparation of the members'
monthly Participation Report within 45 business days of the close of the reporting month.
FARM Participation reports are available to Members for on-line retrieval via the Facility
Association Portal. The Operating Schedule for release dates of the members' monthly
Participation Report is available on the Facility Association website.
4. Any balances due to or from members will be settled on the basis of the Participation Report.
5. Within 6 months of the fiscal year-end, audited financial statements of the operation of the
Facility Association’s Residual Market will be available for presentation to and acceptance by
the members.
6. The audited financial statements are available at www.facilityassociation.com.
4.8 Reconciliation of the Servicing Carriers' trial balance to their statistical reporting
Each month, Facility Association compares written premium, commissions, paid claims, outstanding
loss reserves reported by the Servicing Carrier between the Trial Balance report and as submitted to
the Statistical Plan, and will advise Servicing Carrier of differences to be cleared, and ensure the
variances are reconciled and errors are corrected by the Servicing Carrier.
The Servicing Carrier is responsible for reconciling these differences and correcting the errors that
contributed to differences in excess of $25,000 on a fiscal year to date basis within the current fiscal
year or over $100,000 on an all fiscal years to date basis. If not provided previously for the differences
identified in the month (that would trigger a remediation plan), the Servicing Carrier must send a
remediation plan acceptable for FA management when differences remain in excess of the
Facility Association Accounting & Statistical Manual Part I FARM - Chapter 4
Revised: September 22, 2021 Page 25
thresholds noted above by the end of the following month. These differences will be reduced by any
approved write-offs.
In terms of “older year” differences (i.e. more than 5 years old), Servicing Carriers must submit a
request annually for write off if required:
Carriers should be able to demonstrate that a concerted effort was made to resolve the
difference
Servicing carrier fees will be allowed when premium or claims are increased and will be returned
when premium or claims are reduced.
Carriers to advise the accounting entries (by jurisdiction) for this adjustment before submission
to the Board for approval
The difference should be shown as a % of total business processed over the years to which the
write-off applies
Request for write-offs may be submitted to Facility Association central office annually anytime
during the year, however, any Board approved adjustments should only be processed by
jurisdiction and only to the October trial balance.
Facility Association Accounting & Statistical Manual Part I FARM- Chapter 5
Revised: September 22, 2021 Page 26
Chapter 5 Servicing Carriers' Statistical Data
5.1 Submission of Statistical Data
Each Servicing Carrier will submit the statistical data in respect of its Facility Association Residual
Market (FARM) premium and claim transactions to the designated Statistical Agency (General
Insurance Statistical Agency, “GISA”). The submission of the data in respect of each calendar month's
transaction is to be completed within thirty days after the last day of that month. Servicing Carriers
are required to ensure that the information they provide in Automobile Statistical Plan 9 is reconciled
and errors are corrected in accordance with a remediation plan. The format, coding and control of
the transactions are to be in accordance with the Automobile Statistical Plan administered by GISA
subject to the following special provisions in respect of Facility Association business:
1. A special IBC Company No. (Commencing with '9')
2. A special Plan Code No. ('9')
Please refer to the Automobile Statistical Plan for field codes.
5.2 Correction and Resubmission of Invalid Statistical Data
The Servicing Carrier is responsible for the prompt correction and resubmission of transaction data
that the Statistical Agency reported as being invalid.
5.3 Other Reports to Statistical Agency
The Servicing Carrier is responsible for the completion and return of reports required by the Statistical
Agency in respect of the FARM business.
Facility Association Accounting & Statistical Manual Part I FARM - Chapter 6
Revised: September 22, 2021 Page 27
Chapter 6 Members' Participation in Facility Association
Residual Market Results
6.1 Calculation of Members' Share of Facility Association Residual Market
(FARM) Results
At the end of each fiscal year, profit or loss for each class of business, Private Passenger and Non
Private Passenger, shall be determined separately for each accident year in each jurisdiction in
accordance with accounting procedures approved by the Board of Directors.
Calculations for an accident year shall include all policies earned during such calendar year. Profit
shall be credited or distributed to each member and loss shall be charged against or collected from
each member in accordance with the member's appropriate participation ratio.
Each member's participation ratios for an accident year shall be in accordance with the Plan of
Operation, A. Articles of Association Article V-Participation Ratios and Sharing, Section 3 (a) and (b).
6.2 Participation Report
The Facility Association's Central Office will produce a monthly Participation Report for each member.
The report (see Exhibit 6-A for sample report) will display, by jurisdiction, segment of business
("Private Passenger" and "Non Private Passenger") and accident year, the member's shares of the
following amounts:
a) written and earned premiums, paid losses, claim service fee, change in retro claims expense,
operating and service fee, agents commissions, driver record abstracts, administration
expense, bad debts, premium finance fee and investment income, relative to the report
month;
b) month end provisions for outstanding losses, I.B.N.R. losses (including actuarial present
values) and premium deficiency; and
c) estimates in respect of the above items for the two succeeding months;
Facility Association Accounting & Statistical Manual Part I FARM - Chapter 6
Revised: September 22, 2021 Page 28
All of those amounts are for recording in the member's books as relating to direct business.
Beginning with the March 2009 Participation report, the monthly report produced is available on the
Facility Association Portal at https://portal.facilityassociation.com/. To assist readers in
understanding the new report layout, the User Guide is also posted on the Facility Association
website.
The target date for the release of each Participation Report is within 45 business days after the last
day of the report month. Members are advised via “F” bulletin that the reports are available on the
FA Portal.
6.3 Government Line Report
The Government Line Report (see Exhibit 6-B for sample report) for each member is produced
monthly. It uses the same information that has been calculated for the Member Participation Report.
The Government Line Reports line items are the same as the Projections page on the Member
Participation Report but at a more detailed level– Government Line and Accident Year.
The Government Line Report, replacing the Quarterly Report and the Year-end Report, provides
members with results on both a fiscal year and a calendar year basis.
This report is available on the Facility Association portal at https://portal.facilityassociation.com.
Changes to the new report are identified in the User Guide and the detailed descriptions for each
page are also set out in the User Guide.
6.4 Assessment/Distribution of Funds
a) Operating Results
At the end of each fiscal year, profit or loss for each class of business, Private Passenger and Non
Private Passenger, shall be determined separately for each accident year in each jurisdiction in
accordance with accounting procedures approved by the Board of Directors. Profit shall be credited
or distributed to each member and loss shall be charged against each member in accordance with
the member's appropriate participation ratio.
Facility Association Accounting & Statistical Manual Part I FARM - Chapter 6
Revised: July 28, 2017 Page 29
b) Available Funds
In 2005, the Facility Association Board of Directors authorized the transfer to member companies of
FARM policyholder funds not required to meet Facility Association’s short term FARM cash flow
needs. Transferring these funds to Members will allow them to invest these funds based upon their
own investment plans and policies. In the Participation Report, the net balance of the Operating
Results Distributed and the Available Funds Distributed will be either Funds held by FA or Funds held
by Members. FARM policyholder funds held by Members will eventually need to be returned to the
Facility Association to enable it to pay the policyholder claims to which these funds relate.
Facility Association Accounting & Statistical Manual Part I FARM - Chapter 7
Revised: September 22, 2021 Page 30
Chapter 7 Servicing Carrier Claims Expense Allowance -
Retroactive Adjustment
7.1 Introduction
As specified in the Facility Association's Plan of Operation A. Articles of Association Article IX, the
claims expense allowances paid to each Servicing Carrier are subject to retroactive adjustment in
accordance with the incurred loss ratio (paid losses plus outstanding losses expressed as a
percentage of earned premiums) actually experienced on the Facility Association business written
by the Carrier. (Note: "Losses" do not include "expenses")
The Facility Association's Central Office will calculate the said incurred loss ratio for each jurisdiction
by utilising the premium and loss data submitted by the Servicing Carrier to GISA.
7.2 Basis for Calculation of Loss Ratio
For policies earned prior to January 1, 1993, the incurred loss ratio will be calculated on a calendar
policy year basis i.e., by reference to all losses that have occurred on all the policies that
commenced in the calendar year concerned. For policies earned thereafter, the incurred loss ratio
will be calculated on a calendar accident year basis, i.e., by reference to all losses that have
occurred in the calendar year concerned.
7.3 Frequency of Adjustment
The calculation of the incurred loss ratio and the retroactive adjustment (if any) will be effected
three times for each calendar accident year (for 2003 and subsequent):
1. 1st (interim): Three months after the calendar year-end concerned;
2. 2nd (interim): Two years after the three months after the end of the calendar year
concerned;
3. 3rd (final): Five years after the three months after the end of the calendar year
Facility Association Accounting & Statistical Manual Part I FARM - Chapter 7
Revised: December 1, 2017 Page 31
concerned.
Interim retroactive claims fee adjustments will be calculated on a projected 72-month recorded
loss ratio as estimated by Facility Association on a basis consistent with September 30 valuation
assumptions provided by the Facility Association’s Appointed Actuary.
The 5-year adjustment will be calculated on the reported loss ratio by each Servicing Carrier.
7.4 Calculation of Adjustment Amount
The adjustment to the claims expense allowance is calculated as follows:
1. Adjusted Allowance Rate
Base rate (see table below)
Plus: Incurred loss ratio 10
Equals: Adjusted Allowance Rate
Base rate is applicable in each jurisdiction
In no circumstances shall the Adjusted Allowance Rate be less than 9.00% nor more
than 19.00% for ON, NB, NS, PE, NT, NU & YT.
In no circumstances shall the Adjusted Allowance Rate be less than 9.00% nor more
than 16.00% in AB and NL.
2. Adjusted Claims Expense Allowance
Apply the Adjusted Allowance Rate to the earned premiums
Equals: Calculate the Adjusted Claims Expense Allowance by
3. Claims Service Fee Adjustment
Adjusted Claims Expense Allowance (calculated above)
Subtract: Claims Fees already paid
Equals: Claims Service Fee Adjustment

Facility Association Accounting & Statistical Manual Part I FARM - Chapter 7
Revised: September 22, 2021 Page 32
Base Rate Table
ON, NS, NB, PE, NT, NU & YT
AB & NL
Initial Claims Service Fees paid
(% of Earned Premiums) 12.00% 10.00%
Reimbursement rate Loss Ratio Assumed by
the Initial Claims Service Fees Paid 65.00% 67.50%
Base Rate 5.50 3.25
Range of Adjusted Allowance Rate 9.00% - 19.00% 9.00% - 16.00%
7.5 Legal and Professional Fees
Information can be found in the FARM Claims Guide for legal and professional fees.

Facility Association Accounting & Statistical Manual Part II RSP
Revised: October 17, 2014 Page 33
PART II
RISK SHARING POOLS
Facility Association Accounting & Statistical Manual Part II RSP
Revised: September 22, 2021 Page 34
Overview – Risk Sharing Pools
The Risk Sharing Pools (“RSPs”), operating in Ontario, Alberta (Grid and Non-Grid), New Brunswick, Nova
Scotia and Newfoundland & Labrador, provide a means for individual automobile insurance member
companies to transfer certain of the private passenger use automobile insurance policies they underwrite
in the respective jurisdiction.
The RSPs were established under the Plan of Operation (“the Plan”) of the Facility Association. For risks
that qualify for an RSP, members issue policies on their own accounts and may transfer the whole of the
policy or a portion thereof to the RSP, in accordance with the transfer rules set out in the Plan of
Operation. The member company that issues the initial policy (i.e., the primary writer) remains
responsible for servicing the policy, including any settlement of claims that may arise from the policy. The
Facility Association funds the operations of the RSPs through a monthly sharing among members of the
net of premiums received and claims and expenses paid.
The Facility Association manages the following RSPs:
The Ontario Risk Sharing Pool (“Ontario RSP”) has operated since January 1, 1993 and is
comprised of private passenger business. Participating members share in the experience of
the Ontario RSP in relation to their share of the private passenger market and their usage of
the Ontario RSP weighted at 50% each in accordance with the relevant provision of the Plan.
Currently only 85% is transferred to the Ontario Risk Sharing Pool, with the company
retaining 15% for its own account. Effective January 1, 2022, any risk transferred will be
transferred at 100%. The Facility Association Board may from time to time by resolution set
the percentage of a risk to be retained by the members for their own accounts, and establish
maximum transferable limits and minimum deductibles with respect to risks transferred.
Please see Risk Sharing Pool Procedures Manual for details.
The two Alberta Risk Sharing Pools (Grid and Non-Grid) commenced operations on
October 1, 2004. The “Grid Pool” provides a means for Alberta automobile insurance
member companies to transfer private passenger use automobile insurance policies that are

Facility Association Accounting & Statistical Manual Part II RSP
Revised: September 22, 2021 Page 35
subject to the statutory maximum premium. The “Non-Grid Pool” provides a means for
individual Alberta automobile insurance member companies to transfer certain of the
private passenger use automobile insurance policies they underwrite. Participating
members share in the experience of the Alberta RSPs in relation to their share of the private
passenger market in accordance with the relevant provisions of the Plan.
Currently the Alberta Non-Grid Risk Sharing Pool members transfer limit is 4%. Effective
January 1, 2022, the transfer limit percentage for the Alberta Non-Grid Risk Sharing Pool will
be changed to 5%. Please see Risk Sharing Pool Procedures Manual for details.
The New Brunswick “First Chance” Risk Sharing Pool (“New Brunswick RSP”) commenced
operations on January 1, 2005. The RSP provides a means for individual New Brunswick
automobile insurance member companies to transfer certain of the private passenger use
automobile insurance policies they underwrite that are eligible for the “First Chance”
discount in that province. Participating members share in the experience of the New
Brunswick Pool in relation to their share of the private passenger market in accordance with
the relevant provisions of the Plan.
Effective January 1, 2022, the following changes will be made. Please see Risk Sharing Pool
Procedures Manual for details.
- The member transfer limit percentage for the New Brunswick Risk Sharing Pool will be
changed to 5% from 8%.
- Expand the eligibility criteria to allow all private passenger use vehicles from the current
restrictions for inexperienced operators.
The Nova Scotia Inexperienced Drivers Risk Sharing Pool (“Nova Scotia RSP”) commenced
operations on January 1, 2007. This RSP provides a means for individual Nova Scotia
automobile insurance member companies to transfer certain of the private passenger use
automobile insurance policies they underwrite that are eligible for the “Inexperienced
Drivers” discount in that province. Participating members share in the experience of the

Facility Association Accounting & Statistical Manual Part II RSP
Revised: September 22, 2021 Page 36
Nova Scotia RSP in relation to their share of the private passenger market in accordance
with the relevant provisions of the Plan.
Effective January 1, 2022, the following changes will be made. Please see Risk Sharing Pool
Procedures Manual for details.
- Currently The member transfer limit for the Nova Scotia Risk Sharing Pool will be
changed to 5% from none.
- Expand the eligibility criteria to allow all private passenger use vehicles from the current
restrictions for inexperienced operators.
The Newfoundland & Labrador Risk Sharing Pool (“Newfoundland & Labrador RSP”)
commenced operations on July 1, 2020. This RSP provides a means for Newfoundland &
Labrador members to transfer certain private passenger use automobile insurance policies
they underwrite that are eligible. Members share in the experience of the Newfoundland
& Labrador RSP by accident year in relation to their share of the Newfoundland & Labrador
private passenger market in accordance with the relevant provisions of the Plan.
Submission of Risk Sharing Pools Data
Details on submission of Risk Sharing Pools data can be found in the Risk Sharing Pool
Procedures Manual.
Legal and Professional Fees
Information can be found in the RSP Claims Guide for legal and professional fees.
Facility Association Accounting & Statistical Manual Part II RSP - Chapter 8
Revised: September 22, 2021 Page 37
Chapter 8 General Description of Data Processing,
Accounting and Reporting Responsibilities - RSP
8.1 Facility Association
The following outlines the data processing, accounting and reporting responsibilities of the Facility
Association in managing the Risk Sharing Pools:
1. Administer Bank accounts for the Risk Sharing Pools
2. Manage cash flow and settle funds with members
3. Generate monthly Operational reports and Government Line Reports for members
4. Set expense allowance for each calendar year for each Risk Sharing Pool (Alberta is in
consultation with the Superintendent of Insurance)
5. Report participation experience monthly and update share ratio of the members
annually
6. Maintain necessary controls, books, ledgers
7. Prepare monthly and audited annual Financial Statements
8. Ensure the effectiveness of internal control procedures
8.2 All Facility Association Members
The following outlines the data processing, accounting and reporting responsibilities of the
Members on the Risk Sharing Pools:
1. Record in their books their share of allocated participation experience as direct business
2. Remit monthly settlements when due
3. Pay premium taxes, health levies, Bureau and other association expenses according to
allocated participation
4. Accurate transmission of data
The Facility Association communicates with members via “F” bulletins which are posted on the
Facility Association’s website.
Facility Association Accounting & Statistical Manual Part II RSP - Chapter 9
Revised: September 22, 2021 Page 38
Chapter 9 Members’ Sharing in Risk Sharing Pools’ Results
To allow members to record their share of Risk Sharing Pool business and meet related regulatory
requirements, the Association produces three monthly reports:
The Operational Report
The Government Line Report
The Management Information Report
This allows members to review the impact of the Risk Sharing Pool on the member’s operations. The
Facility Association will be responsible for the preparation of these Reports within 25 business days of the
close of the reporting month.
9.1 Calculation of Members’ Share of Risk Sharing Pools’ Results
At the end of each fiscal year, profit or loss for each class of business, Risk Sharing Pools, shall be
determined separately for each accident year in each jurisdiction in accordance with accounting
procedures approved by the Board of Directors.
Calculations for an accident year shall include all policies earned during such calendar year. Profit
shall be credited or distributed to each member and loss shall be charged against or collected from
each member in accordance with the member’s appropriate participation ratio.
Each member’s participation ratios for an accident year shall be in accordance with the Plan of
Operation A. Articles of Association Article V-Participation Ratios and Sharing, Sections 3 (c) and (d).
9.2 Operational Report
The Facility Association produces this report monthly for each of the Risk Sharing Pools and any
balances due to or from members will be settled on the basis of the Operational Report.
The Operational schedule for release dates of the members' monthly Operational Report is available
on the Facility Association website.
Facility Association Accounting & Statistical Manual Part II RSP - Chapter 9
Revised: December 1, 2017 Page 39
The Operational Report displays the total premiums and losses transferred to the Risk Sharing Pool
by its Members, and the Member's share of the business transferred for the current month, for the
Fiscal Year to date and for all years to date.
The Operational Report allows the Members to recap the net cash flow between the Member and
the Risk Sharing Pool for the current month resulting in an amount either being due to the Risk
Sharing Pool by the Member, or due to the Member from the Risk Sharing Pool. The report indicates
the net amount due to/from the Risk Sharing Pool and the date of settlement.
The Operational Report is divided into major categories as follows:
Risk Sharing Pool Total (Pages 1 and 2)
Member’s Share of Risk Sharing Pool Total (Pages 3 and 4)
Account Reconciliation , Including Share on Cash Basis (Pages 5 to 7)
Two-month Projections (Page 8)
The Report is produced on an accident year basis as follows:
The next future accident year, the current accident year and each of the four previous years
and the total of all other previous years.
With a total of all accident years on the right side of the page.
Throughout the Operational Report, the “Operating Result” is computed as Premiums Earned,
Less Claims Incurred and General Expenses, as follows:
Premiums Written (Transferred)
+ Change in Unearned Premium
= Premiums Earned (A)
Facility Association Accounting & Statistical Manual Part II RSP - Chapter 9
Revised: December 1, 2017 Page 40
Paid Losses
+ Paid Expenses
+ Change in Outstanding Losses
+ Change in IBNR Provision*
= Claims Incurred (B)
Expense Allowance
+ Administration Expense
+ Change in Premium Deficiency (DPAC)*
= General Expenses (C)
*Including Actuarial Present Values
OPERATING RESULT = (A)-(B)-(C)
The sample Operational Report is attached as Exhibit 9-A and the User Guide is posted at Facility
Association website.
9.3 Government Line Report
The Government Line report is issued monthly and is available on the Facility Association Portal. It is
designed to assist Members to reflect their share of the Risk Sharing Pool business in their reports to
federal and/or provincial authorities.
The Government Line reports use the same information that has been calculated for the Member
Operational Report. Each of the Government Lines Reports, are the same as the Projections page on
the Member Operational Report but at a more detailed level - Government Line and Accident Year.
Premiums are shown as transferred premiums by the various government lines with unearned
premiums calculated on the daily pro-rata method.
Claims are shown by paid losses, paid expenses, outstanding losses and I.B.N.R. provision (including
actuarial present values), and incurred losses as at the calendar year end by government line. These
are summarized for the next future year, the current year, each of the previous four claim/loss years
Facility Association Accounting & Statistical Manual Part II RSP - Chapter 9
Revised: December 1, 2017 Page 41
and all prior years combined.
Estimated incurred losses and estimated total outstanding reserves are presented on discounted and
undiscounted basis.
The report includes the projections for the next two months to determine what member’s share is
projected to be as at the end of the current reporting month + 2 months.
The sample Government Line Report is attached as Exhibit 9-B and the User Guide is posted at
www.facilityassociation.com.
9.4 The Management Information Report
The Management Information Report (see Exhibit 9-C) summarizes transactions between Members
and the Risk Sharing Pool.
This report is an information report issued monthly and is available on the Facility Association Portal
for each member in each of the Risk Sharing Pools since November 2008. It is not an accounting
report and is intended to assist the Member in assessing the impact of the Risk Sharing Pool on the
Members operations both as a Member transferring risks to the Risk Sharing Pool and as a Member
sharing in the premiums, claims and expenses of the Risk Sharing Pool.
The Member can measure the results of its underwriting, and claims operations by relating the
portfolio which the Member has transferred to the Risk Sharing Pool relative to the portfolio
transferred by all Members.
1. Report Sequence
By accident year.
“REPORTED” these amounts represent the risks transferred to the Risk Sharing Pool by the
Member
“SHARE” these amounts represent the Member’s share of total risks transferred to the
Risk Sharing Pool
Facility Association Accounting & Statistical Manual Part II RSP - Chapter 9
Revised: September 22, 2021 Page 42
A summary of all accident years combined is shown at the end.
2. Contents of the Report (Horizontal Format)
a) Percentage – The Reported Percentage is the percentage which represents the ratio of the
premiums by the Member to the Premiums transferred to the Risk Sharing Pool by all
Members.
The Shared Percentage is the proportion of each Member writings to all Members writings
in that Risk Sharing Pool.
b) Gross Premiums – Premiums charged for that portion of the risks transferred by the
Member to the Risk Sharing Pool before any calculation of transfer percentage or expense
allowance.
c) Transferred Premiums
Ontario Risk Sharing Pool: The portion of the Gross Premiums transferred to the Pool is
100% initially and 85% in second and subsequent years.
Other Risk Sharing Pools: The portion of the Gross Premiums transferred to the Pool is
100%.
d) Expense Allowance
Ontario Risk Sharing Pool: Members must file the Expense Factor Form annually;
the calendar year expense allowance is subject to the cap determined by the
Board.
Alberta Risk Sharing Pools: As determined by the Board in consultation with the
Superintendent of Insurance.
New Brunswick Risk Sharing Pool: As determined by the Board.
Nova Scotia Risk Sharing Pool: As determined by the Board.
Newfoundland & Labrador Risk Sharing Pool: As determined by the Board.
Facility Association Accounting & Statistical Manual Part II RSP - Chapter 9
Revised: July 28, 2017 Page 43
e) Net Premiums – Transferred premiums less expense allowance.
f) Earned Premiums – The earned portion of the transferred premium.
g) Paid Claims – The Reported Paid Claims amount is the sum of the loss and the expense
payments transferred by the Member, each multiplied by the transfer percentage
applicable to the risk.
The Shared Paid Claims is a similar amount, representing the share of the Member in the
total of all Risk Sharing Pool Paid Claim.
h) Outstanding Claims – The Reported Outstanding Claims amount is the amount transferred
by the Member to the Risk Sharing Pool.
The Shared Outstanding Claims is a similar amount, representing the share of the Member
in the total of all the Risk Sharing Pool Outstanding claims, including the I.B.N.R. (including
actuarial present values).
i) Incurred Claims – Paid claims plus outstanding claims.
j) Earned Claims Ratio – Incurred claims to earned premiums.
Note that a comparison between the Reported Earned Claims Ratio and the Share
Earned Claims Ratio indicates how the portfolio which the Member has transferred to
the Risk Sharing Pool has fared in relation to the portfolio transferred by all Members.
I.B.N.R. estimates (including actuarial present values) are included in the “Share”
outstanding Claims figures only.
k) Administration Expense – Each member’s share of the total of the Risk Sharing Pool
operating and administrative expenses.

Facility Association Accounting & Statistical Manual Part II RSP - Chapter 10
Revised: September 22, 2021 Page 44
Chapter 10 Miscellaneous
10.1 Retention of Records
The retention of records by any member relating to the subject matter of the Plan of Operation which
includes the Risk Sharing Pool, must follow the Statutory Requirements as set out for Insurance
Companies at the Provincial and Federal level. In addition, records supporting the transmission of
data to the Risk Sharing Pool shall be retained for at least a seven-year period.
10.2 Special Remittance
This refers to an amount that may be immediately payable by the Risk Sharing Pool to a member as
a result of the member having paid a single loss recoverable from the Risk Sharing Pool in excess of
$100,000. (The amount recoverable will be reviewed and determined from time to time by the Board
of Directors).
When the total amount paid by the Member and recoverable (net) through the Risk Sharing Pool in
respect of any one accident exceeds $100,000, the Member may at its discretion submit a Special
Remittance as outlined in B. Operating Principles Part IV Section 4-C of the Plan of Operation to be
paid immediately upon submission of the following information by correspondence:
Policy information including policy number, effective and termination dates, risk
classification, date-of-loss and coverage kind and a copy or copies (photocopies are
acceptable) of the claims payment cheques(s) for which the Special Remittance is requested.
The Risk Sharing Pool will examine the information and upon satisfaction that the Loss is within the
authority of the Pool will immediately reimburse the member and enter the particulars of the Special
Remittance in the appropriate accounting record.
10.3 Risk Sharing Pools Expense Allowance
Ontario Risk Sharing Pool
Facility Association Accounting & Statistical Manual Part II RSP - Chapter 10
Revised: September 22, 2021 Page 45
The Board of Directors will review the Expense Factors annually, prior to August 31st, and make the
necessary revisions where required and also establish the Maximum Expense Factor which shall then
appear as item (B) on the Expense Factor Form to be used for the following calendar year. The Net
Expense Factor will be calculated as item (A) on the form, as per the Instructions. The Expense Factor
Allowance to be used by the Member will be the lesser of (A) or (B).
In order to determine the expense allowance applicable to the Member’s transferred business, the
Member must complete an Expense Factor Form (Exhibit 10-A) and forward it to the Risk Sharing
Pool by September 30th annually.
Alberta Risk Sharing Pool
Expense allowance factor for each calendar year will be determined by the Board in consultation
with the Superintendent of Insurance prior to the October 31st of the preceding year.
New Brunswick Risk Sharing Pool
Expense allowance factor for each calendar year will be determined by the Board prior to the
October 31st of the preceding year.
Nova Scotia Risk Sharing Pool
Expense allowance factor for each calendar year will be determined by the Board prior to the
October 31st of the preceding year.
Newfoundland & Labrador Risk Sharing Pool
Expense allowance factor for each calendar year will be determined by the Board prior to the
October 31st of the preceding year.
The Expense allowance factor becomes applicable on the January 1st for the calendar year.
Facility Association Accounting & Statistical Manual Part III UAF
Revised: October 17, 2014 Page 46
PART III
UNINSURED AUTOMOBILE FUNDS
Facility Association Accounting & Statistical Manual Part III UAF - Overview
Page 47
Overview – Uninsured Automobile Funds
Uninsured Automobile Funds
The Uninsured Automobile Funds (UAFs) for New Brunswick, Newfoundland and Labrador, Prince Edward
Island and Nova Scotia, fund valid claims for damages made by persons who cannot obtain satisfaction
for damages under a contract of automobile insurance and where there is no other insurance or where
other insurance is inadequate with respect to the damages claimed.
The UAFs commenced operations as follows:
in New Brunswick on March 1, 1990;
in Newfoundland and Labrador on July 1, 1994;
in Prince Edward Island on July 14, 1994; and
in Nova Scotia on July 1, 1996.
The UAFs are governed by the respective provincial insurance acts. The responsibilities of the Facility
Association are to manage claims recording, adjustment and payment processes, to allocate to members
their share of the experience and to assess members to fund underwriting deficits.
Judgement Recovery
The Facility Association, acting on behalf of its members, entered into a Transfer and Assumption
Agreement as at January 1, 2020 (the “Agreement”) with Judgement Recovery (N.S.) Ltd. (“JRNS”) and
administration of the funds to be recovered from the judgement debtors was moved from JRNS to the
Association. JRNS was an enterprise which had been formed by, and administered under, the statute “An
Act to Incorporate Judgment Recovery (N.S.) Ltd - 1989”. Its role was to pay judgments arising out of
automobile accidents to the limits and on the terms and conditions prescribed in the Motor Vehicle Act,
and then to assume the creditor rights against the uninsured parties. With the creation of the Nova Scotia
UAF on July 1, 1996, (administered by the Association), the handling of Uninsured Automobile Claims
moved from the JRNS to the Association. JRNS continued as a legal entity, administering the ongoing
collection of payments from pre-1996 claims until it ceased operations on January 1, 2020. The Agreement
provided the Association with control of assets under administration, less the costs to wind up the JRNS,
Revised: September 22, 2021
Facility Association Accounting & Statistical Manual Part III UAF - Overview
Revised: September 22, 2021 Page 48
as well as rights against remaining debtors. The members who funded the costs related to JRNS are the
same members who share in the costs of the Nova Scotia UAF, therefore, the rights and obligations of the
Association’s members remain substantially unchanged. The impact of the Agreement to the
Association’s financial statements is trivial as these judgments are over 20 years old and hence statute
barred.
Facility Association Accounting & Statistical Manual Part III UAF - Chapter 11
Revised: September 22, 2021 Page 49
Chapter 11 General Description of Data Processing,
Accounting & Reporting Responsibilities - UAF
11.1 Facility Association
The following outlines the data processing, accounting and reporting responsibilities of the Facility
Association in managing the Uninsured Automobile Funds:
1. Administer Bank accounts for the Uninsured Automobile Funds
2. Bill and collect assessments with members when due
3. Collect funds regarding judgement recovery funds and distribute to members
4. Report participation experience quarterly and update share ratio of the members annually
5. Maintain necessary controls, books, ledgers
6. Review claim invoices for validity
7. Ensure the effectiveness of internal control procedures
11.2 All Facility Association Members
The following outlines the data processing, accounting and reporting responsibilities of the
Members of the Uninsured Automobile Funds:
1. Record in their books their share of reported participation experience as direct business
2. Remit assessments when due
3. Accurate transmission of data
The Facility Association communicates with members via “F” bulletins which are posted on the
Facility Association’s website.
Facility Association Accounting & Statistical Manual Part III UAF - Chapter 12
Revised: December 1, 2017 Page 50
Chapter 12 Members’ Participation in Uninsured Automobile
Funds’ Results
12.1 Calculation of Members’ Share of Uninsured Automobile Funds’ Results
At the end of each fiscal year, profit or loss for each class of business, Uninsured Automobile
Funds, shall be determined separately for each accident year in each jurisdiction in accordance
with accounting procedures approved by the Board of Directors.
Calculations for an accident year shall include all policies earned during such calendar year. Profit
shall be credited or distributed to each member and loss shall be charged against or collected
from each member in accordance with the member’s appropriate participation ratio.
Each member’s participation ratios for an accident year shall be in accordance with the Plan of
Operation, Article V-Participation Ratios and Sharing, Sections 3 (e).
12.2 Member Participation Statement
The Facility Association's Central Office will produce a quarterly Participation Statement for each
Uninsured Automobile Funds for each member. The report (see Exhibit 11-A for sample report) will
in particular display, by current fiscal year and accident years, the member's shares of the following
amounts:
Paid loss
Subrogation
Servicing Fee
Legal Expense
General Administration
Member Participation statements are available on the Facility Association Portal at
Facility Association Accounting & Statistical Manual Part III UAF - Chapter 12
Revised: September 22, 2021 Page 51
https://portal.facilityassociation.com/.
The headings below correspond to those used in the sample Report shown as Exhibit 14-A.
a) Industry Earned Premium
b) Member Earned Premium
c) Member Sharing Ratio Percentage
d) Operating Results
- This Period
- Years to Date
e) Share (Year to Date)
f) Share (Previous Period)
g) Share (This Period)
h) Statement of Financial Position items
- Outstanding Losses
- IBNR Provision (including Actuarial Present Values)
- OS Losses Including IBNR (including Actuarial Present Values)
i) Net assessment
The target date for the release of each Participation Report is within 25 business days after the
close of the reporting quarter. Members are advised via bulletin that the reports are available on
the FA Portal.
Facility Association Accounting & Statistical Manual Resources Available to
Servicing Carriers and Members
Revised: September 22, 2021 Page 52
Resources available to Servicing Carriers and Members
1. Facility Association website: http://www.facilityassociation.com/
2. Facility Association portal
3. Plan of Operation
4. Manuals:
Manuals of Rules and Rates
Risk Sharing Pool Eligibility Manuals
FARM Claims Guides
RSP Claims Guide
Accounting and Statistical Manual
5. User Guide
FARM
FARM Participation Report User Guide
FARM Government Line Report User Guide
RSPs
RSP’s Operational Report User Guide
RSP’s Government Line Report User Guide
Facility Association Accounting & Statistical Manual Exhibits
Revised: September 22, 2021 Page 53
EXHIBITS
Exhibit 1-A Facility Association Servicing Carrier Agreement
Exhibit 3-A Servicing Carrier Trial Balance Accounts
Exhibit 3-B Trial Balance of Servicing Carrier General Ledger
Exhibit 3-C Monthly Cash Analysis and Bank Reconciliation
Exhibit 3-D Monthly Request for Service Fees
Exhibit 3-E Aged Premium Receivable Report
Exhibit 3-F Cash Transfer Confirmation
Exhibit 3-G Agent Commission, and Written Premium Report
Exhibit 3-H Commission Adjustment Report by Servicing Carrier
Exhibit 3-I Aged Premiums Receivable Summary
Exhibit 3-J Unclaimed Property Guidelines and Procedures
Exhibit 3-K Servicing Carrier Unclaimed Property
Exhibit 6-A FARM Monthly (Accident Year) Member Participation Report
Exhibit 6-B FARM Government Line Report
Exhibit 9-A RSP Operational Report
Exhibit 9-B RSP Government Line Report
Exhibit 9-C RSP Management Information Report
Exhibit 10-A Ontario Expense Factor
Exhibit 11-A UAF Member Participation Statement
EXHIBIT 1-A
Facility Association
Servicing Carrier Agreement
(Eff. January 1, 2013) page 1 of 12
FACILITY ASSOCIATION
SERVICING CARRIER AGREEMENT entered into this [ ] day of[ ], 201[ ] between
THE FACILITY ASSOCIATION (the “F.A.”) and [NAME OF CARRIER] (the “Servicing
Carrier”).
In accordance with the applicable legislation and Plan of Operation and related
documents under which the F.A. was created and presently operates (collectively called the “Plan”),
the Board of Directors of the F.A. (the “Board”) has designated the Servicing Carrier as one of the
authorized insurers as a Servicing Carrier for the F.A. in. [NAME(S) OF JURISDICTION]
The Servicing Carrier has agreed to such appointment and this Agreement is being executed to
confirm the understandings and agreements between the parties.
ARTICLE I
APPOINTMENT
The F.A. hereby confirms the designation of INTACT FINANCIAL CORPORATION
to be a Servicing Carrier to provide, pursuant to this Agreement and to the Plan and the applicable
legislation, the following services (collectively called the “Facility Association Services”): policy
services, claims services and all other services to be performed by the Servicing Carrier under the
Plan and the law, including, without limitation, underwriting, policy issuance, premium collection,
accounting, statistical and record-keeping services, claims investigation, handling, adjusting,
defence and payment and a current Business Continuity Plan and Volume Change Plan as approved
by Facility Association. By the execution hereof, the Servicing Carrier acknowledges its agreement
to act as a Servicing Carrier and agrees to be bound by and to carry out all of the obligations
imposed upon it under this Agreement, the Plan and all applicable legislation and agrees to be
bound by the terms and conditions thereof.
(Eff. January 1, 2013) page 2 of 12
ARTICLE II
TERM
The appointment of the Servicing Carrier commenced on the [ ] day of[ ],
201[ ], and shall continue until the Agreement has been validly terminated.
ARTICLE III
POWERS AND DUTIES OF SERVICING CARRIER
Section 3.1 The Servicing Carrier in addition to carrying out all of its obligations as
aforesaid shall administer the activities of all Agents/Brokers assigned to it in accordance with the
Plan. The Servicing Carrier agrees with the F.A. that it shall perform all of its obligations under
any contract entered into between it, the F.A. and any Agent or Broker (the Agent/Broker
Agreement) and agrees that any failure to meet any of its obligations thereunder or any failure by it
to cause any Agent or Broker to meet his or its obligations to the Servicing Carrier thereunder shall
constitute a breach of this agreement and shall entitle F.A. to take such steps as may be necessary to
enforce compliance with any such obligation. The Servicing Carrier shall promptly notify the F.A.
of the failure or refusal of any Agent/Broker to comply with any provision of the Plan, the
Agent/Broker Agreement or of any applicable legislation where such failure to comply has arisen in
the context of its F.A. business, and where such non-compliance is such that the Servicing Carrier
knew, or reasonably ought to have known, of its occurrence.
Section 3.2 The Servicing Carrier shall comply with all of the terms and conditions of
the Plan and with all written bulletins or directives issued by the F.A., and, in the event of any
conflict or difference between any of the foregoing and the operating procedures of or the method
of performing services by the Servicing Carrier in the voluntary market, the terms of the Plan and
all such bulletins and directives issued by the F.A. shall be followed and complied with in
connection with all F.A. business.
The Servicing Carrier shall designate, in writing, the person or persons within its
organization to whom all correspondence, bulletins, circulars and related material shall be sent by
the F.A.

(Eff. January 1, 2013) page 3 of 12
Section 3.3 The Servicing Carrier shall carry out and perform all F.A. Services in
compliance with the Service Standards prescribed by Section 2 of Part II of the Operating Principles
of the Plan and the requirements of any applicable legislation and shall exercise due care and
diligence in connection therewith.
Section 3.4 The Servicing Carrier shall cause an audit of its F.A. business to be
conducted annually in accordance with the terms of engagement prescribed by the F.A. and shall
provide the results of such audit within seventy-five days following the F.A.’s fiscal year end or as
may be prescribed by the F.A.
Section 3.5 The Servicing Carrier shall cooperate fully with all officers, employees and
other representatives of the F.A. during audits, investigations or examinations made and conducted
by them and shall permit such persons to have full access, during normal business hours, to all
books and records of the Servicing Carrier pertaining to its F.A. business.
Section 3.6 The Servicing Carrier shall submit to the F.A., at such intervals as shall be
requested by the F.A., the request for service fees that are allowed for the performance of the F.A.
Services, such report to contain the information called for by any uniform operating expense form
adopted by the F.A., as the same presently exists or may hereafter be modified.
Section 3.7 The Servicing Carrier shall implement all changes, revisions, amendments and
modifications in rates and rules as are lawfully effected by the F.A. at such time or times as the F.A.
shall direct.
ARTICLE IV
RELATIONS OF THE PARTIES
Section 4.1 The Servicing Carrier shall be an independent contractor, performing its
F.A. Services free from any supervision or control by the F.A. except such supervision and control
as may be exercised by the F.A. in connection with enforcing compliance with the Plan and the
applicable legislation.
Section 4.2 With respect to the F.A. and the member insurers of the F.A., the Servicing
Carrier shall be a fiduciary in the handling of all F.A. funds.
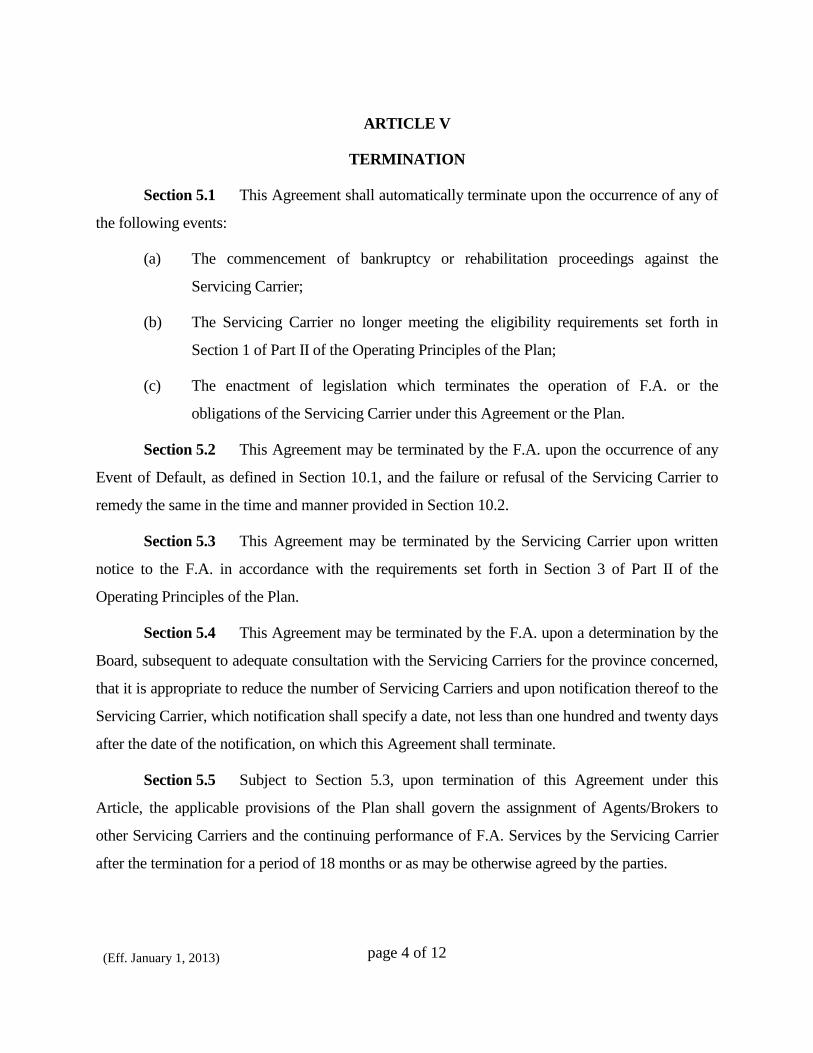
(Eff. January 1, 2013) page 4 of 12
ARTICLE V
TERMINATION
Section 5.1 This Agreement shall automatically terminate upon the occurrence of any of
the following events:
(a) The commencement of bankruptcy or rehabilitation proceedings against the
Servicing Carrier;
(b) The Servicing Carrier no longer meeting the eligibility requirements set forth in
Section 1 of Part II of the Operating Principles of the Plan;
(c) The enactment of legislation which terminates the operation of F.A. or the
obligations of the Servicing Carrier under this Agreement or the Plan.
Section 5.2 This Agreement may be terminated by the F.A. upon the occurrence of any
Event of Default, as defined in Section 10.1, and the failure or refusal of the Servicing Carrier to
remedy the same in the time and manner provided in Section 10.2.
Section 5.3 This Agreement may be terminated by the Servicing Carrier upon written
notice to the F.A. in accordance with the requirements set forth in Section 3 of Part II of the
Operating Principles of the Plan.
Section 5.4 This Agreement may be terminated by the F.A. upon a determination by the
Board, subsequent to adequate consultation with the Servicing Carriers for the province concerned,
that it is appropriate to reduce the number of Servicing Carriers and upon notification thereof to the
Servicing Carrier, which notification shall specify a date, not less than one hundred and twenty days
after the date of the notification, on which this Agreement shall terminate.
Section 5.5 Subject to Section 5.3, upon termination of this Agreement under this
Article, the applicable provisions of the Plan shall govern the assignment of Agents/Brokers to
other Servicing Carriers and the continuing performance of F.A. Services by the Servicing Carrier
after the termination for a period of 18 months or as may be otherwise agreed by the parties.
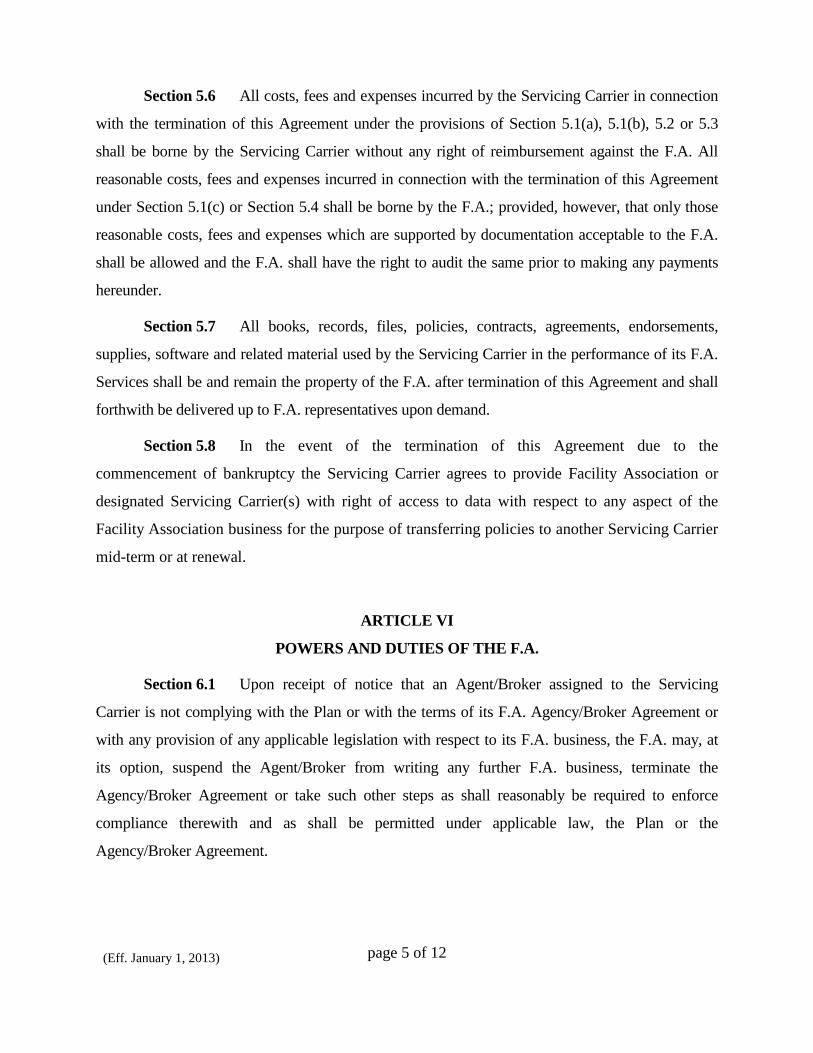
(Eff. January 1, 2013) page 5 of 12
Section 5.6 All costs, fees and expenses incurred by the Servicing Carrier in connection
with the termination of this Agreement under the provisions of Section 5.1(a), 5.1(b), 5.2 or 5.3
shall be borne by the Servicing Carrier without any right of reimbursement against the F.A. All
reasonable costs, fees and expenses incurred in connection with the termination of this Agreement
under Section 5.1(c) or Section 5.4 shall be borne by the F.A.; provided, however, that only those
reasonable costs, fees and expenses which are supported by documentation acceptable to the F.A.
shall be allowed and the F.A. shall have the right to audit the same prior to making any payments
hereunder.
Section 5.7 All books, records, files, policies, contracts, agreements, endorsements,
supplies, software and related material used by the Servicing Carrier in the performance of its F.A.
Services shall be and remain the property of the F.A. after termination of this Agreement and shall
forthwith be delivered up to F.A. representatives upon demand.
Section 5.8 In the event of the termination of this Agreement due to the
commencement of bankruptcy the Servicing Carrier agrees to provide Facility Association or
designated Servicing Carrier(s) with right of access to data with respect to any aspect of the
Facility Association business for the purpose of transferring policies to another Servicing Carrier
mid-term or at renewal.
ARTICLE VI
POWERS AND DUTIES OF THE F.A.
Section 6.1 Upon receipt of notice that an Agent/Broker assigned to the Servicing
Carrier is not complying with the Plan or with the terms of its F.A. Agency/Broker Agreement or
with any provision of any applicable legislation with respect to its F.A. business, the F.A. may, at
its option, suspend the Agent/Broker from writing any further F.A. business, terminate the
Agency/Broker Agreement or take such other steps as shall reasonably be required to enforce
compliance therewith and as shall be permitted under applicable law, the Plan or the
Agency/Broker Agreement.

(Eff. January 1, 2013) page 6 of 12
Section 6.2 The F.A. shall comply with all of the provisions of the Plan and carry out
and perform all obligations and meet all liabilities imposed upon it under the Plan and this
Agreement, including the prompt payment to the Servicing Carrier of all fees, allowances and other
reimbursements to which the Servicing Carrier is entitled.
Section 6.3 The F.A. shall promptly notify the Servicing Carrier in writing of all
amendments or supplements to the Plan.
Section 6.4 The F.A. shall handle all filings of its rates and rules with the appropriate
authorities.
Section 6.5 The F.A. shall monitor the performance of the Servicing Carrier to assure
that services are performed in accordance with the Service Standards and the applicable legislation
and at reasonable cost to the F.A.’s member insurers, and, in connection therewith, shall audit, or
cause to be audited, each Servicing Carrier with such frequency and in such detail as it shall
determine. Copies of such audits shall be furnished to the Audit Committee of the F.A. and to the
Servicing Carrier.
Section 6.6 Upon determination by the Board and adequate consultation with Servicing
Carriers for the jurisdiction concerned, the assignment of new brokers may, on a non-arbitrary and
commercially reasonable basis, be realigned among Servicing Carriers.
ARTICLE VII
COMPENSATION
Section 7.1 In consideration of the performance by the Servicing Carrier of its
obligations, the Servicing Carrier shall be paid the applicable fees, allowances, cost reimbursements
and other compensation set forth in the Plan as in force from time to time. The F.A. reserves the
right to revise the amounts, methods of computation, times and manner of payment and the
components thereof at any time and from time to time. Any such revision shall be effective upon
approval by the Membership pursuant to the Plan, and written notification thereof to the Servicing
Carrier, at least one hundred and twenty days prior to the implementation of the revised program.
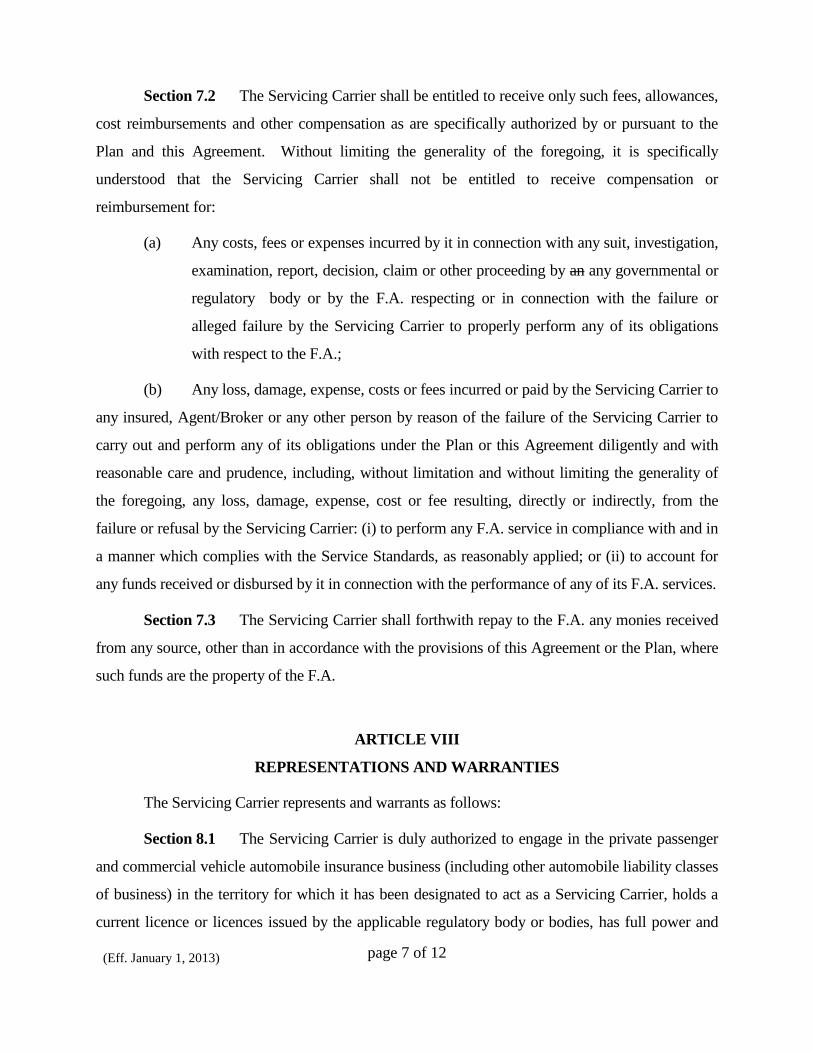
(Eff. January 1, 2013) page 7 of 12
Section 7.2 The Servicing Carrier shall be entitled to receive only such fees, allowances,
cost reimbursements and other compensation as are specifically authorized by or pursuant to the
Plan and this Agreement. Without limiting the generality of the foregoing, it is specifically
understood that the Servicing Carrier shall not be entitled to receive compensation or
reimbursement for:
(a) Any costs, fees or expenses incurred by it in connection with any suit, investigation,
examination, report, decision, claim or other proceeding by an any governmental or
regulatory body or by the F.A. respecting or in connection with the failure or
alleged failure by the Servicing Carrier to properly perform any of its obligations
with respect to the F.A.;
(b) Any loss, damage, expense, costs or fees incurred or paid by the Servicing Carrier to
any insured, Agent/Broker or any other person by reason of the failure of the Servicing Carrier to
carry out and perform any of its obligations under the Plan or this Agreement diligently and with
reasonable care and prudence, including, without limitation and without limiting the generality of
the foregoing, any loss, damage, expense, cost or fee resulting, directly or indirectly, from the
failure or refusal by the Servicing Carrier: (i) to perform any F.A. service in compliance with and in
a manner which complies with the Service Standards, as reasonably applied; or (ii) to account for
any funds received or disbursed by it in connection with the performance of any of its F.A. services.
Section 7.3 The Servicing Carrier shall forthwith repay to the F.A. any monies received
from any source, other than in accordance with the provisions of this Agreement or the Plan, where
such funds are the property of the F.A.
ARTICLE VIII
REPRESENTATIONS AND WARRANTIES
The Servicing Carrier represents and warrants as follows:
Section 8.1 The Servicing Carrier is duly authorized to engage in the private passenger
and commercial vehicle automobile insurance business (including other automobile liability classes
of business) in the territory for which it has been designated to act as a Servicing Carrier, holds a
current licence or licences issued by the applicable regulatory body or bodies, has full power and
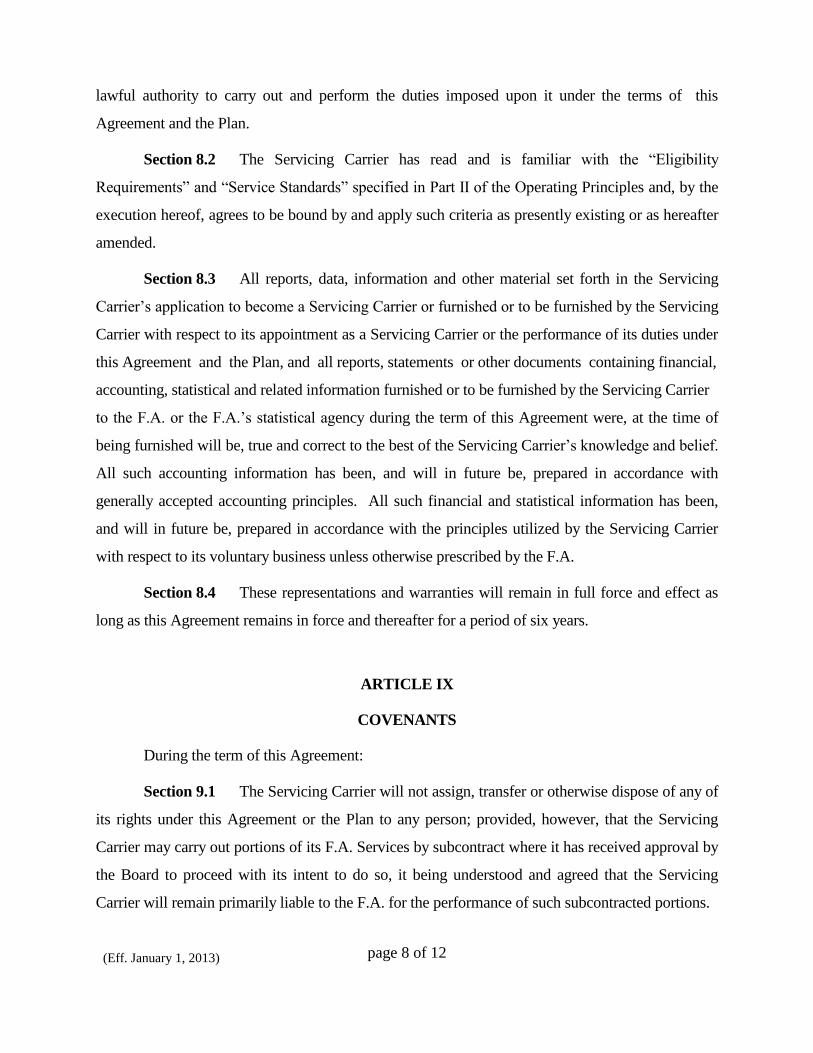
(Eff. January 1, 2013) page 8 of 12
lawful authority to carry out and perform the duties imposed upon it under the terms of this
Agreement and the Plan.
Section 8.2 The Servicing Carrier has read and is familiar with the “Eligibility
Requirements” and “Service Standards” specified in Part II of the Operating Principles and, by the
execution hereof, agrees to be bound by and apply such criteria as presently existing or as hereafter
amended.
Section 8.3 All reports, data, information and other material set forth in the Servicing
Carrier’s application to become a Servicing Carrier or furnished or to be furnished by the Servicing
Carrier with respect to its appointment as a Servicing Carrier or the performance of its duties under
this Agreement and the Plan, and all reports, statements or other documents containing financial,
accounting, statistical and related information furnished or to be furnished by the Servicing Carrier
to the F.A. or the F.A.’s statistical agency during the term of this Agreement were, at the time of
being furnished will be, true and correct to the best of the Servicing Carrier’s knowledge and belief.
All such accounting information has been, and will in future be, prepared in accordance with
generally accepted accounting principles. All such financial and statistical information has been,
and will in future be, prepared in accordance with the principles utilized by the Servicing Carrier
with respect to its voluntary business unless otherwise prescribed by the F.A.
Section 8.4 These representations and warranties will remain in full force and effect as
long as this Agreement remains in force and thereafter for a period of six years.
ARTICLE IX
COVENANTS
During the term of this Agreement:
Section 9.1 The Servicing Carrier will not assign, transfer or otherwise dispose of any of
its rights under this Agreement or the Plan to any person; provided, however, that the Servicing
Carrier may carry out portions of its F.A. Services by subcontract where it has received approval by
the Board to proceed with its intent to do so, it being understood and agreed that the Servicing
Carrier will remain primarily liable to the F.A. for the performance of such subcontracted portions.

(Eff. January 1, 2013) page 9 of 12
Section 9.2 In the performance of its duties hereunder, or under the Plan, the Servicing
Carrier will not knowingly engage in any activity which is unlawful under any applicable
legislation.
Section 9.3 The Servicing Carrier will not knowingly do or perform, or refrain from
doing or performing, any act or thing so as to be in violation of this Agreement, the Plan or any
applicable legislation and thus subject the F.A., any member of the Board or any officer or
employee of the F.A. to any civil liability or criminal penalty. The Servicing Carrier agrees to
indemnify and hold the F.A. harmless from any civil liability, or any penalty or fine imposed as a
result of any breach of the foregoing obligation. The foregoing “indemnification and hold harmless”
agreement shall not apply to liabilities incurred through the reasonable action or inaction of the
Servicing Carrier where the course of conduct is undertaken in a reasonable and good-faith belief
that the Servicing Carrier was acting in accordance with all of the applicable rules and with the
Plan.
Section 9.4 The Servicing Carrier will not pay out or disburse any F.A. funds of any
purpose or to any person other than as specifically permitted or contemplated by the Plan or this
Agreement.
Section 9.5 These covenants will remain in force for as long as this Agreement remains
in force and hereafter for a period of six years.
ARTICLE X
NONPERFORMANCE BY SERVICING CARRIER
Section 10.1 Any of the following events shall be an ‘Event of Default” hereunder:
(a) The disclosure by any audit of the Servicing Carrier that the Servicing Carrier has
failed to perform its F.A. Services in compliance with the Service Standards, the Plan or any
applicable legislation;
(b) A default by the Servicing Carrier in the performance of any material obligation or
in the meeting of any liability imposed upon it under this Agreement, the Plan or any applicable
legislation.

(Eff. January 1, 2013) page 10 of 12
Section 10.2 The F.A. shall notify the Servicing Carrier of any Event of Default of which
the F.A. becomes aware. Such notification shall specify the relevant facts and other details giving
rise to the Event of Default and, where possible and deemed advisable by the F.A., shall set forth a
reasonable and practical method and time for remedying the same. If the Servicing Carrier fails to
remedy the Event of Default in the time set forth in such notice, the F.A. may terminate this
Agreement by notice in writing, which notice shall specify the date of termination and such other
matters respecting the procedures to be followed in connection therewith as the F.A. shall
reasonably determine.
Section 10.3 The F.A. shall have the right, without advising the Servicing Carrier, to
communicate directly with any regulatory body or representative or official thereof in connection
with any matter concerning the Servicing Carrier’s performance or alleged or suspected failure to
perform its duties under the Plan or any applicable legislation, and either the F.A. or the Servicing
Carrier may, at its own cost and expense, initiate such action, suit or other proceeding or assert or
file such protest, answer or other defence as it may decide advisable with respect to any existing or
proposed rule, regulation, report, examination or finding issued or made by any legislative or
regulatory body which touches upon the performance by the Servicing Carrier of the F.A. Services
or which might adversely affect its standing or right to continue as a Servicing Carrier or might
expose either to any fine, penalty or civil liability.
ARTICLE XI
MISCELLANEOUS
Section 11.1 This Agreement shall be construed, interpreted and applied in accordance
with the laws of the Province of Ontario.
Section 11.2 Where used in this Agreement the term:
(a) “Plan” shall mean and include the F.A. Articles of Association and Operating
Principles, the Accounting and Statistical Manual and the Manual of Rules and Rates, and all
amendments, modifications and revisions made thereto from time to time;
(Eff. January 1, 2013) page 11 of 12
(b) “F.A.” shall mean Facility Association and shall include its Board of Directors and
any committee established pursuant to the Plan;
(c) “Agreement” shall mean this Servicing Carrier Agreement and any amendments,
modifications or additions made thereto from time to time.
Section 11.3 Nothing contained in this Agreement shall impose upon the Servicing
Carrier the obligation to perform services which are different in any material respect from the
services performed by the Servicing Carrier for its insureds in the voluntary market except as
required by the provisions of this Agreement, the Plan or any applicable legislation.
Section 11.4 Any notice or communication required to be furnished to the F.A. hereunder
or under the Plan shall be in writing and shall be delivered either by hand or by first class mail
addressed to the F.A. at 777 Bay Street, Suite 2400, 24th Floor, Toronto, Ontario M5G 2C8 or to
such other address as may be directed in writing. Any notice or communication required to be
given to the Servicing Carrier hereunder or under the Plan or under any applicable legislation shall
be delivered either by hand or in person or by mail addressed to the Servicing Carrier at its head
office or to such other address as it may have in writing directed.
Section 11.5 Neither this Agreement nor any term hereof may be changed, waived,
discharged, amended or terminated orally, but only by a document in writing signed by either or
both of the parties as appropriate.
Section 11.6 In the event that any article, section, sentence or clause of this Agreement
shall be declared invalid, illegal or unenforceable in any respect, the validity of the remaining terms
and provisions hereof and of the Plan shall in no way be affected or disturbed and such invalid,
illegal or unenforceable provision shall be severable from the balance of the Agreement.
Section 11.7 In the event the Servicing Carrier shall consider itself to be aggrieved as the
result of any action or failure to act of the F.A. under this Agreement or the Plan, the Board shall,
upon written demand by the Servicing Carrier specifying the details of such action or failure to act,
hear and determine all matters in connection therewith or relating thereto.
(Eff. January 1, 2013) page 12 of 12
Section 11.8 This Agreement may be executed in several counterparts, each of which
shall be deemed an original, but all of which together shall constitute one and the same instrument.
Section 11.9 This Agreement is between the F.A. and the Servicing Carrier and no F.A.
insured, agent/broker, claimant or other person not a party to this Agreement, having or asserting a
claim against either the F.A., the Servicing Carrier or any agent or broker, shall have or acquire any
rights by reason of the execution and delivery of this Agreement.
Section 11.10 In the event of a conflict between this Agreement and the terms of the Plan,
the terms of the Plan shall govern.
This contract replaces all prior previous contracts or agreements.
IN WITNESS WHEREOF this Agreement has been duly signed, sealed and
delivered by the Parties the day and year above written.
Witnesses: THE FACILITY ASSOCIATION:
__________________________________ By: __________________________________
(Title)
__________________________________ And: _________________________________
As to the “F.A.” (Title)
Date: _________________________________
__________________________________ ___________________________________
(Servicing Carrier)
__________________________________ By: __________________________________
As to the “Servicing Carrier” (Title)
And: _________________________________
(Title)
Date: _________________________________
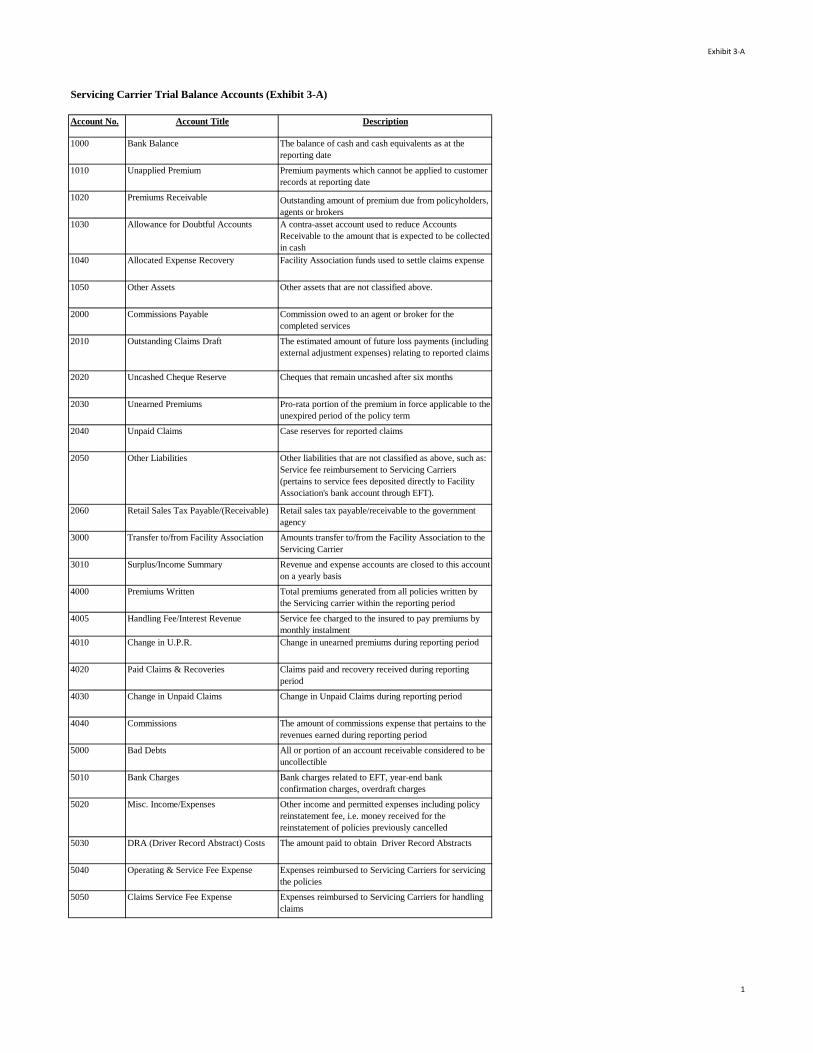
Exhibit 3-A
Servicing Carrier Trial Balance Accounts (Exhibit 3-A)
Account No. Account Title Description
1000 Bank Balance The balance of cash and cash equivalents as at the
reporting date
1010 Unapplied Premium Premium payments which cannot be applied to customer
records at reporting date
1020 Premiums Receivable Outstanding amount of premium due from policyholders,
agents or brokers
1030 Allowance for Doubtful Accounts A contra-asset account used to reduce Accounts
Receivable to the amount that is expected to be collected
in cash
1040 Allocated Expense Recovery Facility Association funds used to settle claims expense
1050 Other Assets Other assets that are not classified above.
2000 Commissions Payable Commission owed to an agent or broker for the
completed services
2010 Outstanding Claims Draft The estimated amount of future loss payments (including
external adjustment expenses) relating to reported claims
2020 Uncashed Cheque Reserve Cheques that remain uncashed after six months
2030 Unearned Premiums Pro-rata portion of the premium in force applicable to the
unexpired period of the policy term
2040 Unpaid Claims Case reserves for reported claims
2050 Other Liabilities Other liabilities that are not classified as above, such as:
Service fee reimbursement to Servicing Carriers
(pertains to service fees deposited directly to Facility
Association's bank account through EFT).
2060 Retail Sales Tax Payable/(Receivable) Retail sales tax payable/receivable to the government
agency
3000 Transfer to/from Facility Association Amounts transfer to/from the Facility Association to the
Servicing Carrier
3010 Surplus/Income Summary Revenue and expense accounts are closed to this account
on a yearly basis
4000 Premiums Written Total premiums generated from all policies written by
the Servicing carrier within the reporting period
4005 Handling Fee/Interest Revenue Service fee charged to the insured to pay premiums by
monthly instalment
4010 Change in U.P.R. Change in unearned premiums during reporting period
4020 Paid Claims & Recoveries Claims paid and recovery received during reporting
period
4030 Change in Unpaid Claims Change in Unpaid Claims during reporting period
4040 Commissions The amount of commissions expense that pertains to the
revenues earned during reporting period
5000 Bad Debts All or portion of an account receivable considered to be
uncollectible
5010 Bank Charges Bank charges related to EFT, year-end bank
confirmation charges, overdraft charges
5020 Misc. Income/Expenses Other income and permitted expenses including policy
reinstatement fee, i.e. money received for the
reinstatement of policies previously cancelled
5030 DRA (Driver Record Abstract) Costs The amount paid to obtain Driver Record Abstracts
5040 Operating & Service Fee Expense Expenses reimbursed to Servicing Carriers for servicing
the policies
5050 Claims Service Fee Expense Expenses reimbursed to Servicing Carriers for handling
claims
1
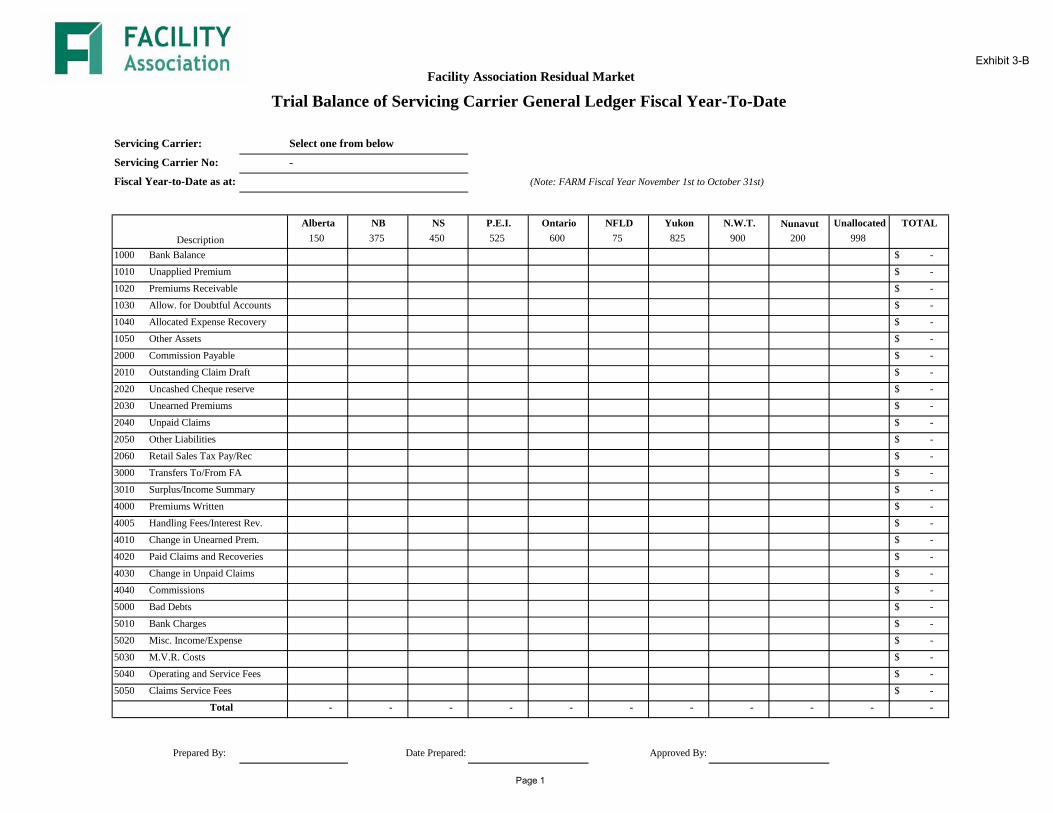
Exhibit 3-B
Page 1
Servicing Carrier:
Servicing Carrier No:
Fiscal Year-to-Date as at: (Note: FARM Fiscal Year November 1st to October 31st)
Alberta NB NS P.E.I. Ontario NFLD Yukon N.W.T. Nunavut Unallocated TOTAL150 375 450 525 600 75 825 900 200 998
1000 -$ 1010 -$ 1020 -$ 1030 Allow. for Doubtful Accounts -$ 1040 Allocated Expense Recovery -$ 1050 -$ 2000 -$ 2010 -$ 2020 -$ 2030 -$ 2040 -$ 2050 -$ 2060 -$ 3000 -$ 3010 -$ 4000 -$ 4005 -$ 4010 -$ 4020 -$ 4030 -$ 4040 -$ 5000 -$ 5010 -$ 5020 -$ 5030 -$ 5040 -$ 5050 -$
- - - - - - - - - - -
Prepared By: Date Prepared: Approved By:
Claims Service FeesTotal
Operating and Service Fees
Surplus/Income SummaryPremiums WrittenHandling Fees/Interest Rev.Change in Unearned Prem.Paid Claims and RecoveriesChange in Unpaid ClaimsCommissions Bad DebtsBank ChargesMisc. Income/ExpenseM.V.R. Costs
Transfers To/From FA
Bank BalanceUnapplied PremiumPremiums Receivable
Other AssetsCommission PayableOutstanding Claim DraftUncashed Cheque reserveUnearned PremiumsUnpaid ClaimsOther LiabilitiesRetail Sales Tax Pay/Rec
Description
Facility Association Residual Market
Trial Balance of Servicing Carrier General Ledger Fiscal Year-To-Date
Select one from below
-
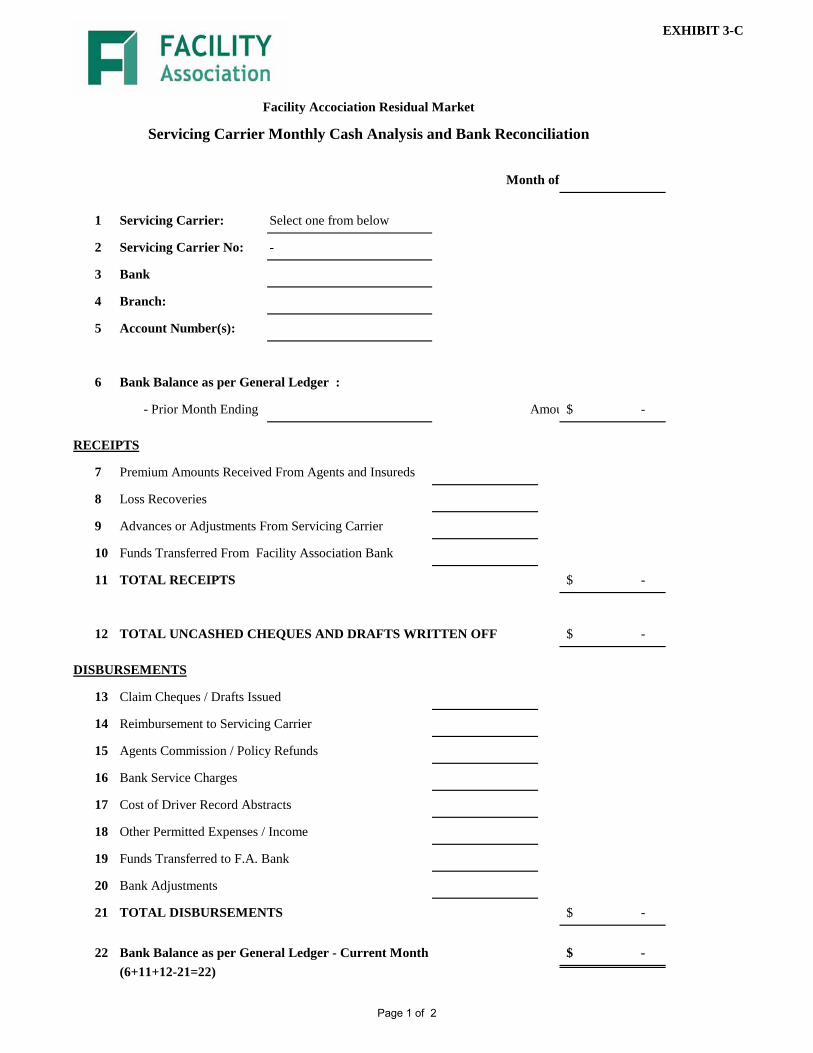
EXHIBIT 3-C
Page 1 of 2
Month of
1 Servicing Carrier: Select one from below
2 Servicing Carrier No: -
3 Bank
4 Branch:
5 Account Number(s):
6 Bank Balance as per General Ledger :
- Prior Month Ending Amou -$
RECEIPTS
7 Premium Amounts Received From Agents and Insureds
8 Loss Recoveries
9 Advances or Adjustments From Servicing Carrier
10 Funds Transferred From Facility Association Bank
11 TOTAL RECEIPTS -$
12 TOTAL UNCASHED CHEQUES AND DRAFTS WRITTEN OFF -$
DISBURSEMENTS
13 Claim Cheques / Drafts Issued
14 Reimbursement to Servicing Carrier
15 Agents Commission / Policy Refunds
16 Bank Service Charges
17 Cost of Driver Record Abstracts
18 Other Permitted Expenses / Income
19 Funds Transferred to F.A. Bank
20 Bank Adjustments
21 TOTAL DISBURSEMENTS -$
22 Bank Balance as per General Ledger - Current Month -$ (6+11+12-21=22)
Facility Accociation Residual Market
Servicing Carrier Monthly Cash Analysis and Bank Reconciliation
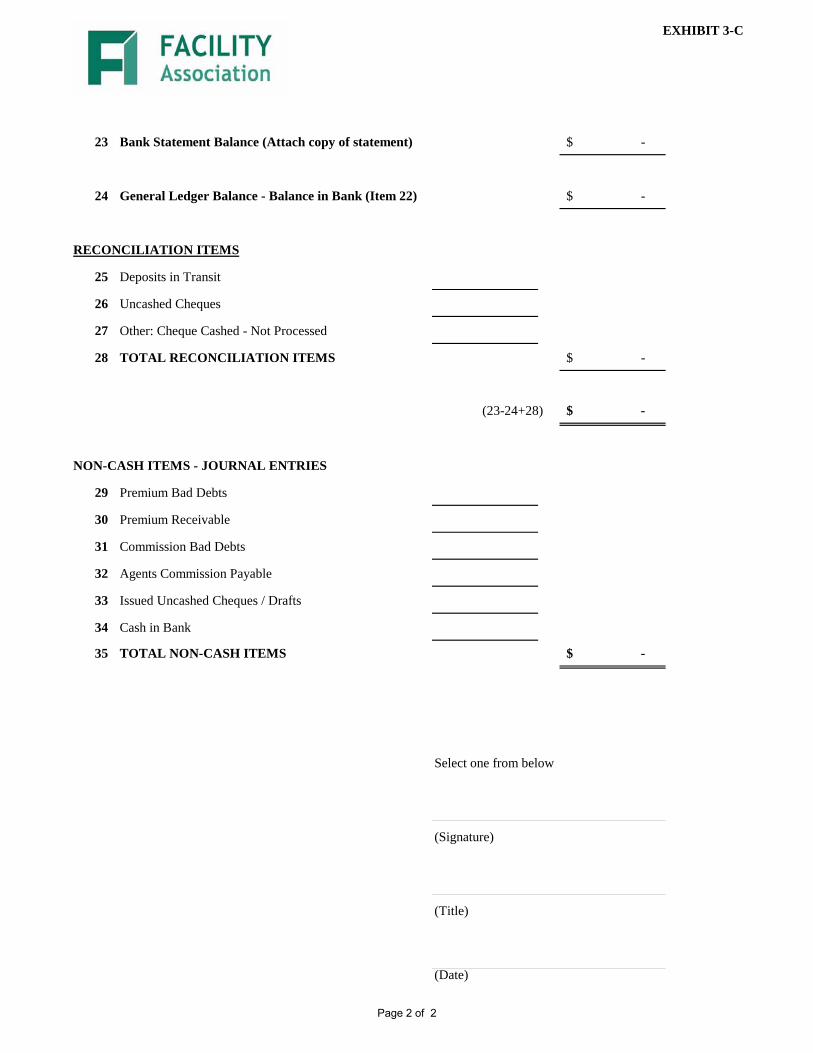
EXHIBIT 3-C
Page 2 of 2
23 Bank Statement Balance (Attach copy of statement) -$
24 General Ledger Balance - Balance in Bank (Item 22) -$
RECONCILIATION ITEMS
25 Deposits in Transit
26 Uncashed Cheques
27 Other: Cheque Cashed - Not Processed
28 TOTAL RECONCILIATION ITEMS -$
(23-24+28) -$
NON-CASH ITEMS - JOURNAL ENTRIES
29 Premium Bad Debts
30 Premium Receivable
31 Commission Bad Debts
32 Agents Commission Payable
33 Issued Uncashed Cheques / Drafts
34 Cash in Bank
35 TOTAL NON-CASH ITEMS -$
Select one from below
(Signature)
(Title)
(Date)

EXHIBIT 3-D
Servicing Carrier:
Servicing Carrier No:
Month of:
Alberta New Brunswick Nova Scotia PEI Ontario Newfoundland Yukon N.W.T Nunavut TOTAL
(1) Written Premiums Excluding -
Premiums Effective in Later Months
(2) Commission on Those Premiums -
(3) Earned Premiums -
(4) Allocated Claims Expense -
OPERATING / SERVICE FEES:
(5) Item #1 Multiplied by % - - - - - - - - - -
(6) Item #1 Multiplied by % - - - - - - - - - -
TOTAL OPERATING / SERVICE FEES -$ -$ -$ -$ -$ -$ -$ -$ -$ -$
CLAIMS SERVICE FEES:
(7) Item #3 Multiplied by % - - - - - - - - - -
(8) Less Allocated Expense - - - - - - - - - -
-$ -$ -$ -$ -$ -$ -$ -$ -$ -$
NET CLAIMS SERVICE FEES
(9) Collection Fee (Not Offset by Recoveries) -
TOTAL FEES DUE SERVICING CARRIER -$ -$ -$ -$ -$ -$ -$ -$ -$ -$
Select one from below
(Signature) (Title)
(Date)
Servicing Carrier Monthly Request For Service Fees
Select one from below
-
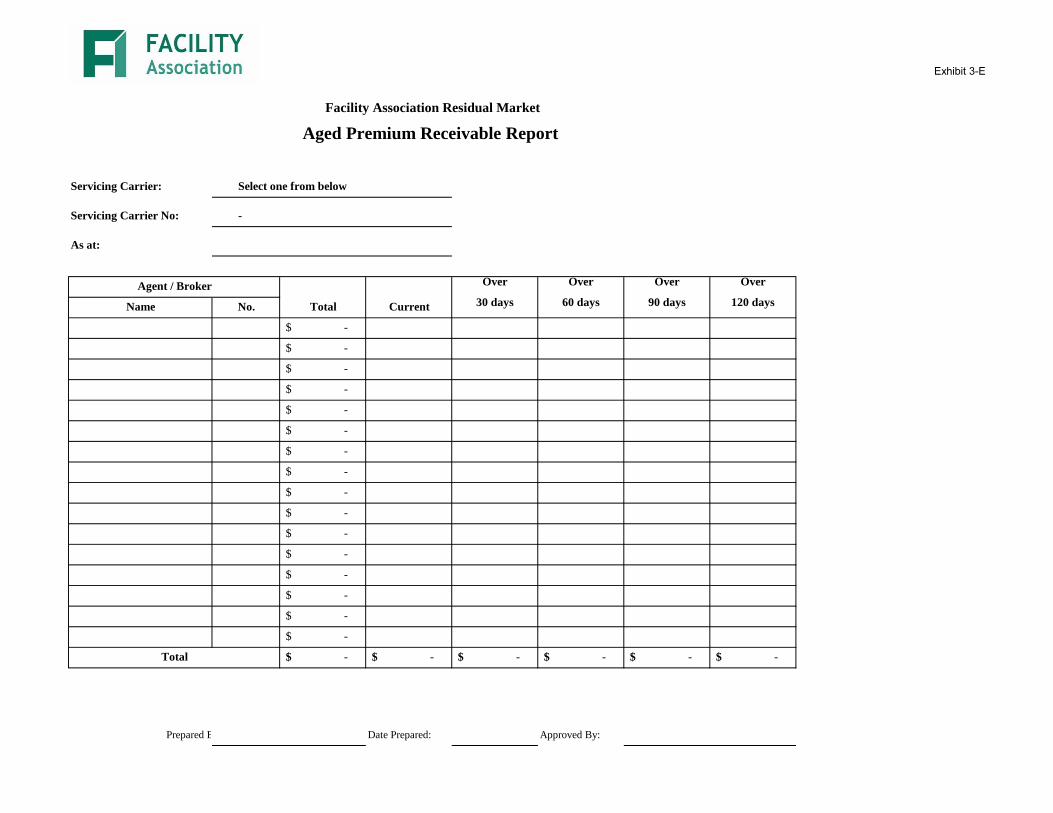
Exhibit 3-E
Servicing Carrier:
Servicing Carrier No:
As at:
Over Over Over Over
Name No. 30 days 60 days 90 days 120 days
-$
-$
-$
-$
-$
-$
-$
-$
-$
-$
-$
-$
-$
-$
-$
-$
-$ -$ -$ -$ -$ -$
Prepared By: Date Prepared: Approved By:
Total
Facility Association Residual Market
Aged Premium Receivable Report
Select one from below
-
Agent / Broker
Total Current
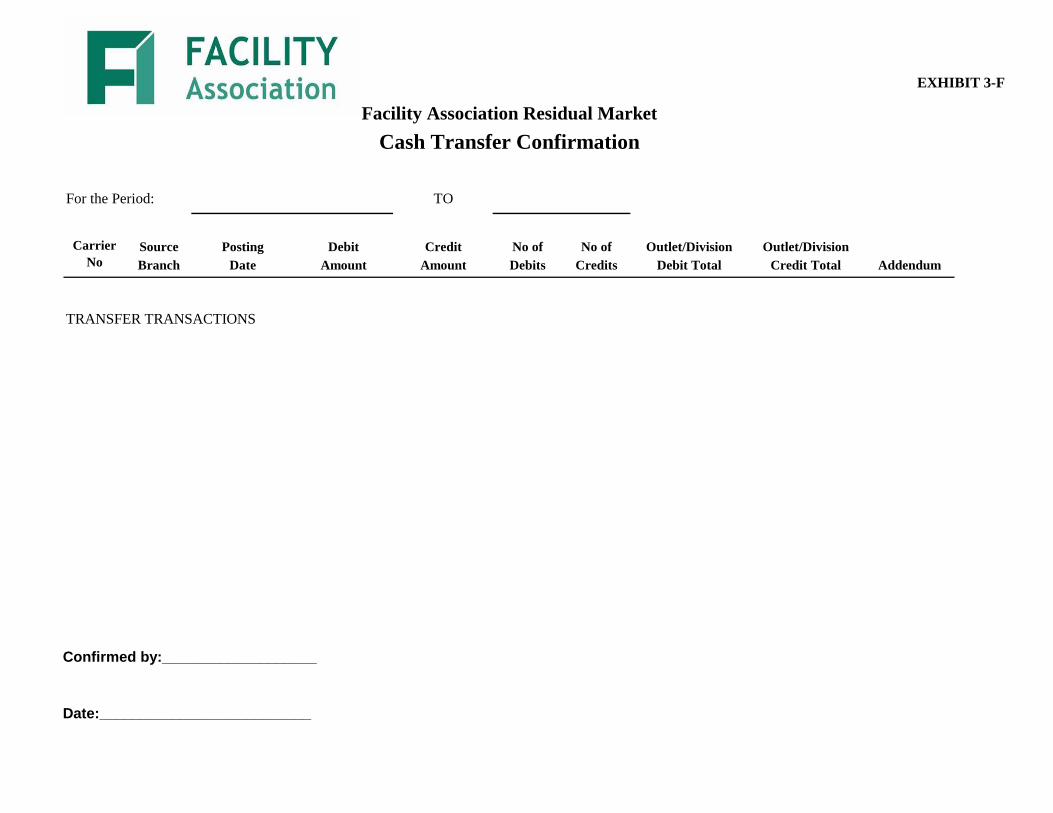
EXHIBIT 3-F
Confirmed by:___________________
Date:__________________________
TO
Source Posting Debit Credit No of No of Outlet/Division Outlet/DivisionBranch Date Amount Amount Debits Credits Debit Total Credit Total Addendum
TRANSFER TRANSACTIONS
Facility Association Residual MarketCash Transfer Confirmation
For the Period:
Carrier
No

EXHIBIT 3-G
Page 1 of 2File: Exhibit 3-G.xlsx(Orig. LME)
30/11/12
Fiscal Year:
November December January February March April May June July August September October TotalsAlberta Private Passenger 0.00 Other 0.00Total 0.00 0.00 0.00 0.00 0.00 0.00 0.00 0.00 0.00 0.00 0.00 0.00 0.00
New Brunswick Private Passenger 0.00 Other 0.00Total 0.00 0.00 0.00 0.00 0.00 0.00 0.00 0.00 0.00 0.00 0.00 0.00 0.00
Nova Scotia Private Passenger 0.00 Other 0.00Total 0.00 0.00 0.00 0.00 0.00 0.00 0.00 0.00 0.00 0.00 0.00 0.00 0.00
Prince Edward Island Private Passenger 0.00 Other 0.00Total 0.00 0.00 0.00 0.00 0.00 0.00 0.00 0.00 0.00 0.00 0.00 0.00 0.00
Ontario Private Passenger 0.00 Other 0.00Total 0.00 0.00 0.00 0.00 0.00 0.00 0.00 0.00 0.00 0.00 0.00 0.00 0.00
Newfoundland Private Passenger 0.00 Other 0.00Total 0.00 0.00 0.00 0.00 0.00 0.00 0.00 0.00 0.00 0.00 0.00 0.00 0.00
Yukon Private Passenger 0.00 Other 0.00Total 0.00 0.00 0.00 0.00 0.00 0.00 0.00 0.00 0.00 0.00 0.00 0.00 0.00
N.W.T Private Passenger 0.00 Other 0.00Total 0.00 0.00 0.00 0.00 0.00 0.00 0.00 0.00 0.00 0.00 0.00 0.00 0.00
Nunavut Private Passenger 0.00 Other 0.00Total 0.00 0.00 0.00 0.00 0.00 0.00 0.00 0.00 0.00 0.00 0.00 0.00 0.00
Total All Provinces Private Passenger 0.00 0.00 0.00 0.00 0.00 0.00 0.00 0.00 0.00 0.00 0.00 0.00 0.00 Other 0.00 0.00 0.00 0.00 0.00 0.00 0.00 0.00 0.00 0.00 0.00 0.00 0.00TOTAL 0.00 0.00 0.00 0.00 0.00 0.00 0.00 0.00 0.00 0.00 0.00 0.00 0.00
AGENTS COMMISSION
EXHIBIT 3-G
Page 2 of 2File: Exhibit 3-G.xlsx(Orig. LME)
30/11/12
Fiscal Year:
November December January February March April May June July August September October TotalsAlberta Private Passenger 0.00 Other 0.00Total 0.00 0.00 0.00 0.00 0.00 0.00 0.00 0.00 0.00 0.00 0.00 0.00 0.00
New Brunswick Private Passenger 0.00 Other 0.00Total 0.00 0.00 0.00 0.00 0.00 0.00 0.00 0.00 0.00 0.00 0.00 0.00 0.00
Nova Scotia Private Passenger 0.00 Other 0.00Total 0.00 0.00 0.00 0.00 0.00 0.00 0.00 0.00 0.00 0.00 0.00 0.00 0.00
Prince Edward Island Private Passenger 0.00 Other 0.00Total 0.00 0.00 0.00 0.00 0.00 0.00 0.00 0.00 0.00 0.00 0.00 0.00 0.00
Ontario Private Passenger 0.00 Other 0.00Total 0.00 0.00 0.00 0.00 0.00 0.00 0.00 0.00 0.00 0.00 0.00 0.00 0.00
Newfoundland Private Passenger 0.00 Other 0.00Total 0.00 0.00 0.00 0.00 0.00 0.00 0.00 0.00 0.00 0.00 0.00 0.00 0.00
Yukon Private Passenger 0.00 Other 0.00Total 0.00 0.00 0.00 0.00 0.00 0.00 0.00 0.00 0.00 0.00 0.00 0.00 0.00
N.W.T Private Passenger 0.00 Other 0.00Total 0.00 0.00 0.00 0.00 0.00 0.00 0.00 0.00 0.00 0.00 0.00 0.00 0.00
Nunavut Private Passenger 0.00 Other 0.00Total 0.00 0.00 0.00 0.00 0.00 0.00 0.00 0.00 0.00 0.00 0.00 0.00 0.00
Total All Provinces Private Passenger 0.00 0.00 0.00 0.00 0.00 0.00 0.00 0.00 0.00 0.00 0.00 0.00 0.00 Other 0.00 0.00 0.00 0.00 0.00 0.00 0.00 0.00 0.00 0.00 0.00 0.00 0.00TOTAL 0.00 0.00 0.00 0.00 0.00 0.00 0.00 0.00 0.00 0.00 0.00 0.00 0.00
WRITTEN PREMIUM
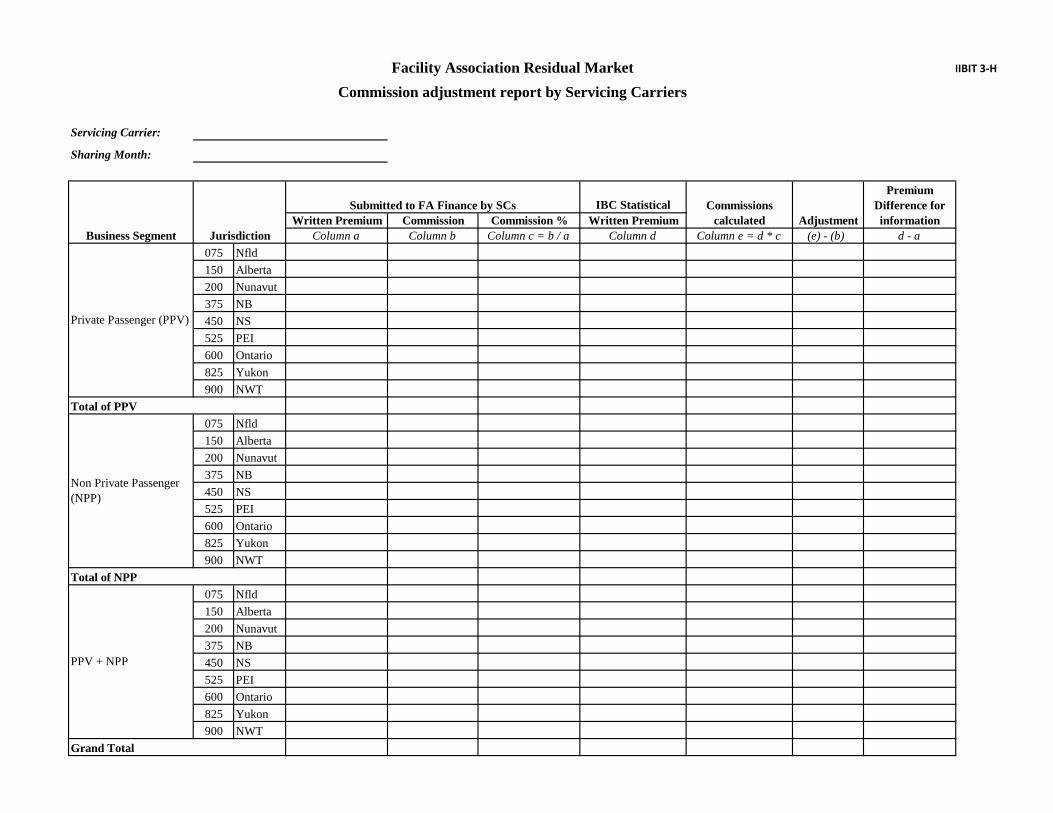
EXHIBIT 3-H
Servicing Carrier:
Sharing Month:
IBC Statistical
Written Premium Commission Commission % Written Premium
Column a Column b Column c = b / a Column d Column e = d * c (e) - (b) d - a
075 Nfld
150 Alberta
200 Nunavut
375 NB
450 NS
525 PEI
600 Ontario
825 Yukon
900 NWT
075 Nfld
150 Alberta
200 Nunavut
375 NB
450 NS
525 PEI
600 Ontario
825 Yukon
900 NWT
075 Nfld
150 Alberta
200 Nunavut
375 NB
450 NS
525 PEI
600 Ontario
825 Yukon
900 NWT
Grand Total
Facility Association Residual Market
Commission adjustment report by Servicing Carriers
Business Segment Jurisdiction
Submitted to FA Finance by SCs Commissions
calculated Adjustment
Written
Premium
Difference for
information
Private Passenger (PPV)
Total of PPV
Non Private Passenger
(NPP)
Total of NPP
PPV + NPP

FARM Exhibit 3-IAged Premiums Receivable Summary (Insert Company name & number)
Month Ending (Insert Date)
Current 31-60 Days 61-90 Days 91-120 Days 121-150 Days Over 150 Days Total(see below for req'd comments & documentation)
Broker a/c's 0.00Agency a/c's 0.00Direct Writers 0.00Monthly Pay Plan 0.00Other Items (Please Explain ) 0.00
Premiums Receivable per Sub-ledger 0.00 0.00 0.00 0.00 0.00 0.00 0.00
Reconciling Differences 0.00
Premiums Receivable per Trial Balance (a/#1020) 0.00
Percentage of Aged Amount to Total Amount #DIV/0! #DIV/0! #DIV/0! #DIV/0! #DIV/0! #DIV/0! #DIV/0!
Required Comments & Documentation
An itemized list for all amounts which are past due greater than 90 daysEach item must include comments as to their collectibllity
For those amounts over 150 days, deposit a cheque to your FA Bank a/c and send to Head Office documentation confirming the deposit Provide an explanation if payment is not required (i.e bankruptcy, litigation or other)
Signature
Date
Finance and Member Services Department Unclaimed Property Guidelines and Procedures
Approved by: FA Audit and Risk Committee Effective: November 23, 2012
page 1 of 11 Exhibit 3-J
Unclaimed Property Guidelines and Procedures
Governance and Accounting
Facility Association Finance and Member Services
Finance and Member Services Department Unclaimed Property Guidelines and Procedures
Approved by: FA Audit and Risk Committee Effective: November 23, 2012
page 2 of 11 Exhibit 3-J
Contents
Section 1. Introduction ............................................................................................................................ 3
1.1 Purpose .......................................................................................................................................... 3
1.2 Scope .............................................................................................................................................. 3
1.3 Legislative Context ......................................................................................................................... 4
Section 2. Guidelines ............................................................................................................................... 4
2.1 Underlying Principles ..................................................................................................................... 4
2.2 Governance and Management ...................................................................................................... 4
2.2.1 Risk Management ................................................................................................................... 4
2.2.2 Responsibility for Regular Reviews and Compliance Verification .......................................... 5
2.2.3 Regular Audits ........................................................................................................................ 5
2.2.4 Reporting ................................................................................................................................ 5
Section 3. Procedures Supporting Facility Association Unclaimed Property Guidelines ........................ 6
3.1 Use of Servicing Carrier own procedures ...................................................................................... 6
3.2 Facility Association Internal Procedures ....................................................................................... 6
3.2.1 Determining and Recording Unclaimed Property – Uncashed Cheques ............................... 6
3.2.2 Re-classification of property from unclaimed to abandoned ................................................ 7
3.2.3 Regular Reporting ................................................................................................................... 7
3.2.4 Information and Record Retention ........................................................................................ 8
Section 4. Sample Verification Letter ...................................................................................................... 9
Section 5. Summary and assessment of provincial unclaimed property laws and regulations ........... 10
5.1 B.C. ............................................................................................................................................... 10
5.2 Alberta ......................................................................................................................................... 11
5.3 Quebec ......................................................................................................................................... 11
Finance and Member Services Department Unclaimed Property Guidelines and Procedures
Approved by: FA Audit and Risk Committee Effective: November 23, 2012
page 3 of 11 Exhibit 3-J
Section 1. Introduction
Unclaimed property is generally defined as a liability a company (the “holder”) owes to an individual or entity (the
“owner”) when a debt or obligation remains outstanding after a specified period of time. For insurance companies,
uncashed premium refund or claim cheques are a common type of unclaimed property. Where the payee (i.e. the
owner) does not extinguish the debt by cashing the cheque, their property right may be protected by provincial
unclaimed property (escheat) laws.
Companies as holders of unclaimed property undertake all reasonable options to locate the property’s rightful
owner through a process of due diligence and determine, as appropriate, whether there is a Canadian statutory
requirement to report the unclaimed property and whether and when the property may be deemed “abandoned” and
the liability becomes de-recognized by the holder.
For Facility Association, uncashed or unclaimed cheques are the major source of potential unclaimed property.
1.1 Purpose
This document represents Facility Association’s formal guidelines and associated procedures for identifying and
tracking potential unclaimed property, complying with applicable Canadian provincial reporting and remittance
requirements, and potentially de-recognizing the liability. While every effort is undertaken to ensure these
guidelines and the associated procedures are up-to-date, all applicable Canadian statutory requirements supersede
this document.
This document has been introduced to:
• define the conditions under which cheques will be tracked as “uncashed”;
• define the conditions under which cheques will be considered “unclaimed property”;
• define how substantive owner information will be obtained under applicable law, taking into consideration
applicable privacy issues;
• define the conditions under which “unclaimed property” will be de-recognized as a liability either via
transfer to a provincial authority or taken directly to income;
• identify who is authorised to recommend amounts to de-recognize; and
• ensure appropriate accounting procedures and internal controls are in place.
Please refer to section 1.3 on Canadian jurisdictions where Unclaimed Property Acts and Regulation are enacted
and in-force.
1.2 Scope
These guidelines and procedures apply to Facility Association’s central administrative office and to the following
as administered by Facility Association:
Residual Market
Uninsured Automobile Funds
Member companies using any of the Risk Sharing Pools (RSPs) are assumed to use their existing unclaimed
property policies and procedures, and that such policies and procedures are in compliance with applicable
Canadian federal and/or provincial laws and regulations, and are appropriately ensuring the disposition of any
deemed abandoned property is reported to Facility Association in accordance with instructions provided by Facility
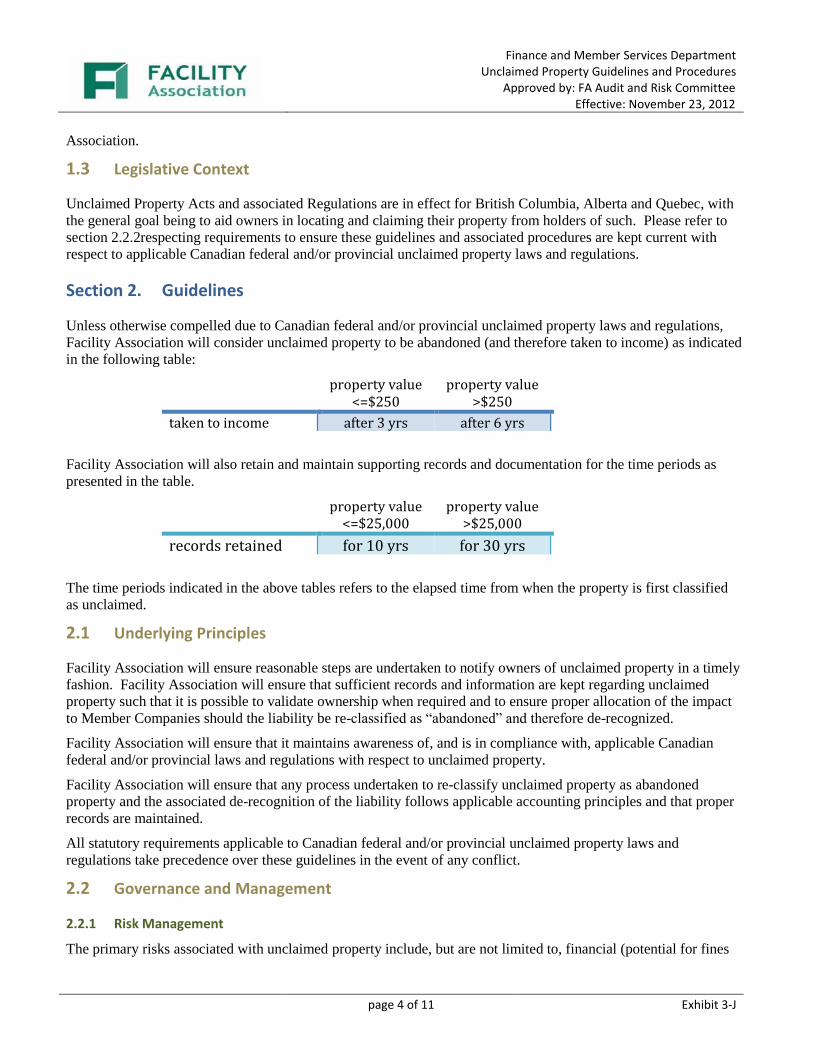
Finance and Member Services Department Unclaimed Property Guidelines and Procedures
Approved by: FA Audit and Risk Committee Effective: November 23, 2012
page 4 of 11 Exhibit 3-J
Association.
1.3 Legislative Context
Unclaimed Property Acts and associated Regulations are in effect for British Columbia, Alberta and Quebec, with
the general goal being to aid owners in locating and claiming their property from holders of such. Please refer to
section 2.2.2respecting requirements to ensure these guidelines and associated procedures are kept current with
respect to applicable Canadian federal and/or provincial unclaimed property laws and regulations.
Section 2. Guidelines
Unless otherwise compelled due to Canadian federal and/or provincial unclaimed property laws and regulations,
Facility Association will consider unclaimed property to be abandoned (and therefore taken to income) as indicated
in the following table:
property value <=$250
property value >$250
taken to income after 3 yrs after 6 yrs
Facility Association will also retain and maintain supporting records and documentation for the time periods as
presented in the table.
property value <=$25,000
property value >$25,000
records retained for 10 yrs for 30 yrs
The time periods indicated in the above tables refers to the elapsed time from when the property is first classified
as unclaimed.
2.1 Underlying Principles
Facility Association will ensure reasonable steps are undertaken to notify owners of unclaimed property in a timely
fashion. Facility Association will ensure that sufficient records and information are kept regarding unclaimed
property such that it is possible to validate ownership when required and to ensure proper allocation of the impact
to Member Companies should the liability be re-classified as “abandoned” and therefore de-recognized.
Facility Association will ensure that it maintains awareness of, and is in compliance with, applicable Canadian
federal and/or provincial laws and regulations with respect to unclaimed property.
Facility Association will ensure that any process undertaken to re-classify unclaimed property as abandoned
property and the associated de-recognition of the liability follows applicable accounting principles and that proper
records are maintained.
All statutory requirements applicable to Canadian federal and/or provincial unclaimed property laws and
regulations take precedence over these guidelines in the event of any conflict.
2.2 Governance and Management
2.2.1 Risk Management
The primary risks associated with unclaimed property include, but are not limited to, financial (potential for fines
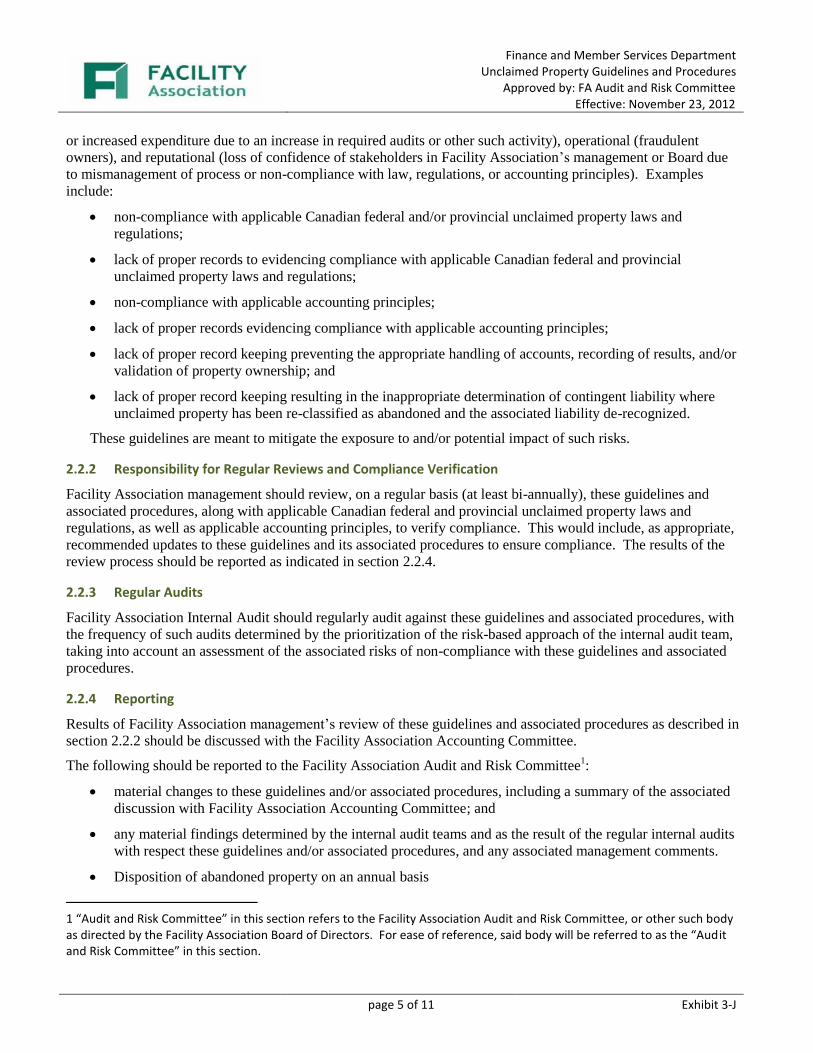
Finance and Member Services Department Unclaimed Property Guidelines and Procedures
Approved by: FA Audit and Risk Committee Effective: November 23, 2012
page 5 of 11 Exhibit 3-J
or increased expenditure due to an increase in required audits or other such activity), operational (fraudulent
owners), and reputational (loss of confidence of stakeholders in Facility Association’s management or Board due
to mismanagement of process or non-compliance with law, regulations, or accounting principles). Examples
include:
non-compliance with applicable Canadian federal and/or provincial unclaimed property laws and
regulations;
lack of proper records to evidencing compliance with applicable Canadian federal and provincial
unclaimed property laws and regulations;
non-compliance with applicable accounting principles;
lack of proper records evidencing compliance with applicable accounting principles;
lack of proper record keeping preventing the appropriate handling of accounts, recording of results, and/or
validation of property ownership; and
lack of proper record keeping resulting in the inappropriate determination of contingent liability where
unclaimed property has been re-classified as abandoned and the associated liability de-recognized.
These guidelines are meant to mitigate the exposure to and/or potential impact of such risks.
2.2.2 Responsibility for Regular Reviews and Compliance Verification
Facility Association management should review, on a regular basis (at least bi-annually), these guidelines and
associated procedures, along with applicable Canadian federal and provincial unclaimed property laws and
regulations, as well as applicable accounting principles, to verify compliance. This would include, as appropriate,
recommended updates to these guidelines and its associated procedures to ensure compliance. The results of the
review process should be reported as indicated in section 2.2.4.
2.2.3 Regular Audits
Facility Association Internal Audit should regularly audit against these guidelines and associated procedures, with
the frequency of such audits determined by the prioritization of the risk-based approach of the internal audit team,
taking into account an assessment of the associated risks of non-compliance with these guidelines and associated
procedures.
2.2.4 Reporting
Results of Facility Association management’s review of these guidelines and associated procedures as described in
section 2.2.2 should be discussed with the Facility Association Accounting Committee.
The following should be reported to the Facility Association Audit and Risk Committee1:
material changes to these guidelines and/or associated procedures, including a summary of the associated
discussion with Facility Association Accounting Committee; and
any material findings determined by the internal audit teams and as the result of the regular internal audits
with respect these guidelines and/or associated procedures, and any associated management comments.
Disposition of abandoned property on an annual basis
1 “Audit and Risk Committee” in this section refers to the Facility Association Audit and Risk Committee, or other such body as directed by the Facility Association Board of Directors. For ease of reference, said body will be referred to as the “Audit and Risk Committee” in this section.
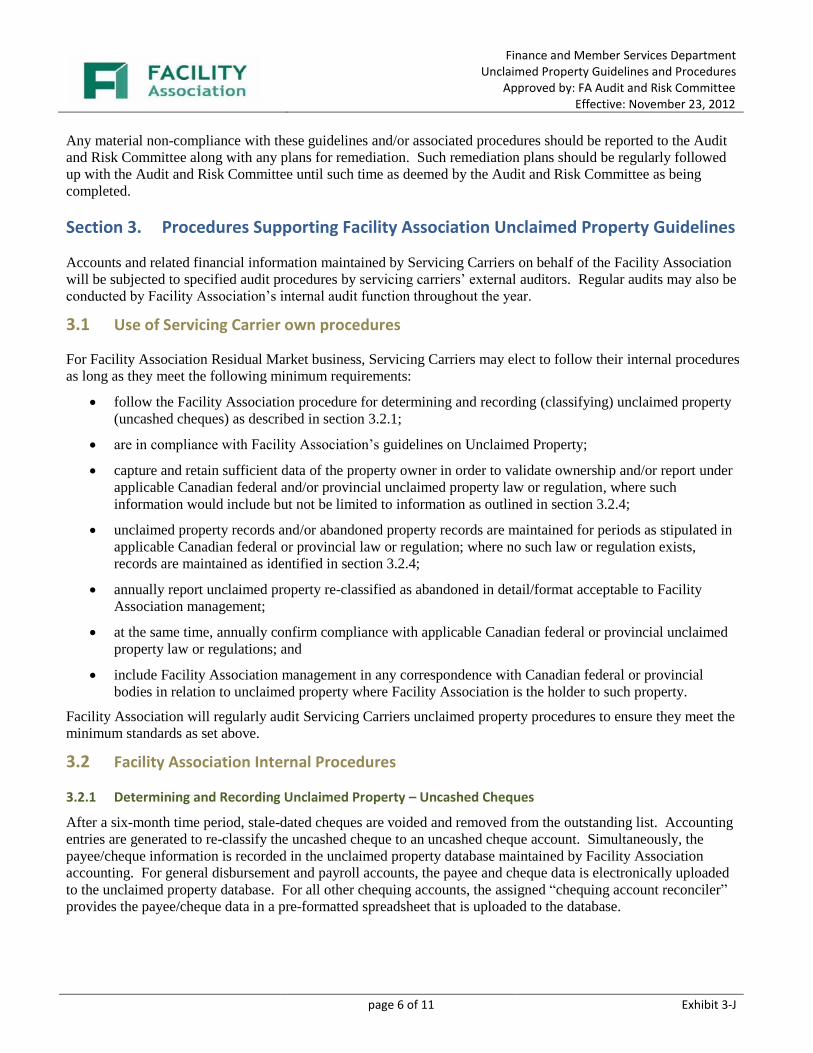
Finance and Member Services Department Unclaimed Property Guidelines and Procedures
Approved by: FA Audit and Risk Committee Effective: November 23, 2012
page 6 of 11 Exhibit 3-J
Any material non-compliance with these guidelines and/or associated procedures should be reported to the Audit
and Risk Committee along with any plans for remediation. Such remediation plans should be regularly followed
up with the Audit and Risk Committee until such time as deemed by the Audit and Risk Committee as being
completed.
Section 3. Procedures Supporting Facility Association Unclaimed Property Guidelines
Accounts and related financial information maintained by Servicing Carriers on behalf of the Facility Association
will be subjected to specified audit procedures by servicing carriers’ external auditors. Regular audits may also be
conducted by Facility Association’s internal audit function throughout the year.
3.1 Use of Servicing Carrier own procedures
For Facility Association Residual Market business, Servicing Carriers may elect to follow their internal procedures
as long as they meet the following minimum requirements:
follow the Facility Association procedure for determining and recording (classifying) unclaimed property
(uncashed cheques) as described in section 3.2.1;
are in compliance with Facility Association’s guidelines on Unclaimed Property;
capture and retain sufficient data of the property owner in order to validate ownership and/or report under
applicable Canadian federal and/or provincial unclaimed property law or regulation, where such
information would include but not be limited to information as outlined in section 3.2.4;
unclaimed property records and/or abandoned property records are maintained for periods as stipulated in
applicable Canadian federal or provincial law or regulation; where no such law or regulation exists,
records are maintained as identified in section 3.2.4;
annually report unclaimed property re-classified as abandoned in detail/format acceptable to Facility
Association management;
at the same time, annually confirm compliance with applicable Canadian federal or provincial unclaimed
property law or regulations; and
include Facility Association management in any correspondence with Canadian federal or provincial
bodies in relation to unclaimed property where Facility Association is the holder to such property.
Facility Association will regularly audit Servicing Carriers unclaimed property procedures to ensure they meet the
minimum standards as set above.
3.2 Facility Association Internal Procedures
3.2.1 Determining and Recording Unclaimed Property – Uncashed Cheques
After a six-month time period, stale-dated cheques are voided and removed from the outstanding list. Accounting
entries are generated to re-classify the uncashed cheque to an uncashed cheque account. Simultaneously, the
payee/cheque information is recorded in the unclaimed property database maintained by Facility Association
accounting. For general disbursement and payroll accounts, the payee and cheque data is electronically uploaded
to the unclaimed property database. For all other chequing accounts, the assigned “chequing account reconciler”
provides the payee/cheque data in a pre-formatted spreadsheet that is uploaded to the database.
Finance and Member Services Department Unclaimed Property Guidelines and Procedures
Approved by: FA Audit and Risk Committee Effective: November 23, 2012
page 7 of 11 Exhibit 3-J
1. Monthly review process
When cheques are stale-dated, Facility Association accounting generates and reviews a report detailing
selected payee information. As it relates to the property in question, the reviewer records appropriate
information as needed, including but not necessarily limited to information as outlined in section 3.2.4.
2. Verification letters
After the monthly review process is complete, Facility Association accounting generates verification
letters to payees for cheques of $250 or more, and mails them within 30 days of classifying the property as
unclaimed (see example letter in section 4). The verification letter contains the payee's name and address
on record, cheque number, and date of cheque, voucher number, description if available, and a contact
person for related questions (see 3 below). The letter also contains a section for the payee to certify that
the cheque was either lost or never received. Verification letters are not sent to payees for cheques of less
than $250, or as stipulated in applicable Canadian federal or provincial unclaimed property law or
regulations.
3. Contact information
If the payee has questions about the cheque, inquiries are directed to the contact person specified in the
letter for additional information. The contact person is responsible for answering any questions and
reissuing all cheques as applicable.
4. Replacement cheques
Upon receipt of the signed letter from the payee to certify that the cheque was either lost or never received,
Facility Association will issue a replacement cheque. The replacement cheque is charged to the uncashed
cheque account. The associated payee information is provided to Facility Association accounting and
entered into the unclaimed property database for matching of payee and amount with the original payment.
A replacement cheque will not be issued without the signed letter and only after the original cheque has
been stale-dated and reviewed in the normal course
5. Final follow up
If required by applicable Canadian federal and/or provincial unclaimed property laws or regulations, a
final attempt is made to contact the owner by letter sent to their last known address. This due diligence
letter is generated and sent by Facility Association accounting. If the payee responds, apply procedure 4
above.
3.2.2 Re-classification of property from unclaimed to abandoned
If all efforts to contact the owner of the unclaimed property as outlined in section 3.2.1 above have been
unsuccessful, and the applicable dormancy period as been surpassed, unclaimed property may be reclassified as
abandoned property. Subject to compliance with Canadian federal or provincial law and regulations procedures
(see section Section 5), uunclaimed property will be re-classified to abandoned and therefore taken into income:
(i) after 3 years have elapsed since the property under consideration was first classified as unclaimed, where the
property value is less than or equal to $250; or
(ii) after 6 years have elapsed since the property under consideration was first classified as unclaimed, where the
property value is greater than $250.
3.2.3 Regular Reporting
Facility Association accounting will generate reports showing the monthly activity and the month-end unclaimed
property database balance, reconciled with the uncashed cheque account. Facility Association accounting will
Finance and Member Services Department Unclaimed Property Guidelines and Procedures
Approved by: FA Audit and Risk Committee Effective: November 23, 2012
page 8 of 11 Exhibit 3-J
prepare any associated reports as required by applicable Canadian and/or Provincial law or regulation, and as
requested by the Audit and Risk Committee and Accounting Committees in support of their responsibility to
review and/or approve management’s recommendations.
3.2.4 Information and Record Retention
Unclaimed property information needs to be retained in sufficient detail and over the appropriate duration to allow
for such things as property owner identification, , audit, and evidence of compliance with the Facility Association
Unclaimed Property Guidelines and applicable Canadian federal or provincial law or regulation.
To this end, the Facility Association unclaimed property database should capture and retain sufficient data of the
property owner in order to validate ownership and/or report under applicable Canadian federal and/or provincial
unclaimed property law or regulation, where such information would include but not be limited to (as relates to the
property in question):
property owner name and last known address;
description of the unclaimed property (including a description of the act that gave rise to the unclaimed
property);
insurance policy number or identifier, effective date, refund date (as applicable);
claim number or identifier, date of loss (as applicable);
all correspondence with property owner;
value of the property and related cheque numbers and issue dates (as applicable);
any monies owed by the owner to the Facility Association;
applicable jurisdiction (as per last known address or where the act giving rise to the property occurred);
the determination of applicable Canadian federal and/or provincial Unclaimed Property Laws and
Regulations that apply; and
diary of next action required, including date action required.
Unclaimed property records and/or abandoned property records are maintained for periods as stipulated in
applicable Canadian federal or provincial law or regulation; where no such law or regulation exists, records are
maintained as identified below:
(i) 10 years from when the property is first classified as unclaimed, where the property value is less than or
equal $25,000; or
(ii) 30 years from when the property is first classified as unclaimed, where the property value is greater than
$25,000.

Finance and Member Services Department Unclaimed Property Guidelines and Procedures
Approved by: FA Audit and Risk Committee Effective: November 23, 2012
page 9 of 11 Exhibit 3-J
Section 4. Sample Verification Letter
<Current Date>
<Name Of Payee> <Address of Payee>
RE: Property Type: UNCLAIMED PROPERTY CHEQUE Issue date of cheque Cheque Number> $<Amount of Cheque>
I The above referenced cheque has been found in our records as unclaimed property. Kindly complete the section below so we can send you a replacement cheque
Yes, this payment is still due.
No, this payment has been settled or I am not entitled to receive this payment
Name (if different than above): ____________________________________________
New Mailing Address
___________________________________________
___________________________________________ ___________________________________________ Signature: ____________________________________________ Date: _____________ If you have any questions please feel free to contact the undersigned. Sincerely yours, FA <Title> <Address> <Telephone> <Fax Number>
<e-mail address>
Finance and Member Services Department Unclaimed Property Guidelines and Procedures
Approved by: FA Audit and Risk Committee Effective: November 23, 2012
page 10 of 11 Exhibit 3-J
Section 5. Summary and assessment of provincial unclaimed property laws and regulations
5.1 B.C.
Unclaimed Property Act [SBC 1999], assented to July 15, 1999
Part 1 1 “property” means:
…
(d) the right to an amount due and payable by an insurer under the terms of an insurance policy,
including an annuity and a refund of premiums,
…
As such, uncashed claims cheques and premium refund cheques are considered “property” within the law.
“Part 3 – Unclaimed Property Held by Holders” then applies, addressing the issues of:
which property owners are subject to this Law (as applicable to Facility Association, last known address is
in B.C. and the initial payment was initiated after July 1, 2000);
duty of holders to make reasonable efforts to locate and notify owners;
duty of holders to maintain a database of unclaimed property, including prescribed particulars and
reasonable efforts to ensure the existence of the database and means to access it are known to the public;
eventual treatment of unclaimed property as income of the holder.
The associated Unclaimed Property Regulation came into force April 2001. Part 3 outlines:
exempt classes of holders (as applies to Facility Association, where property value is under $50);
prescribed time periods (3 yrs since cheque sent)
requirement to establish written policies and procedures respecting what constitutes reasonable efforts to
locate and notify owners and make available to the public said policies and procedures;
allowable data to be made available to the public in order to search the unclaimed property database
(limited to name only; date property became unclaimed, and property identification number to be
provided);
data to collect and hold for periods identified below:
(i) after 6 years have elapsed since the property under consideration became Unclaimed Property
and the amount is less than $1000.00;
(ii) after 10 years have elapsed since the property under consideration became Unclaimed Property
and the amount is between $1000.00 and 24,999.99; and,
(iii) after 30 years have elapsed since the property under consideration became Unclaimed Property
and the amounts more than $24,999.99.
establish and make public point of contact for owner, and how to make a claim; have procedure for
reviewing and processing claims including appeal process for denied claims.
prescribed periods when property may be treated as income to the holder:
Finance and Member Services Department Unclaimed Property Guidelines and Procedures
Approved by: FA Audit and Risk Committee Effective: November 23, 2012
page 11 of 11 Exhibit 3-J
(i) after 6 years have elapsed since the property under consideration became Unclaimed Property
and the amount is less than $1000.00;
(ii) after 10 years have elapsed since the property under consideration became Unclaimed Property
and the amount is between $1000.00 and 24,999.99; and,
(iii) after 30 years have elapsed since the property under consideration became Unclaimed Property
and the amounts more than $24,999.99.
5.2 Alberta
Unclaimed Personal Property and Vested Property Act, effective September 1, 2008
Intangible property valued at $250 or more falls into this Act which includes cheques. The Act applies to owners
where their last known address is in Alberta (and the holder, Facility Association, carries on business in Alberta –
different rules would apply if Facility was physically located in Alberta).
Holders must decide when property becomes unclaimed but the time period for calculating when the property is
considered abandoned began on Sept 1, 2008. Abandoned property is transferred to the Tax and Revenue
Administration (TRA) on behalf of Alberta Finance. The holder is responsible to:
between three and eight months prior to the property being transferrable to the TRA, send a final statement
to the owner)
prepare Holder Report forms listing all unclaimed property as at December 31 each year within 120 days
of year-end;
According to the associated regulation (also effective September 1, 2008), property is considered abandoned: "5
years after the earlier of (i) the date on which the apparent owner's right to demand the personal property arises,
and (ii) the date on which the obligation to pay or distribute the personal property arises. The regulation also
stipulates language required in the notice letter to the property owner.
5.3 Quebec
Unclaimed Property Act [Bill 6, 2011], assented to June 13, 2011
The Act indicates in Section 3 “The following property is considered to be unclaimed property if the owner or
other right-holder is domiciled in Quebec:” … “(2) the value of cheques … three years following date of … issue”.
Section 4 indicates “A right-holder is deemed to be domiciled in Quebec if the right-holder’s last known address is
in Quebec, or, where the address is unknown, if the act establishing the right-holder’s rights was made in Quebec”.
Unclaimed property is transferred annually to the Quebec Minister of Revenue; six months preceding transfer, a
final attempt to notify the owner is required, giving 3 months notice. Late transfers are subject to interest. Holders
must maintain a database of the unclaimed property, including the date the property was transferred to the
Minister; with the associated data maintained for 10 years.
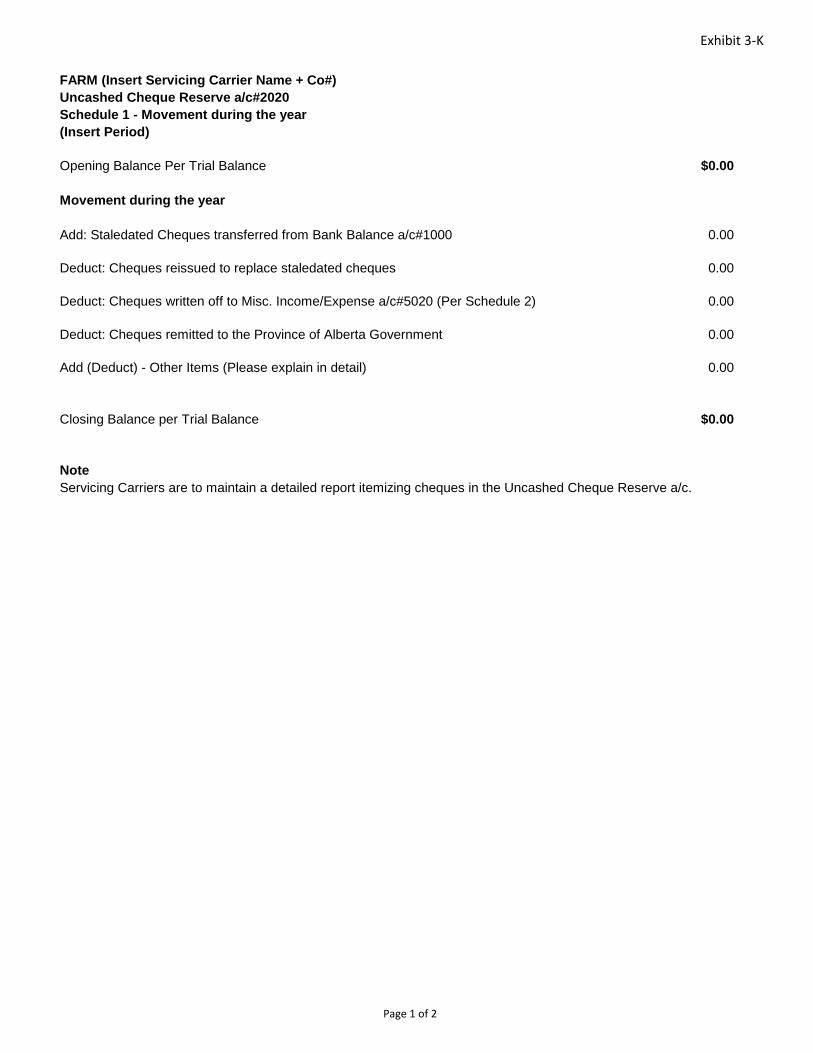
Exhibit 3-K
FARM (Insert Servicing Carrier Name + Co#)
Uncashed Cheque Reserve a/c#2020
Schedule 1 - Movement during the year
(Insert Period)
Opening Balance Per Trial Balance $0.00
Movement during the year
Add: Staledated Cheques transferred from Bank Balance a/c#1000 0.00
Deduct: Cheques reissued to replace staledated cheques 0.00
Deduct: Cheques written off to Misc. Income/Expense a/c#5020 (Per Schedule 2) 0.00
Deduct: Cheques remitted to the Province of Alberta Government 0.00
Add (Deduct) - Other Items (Please explain in detail) 0.00
Closing Balance per Trial Balance $0.00
Note
Servicing Carriers are to maintain a detailed report itemizing cheques in the Uncashed Cheque Reserve a/c.
Page 1 of 2
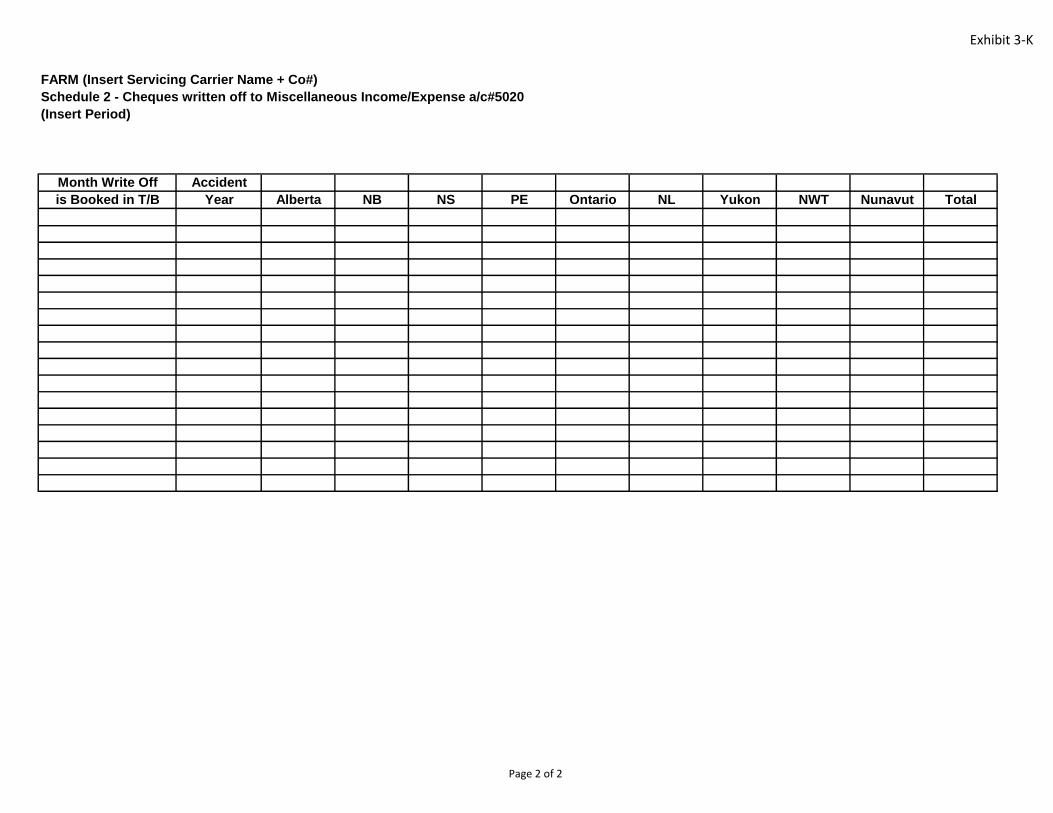
Exhibit 3-K
FARM (Insert Servicing Carrier Name + Co#)
Schedule 2 - Cheques written off to Miscellaneous Income/Expense a/c#5020
(Insert Period)
Month Write Off Accident
is Booked in T/B Year Alberta NB NS PE Ontario NL Yukon NWT Nunavut Total
Page 2 of 2
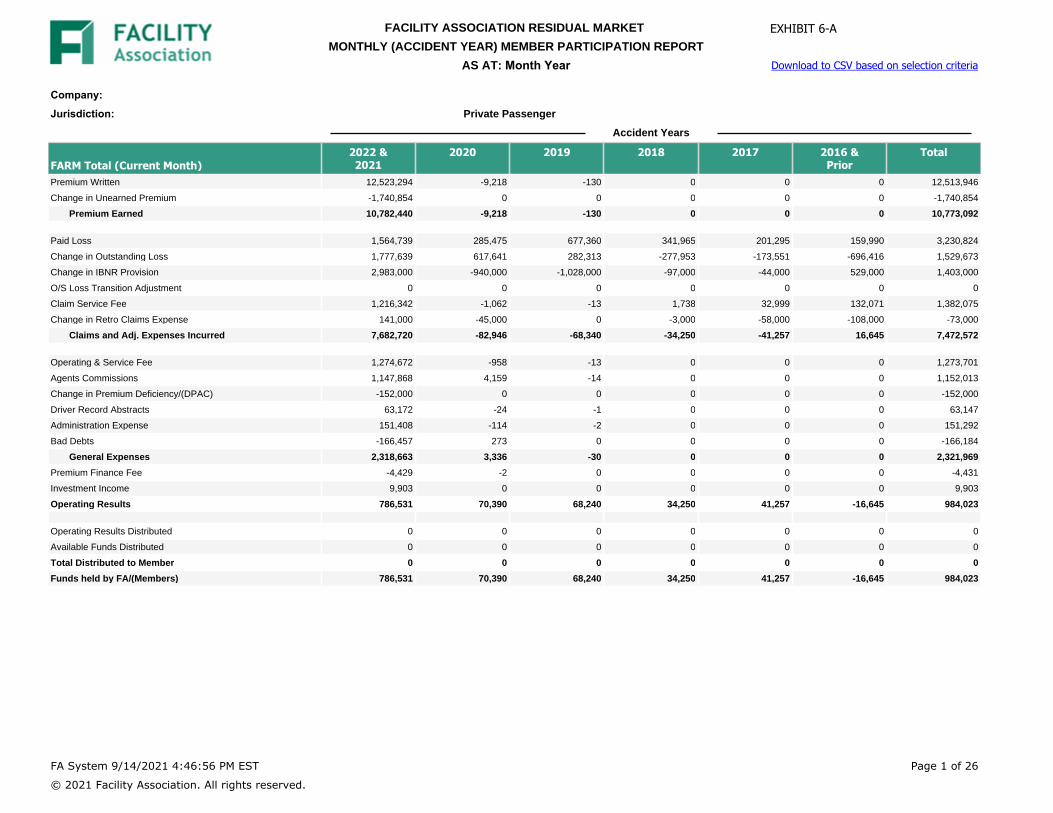
Company: Jurisdiction: Private Passenger
Accident Years
FARM Total (Current Month)2022 &2021
2020 2019 2018 2017 2016 &Prior
Total
Premium Written 12,523,294 -9,218 -130 0 0 0 12,513,946
Change in Unearned Premium -1,740,854 0 0 0 0 0 -1,740,854
Premium Earned 10,782,440 -9,218 -130 0 0 0 10,773,092
Paid Loss 1,564,739 285,475 677,360 341,965 201,295 159,990 3,230,824
Change in Outstanding Loss 1,777,639 617,641 282,313 -277,953 -173,551 -696,416 1,529,673
Change in IBNR Provision 2,983,000 -940,000 -1,028,000 -97,000 -44,000 529,000 1,403,000
O/S Loss Transition Adjustment 0 0 0 0 0 0 0
Claim Service Fee 1,216,342 -1,062 -13 1,738 32,999 132,071 1,382,075
Change in Retro Claims Expense 141,000 -45,000 0 -3,000 -58,000 -108,000 -73,000
Claims and Adj. Expenses Incurred 7,682,720 -82,946 -68,340 -34,250 -41,257 16,645 7,472,572
Operating & Service Fee 1,274,672 -958 -13 0 0 0 1,273,701
Agents Commissions 1,147,868 4,159 -14 0 0 0 1,152,013
Change in Premium Deficiency/(DPAC) -152,000 0 0 0 0 0 -152,000
Driver Record Abstracts 63,172 -24 -1 0 0 0 63,147
Administration Expense 151,408 -114 -2 0 0 0 151,292
Bad Debts -166,457 273 0 0 0 0 -166,184
General Expenses 2,318,663 3,336 -30 0 0 0 2,321,969
Premium Finance Fee -4,429 -2 0 0 0 0 -4,431
Investment Income 9,903 0 0 0 0 0 9,903
Operating Results 786,531 70,390 68,240 34,250 41,257 -16,645 984,023
Operating Results Distributed 0 0 0 0 0 0 0
Available Funds Distributed 0 0 0 0 0 0 0
Total Distributed to Member 0 0 0 0 0 0 0
Funds held by FA/(Members) 786,531 70,390 68,240 34,250 41,257 -16,645 984,023
FA System 9/14/2021 4:46:56 PM EST
© 2021 Facility Association. All rights reserved.
Page 1 of 26
FACILITY ASSOCIATION RESIDUAL MARKET
MONTHLY (ACCIDENT YEAR) MEMBER PARTICIPATION REPORT AS AT: Month Year Download to CSV based on selection criteria
EXHIBIT 6-A
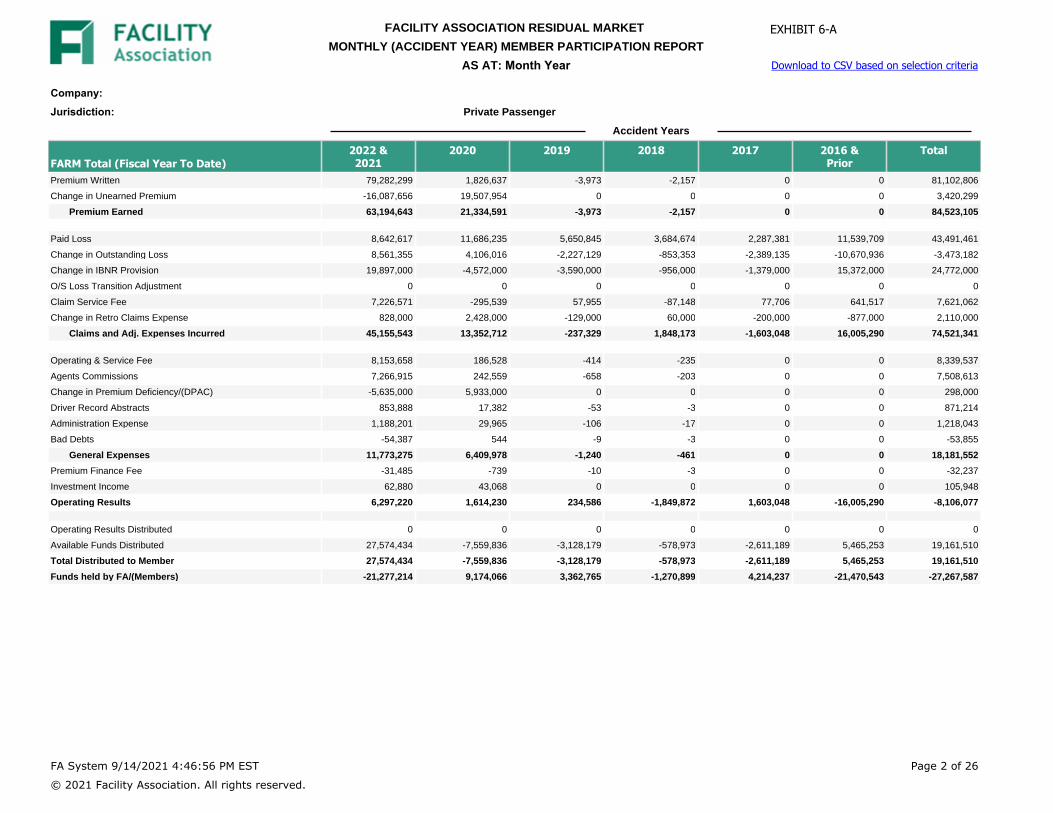
Company: Jurisdiction: Private Passenger
Accident Years
FARM Total (Fiscal Year To Date)2022 &2021
2020 2019 2018 2017 2016 &Prior
Total
Premium Written 79,282,299 1,826,637 -3,973 -2,157 0 0 81,102,806
Change in Unearned Premium -16,087,656 19,507,954 0 0 0 0 3,420,299
Premium Earned 63,194,643 21,334,591 -3,973 -2,157 0 0 84,523,105
Paid Loss 8,642,617 11,686,235 5,650,845 3,684,674 2,287,381 11,539,709 43,491,461
Change in Outstanding Loss 8,561,355 4,106,016 -2,227,129 -853,353 -2,389,135 -10,670,936 -3,473,182
Change in IBNR Provision 19,897,000 -4,572,000 -3,590,000 -956,000 -1,379,000 15,372,000 24,772,000
O/S Loss Transition Adjustment 0 0 0 0 0 0 0
Claim Service Fee 7,226,571 -295,539 57,955 -87,148 77,706 641,517 7,621,062
Change in Retro Claims Expense 828,000 2,428,000 -129,000 60,000 -200,000 -877,000 2,110,000
Claims and Adj. Expenses Incurred 45,155,543 13,352,712 -237,329 1,848,173 -1,603,048 16,005,290 74,521,341
Operating & Service Fee 8,153,658 186,528 -414 -235 0 0 8,339,537
Agents Commissions 7,266,915 242,559 -658 -203 0 0 7,508,613
Change in Premium Deficiency/(DPAC) -5,635,000 5,933,000 0 0 0 0 298,000
Driver Record Abstracts 853,888 17,382 -53 -3 0 0 871,214
Administration Expense 1,188,201 29,965 -106 -17 0 0 1,218,043
Bad Debts -54,387 544 -9 -3 0 0 -53,855
General Expenses 11,773,275 6,409,978 -1,240 -461 0 0 18,181,552
Premium Finance Fee -31,485 -739 -10 -3 0 0 -32,237
Investment Income 62,880 43,068 0 0 0 0 105,948
Operating Results 6,297,220 1,614,230 234,586 -1,849,872 1,603,048 -16,005,290 -8,106,077
Operating Results Distributed 0 0 0 0 0 0 0
Available Funds Distributed 27,574,434 -7,559,836 -3,128,179 -578,973 -2,611,189 5,465,253 19,161,510
Total Distributed to Member 27,574,434 -7,559,836 -3,128,179 -578,973 -2,611,189 5,465,253 19,161,510
Funds held by FA/(Members) -21,277,214 9,174,066 3,362,765 -1,270,899 4,214,237 -21,470,543 -27,267,587
FA System 9/14/2021 4:46:56 PM EST
© 2021 Facility Association. All rights reserved.
Page 2 of 26
FACILITY ASSOCIATION RESIDUAL MARKET
MONTHLY (ACCIDENT YEAR) MEMBER PARTICIPATION REPORT AS AT: Month Year Download to CSV based on selection criteria
EXHIBIT 6-A

Company: Jurisdiction: Private Passenger
Accident Years
FARM Total (All Years To Date)2022 &2021
2020 2019 2018 2017 2016 &Prior
Total
Premium Written 126,267,075 122,708,229 96,766,127 72,696,454 68,995,475 5,274,956,516 5,762,389,876
Change in Unearned Premium -63,072,432 0 0 0 0 -1 -63,072,433
Premium Earned 63,194,643 122,708,229 96,766,127 72,696,454 68,995,475 5,274,956,515 5,699,317,443
Paid Loss 8,642,617 27,505,460 35,502,690 31,216,156 28,939,151 3,732,185,378 3,863,991,452
Outstanding Loss 8,561,355 18,341,712 21,881,933 12,517,545 6,306,305 59,507,444 127,116,294
IBNR Provision 19,897,000 21,483,000 9,885,000 4,655,000 1,667,000 24,857,000 82,444,000
O/S Loss Transition Adjustment 0 0 0 0 0 -893,574,018 -893,574,018
Claim Service Fee 7,226,571 11,309,097 10,318,307 7,732,804 7,527,954 757,112,197 801,226,930
Retro Claim Expense Provision 828,000 3,450,000 2,406,000 1,512,000 919,000 7,096,000 16,211,000
Claims and Adj. Expenses Incurred 45,155,543 82,089,269 79,993,930 57,633,505 45,359,410 3,687,184,001 3,997,415,658
Operating & Service Fee 13,003,975 12,675,811 9,984,054 7,473,686 7,108,889 564,112,849 614,359,264
Agents Commissions 11,409,342 11,103,639 8,993,900 6,970,669 6,650,152 495,201,970 540,329,672
Premium Deficiency/(DPAC) -5,635,000 0 0 0 0 0 -5,635,000
Driver Record Abstracts 1,378,364 1,507,002 1,541,757 1,289,099 1,510,205 63,254,258 70,480,685
Administration Expense 1,804,554 1,926,110 1,843,553 1,934,115 2,022,755 10,640,497 20,171,584
Bad Debts -140,995 24,216 21,326 -58,057 -84,319 -874,096 -1,111,925
General Expenses 21,820,240 27,236,778 22,384,590 17,609,512 17,207,682 1,132,335,478 1,238,594,280
Premium Finance Fee -44,502 -40,820 -34,848 -35,610 -40,779 14,977,466 14,780,907
Investment Income 62,880 224,974 412,215 246,930 110,243 632,602,886 633,660,128
Operating Results -3,762,762 13,566,336 -5,235,026 -2,335,243 6,497,847 1,103,017,388 1,111,748,540
Operating Results Distributed 0 0 -4,212,984 -2,245,940 4,152,871 1,145,089,428 1,142,783,376
Available Funds Distributed 63,711,024 34,654,956 27,727,905 15,137,000 7,279,940 73,050,554 221,561,378
Total Distributed to Member 63,711,024 34,654,956 23,514,921 12,891,060 11,432,811 1,218,139,982 1,364,344,754
Funds held by FA/(Members) -67,473,786 -21,088,620 -28,749,947 -15,226,303 -4,934,964 -115,122,594 -252,596,214
FARM Total(Balance Sheet Amounts)
Unearned Premium 63,072,432 0 0 0 0 1 63,072,433
Premium Deficiency/(DPAC) -5,635,000 0 0 0 0 0 -5,635,000
Outstanding Loss 8,561,355 18,341,712 21,881,933 12,517,545 6,306,305 59,507,444 127,116,294
IBNR Provision 19,897,000 21,483,000 9,885,000 4,655,000 1,667,000 24,857,000 82,444,000
Retro Claim Expense Provision 828,000 3,450,000 2,406,000 1,512,000 919,000 7,096,000 16,211,000
Total Outstanding 29,286,355 43,274,712 34,172,933 18,684,545 8,892,305 91,460,444 225,771,294
FA System 9/14/2021 4:46:56 PM EST
© 2021 Facility Association. All rights reserved.
Page 3 of 26
FACILITY ASSOCIATION RESIDUAL MARKET
MONTHLY (ACCIDENT YEAR) MEMBER PARTICIPATION REPORT AS AT: Month Year Download to CSV based on selection criteria
EXHIBIT 6-A

Company: Jurisdiction: Private Passenger
Accident Years
FARM Total (All Years To Date)2022 &2021
2020 2019 2018 2017 2016 &Prior
Total
FARM Total(Memo Items)
Future Cost on Unearned Premium 46,934,000 0 0 0 0 0 46,934,000
Undiscounted Premium Deficiency/(DPAC) -5,635,000 0 0 0 0 0 -5,635,000
Undiscounted Future Cost on Unearned 43,577,000 0 0 0 0 0 43,577,000
PFAD Included IBNR Provision 3,153,000 4,567,000 3,473,000 1,874,000 771,000 8,093,000 21,931,000
Undiscounted IBNR Provision 17,281,000 17,632,000 6,916,000 3,030,000 1,006,000 17,962,000 63,827,000
Undiscounted Retro Claim Expense 394,000 2,790,000 1,893,000 1,224,000 769,000 6,489,000 13,559,000
FA System 9/14/2021 4:46:56 PM EST
© 2021 Facility Association. All rights reserved.
Page 4 of 26
FACILITY ASSOCIATION RESIDUAL MARKET
MONTHLY (ACCIDENT YEAR) MEMBER PARTICIPATION REPORT AS AT: Month Year Download to CSV based on selection criteria
EXHIBIT 6-A

Company: Jurisdiction: Non Private Passenger
Accident Years
FARM Total (Current Month)2022 &2021
2020 2019 2018 2017 2016 &Prior
Total
Premium Written 30,210,552 -68,755 0 0 0 0 30,141,797
Change in Unearned Premium -3,578,186 0 0 0 0 0 -3,578,186
Premium Earned 26,632,366 -68,755 0 0 0 0 26,563,611
Paid Loss 2,710,735 1,115,599 767,035 184,036 353,032 1,591,370 6,721,807
Change in Outstanding Loss 2,196,342 1,195,820 -144,146 284,713 -180,436 -1,870,022 1,482,271
Change in IBNR Provision 8,754,000 -2,468,000 -710,000 -491,000 -206,000 159,000 5,038,000
O/S Loss Transition Adjustment 0 0 0 0 0 0 0
Claim Service Fee 2,942,982 -7,649 0 4,625 62,894 141,924 3,144,776
Change in Retro Claims Expense 277,000 -34,000 0 -6,000 -90,000 -188,000 -41,000
Claims and Adj. Expenses Incurred 16,881,059 -198,230 -87,111 -23,626 -60,510 -165,728 16,345,854
Operating & Service Fee 3,076,061 -7,087 0 0 0 0 3,068,974
Agents Commissions 2,165,113 -15,394 -73 0 0 0 2,149,646
Change in Premium Deficiency/(DPAC) -282,000 0 0 0 0 0 -282,000
Driver Record Abstracts 123,940 -183 0 0 0 0 123,757
Administration Expense 366,497 -830 0 0 0 0 365,667
Bad Debts -352,714 1,569 0 0 0 0 -351,145
General Expenses 5,096,897 -21,925 -73 0 0 0 5,074,899
Premium Finance Fee -10,752 23 0 0 0 0 -10,729
Investment Income 16,536 0 0 0 0 0 16,536
Operating Results 4,660,194 151,423 87,184 23,626 60,510 165,728 5,148,665
Operating Results Distributed 0 0 0 0 0 0 0
Available Funds Distributed 0 0 0 0 0 0 0
Total Distributed to Member 0 0 0 0 0 0 0
Funds held by FA/(Members) 4,660,194 151,423 87,184 23,626 60,510 165,728 5,148,665
FA System 9/14/2021 4:46:56 PM EST
© 2021 Facility Association. All rights reserved.
Page 5 of 26
FACILITY ASSOCIATION RESIDUAL MARKET
MONTHLY (ACCIDENT YEAR) MEMBER PARTICIPATION REPORT AS AT: Month Year Download to CSV based on selection criteria
EXHIBIT 6-A

Company: Jurisdiction: Non Private Passenger
Accident Years
FARM Total (Fiscal Year To Date)2022 &2021
2020 2019 2018 2017 2016 &Prior
Total
Premium Written 198,006,944 6,838,757 -70,054 -302 0 66 204,775,410
Change in Unearned Premium -43,675,977 44,738,965 0 0 0 0 1,062,988
Premium Earned 154,330,967 51,577,722 -70,054 -302 0 66 205,838,398
Paid Loss 11,835,495 23,890,414 11,803,657 4,323,538 3,758,716 9,631,023 65,242,843
Change in Outstanding Loss 17,112,415 11,588,581 -5,416,305 -1,245,523 -2,869,619 -10,291,904 8,877,645
Change in IBNR Provision 50,678,000 -3,980,000 -6,622,000 -3,001,000 -2,096,000 -871,000 34,108,000
O/S Loss Transition Adjustment 0 0 0 0 0 0 0
Claim Service Fee 17,237,745 1,599,185 80,542 528,385 183,247 1,345,043 20,974,147
Change in Retro Claims Expense 1,597,000 5,864,000 127,000 -308,000 -248,000 -1,222,000 5,810,000
Claims and Adj. Expenses Incurred 98,460,655 38,962,180 -27,106 297,400 -1,271,656 -1,408,838 135,012,635
Operating & Service Fee 20,413,117 713,597 -7,225 -30 0 4 21,119,463
Agents Commissions 13,857,558 501,759 -7,431 -16 0 3 14,351,873
Change in Premium Deficiency/(DPAC) -10,936,000 10,980,000 0 0 0 0 44,000
Driver Record Abstracts 1,458,319 61,411 -402 -4 0 0 1,519,324
Administration Expense 2,764,978 100,809 -1,063 -8 0 0 2,864,716
Bad Debts 10,098 16,500 -58 -3 0 -4 26,533
General Expenses 27,568,070 12,374,076 -16,179 -61 0 3 39,925,909
Premium Finance Fee -79,434 -2,821 20 0 0 -4 -82,239
Investment Income 113,320 70,707 0 0 0 0 184,027
Operating Results 28,336,128 309,352 -26,749 -297,641 1,271,656 1,408,897 31,001,642
Operating Results Distributed 0 0 0 0 0 0 0
Available Funds Distributed 72,327,977 -12,253,076 -6,749,727 -2,299,877 -3,223,539 -6,963,280 40,838,478
Total Distributed to Member 72,327,977 -12,253,076 -6,749,727 -2,299,877 -3,223,539 -6,963,280 40,838,478
Funds held by FA/(Members) -43,991,849 12,562,428 6,722,978 2,002,236 4,495,195 8,372,177 -9,836,836
FA System 9/14/2021 4:46:56 PM EST
© 2021 Facility Association. All rights reserved.
Page 6 of 26
FACILITY ASSOCIATION RESIDUAL MARKET
MONTHLY (ACCIDENT YEAR) MEMBER PARTICIPATION REPORT AS AT: Month Year Download to CSV based on selection criteria
EXHIBIT 6-A
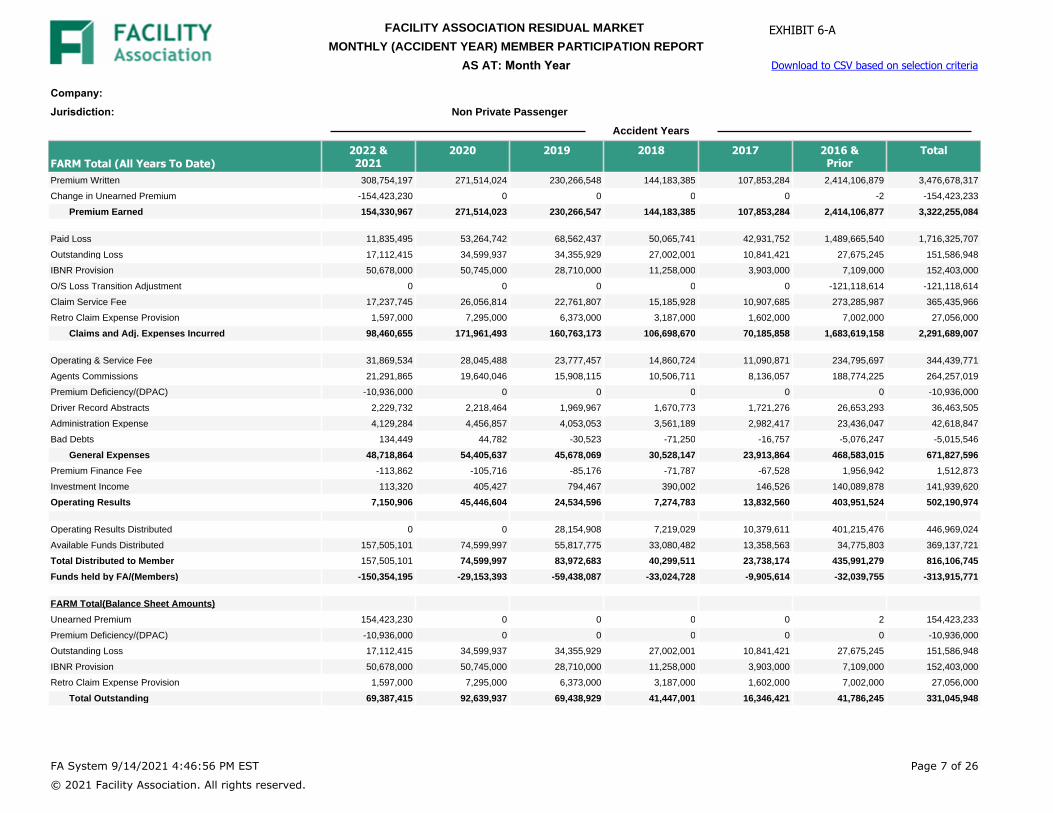
Company: Jurisdiction: Non Private Passenger
Accident Years
FARM Total (All Years To Date)2022 &2021
2020 2019 2018 2017 2016 &Prior
Total
Premium Written 308,754,197 271,514,024 230,266,548 144,183,385 107,853,284 2,414,106,879 3,476,678,317
Change in Unearned Premium -154,423,230 0 0 0 0 -2 -154,423,233
Premium Earned 154,330,967 271,514,023 230,266,547 144,183,385 107,853,284 2,414,106,877 3,322,255,084
Paid Loss 11,835,495 53,264,742 68,562,437 50,065,741 42,931,752 1,489,665,540 1,716,325,707
Outstanding Loss 17,112,415 34,599,937 34,355,929 27,002,001 10,841,421 27,675,245 151,586,948
IBNR Provision 50,678,000 50,745,000 28,710,000 11,258,000 3,903,000 7,109,000 152,403,000
O/S Loss Transition Adjustment 0 0 0 0 0 -121,118,614 -121,118,614
Claim Service Fee 17,237,745 26,056,814 22,761,807 15,185,928 10,907,685 273,285,987 365,435,966
Retro Claim Expense Provision 1,597,000 7,295,000 6,373,000 3,187,000 1,602,000 7,002,000 27,056,000
Claims and Adj. Expenses Incurred 98,460,655 171,961,493 160,763,173 106,698,670 70,185,858 1,683,619,158 2,291,689,007
Operating & Service Fee 31,869,534 28,045,488 23,777,457 14,860,724 11,090,871 234,795,697 344,439,771
Agents Commissions 21,291,865 19,640,046 15,908,115 10,506,711 8,136,057 188,774,225 264,257,019
Premium Deficiency/(DPAC) -10,936,000 0 0 0 0 0 -10,936,000
Driver Record Abstracts 2,229,732 2,218,464 1,969,967 1,670,773 1,721,276 26,653,293 36,463,505
Administration Expense 4,129,284 4,456,857 4,053,053 3,561,189 2,982,417 23,436,047 42,618,847
Bad Debts 134,449 44,782 -30,523 -71,250 -16,757 -5,076,247 -5,015,546
General Expenses 48,718,864 54,405,637 45,678,069 30,528,147 23,913,864 468,583,015 671,827,596
Premium Finance Fee -113,862 -105,716 -85,176 -71,787 -67,528 1,956,942 1,512,873
Investment Income 113,320 405,427 794,467 390,002 146,526 140,089,878 141,939,620
Operating Results 7,150,906 45,446,604 24,534,596 7,274,783 13,832,560 403,951,524 502,190,974
Operating Results Distributed 0 0 28,154,908 7,219,029 10,379,611 401,215,476 446,969,024
Available Funds Distributed 157,505,101 74,599,997 55,817,775 33,080,482 13,358,563 34,775,803 369,137,721
Total Distributed to Member 157,505,101 74,599,997 83,972,683 40,299,511 23,738,174 435,991,279 816,106,745
Funds held by FA/(Members) -150,354,195 -29,153,393 -59,438,087 -33,024,728 -9,905,614 -32,039,755 -313,915,771
FARM Total(Balance Sheet Amounts)
Unearned Premium 154,423,230 0 0 0 0 2 154,423,233
Premium Deficiency/(DPAC) -10,936,000 0 0 0 0 0 -10,936,000
Outstanding Loss 17,112,415 34,599,937 34,355,929 27,002,001 10,841,421 27,675,245 151,586,948
IBNR Provision 50,678,000 50,745,000 28,710,000 11,258,000 3,903,000 7,109,000 152,403,000
Retro Claim Expense Provision 1,597,000 7,295,000 6,373,000 3,187,000 1,602,000 7,002,000 27,056,000
Total Outstanding 69,387,415 92,639,937 69,438,929 41,447,001 16,346,421 41,786,245 331,045,948
FA System 9/14/2021 4:46:56 PM EST
© 2021 Facility Association. All rights reserved.
Page 7 of 26
FACILITY ASSOCIATION RESIDUAL MARKET
MONTHLY (ACCIDENT YEAR) MEMBER PARTICIPATION REPORT AS AT: Month Year Download to CSV based on selection criteria
EXHIBIT 6-A

Company: Jurisdiction: Non Private Passenger
Accident Years
FARM Total (All Years To Date)2022 &2021
2020 2019 2018 2017 2016 &Prior
Total
FARM Total(Memo Items)
Future Cost on Unearned Premium 102,918,000 0 0 0 0 0 102,918,000
Undiscounted Premium Deficiency/(DPAC) -10,936,000 0 0 0 0 0 -10,936,000
Undiscounted Future Cost on Unearned 95,136,000 0 0 0 0 0 95,136,000
PFAD Included IBNR Provision 7,694,000 10,226,000 7,158,000 4,303,000 1,433,000 3,437,000 34,251,000
Undiscounted IBNR Provision 44,327,000 42,145,000 22,577,000 7,499,000 2,673,000 4,472,000 123,693,000
Undiscounted Retro Claim Expense 735,000 5,986,000 5,101,000 2,570,000 1,400,000 6,338,000 22,130,000
FA System 9/14/2021 4:46:56 PM EST
© 2021 Facility Association. All rights reserved.
Page 8 of 26
FACILITY ASSOCIATION RESIDUAL MARKET
MONTHLY (ACCIDENT YEAR) MEMBER PARTICIPATION REPORT AS AT: Month Year Download to CSV based on selection criteria
EXHIBIT 6-A

Company: Jurisdiction: Private and Non Private Passenger Combined
Accident Years
FARM Total (Current Month)2022 &2021
2020 2019 2018 2017 2016 &Prior
Total
Premium Written 42,733,846 -77,973 -130 0 0 0 42,655,743
Change in Unearned Premium -5,319,039 0 0 0 0 0 -5,319,039
Premium Earned 37,414,807 -77,973 -130 0 0 0 37,336,704
Paid Loss 4,275,474 1,401,074 1,444,395 526,001 554,327 1,751,360 9,952,631
Change in Outstanding Loss 3,973,981 1,813,461 138,167 6,760 -353,987 -2,566,438 3,011,944
Change in IBNR Provision 11,737,000 -3,408,000 -1,738,000 -588,000 -250,000 688,000 6,441,000
O/S Loss Transition Adjustment 0 0 0 0 0 0 0
Claim Service Fee 4,159,324 -8,711 -13 6,363 95,893 273,995 4,526,851
Change in Retro Claims Expense 418,000 -79,000 0 -9,000 -148,000 -296,000 -114,000
Claims and Adj. Expenses Incurred 24,563,779 -281,176 -155,451 -57,876 -101,767 -149,083 23,818,426
Operating & Service Fee 4,350,733 -8,045 -13 0 0 0 4,342,675
Agents Commissions 3,312,981 -11,235 -87 0 0 0 3,301,659
Change in Premium Deficiency/(DPAC) -434,000 0 0 0 0 0 -434,000
Driver Record Abstracts 187,112 -207 -1 0 0 0 186,904
Administration Expense 517,905 -944 -2 0 0 0 516,959
Bad Debts -519,171 1,842 0 0 0 0 -517,329
General Expenses 7,415,560 -18,589 -103 0 0 0 7,396,868
Premium Finance Fee -15,181 21 0 0 0 0 -15,160
Investment Income 26,439 0 0 0 0 0 26,439
Operating Results 5,446,726 221,813 155,424 57,876 101,767 149,083 6,132,689
Operating Results Distributed 0 0 0 0 0 0 0
Available Funds Distributed 0 0 0 0 0 0 0
Total Distributed to Member 0 0 0 0 0 0 0
Funds held by FA/(Members) 5,446,726 221,813 155,424 57,876 101,767 149,083 6,132,689
FA System 9/14/2021 4:46:56 PM EST
© 2021 Facility Association. All rights reserved.
Page 9 of 26
FACILITY ASSOCIATION RESIDUAL MARKET
MONTHLY (ACCIDENT YEAR) MEMBER PARTICIPATION REPORT AS AT: Month Year Download to CSV based on selection criteria
EXHIBIT 6-A
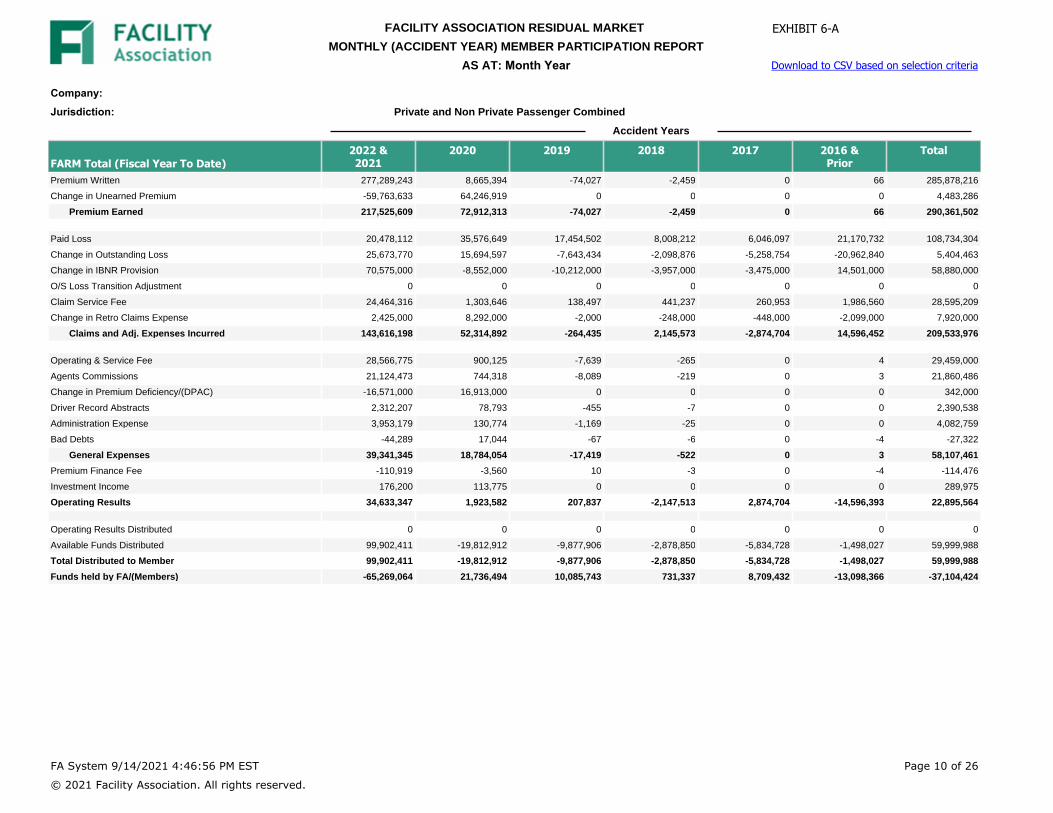
Company: Jurisdiction: Private and Non Private Passenger Combined
Accident Years
FARM Total (Fiscal Year To Date)2022 &2021
2020 2019 2018 2017 2016 &Prior
Total
Premium Written 277,289,243 8,665,394 -74,027 -2,459 0 66 285,878,216
Change in Unearned Premium -59,763,633 64,246,919 0 0 0 0 4,483,286
Premium Earned 217,525,609 72,912,313 -74,027 -2,459 0 66 290,361,502
Paid Loss 20,478,112 35,576,649 17,454,502 8,008,212 6,046,097 21,170,732 108,734,304
Change in Outstanding Loss 25,673,770 15,694,597 -7,643,434 -2,098,876 -5,258,754 -20,962,840 5,404,463
Change in IBNR Provision 70,575,000 -8,552,000 -10,212,000 -3,957,000 -3,475,000 14,501,000 58,880,000
O/S Loss Transition Adjustment 0 0 0 0 0 0 0
Claim Service Fee 24,464,316 1,303,646 138,497 441,237 260,953 1,986,560 28,595,209
Change in Retro Claims Expense 2,425,000 8,292,000 -2,000 -248,000 -448,000 -2,099,000 7,920,000
Claims and Adj. Expenses Incurred 143,616,198 52,314,892 -264,435 2,145,573 -2,874,704 14,596,452 209,533,976
Operating & Service Fee 28,566,775 900,125 -7,639 -265 0 4 29,459,000
Agents Commissions 21,124,473 744,318 -8,089 -219 0 3 21,860,486
Change in Premium Deficiency/(DPAC) -16,571,000 16,913,000 0 0 0 0 342,000
Driver Record Abstracts 2,312,207 78,793 -455 -7 0 0 2,390,538
Administration Expense 3,953,179 130,774 -1,169 -25 0 0 4,082,759
Bad Debts -44,289 17,044 -67 -6 0 -4 -27,322
General Expenses 39,341,345 18,784,054 -17,419 -522 0 3 58,107,461
Premium Finance Fee -110,919 -3,560 10 -3 0 -4 -114,476
Investment Income 176,200 113,775 0 0 0 0 289,975
Operating Results 34,633,347 1,923,582 207,837 -2,147,513 2,874,704 -14,596,393 22,895,564
Operating Results Distributed 0 0 0 0 0 0 0
Available Funds Distributed 99,902,411 -19,812,912 -9,877,906 -2,878,850 -5,834,728 -1,498,027 59,999,988
Total Distributed to Member 99,902,411 -19,812,912 -9,877,906 -2,878,850 -5,834,728 -1,498,027 59,999,988
Funds held by FA/(Members) -65,269,064 21,736,494 10,085,743 731,337 8,709,432 -13,098,366 -37,104,424
FA System 9/14/2021 4:46:56 PM EST
© 2021 Facility Association. All rights reserved.
Page 10 of 26
FACILITY ASSOCIATION RESIDUAL MARKET
MONTHLY (ACCIDENT YEAR) MEMBER PARTICIPATION REPORT AS AT: Month Year Download to CSV based on selection criteria
EXHIBIT 6-A

Company: Jurisdiction: Private and Non Private Passenger Combined
Accident Years
FARM Total (All Years To Date)2022 &2021
2020 2019 2018 2017 2016 &Prior
Total
Premium Written 435,021,272 394,222,253 327,032,675 216,879,839 176,848,759 7,689,063,395 9,239,068,192
Change in Unearned Premium -217,495,662 0 0 0 0 -2 -217,495,666
Premium Earned 217,525,609 394,222,252 327,032,674 216,879,839 176,848,759 7,689,063,392 9,021,572,526
Paid Loss 20,478,112 80,770,202 104,065,127 81,281,897 71,870,903 5,221,850,918 5,580,317,159
Outstanding Loss 25,673,770 52,941,649 56,237,862 39,519,546 17,147,726 87,182,689 278,703,242
IBNR Provision 70,575,000 72,228,000 38,595,000 15,913,000 5,570,000 31,966,000 234,847,000
O/S Loss Transition Adjustment 0 0 0 0 0 -1,014,692,632 -1,014,692,632
Claim Service Fee 24,464,316 37,365,911 33,080,114 22,918,732 18,435,639 1,030,398,184 1,166,662,896
Retro Claim Expense Provision 2,425,000 10,745,000 8,779,000 4,699,000 2,521,000 14,098,000 43,267,000
Claims and Adj. Expenses Incurred 143,616,198 254,050,762 240,757,103 164,332,175 115,545,268 5,370,803,159 6,289,104,665
Operating & Service Fee 44,873,509 40,721,299 33,761,511 22,334,410 18,199,760 798,908,546 958,799,035
Agents Commissions 32,701,207 30,743,685 24,902,015 17,477,380 14,786,209 683,976,195 804,586,691
Premium Deficiency/(DPAC) -16,571,000 0 0 0 0 0 -16,571,000
Driver Record Abstracts 3,608,096 3,725,466 3,511,724 2,959,872 3,231,481 89,907,551 106,944,190
Administration Expense 5,933,838 6,382,967 5,896,606 5,495,304 5,005,172 34,076,544 62,790,431
Bad Debts -6,546 68,998 -9,197 -129,307 -101,076 -5,950,343 -6,127,471
General Expenses 70,539,104 81,642,415 68,062,659 48,137,659 41,121,546 1,600,918,493 1,910,421,876
Premium Finance Fee -158,364 -146,536 -120,024 -107,397 -108,307 16,934,408 16,293,780
Investment Income 176,200 630,401 1,206,682 636,932 256,769 772,692,764 775,599,748
Operating Results 3,388,143 59,012,940 19,299,570 4,939,540 20,330,407 1,506,968,912 1,613,939,513
Operating Results Distributed 0 0 23,941,924 4,973,089 14,532,482 1,546,304,904 1,589,752,399
Available Funds Distributed 221,216,125 109,254,953 83,545,680 48,217,482 20,638,503 107,826,357 590,699,100
Total Distributed to Member 221,216,125 109,254,953 107,487,604 53,190,571 35,170,985 1,654,131,261 2,180,451,499
Funds held by FA/(Members) -217,827,982 -50,242,013 -88,188,034 -48,251,031 -14,840,578 -147,162,349 -566,511,986
FARM Total(Balance Sheet Amounts)
Unearned Premium 217,495,662 0 0 0 0 2 217,495,666
Premium Deficiency/(DPAC) -16,571,000 0 0 0 0 0 -16,571,000
Outstanding Loss 25,673,770 52,941,649 56,237,862 39,519,546 17,147,726 87,182,689 278,703,242
IBNR Provision 70,575,000 72,228,000 38,595,000 15,913,000 5,570,000 31,966,000 234,847,000
Retro Claim Expense Provision 2,425,000 10,745,000 8,779,000 4,699,000 2,521,000 14,098,000 43,267,000
Total Outstanding 98,673,770 135,914,649 103,611,862 60,131,546 25,238,726 133,246,689 556,817,242
FA System 9/14/2021 4:46:57 PM EST
© 2021 Facility Association. All rights reserved.
Page 11 of 26
FACILITY ASSOCIATION RESIDUAL MARKET
MONTHLY (ACCIDENT YEAR) MEMBER PARTICIPATION REPORT AS AT: Month Year Download to CSV based on selection criteria
EXHIBIT 6-A

Company: Jurisdiction: Private and Non Private Passenger Combined
Accident Years
FARM Total (All Years To Date)2022 &2021
2020 2019 2018 2017 2016 &Prior
Total
FARM Total(Memo Items)
Future Cost on Unearned Premium 149,852,000 0 0 0 0 0 149,852,000
Undiscounted Premium Deficiency/(DPAC) -16,571,000 0 0 0 0 0 -16,571,000
Undiscounted Future Cost on Unearned 138,713,000 0 0 0 0 0 138,713,000
PFAD Included IBNR Provision 10,847,000 14,793,000 10,631,000 6,177,000 2,204,000 11,530,000 56,182,000
Undiscounted IBNR Provision 61,608,000 59,777,000 29,493,000 10,529,000 3,679,000 22,434,000 187,520,000
Undiscounted Retro Claim Expense 1,129,000 8,776,000 6,994,000 3,794,000 2,169,000 12,827,000 35,689,000
FA System 9/14/2021 4:46:57 PM EST
© 2021 Facility Association. All rights reserved.
Page 12 of 26
FACILITY ASSOCIATION RESIDUAL MARKET
MONTHLY (ACCIDENT YEAR) MEMBER PARTICIPATION REPORT AS AT: Month Year Download to CSV based on selection criteria
EXHIBIT 6-A
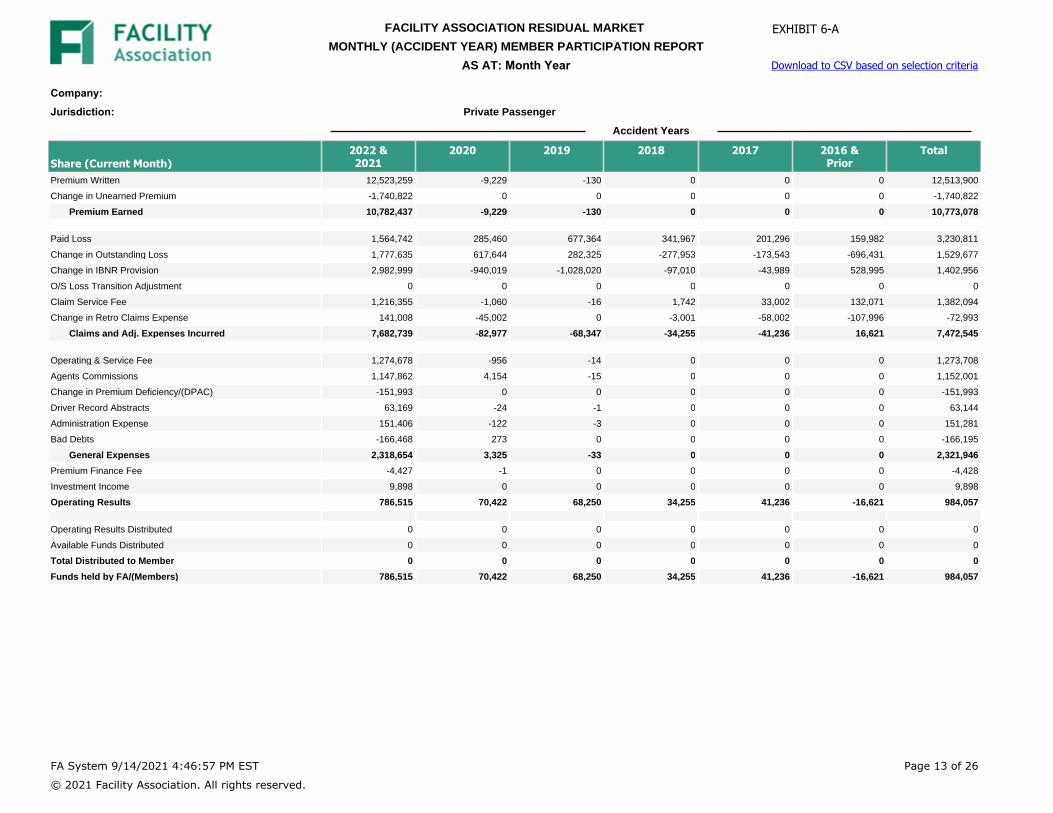
Company: Jurisdiction: Private Passenger
Accident Years
Share (Current Month)2022 &2021
2020 2019 2018 2017 2016 &Prior
Total
Premium Written 12,523,259 -9,229 -130 0 0 0 12,513,900
Change in Unearned Premium -1,740,822 0 0 0 0 0 -1,740,822
Premium Earned 10,782,437 -9,229 -130 0 0 0 10,773,078
Paid Loss 1,564,742 285,460 677,364 341,967 201,296 159,982 3,230,811
Change in Outstanding Loss 1,777,635 617,644 282,325 -277,953 -173,543 -696,431 1,529,677
Change in IBNR Provision 2,982,999 -940,019 -1,028,020 -97,010 -43,989 528,995 1,402,956
O/S Loss Transition Adjustment 0 0 0 0 0 0 0
Claim Service Fee 1,216,355 -1,060 -16 1,742 33,002 132,071 1,382,094
Change in Retro Claims Expense 141,008 -45,002 0 -3,001 -58,002 -107,996 -72,993
Claims and Adj. Expenses Incurred 7,682,739 -82,977 -68,347 -34,255 -41,236 16,621 7,472,545
Operating & Service Fee 1,274,678 -956 -14 0 0 0 1,273,708
Agents Commissions 1,147,862 4,154 -15 0 0 0 1,152,001
Change in Premium Deficiency/(DPAC) -151,993 0 0 0 0 0 -151,993
Driver Record Abstracts 63,169 -24 -1 0 0 0 63,144
Administration Expense 151,406 -122 -3 0 0 0 151,281
Bad Debts -166,468 273 0 0 0 0 -166,195
General Expenses 2,318,654 3,325 -33 0 0 0 2,321,946
Premium Finance Fee -4,427 -1 0 0 0 0 -4,428
Investment Income 9,898 0 0 0 0 0 9,898
Operating Results 786,515 70,422 68,250 34,255 41,236 -16,621 984,057
Operating Results Distributed 0 0 0 0 0 0 0
Available Funds Distributed 0 0 0 0 0 0 0
Total Distributed to Member 0 0 0 0 0 0 0
Funds held by FA/(Members) 786,515 70,422 68,250 34,255 41,236 -16,621 984,057
FA System 9/14/2021 4:46:57 PM EST
© 2021 Facility Association. All rights reserved.
Page 13 of 26
FACILITY ASSOCIATION RESIDUAL MARKET
MONTHLY (ACCIDENT YEAR) MEMBER PARTICIPATION REPORT AS AT: Month Year Download to CSV based on selection criteria
EXHIBIT 6-A

Company: Jurisdiction: Private Passenger
Accident Years
Share (Fiscal Year To Date)2022 &2021
2020 2019 2018 2017 2016 &Prior
Total
Premium Written 79,282,289 1,826,623 -3,976 -2,149 0 0 81,102,787
Change in Unearned Premium -16,087,644 19,507,962 0 0 0 0 3,420,318
Premium Earned 63,194,645 21,334,585 -3,976 -2,149 0 0 84,523,105
Paid Loss 8,642,615 11,686,226 5,650,848 3,684,670 2,287,390 11,539,714 43,491,463
Change in Outstanding Loss 8,561,355 4,106,014 -2,227,123 -853,349 -2,389,134 -10,670,950 -3,473,187
Change in IBNR Provision 19,896,998 -4,572,007 -3,590,021 -956,001 -1,379,008 15,372,005 24,771,966
O/S Loss Transition Adjustment 0 0 0 0 0 0 0
Claim Service Fee 7,226,571 -295,535 57,962 -87,140 77,715 641,501 7,621,074
Change in Retro Claims Expense 828,006 2,428,017 -129,005 59,997 -199,987 -876,984 2,110,044
Claims and Adj. Expenses Incurred 45,155,545 13,352,715 -237,339 1,848,177 -1,603,024 16,005,286 74,521,360
Operating & Service Fee 8,153,666 186,552 -416 -229 7 0 8,339,580
Agents Commissions 7,266,913 242,562 -657 -213 -1 0 7,508,604
Change in Premium Deficiency/(DPAC) -5,634,993 5,932,994 0 0 0 0 298,001
Driver Record Abstracts 853,875 17,363 -66 -1 9 0 871,180
Administration Expense 1,188,215 29,966 -114 -23 6 0 1,218,050
Bad Debts -54,396 533 -16 3 6 0 -53,870
General Expenses 11,773,280 6,409,970 -1,269 -463 27 0 18,181,545
Premium Finance Fee -31,485 -734 -9 -1 -3 0 -32,232
Investment Income 62,870 43,069 -3 -5 2 0 105,933
Operating Results 6,297,205 1,614,235 234,620 -1,849,869 1,602,996 -16,005,286 -8,106,099
Operating Results Distributed 0 0 7 6 18 0 31
Available Funds Distributed 27,574,424 -7,559,839 -3,128,180 -578,981 -2,611,195 5,465,175 19,161,404
Total Distributed to Member 27,574,424 -7,559,839 -3,128,173 -578,975 -2,611,177 5,465,175 19,161,435
Funds held by FA/(Members) -21,277,219 9,174,074 3,362,793 -1,270,894 4,214,173 -21,470,461 -27,267,534
FA System 9/14/2021 4:46:57 PM EST
© 2021 Facility Association. All rights reserved.
Page 14 of 26
FACILITY ASSOCIATION RESIDUAL MARKET
MONTHLY (ACCIDENT YEAR) MEMBER PARTICIPATION REPORT AS AT: Month Year Download to CSV based on selection criteria
EXHIBIT 6-A

Company: Jurisdiction: Private Passenger
Accident Years
Share (All Years To Date)2022 &2021
2020 2019 2018 2017 2016 &Prior
Total
Premium Written 126,267,059 122,708,219 96,766,119 72,696,451 68,995,475 5,274,956,527 5,762,389,850
Change in Unearned Premium -63,072,414 0 0 0 0 0 -63,072,414
Premium Earned 63,194,645 122,708,219 96,766,119 72,696,451 68,995,475 5,274,956,527 5,699,317,436
Paid Loss 8,642,615 27,505,444 35,502,690 31,216,155 28,939,149 3,732,185,351 3,863,991,404
Outstanding Loss 8,561,355 18,341,712 21,881,944 12,517,547 6,306,306 59,507,404 127,116,268
IBNR Provision 19,896,998 21,482,990 9,884,984 4,654,996 1,666,995 24,856,982 82,443,945
O/S Loss Transition Adjustment 0 0 0 0 0 -893,573,966 -893,573,966
Claim Service Fee 7,226,571 11,309,097 10,318,304 7,732,807 7,527,950 757,112,171 801,226,900
Retro Claim Expense Provision 828,006 3,450,012 2,405,997 1,511,993 919,004 7,095,978 16,210,990
Claims and Adj. Expenses Incurred 45,155,545 82,089,255 79,993,919 57,633,498 45,359,404 3,687,183,920 3,997,415,541
Operating & Service Fee 13,003,979 12,675,817 9,984,059 7,473,694 7,108,901 564,112,859 614,359,309
Agents Commissions 11,409,342 11,103,637 8,993,894 6,970,660 6,650,147 495,201,928 540,329,608
Premium Deficiency/(DPAC) -5,634,993 0 0 0 0 0 -5,634,993
Driver Record Abstracts 1,378,353 1,506,984 1,541,743 1,289,091 1,510,207 63,254,231 70,480,609
Administration Expense 1,804,565 1,926,103 1,843,545 1,934,112 2,022,757 10,640,515 20,171,597
Bad Debts -140,997 24,220 21,313 -58,046 -84,311 -874,014 -1,111,835
General Expenses 21,820,249 27,236,761 22,384,554 17,609,511 17,207,701 1,132,335,519 1,238,594,295
Premium Finance Fee -44,503 -40,807 -34,844 -35,591 -40,761 14,977,585 14,781,079
Investment Income 62,870 224,969 412,214 246,929 110,247 632,602,860 633,660,089
Operating Results -3,762,782 13,566,365 -5,234,984 -2,335,220 6,497,856 1,103,017,533 1,111,748,768
Operating Results Distributed 0 0 -4,212,985 -2,245,950 4,152,878 1,145,089,423 1,142,783,366
Available Funds Distributed 63,711,018 34,654,959 27,727,905 15,136,993 7,279,937 73,050,432 221,561,244
Total Distributed to Member 63,711,018 34,654,959 23,514,920 12,891,043 11,432,815 1,218,139,855 1,364,344,610
Funds held by FA/(Members) -67,473,800 -21,088,594 -28,749,904 -15,226,263 -4,934,959 -115,122,322 -252,595,842
FARM Total(Balance Sheet Amounts)
Unearned Premium 63,072,414 0 0 0 0 0 63,072,414
Premium Deficiency/(DPAC) -5,634,993 0 0 0 0 0 -5,634,993
Outstanding Loss 8,561,355 18,341,712 21,881,944 12,517,547 6,306,306 59,507,404 127,116,268
IBNR Provision 19,896,998 21,482,990 9,884,984 4,654,996 1,666,995 24,856,982 82,443,945
Retro Claim Expense Provision 828,006 3,450,012 2,405,997 1,511,993 919,004 7,095,978 16,210,990
Total Outstanding 29,286,359 43,274,714 34,172,925 18,684,536 8,892,305 91,460,364 225,771,203
FA System 9/14/2021 4:46:57 PM EST
© 2021 Facility Association. All rights reserved.
Page 15 of 26
FACILITY ASSOCIATION RESIDUAL MARKET
MONTHLY (ACCIDENT YEAR) MEMBER PARTICIPATION REPORT AS AT: Month Year Download to CSV based on selection criteria
EXHIBIT 6-A
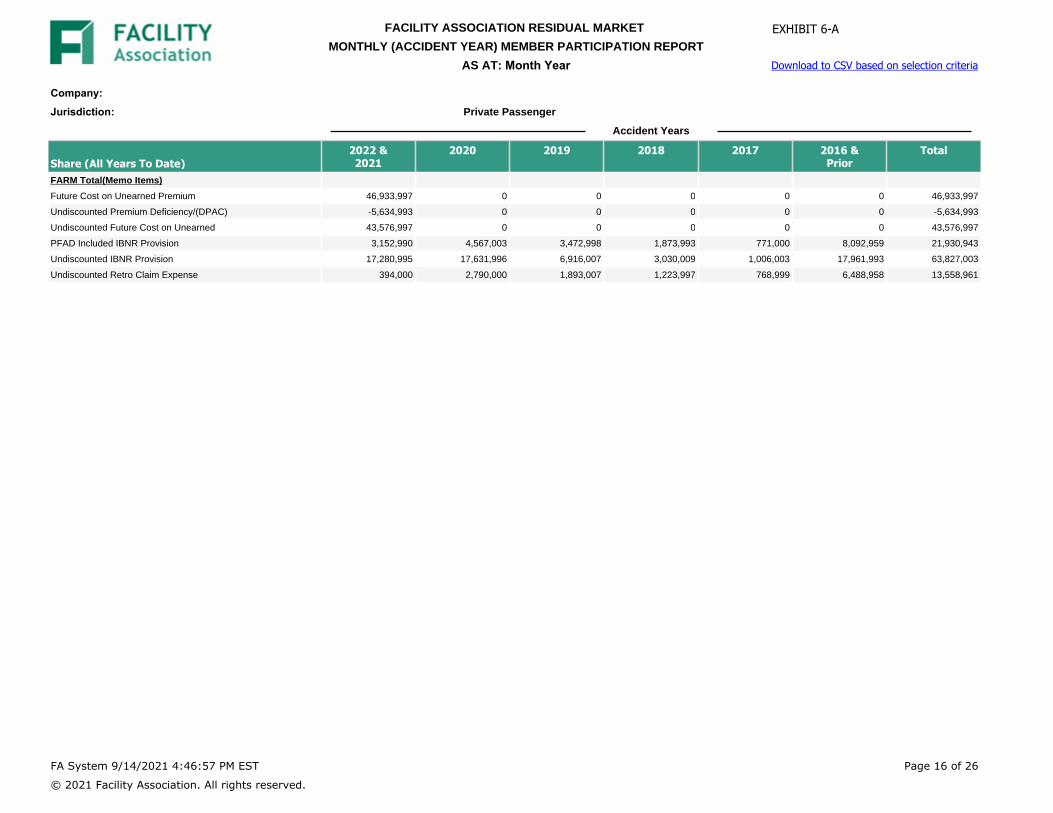
Company: Jurisdiction: Private Passenger
Accident Years
Share (All Years To Date)2022 &2021
2020 2019 2018 2017 2016 &Prior
Total
FARM Total(Memo Items)
Future Cost on Unearned Premium 46,933,997 0 0 0 0 0 46,933,997
Undiscounted Premium Deficiency/(DPAC) -5,634,993 0 0 0 0 0 -5,634,993
Undiscounted Future Cost on Unearned 43,576,997 0 0 0 0 0 43,576,997
PFAD Included IBNR Provision 3,152,990 4,567,003 3,472,998 1,873,993 771,000 8,092,959 21,930,943
Undiscounted IBNR Provision 17,280,995 17,631,996 6,916,007 3,030,009 1,006,003 17,961,993 63,827,003
Undiscounted Retro Claim Expense 394,000 2,790,000 1,893,007 1,223,997 768,999 6,488,958 13,558,961
FA System 9/14/2021 4:46:57 PM EST
© 2021 Facility Association. All rights reserved.
Page 16 of 26
FACILITY ASSOCIATION RESIDUAL MARKET
MONTHLY (ACCIDENT YEAR) MEMBER PARTICIPATION REPORT AS AT: Month Year Download to CSV based on selection criteria
EXHIBIT 6-A
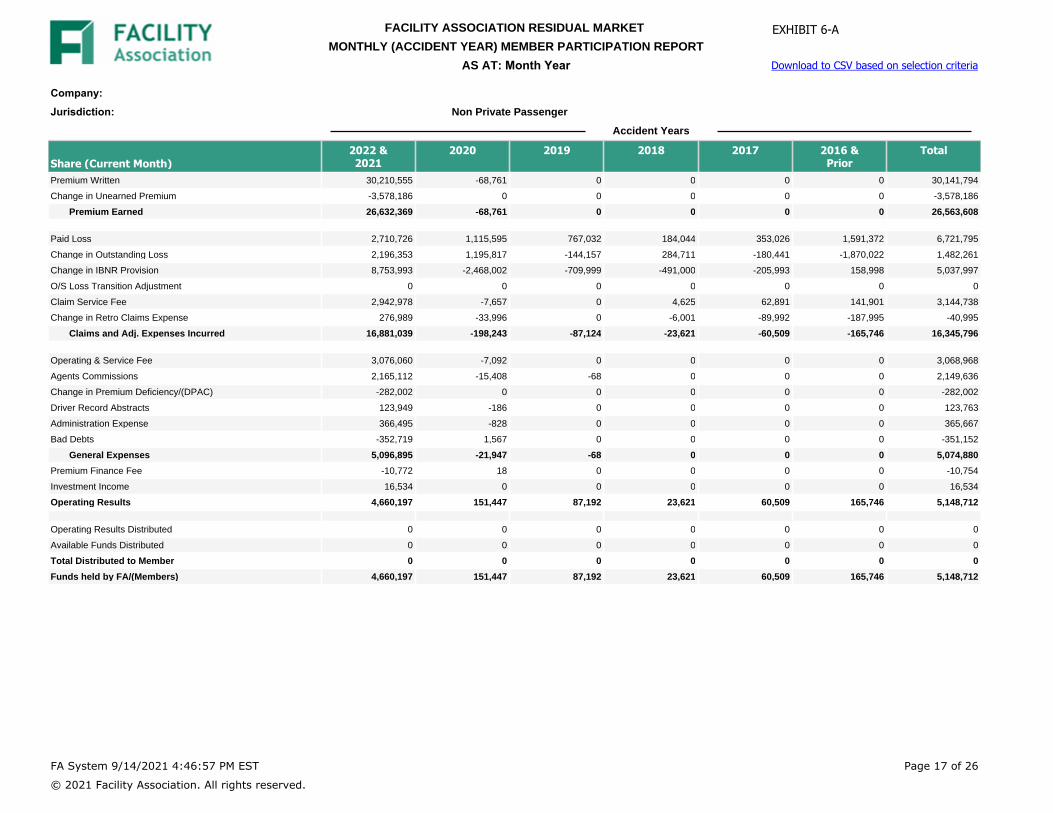
Company: Jurisdiction: Non Private Passenger
Accident Years
Share (Current Month)2022 &2021
2020 2019 2018 2017 2016 &Prior
Total
Premium Written 30,210,555 -68,761 0 0 0 0 30,141,794
Change in Unearned Premium -3,578,186 0 0 0 0 0 -3,578,186
Premium Earned 26,632,369 -68,761 0 0 0 0 26,563,608
Paid Loss 2,710,726 1,115,595 767,032 184,044 353,026 1,591,372 6,721,795
Change in Outstanding Loss 2,196,353 1,195,817 -144,157 284,711 -180,441 -1,870,022 1,482,261
Change in IBNR Provision 8,753,993 -2,468,002 -709,999 -491,000 -205,993 158,998 5,037,997
O/S Loss Transition Adjustment 0 0 0 0 0 0 0
Claim Service Fee 2,942,978 -7,657 0 4,625 62,891 141,901 3,144,738
Change in Retro Claims Expense 276,989 -33,996 0 -6,001 -89,992 -187,995 -40,995
Claims and Adj. Expenses Incurred 16,881,039 -198,243 -87,124 -23,621 -60,509 -165,746 16,345,796
Operating & Service Fee 3,076,060 -7,092 0 0 0 0 3,068,968
Agents Commissions 2,165,112 -15,408 -68 0 0 0 2,149,636
Change in Premium Deficiency/(DPAC) -282,002 0 0 0 0 0 -282,002
Driver Record Abstracts 123,949 -186 0 0 0 0 123,763
Administration Expense 366,495 -828 0 0 0 0 365,667
Bad Debts -352,719 1,567 0 0 0 0 -351,152
General Expenses 5,096,895 -21,947 -68 0 0 0 5,074,880
Premium Finance Fee -10,772 18 0 0 0 0 -10,754
Investment Income 16,534 0 0 0 0 0 16,534
Operating Results 4,660,197 151,447 87,192 23,621 60,509 165,746 5,148,712
Operating Results Distributed 0 0 0 0 0 0 0
Available Funds Distributed 0 0 0 0 0 0 0
Total Distributed to Member 0 0 0 0 0 0 0
Funds held by FA/(Members) 4,660,197 151,447 87,192 23,621 60,509 165,746 5,148,712
FA System 9/14/2021 4:46:57 PM EST
© 2021 Facility Association. All rights reserved.
Page 17 of 26
FACILITY ASSOCIATION RESIDUAL MARKET
MONTHLY (ACCIDENT YEAR) MEMBER PARTICIPATION REPORT AS AT: Month Year Download to CSV based on selection criteria
EXHIBIT 6-A
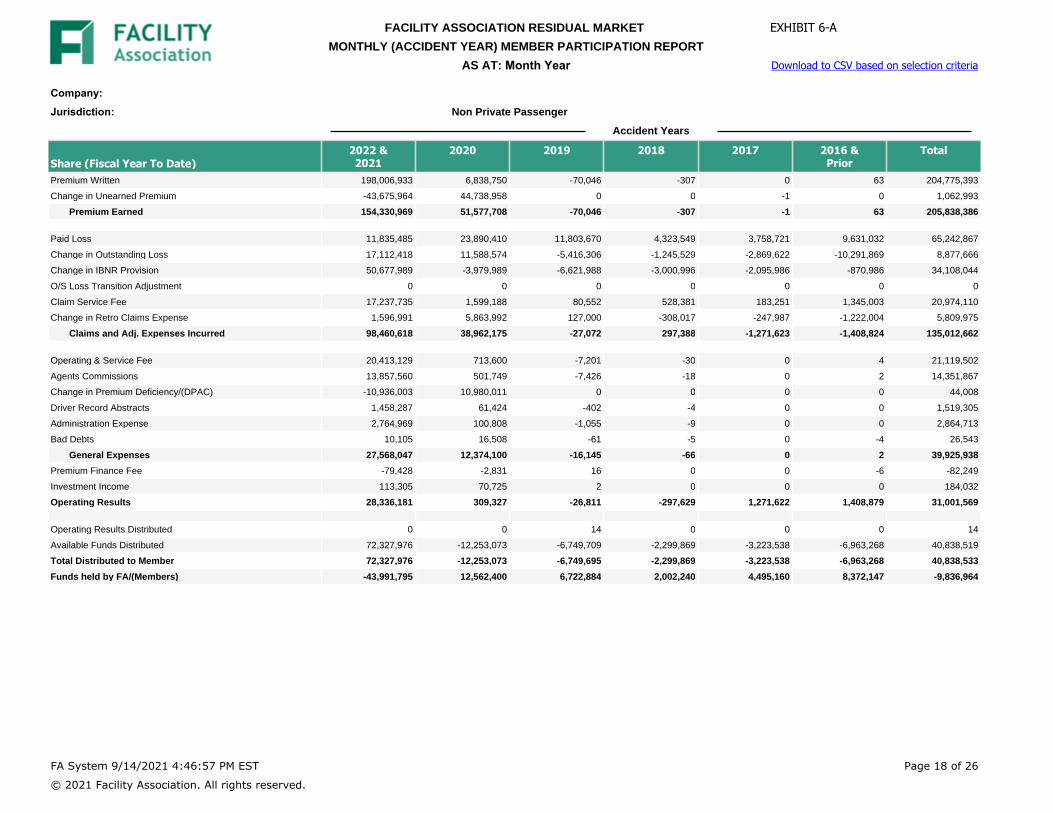
Company: Jurisdiction: Non Private Passenger
Accident Years
Share (Fiscal Year To Date)2022 &2021
2020 2019 2018 2017 2016 &Prior
Total
Premium Written 198,006,933 6,838,750 -70,046 -307 0 63 204,775,393
Change in Unearned Premium -43,675,964 44,738,958 0 0 -1 0 1,062,993
Premium Earned 154,330,969 51,577,708 -70,046 -307 -1 63 205,838,386
Paid Loss 11,835,485 23,890,410 11,803,670 4,323,549 3,758,721 9,631,032 65,242,867
Change in Outstanding Loss 17,112,418 11,588,574 -5,416,306 -1,245,529 -2,869,622 -10,291,869 8,877,666
Change in IBNR Provision 50,677,989 -3,979,989 -6,621,988 -3,000,996 -2,095,986 -870,986 34,108,044
O/S Loss Transition Adjustment 0 0 0 0 0 0 0
Claim Service Fee 17,237,735 1,599,188 80,552 528,381 183,251 1,345,003 20,974,110
Change in Retro Claims Expense 1,596,991 5,863,992 127,000 -308,017 -247,987 -1,222,004 5,809,975
Claims and Adj. Expenses Incurred 98,460,618 38,962,175 -27,072 297,388 -1,271,623 -1,408,824 135,012,662
Operating & Service Fee 20,413,129 713,600 -7,201 -30 0 4 21,119,502
Agents Commissions 13,857,560 501,749 -7,426 -18 0 2 14,351,867
Change in Premium Deficiency/(DPAC) -10,936,003 10,980,011 0 0 0 0 44,008
Driver Record Abstracts 1,458,287 61,424 -402 -4 0 0 1,519,305
Administration Expense 2,764,969 100,808 -1,055 -9 0 0 2,864,713
Bad Debts 10,105 16,508 -61 -5 0 -4 26,543
General Expenses 27,568,047 12,374,100 -16,145 -66 0 2 39,925,938
Premium Finance Fee -79,428 -2,831 16 0 0 -6 -82,249
Investment Income 113,305 70,725 2 0 0 0 184,032
Operating Results 28,336,181 309,327 -26,811 -297,629 1,271,622 1,408,879 31,001,569
Operating Results Distributed 0 0 14 0 0 0 14
Available Funds Distributed 72,327,976 -12,253,073 -6,749,709 -2,299,869 -3,223,538 -6,963,268 40,838,519
Total Distributed to Member 72,327,976 -12,253,073 -6,749,695 -2,299,869 -3,223,538 -6,963,268 40,838,533
Funds held by FA/(Members) -43,991,795 12,562,400 6,722,884 2,002,240 4,495,160 8,372,147 -9,836,964
FA System 9/14/2021 4:46:57 PM EST
© 2021 Facility Association. All rights reserved.
Page 18 of 26
FACILITY ASSOCIATION RESIDUAL MARKET
MONTHLY (ACCIDENT YEAR) MEMBER PARTICIPATION REPORT AS AT: Month Year Download to CSV based on selection criteria
EXHIBIT 6-A

Company: Jurisdiction: Non Private Passenger
Accident Years
Share (All Years To Date)2022 &2021
2020 2019 2018 2017 2016 &Prior
Total
Premium Written 308,754,191 271,514,017 230,266,553 144,183,389 107,853,286 2,414,106,898 3,476,678,334
Change in Unearned Premium -154,423,222 -14 0 0 -1 -1 -154,423,238
Premium Earned 154,330,969 271,514,003 230,266,553 144,183,389 107,853,285 2,414,106,897 3,322,255,096
Paid Loss 11,835,485 53,264,741 68,562,437 50,065,744 42,931,750 1,489,665,548 1,716,325,705
Outstanding Loss 17,112,418 34,599,936 34,355,918 27,001,996 10,841,421 27,675,248 151,586,937
IBNR Provision 50,677,989 50,745,007 28,710,001 11,257,998 3,903,009 7,108,996 152,403,000
O/S Loss Transition Adjustment 0 0 0 0 0 -121,118,621 -121,118,621
Claim Service Fee 17,237,735 26,056,813 22,761,809 15,185,920 10,907,679 273,285,900 365,435,856
Retro Claim Expense Provision 1,596,991 7,294,995 6,373,002 3,186,994 1,602,013 7,001,970 27,055,965
Claims and Adj. Expenses Incurred 98,460,618 171,961,492 160,763,167 106,698,652 70,185,872 1,683,619,041 2,291,688,842
Operating & Service Fee 31,869,538 28,045,486 23,777,473 14,860,729 11,090,861 234,795,643 344,439,730
Agents Commissions 21,291,868 19,640,039 15,908,111 10,506,707 8,136,065 188,774,182 264,256,972
Premium Deficiency/(DPAC) -10,936,003 0 0 0 0 0 -10,936,003
Driver Record Abstracts 2,229,706 2,218,465 1,969,975 1,670,763 1,721,268 26,653,230 36,463,407
Administration Expense 4,129,281 4,456,862 4,053,053 3,561,185 2,982,415 23,436,000 42,618,796
Bad Debts 134,454 44,787 -30,526 -71,257 -16,758 -5,075,991 -5,015,291
General Expenses 48,718,844 54,405,639 45,678,086 30,528,127 23,913,851 468,583,064 671,827,611
Premium Finance Fee -113,843 -105,709 -85,175 -71,765 -67,521 1,957,093 1,513,080
Investment Income 113,305 405,424 794,462 389,990 146,518 140,089,818 141,939,517
Operating Results 7,150,969 45,446,587 24,534,587 7,274,835 13,832,559 403,951,703 502,191,240
Operating Results Distributed 0 0 28,154,910 7,219,028 10,379,606 401,215,525 446,969,069
Available Funds Distributed 157,505,098 74,599,994 55,817,783 33,080,485 13,358,563 34,775,721 369,137,644
Total Distributed to Member 157,505,098 74,599,994 83,972,693 40,299,513 23,738,169 435,991,246 816,106,713
Funds held by FA/(Members) -150,354,129 -29,153,407 -59,438,106 -33,024,678 -9,905,610 -32,039,543 -313,915,473
FARM Total(Balance Sheet Amounts)
Unearned Premium 154,423,222 14 0 0 1 1 154,423,238
Premium Deficiency/(DPAC) -10,936,003 0 0 0 0 0 -10,936,003
Outstanding Loss 17,112,418 34,599,936 34,355,918 27,001,996 10,841,421 27,675,248 151,586,937
IBNR Provision 50,677,989 50,745,007 28,710,001 11,257,998 3,903,009 7,108,996 152,403,000
Retro Claim Expense Provision 1,596,991 7,294,995 6,373,002 3,186,994 1,602,013 7,001,970 27,055,965
Total Outstanding 69,387,398 92,639,938 69,438,921 41,446,988 16,346,443 41,786,214 331,045,902
FA System 9/14/2021 4:46:57 PM EST
© 2021 Facility Association. All rights reserved.
Page 19 of 26
FACILITY ASSOCIATION RESIDUAL MARKET
MONTHLY (ACCIDENT YEAR) MEMBER PARTICIPATION REPORT AS AT: Month Year Download to CSV based on selection criteria
EXHIBIT 6-A

Company: Jurisdiction: Non Private Passenger
Accident Years
Share (All Years To Date)2022 &2021
2020 2019 2018 2017 2016 &Prior
Total
FARM Total(Memo Items)
Future Cost on Unearned Premium 102,918,001 0 0 0 0 0 102,918,001
Undiscounted Premium Deficiency/(DPAC) -10,936,003 0 0 0 0 0 -10,936,003
Undiscounted Future Cost on Unearned 95,136,003 0 0 0 0 0 95,136,003
PFAD Included IBNR Provision 7,693,997 10,226,010 7,157,993 4,303,005 1,432,996 3,436,905 34,250,906
Undiscounted IBNR Provision 44,327,001 42,145,000 22,576,995 7,498,991 2,673,003 4,471,995 123,692,985
Undiscounted Retro Claim Expense 734,994 5,986,013 5,101,012 2,569,994 1,400,005 6,337,971 22,129,989
FA System 9/14/2021 4:46:57 PM EST
© 2021 Facility Association. All rights reserved.
Page 20 of 26
FACILITY ASSOCIATION RESIDUAL MARKET
MONTHLY (ACCIDENT YEAR) MEMBER PARTICIPATION REPORT AS AT: Month Year Download to CSV based on selection criteria
EXHIBIT 6-A
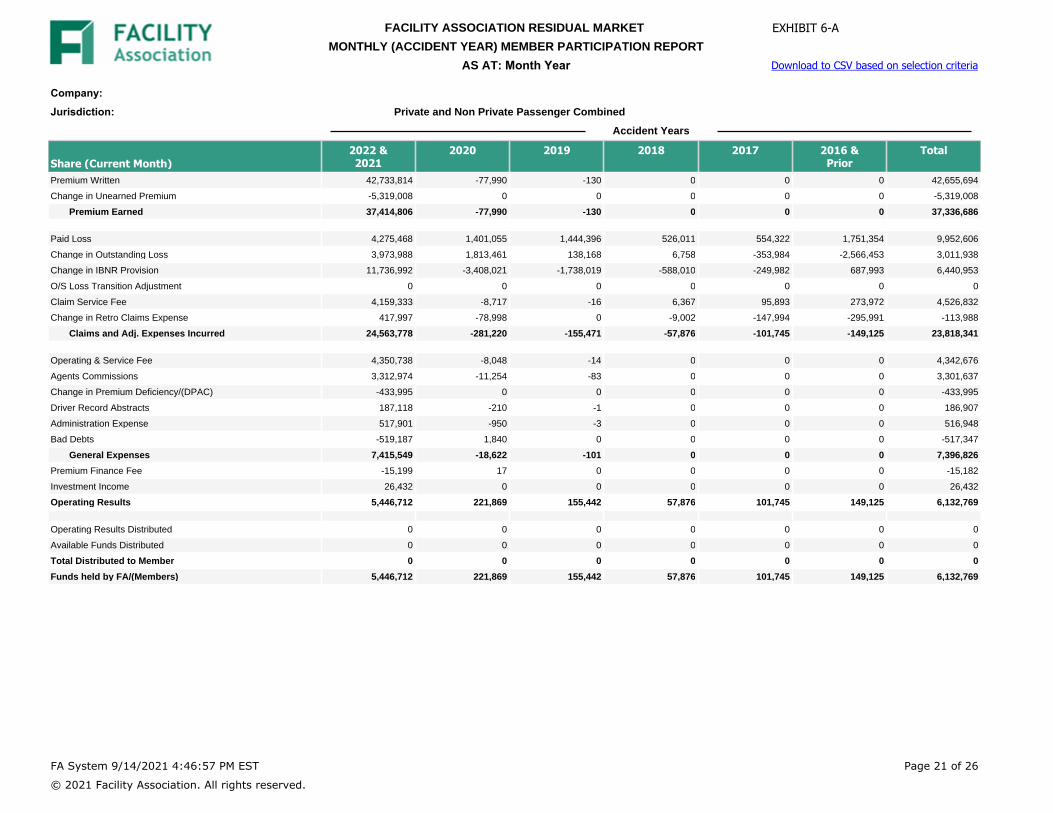
Company: Jurisdiction: Private and Non Private Passenger Combined
Accident Years
Share (Current Month)2022 &2021
2020 2019 2018 2017 2016 &Prior
Total
Premium Written 42,733,814 -77,990 -130 0 0 0 42,655,694
Change in Unearned Premium -5,319,008 0 0 0 0 0 -5,319,008
Premium Earned 37,414,806 -77,990 -130 0 0 0 37,336,686
Paid Loss 4,275,468 1,401,055 1,444,396 526,011 554,322 1,751,354 9,952,606
Change in Outstanding Loss 3,973,988 1,813,461 138,168 6,758 -353,984 -2,566,453 3,011,938
Change in IBNR Provision 11,736,992 -3,408,021 -1,738,019 -588,010 -249,982 687,993 6,440,953
O/S Loss Transition Adjustment 0 0 0 0 0 0 0
Claim Service Fee 4,159,333 -8,717 -16 6,367 95,893 273,972 4,526,832
Change in Retro Claims Expense 417,997 -78,998 0 -9,002 -147,994 -295,991 -113,988
Claims and Adj. Expenses Incurred 24,563,778 -281,220 -155,471 -57,876 -101,745 -149,125 23,818,341
Operating & Service Fee 4,350,738 -8,048 -14 0 0 0 4,342,676
Agents Commissions 3,312,974 -11,254 -83 0 0 0 3,301,637
Change in Premium Deficiency/(DPAC) -433,995 0 0 0 0 0 -433,995
Driver Record Abstracts 187,118 -210 -1 0 0 0 186,907
Administration Expense 517,901 -950 -3 0 0 0 516,948
Bad Debts -519,187 1,840 0 0 0 0 -517,347
General Expenses 7,415,549 -18,622 -101 0 0 0 7,396,826
Premium Finance Fee -15,199 17 0 0 0 0 -15,182
Investment Income 26,432 0 0 0 0 0 26,432
Operating Results 5,446,712 221,869 155,442 57,876 101,745 149,125 6,132,769
Operating Results Distributed 0 0 0 0 0 0 0
Available Funds Distributed 0 0 0 0 0 0 0
Total Distributed to Member 0 0 0 0 0 0 0
Funds held by FA/(Members) 5,446,712 221,869 155,442 57,876 101,745 149,125 6,132,769
FA System 9/14/2021 4:46:57 PM EST
© 2021 Facility Association. All rights reserved.
Page 21 of 26
FACILITY ASSOCIATION RESIDUAL MARKET
MONTHLY (ACCIDENT YEAR) MEMBER PARTICIPATION REPORT AS AT: Month Year Download to CSV based on selection criteria
EXHIBIT 6-A

Company: Jurisdiction: Private and Non Private Passenger Combined
Accident Years
Share (Fiscal Year To Date)2022 &2021
2020 2019 2018 2017 2016 &Prior
Total
Premium Written 277,289,222 8,665,373 -74,022 -2,456 0 63 285,878,180
Change in Unearned Premium -59,763,608 64,246,920 0 0 -1 0 4,483,311
Premium Earned 217,525,614 72,912,293 -74,022 -2,456 -1 63 290,361,491
Paid Loss 20,478,100 35,576,636 17,454,518 8,008,219 6,046,111 21,170,746 108,734,330
Change in Outstanding Loss 25,673,773 15,694,588 -7,643,429 -2,098,878 -5,258,756 -20,962,819 5,404,479
Change in IBNR Provision 70,574,987 -8,551,996 -10,212,009 -3,956,997 -3,474,994 14,501,019 58,880,010
O/S Loss Transition Adjustment 0 0 0 0 0 0 0
Claim Service Fee 24,464,306 1,303,653 138,514 441,241 260,966 1,986,504 28,595,184
Change in Retro Claims Expense 2,424,997 8,292,009 -2,005 -248,020 -447,974 -2,098,988 7,920,019
Claims and Adj. Expenses Incurred 143,616,163 52,314,890 -264,411 2,145,565 -2,874,647 14,596,462 209,534,022
Operating & Service Fee 28,566,795 900,152 -7,617 -259 7 4 29,459,082
Agents Commissions 21,124,473 744,311 -8,083 -231 -1 2 21,860,471
Change in Premium Deficiency/(DPAC) -16,570,996 16,913,005 0 0 0 0 342,009
Driver Record Abstracts 2,312,162 78,787 -468 -5 9 0 2,390,485
Administration Expense 3,953,184 130,774 -1,169 -32 6 0 4,082,763
Bad Debts -44,291 17,041 -77 -2 6 -4 -27,327
General Expenses 39,341,327 18,784,070 -17,414 -529 27 2 58,107,483
Premium Finance Fee -110,913 -3,565 7 -1 -3 -6 -114,481
Investment Income 176,175 113,794 -1 -5 2 0 289,965
Operating Results 34,633,386 1,923,562 207,809 -2,147,498 2,874,618 -14,596,407 22,895,470
Operating Results Distributed 0 0 21 6 18 0 45
Available Funds Distributed 99,902,400 -19,812,912 -9,877,889 -2,878,850 -5,834,733 -1,498,093 59,999,923
Total Distributed to Member 99,902,400 -19,812,912 -9,877,868 -2,878,844 -5,834,715 -1,498,093 59,999,968
Funds held by FA/(Members) -65,269,014 21,736,474 10,085,677 731,346 8,709,333 -13,098,314 -37,104,498
FA System 9/14/2021 4:46:57 PM EST
© 2021 Facility Association. All rights reserved.
Page 22 of 26
FACILITY ASSOCIATION RESIDUAL MARKET
MONTHLY (ACCIDENT YEAR) MEMBER PARTICIPATION REPORT AS AT: Month Year Download to CSV based on selection criteria
EXHIBIT 6-A
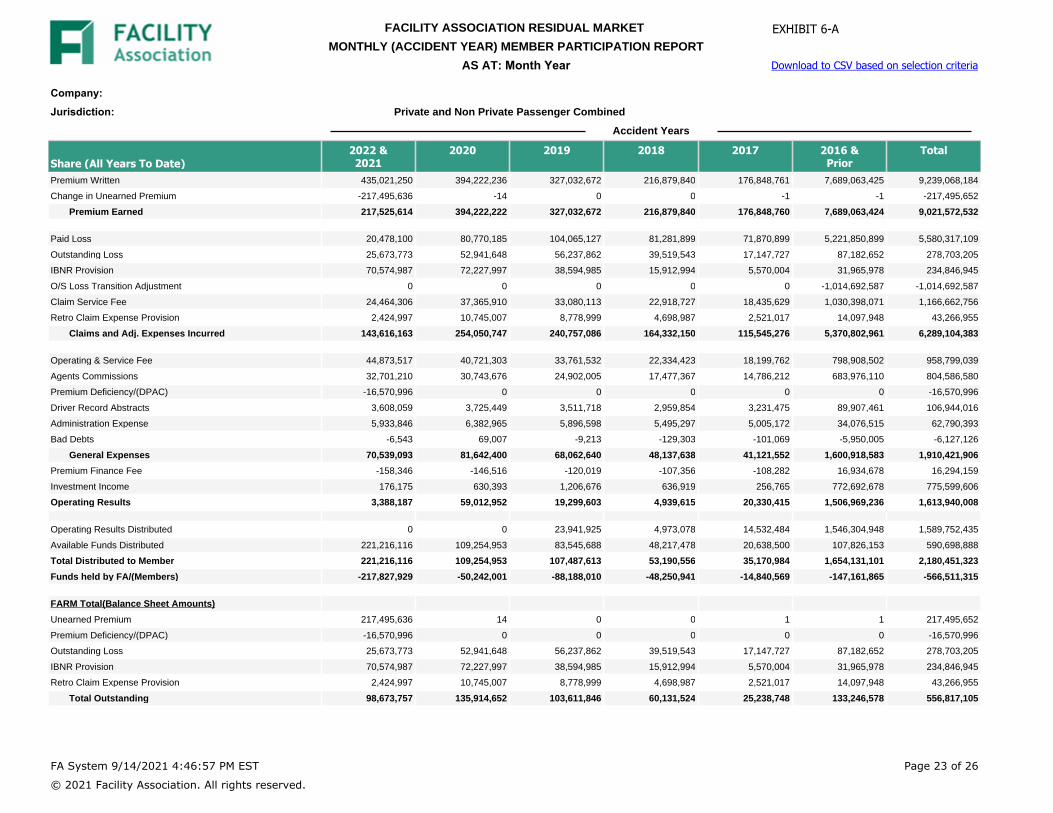
Company: Jurisdiction: Private and Non Private Passenger Combined
Accident Years
Share (All Years To Date)2022 &2021
2020 2019 2018 2017 2016 &Prior
Total
Premium Written 435,021,250 394,222,236 327,032,672 216,879,840 176,848,761 7,689,063,425 9,239,068,184
Change in Unearned Premium -217,495,636 -14 0 0 -1 -1 -217,495,652
Premium Earned 217,525,614 394,222,222 327,032,672 216,879,840 176,848,760 7,689,063,424 9,021,572,532
Paid Loss 20,478,100 80,770,185 104,065,127 81,281,899 71,870,899 5,221,850,899 5,580,317,109
Outstanding Loss 25,673,773 52,941,648 56,237,862 39,519,543 17,147,727 87,182,652 278,703,205
IBNR Provision 70,574,987 72,227,997 38,594,985 15,912,994 5,570,004 31,965,978 234,846,945
O/S Loss Transition Adjustment 0 0 0 0 0 -1,014,692,587 -1,014,692,587
Claim Service Fee 24,464,306 37,365,910 33,080,113 22,918,727 18,435,629 1,030,398,071 1,166,662,756
Retro Claim Expense Provision 2,424,997 10,745,007 8,778,999 4,698,987 2,521,017 14,097,948 43,266,955
Claims and Adj. Expenses Incurred 143,616,163 254,050,747 240,757,086 164,332,150 115,545,276 5,370,802,961 6,289,104,383
Operating & Service Fee 44,873,517 40,721,303 33,761,532 22,334,423 18,199,762 798,908,502 958,799,039
Agents Commissions 32,701,210 30,743,676 24,902,005 17,477,367 14,786,212 683,976,110 804,586,580
Premium Deficiency/(DPAC) -16,570,996 0 0 0 0 0 -16,570,996
Driver Record Abstracts 3,608,059 3,725,449 3,511,718 2,959,854 3,231,475 89,907,461 106,944,016
Administration Expense 5,933,846 6,382,965 5,896,598 5,495,297 5,005,172 34,076,515 62,790,393
Bad Debts -6,543 69,007 -9,213 -129,303 -101,069 -5,950,005 -6,127,126
General Expenses 70,539,093 81,642,400 68,062,640 48,137,638 41,121,552 1,600,918,583 1,910,421,906
Premium Finance Fee -158,346 -146,516 -120,019 -107,356 -108,282 16,934,678 16,294,159
Investment Income 176,175 630,393 1,206,676 636,919 256,765 772,692,678 775,599,606
Operating Results 3,388,187 59,012,952 19,299,603 4,939,615 20,330,415 1,506,969,236 1,613,940,008
Operating Results Distributed 0 0 23,941,925 4,973,078 14,532,484 1,546,304,948 1,589,752,435
Available Funds Distributed 221,216,116 109,254,953 83,545,688 48,217,478 20,638,500 107,826,153 590,698,888
Total Distributed to Member 221,216,116 109,254,953 107,487,613 53,190,556 35,170,984 1,654,131,101 2,180,451,323
Funds held by FA/(Members) -217,827,929 -50,242,001 -88,188,010 -48,250,941 -14,840,569 -147,161,865 -566,511,315
FARM Total(Balance Sheet Amounts)
Unearned Premium 217,495,636 14 0 0 1 1 217,495,652
Premium Deficiency/(DPAC) -16,570,996 0 0 0 0 0 -16,570,996
Outstanding Loss 25,673,773 52,941,648 56,237,862 39,519,543 17,147,727 87,182,652 278,703,205
IBNR Provision 70,574,987 72,227,997 38,594,985 15,912,994 5,570,004 31,965,978 234,846,945
Retro Claim Expense Provision 2,424,997 10,745,007 8,778,999 4,698,987 2,521,017 14,097,948 43,266,955
Total Outstanding 98,673,757 135,914,652 103,611,846 60,131,524 25,238,748 133,246,578 556,817,105
FA System 9/14/2021 4:46:57 PM EST
© 2021 Facility Association. All rights reserved.
Page 23 of 26
FACILITY ASSOCIATION RESIDUAL MARKET
MONTHLY (ACCIDENT YEAR) MEMBER PARTICIPATION REPORT AS AT: Month Year Download to CSV based on selection criteria
EXHIBIT 6-A
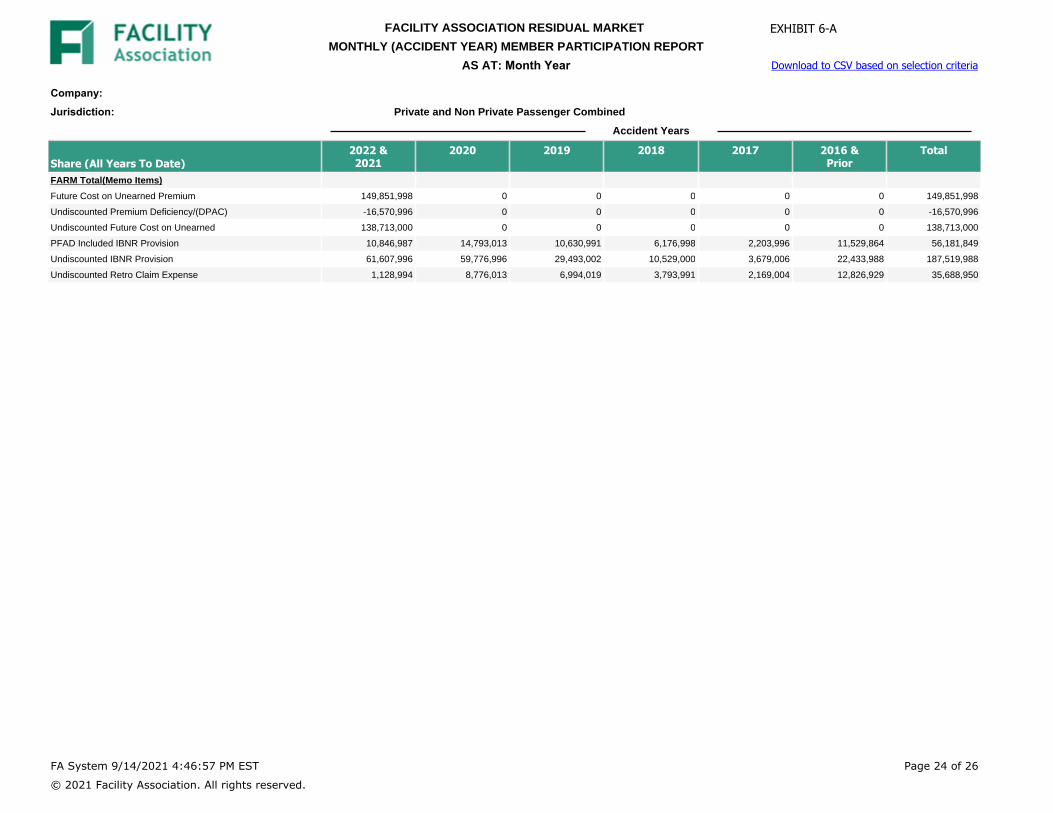
Company: Jurisdiction: Private and Non Private Passenger Combined
Accident Years
Share (All Years To Date)2022 &2021
2020 2019 2018 2017 2016 &Prior
Total
FARM Total(Memo Items)
Future Cost on Unearned Premium 149,851,998 0 0 0 0 0 149,851,998
Undiscounted Premium Deficiency/(DPAC) -16,570,996 0 0 0 0 0 -16,570,996
Undiscounted Future Cost on Unearned 138,713,000 0 0 0 0 0 138,713,000
PFAD Included IBNR Provision 10,846,987 14,793,013 10,630,991 6,176,998 2,203,996 11,529,864 56,181,849
Undiscounted IBNR Provision 61,607,996 59,776,996 29,493,002 10,529,000 3,679,006 22,433,988 187,519,988
Undiscounted Retro Claim Expense 1,128,994 8,776,013 6,994,019 3,793,991 2,169,004 12,826,929 35,688,950
FA System 9/14/2021 4:46:57 PM EST
© 2021 Facility Association. All rights reserved.
Page 24 of 26
FACILITY ASSOCIATION RESIDUAL MARKET
MONTHLY (ACCIDENT YEAR) MEMBER PARTICIPATION REPORT AS AT: Month Year Download to CSV based on selection criteria
EXHIBIT 6-A

Company: Jurisdiction: Private and Non Private Passenger Combined
Combined Share (Calendar Period)FY Jun 2021
[1]
Estimate Jul 2021
[2]
Estimate Aug 2021
[3]
Estimate Nov 2020
[4]
Estimate Dec 2020
[5]
CalendarYear toDate at
Aug 2021[6]
CalendarYear toDate at
Jul 2021[7]
CalendarMonth ofAug 2021
[8]Premium Written 285,878,180 42,449,004 33,822,000 39,329,000 29,480,981 293,339,203 251,603,503 41,735,700
Change in Unearned Premium 4,483,311 -9,177,910 5,006,297 -4,771,321 6,898,241 -1,815,222 487,007 -2,302,229
Premium Earned 290,361,491 33,271,094 38,828,297 34,557,679 36,379,222 291,523,981 252,090,510 39,433,471
Paid Loss 108,734,330 9,583,770 9,809,881 15,226,366 16,291,947 96,609,668 89,524,577 7,085,091
Change in Outstanding Loss 5,404,479 2,776,250 4,235,965 4,975,966 1,942,992 5,497,736 -1,648,222 7,145,958
Change in IBNR Provision 58,880,010 4,790,985 6,157,993 -3,909,984 -1,105,001 74,843,973 68,208,017 6,635,956
O/S Loss Transition Adjustment 0 0 0 0 0 0 0 0
Claim Service Fee 28,595,184 4,706,907 5,357,894 4,718,874 4,924,883 29,016,228 24,253,383 4,762,845
Change in Retro Claims Expense 7,920,019 -666,173 -732,019 -721,335 -652,938 7,896,100 7,983,129 -87,029
Claims and Adj. Expenses Incurred 209,534,022 21,191,739 24,829,714 20,289,887 21,401,883 213,863,705 188,320,884 25,542,821
Operating & Service Fee 29,459,082 4,382,988 3,492,987 4,078,982 3,049,986 30,206,089 25,947,443 4,258,646
Agents Commissions 21,860,471 3,247,000 2,624,994 2,966,992 2,252,001 22,513,472 19,278,840 3,234,632
Change in Premium Deficiency/(DPAC) 342,009 -734,012 337,010 -322,991 529,986 -261,988 -56,988 -205,000
Driver Record Abstracts 2,390,485 533,969 439,983 452,975 411,969 2,499,493 2,342,607 156,886
Administration Expense 4,082,763 1,016,969 810,992 944,993 709,995 4,255,736 3,765,798 489,938
Bad Debts -27,327 0 0 0 0 -27,327 490,020 -517,347
General Expenses 58,107,483 8,446,914 7,705,966 8,120,951 6,953,937 59,185,475 51,767,720 7,417,755
Premium Finance Fee -114,481 0 0 0 0 -114,481 -99,299 -15,182
Investment Income 289,965 34,947 32,823 33,678 28,793 295,264 253,141 42,123
Operating Results 22,895,470 3,667,388 6,325,440 6,180,519 8,052,195 18,655,584 12,155,748 6,499,836
Operating Results Distributed 45 0 0 0 0 45 45 0
Available Funds Distributed 59,999,923 0 0 0 0 59,999,923 59,999,923 0
Total Distributed to Member 59,999,968 0 0 0 0 59,999,968 59,999,968 0
Funds held by FA/(Members) -37,104,498 3,667,388 6,325,440 6,180,519 8,052,195 -41,344,384 -47,844,220 6,499,836
FA System 9/14/2021 4:46:57 PM EST
© 2021 Facility Association. All rights reserved.
Page 25 of 26
FACILITY ASSOCIATION RESIDUAL MARKET
MONTHLY (ACCIDENT YEAR) MEMBER PARTICIPATION REPORT AS AT: Month Year Download to CSV based on selection criteria
EXHIBIT 6-A
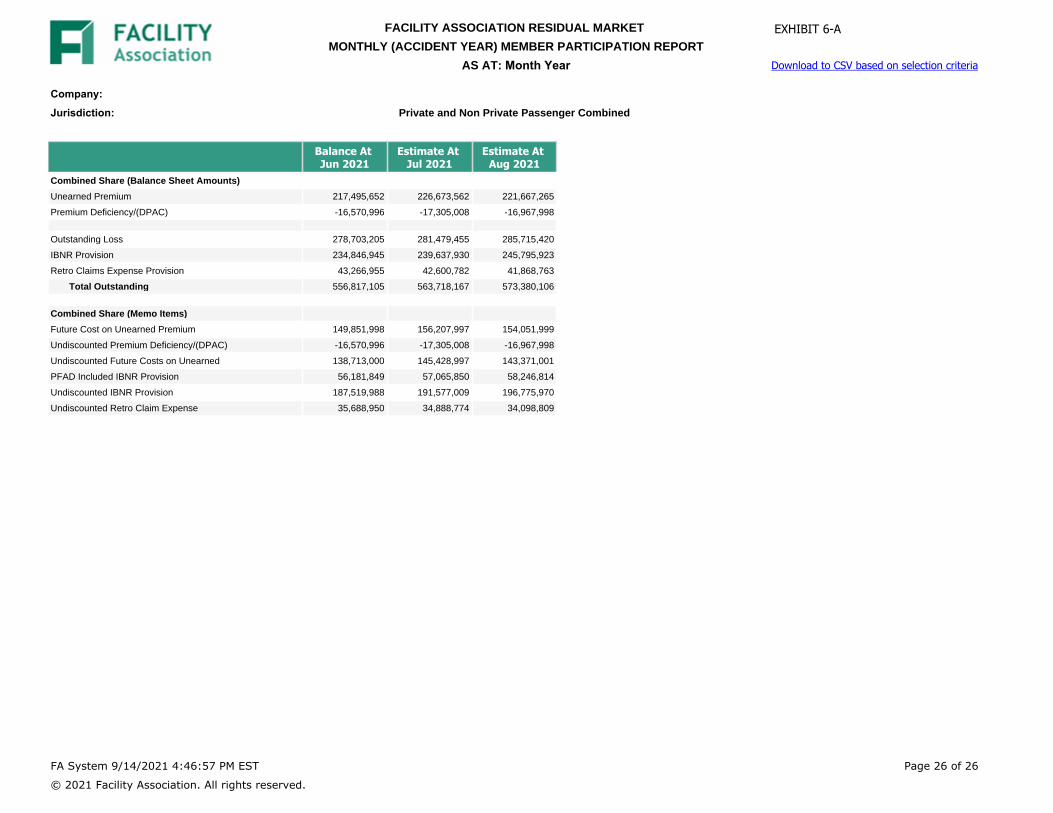
Company: Jurisdiction:
Balance At Jun 2021
Estimate At Jul 2021
Estimate At Aug 2021
Combined Share (Balance Sheet Amounts)
Unearned Premium 217,495,652 226,673,562 221,667,265
Premium Deficiency/(DPAC) -16,570,996 -17,305,008 -16,967,998
Outstanding Loss 278,703,205 281,479,455 285,715,420
IBNR Provision 234,846,945 239,637,930 245,795,923
Retro Claims Expense Provision 43,266,955 42,600,782 41,868,763
Total Outstanding 556,817,105 563,718,167 573,380,106
Combined Share (Memo Items)
Future Cost on Unearned Premium 149,851,998 156,207,997 154,051,999
Undiscounted Premium Deficiency/(DPAC) -16,570,996 -17,305,008 -16,967,998
Undiscounted Future Costs on Unearned 138,713,000 145,428,997 143,371,001
PFAD Included IBNR Provision 56,181,849 57,065,850 58,246,814
Undiscounted IBNR Provision 187,519,988 191,577,009 196,775,970
Undiscounted Retro Claim Expense 35,688,950 34,888,774 34,098,809
FA System 9/14/2021 4:46:57 PM EST
© 2021 Facility Association. All rights reserved.
Page 26 of 26
FACILITY ASSOCIATION RESIDUAL MARKET
MONTHLY (ACCIDENT YEAR) MEMBER PARTICIPATION REPORT AS AT: Month Year
Private and Non Private Passenger Combined
Download to CSV based on selection criteria
EXHIBIT 6-A

Estimated Calendar Year Written Premiums For the __ months ending ____________
Government Line Written PremiumFiscal Year 2021
Nov 1 2020 toJun 30 2021
EstimatedWritten Premium
For Jul 2021 & Aug 2021
EstimatedWritten PremiumFor Nov 2020 &
Dec 2020
EstimatedWritten Premium
For CY 2021At Aug 2021
EstimatedWritten Premium
For CY 2021At Jul 2021
EstimatedWritten Premium
For MonthAug 2021
[1] [2] [3] [4] = [1] + [2] - [3] [5] [6] = [4] - [5]
Liability 194,000,685 45,497,162 47,048,470 192,449,377 171,094,127 21,355,250
Accident Benefits 35,684,684 13,309,168 8,853,798 40,140,054 31,487,971 8,652,083
Other 56,192,811 17,464,674 12,907,713 60,749,772 49,021,405 11,728,367
Total All Lines 285,878,180 76,271,004 68,809,981 293,339,203 251,603,503 41,735,700
FA Systtem 9/14/2021 4:48:12 PM EST
© 2021 Facility Association. All rights reserved.Page 1 of 11
FACILITY ASSOCIATION RESIDUAL MARKET GOVERNMENT LINE REPORT
AS AT:
Company:
Jurisdiction:Download to CSV based on selection criteria
EXHIBIT 6-B
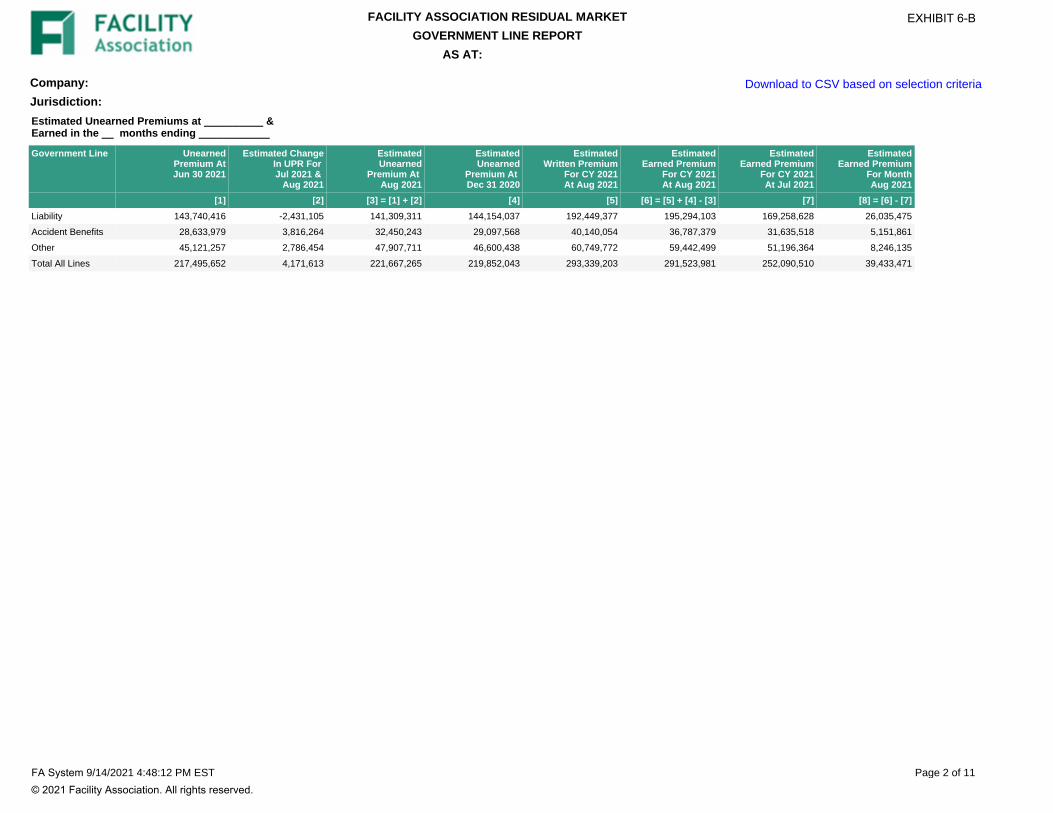
Estimated Unearned Premiums at __________ & Earned in the __ months ending ____________
Government Line UnearnedPremium AtJun 30 2021
Estimated ChangeIn UPR For Jul 2021 &
Aug 2021
EstimatedUnearned
Premium At Aug 2021
EstimatedUnearned
Premium At Dec 31 2020
EstimatedWritten Premium
For CY 2021At Aug 2021
EstimatedEarned Premium
For CY 2021At Aug 2021
EstimatedEarned Premium
For CY 2021At Jul 2021
EstimatedEarned Premium
For MonthAug 2021
[1] [2] [3] = [1] + [2] [4] [5] [6] = [5] + [4] - [3] [7] [8] = [6] - [7]
Liability 143,740,416 -2,431,105 141,309,311 144,154,037 192,449,377 195,294,103 169,258,628 26,035,475
Accident Benefits 28,633,979 3,816,264 32,450,243 29,097,568 40,140,054 36,787,379 31,635,518 5,151,861
Other 45,121,257 2,786,454 47,907,711 46,600,438 60,749,772 59,442,499 51,196,364 8,246,135
Total All Lines 217,495,652 4,171,613 221,667,265 219,852,043 293,339,203 291,523,981 252,090,510 39,433,471
FA System 9/14/2021 4:48:12 PM EST
© 2021 Facility Association. All rights reserved.Page 2 of 11
FACILITY ASSOCIATION RESIDUAL MARKET GOVERNMENT LINE REPORT
AS AT:
Company:
Jurisdiction:Download to CSV based on selection criteria
EXHIBIT 6-B
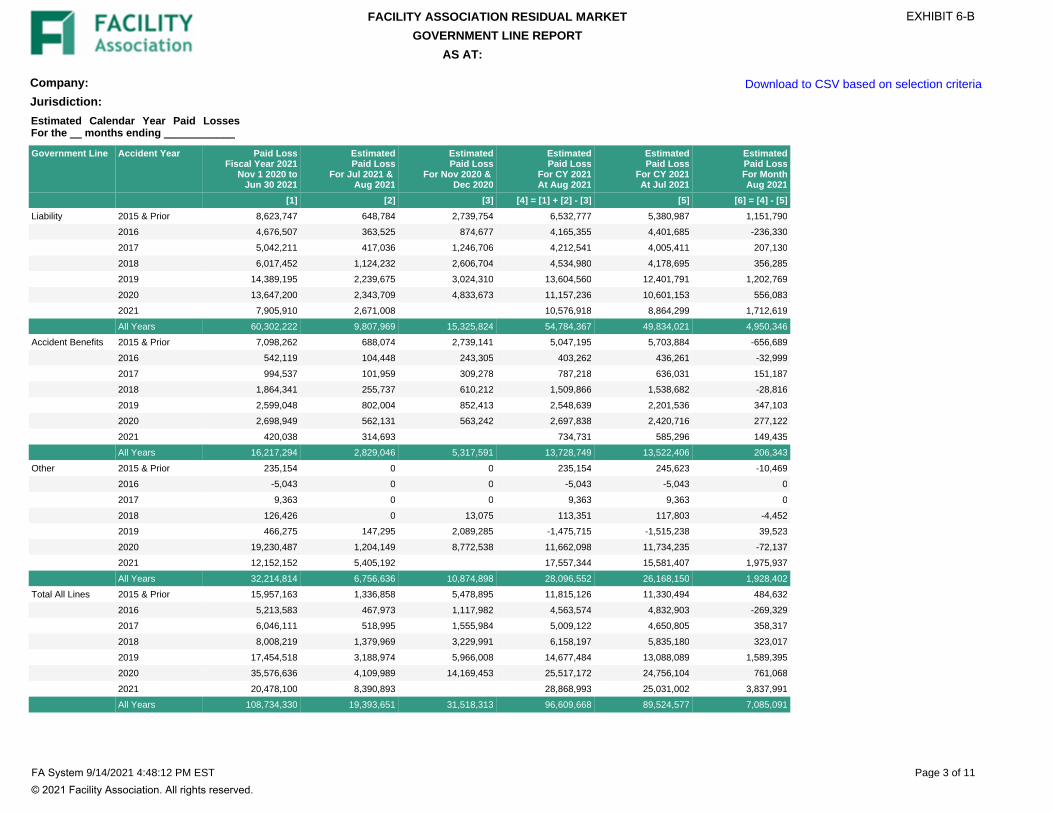
Estimated Calendar Year Paid Losses For the __ months ending ____________
Government Line Accident Year Paid LossFiscal Year 2021
Nov 1 2020 toJun 30 2021
EstimatedPaid Loss
For Jul 2021 & Aug 2021
EstimatedPaid Loss
For Nov 2020 & Dec 2020
EstimatedPaid Loss
For CY 2021At Aug 2021
EstimatedPaid Loss
For CY 2021At Jul 2021
EstimatedPaid LossFor MonthAug 2021
[1] [2] [3] [4] = [1] + [2] - [3] [5] [6] = [4] - [5]
Liability 2015 & Prior 8,623,747 648,784 2,739,754 6,532,777 5,380,987 1,151,790
2016 4,676,507 363,525 874,677 4,165,355 4,401,685 -236,330
2017 5,042,211 417,036 1,246,706 4,212,541 4,005,411 207,130
2018 6,017,452 1,124,232 2,606,704 4,534,980 4,178,695 356,285
2019 14,389,195 2,239,675 3,024,310 13,604,560 12,401,791 1,202,769
2020 13,647,200 2,343,709 4,833,673 11,157,236 10,601,153 556,083
2021 7,905,910 2,671,008 10,576,918 8,864,299 1,712,619
All Years 60,302,222 9,807,969 15,325,824 54,784,367 49,834,021 4,950,346
Accident Benefits 2015 & Prior 7,098,262 688,074 2,739,141 5,047,195 5,703,884 -656,689
2016 542,119 104,448 243,305 403,262 436,261 -32,999
2017 994,537 101,959 309,278 787,218 636,031 151,187
2018 1,864,341 255,737 610,212 1,509,866 1,538,682 -28,816
2019 2,599,048 802,004 852,413 2,548,639 2,201,536 347,103
2020 2,698,949 562,131 563,242 2,697,838 2,420,716 277,122
2021 420,038 314,693 734,731 585,296 149,435
All Years 16,217,294 2,829,046 5,317,591 13,728,749 13,522,406 206,343
Other 2015 & Prior 235,154 0 0 235,154 245,623 -10,469
2016 -5,043 0 0 -5,043 -5,043 0
2017 9,363 0 0 9,363 9,363 0
2018 126,426 0 13,075 113,351 117,803 -4,452
2019 466,275 147,295 2,089,285 -1,475,715 -1,515,238 39,523
2020 19,230,487 1,204,149 8,772,538 11,662,098 11,734,235 -72,137
2021 12,152,152 5,405,192 17,557,344 15,581,407 1,975,937
All Years 32,214,814 6,756,636 10,874,898 28,096,552 26,168,150 1,928,402
Total All Lines 2015 & Prior 15,957,163 1,336,858 5,478,895 11,815,126 11,330,494 484,632
2016 5,213,583 467,973 1,117,982 4,563,574 4,832,903 -269,329
2017 6,046,111 518,995 1,555,984 5,009,122 4,650,805 358,317
2018 8,008,219 1,379,969 3,229,991 6,158,197 5,835,180 323,017
2019 17,454,518 3,188,974 5,966,008 14,677,484 13,088,089 1,589,395
2020 35,576,636 4,109,989 14,169,453 25,517,172 24,756,104 761,068
2021 20,478,100 8,390,893 28,868,993 25,031,002 3,837,991
All Years 108,734,330 19,393,651 31,518,313 96,609,668 89,524,577 7,085,091
FA System 9/14/2021 4:48:12 PM EST
© 2021 Facility Association. All rights reserved.Page 3 of 11
FACILITY ASSOCIATION RESIDUAL MARKET GOVERNMENT LINE REPORT
AS AT:
Company:
Jurisdiction:Download to CSV based on selection criteria
EXHIBIT 6-B
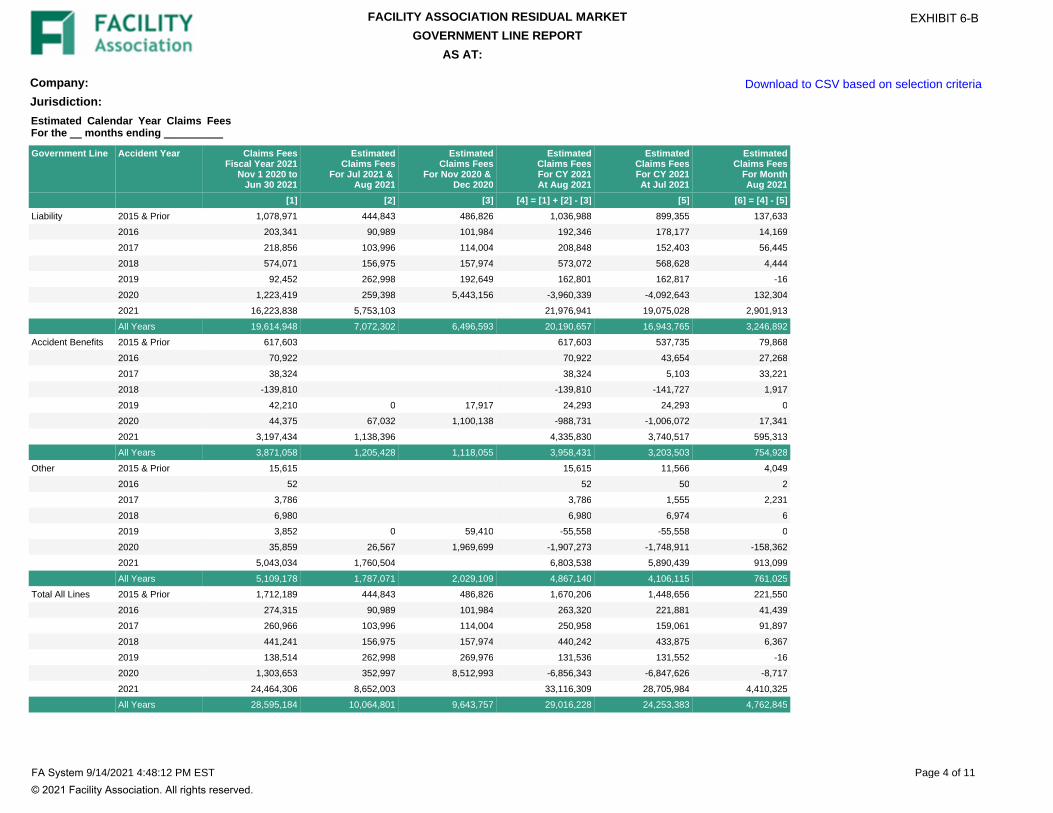
Estimated Calendar Year Claims Fees For the __ months ending __________
Government Line Accident Year Claims FeesFiscal Year 2021
Nov 1 2020 toJun 30 2021
EstimatedClaims Fees
For Jul 2021 & Aug 2021
EstimatedClaims Fees
For Nov 2020 & Dec 2020
EstimatedClaims FeesFor CY 2021At Aug 2021
EstimatedClaims FeesFor CY 2021At Jul 2021
EstimatedClaims Fees
For MonthAug 2021
[1] [2] [3] [4] = [1] + [2] - [3] [5] [6] = [4] - [5]
Liability 2015 & Prior 1,078,971 444,843 486,826 1,036,988 899,355 137,633
2016 203,341 90,989 101,984 192,346 178,177 14,169
2017 218,856 103,996 114,004 208,848 152,403 56,445
2018 574,071 156,975 157,974 573,072 568,628 4,444
2019 92,452 262,998 192,649 162,801 162,817 -16
2020 1,223,419 259,398 5,443,156 -3,960,339 -4,092,643 132,304
2021 16,223,838 5,753,103 21,976,941 19,075,028 2,901,913
All Years 19,614,948 7,072,302 6,496,593 20,190,657 16,943,765 3,246,892
Accident Benefits 2015 & Prior 617,603 617,603 537,735 79,868
2016 70,922 70,922 43,654 27,268
2017 38,324 38,324 5,103 33,221
2018 -139,810 -139,810 -141,727 1,917
2019 42,210 0 17,917 24,293 24,293 0
2020 44,375 67,032 1,100,138 -988,731 -1,006,072 17,341
2021 3,197,434 1,138,396 4,335,830 3,740,517 595,313
All Years 3,871,058 1,205,428 1,118,055 3,958,431 3,203,503 754,928
Other 2015 & Prior 15,615 15,615 11,566 4,049
2016 52 52 50 2
2017 3,786 3,786 1,555 2,231
2018 6,980 6,980 6,974 6
2019 3,852 0 59,410 -55,558 -55,558 0
2020 35,859 26,567 1,969,699 -1,907,273 -1,748,911 -158,362
2021 5,043,034 1,760,504 6,803,538 5,890,439 913,099
All Years 5,109,178 1,787,071 2,029,109 4,867,140 4,106,115 761,025
Total All Lines 2015 & Prior 1,712,189 444,843 486,826 1,670,206 1,448,656 221,550
2016 274,315 90,989 101,984 263,320 221,881 41,439
2017 260,966 103,996 114,004 250,958 159,061 91,897
2018 441,241 156,975 157,974 440,242 433,875 6,367
2019 138,514 262,998 269,976 131,536 131,552 -16
2020 1,303,653 352,997 8,512,993 -6,856,343 -6,847,626 -8,717
2021 24,464,306 8,652,003 33,116,309 28,705,984 4,410,325
All Years 28,595,184 10,064,801 9,643,757 29,016,228 24,253,383 4,762,845
FA System 9/14/2021 4:48:12 PM EST
© 2021 Facility Association. All rights reserved.Page 4 of 11
FACILITY ASSOCIATION RESIDUAL MARKET GOVERNMENT LINE REPORT
AS AT:
Company:
Jurisdiction:Download to CSV based on selection criteria
EXHIBIT 6-B
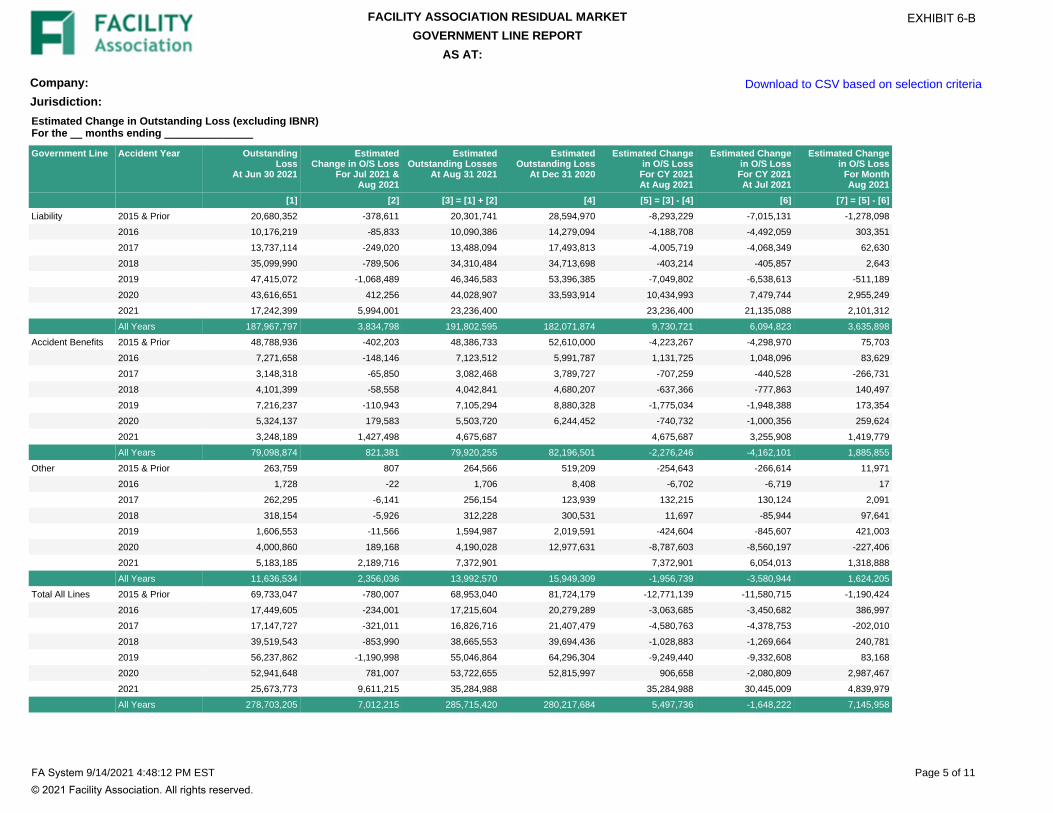
Estimated Change in Outstanding Loss (excluding IBNR) For the __ months ending _______________
Government Line Accident Year OutstandingLoss
At Jun 30 2021
EstimatedChange in O/S Loss
For Jul 2021 &Aug 2021
EstimatedOutstanding Losses
At Aug 31 2021
EstimatedOutstanding Loss
At Dec 31 2020
Estimated Changein O/S LossFor CY 2021At Aug 2021
Estimated Changein O/S LossFor CY 2021At Jul 2021
Estimated Changein O/S Loss
For MonthAug 2021
[1] [2] [3] = [1] + [2] [4] [5] = [3] - [4] [6] [7] = [5] - [6]
Liability 2015 & Prior 20,680,352 -378,611 20,301,741 28,594,970 -8,293,229 -7,015,131 -1,278,098
2016 10,176,219 -85,833 10,090,386 14,279,094 -4,188,708 -4,492,059 303,351
2017 13,737,114 -249,020 13,488,094 17,493,813 -4,005,719 -4,068,349 62,630
2018 35,099,990 -789,506 34,310,484 34,713,698 -403,214 -405,857 2,643
2019 47,415,072 -1,068,489 46,346,583 53,396,385 -7,049,802 -6,538,613 -511,189
2020 43,616,651 412,256 44,028,907 33,593,914 10,434,993 7,479,744 2,955,249
2021 17,242,399 5,994,001 23,236,400 23,236,400 21,135,088 2,101,312
All Years 187,967,797 3,834,798 191,802,595 182,071,874 9,730,721 6,094,823 3,635,898
Accident Benefits 2015 & Prior 48,788,936 -402,203 48,386,733 52,610,000 -4,223,267 -4,298,970 75,703
2016 7,271,658 -148,146 7,123,512 5,991,787 1,131,725 1,048,096 83,629
2017 3,148,318 -65,850 3,082,468 3,789,727 -707,259 -440,528 -266,731
2018 4,101,399 -58,558 4,042,841 4,680,207 -637,366 -777,863 140,497
2019 7,216,237 -110,943 7,105,294 8,880,328 -1,775,034 -1,948,388 173,354
2020 5,324,137 179,583 5,503,720 6,244,452 -740,732 -1,000,356 259,624
2021 3,248,189 1,427,498 4,675,687 4,675,687 3,255,908 1,419,779
All Years 79,098,874 821,381 79,920,255 82,196,501 -2,276,246 -4,162,101 1,885,855
Other 2015 & Prior 263,759 807 264,566 519,209 -254,643 -266,614 11,971
2016 1,728 -22 1,706 8,408 -6,702 -6,719 17
2017 262,295 -6,141 256,154 123,939 132,215 130,124 2,091
2018 318,154 -5,926 312,228 300,531 11,697 -85,944 97,641
2019 1,606,553 -11,566 1,594,987 2,019,591 -424,604 -845,607 421,003
2020 4,000,860 189,168 4,190,028 12,977,631 -8,787,603 -8,560,197 -227,406
2021 5,183,185 2,189,716 7,372,901 7,372,901 6,054,013 1,318,888
All Years 11,636,534 2,356,036 13,992,570 15,949,309 -1,956,739 -3,580,944 1,624,205
Total All Lines 2015 & Prior 69,733,047 -780,007 68,953,040 81,724,179 -12,771,139 -11,580,715 -1,190,424
2016 17,449,605 -234,001 17,215,604 20,279,289 -3,063,685 -3,450,682 386,997
2017 17,147,727 -321,011 16,826,716 21,407,479 -4,580,763 -4,378,753 -202,010
2018 39,519,543 -853,990 38,665,553 39,694,436 -1,028,883 -1,269,664 240,781
2019 56,237,862 -1,190,998 55,046,864 64,296,304 -9,249,440 -9,332,608 83,168
2020 52,941,648 781,007 53,722,655 52,815,997 906,658 -2,080,809 2,987,467
2021 25,673,773 9,611,215 35,284,988 35,284,988 30,445,009 4,839,979
All Years 278,703,205 7,012,215 285,715,420 280,217,684 5,497,736 -1,648,222 7,145,958
FA System 9/14/2021 4:48:12 PM EST
© 2021 Facility Association. All rights reserved.Page 5 of 11
FACILITY ASSOCIATION RESIDUAL MARKET GOVERNMENT LINE REPORT
AS AT:
Company:
Jurisdiction:Download to CSV based on selection criteria
EXHIBIT 6-B
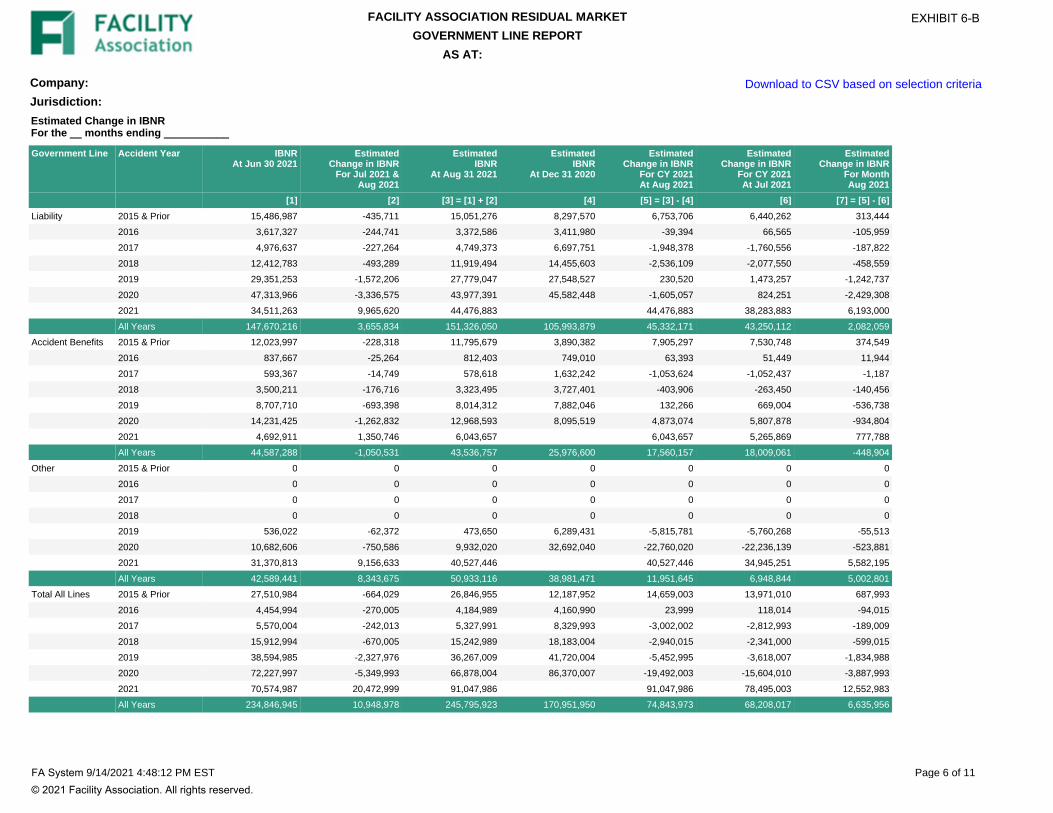
Estimated Change in IBNRFor the __ months ending ___________
Government Line Accident Year IBNRAt Jun 30 2021
EstimatedChange in IBNR
For Jul 2021 &Aug 2021
EstimatedIBNR
At Aug 31 2021
EstimatedIBNR
At Dec 31 2020
EstimatedChange in IBNR
For CY 2021At Aug 2021
EstimatedChange in IBNR
For CY 2021At Jul 2021
EstimatedChange in IBNR
For MonthAug 2021
[1] [2] [3] = [1] + [2] [4] [5] = [3] - [4] [6] [7] = [5] - [6]
Liability 2015 & Prior 15,486,987 -435,711 15,051,276 8,297,570 6,753,706 6,440,262 313,444
2016 3,617,327 -244,741 3,372,586 3,411,980 -39,394 66,565 -105,959
2017 4,976,637 -227,264 4,749,373 6,697,751 -1,948,378 -1,760,556 -187,822
2018 12,412,783 -493,289 11,919,494 14,455,603 -2,536,109 -2,077,550 -458,559
2019 29,351,253 -1,572,206 27,779,047 27,548,527 230,520 1,473,257 -1,242,737
2020 47,313,966 -3,336,575 43,977,391 45,582,448 -1,605,057 824,251 -2,429,308
2021 34,511,263 9,965,620 44,476,883 44,476,883 38,283,883 6,193,000
All Years 147,670,216 3,655,834 151,326,050 105,993,879 45,332,171 43,250,112 2,082,059
Accident Benefits 2015 & Prior 12,023,997 -228,318 11,795,679 3,890,382 7,905,297 7,530,748 374,549
2016 837,667 -25,264 812,403 749,010 63,393 51,449 11,944
2017 593,367 -14,749 578,618 1,632,242 -1,053,624 -1,052,437 -1,187
2018 3,500,211 -176,716 3,323,495 3,727,401 -403,906 -263,450 -140,456
2019 8,707,710 -693,398 8,014,312 7,882,046 132,266 669,004 -536,738
2020 14,231,425 -1,262,832 12,968,593 8,095,519 4,873,074 5,807,878 -934,804
2021 4,692,911 1,350,746 6,043,657 6,043,657 5,265,869 777,788
All Years 44,587,288 -1,050,531 43,536,757 25,976,600 17,560,157 18,009,061 -448,904
Other 2015 & Prior 0 0 0 0 0 0 0
2016 0 0 0 0 0 0 0
2017 0 0 0 0 0 0 0
2018 0 0 0 0 0 0 0
2019 536,022 -62,372 473,650 6,289,431 -5,815,781 -5,760,268 -55,513
2020 10,682,606 -750,586 9,932,020 32,692,040 -22,760,020 -22,236,139 -523,881
2021 31,370,813 9,156,633 40,527,446 40,527,446 34,945,251 5,582,195
All Years 42,589,441 8,343,675 50,933,116 38,981,471 11,951,645 6,948,844 5,002,801
Total All Lines 2015 & Prior 27,510,984 -664,029 26,846,955 12,187,952 14,659,003 13,971,010 687,993
2016 4,454,994 -270,005 4,184,989 4,160,990 23,999 118,014 -94,015
2017 5,570,004 -242,013 5,327,991 8,329,993 -3,002,002 -2,812,993 -189,009
2018 15,912,994 -670,005 15,242,989 18,183,004 -2,940,015 -2,341,000 -599,015
2019 38,594,985 -2,327,976 36,267,009 41,720,004 -5,452,995 -3,618,007 -1,834,988
2020 72,227,997 -5,349,993 66,878,004 86,370,007 -19,492,003 -15,604,010 -3,887,993
2021 70,574,987 20,472,999 91,047,986 91,047,986 78,495,003 12,552,983
All Years 234,846,945 10,948,978 245,795,923 170,951,950 74,843,973 68,208,017 6,635,956
FA System 9/14/2021 4:48:12 PM EST
© 2021 Facility Association. All rights reserved.Page 6 of 11
FACILITY ASSOCIATION RESIDUAL MARKET GOVERNMENT LINE REPORT
AS AT:
Company:
Jurisdiction:Download to CSV based on selection criteria
EXHIBIT 6-B
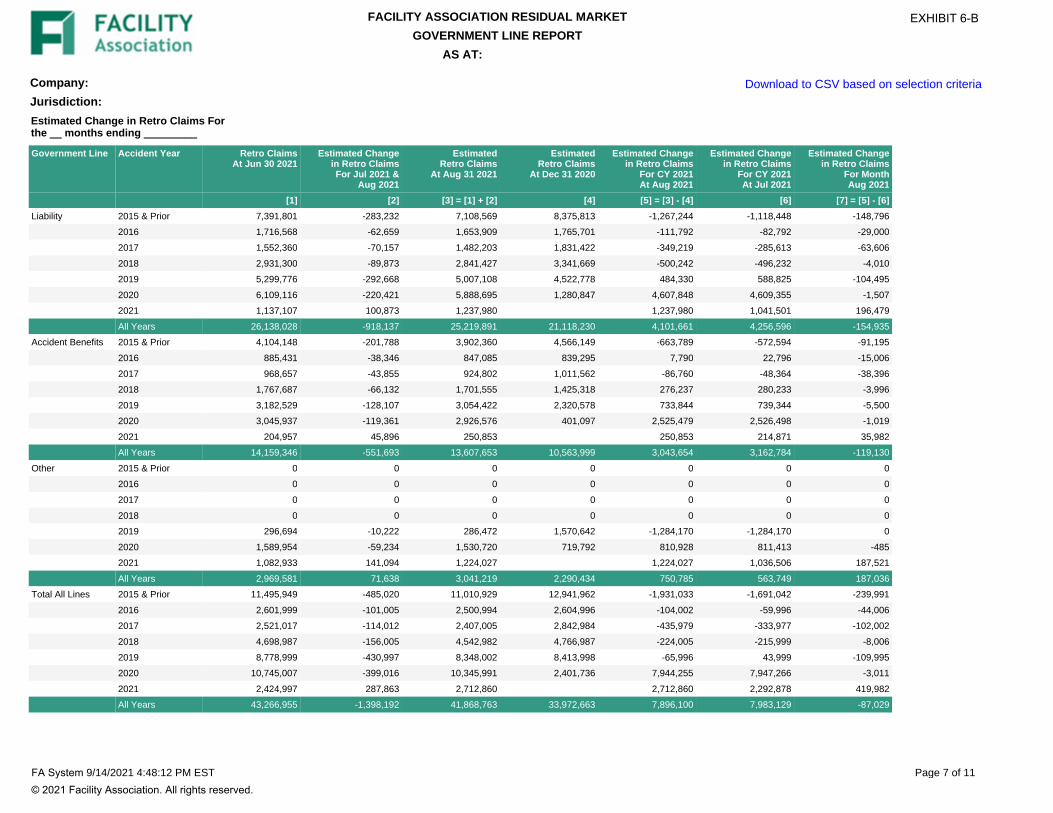
Estimated Change in Retro Claims For the __ months ending _________
Government Line Accident Year Retro ClaimsAt Jun 30 2021
Estimated Changein Retro ClaimsFor Jul 2021 &
Aug 2021
EstimatedRetro Claims
At Aug 31 2021
EstimatedRetro Claims
At Dec 31 2020
Estimated Changein Retro Claims
For CY 2021At Aug 2021
Estimated Changein Retro Claims
For CY 2021At Jul 2021
Estimated Changein Retro Claims
For MonthAug 2021
[1] [2] [3] = [1] + [2] [4] [5] = [3] - [4] [6] [7] = [5] - [6]
Liability 2015 & Prior 7,391,801 -283,232 7,108,569 8,375,813 -1,267,244 -1,118,448 -148,796
2016 1,716,568 -62,659 1,653,909 1,765,701 -111,792 -82,792 -29,000
2017 1,552,360 -70,157 1,482,203 1,831,422 -349,219 -285,613 -63,606
2018 2,931,300 -89,873 2,841,427 3,341,669 -500,242 -496,232 -4,010
2019 5,299,776 -292,668 5,007,108 4,522,778 484,330 588,825 -104,495
2020 6,109,116 -220,421 5,888,695 1,280,847 4,607,848 4,609,355 -1,507
2021 1,137,107 100,873 1,237,980 1,237,980 1,041,501 196,479
All Years 26,138,028 -918,137 25,219,891 21,118,230 4,101,661 4,256,596 -154,935
Accident Benefits 2015 & Prior 4,104,148 -201,788 3,902,360 4,566,149 -663,789 -572,594 -91,195
2016 885,431 -38,346 847,085 839,295 7,790 22,796 -15,006
2017 968,657 -43,855 924,802 1,011,562 -86,760 -48,364 -38,396
2018 1,767,687 -66,132 1,701,555 1,425,318 276,237 280,233 -3,996
2019 3,182,529 -128,107 3,054,422 2,320,578 733,844 739,344 -5,500
2020 3,045,937 -119,361 2,926,576 401,097 2,525,479 2,526,498 -1,019
2021 204,957 45,896 250,853 250,853 214,871 35,982
All Years 14,159,346 -551,693 13,607,653 10,563,999 3,043,654 3,162,784 -119,130
Other 2015 & Prior 0 0 0 0 0 0 0
2016 0 0 0 0 0 0 0
2017 0 0 0 0 0 0 0
2018 0 0 0 0 0 0 0
2019 296,694 -10,222 286,472 1,570,642 -1,284,170 -1,284,170 0
2020 1,589,954 -59,234 1,530,720 719,792 810,928 811,413 -485
2021 1,082,933 141,094 1,224,027 1,224,027 1,036,506 187,521
All Years 2,969,581 71,638 3,041,219 2,290,434 750,785 563,749 187,036
Total All Lines 2015 & Prior 11,495,949 -485,020 11,010,929 12,941,962 -1,931,033 -1,691,042 -239,991
2016 2,601,999 -101,005 2,500,994 2,604,996 -104,002 -59,996 -44,006
2017 2,521,017 -114,012 2,407,005 2,842,984 -435,979 -333,977 -102,002
2018 4,698,987 -156,005 4,542,982 4,766,987 -224,005 -215,999 -8,006
2019 8,778,999 -430,997 8,348,002 8,413,998 -65,996 43,999 -109,995
2020 10,745,007 -399,016 10,345,991 2,401,736 7,944,255 7,947,266 -3,011
2021 2,424,997 287,863 2,712,860 2,712,860 2,292,878 419,982
All Years 43,266,955 -1,398,192 41,868,763 33,972,663 7,896,100 7,983,129 -87,029
FA System 9/14/2021 4:48:12 PM EST
© 2021 Facility Association. All rights reserved.Page 7 of 11
FACILITY ASSOCIATION RESIDUAL MARKET GOVERNMENT LINE REPORT
AS AT:
Company:
Jurisdiction:Download to CSV based on selection criteria
EXHIBIT 6-B

Estimated Incurred LossFor the __ months ending __________
Government Line Accident Year EstimatedPaid LossesFor CY 2021
At Aug 31 2021
EstimatedClaims FeesFor CY 2021
At Aug 31 2021
Estimated Changein O/S Losses
For CY 2021At Aug 31 2021
Estimated Changein IBNR
For CY 2021At Aug 31 2021
Estimated Changein Retro Claims
For CY 2021At Aug 31 2021
Estimated IncurredLosses
For CY 2021At Aug 31 2021
Estimated IncurredLosses
For CY 2021At Jul 31 2021
Estimated IncurredLosses
For the Monthof Aug 2021
[1] [2] [3] [4] [5] [6]=[1]+[2]+[3]+[4]+[5] [7] [8] = [6] - [7]
Liability 2015 & Prior 6,532,777 1,036,988 -8,293,229 6,753,706 -1,267,244 4,762,998 4,587,025 175,973
2016 4,165,355 192,346 -4,188,708 -39,394 -111,792 17,807 71,576 -53,769
2017 4,212,541 208,848 -4,005,719 -1,948,378 -349,219 -1,881,927 -1,956,704 74,777
2018 4,534,980 573,072 -403,214 -2,536,109 -500,242 1,668,487 1,767,684 -99,197
2019 13,604,560 162,801 -7,049,802 230,520 484,330 7,432,409 8,088,077 -655,668
2020 11,157,236 -3,960,339 10,434,993 -1,605,057 4,607,848 20,634,681 19,421,860 1,212,821
2021 10,576,918 21,976,941 23,236,400 44,476,883 1,237,980 101,505,122 88,399,799 13,105,323
All Years 54,784,367 20,190,657 9,730,721 45,332,171 4,101,661 134,139,577 120,379,317 13,760,260
Accident Benefits 2015 & Prior 5,047,195 617,603 -4,223,267 7,905,297 -663,789 8,683,039 8,900,803 -217,764
2016 403,262 70,922 1,131,725 63,393 7,790 1,677,092 1,602,256 74,836
2017 787,218 38,324 -707,259 -1,053,624 -86,760 -1,022,101 -900,195 -121,906
2018 1,509,866 -139,810 -637,366 -403,906 276,237 605,021 635,875 -30,854
2019 2,548,639 24,293 -1,775,034 132,266 733,844 1,664,008 1,685,789 -21,781
2020 2,697,838 -988,731 -740,732 4,873,074 2,525,479 8,366,928 8,748,664 -381,736
2021 734,731 4,335,830 4,675,687 6,043,657 250,853 16,040,758 13,062,461 2,978,297
All Years 13,728,749 3,958,431 -2,276,246 17,560,157 3,043,654 36,014,745 33,735,653 2,279,092
Other 2015 & Prior 235,154 15,615 -254,643 0 0 -3,874 -9,425 5,551
2016 -5,043 52 -6,702 0 0 -11,693 -11,712 19
2017 9,363 3,786 132,215 0 0 145,364 141,042 4,322
2018 113,351 6,980 11,697 0 0 132,028 38,833 93,195
2019 -1,475,715 -55,558 -424,604 -5,815,781 -1,284,170 -9,055,828 -9,460,841 405,013
2020 11,662,098 -1,907,273 -8,787,603 -22,760,020 810,928 -20,981,870 -19,999,599 -982,271
2021 17,557,344 6,803,538 7,372,901 40,527,446 1,224,027 73,485,256 63,507,616 9,977,640
All Years 28,096,552 4,867,140 -1,956,739 11,951,645 750,785 43,709,383 34,205,914 9,503,469
Total All Lines 2015 & Prior 11,815,126 1,670,206 -12,771,139 14,659,003 -1,931,033 13,442,163 13,478,403 -36,240
2016 4,563,574 263,320 -3,063,685 23,999 -104,002 1,683,206 1,662,120 21,086
2017 5,009,122 250,958 -4,580,763 -3,002,002 -435,979 -2,758,664 -2,715,857 -42,807
2018 6,158,197 440,242 -1,028,883 -2,940,015 -224,005 2,405,536 2,442,392 -36,856
2019 14,677,484 131,536 -9,249,440 -5,452,995 -65,996 40,589 313,025 -272,436
2020 25,517,172 -6,856,343 906,658 -19,492,003 7,944,255 8,019,739 8,170,925 -151,186
2021 28,868,993 33,116,309 35,284,988 91,047,986 2,712,860 191,031,136 164,969,876 26,061,260
All Years 96,609,668 29,016,228 5,497,736 74,843,973 7,896,100 213,863,705 188,320,884 25,542,821
FA System 9/14/2021 4:48:12 PM EST
© 2021 Facility Association. All rights reserved.Page 8 of 11
FACILITY ASSOCIATION RESIDUAL MARKET GOVERNMENT LINE REPORT
AS AT:
Company:
Jurisdiction:Download to CSV based on selection criteria
EXHIBIT 6-B
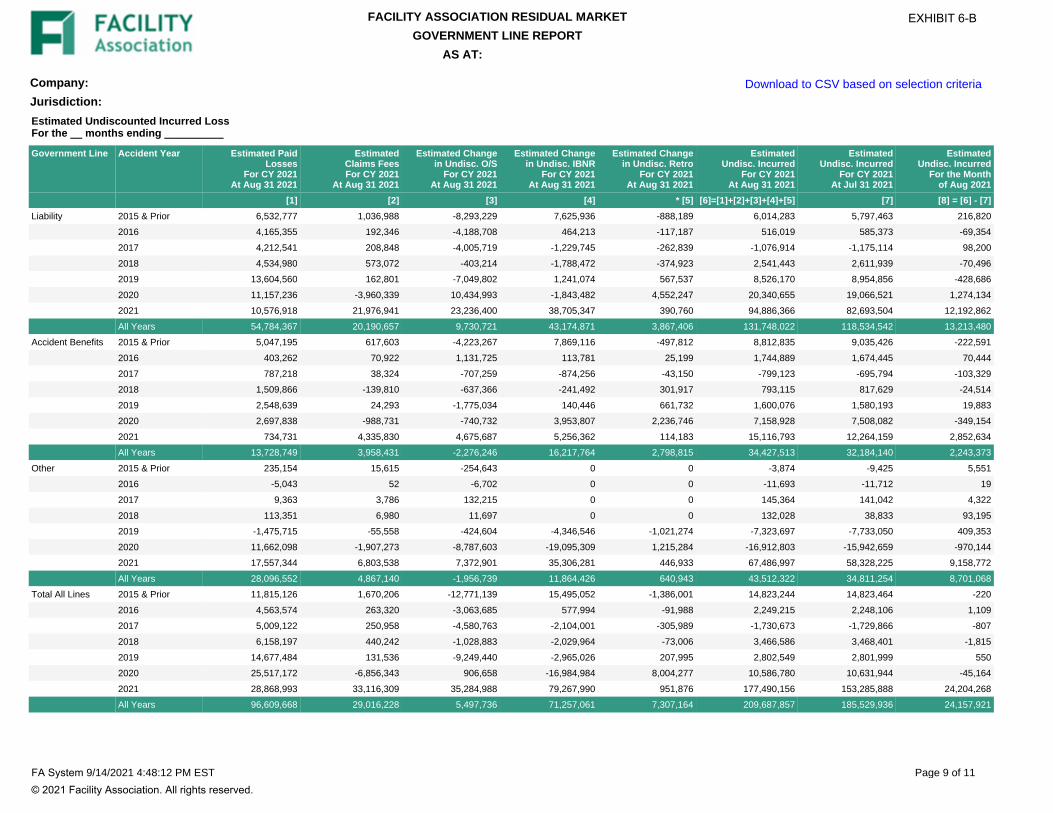
Estimated Undiscounted Incurred Loss For the __ months ending __________
Government Line Accident Year Estimated PaidLosses
For CY 2021At Aug 31 2021
EstimatedClaims FeesFor CY 2021
At Aug 31 2021
Estimated Changein Undisc. O/S
For CY 2021At Aug 31 2021
Estimated Changein Undisc. IBNR
For CY 2021At Aug 31 2021
Estimated Changein Undisc. Retro
For CY 2021At Aug 31 2021
EstimatedUndisc. Incurred
For CY 2021At Aug 31 2021
EstimatedUndisc. Incurred
For CY 2021At Jul 31 2021
EstimatedUndisc. Incurred
For the Monthof Aug 2021
[1] [2] [3] [4] * [5] [6]=[1]+[2]+[3]+[4]+[5] [7] [8] = [6] - [7]
Liability 2015 & Prior 6,532,777 1,036,988 -8,293,229 7,625,936 -888,189 6,014,283 5,797,463 216,820
2016 4,165,355 192,346 -4,188,708 464,213 -117,187 516,019 585,373 -69,354
2017 4,212,541 208,848 -4,005,719 -1,229,745 -262,839 -1,076,914 -1,175,114 98,200
2018 4,534,980 573,072 -403,214 -1,788,472 -374,923 2,541,443 2,611,939 -70,496
2019 13,604,560 162,801 -7,049,802 1,241,074 567,537 8,526,170 8,954,856 -428,686
2020 11,157,236 -3,960,339 10,434,993 -1,843,482 4,552,247 20,340,655 19,066,521 1,274,134
2021 10,576,918 21,976,941 23,236,400 38,705,347 390,760 94,886,366 82,693,504 12,192,862
All Years 54,784,367 20,190,657 9,730,721 43,174,871 3,867,406 131,748,022 118,534,542 13,213,480
Accident Benefits 2015 & Prior 5,047,195 617,603 -4,223,267 7,869,116 -497,812 8,812,835 9,035,426 -222,591
2016 403,262 70,922 1,131,725 113,781 25,199 1,744,889 1,674,445 70,444
2017 787,218 38,324 -707,259 -874,256 -43,150 -799,123 -695,794 -103,329
2018 1,509,866 -139,810 -637,366 -241,492 301,917 793,115 817,629 -24,514
2019 2,548,639 24,293 -1,775,034 140,446 661,732 1,600,076 1,580,193 19,883
2020 2,697,838 -988,731 -740,732 3,953,807 2,236,746 7,158,928 7,508,082 -349,154
2021 734,731 4,335,830 4,675,687 5,256,362 114,183 15,116,793 12,264,159 2,852,634
All Years 13,728,749 3,958,431 -2,276,246 16,217,764 2,798,815 34,427,513 32,184,140 2,243,373
Other 2015 & Prior 235,154 15,615 -254,643 0 0 -3,874 -9,425 5,551
2016 -5,043 52 -6,702 0 0 -11,693 -11,712 19
2017 9,363 3,786 132,215 0 0 145,364 141,042 4,322
2018 113,351 6,980 11,697 0 0 132,028 38,833 93,195
2019 -1,475,715 -55,558 -424,604 -4,346,546 -1,021,274 -7,323,697 -7,733,050 409,353
2020 11,662,098 -1,907,273 -8,787,603 -19,095,309 1,215,284 -16,912,803 -15,942,659 -970,144
2021 17,557,344 6,803,538 7,372,901 35,306,281 446,933 67,486,997 58,328,225 9,158,772
All Years 28,096,552 4,867,140 -1,956,739 11,864,426 640,943 43,512,322 34,811,254 8,701,068
Total All Lines 2015 & Prior 11,815,126 1,670,206 -12,771,139 15,495,052 -1,386,001 14,823,244 14,823,464 -220
2016 4,563,574 263,320 -3,063,685 577,994 -91,988 2,249,215 2,248,106 1,109
2017 5,009,122 250,958 -4,580,763 -2,104,001 -305,989 -1,730,673 -1,729,866 -807
2018 6,158,197 440,242 -1,028,883 -2,029,964 -73,006 3,466,586 3,468,401 -1,815
2019 14,677,484 131,536 -9,249,440 -2,965,026 207,995 2,802,549 2,801,999 550
2020 25,517,172 -6,856,343 906,658 -16,984,984 8,004,277 10,586,780 10,631,944 -45,164
2021 28,868,993 33,116,309 35,284,988 79,267,990 951,876 177,490,156 153,285,888 24,204,268
All Years 96,609,668 29,016,228 5,497,736 71,257,061 7,307,164 209,687,857 185,529,936 24,157,921
FA System 9/14/2021 4:48:12 PM EST
© 2021 Facility Association. All rights reserved.Page 9 of 11
FACILITY ASSOCIATION RESIDUAL MARKET GOVERNMENT LINE REPORT
AS AT:
Company:
Jurisdiction:Download to CSV based on selection criteria
EXHIBIT 6-B
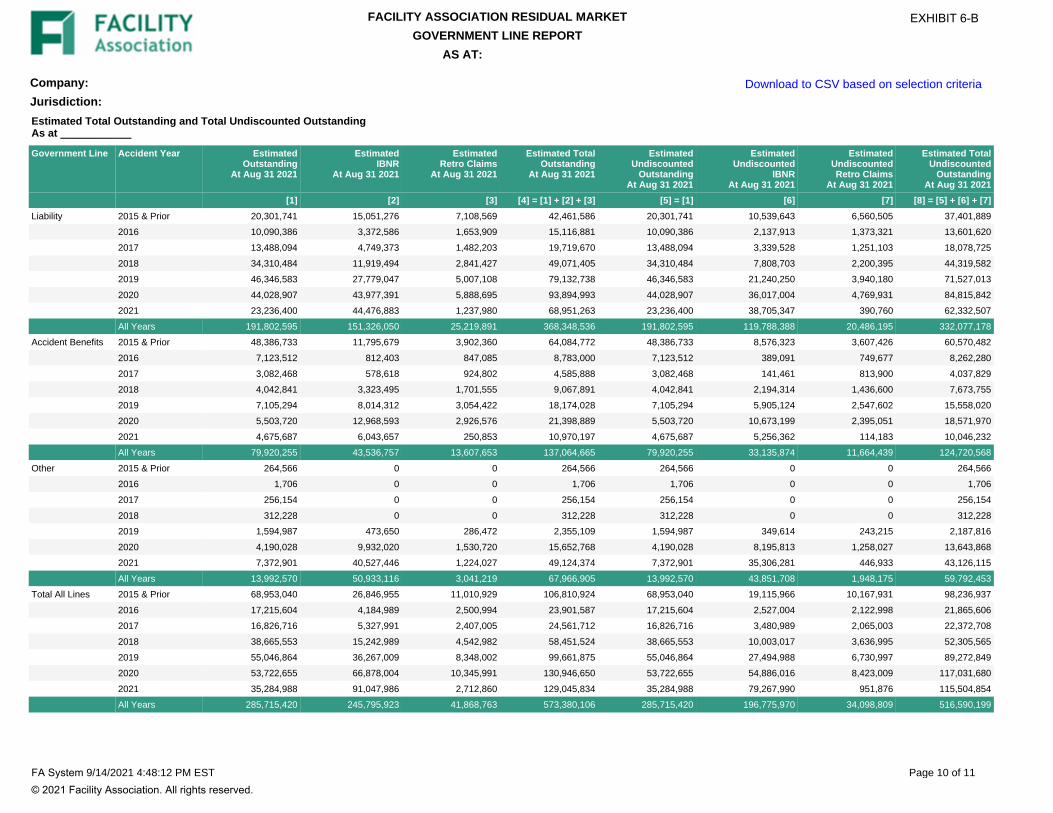
Estimated Total Outstanding and Total Undiscounted Outstanding As at ____________
Government Line Accident Year EstimatedOutstanding
At Aug 31 2021
EstimatedIBNR
At Aug 31 2021
EstimatedRetro Claims
At Aug 31 2021
Estimated TotalOutstanding
At Aug 31 2021
EstimatedUndiscounted
OutstandingAt Aug 31 2021
EstimatedUndiscounted
IBNRAt Aug 31 2021
EstimatedUndiscountedRetro Claims
At Aug 31 2021
Estimated TotalUndiscounted
OutstandingAt Aug 31 2021
[1] [2] [3] [4] = [1] + [2] + [3] [5] = [1] [6] [7] [8] = [5] + [6] + [7]
Liability 2015 & Prior 20,301,741 15,051,276 7,108,569 42,461,586 20,301,741 10,539,643 6,560,505 37,401,889
2016 10,090,386 3,372,586 1,653,909 15,116,881 10,090,386 2,137,913 1,373,321 13,601,620
2017 13,488,094 4,749,373 1,482,203 19,719,670 13,488,094 3,339,528 1,251,103 18,078,725
2018 34,310,484 11,919,494 2,841,427 49,071,405 34,310,484 7,808,703 2,200,395 44,319,582
2019 46,346,583 27,779,047 5,007,108 79,132,738 46,346,583 21,240,250 3,940,180 71,527,013
2020 44,028,907 43,977,391 5,888,695 93,894,993 44,028,907 36,017,004 4,769,931 84,815,842
2021 23,236,400 44,476,883 1,237,980 68,951,263 23,236,400 38,705,347 390,760 62,332,507
All Years 191,802,595 151,326,050 25,219,891 368,348,536 191,802,595 119,788,388 20,486,195 332,077,178
Accident Benefits 2015 & Prior 48,386,733 11,795,679 3,902,360 64,084,772 48,386,733 8,576,323 3,607,426 60,570,482
2016 7,123,512 812,403 847,085 8,783,000 7,123,512 389,091 749,677 8,262,280
2017 3,082,468 578,618 924,802 4,585,888 3,082,468 141,461 813,900 4,037,829
2018 4,042,841 3,323,495 1,701,555 9,067,891 4,042,841 2,194,314 1,436,600 7,673,755
2019 7,105,294 8,014,312 3,054,422 18,174,028 7,105,294 5,905,124 2,547,602 15,558,020
2020 5,503,720 12,968,593 2,926,576 21,398,889 5,503,720 10,673,199 2,395,051 18,571,970
2021 4,675,687 6,043,657 250,853 10,970,197 4,675,687 5,256,362 114,183 10,046,232
All Years 79,920,255 43,536,757 13,607,653 137,064,665 79,920,255 33,135,874 11,664,439 124,720,568
Other 2015 & Prior 264,566 0 0 264,566 264,566 0 0 264,566
2016 1,706 0 0 1,706 1,706 0 0 1,706
2017 256,154 0 0 256,154 256,154 0 0 256,154
2018 312,228 0 0 312,228 312,228 0 0 312,228
2019 1,594,987 473,650 286,472 2,355,109 1,594,987 349,614 243,215 2,187,816
2020 4,190,028 9,932,020 1,530,720 15,652,768 4,190,028 8,195,813 1,258,027 13,643,868
2021 7,372,901 40,527,446 1,224,027 49,124,374 7,372,901 35,306,281 446,933 43,126,115
All Years 13,992,570 50,933,116 3,041,219 67,966,905 13,992,570 43,851,708 1,948,175 59,792,453
Total All Lines 2015 & Prior 68,953,040 26,846,955 11,010,929 106,810,924 68,953,040 19,115,966 10,167,931 98,236,937
2016 17,215,604 4,184,989 2,500,994 23,901,587 17,215,604 2,527,004 2,122,998 21,865,606
2017 16,826,716 5,327,991 2,407,005 24,561,712 16,826,716 3,480,989 2,065,003 22,372,708
2018 38,665,553 15,242,989 4,542,982 58,451,524 38,665,553 10,003,017 3,636,995 52,305,565
2019 55,046,864 36,267,009 8,348,002 99,661,875 55,046,864 27,494,988 6,730,997 89,272,849
2020 53,722,655 66,878,004 10,345,991 130,946,650 53,722,655 54,886,016 8,423,009 117,031,680
2021 35,284,988 91,047,986 2,712,860 129,045,834 35,284,988 79,267,990 951,876 115,504,854
All Years 285,715,420 245,795,923 41,868,763 573,380,106 285,715,420 196,775,970 34,098,809 516,590,199
FA System 9/14/2021 4:48:12 PM EST
© 2021 Facility Association. All rights reserved.Page 10 of 11
FACILITY ASSOCIATION RESIDUAL MARKET GOVERNMENT LINE REPORT
AS AT:
Company:
Jurisdiction:Download to CSV based on selection criteria
EXHIBIT 6-B
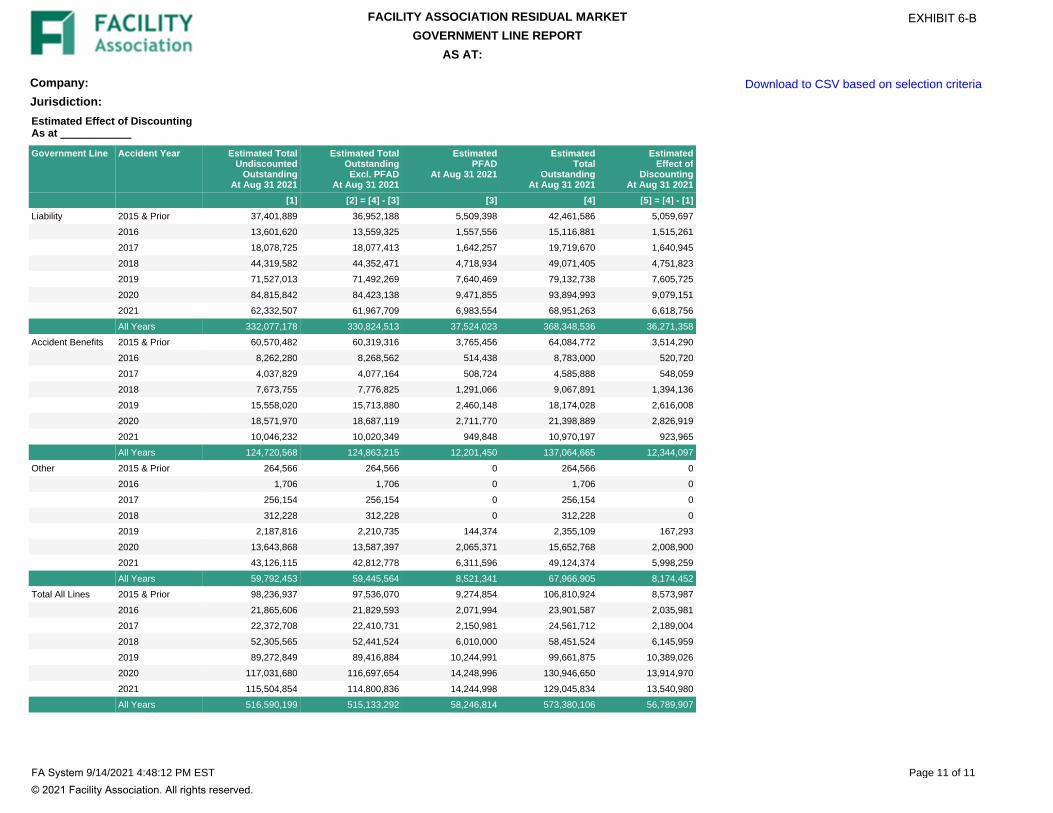
Estimated Effect of Discounting As at ____________
Government Line Accident Year Estimated TotalUndiscounted
OutstandingAt Aug 31 2021
Estimated TotalOutstandingExcl. PFAD
At Aug 31 2021
EstimatedPFAD
At Aug 31 2021
EstimatedTotal
OutstandingAt Aug 31 2021
EstimatedEffect of
DiscountingAt Aug 31 2021
[1] [2] = [4] - [3] [3] [4] [5] = [4] - [1]
Liability 2015 & Prior 37,401,889 36,952,188 5,509,398 42,461,586 5,059,697
2016 13,601,620 13,559,325 1,557,556 15,116,881 1,515,261
2017 18,078,725 18,077,413 1,642,257 19,719,670 1,640,945
2018 44,319,582 44,352,471 4,718,934 49,071,405 4,751,823
2019 71,527,013 71,492,269 7,640,469 79,132,738 7,605,725
2020 84,815,842 84,423,138 9,471,855 93,894,993 9,079,151
2021 62,332,507 61,967,709 6,983,554 68,951,263 6,618,756
All Years 332,077,178 330,824,513 37,524,023 368,348,536 36,271,358
Accident Benefits 2015 & Prior 60,570,482 60,319,316 3,765,456 64,084,772 3,514,290
2016 8,262,280 8,268,562 514,438 8,783,000 520,720
2017 4,037,829 4,077,164 508,724 4,585,888 548,059
2018 7,673,755 7,776,825 1,291,066 9,067,891 1,394,136
2019 15,558,020 15,713,880 2,460,148 18,174,028 2,616,008
2020 18,571,970 18,687,119 2,711,770 21,398,889 2,826,919
2021 10,046,232 10,020,349 949,848 10,970,197 923,965
All Years 124,720,568 124,863,215 12,201,450 137,064,665 12,344,097
Other 2015 & Prior 264,566 264,566 0 264,566 0
2016 1,706 1,706 0 1,706 0
2017 256,154 256,154 0 256,154 0
2018 312,228 312,228 0 312,228 0
2019 2,187,816 2,210,735 144,374 2,355,109 167,293
2020 13,643,868 13,587,397 2,065,371 15,652,768 2,008,900
2021 43,126,115 42,812,778 6,311,596 49,124,374 5,998,259
All Years 59,792,453 59,445,564 8,521,341 67,966,905 8,174,452
Total All Lines 2015 & Prior 98,236,937 97,536,070 9,274,854 106,810,924 8,573,987
2016 21,865,606 21,829,593 2,071,994 23,901,587 2,035,981
2017 22,372,708 22,410,731 2,150,981 24,561,712 2,189,004
2018 52,305,565 52,441,524 6,010,000 58,451,524 6,145,959
2019 89,272,849 89,416,884 10,244,991 99,661,875 10,389,026
2020 117,031,680 116,697,654 14,248,996 130,946,650 13,914,970
2021 115,504,854 114,800,836 14,244,998 129,045,834 13,540,980
All Years 516,590,199 515,133,292 58,246,814 573,380,106 56,789,907
FA System 9/14/2021 4:48:12 PM EST
© 2021 Facility Association. All rights reserved.Page 11 of 11
FACILITY ASSOCIATION RESIDUAL MARKET GOVERNMENT LINE REPORT
AS AT:
Company:
Jurisdiction:Download to CSV based on selection criteria
EXHIBIT 6-B
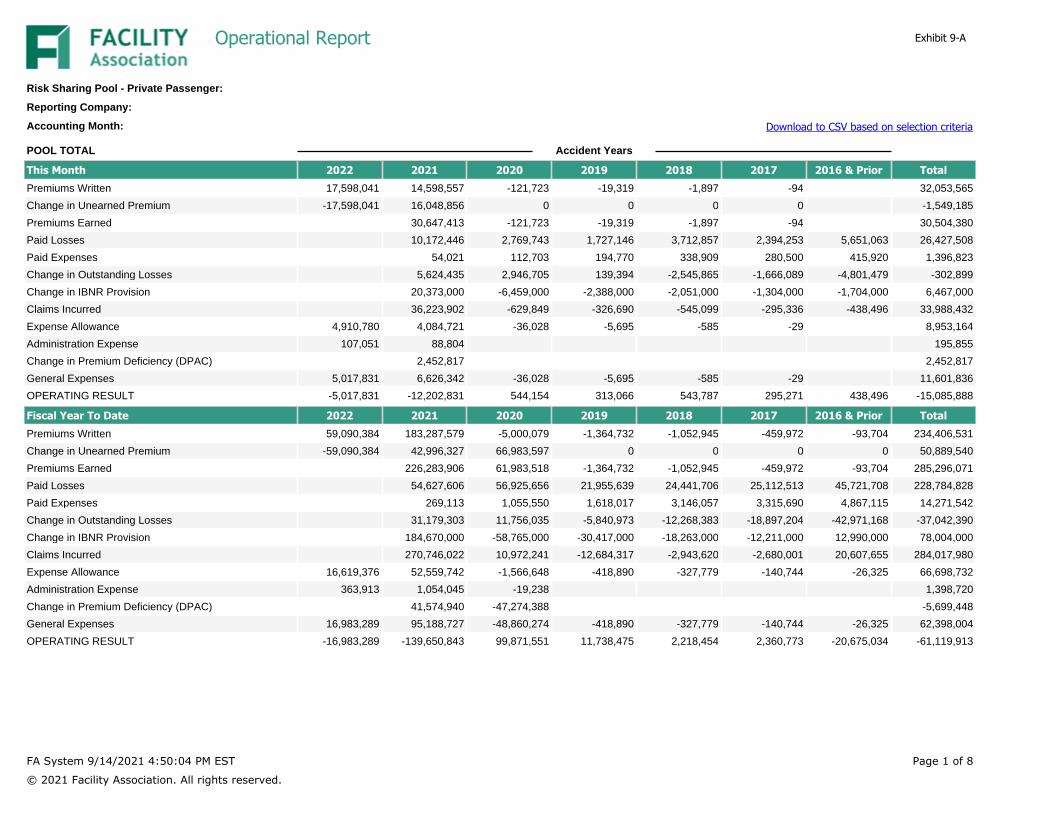
This Month 2022 2021 2020 2019 2018 2017 2016 & Prior TotalPremiums Written 17,598,041 14,598,557 -121,723 -19,319 -1,897 -94 32,053,565
Change in Unearned Premium -17,598,041 16,048,856 0 0 0 0 -1,549,185
Premiums Earned 30,647,413 -121,723 -19,319 -1,897 -94 30,504,380
Paid Losses 10,172,446 2,769,743 1,727,146 3,712,857 2,394,253 5,651,063 26,427,508
Paid Expenses 54,021 112,703 194,770 338,909 280,500 415,920 1,396,823
Change in Outstanding Losses 5,624,435 2,946,705 139,394 -2,545,865 -1,666,089 -4,801,479 -302,899
Change in IBNR Provision 20,373,000 -6,459,000 -2,388,000 -2,051,000 -1,304,000 -1,704,000 6,467,000
Claims Incurred 36,223,902 -629,849 -326,690 -545,099 -295,336 -438,496 33,988,432
Expense Allowance 4,910,780 4,084,721 -36,028 -5,695 -585 -29 8,953,164
Administration Expense 107,051 88,804 195,855
Change in Premium Deficiency (DPAC) 2,452,817 2,452,817
General Expenses 5,017,831 6,626,342 -36,028 -5,695 -585 -29 11,601,836
OPERATING RESULT -5,017,831 -12,202,831 544,154 313,066 543,787 295,271 438,496 -15,085,888
POOL TOTAL
Fiscal Year To Date 2022 2021 2020 2019 2018 2017 2016 & Prior TotalPremiums Written 59,090,384 183,287,579 -5,000,079 -1,364,732 -1,052,945 -459,972 -93,704 234,406,531
Change in Unearned Premium -59,090,384 42,996,327 66,983,597 0 0 0 0 50,889,540
Premiums Earned 226,283,906 61,983,518 -1,364,732 -1,052,945 -459,972 -93,704 285,296,071
Paid Losses 54,627,606 56,925,656 21,955,639 24,441,706 25,112,513 45,721,708 228,784,828
Paid Expenses 269,113 1,055,550 1,618,017 3,146,057 3,315,690 4,867,115 14,271,542
Change in Outstanding Losses 31,179,303 11,756,035 -5,840,973 -12,268,383 -18,897,204 -42,971,168 -37,042,390
Change in IBNR Provision 184,670,000 -58,765,000 -30,417,000 -18,263,000 -12,211,000 12,990,000 78,004,000
Claims Incurred 270,746,022 10,972,241 -12,684,317 -2,943,620 -2,680,001 20,607,655 284,017,980
Expense Allowance 16,619,376 52,559,742 -1,566,648 -418,890 -327,779 -140,744 -26,325 66,698,732
Administration Expense 363,913 1,054,045 -19,238 1,398,720
Change in Premium Deficiency (DPAC) 41,574,940 -47,274,388 -5,699,448
General Expenses 16,983,289 95,188,727 -48,860,274 -418,890 -327,779 -140,744 -26,325 62,398,004
OPERATING RESULT -16,983,289 -139,650,843 99,871,551 11,738,475 2,218,454 2,360,773 -20,675,034 -61,119,913
Accident Years
FA System 9/14/2021 4:50:04 PM EST
© 2021 Facility Association. All rights reserved.
Page 1 of 8
Operational Report
Risk Sharing Pool - Private Passenger:
Reporting Company:
Accounting Month: Download to CSV based on selection criteria
Exhibit 9-A
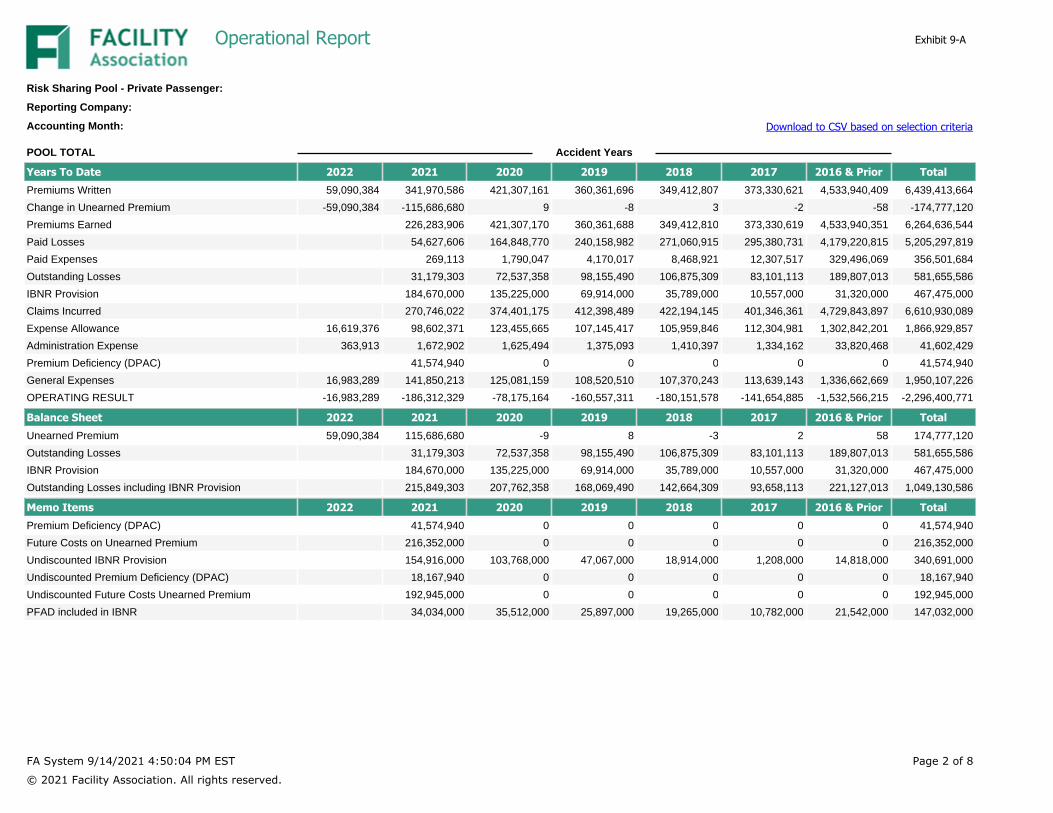
Years To Date 2022 2021 2020 2019 2018 2017 2016 & Prior TotalPremiums Written 59,090,384 341,970,586 421,307,161 360,361,696 349,412,807 373,330,621 4,533,940,409 6,439,413,664
Change in Unearned Premium -59,090,384 -115,686,680 9 -8 3 -2 -58 -174,777,120
Premiums Earned 226,283,906 421,307,170 360,361,688 349,412,810 373,330,619 4,533,940,351 6,264,636,544
Paid Losses 54,627,606 164,848,770 240,158,982 271,060,915 295,380,731 4,179,220,815 5,205,297,819
Paid Expenses 269,113 1,790,047 4,170,017 8,468,921 12,307,517 329,496,069 356,501,684
Outstanding Losses 31,179,303 72,537,358 98,155,490 106,875,309 83,101,113 189,807,013 581,655,586
IBNR Provision 184,670,000 135,225,000 69,914,000 35,789,000 10,557,000 31,320,000 467,475,000
Claims Incurred 270,746,022 374,401,175 412,398,489 422,194,145 401,346,361 4,729,843,897 6,610,930,089
Expense Allowance 16,619,376 98,602,371 123,455,665 107,145,417 105,959,846 112,304,981 1,302,842,201 1,866,929,857
Administration Expense 363,913 1,672,902 1,625,494 1,375,093 1,410,397 1,334,162 33,820,468 41,602,429
Premium Deficiency (DPAC) 41,574,940 0 0 0 0 0 41,574,940
General Expenses 16,983,289 141,850,213 125,081,159 108,520,510 107,370,243 113,639,143 1,336,662,669 1,950,107,226
OPERATING RESULT -16,983,289 -186,312,329 -78,175,164 -160,557,311 -180,151,578 -141,654,885 -1,532,566,215 -2,296,400,771
POOL TOTAL
Balance Sheet 2022 2021 2020 2019 2018 2017 2016 & Prior TotalUnearned Premium 59,090,384 115,686,680 -9 8 -3 2 58 174,777,120
Outstanding Losses 31,179,303 72,537,358 98,155,490 106,875,309 83,101,113 189,807,013 581,655,586
IBNR Provision 184,670,000 135,225,000 69,914,000 35,789,000 10,557,000 31,320,000 467,475,000
Outstanding Losses including IBNR Provision 215,849,303 207,762,358 168,069,490 142,664,309 93,658,113 221,127,013 1,049,130,586
Memo Items 2022 2021 2020 2019 2018 2017 2016 & Prior TotalPremium Deficiency (DPAC) 41,574,940 0 0 0 0 0 41,574,940
Future Costs on Unearned Premium 216,352,000 0 0 0 0 0 216,352,000
Undiscounted IBNR Provision 154,916,000 103,768,000 47,067,000 18,914,000 1,208,000 14,818,000 340,691,000
Undiscounted Premium Deficiency (DPAC) 18,167,940 0 0 0 0 0 18,167,940
Undiscounted Future Costs Unearned Premium 192,945,000 0 0 0 0 0 192,945,000
PFAD included in IBNR 34,034,000 35,512,000 25,897,000 19,265,000 10,782,000 21,542,000 147,032,000
Accident Years
FA System 9/14/2021 4:50:04 PM EST
© 2021 Facility Association. All rights reserved.
Page 2 of 8
Operational Report
Risk Sharing Pool - Private Passenger:
Reporting Company:
Accounting Month: Download to CSV based on selection criteria
Exhibit 9-A

MEMBER'S SHARE
Premiums Written 17,598,038 14,598,561 -121,723 -19,313 -1,903 -90 0 32,053,570
Change in Unearned Premium -17,598,038 16,048,846 -2 -2 -1 -2 0 -1,549,199
Premiums Earned 30,647,407 -121,725 -19,315 -1,904 -92 0 30,504,371
Paid Losses 10,172,447 2,769,742 1,727,139 3,712,855 2,394,252 5,651,050 26,427,485
Paid Expenses 54,019 112,691 194,772 338,907 280,501 415,934 1,396,824
Change in Outstanding Losses 5,624,440 2,946,708 139,399 -2,545,862 -1,666,096 -4,801,492 -302,903
Change in IBNR Provision 20,373,004 -6,459,002 -2,388,003 -2,050,996 -1,303,998 -1,704,005 6,467,000
Claims Incurred 36,223,910 -629,861 -326,693 -545,096 -295,341 -438,513 33,988,406
Expense Allowance 4,910,781 4,084,718 -36,035 -5,701 -587 -28 0 8,953,148
Administration Expense 107,047 88,799 0 0 0 0 0 195,846
Change in Premium Deficiency (DPAC) 2,452,811 2,452,811
General Expenses 5,017,828 6,626,328 -36,035 -5,701 -587 -28 0 11,601,805
OPERATING RESULT -5,017,828 -12,202,831 544,171 313,079 543,779 295,277 438,513 -15,085,840
Fiscal Year To Date 2022 2021 2020 2019 2018 2017 2016 & Prior TotalPremiums Written 59,090,375 183,287,576 -5,000,053 -1,364,714 -1,052,951 -459,974 -93,704 234,406,555
Change in Unearned Premium -59,090,375 42,996,334 66,983,590 -2 3 -3 2 50,889,549
Premiums Earned 226,283,910 61,983,537 -1,364,716 -1,052,948 -459,977 -93,702 285,296,104
Paid Losses 54,627,595 56,925,644 21,955,641 24,441,704 25,112,498 45,721,659 228,784,741
Paid Expenses 269,112 1,055,537 1,617,998 3,146,035 3,315,689 4,867,072 14,271,443
Change in Outstanding Losses 31,179,305 11,756,020 -5,840,977 -12,268,382 -18,897,205 -42,971,228 -37,042,467
Change in IBNR Provision 184,670,006 -58,764,987 -30,416,991 -18,262,999 -12,211,002 12,990,003 78,004,030
Claims Incurred 270,746,018 10,972,214 -12,684,329 -2,943,642 -2,680,020 20,607,506 284,017,747
Expense Allowance 16,619,377 52,559,753 -1,566,647 -418,888 -327,778 -140,747 -26,328 66,698,742
Administration Expense 363,911 1,054,039 -19,233 0 0 0 0 1,398,717
Change in Premium Deficiency (DPAC) 41,574,937 -47,274,391 -5,699,454
General Expenses 16,983,288 95,188,729 -48,860,271 -418,888 -327,778 -140,747 -26,328 62,398,005
OPERATING RESULT -16,983,288 -139,650,837 99,871,594 11,738,501 2,218,472 2,360,790 -20,674,880 -61,119,648
Accident Years
This Month 2022 2021 2020 2019 2018 2017 2016 & Prior TotalSharing Percentage 100.000001 100.000001 100.000005 100.000003 100.000002 99.999993
FA System 9/14/2021 4:50:04 PM EST
© 2021 Facility Association. All rights reserved.
Page 3 of 8
Operational Report
Risk Sharing Pool - Private Passenger:
Reporting Company:
Accounting Month: Download to CSV based on selection criteria
Exhibit 9-A
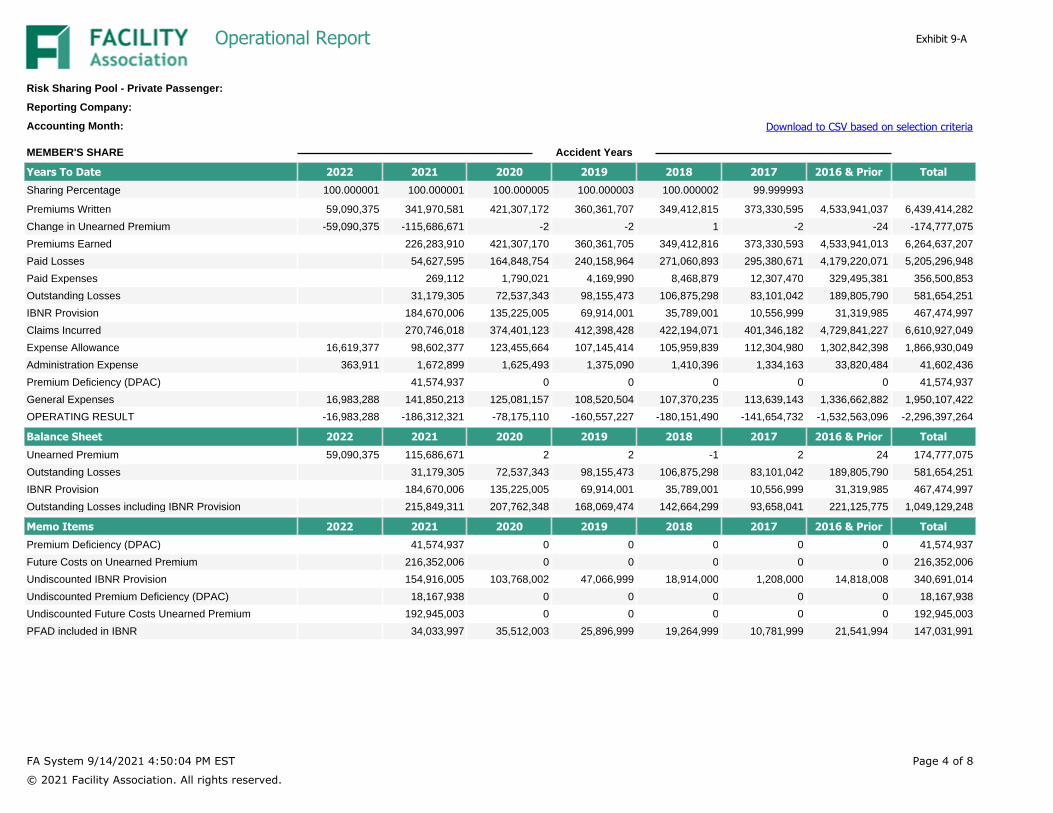
Premiums Written 59,090,375 341,970,581 421,307,172 360,361,707 349,412,815 373,330,595 4,533,941,037 6,439,414,282
Change in Unearned Premium -59,090,375 -115,686,671 -2 -2 1 -2 -24 -174,777,075
Premiums Earned 226,283,910 421,307,170 360,361,705 349,412,816 373,330,593 4,533,941,013 6,264,637,207
Paid Losses 54,627,595 164,848,754 240,158,964 271,060,893 295,380,671 4,179,220,071 5,205,296,948
Paid Expenses 269,112 1,790,021 4,169,990 8,468,879 12,307,470 329,495,381 356,500,853
Outstanding Losses 31,179,305 72,537,343 98,155,473 106,875,298 83,101,042 189,805,790 581,654,251
IBNR Provision 184,670,006 135,225,005 69,914,001 35,789,001 10,556,999 31,319,985 467,474,997
Claims Incurred 270,746,018 374,401,123 412,398,428 422,194,071 401,346,182 4,729,841,227 6,610,927,049
Expense Allowance 16,619,377 98,602,377 123,455,664 107,145,414 105,959,839 112,304,980 1,302,842,398 1,866,930,049
Administration Expense 363,911 1,672,899 1,625,493 1,375,090 1,410,396 1,334,163 33,820,484 41,602,436
Premium Deficiency (DPAC) 41,574,937 0 0 0 0 0 41,574,937
General Expenses 16,983,288 141,850,213 125,081,157 108,520,504 107,370,235 113,639,143 1,336,662,882 1,950,107,422
OPERATING RESULT -16,983,288 -186,312,321 -78,175,110 -160,557,227 -180,151,490 -141,654,732 -1,532,563,096 -2,296,397,264
MEMBER'S SHARE
Balance Sheet 2022 2021 2020 2019 2018 2017 2016 & Prior TotalUnearned Premium 59,090,375 115,686,671 2 2 -1 2 24 174,777,075
Outstanding Losses 31,179,305 72,537,343 98,155,473 106,875,298 83,101,042 189,805,790 581,654,251
IBNR Provision 184,670,006 135,225,005 69,914,001 35,789,001 10,556,999 31,319,985 467,474,997
Outstanding Losses including IBNR Provision 215,849,311 207,762,348 168,069,474 142,664,299 93,658,041 221,125,775 1,049,129,248
Memo Items 2022 2021 2020 2019 2018 2017 2016 & Prior TotalPremium Deficiency (DPAC) 41,574,937 0 0 0 0 0 41,574,937
Future Costs on Unearned Premium 216,352,006 0 0 0 0 0 216,352,006
Undiscounted IBNR Provision 154,916,005 103,768,002 47,066,999 18,914,000 1,208,000 14,818,008 340,691,014
Undiscounted Premium Deficiency (DPAC) 18,167,938 0 0 0 0 0 18,167,938
Undiscounted Future Costs Unearned Premium 192,945,003 0 0 0 0 0 192,945,003
PFAD included in IBNR 34,033,997 35,512,003 25,896,999 19,264,999 10,781,999 21,541,994 147,031,991
Accident Years
Years To Date 2022 2021 2020 2019 2018 2017 2016 & Prior TotalSharing Percentage 100.000001 100.000001 100.000005 100.000003 100.000002 99.999993
FA System 9/14/2021 4:50:04 PM EST
© 2021 Facility Association. All rights reserved.
Page 4 of 8
Operational Report
Risk Sharing Pool - Private Passenger:
Reporting Company:
Accounting Month: Download to CSV based on selection criteria
Exhibit 9-A
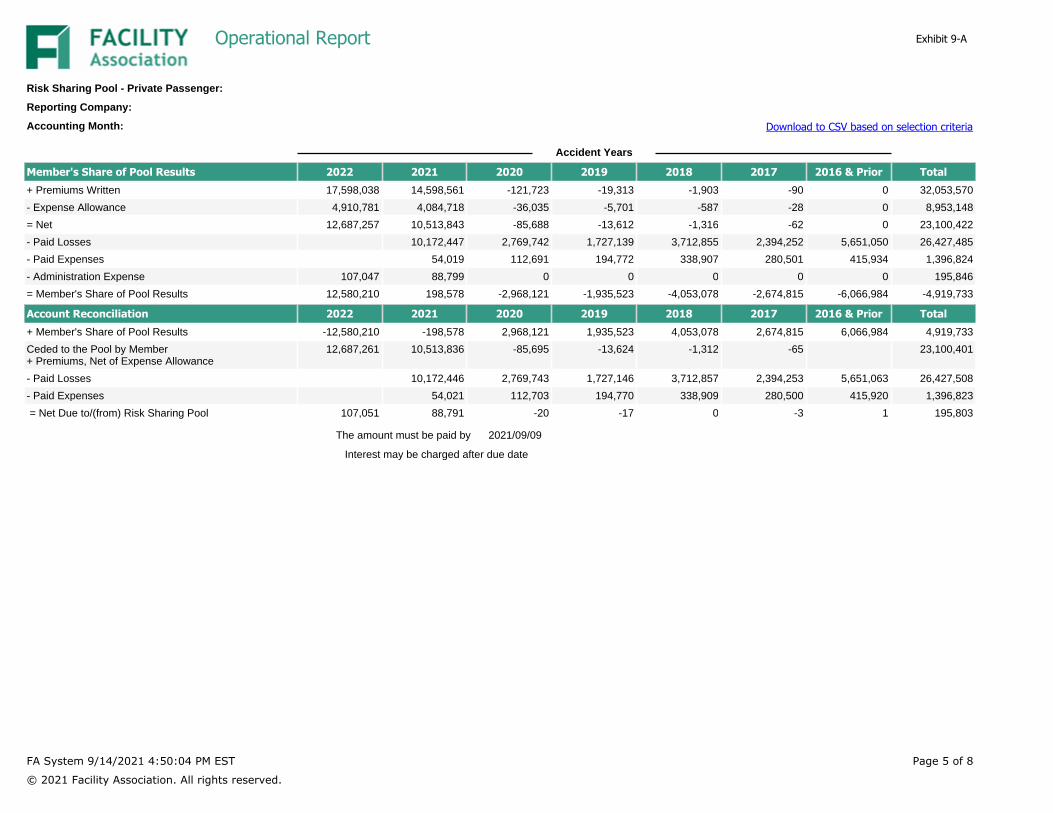
Member's Share of Pool Results 2022 2021 2020 2019 2018 2017 2016 & Prior Total+ Premiums Written 17,598,038 14,598,561 -121,723 -19,313 -1,903 -90 0 32,053,570
- Expense Allowance 4,910,781 4,084,718 -36,035 -5,701 -587 -28 0 8,953,148
= Net 12,687,257 10,513,843 -85,688 -13,612 -1,316 -62 0 23,100,422
- Paid Losses 10,172,447 2,769,742 1,727,139 3,712,855 2,394,252 5,651,050 26,427,485
- Paid Expenses 54,019 112,691 194,772 338,907 280,501 415,934 1,396,824
- Administration Expense 107,047 88,799 0 0 0 0 0 195,846
= Member's Share of Pool Results 12,580,210 198,578 -2,968,121 -1,935,523 -4,053,078 -2,674,815 -6,066,984 -4,919,733
Account Reconciliation 2022 2021 2020 2019 2018 2017 2016 & Prior Total+ Member's Share of Pool Results -12,580,210 -198,578 2,968,121 1,935,523 4,053,078 2,674,815 6,066,984 4,919,733
Ceded to the Pool by Member+ Premiums, Net of Expense Allowance
12,687,261 10,513,836 -85,695 -13,624 -1,312 -65 23,100,401
- Paid Losses 10,172,446 2,769,743 1,727,146 3,712,857 2,394,253 5,651,063 26,427,508
- Paid Expenses 54,021 112,703 194,770 338,909 280,500 415,920 1,396,823
= Net Due to/(from) Risk Sharing Pool 107,051 88,791 -20 -17 0 -3 1 195,803
The amount must be paid by 2021/09/09
Interest may be charged after due date
Accident Years
FA System 9/14/2021 4:50:04 PM EST
© 2021 Facility Association. All rights reserved.
Page 5 of 8
Operational Report
Risk Sharing Pool - Private Passenger:
Reporting Company:
Accounting Month: Download to CSV based on selection criteria
Exhibit 9-A

REPORTED BY MEMBERThis Month
Premium 2022 2021 2020 2019 2018 2017 2016 & Prior Total+ Gross 20,703,577 17,174,770 -143,204 -22,726 -2,231 -110 37,710,076
- Retained 3,105,536 2,576,213 -21,481 -3,407 -334 -16 5,656,511
= Transferred 17,598,041 14,598,557 -121,723 -19,319 -1,897 -94 32,053,565
- Expense Allowance 4,910,780 4,084,721 -36,028 -5,695 -585 -29 8,953,164
= Net (B) 12,687,261 10,513,836 -85,695 -13,624 -1,312 -65 23,100,401
Normal Payments 2022 2021 2020 2019 2018 2017 2016 & Prior Total+ Gross Paid Losses 11,967,583 3,258,524 2,031,936 4,368,067 2,816,768 6,648,319 31,091,197
- Retained Paid Losses 1,795,137 488,781 304,790 655,210 422,515 997,256 4,663,689
= Transferred Paid Losses (C) 10,172,446 2,769,743 1,727,146 3,712,857 2,394,253 5,651,063 26,427,508
+ Gross Paid Expenses 63,552 132,592 229,143 398,717 329,999 489,312 1,643,315
- Retained Paid Expenses 9,531 19,889 34,373 59,808 49,499 73,392 246,492
= Transferred Paid Expenses (D) 54,021 112,703 194,770 338,909 280,500 415,920 1,396,823
Special Payments 2022 2021 2020 2019 2018 2017 2016 & Prior Total+ Gross Paid Losses
- Retained Paid Losses
= Transferred Paid Losses
+ Gross Paid Expenses
- Retained Paid Expenses
+ Gross Paid Losses
Total Payments 2022 2021 2020 2019 2018 2017 2016 & Prior Total+ Gross Paid Losses 11,967,583 3,258,524 2,031,936 4,368,067 2,816,768 6,648,319 31,091,197
- Retained Paid Losses 1,795,137 488,781 304,790 655,210 422,515 997,256 4,663,689
= Transferred Paid Losses 10,172,446 2,769,743 1,727,146 3,712,857 2,394,253 5,651,063 26,427,508
+ Gross Paid Expenses 63,552 132,592 229,143 398,717 329,999 489,312 1,643,315
- Retained Paid Expenses 9,531 19,889 34,373 59,808 49,499 73,392 246,492
= Transferred Paid Expenses 54,021 112,703 194,770 338,909 280,500 415,920 1,396,823
Accident Years
FA System 9/14/2021 4:50:04 PM EST
© 2021 Facility Association. All rights reserved.
Page 6 of 8
Operational Report
Risk Sharing Pool - Private Passenger:
Reporting Company:
Accounting Month: Download to CSV based on selection criteria
Exhibit 9-A
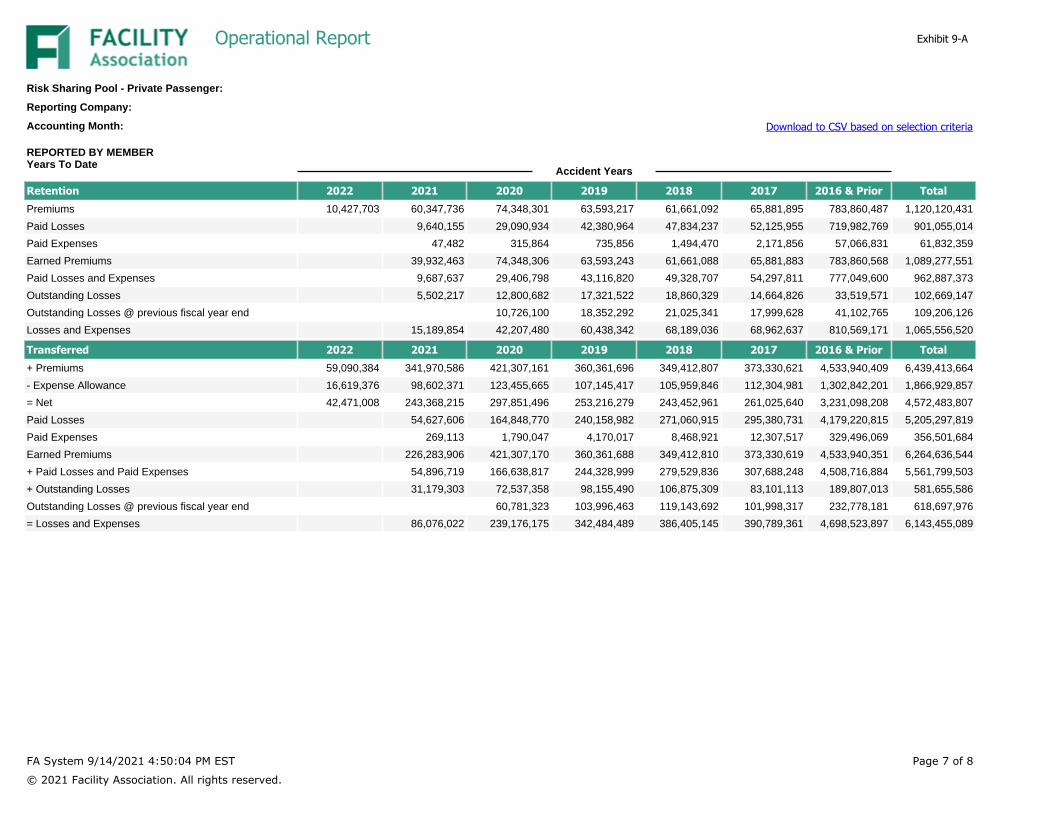
REPORTED BY MEMBERYears To Date
Retention 2022 2021 2020 2019 2018 2017 2016 & Prior TotalPremiums 10,427,703 60,347,736 74,348,301 63,593,217 61,661,092 65,881,895 783,860,487 1,120,120,431
Paid Losses 9,640,155 29,090,934 42,380,964 47,834,237 52,125,955 719,982,769 901,055,014
Paid Expenses 47,482 315,864 735,856 1,494,470 2,171,856 57,066,831 61,832,359
Earned Premiums 39,932,463 74,348,306 63,593,243 61,661,088 65,881,883 783,860,568 1,089,277,551
Paid Losses and Expenses 9,687,637 29,406,798 43,116,820 49,328,707 54,297,811 777,049,600 962,887,373
Outstanding Losses 5,502,217 12,800,682 17,321,522 18,860,329 14,664,826 33,519,571 102,669,147
Outstanding Losses @ previous fiscal year end 10,726,100 18,352,292 21,025,341 17,999,628 41,102,765 109,206,126
Losses and Expenses 15,189,854 42,207,480 60,438,342 68,189,036 68,962,637 810,569,171 1,065,556,520
Transferred 2022 2021 2020 2019 2018 2017 2016 & Prior Total+ Premiums 59,090,384 341,970,586 421,307,161 360,361,696 349,412,807 373,330,621 4,533,940,409 6,439,413,664
- Expense Allowance 16,619,376 98,602,371 123,455,665 107,145,417 105,959,846 112,304,981 1,302,842,201 1,866,929,857
= Net 42,471,008 243,368,215 297,851,496 253,216,279 243,452,961 261,025,640 3,231,098,208 4,572,483,807
Paid Losses 54,627,606 164,848,770 240,158,982 271,060,915 295,380,731 4,179,220,815 5,205,297,819
Paid Expenses 269,113 1,790,047 4,170,017 8,468,921 12,307,517 329,496,069 356,501,684
Earned Premiums 226,283,906 421,307,170 360,361,688 349,412,810 373,330,619 4,533,940,351 6,264,636,544
+ Paid Losses and Paid Expenses 54,896,719 166,638,817 244,328,999 279,529,836 307,688,248 4,508,716,884 5,561,799,503
+ Outstanding Losses 31,179,303 72,537,358 98,155,490 106,875,309 83,101,113 189,807,013 581,655,586
Outstanding Losses @ previous fiscal year end 60,781,323 103,996,463 119,143,692 101,998,317 232,778,181 618,697,976
= Losses and Expenses 86,076,022 239,176,175 342,484,489 386,405,145 390,789,361 4,698,523,897 6,143,455,089
Accident Years
FA System 9/14/2021 4:50:04 PM EST
© 2021 Facility Association. All rights reserved.
Page 7 of 8
Operational Report
Risk Sharing Pool - Private Passenger:
Reporting Company:
Accounting Month: Download to CSV based on selection criteria
Exhibit 9-A

Fiscal Year FY Jul 2021[1]
Estimate Aug 2021
[2]
Estimate Sep 2021
[3]
Estimate Nov 2020
[4]
Estimate Dec 2020
[5]
Year to Date at
CY Sep 2021[6]
Year to Date at
CY Aug 2021[7]
Calendar Month
Sep 2021[8]
Premiums Written 234,406,555 40,287,995 49,342,004 52,026,000 29,576,003 242,434,551 199,096,984 43,337,567
Change in Unearned Premium 50,889,549 -5,348,511 -19,285,393 -15,618,347 8,640,944 33,233,048 47,039,456 -13,806,408
Premiums Earned 285,296,104 34,939,484 30,056,611 36,407,653 38,216,947 275,667,599 246,136,440 29,531,159
Paid Losses 228,784,741 21,553,333 22,638,940 29,397,819 31,341,969 212,237,226 183,420,182 28,817,044
Paid Expenses 14,271,443 2,302,801 2,521,878 2,955,431 3,179,918 12,960,773 11,412,981 1,547,792
Change in Outstanding Losses -37,042,467 1,116,676 -2,713,996 88,670 -783,032 -37,945,425 -37,054,102 -891,323
Change in IBNR Provision 78,004,030 14,834,967 11,206,006 1,450,994 1,760,997 100,833,012 97,902,058 2,930,954
Claims Incurred 284,017,747 39,807,777 33,652,828 33,892,914 35,499,852 288,085,586 255,681,119 32,404,467
Expense Allowance 66,698,742 11,885,004 14,556,004 15,400,001 8,755,002 68,984,747 56,701,599 12,283,148
Administration Expense 1,398,717 168,992 207,001 208,997 117,998 1,447,715 1,204,872 242,843
Change in Premium Deficiency (DPAC) -5,699,454 4,167,064 8,110,989 12,316,612 7,189,004 -12,927,017 -19,408,997 6,481,980
General Expenses 62,398,005 16,221,060 22,873,994 27,925,610 16,062,004 57,505,445 38,497,474 19,007,971
OPERATING RESULT -61,119,648 -21,089,353 -26,470,211 -25,410,871 -13,344,909 -69,923,432 -48,042,153 -21,881,279
PROJECTIONS
Balance Sheet As At Jul 2021
Estimate At Aug 2021
Estimate At Sep 2021
Unearned Premium 174,777,075 180,125,586 199,410,979
Outstanding Losses 581,654,251 582,770,927 580,056,931
IBNR Provision 467,474,997 482,309,981 493,515,987
Outstanding Losses including IBNR Provision 1,049,129,248 1,065,080,908 1,073,572,918
Premium Deficiency (DPAC) 41,574,937 45,742,005 53,852,994
Future Costs on Unearned Premium 216,352,006 225,868,000 253,264,003
Undiscounted IBNR Provision 340,691,014 352,928,989 362,491,961
Undiscounted Premium Deficiency (DPAC) 18,167,938 21,304,001 26,450,002
Undiscounted Future Costs Unearned Premium 192,945,003 201,429,998 225,861,007
PFAD included in IBNR 147,031,991 149,957,943 151,781,909
MEMO ITEMS
FA System 9/14/2021 4:50:04 PM EST
© 2021 Facility Association. All rights reserved.
Page 8 of 8
Operational Report
Risk Sharing Pool - Private Passenger:
Reporting Company:
Accounting Month: Download to CSV based on selection criteria
Exhibit 9-A

Estimated Calendar Year Transferred Premiums For __ Months Ending _____________
Transfer To Pool Member's Share of Pool____________________________ ____________________________________________________________________________________________
[1] [2] [3] [4] [5] [6]=[3]+[4]-[5] [7] [8]=[6]-[7]
Government Line Written PremiumFiscal Year 2021
Nov 1 to Jul 31
WrittenPremium For
Nov & Dec 2020
Written PremiumFiscal Year 2021
For Nov 1 to Jul 31
EstimatedPremiums For
Aug 2021 & Sep 2021
EstimatedPremiums For
Nov & Dec 2020
Est PremiumsFor CY 2021At Sep 2021
Est PremiumsFor CY 2021At Aug 2021
Est PremiumsFor MonthSep 2021
Liability 103,265,495 19,302,260 103,262,855 41,605,982 37,077,672 107,791,165 87,118,015 20,673,150
Personal Accident 68,994,893 16,447,138 68,995,968 24,785,321 24,982,307 68,798,982 56,924,641 11,874,341
Other 62,146,143 14,104,572 62,147,732 23,238,700 19,542,020 65,844,412 55,054,335 10,790,077
Total All Lines 234,406,531 49,853,970 234,406,555 89,630,003 81,601,999 242,434,559 199,096,991 43,337,568
Page 1 of 10FA System 9/14/2021 4:51:00 PM EST
© 2021 Facility Association. All rights reserved.
Government Line ReportRSP:
Reporting Company:
Accounting Month: Download to CSV based on selection criteria
Exhibit 9-B

Transfer To Pool
Member's Share of Pool
_________ _______________________________________________________________________________________________________________________[1] [2] [3] [4]=[2]+[3] [5] [6] [7]=[6]+[5]-[4] [8] [9]=[7]-[8]
Government Line
UnearnedPremium
At Jul 31 2021
UnearnedAt Jul 31 2021
EstimatedChange in UPR
Aug 2021 & Sep 2021
EstimatedUnearned
At Sep 30 2021
Estimated UnearnedPremium At
Dec 31, 2020
Estimated WrittenPremium For CY 2021
At Sep 2021
Estimated EarnedPremium For CY 2021
At Sep 2021
Estimated EarnedPremium For CY 2021
At Aug 2021
Est Earned PremiumFor MonthSep 2021
Liability 79,735,277 79,677,667 12,201,182 91,878,849 105,529,031 107,791,165 121,441,347 108,023,485 13,417,862
Personal Accident 50,615,583 50,621,948 5,767,707 56,389,655 71,036,194 68,798,982 83,445,521 74,975,163 8,470,358
Other 44,467,883 44,477,460 6,665,012 51,142,472 56,078,793 65,844,412 70,780,733 63,137,787 7,642,946
Total All Lines 174,818,743 174,777,075 24,633,901 199,410,976 232,644,018 242,434,559 275,667,601 246,136,435 29,531,166
Estimated Unearned Premium at __________& Earned in __ Months Ending _____________
Page 2 of 10FA System 9/14/2021 4:51:00 PM EST
© 2021 Facility Association. All rights reserved.
Government Line ReportRSP:
Reporting Company:
Accounting Month: Download to CSV based on selection criteria
Exhibit 9-B
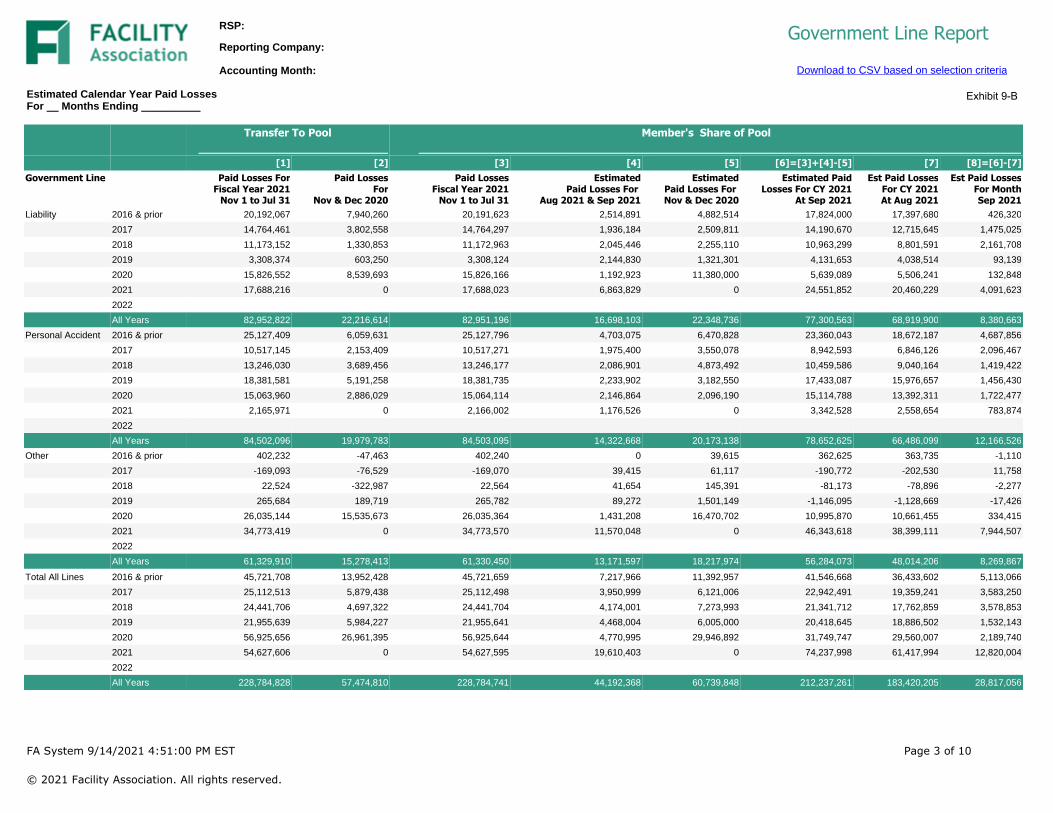
Estimated Calendar Year Paid Losses For __ Months Ending __________
Transfer To Pool Member's Share of Pool____________________________ _________________________________________________________________________________________
[1] [2] [3] [4] [5] [6]=[3]+[4]-[5] [7] [8]=[6]-[7]Government Line Paid Losses For
Fiscal Year 2021Nov 1 to Jul 31
Paid LossesFor
Nov & Dec 2020
Paid LossesFiscal Year 2021
Nov 1 to Jul 31
EstimatedPaid Losses For
Aug 2021 & Sep 2021
EstimatedPaid Losses For Nov & Dec 2020
Estimated PaidLosses For CY 2021
At Sep 2021
Est Paid LossesFor CY 2021At Aug 2021
Est Paid LossesFor MonthSep 2021
Liability 2016 & prior 20,192,067 7,940,260 20,191,623 2,514,891 4,882,514 17,824,000 17,397,680 426,320
2017 14,764,461 3,802,558 14,764,297 1,936,184 2,509,811 14,190,670 12,715,645 1,475,025
2018 11,173,152 1,330,853 11,172,963 2,045,446 2,255,110 10,963,299 8,801,591 2,161,708
2019 3,308,374 603,250 3,308,124 2,144,830 1,321,301 4,131,653 4,038,514 93,139
2020 15,826,552 8,539,693 15,826,166 1,192,923 11,380,000 5,639,089 5,506,241 132,848
2021 17,688,216 0 17,688,023 6,863,829 0 24,551,852 20,460,229 4,091,623
2022
All Years 82,952,822 22,216,614 82,951,196 16,698,103 22,348,736 77,300,563 68,919,900 8,380,663
Personal Accident 2016 & prior 25,127,409 6,059,631 25,127,796 4,703,075 6,470,828 23,360,043 18,672,187 4,687,856
2017 10,517,145 2,153,409 10,517,271 1,975,400 3,550,078 8,942,593 6,846,126 2,096,467
2018 13,246,030 3,689,456 13,246,177 2,086,901 4,873,492 10,459,586 9,040,164 1,419,422
2019 18,381,581 5,191,258 18,381,735 2,233,902 3,182,550 17,433,087 15,976,657 1,456,430
2020 15,063,960 2,886,029 15,064,114 2,146,864 2,096,190 15,114,788 13,392,311 1,722,477
2021 2,165,971 0 2,166,002 1,176,526 0 3,342,528 2,558,654 783,874
2022
All Years 84,502,096 19,979,783 84,503,095 14,322,668 20,173,138 78,652,625 66,486,099 12,166,526
Other 2016 & prior 402,232 -47,463 402,240 0 39,615 362,625 363,735 -1,110
2017 -169,093 -76,529 -169,070 39,415 61,117 -190,772 -202,530 11,758
2018 22,524 -322,987 22,564 41,654 145,391 -81,173 -78,896 -2,277
2019 265,684 189,719 265,782 89,272 1,501,149 -1,146,095 -1,128,669 -17,426
2020 26,035,144 15,535,673 26,035,364 1,431,208 16,470,702 10,995,870 10,661,455 334,415
2021 34,773,419 0 34,773,570 11,570,048 0 46,343,618 38,399,111 7,944,507
2022
All Years 61,329,910 15,278,413 61,330,450 13,171,597 18,217,974 56,284,073 48,014,206 8,269,867
Total All Lines 2016 & prior 45,721,708 13,952,428 45,721,659 7,217,966 11,392,957 41,546,668 36,433,602 5,113,066
2017 25,112,513 5,879,438 25,112,498 3,950,999 6,121,006 22,942,491 19,359,241 3,583,250
2018 24,441,706 4,697,322 24,441,704 4,174,001 7,273,993 21,341,712 17,762,859 3,578,853
2019 21,955,639 5,984,227 21,955,641 4,468,004 6,005,000 20,418,645 18,886,502 1,532,143
2020 56,925,656 26,961,395 56,925,644 4,770,995 29,946,892 31,749,747 29,560,007 2,189,740
2021 54,627,606 0 54,627,595 19,610,403 0 74,237,998 61,417,994 12,820,004
2022
All Years 228,784,828 57,474,810 228,784,741 44,192,368 60,739,848 212,237,261 183,420,205 28,817,056
Page 3 of 10FA System 9/14/2021 4:51:00 PM EST
© 2021 Facility Association. All rights reserved.
Government Line ReportRSP:
Reporting Company:
Accounting Month: Download to CSV based on selection criteria
Exhibit 9-B

Estimated Calendar Year Paid Expenses For __Months Ending _____________
Transfer To Pool Member's Share of Pool___________________________ ___________________________________________________________________________________________
[1] [2] [3] [4] [5] [6]=[3]+[4]-[5] [7] [8]=[6]-[7]Government Line Paid Expenses For
Fiscal Year 2021Nov 1 to Jul 31
Paid ExpensesFor
Nov & Dec 2020
Paid ExpensesFiscal Year 2021
Nov 1 to Jul 31
EstimatedPaid Expenses For
Aug 2021 & Sep 2021
EstimatedPaid Expenses For
Nov & Dec 2020
Estimated PaidExpenses For CY 2021
At Sep 2021
Est Paid ExpensesFor CY 2021At Aug 2021
Est Paid ExpensesFor MonthSep 2021
Liability 2016 & prior 2,894,877 754,169 2,894,515 668,133 1,346,316 2,216,332 1,949,839 266,4932017 2,027,761 464,665 2,027,640 546,057 708,253 1,865,444 1,518,624 346,8202018 1,627,718 280,153 1,627,531 577,398 144,028 2,060,901 1,868,902 191,9992019 658,109 80,883 657,942 136,971 84,442 710,471 620,932 89,5392020 205,512 51,486 205,325 76,425 250,419 31,331 16,130 15,2012021 39,546 0 39,564 89,038 0 128,602 110,191 18,4112022All Years 7,453,523 1,631,356 7,452,517 2,094,022 2,533,458 7,013,081 6,084,618 928,463
Personal Accident 2016 & prior 1,861,752 395,632 1,862,029 1,020,834 1,545,533 1,337,330 1,337,522 -1922017 1,235,335 292,561 1,235,443 556,898 1,001,567 790,774 526,637 264,1372018 1,476,884 389,830 1,477,022 588,908 310,785 1,755,145 1,653,503 101,6422019 902,617 189,120 902,729 142,413 202,899 842,243 759,422 82,8212020 473,113 56,525 473,209 137,165 46,006 564,368 503,964 60,4042021 34,880 0 34,864 15,144 0 50,008 38,446 11,5622022All Years 5,984,581 1,323,668 5,985,296 2,461,362 3,106,790 5,339,868 4,819,494 520,374
Other 2016 & prior 110,486 27,458 110,528 0 11,114 99,414 83,766 15,6482017 52,594 5,921 52,606 11,051 17,186 46,471 40,922 5,5492018 41,455 12,322 41,482 11,695 9,194 43,983 36,717 7,2662019 57,291 13,849 57,327 5,614 95,659 -32,718 -42,126 9,4082020 376,925 146,216 377,003 91,411 362,091 106,323 105,234 1,0892021 194,687 0 194,684 149,703 0 344,387 284,364 60,0232022All Years 833,438 205,766 833,630 269,474 495,244 607,860 508,877 98,983
Total All Lines 2016 & prior 4,867,115 1,177,259 4,867,072 1,688,967 2,902,963 3,653,076 3,371,127 281,9492017 3,315,690 763,147 3,315,689 1,114,006 1,727,006 2,702,689 2,086,183 616,5062018 3,146,057 682,305 3,146,035 1,178,001 464,007 3,860,029 3,559,122 300,9072019 1,618,017 283,852 1,617,998 284,998 383,000 1,519,996 1,338,228 181,7682020 1,055,550 254,227 1,055,537 305,001 658,516 702,022 625,328 76,6942021 269,113 0 269,112 253,885 0 522,997 433,001 89,9962022All Years 14,271,542 3,160,790 14,271,443 4,824,858 6,135,492 12,960,809 11,412,989 1,547,820
Page 4 of 10FA System 9/14/2021 4:51:00 PM EST
© 2021 Facility Association. All rights reserved.
Government Line ReportRSP:
Reporting Company:
Accounting Month: Download to CSV based on selection criteria
Exhibit 9-B

Estimated Outstanding Losses & IBNR Provision As at ______________
Transfer To Pool Member's Share of Pool_____________ _____________________________________________________________________________________________
[1] [2] [3] [4]=[2]+[3] [5] [6] [7]=[5]+[6]Government Line Outstanding
LossesOutstanding Losses
At Jul 31 2021Estimated Change in
Outstanding Losses For Aug 2021 & Sep 2021
EstimatedOutstanding Losses
At Sep 30 2021
IBNR AtJul 31 2021
EstimatedChange In IBNR
EstimatedIBNR At
Sep 30 2021Liability 2016 & prior 62,221,584 62,199,439 -2,712,181 59,487,258 3,097,264 -126,462 2,970,802
2017 41,017,594 41,015,974 -2,464,865 38,551,109 2,639,302 -158,251 2,481,0512018 58,716,547 58,715,033 -1,927,208 56,787,825 16,820,877 -1,203,663 15,617,2142019 51,383,153 51,382,052 -85,853 51,296,199 32,160,538 -2,455,022 29,705,5162020 28,542,727 28,542,006 1,983,521 30,525,527 51,385,593 -4,188,358 47,197,2352021 9,895,981 9,895,795 3,297,491 13,193,286 64,634,597 16,400,653 81,035,2502022All Years 251,777,586 251,750,299 -1,909,095 249,841,204 170,738,171 8,268,897 179,007,068
Personal Accident 2016 & prior 126,677,918 126,694,134 -5,904,764 120,789,370 28,222,721 -1,138,522 27,084,1992017 41,478,827 41,479,770 -2,492,750 38,987,020 7,917,697 -474,749 7,442,9482018 45,730,606 45,731,460 -1,501,070 44,230,390 18,968,124 -1,357,332 17,610,7922019 45,396,759 45,397,289 -75,849 45,321,440 36,355,235 -2,775,241 33,579,9942020 41,622,460 41,622,752 2,892,589 44,515,341 70,316,957 -5,731,440 64,585,5172021 13,959,857 13,959,903 4,651,794 18,611,697 40,627,352 10,308,980 50,936,3322022All Years 314,866,427 314,885,308 -2,430,050 312,455,258 202,408,086 -1,168,304 201,239,782
Other 2016 & prior 907,511 912,217 254,932 1,167,149 0 0 02017 604,692 605,298 -36,381 568,917 0 0 02018 2,428,156 2,428,805 -79,729 2,349,076 0 0 02019 1,375,578 1,376,132 -2,296 1,373,836 1,398,228 -106,737 1,291,4912020 2,372,171 2,372,585 164,890 2,537,475 13,522,455 -1,102,200 12,420,2552021 7,323,465 7,323,607 2,440,410 9,764,017 79,408,057 20,149,365 99,557,4222022All Years 15,011,573 15,018,644 2,741,826 17,760,470 94,328,740 18,940,428 113,269,168
Total All Lines 2016 & prior 189,807,013 189,805,790 -8,362,013 181,443,777 31,319,985 -1,264,984 30,055,0012017 83,101,113 83,101,042 -4,993,996 78,107,046 10,556,999 -633,000 9,923,9992018 106,875,309 106,875,298 -3,508,007 103,367,291 35,789,001 -2,560,995 33,228,0062019 98,155,490 98,155,473 -163,998 97,991,475 69,914,001 -5,337,000 64,577,0012020 72,537,358 72,537,343 5,041,000 77,578,343 135,225,005 -11,021,998 124,203,0072021 31,179,303 31,179,305 10,389,695 41,569,000 184,670,006 46,858,998 231,529,0042022All Years 581,655,586 581,654,251 -1,597,319 580,056,932 467,474,997 26,041,021 493,516,018
Page 5 of 10FA System 9/14/2021 4:51:00 PM EST
© 2021 Facility Association. All rights reserved.
Government Line ReportRSP:
Reporting Company:
Accounting Month: Download to CSV based on selection criteria
Exhibit 9-B
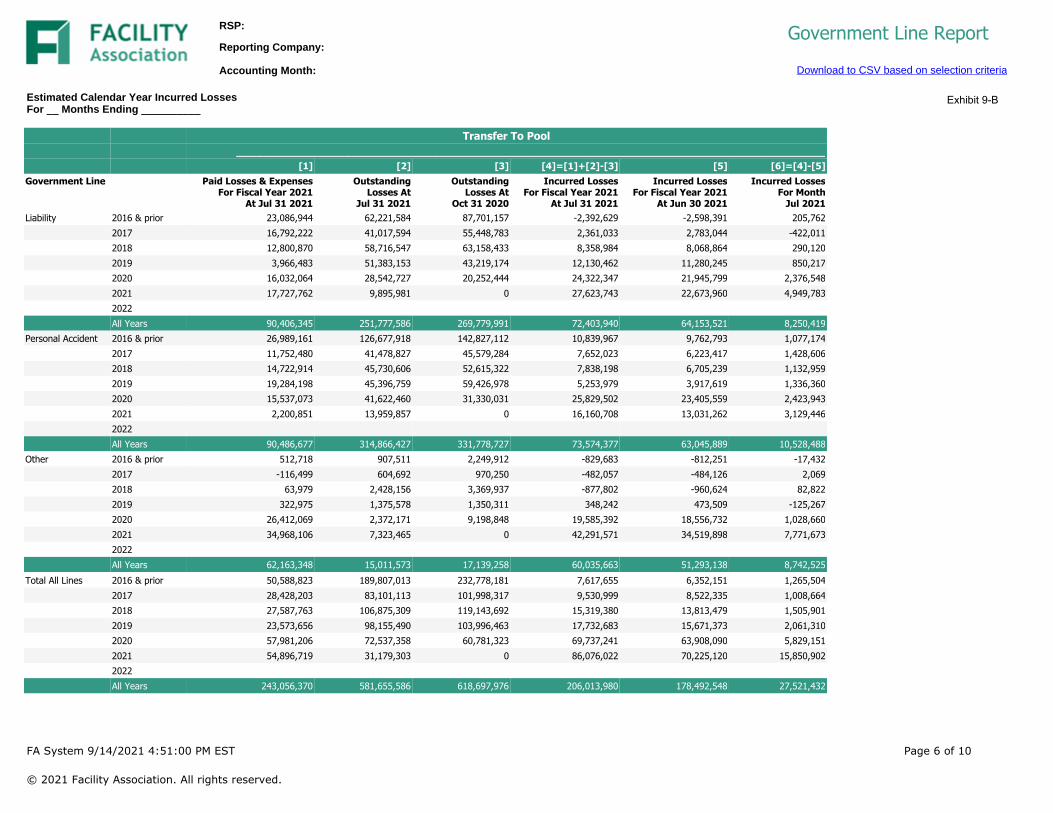
Estimated Calendar Year Incurred Losses For __ Months Ending __________
Transfer To Pool_______________________________________________________________________________________
[1] [2] [3] [4]=[1]+[2]-[3] [5] [6]=[4]-[5]Government Line Paid Losses & Expenses
For Fiscal Year 2021At Jul 31 2021
Outstanding Losses At
Jul 31 2021
OutstandingLosses At
Oct 31 2020
Incurred LossesFor Fiscal Year 2021
At Jul 31 2021
Incurred LossesFor Fiscal Year 2021
At Jun 30 2021
Incurred LossesFor Month
Jul 2021Liability 2016 & prior 23,086,944 62,221,584 87,701,157 -2,392,629 -2,598,391 205,762
2017 16,792,222 41,017,594 55,448,783 2,361,033 2,783,044 -422,0112018 12,800,870 58,716,547 63,158,433 8,358,984 8,068,864 290,1202019 3,966,483 51,383,153 43,219,174 12,130,462 11,280,245 850,2172020 16,032,064 28,542,727 20,252,444 24,322,347 21,945,799 2,376,5482021 17,727,762 9,895,981 0 27,623,743 22,673,960 4,949,7832022All Years 90,406,345 251,777,586 269,779,991 72,403,940 64,153,521 8,250,419
Personal Accident 2016 & prior 26,989,161 126,677,918 142,827,112 10,839,967 9,762,793 1,077,1742017 11,752,480 41,478,827 45,579,284 7,652,023 6,223,417 1,428,6062018 14,722,914 45,730,606 52,615,322 7,838,198 6,705,239 1,132,9592019 19,284,198 45,396,759 59,426,978 5,253,979 3,917,619 1,336,3602020 15,537,073 41,622,460 31,330,031 25,829,502 23,405,559 2,423,9432021 2,200,851 13,959,857 0 16,160,708 13,031,262 3,129,4462022All Years 90,486,677 314,866,427 331,778,727 73,574,377 63,045,889 10,528,488
Other 2016 & prior 512,718 907,511 2,249,912 -829,683 -812,251 -17,4322017 -116,499 604,692 970,250 -482,057 -484,126 2,0692018 63,979 2,428,156 3,369,937 -877,802 -960,624 82,8222019 322,975 1,375,578 1,350,311 348,242 473,509 -125,2672020 26,412,069 2,372,171 9,198,848 19,585,392 18,556,732 1,028,6602021 34,968,106 7,323,465 0 42,291,571 34,519,898 7,771,6732022All Years 62,163,348 15,011,573 17,139,258 60,035,663 51,293,138 8,742,525
Total All Lines 2016 & prior 50,588,823 189,807,013 232,778,181 7,617,655 6,352,151 1,265,5042017 28,428,203 83,101,113 101,998,317 9,530,999 8,522,335 1,008,6642018 27,587,763 106,875,309 119,143,692 15,319,380 13,813,479 1,505,9012019 23,573,656 98,155,490 103,996,463 17,732,683 15,671,373 2,061,3102020 57,981,206 72,537,358 60,781,323 69,737,241 63,908,090 5,829,1512021 54,896,719 31,179,303 0 86,076,022 70,225,120 15,850,9022022All Years 243,056,370 581,655,586 618,697,976 206,013,980 178,492,548 27,521,432
Page 6 of 10FA System 9/14/2021 4:51:00 PM EST
© 2021 Facility Association. All rights reserved.
Government Line ReportRSP:
Reporting Company:
Accounting Month: Download to CSV based on selection criteria
Exhibit 9-B

Estimated Calendar Year Incurred Losses For __ Months Ending __________
Member's Share of Pool_______________________________________________________________________________________________________________________
[1] [2] [3] [4] [5] [6]=[1]+([2]-[3])+([4]-[5])
[7] [8]=[6]-[7]
Government Line Est Paid Losses & Expenses For CY 2021
At Sep 30 2021
Estimated OutstandingExcluding IBNR
As at Sep 30 2021
Estimated OutstandingExcluding IBNR
As at Dec 31 2020
EstimatedIBNR At
Sep 30 2021
EstimatedIBNR
As at Dec 31 2020
Est Incurred LossesFor CY 2021At Sep 2021
Est Incurred LossesFor CY 2021At Aug 2021
Est Incurred LossesFor Month
Sep 2021Liability 2016 & prior 20,040,332 59,487,258 81,957,218 2,970,802 2,298,643 -1,757,469 -1,733,917 -23,552
2017 16,056,114 38,551,109 51,657,280 2,481,051 6,275,196 -844,202 -57,977 -786,2252018 13,024,200 56,787,825 60,688,504 15,617,214 18,931,320 5,809,415 6,390,979 -581,5642019 4,842,124 51,296,199 42,430,779 29,705,516 35,052,059 8,361,001 8,502,988 -141,9872020 5,670,420 30,525,527 29,409,526 47,197,235 77,678,635 -23,694,979 -23,805,899 110,9202021 24,680,454 13,193,286 0 81,035,250 0 118,908,990 107,321,355 11,587,6352022All Years 84,313,644 249,841,204 266,143,307 179,007,068 140,235,853 106,782,756 96,617,529 10,165,227
Personal Accident 2016 & prior 24,697,373 120,789,370 133,768,607 27,084,199 14,971,362 23,830,973 24,176,956 -345,9832017 9,733,367 38,987,020 42,464,494 7,442,948 14,223,512 -524,671 -840,366 315,6952018 12,214,731 44,230,390 50,559,378 17,610,792 29,891,355 -6,394,820 -6,362,257 -32,5632019 18,275,330 45,321,440 58,344,480 33,579,994 53,051,552 -14,219,268 -14,247,471 28,2032020 15,679,156 44,515,341 45,496,808 64,585,517 50,386,030 28,897,176 29,748,281 -851,1052021 3,392,536 18,611,697 0 50,936,332 0 72,940,565 66,699,459 6,241,1062022All Years 83,992,493 312,455,258 330,633,767 201,239,782 162,523,811 104,529,955 99,174,602 5,355,353
Other 2016 & prior 462,039 1,167,149 2,397,213 0 0 -768,025 -750,078 -17,9472017 -144,301 568,917 904,475 0 418,288 -898,147 -903,341 5,1942018 -37,190 2,349,076 3,238,799 0 996,329 -1,923,242 -2,015,264 92,0222019 -1,178,813 1,373,836 1,326,191 1,291,491 6,631,391 -6,471,068 -6,291,161 -179,9072020 11,102,193 2,537,475 13,358,657 12,420,255 81,877,330 -69,176,064 -69,397,384 221,3202021 46,688,005 9,764,017 0 99,557,422 0 156,009,444 139,246,183 16,763,2612022All Years 56,891,933 17,760,470 21,225,335 113,269,168 89,923,338 76,772,898 59,888,955 16,883,943
Total All Lines 2016 & prior 45,199,744 181,443,777 218,123,038 30,055,001 17,270,005 21,305,479 21,692,961 -387,4822017 25,645,180 78,107,046 95,026,249 9,923,999 20,916,996 -2,267,020 -1,801,684 -465,3362018 25,201,741 103,367,291 114,486,681 33,228,006 49,819,004 -2,508,647 -1,986,542 -522,1052019 21,938,641 97,991,475 102,101,450 64,577,001 94,735,002 -12,329,335 -12,035,644 -293,6912020 32,451,769 77,578,343 88,264,991 124,203,007 209,941,995 -63,973,867 -63,455,002 -518,8652021 74,760,995 41,569,000 0 231,529,004 0 347,858,999 313,266,997 34,592,0022022All Years 225,198,070 580,056,932 618,002,409 493,516,018 392,683,002 288,085,609 255,681,086 32,404,523
Page 7 of 10FA System 9/14/2021 4:51:01 PM EST
© 2021 Facility Association. All rights reserved.
Government Line ReportRSP:
Reporting Company:
Accounting Month: Download to CSV based on selection criteria
Exhibit 9-B

Estimated IBNR (Undiscounted), IBNR And PFAD As at ___________
Member's Share of Pool__________________________________________________________________________________________________________________________
[1] [2] [3]=[1]+[2] [4] [5] [6]=[4]+[5] [7] [8] [9]=[7]+[8]Government Line Undiscounted
IBNR AtJul 31 2021
Estimated Change inUndiscounted IBNR AtAug 2021 & Sep 2021
EstimatedUndiscounted IBNR
As At Sep 30 2021
Discounted IBNRInclude PFAD At
Jul 31 2021
Estimated Change inDiscounted IBNR At
Aug 2021 & Sep 2021
EstimatedDiscounted IBNR
At Sep 30 2021
PFADAt
Jul 31 2021
Estimated Change inPFAD
Aug 2021 & Sep 2021
EstimatedPFAD At
Sep 30 2021Liability 2016 & prior 1,442,583 -53,602 1,388,981 3,097,264 -126,462 2,970,802 2,159,794 -94,928 2,064,866
2017 302,051 -17,757 284,294 2,639,302 -158,251 2,481,051 2,695,548 -161,996 2,533,5522018 8,889,625 -866,673 8,022,952 16,820,877 -1,203,663 15,617,214 9,054,603 -384,932 8,669,6712019 21,650,909 -2,110,928 19,539,981 32,160,538 -2,455,022 29,705,516 11,912,713 -390,083 11,522,6302020 39,431,933 -3,844,459 35,587,474 51,385,593 -4,188,358 47,197,235 13,494,653 -388,357 13,106,2962021 54,220,696 13,638,448 67,859,144 64,634,597 16,400,653 81,035,250 11,911,988 3,159,454 15,071,4422022All Years 125,937,797 6,745,029 132,682,826 170,738,171 8,268,897 179,007,068 51,229,299 1,739,158 52,968,457
Personal Accident 2016 & prior 13,375,425 -491,417 12,884,008 28,222,721 -1,138,522 27,084,199 19,382,200 -845,089 18,537,1112017 905,949 -53,240 852,709 7,917,697 -474,749 7,442,948 8,086,451 -486,003 7,600,4482018 10,024,375 -977,324 9,047,051 18,968,124 -1,357,332 17,610,792 10,210,396 -434,065 9,776,3312019 24,474,795 -2,386,288 22,088,507 36,355,235 -2,775,241 33,579,994 13,466,397 -440,966 13,025,4312020 53,959,315 -5,260,839 48,698,476 70,316,957 -5,731,440 64,585,517 18,466,192 -531,436 17,934,7562021 34,081,476 8,572,739 42,654,215 40,627,352 10,308,980 50,936,332 7,487,435 1,985,944 9,473,3792022All Years 136,821,335 -596,369 136,224,966 202,408,086 -1,168,304 201,239,782 77,099,071 -751,615 76,347,456
Other 2016 & prior 0 0 0 0 0 0 0 0 02017 0 0 0 0 0 0 0 0 02018 0 0 0 0 0 0 0 0 02019 941,295 -91,784 849,511 1,398,228 -106,737 1,291,491 517,889 -16,952 500,9372020 10,376,754 -1,011,698 9,365,056 13,522,455 -1,102,200 12,420,255 3,551,158 -102,208 3,448,9502021 66,613,833 16,755,809 83,369,642 79,408,057 20,149,365 99,557,422 14,634,574 3,881,608 18,516,1822022All Years 77,931,882 15,652,327 93,584,209 94,328,740 18,940,428 113,269,168 18,703,621 3,762,448 22,466,069
Total All Lines 2016 & prior 14,818,008 -545,019 14,272,989 31,319,985 -1,264,984 30,055,001 21,541,994 -940,017 20,601,9772017 1,208,000 -70,997 1,137,003 10,556,999 -633,000 9,923,999 10,781,999 -647,999 10,134,0002018 18,914,000 -1,843,997 17,070,003 35,789,001 -2,560,995 33,228,006 19,264,999 -818,997 18,446,0022019 47,066,999 -4,589,000 42,477,999 69,914,001 -5,337,000 64,577,001 25,896,999 -848,001 25,048,9982020 103,768,002 -10,116,996 93,651,006 135,225,005 -11,021,998 124,203,007 35,512,003 -1,022,001 34,490,0022021 154,916,005 38,966,996 193,883,001 184,670,006 46,858,998 231,529,004 34,033,997 9,027,006 43,061,0032022All Years 340,691,014 21,800,987 362,492,001 467,474,997 26,041,021 493,516,018 147,031,991 4,749,991 151,781,982
Page 8 of 10FA System 9/14/2021 4:51:01 PM EST
© 2021 Facility Association. All rights reserved.
Government Line ReportRSP:
Reporting Company:
Accounting Month: Download to CSV based on selection criteria
Exhibit 9-B
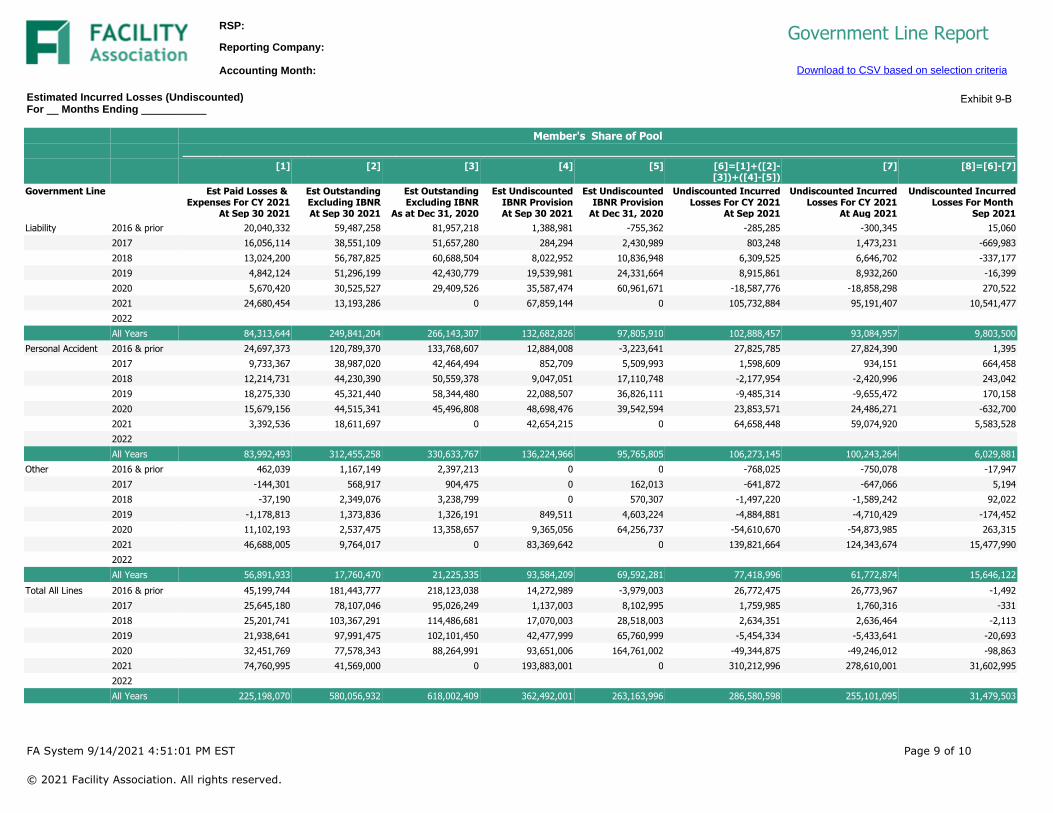
Estimated Incurred Losses (Undiscounted) For __ Months Ending ___________
Member's Share of Pool___________________________________________________________________________________________________________________________
[1] [2] [3] [4] [5] [6]=[1]+([2]-[3])+([4]-[5])
[7] [8]=[6]-[7]
Government Line Est Paid Losses & Expenses For CY 2021
At Sep 30 2021
Est OutstandingExcluding IBNRAt Sep 30 2021
Est OutstandingExcluding IBNR
As at Dec 31, 2020
Est UndiscountedIBNR ProvisionAt Sep 30 2021
Est UndiscountedIBNR Provision
At Dec 31, 2020
Undiscounted IncurredLosses For CY 2021
At Sep 2021
Undiscounted IncurredLosses For CY 2021
At Aug 2021
Undiscounted IncurredLosses For Month
Sep 2021Liability 2016 & prior 20,040,332 59,487,258 81,957,218 1,388,981 -755,362 -285,285 -300,345 15,060
2017 16,056,114 38,551,109 51,657,280 284,294 2,430,989 803,248 1,473,231 -669,9832018 13,024,200 56,787,825 60,688,504 8,022,952 10,836,948 6,309,525 6,646,702 -337,1772019 4,842,124 51,296,199 42,430,779 19,539,981 24,331,664 8,915,861 8,932,260 -16,3992020 5,670,420 30,525,527 29,409,526 35,587,474 60,961,671 -18,587,776 -18,858,298 270,5222021 24,680,454 13,193,286 0 67,859,144 0 105,732,884 95,191,407 10,541,4772022All Years 84,313,644 249,841,204 266,143,307 132,682,826 97,805,910 102,888,457 93,084,957 9,803,500
Personal Accident 2016 & prior 24,697,373 120,789,370 133,768,607 12,884,008 -3,223,641 27,825,785 27,824,390 1,3952017 9,733,367 38,987,020 42,464,494 852,709 5,509,993 1,598,609 934,151 664,4582018 12,214,731 44,230,390 50,559,378 9,047,051 17,110,748 -2,177,954 -2,420,996 243,0422019 18,275,330 45,321,440 58,344,480 22,088,507 36,826,111 -9,485,314 -9,655,472 170,1582020 15,679,156 44,515,341 45,496,808 48,698,476 39,542,594 23,853,571 24,486,271 -632,7002021 3,392,536 18,611,697 0 42,654,215 0 64,658,448 59,074,920 5,583,5282022All Years 83,992,493 312,455,258 330,633,767 136,224,966 95,765,805 106,273,145 100,243,264 6,029,881
Other 2016 & prior 462,039 1,167,149 2,397,213 0 0 -768,025 -750,078 -17,9472017 -144,301 568,917 904,475 0 162,013 -641,872 -647,066 5,1942018 -37,190 2,349,076 3,238,799 0 570,307 -1,497,220 -1,589,242 92,0222019 -1,178,813 1,373,836 1,326,191 849,511 4,603,224 -4,884,881 -4,710,429 -174,4522020 11,102,193 2,537,475 13,358,657 9,365,056 64,256,737 -54,610,670 -54,873,985 263,3152021 46,688,005 9,764,017 0 83,369,642 0 139,821,664 124,343,674 15,477,9902022All Years 56,891,933 17,760,470 21,225,335 93,584,209 69,592,281 77,418,996 61,772,874 15,646,122
Total All Lines 2016 & prior 45,199,744 181,443,777 218,123,038 14,272,989 -3,979,003 26,772,475 26,773,967 -1,4922017 25,645,180 78,107,046 95,026,249 1,137,003 8,102,995 1,759,985 1,760,316 -3312018 25,201,741 103,367,291 114,486,681 17,070,003 28,518,003 2,634,351 2,636,464 -2,1132019 21,938,641 97,991,475 102,101,450 42,477,999 65,760,999 -5,454,334 -5,433,641 -20,6932020 32,451,769 77,578,343 88,264,991 93,651,006 164,761,002 -49,344,875 -49,246,012 -98,8632021 74,760,995 41,569,000 0 193,883,001 0 310,212,996 278,610,001 31,602,9952022All Years 225,198,070 580,056,932 618,002,409 362,492,001 263,163,996 286,580,598 255,101,095 31,479,503
Page 9 of 10FA System 9/14/2021 4:51:01 PM EST
© 2021 Facility Association. All rights reserved.
Government Line ReportRSP:
Reporting Company:
Accounting Month: Download to CSV based on selection criteria
Exhibit 9-B
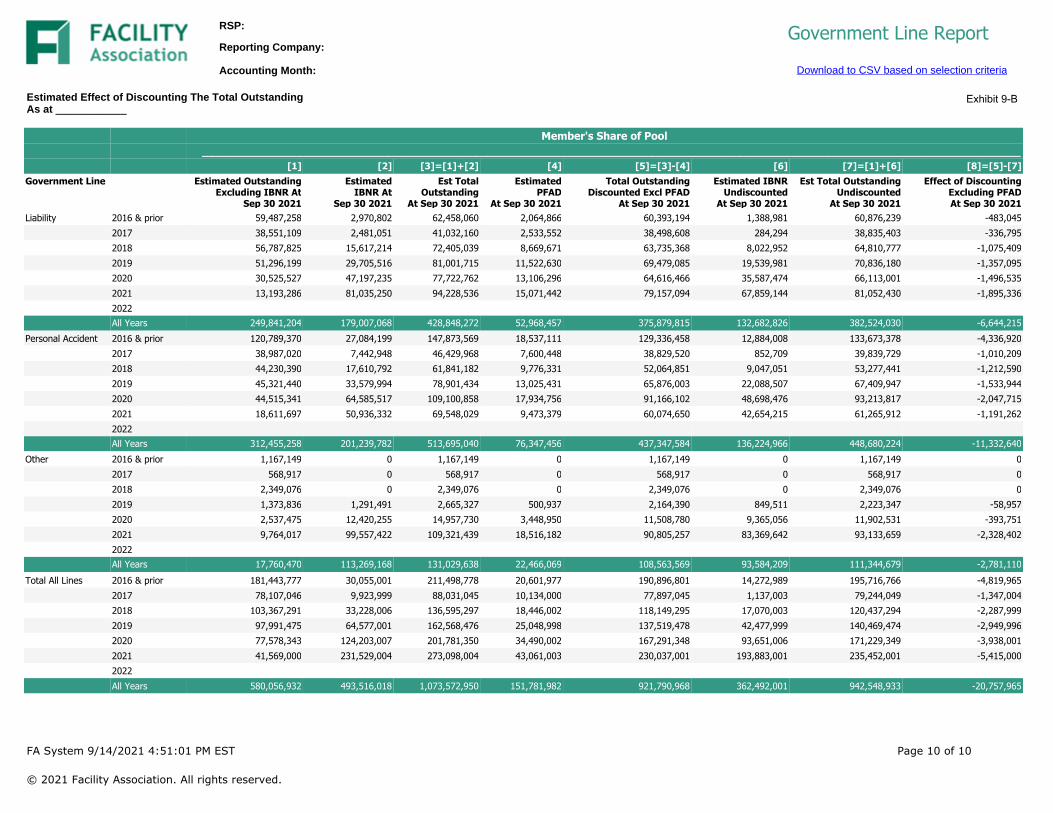
Estimated Effect of Discounting The Total Outstanding As at ____________
Member's Share of Pool_________________________________________________________________________________________________________________________
[1] [2] [3]=[1]+[2] [4] [5]=[3]-[4] [6] [7]=[1]+[6] [8]=[5]-[7]Government Line Estimated Outstanding
Excluding IBNR AtSep 30 2021
EstimatedIBNR At
Sep 30 2021
Est TotalOutstanding
At Sep 30 2021
EstimatedPFAD
At Sep 30 2021
Total OutstandingDiscounted Excl PFAD
At Sep 30 2021
Estimated IBNRUndiscounted
At Sep 30 2021
Est Total OutstandingUndiscounted
At Sep 30 2021
Effect of DiscountingExcluding PFADAt Sep 30 2021
Liability 2016 & prior 59,487,258 2,970,802 62,458,060 2,064,866 60,393,194 1,388,981 60,876,239 -483,0452017 38,551,109 2,481,051 41,032,160 2,533,552 38,498,608 284,294 38,835,403 -336,7952018 56,787,825 15,617,214 72,405,039 8,669,671 63,735,368 8,022,952 64,810,777 -1,075,4092019 51,296,199 29,705,516 81,001,715 11,522,630 69,479,085 19,539,981 70,836,180 -1,357,0952020 30,525,527 47,197,235 77,722,762 13,106,296 64,616,466 35,587,474 66,113,001 -1,496,5352021 13,193,286 81,035,250 94,228,536 15,071,442 79,157,094 67,859,144 81,052,430 -1,895,3362022All Years 249,841,204 179,007,068 428,848,272 52,968,457 375,879,815 132,682,826 382,524,030 -6,644,215
Personal Accident 2016 & prior 120,789,370 27,084,199 147,873,569 18,537,111 129,336,458 12,884,008 133,673,378 -4,336,9202017 38,987,020 7,442,948 46,429,968 7,600,448 38,829,520 852,709 39,839,729 -1,010,2092018 44,230,390 17,610,792 61,841,182 9,776,331 52,064,851 9,047,051 53,277,441 -1,212,5902019 45,321,440 33,579,994 78,901,434 13,025,431 65,876,003 22,088,507 67,409,947 -1,533,9442020 44,515,341 64,585,517 109,100,858 17,934,756 91,166,102 48,698,476 93,213,817 -2,047,7152021 18,611,697 50,936,332 69,548,029 9,473,379 60,074,650 42,654,215 61,265,912 -1,191,2622022All Years 312,455,258 201,239,782 513,695,040 76,347,456 437,347,584 136,224,966 448,680,224 -11,332,640
Other 2016 & prior 1,167,149 0 1,167,149 0 1,167,149 0 1,167,149 02017 568,917 0 568,917 0 568,917 0 568,917 02018 2,349,076 0 2,349,076 0 2,349,076 0 2,349,076 02019 1,373,836 1,291,491 2,665,327 500,937 2,164,390 849,511 2,223,347 -58,9572020 2,537,475 12,420,255 14,957,730 3,448,950 11,508,780 9,365,056 11,902,531 -393,7512021 9,764,017 99,557,422 109,321,439 18,516,182 90,805,257 83,369,642 93,133,659 -2,328,4022022All Years 17,760,470 113,269,168 131,029,638 22,466,069 108,563,569 93,584,209 111,344,679 -2,781,110
Total All Lines 2016 & prior 181,443,777 30,055,001 211,498,778 20,601,977 190,896,801 14,272,989 195,716,766 -4,819,9652017 78,107,046 9,923,999 88,031,045 10,134,000 77,897,045 1,137,003 79,244,049 -1,347,0042018 103,367,291 33,228,006 136,595,297 18,446,002 118,149,295 17,070,003 120,437,294 -2,287,9992019 97,991,475 64,577,001 162,568,476 25,048,998 137,519,478 42,477,999 140,469,474 -2,949,9962020 77,578,343 124,203,007 201,781,350 34,490,002 167,291,348 93,651,006 171,229,349 -3,938,0012021 41,569,000 231,529,004 273,098,004 43,061,003 230,037,001 193,883,001 235,452,001 -5,415,0002022All Years 580,056,932 493,516,018 1,073,572,950 151,781,982 921,790,968 362,492,001 942,548,933 -20,757,965
Page 10 of 10FA System 9/14/2021 4:51:01 PM EST
© 2021 Facility Association. All rights reserved.
Government Line ReportRSP:
Reporting Company:
Accounting Month: Download to CSV based on selection criteria
Exhibit 9-B
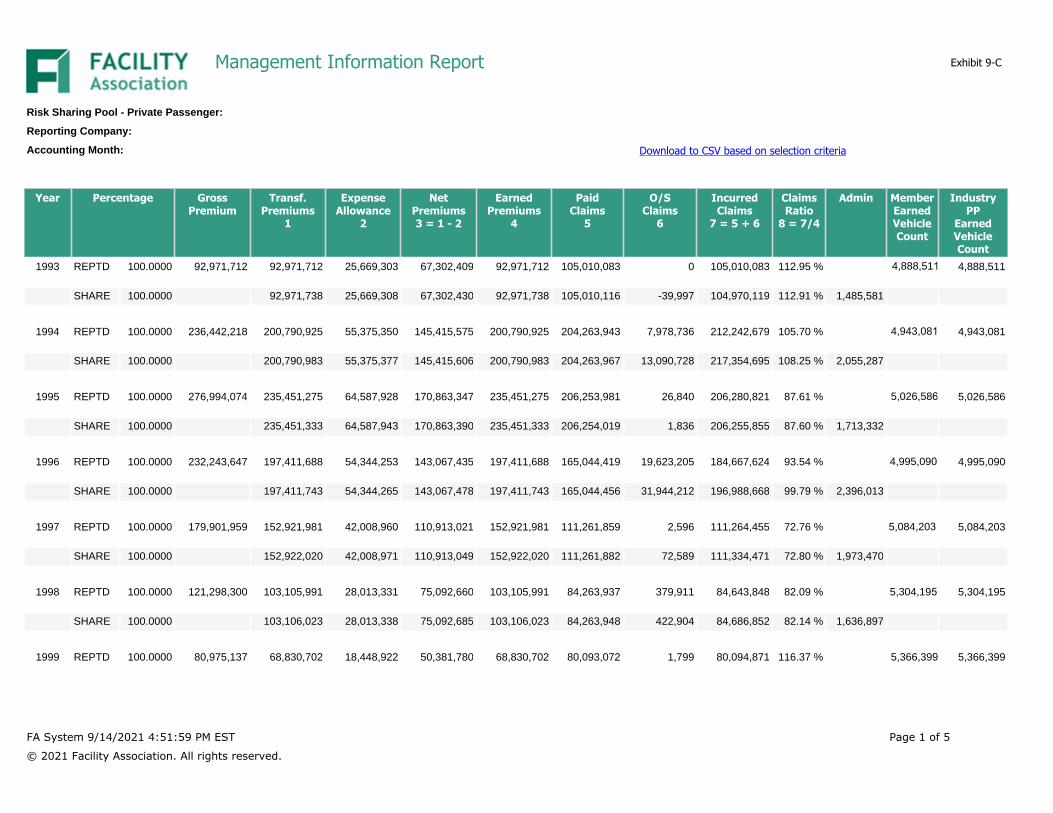
Year Percentage GrossPremium
Transf.Premiums
1
ExpenseAllowance
2
NetPremiums3 = 1 - 2
EarnedPremiums
4
PaidClaims
5
O/SClaims
6
IncurredClaims
7 = 5 + 6
ClaimsRatio
8 = 7/4
Admin MemberEarnedVehicleCount
IndustryPP
EarnedVehicleCount
1993 REPTD 100.0000 92,971,712 92,971,712 25,669,303 67,302,409 92,971,712 105,010,083 0 105,010,083 112.95 % 4,888,511 4,888,511
SHARE 100.0000 92,971,738 25,669,308 67,302,430 92,971,738 105,010,116 -39,997 104,970,119 112.91 % 1,485,581
1994 REPTD 100.0000 236,442,218 200,790,925 55,375,350 145,415,575 200,790,925 204,263,943 7,978,736 212,242,679 105.70 % 4,943,081 4,943,081
SHARE 100.0000 200,790,983 55,375,377 145,415,606 200,790,983 204,263,967 13,090,728 217,354,695 108.25 % 2,055,287
1995 REPTD 100.0000 276,994,074 235,451,275 64,587,928 170,863,347 235,451,275 206,253,981 26,840 206,280,821 87.61 % 5,026,586 5,026,586
SHARE 100.0000 235,451,333 64,587,943 170,863,390 235,451,333 206,254,019 1,836 206,255,855 87.60 % 1,713,332
1996 REPTD 100.0000 232,243,647 197,411,688 54,344,253 143,067,435 197,411,688 165,044,419 19,623,205 184,667,624 93.54 % 4,995,090 4,995,090
SHARE 100.0000 197,411,743 54,344,265 143,067,478 197,411,743 165,044,456 31,944,212 196,988,668 99.79 % 2,396,013
1997 REPTD 100.0000 179,901,959 152,921,981 42,008,960 110,913,021 152,921,981 111,261,859 2,596 111,264,455 72.76 % 5,084,203 5,084,203
SHARE 100.0000 152,922,020 42,008,971 110,913,049 152,922,020 111,261,882 72,589 111,334,471 72.80 % 1,973,470
1998 REPTD 100.0000 121,298,300 103,105,991 28,013,331 75,092,660 103,105,991 84,263,937 379,911 84,643,848 82.09 % 5,304,195 5,304,195
SHARE 100.0000 103,106,023 28,013,338 75,092,685 103,106,023 84,263,948 422,904 84,686,852 82.14 % 1,636,897
1999 REPTD 100.0000 80,975,137 68,830,702 18,448,922 50,381,780 68,830,702 80,093,072 1,799 80,094,871 116.37 % 5,366,399 5,366,399
FA System 9/14/2021 4:51:59 PM EST
© 2021 Facility Association. All rights reserved.
Page 1 of 5
Management Information Report
Risk Sharing Pool - Private Passenger:
Reporting Company:
Accounting Month: Download to CSV based on selection criteria
Exhibit 9-C
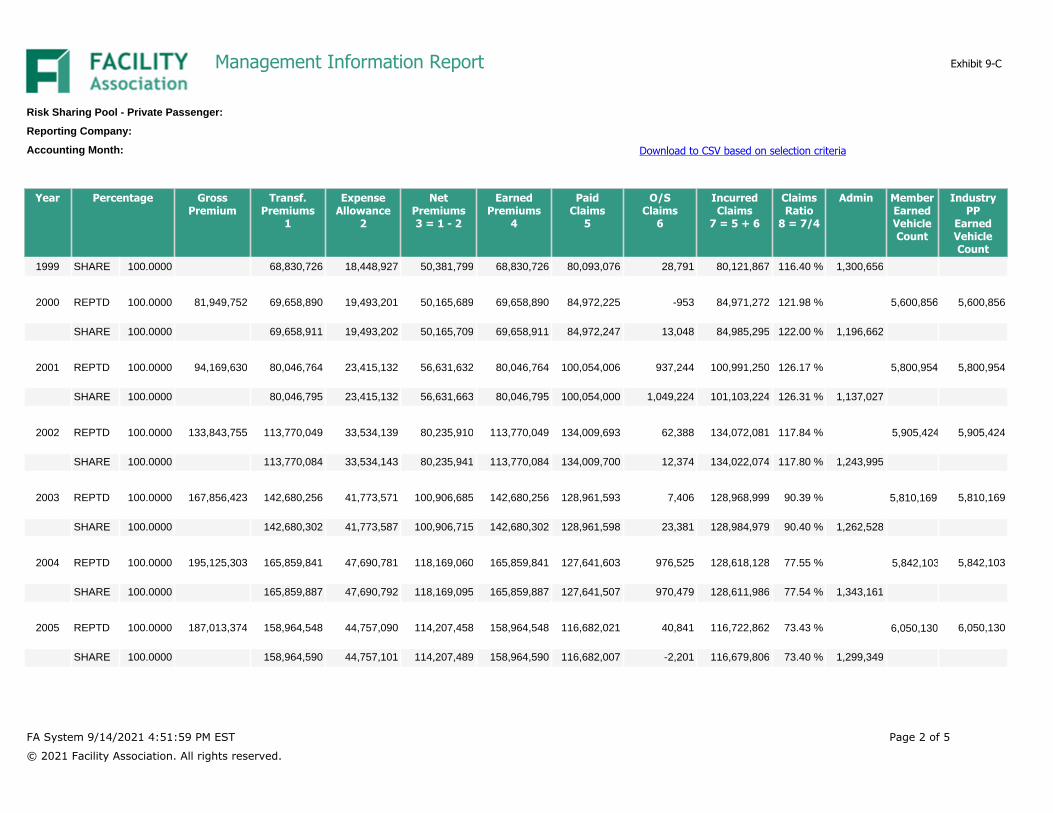
Year Percentage GrossPremium
Transf.Premiums
1
ExpenseAllowance
2
NetPremiums3 = 1 - 2
EarnedPremiums
4
PaidClaims
5
O/SClaims
6
IncurredClaims
7 = 5 + 6
ClaimsRatio
8 = 7/4
Admin MemberEarnedVehicleCount
IndustryPP
EarnedVehicleCount
1999 SHARE 100.0000 68,830,726 18,448,927 50,381,799 68,830,726 80,093,076 28,791 80,121,867 116.40 % 1,300,656
2000 REPTD 100.0000 81,949,752 69,658,890 19,493,201 50,165,689 69,658,890 84,972,225 -953 84,971,272 121.98 % 5,600,856 5,600,856
SHARE 100.0000 69,658,911 19,493,202 50,165,709 69,658,911 84,972,247 13,048 84,985,295 122.00 % 1,196,662
2001 REPTD 100.0000 94,169,630 80,046,764 23,415,132 56,631,632 80,046,764 100,054,006 937,244 100,991,250 126.17 % 5,800,954 5,800,954
SHARE 100.0000 80,046,795 23,415,132 56,631,663 80,046,795 100,054,000 1,049,224 101,103,224 126.31 % 1,137,027
2002 REPTD 100.0000 133,843,755 113,770,049 33,534,139 80,235,910 113,770,049 134,009,693 62,388 134,072,081 117.84 % 5,905,424 5,905,424
SHARE 100.0000 113,770,084 33,534,143 80,235,941 113,770,084 134,009,700 12,374 134,022,074 117.80 % 1,243,995
2003 REPTD 100.0000 167,856,423 142,680,256 41,773,571 100,906,685 142,680,256 128,961,593 7,406 128,968,999 90.39 % 5,810,169 5,810,169
SHARE 100.0000 142,680,302 41,773,587 100,906,715 142,680,302 128,961,598 23,381 128,984,979 90.40 % 1,262,528
2004 REPTD 100.0000 195,125,303 165,859,841 47,690,781 118,169,060 165,859,841 127,641,603 976,525 128,618,128 77.55 % 5,842,103 5,842,103
SHARE 100.0000 165,859,887 47,690,792 118,169,095 165,859,887 127,641,507 970,479 128,611,986 77.54 % 1,343,161
2005 REPTD 100.0000 187,013,374 158,964,548 44,757,090 114,207,458 158,964,548 116,682,021 40,841 116,722,862 73.43 % 6,050,130 6,050,130
SHARE 100.0000 158,964,590 44,757,101 114,207,489 158,964,590 116,682,007 -2,201 116,679,806 73.40 % 1,299,349
FA System 9/14/2021 4:51:59 PM EST
© 2021 Facility Association. All rights reserved.
Page 2 of 5
Management Information Report
Risk Sharing Pool - Private Passenger:
Reporting Company:
Accounting Month: Download to CSV based on selection criteria
Exhibit 9-C
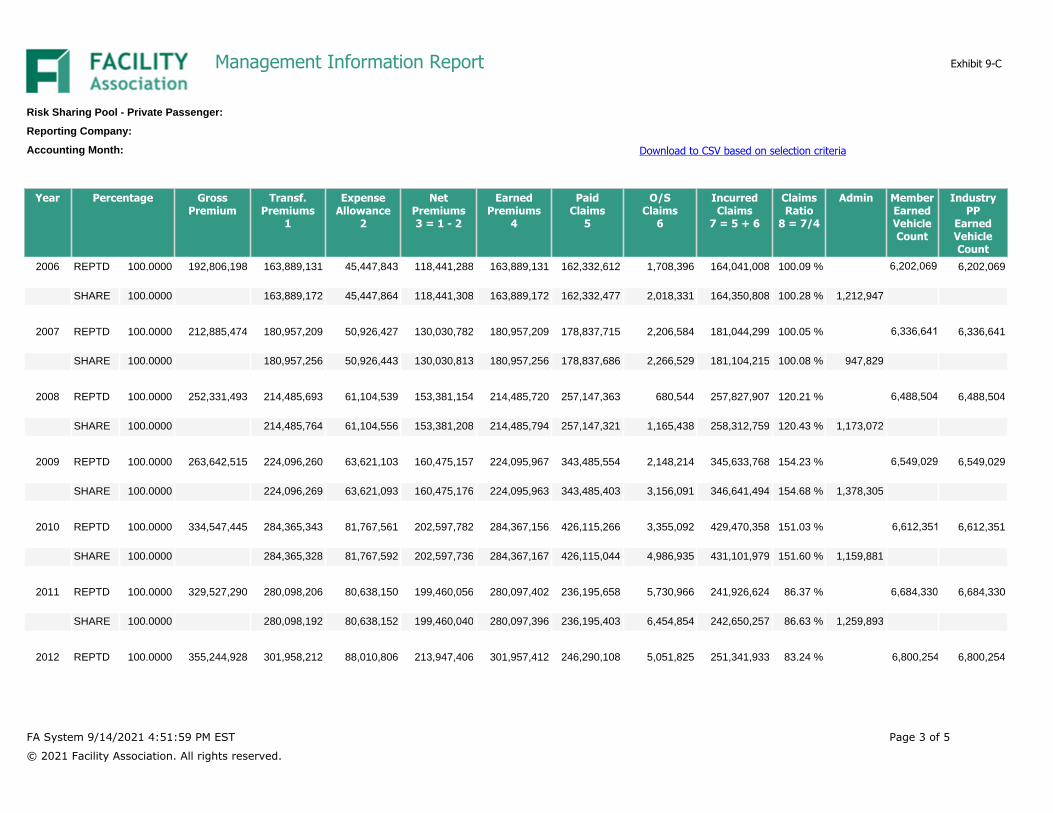
Year Percentage GrossPremium
Transf.Premiums
1
ExpenseAllowance
2
NetPremiums3 = 1 - 2
EarnedPremiums
4
PaidClaims
5
O/SClaims
6
IncurredClaims
7 = 5 + 6
ClaimsRatio
8 = 7/4
Admin MemberEarnedVehicleCount
IndustryPP
EarnedVehicleCount
2006 REPTD 100.0000 192,806,198 163,889,131 45,447,843 118,441,288 163,889,131 162,332,612 1,708,396 164,041,008 100.09 % 6,202,069 6,202,069
SHARE 100.0000 163,889,172 45,447,864 118,441,308 163,889,172 162,332,477 2,018,331 164,350,808 100.28 % 1,212,947
2007 REPTD 100.0000 212,885,474 180,957,209 50,926,427 130,030,782 180,957,209 178,837,715 2,206,584 181,044,299 100.05 % 6,336,641 6,336,641
SHARE 100.0000 180,957,256 50,926,443 130,030,813 180,957,256 178,837,686 2,266,529 181,104,215 100.08 % 947,829
2008 REPTD 100.0000 252,331,493 214,485,693 61,104,539 153,381,154 214,485,720 257,147,363 680,544 257,827,907 120.21 % 6,488,504 6,488,504
SHARE 100.0000 214,485,764 61,104,556 153,381,208 214,485,794 257,147,321 1,165,438 258,312,759 120.43 % 1,173,072
2009 REPTD 100.0000 263,642,515 224,096,260 63,621,103 160,475,157 224,095,967 343,485,554 2,148,214 345,633,768 154.23 % 6,549,029 6,549,029
SHARE 100.0000 224,096,269 63,621,093 160,475,176 224,095,963 343,485,403 3,156,091 346,641,494 154.68 % 1,378,305
2010 REPTD 100.0000 334,547,445 284,365,343 81,767,561 202,597,782 284,367,156 426,115,266 3,355,092 429,470,358 151.03 % 6,612,351 6,612,351
SHARE 100.0000 284,365,328 81,767,592 202,597,736 284,367,167 426,115,044 4,986,935 431,101,979 151.60 % 1,159,881
2011 REPTD 100.0000 329,527,290 280,098,206 80,638,150 199,460,056 280,097,402 236,195,658 5,730,966 241,926,624 86.37 % 6,684,330 6,684,330
SHARE 100.0000 280,098,192 80,638,152 199,460,040 280,097,396 236,195,403 6,454,854 242,650,257 86.63 % 1,259,893
2012 REPTD 100.0000 355,244,928 301,958,212 88,010,806 213,947,406 301,957,412 246,290,108 5,051,825 251,341,933 83.24 % 6,800,254 6,800,254
FA System 9/14/2021 4:51:59 PM EST
© 2021 Facility Association. All rights reserved.
Page 3 of 5
Management Information Report
Risk Sharing Pool - Private Passenger:
Reporting Company:
Accounting Month: Download to CSV based on selection criteria
Exhibit 9-C
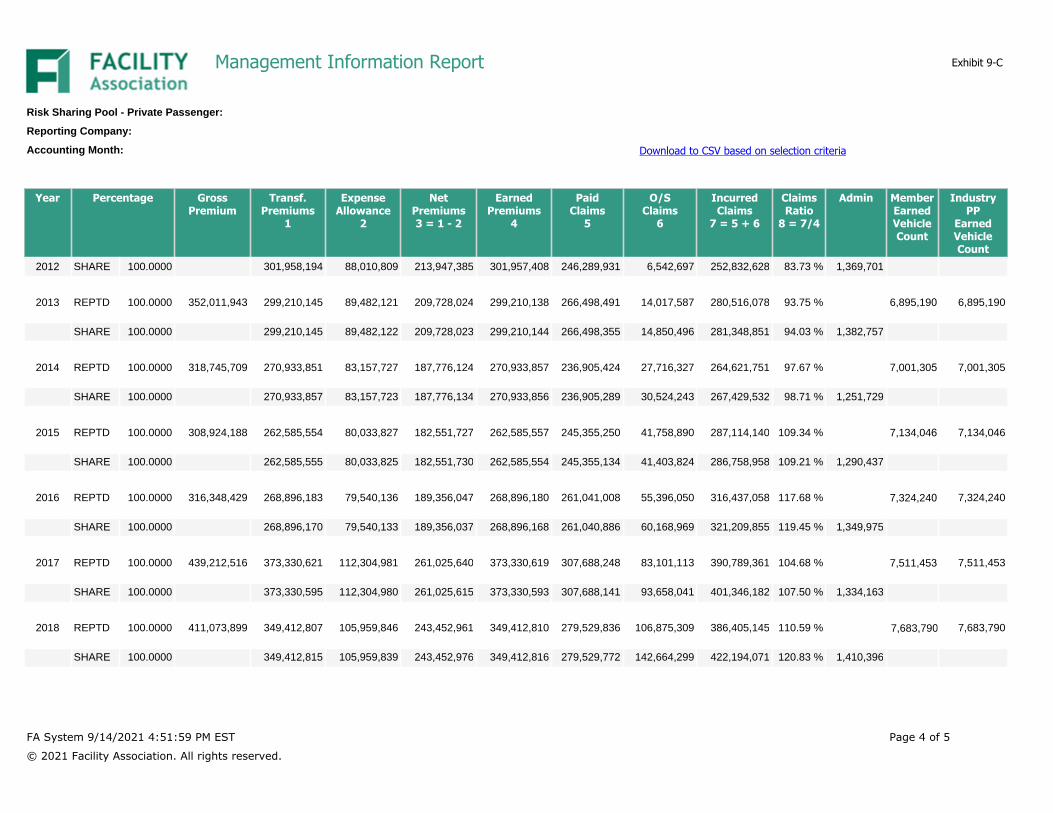
Year Percentage GrossPremium
Transf.Premiums
1
ExpenseAllowance
2
NetPremiums3 = 1 - 2
EarnedPremiums
4
PaidClaims
5
O/SClaims
6
IncurredClaims
7 = 5 + 6
ClaimsRatio
8 = 7/4
Admin MemberEarnedVehicleCount
IndustryPP
EarnedVehicleCount
2012 SHARE 100.0000 301,958,194 88,010,809 213,947,385 301,957,408 246,289,931 6,542,697 252,832,628 83.73 % 1,369,701
2013 REPTD 100.0000 352,011,943 299,210,145 89,482,121 209,728,024 299,210,138 266,498,491 14,017,587 280,516,078 93.75 % 6,895,190 6,895,190
SHARE 100.0000 299,210,145 89,482,122 209,728,023 299,210,144 266,498,355 14,850,496 281,348,851 94.03 % 1,382,757
2014 REPTD 100.0000 318,745,709 270,933,851 83,157,727 187,776,124 270,933,857 236,905,424 27,716,327 264,621,751 97.67 % 7,001,305 7,001,305
SHARE 100.0000 270,933,857 83,157,723 187,776,134 270,933,856 236,905,289 30,524,243 267,429,532 98.71 % 1,251,729
2015 REPTD 100.0000 308,924,188 262,585,554 80,033,827 182,551,727 262,585,557 245,355,250 41,758,890 287,114,140 109.34 % 7,134,046 7,134,046
SHARE 100.0000 262,585,555 80,033,825 182,551,730 262,585,554 245,355,134 41,403,824 286,758,958 109.21 % 1,290,437
2016 REPTD 100.0000 316,348,429 268,896,183 79,540,136 189,356,047 268,896,180 261,041,008 55,396,050 316,437,058 117.68 % 7,324,240 7,324,240
SHARE 100.0000 268,896,170 79,540,133 189,356,037 268,896,168 261,040,886 60,168,969 321,209,855 119.45 % 1,349,975
2017 REPTD 100.0000 439,212,516 373,330,621 112,304,981 261,025,640 373,330,619 307,688,248 83,101,113 390,789,361 104.68 % 7,511,453 7,511,453
SHARE 100.0000 373,330,595 112,304,980 261,025,615 373,330,593 307,688,141 93,658,041 401,346,182 107.50 % 1,334,163
2018 REPTD 100.0000 411,073,899 349,412,807 105,959,846 243,452,961 349,412,810 279,529,836 106,875,309 386,405,145 110.59 % 7,683,790 7,683,790
SHARE 100.0000 349,412,815 105,959,839 243,452,976 349,412,816 279,529,772 142,664,299 422,194,071 120.83 % 1,410,396
FA System 9/14/2021 4:51:59 PM EST
© 2021 Facility Association. All rights reserved.
Page 4 of 5
Management Information Report
Risk Sharing Pool - Private Passenger:
Reporting Company:
Accounting Month: Download to CSV based on selection criteria
Exhibit 9-C
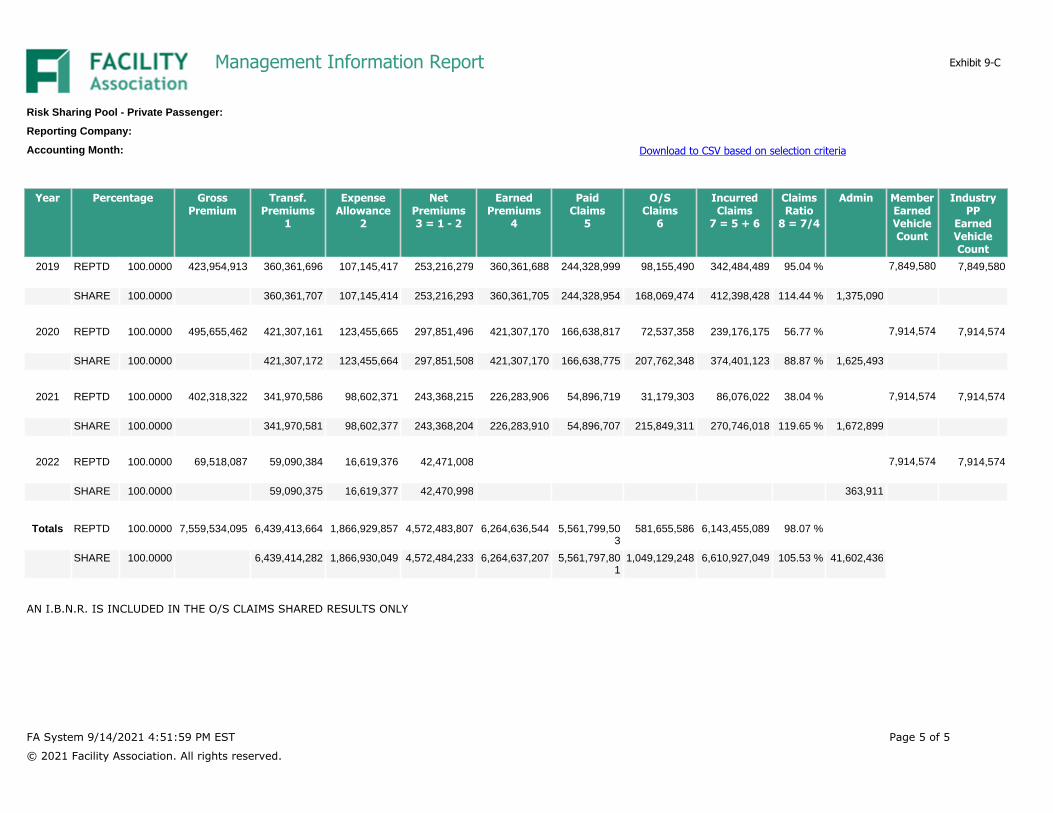
Year Percentage GrossPremium
Transf.Premiums
1
ExpenseAllowance
2
NetPremiums3 = 1 - 2
EarnedPremiums
4
PaidClaims
5
O/SClaims
6
IncurredClaims
7 = 5 + 6
ClaimsRatio
8 = 7/4
Admin MemberEarnedVehicleCount
IndustryPP
EarnedVehicleCount
2019 REPTD 100.0000 423,954,913 360,361,696 107,145,417 253,216,279 360,361,688 244,328,999 98,155,490 342,484,489 95.04 % 7,849,580 7,849,580
SHARE 100.0000 360,361,707 107,145,414 253,216,293 360,361,705 244,328,954 168,069,474 412,398,428 114.44 % 1,375,090
2020 REPTD 100.0000 495,655,462 421,307,161 123,455,665 297,851,496 421,307,170 166,638,817 72,537,358 239,176,175 56.77 % 7,914,574 7,914,574
SHARE 100.0000 421,307,172 123,455,664 297,851,508 421,307,170 166,638,775 207,762,348 374,401,123 88.87 % 1,625,493
2021 REPTD 100.0000 402,318,322 341,970,586 98,602,371 243,368,215 226,283,906 54,896,719 31,179,303 86,076,022 38.04 % 7,914,574 7,914,574
SHARE 100.0000 341,970,581 98,602,377 243,368,204 226,283,910 54,896,707 215,849,311 270,746,018 119.65 % 1,672,899
2022 REPTD 100.0000 69,518,087 59,090,384 16,619,376 42,471,008 7,914,574 7,914,574
SHARE 100.0000 59,090,375 16,619,377 42,470,998 363,911
Totals REPTD 100.0000 7,559,534,095 6,439,413,664 1,866,929,857 4,572,483,807 6,264,636,544 5,561,799,503
581,655,586 6,143,455,089 98.07 %
SHARE 100.0000 6,439,414,282 1,866,930,049 4,572,484,233 6,264,637,207 5,561,797,801
1,049,129,248 6,610,927,049 105.53 % 41,602,436
AN I.B.N.R. IS INCLUDED IN THE O/S CLAIMS SHARED RESULTS ONLY
FA System 9/14/2021 4:51:59 PM EST
© 2021 Facility Association. All rights reserved.
Page 5 of 5
Management Information Report
Risk Sharing Pool - Private Passenger:
Reporting Company:
Accounting Month: Download to CSV based on selection criteria
Exhibit 9-C
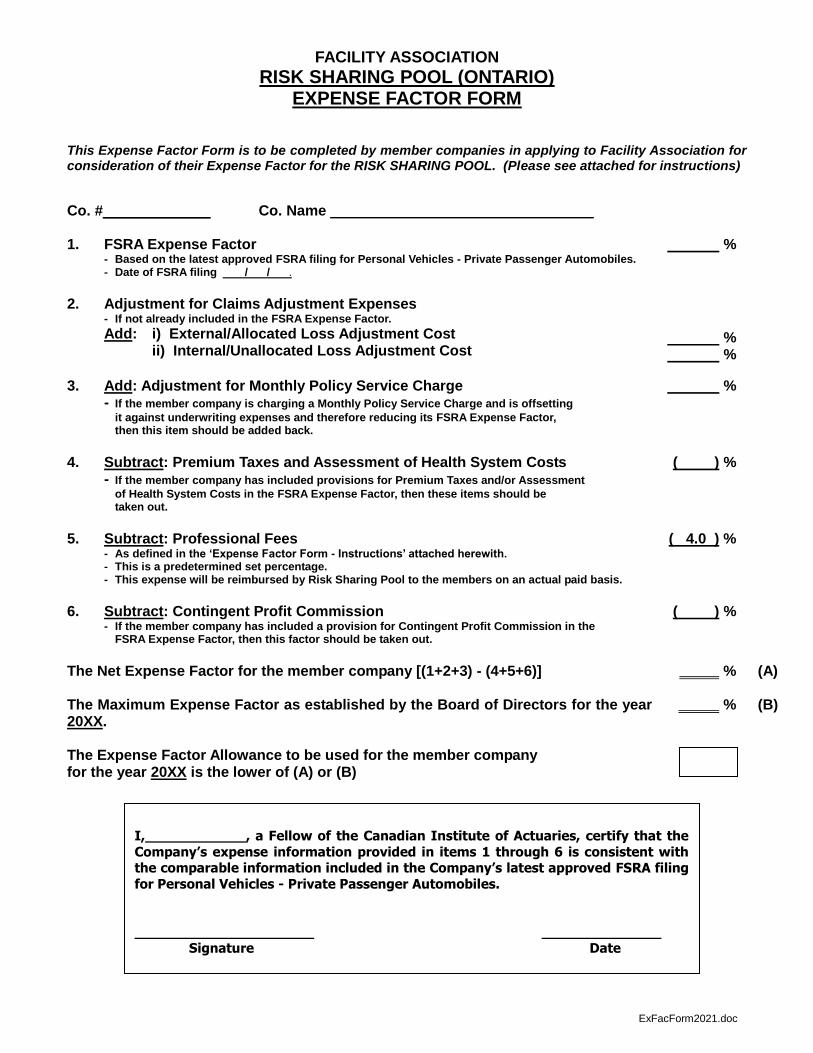
ExFacForm2021.doc
FACILITY ASSOCIATION
RISK SHARING POOL (ONTARIO) EXPENSE FACTOR FORM
This Expense Factor Form is to be completed by member companies in applying to Facility Association for consideration of their Expense Factor for the RISK SHARING POOL. (Please see attached for instructions)
Co. # Co. Name 1. FSRA Expense Factor
- Based on the latest approved FSRA filing for Personal Vehicles - Private Passenger Automobiles. - Date of FSRA filing / / .
%
2. Adjustment for Claims Adjustment Expenses - If not already included in the FSRA Expense Factor.
Add: i) External/Allocated Loss Adjustment Cost ii) Internal/Unallocated Loss Adjustment Cost
% %
3. Add: Adjustment for Monthly Policy Service Charge - If the member company is charging a Monthly Policy Service Charge and is offsetting
it against underwriting expenses and therefore reducing its FSRA Expense Factor, then this item should be added back.
%
4. Subtract: Premium Taxes and Assessment of Health System Costs - If the member company has included provisions for Premium Taxes and/or Assessment
of Health System Costs in the FSRA Expense Factor, then these items should be taken out.
( ) %
5. Subtract: Professional Fees - As defined in the ‘Expense Factor Form - Instructions’ attached herewith. - This is a predetermined set percentage. - This expense will be reimbursed by Risk Sharing Pool to the members on an actual paid basis.
( 4.0 ) %
6. Subtract: Contingent Profit Commission - If the member company has included a provision for Contingent Profit Commission in the FSRA Expense Factor, then this factor should be taken out.
( ) %
The Net Expense Factor for the member company [(1+2+3) - (4+5+6)]
% (A)
The Maximum Expense Factor as established by the Board of Directors for the year 20XX.
% (B)
The Expense Factor Allowance to be used for the member company for the year 20XX is the lower of (A) or (B)
I, , a Fellow of the Canadian Institute of Actuaries, certify that the
Company’s expense information provided in items 1 through 6 is consistent with the comparable information included in the Company’s latest approved FSRA filing
for Personal Vehicles - Private Passenger Automobiles.
Signature Date
Page 1 of 3
FACILITY ASSOCIATION
RISK SHARING POOL (ONTARIO) Instructions for completing the Expense Factor Form
Each member company is assigned a unique company number by the Insurance Bureau
of Canada for statistical reporting. This is the same number which you use for Facility
Association and to report on this Expense Factor Form.
The name of the member company should correspond with the company number. If,
within the same organization, there are several companies each with a separate
company number, then a separate Expense Factor Form should be completed for each
company.
Where there are several companies operating within a single company number and they
have submitted more than one rate filing, these companies would still have to file a
single Expense Factor Form; however, they would have to indicate therein their
Weighted Average Expense Factor.
Where a member company is conducting its business through different distribution
channels such as “group plan” the company may have filed separate rates, it would then
have to calculate the Weighted Average Expense Factor for all such filings.
The expenses to be reflected in the Expense Factor Form should be expressed as a
percentage of written premiums.
1. The FSRA Expense Factor percentage is for that particular company with the same
company number.
Please indicate the Expense Factor percentage most recently approved by FSRA for
Personal Vehicles - Private Passenger Automobiles and not necessarily the one
which was filed with FSRA.
For this purpose, it is assumed that the FSRA Expense Factor, as defined, makes
provision for categories of expense such as Commissions, Taxes, Assessments,
Operating Expenses and possibly Loss Adjustment Expenses, but specifically
excludes any provision for profit or return on equity and furthermore excludes any
offsetting provision for the contribution of investment income on the cash flow from
insurance operations.
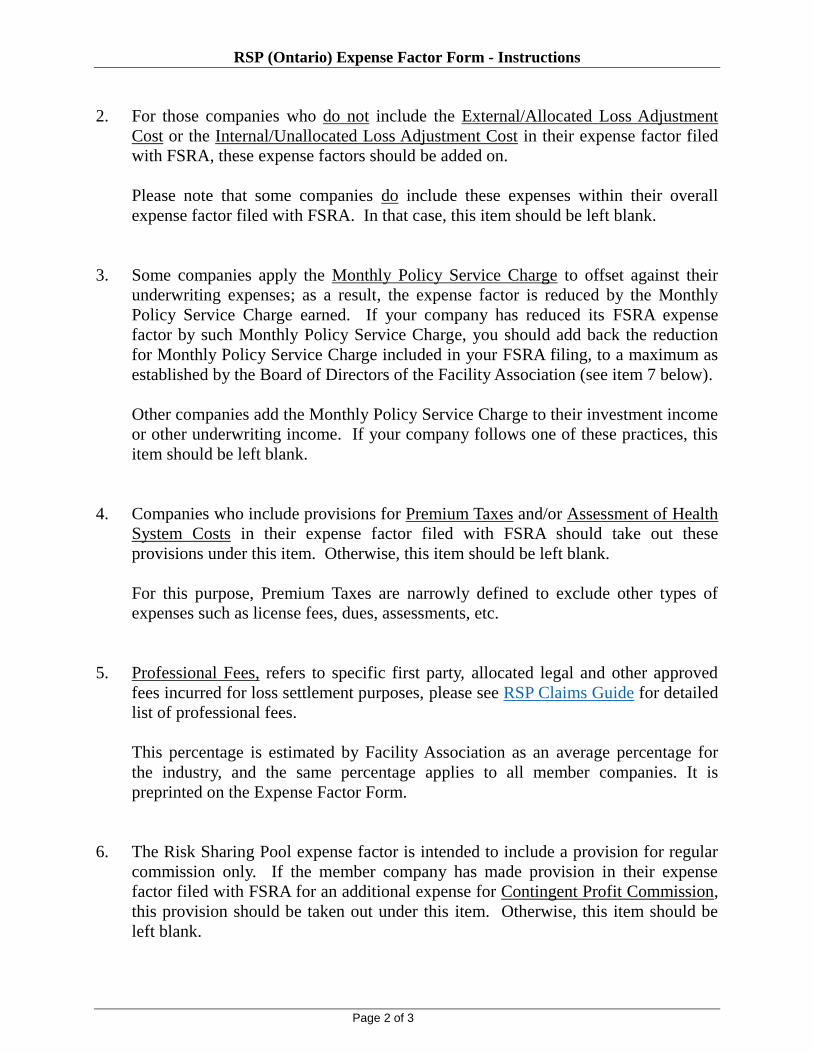
RSP (Ontario) Expense Factor Form - Instructions
Page 2 of 3
2. For those companies who do not include the External/Allocated Loss Adjustment
Cost or the Internal/Unallocated Loss Adjustment Cost in their expense factor filed
with FSRA, these expense factors should be added on.
Please note that some companies do include these expenses within their overall
expense factor filed with FSRA. In that case, this item should be left blank.
3. Some companies apply the Monthly Policy Service Charge to offset against their
underwriting expenses; as a result, the expense factor is reduced by the Monthly
Policy Service Charge earned. If your company has reduced its FSRA expense
factor by such Monthly Policy Service Charge, you should add back the reduction
for Monthly Policy Service Charge included in your FSRA filing, to a maximum as
established by the Board of Directors of the Facility Association (see item 7 below).
Other companies add the Monthly Policy Service Charge to their investment income
or other underwriting income. If your company follows one of these practices, this
item should be left blank.
4. Companies who include provisions for Premium Taxes and/or Assessment of Health
System Costs in their expense factor filed with FSRA should take out these
provisions under this item. Otherwise, this item should be left blank.
For this purpose, Premium Taxes are narrowly defined to exclude other types of
expenses such as license fees, dues, assessments, etc.
5. Professional Fees, refers to specific first party, allocated legal and other approved
fees incurred for loss settlement purposes, please see RSP Claims Guide for detailed
list of professional fees.
This percentage is estimated by Facility Association as an average percentage for
the industry, and the same percentage applies to all member companies. It is
preprinted on the Expense Factor Form.
6. The Risk Sharing Pool expense factor is intended to include a provision for regular
commission only. If the member company has made provision in their expense
factor filed with FSRA for an additional expense for Contingent Profit Commission,
this provision should be taken out under this item. Otherwise, this item should be
left blank.
RSP (Ontario) Expense Factor Form - Instructions
Page 3 of 3
7. The Board of Directors of the Facility Association will establish the Maximum
Expense Factor before the end of September of each year, to be used for the
subsequent calendar year.
Please note that although Facility Association does not require you to submit the back-
up materials with the Expense Factor Form, it does reserve its right to audit and as
such, we request that you retain the appropriate back-up material for a minimum
period of two years.

Download to CSV based on selection criteriaCompany : ________Jurisdiction: _____________
Accident Years
Fiscal Year 2021 2021 2020 2019 2018 2017 2016 & Prior TotalIndustry Earned Premium 301,842,741 301,842,741 273,797,930 251,298,268 235,343,503 5,174,281,953
Member Earned Premium 301,842,741 301,842,741 273,797,930 251,298,268 235,343,503 5,174,281,953
Member Share Ratio Percentage 100.000001 % 100.000001 % 99.999997 % 100.000000 % 99.999998 %
Share (Previous Period)
Paid Loss 0 0 0 92,944 228,244 6,315,347 6,636,535
Subrogation 0 0 0 0 0 -50,109 -50,109
Servicing Fee 0 0 0 0 0 295,528 295,528
Legal Expense 0 0 6,555 16,278 89,411 2,740,620 2,852,864
General Administration 69,401 135,085 118,080 71,686 86,258 856,203 1,336,713
Operating Result Total 69,401 135,085 124,635 180,908 403,913 10,157,589 11,071,531
Share (This Period)
Paid Loss 0 0 180,002 0 0 0 180,002
Subrogation 0 0 0 0 0 -10,002 -10,002
Servicing Fee 0 0 0 0 0 0 0
Legal Expense 0 0 2,396 1,052 998 11,496 15,942
General Administration 41,860 1 0 0 0 0 41,861
Operating Result Total 41,860 1 182,398 1,052 998 1,494 227,803
Balance Sheet Items
Outstanding Losses 9,998 50,001 249,998 30,002 170,000 630,592 1,140,591
IBNR Provision 94,999 129,999 85,002 44,995 4,997 0 359,992
OS Losses Incl IBNR 104,997 180,000 335,000 74,997 174,997 630,592 1,500,583
-This Period 41,860 1 182,398 1,052 998 1,494 227,803
Operating Results
--This Period 41,858 0 182,400 1,053 996 1,495 227,802
--Years To Date 624,048 111,260 135,085 307,036 181,953 404,911 10,159,123 11,299,368
111,261 135,086 307,033 181,960 404,911 10,159,083 11,299,334
Net Assessment
-Years To Date 624,055
Share (Years To Date)
Paid Loss 418,949
Subrogation -10,182
Servicing Fee 0
Legal Expense 104,026
General Administration 111,262
Operating Result Total 624,055
0 0 180,002 92,944 228,244 6,315,347 6,816,537
0 0 0 0 0 -60,111 -60,111
0 0 0 0 0 295,528 295,528
0 0 8,951 17,330 90,409 2,752,116 2,868,806
111,261 135,086 118,080 71,686 86,258 856,203 1,378,574
111,261 135,086 307,033 181,960 404,911 10,159,083 11,299,334
FA System 9/14/2021 4:53:28 PM EST
© 2021 Facility Association. All rights reserved.
Page 1 of 1
FACILITY ASSOCIATION
UNINSURED AUTOMOBILE FUND
MEMBER PARTICIPATION STATEMENT
FOR FISCAL QUARTER ENDING: ___________
Exhibit 11-A


