The 2019-20 Budget: Higher Education Analysis · 201920 1 Executive Summary In this report, we...
76
GABRIEL PETEK LEGISLATIVE ANALYST FEBRUARY 21, 2019 Higher Education Analysis The 2019-20 Budget:
-
Upload
nguyenhuong -
Category
Documents
-
view
214 -
download
0
Transcript of The 2019-20 Budget: Higher Education Analysis · 201920 1 Executive Summary In this report, we...

G A B R I E L P E T E KL E G I S L AT I V E A N A LY S T
F E B R U A R Y 2 1 , 2 0 1 9
Higher Education AnalysisThe 2019-20 Budget:

L E G I S L A T I V E A N A L Y S T ’ S O F F I C E
2 0 1 9 - 2 0 B U D G E T
gutter
analysis full
www.lao.ca.gov
2 0 1 9 - 2 0 B U D G E T
Table of Contents
Executive Summary . . . . . . . . . . . . . . . . . . . . . . . . . . . . . . . . . . . . . . . . . . . . . . . . . . . . . . . . . . . . . 1
Introduction . . . . . . . . . . . . . . . . . . . . . . . . . . . . . . . . . . . . . . . . . . . . . . . . . . . . . . . . . . . . . . . . . . 3
California Community Colleges . . . . . . . . . . . . . . . . . . . . . . . . . . . . . . . . . . . . . . . . . . . . . . . . . . . . 3
Overview . . . . . . . . . . . . . . . . . . . . . . . . . . . . . . . . . . . . . . . . . . . . . . . . . . . . . . . . . . . . . . . . . . 3Apportionments . . . . . . . . . . . . . . . . . . . . . . . . . . . . . . . . . . . . . . . . . . . . . . . . . . . . . . . . . . . . . 3College Promise Program . . . . . . . . . . . . . . . . . . . . . . . . . . . . . . . . . . . . . . . . . . . . . . . . . . . . . . 8Facilities . . . . . . . . . . . . . . . . . . . . . . . . . . . . . . . . . . . . . . . . . . . . . . . . . . . . . . . . . . . . . . . . . 11
California State University . . . . . . . . . . . . . . . . . . . . . . . . . . . . . . . . . . . . . . . . . . . . . . . . . . . . . . . 15
Overview . . . . . . . . . . . . . . . . . . . . . . . . . . . . . . . . . . . . . . . . . . . . . . . . . . . . . . . . . . . . . . . . . 16Compensation and Other Operational Costs . . . . . . . . . . . . . . . . . . . . . . . . . . . . . . . . . . . . . . . 16Enrollment Growth . . . . . . . . . . . . . . . . . . . . . . . . . . . . . . . . . . . . . . . . . . . . . . . . . . . . . . . . . . 20Graduation Initiative . . . . . . . . . . . . . . . . . . . . . . . . . . . . . . . . . . . . . . . . . . . . . . . . . . . . . . . . . 22Project Rebound . . . . . . . . . . . . . . . . . . . . . . . . . . . . . . . . . . . . . . . . . . . . . . . . . . . . . . . . . . . 26Facilities . . . . . . . . . . . . . . . . . . . . . . . . . . . . . . . . . . . . . . . . . . . . . . . . . . . . . . . . . . . . . . . . . 27Covering Cost Increases . . . . . . . . . . . . . . . . . . . . . . . . . . . . . . . . . . . . . . . . . . . . . . . . . . . . . . 32
University of California . . . . . . . . . . . . . . . . . . . . . . . . . . . . . . . . . . . . . . . . . . . . . . . . . . . . . . . . . 35
Overview . . . . . . . . . . . . . . . . . . . . . . . . . . . . . . . . . . . . . . . . . . . . . . . . . . . . . . . . . . . . . . . . . 35Compensation and Other Operational Costs . . . . . . . . . . . . . . . . . . . . . . . . . . . . . . . . . . . . . . . 37Enrollment Growth . . . . . . . . . . . . . . . . . . . . . . . . . . . . . . . . . . . . . . . . . . . . . . . . . . . . . . . . . . 39Student Success . . . . . . . . . . . . . . . . . . . . . . . . . . . . . . . . . . . . . . . . . . . . . . . . . . . . . . . . . . . 43Extended Education . . . . . . . . . . . . . . . . . . . . . . . . . . . . . . . . . . . . . . . . . . . . . . . . . . . . . . . . . 46Facilities . . . . . . . . . . . . . . . . . . . . . . . . . . . . . . . . . . . . . . . . . . . . . . . . . . . . . . . . . . . . . . . . . 48Covering Cost Increases . . . . . . . . . . . . . . . . . . . . . . . . . . . . . . . . . . . . . . . . . . . . . . . . . . . . . . 52
California Student Aid Commission . . . . . . . . . . . . . . . . . . . . . . . . . . . . . . . . . . . . . . . . . . . . . . . . 56
Overview . . . . . . . . . . . . . . . . . . . . . . . . . . . . . . . . . . . . . . . . . . . . . . . . . . . . . . . . . . . . . . . . . 56Cal Grants . . . . . . . . . . . . . . . . . . . . . . . . . . . . . . . . . . . . . . . . . . . . . . . . . . . . . . . . . . . . . . . . 56Nontuition Coverage for Student Parents . . . . . . . . . . . . . . . . . . . . . . . . . . . . . . . . . . . . . . . . . . 59Cal Grant Competitive Awards . . . . . . . . . . . . . . . . . . . . . . . . . . . . . . . . . . . . . . . . . . . . . . . . . 62Middle Class Scholarships . . . . . . . . . . . . . . . . . . . . . . . . . . . . . . . . . . . . . . . . . . . . . . . . . . . . 64
Summary of Recommendations . . . . . . . . . . . . . . . . . . . . . . . . . . . . . . . . . . . . . . . . . . . . . . . . . . 65
gutter
analysis full

L E G I S L A T I V E A N A L Y S T ’ S O F F I C E
2 0 1 9 - 2 0 B U D G E T
gutter
analysis full
www.lao.ca.gov
2 0 1 9 - 2 0 B U D G E T
1
Executive Summary
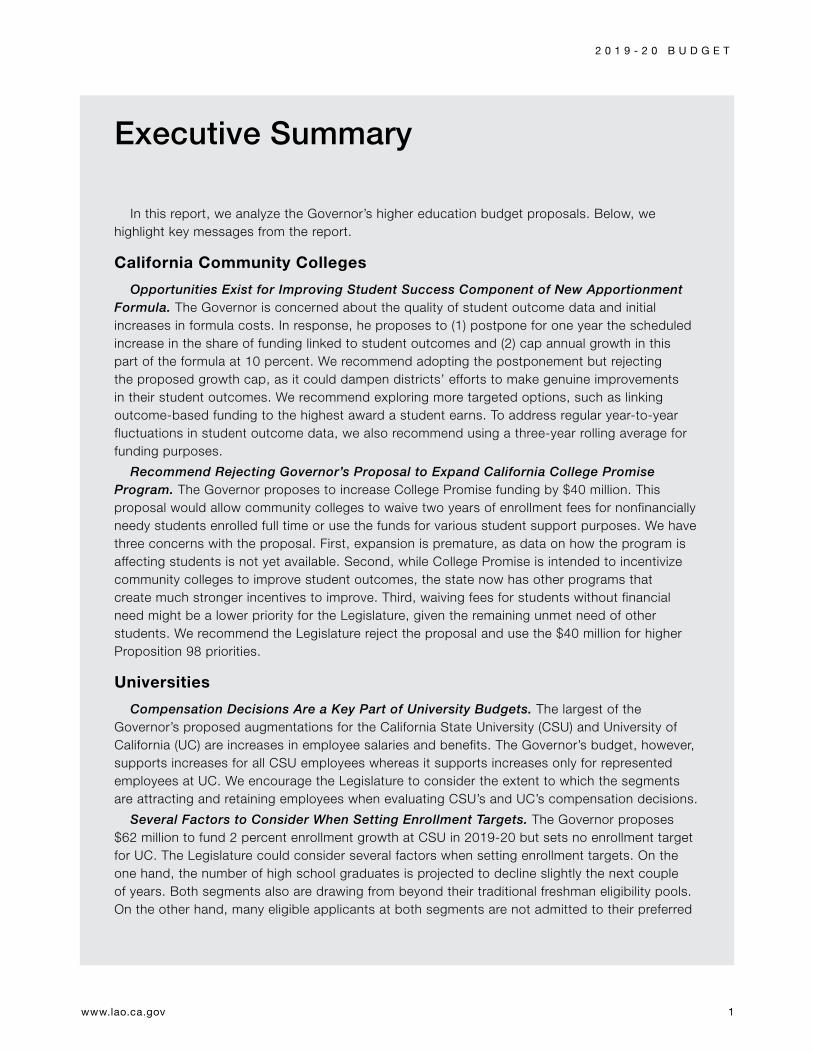
In this report, we analyze the Governor’s higher education budget proposals . Below, we highlight key messages from the report .
California Community Colleges
Opportunities Exist for Improving Student Success Component of New Apportionment Formula. The Governor is concerned about the quality of student outcome data and initial increases in formula costs . In response, he proposes to (1) postpone for one year the scheduled increase in the share of funding linked to student outcomes and (2) cap annual growth in this part of the formula at 10 percent . We recommend adopting the postponement but rejecting the proposed growth cap, as it could dampen districts’ efforts to make genuine improvements in their student outcomes . We recommend exploring more targeted options, such as linking outcome-based funding to the highest award a student earns . To address regular year-to-year fluctuations in student outcome data, we also recommend using a three-year rolling average for funding purposes .
Recommend Rejecting Governor’s Proposal to Expand California College Promise Program. The Governor proposes to increase College Promise funding by $40 million . This proposal would allow community colleges to waive two years of enrollment fees for nonfinancially needy students enrolled full time or use the funds for various student support purposes . We have three concerns with the proposal . First, expansion is premature, as data on how the program is affecting students is not yet available . Second, while College Promise is intended to incentivize community colleges to improve student outcomes, the state now has other programs that create much stronger incentives to improve . Third, waiving fees for students without financial need might be a lower priority for the Legislature, given the remaining unmet need of other students . We recommend the Legislature reject the proposal and use the $40 million for higher Proposition 98 priorities .
Universities
Compensation Decisions Are a Key Part of University Budgets. The largest of the Governor’s proposed augmentations for the California State University (CSU) and University of California (UC) are increases in employee salaries and benefits . The Governor’s budget, however, supports increases for all CSU employees whereas it supports increases only for represented employees at UC . We encourage the Legislature to consider the extent to which the segments are attracting and retaining employees when evaluating CSU’s and UC’s compensation decisions .
Several Factors to Consider When Setting Enrollment Targets. The Governor proposes $62 million to fund 2 percent enrollment growth at CSU in 2019-20 but sets no enrollment target for UC . The Legislature could consider several factors when setting enrollment targets . On the one hand, the number of high school graduates is projected to decline slightly the next couple of years . Both segments also are drawing from beyond their traditional freshman eligibility pools . On the other hand, many eligible applicants at both segments are not admitted to their preferred
gutter
analysis full

L E G I S L A T I V E A N A L Y S T ’ S O F F I C E
2 0 1 9 - 2 0 B U D G E T
2
campus . Whereas the first two factors suggest the Legislature might wish to hold enrollment flat, the last factor suggests some growth might be warranted .
Recommend Increasing Transparency and Accountability for Student Success Initiatives. The Governor proposes funding student success initiatives at both segments ($45 million for CSU’s Graduation Initiative and $50 million for a new UC initiative) . Were the Legislature interested in supporting these initiatives, we recommend linking the funding to the segments achieving certain performance expectations (such as improving graduation rates, reducing excess units, and narrowing achievement gaps by specified amounts) .
Many Proposed Capital Outlay Projects Have Merit, but Some Not Justified. We have concerns with 4 of CSU’s 18 proposed projects and 2 of UC’s 7 proposed projects . We have concerns when projects are especially costly without justification, when the space requested is not warranted given existing facility utilization, and when promising, less costly alternatives exist . We recommend the segments not proceed with these six projects, though the segments could resubmit project proposals if they found ways to lower costs or better substantiate need .
Opportunities Exist for Making Tuition More Predictable. The Governor calls for more fiscal predictability for students and their families . The best way to promote such predictability is through sizeable state reserves—sufficient to sustain university spending during an economic downturn and prevent steep tuition hikes . One way to free up General Fund for higher reserves is to have student tuition cover a share of proposed 2019-20 cost increases . In tandem with building higher reserves, we encourage the Legislature to adopt a policy explicitly establishing what share of cost nonfinancially needy students should pay . Such a policy would improve budget transparency and aim to treat student cohorts similarly, whether enrolling in college during good or bad economic times .
Cal Grants
Recommend Rejecting Proposal to Increase Financial Aid for Student Parents. The Governor proposes $122 million to help some financially needy student parents attending the three public segments with more of their living costs . We have several concerns with this proposal . By creating new rules that apply only to one group of students, the proposal further complicates the state’s financial aid system . By allocating additional aid based on students’ parental status rather than financial need, the proposal does not necessarily prioritize the highest-need students . By focusing only on existing Cal Grant recipients, the proposal would not benefit most financially needy student parents, who do not currently receive Cal Grants because of the limit on available awards . We recommend the Legislature reject the Governor’s proposal but potentially pursue more information on this issue . To this end, it could request certain state agencies work with the segments to assess the extent to which current financial aid and public assistance programs collectively address student parents’ needs .
Recommend Prioritizing Funding for More Cal Grant Competitive Awards. The state currently provides up to 25,750 new competitive awards each year for students who do not qualify for an entitlement award (typically older students) . The Governor proposes $9 .6 million to fund an additional 4,250 awards . Because the number of eligible applicants far exceeds the number of competitive awards, each year nearly 300,000 financially needy students do not receive an award . Given this figure, we think increasing the number of competitive awards is warranted . If the Legislature wishes to go further, we estimate every $1 million augmentation funds 440 additional awards .
gutter
analysis full

www.lao.ca.gov
2 0 1 9 - 2 0 B U D G E T
3
INTRODUCTION
In this report, we analyze the Governor’s major higher education budget proposals . The report has sections covering the Governor’s major proposals for the California Community Colleges (CCC), California State University (CSU), University of California (UC), and California Student Aid Commission . The final section of the report consists of a summary of our recommendations . Forthcoming analyses will cover Hastings College
of the Law as well as a few other higher education proposals, including ones relating to student food and housing insecurity . For background on the state’s college students, staffing, campuses, funding, outcomes, and facilities, please see our recently released report, California’s Education System: A 2019 Guide . For tables providing additional higher education budget detail, please see the “EdBudget” section of our website .
CALIFORNIA COMMUNITY COLLEGES
In this section, we provide an overview of the CCC budget, then analyze the Governor’s proposals for community college apportionments, the College Promise program, and CCC facilities .
OVERVIEW
Total CCC Budget Reaches $15.9 Billion Under Governor’s Budget. Community colleges receive their core support from Proposition 98 funds (Figure 1, see next page) . In addition, the state provides CCC with non-Proposition 98 General Fund for certain purposes . Most notably, non-Proposition 98 funds cover debt service on state general obligation bonds for CCC facilities, a portion of CCC teacher retirement costs, and Chancellor’s Office operations . Altogether, these Proposition 98 and non-Proposition 98 funds comprise about two-thirds of CCC funding . The remaining one-third of funding comes primarily from student enrollment fees, other student fees (such as nonresident tuition, parking fees, and health services fees), and various local sources, including community service programs and facility rentals .
Proposition 98 Funding Grows to $9.4 Billion Under Governor’s Budget. As Figure 2 (see next page) shows, the Governor has several policy proposals that together account for $290 million in new Proposition 98 spending . These augmentations are partly offset by expiring one-time funds . Under the Governor’s budget, Proposition 98 funding per full-time equivalent (FTE) student rises to $8,306 in
2019-20, an increase of $207 (2 .6 percent) from the prior year . The Governor proposes no change to the CCC enrollment fee—leaving it at $46 per unit (or $1,380 for a full-time student taking 30 semester units per year) . The state last raised the CCC enrollment fee in July 2012 .
APPORTIONMENTS
Below, we provide background on community college apportionment funding, describe the Governor’s major apportionment proposals, analyze those proposals, and offer associated recommendations .
Background
State Adopted New Credit Apportionment Funding Formula in 2018-19. Prior to 2018-19, the state based general purpose apportionment funding for both credit and noncredit instruction almost entirely on FTE enrollment . Last year, the state changed the credit-based apportionment formula to include three main components, described in the next three paragraphs . For each of the three components, the state set new per-student funding rates . In future years, these underlying rates are to receive a cost-of-living adjustment (COLA) . The new formula does not apply to credit enrollment generated from incarcerated students or high school students . It also does not apply to noncredit enrollment . Apportionments for these students remain based entirely on enrollment .
gutter
analysis full

L E G I S L A T I V E A N A L Y S T ’ S O F F I C E
2 0 1 9 - 2 0 B U D G E T
4
Base Allocation. As with the prior apportionment formula, the base allocation gives each district certain amounts for each of its colleges and state-approved centers . It also gives each district funding for each credit FTE student ($3,727 in 2018-19) . Calculating a district’s FTE student count involves several somewhat complicated steps, but basically a district is funded based on a three-year rolling average of its FTE student count . The rolling average takes into account a district’s current-year FTE count and counts for the prior two years . As discussed later, enrollment growth for the budget year is funded separately .
Figure 1
California Community Colleges Funding by Source(Dollars in Millions Except Funding Per Student)
2017-18 Actual
2018-19 Revised
2019-20 Proposed
Change From 2018-19
Amount Percent
Proposition 98General Fund $5,757 $6,055 $6,117 $62 1.0%Local property tax 2,963 3,119 3,321 202 6.5 Subtotals ($8,720) ($9,174) ($9,438) ($264) (2.9%)
Other StateOther General Funda $466 $819 $683 -$136 -16.6%Lottery 231 253 253 —b -0.1Special funds 96 95 93 -2 -2.2 Subtotals ($793) ($1,167) ($1,028) (-$138) (-11.9%)
Other LocalEnrollment fees $457 $457 $459 $2 0.4%Other local revenuesc 4,644 4,663 4,685 22 0.5 Subtotals ($5,102) ($5,120) ($5,145) ($24) (0.5%)
Federal $288 $288 $288 — —
Totals $14,903 $15,749 $15,899 $150 1.0%
Full-Time Equivalent (FTE) Students 1,125,224 1,132,757 1,136,214 3,457 0.3%Proposition 98 Funding Per FTE Student $7,749 $8,099 $8,306 $207 2.6%
Total Funding Per FTE Student $13,244 $13,903 $13,993 $89 0.6%a In 2018-19 and 2019-20, includes the Governor’s proposal to provide supplemental payments to the California State Teachers’ Retirement System.b Projected to decline by $211,000.c Primarily consists of revenue from student fees (other than enrollment fees), sales and services, and grants and contracts, as well as local debt-service payments.
Figure 2
2019-20 Changes in CCC Proposition 98 Spending(In Millions)2018-19 Revised Spending $9,174
Technical AdjustmentsPrior-year one-time spending -$110Other 83 Subtotal (-$26)
Policy ProposalsCOLA for apportionments (3.46 percent) $248College Promise fee waivers (extend program to sophomores) 40COLA for select student support programs (3.46 percent)a 32Enrollment growth (0.55 percent) 26Student Success Completion Grants (caseload adjustment) 11Legal services for undocumented students 10Strong Workforce Program (portion of costs shifted to one-time funds) -77 Subtotal ($290)
Total Changes $264
2019-20 Proposed Spending $9,438a Applies to Adult Education, Apprenticeship Programs, Extended Opportunity Programs and Services, mandates block
grant, Disabled Students Programs and Services, CalWORKs student services, and campus child care support. COLA = cost-of-living adjustment.
gutter
analysis full

www.lao.ca.gov
2 0 1 9 - 2 0 B U D G E T
5
Supplemental Allocation. The formula provides an additional $919 for every student who receives a Pell Grant, receives a need-based fee waiver, or is undocumented and qualifies for resident tuition . Student counts are “duplicated,” such that districts receive twice as much supplemental funding ($1,838) for a student who is included in two of these categories (for example, receiving both a Pell Grant and a need-based fee waiver) . The allocation is based on student counts from the prior year .
Student Success Allocation. As Figure 3 shows, the formula also provides additional funding for each student achieving specified outcomes—obtaining various degrees and certificates, completing transfer-level math and English within the student’s first year, and obtaining a regional living wage within a year of completing community college . Districts receive higher funding rates for the outcomes of students who receive a Pell Grant or need-based fee waiver, with somewhat greater rates for the outcomes of Pell Grant recipients . As with the supplemental allocation, funding is based on outcome data from the prior year .
Over Next Two Years, Base Allocation to Decrease, Student Success Allocation to Increase. In 2018-19, roughly 70 percent of the cost of the formula stems from the base allocation, 20 percent from the supplemental allocation, and 10 percent from the student success allocation . The share for the base allocation is scheduled to decrease to roughly 65 percent in 2019-20 and 60 percent in 2020-21, whereas the share for the student success allocation is set to increase to
15 percent in 2019-20 and 20 percent in 2020-21 . To achieve these changes in shares, statute specifies changes to the base and student success rates for each of the next two years . Whereas the base rate is set to decrease from $3,727 to $3,046 over the period, the student success rates are set to double .
New Formula Insulates Districts From Funding Losses During Transition. The new formula includes several hold harmless provisions for community college districts that would have received more funding under the former apportionment formula than the new formula . For 2018-19, 2019-20, and 2020-21, these community college districts are to receive their total apportionment in 2017-18, adjusted for COLA each year of the period . Beginning in 2020-21, districts are to receive no less than the per-student rate they generated in 2017-18 under the former apportionment formula multiplied by their current FTE student count . To help districts with declining enrollment, the state also retained its longstanding one-year hold harmless provision that allows districts to receive the greater of their calculated current- or prior-year allotments .
State Allocates Enrollment Growth Separately From Other Components of the Apportionment Formula. Enrollment growth funding is provided on top of the funding derived from all the other components of the apportionment formula . Statute does not specify how the state is to go about determining how much growth funding to provide . Historically, the state considers several factors,
Figure 3
Student Success Allocation in New CCC Formula2018-19 Amounts by Student Outcome Measure and Student Type
Outcome Measure All Students
Additional Funding for Each:
Pell Grant Recipient
Need-Based Fee Waiver Recipient
Associate degree for transfer $1,760 $666 $444 Associate degree 1,320 500 333Credit certificate requiring 18 or more units 880 333 222Transfer-level math and English courses completed within first academic year 880 333 222Transfer to a four-year university 660 250 167Nine or more career technical education units completed 440 167 111Regional living wage obtained within one year of community college completion 440 167 111
gutter
analysis full

L E G I S L A T I V E A N A L Y S T ’ S O F F I C E
2 0 1 9 - 2 0 B U D G E T
6
including changes in the adult population, the unemployment rate, and prior-year enrollment . When the state funds growth, the Chancellor’s Office uses a statutory formula to allocate that funding across community college districts . The allocation formula takes into account local educational attainment, unemployment, and poverty rates, as well as recent local enrollment trends . The formula is designed to direct a larger share of enrollment growth to high-need districts .
Community College Districts Required to Conduct Annual Financial Audits. Districts must contract annually with a certified public accountant to conduct an audit that reviews their financial statements and verifies compliance with state and federal programs . The compliance portion of the audit includes a review of districts’ documentation relating to FTE enrollment . The Chancellor’s Office annually publishes an audit manual that provides guidelines for the documentation that must be collected and reviewed in assessing compliance .
Governor’s Proposals
Projects Higher Cost of 2018-19 Apportionments but Does Not Cover Shortfall at This Time. The administration estimates that 2018-19 apportionments cost $69 million more than provided for in the Governor’s current budget package . The higher cost is primarily a result of the student success allocation exceeding levels assumed in the 2018-19 Budget Act . The administration indicates it will decide whether to provide additional funding to address the apportionment shortfall in May, at which time the state will have updated estimates of both apportionment costs and General Fund revenues .
Funds COLA and Enrollment Growth. The Governor’s budget includes $248 million to cover a 3 .46 percent COLA for apportionments . In addition, the budget includes $26 million to cover 0 .55 percent enrollment growth (equating to about 6,000 additional FTE students) .
Postpones Scheduled Changes in Funding Formula Rates. The administration proposes to postpone for one year the scheduled changes in the share of apportionment funding linked with the base allocation and the student success
allocation . Under the Governor’s proposal, the 2019-20 funding formula rates would be the same as in 2018-19, adjusted for COLA . The administration indicates the proposal is intended to provide additional time for the Chancellor’s Office to assess the reliability and quality of the student outcome data used in determining districts’ funding allocations . In 2020-21, rates would change as currently scheduled, with base rates decreasing and student success rates doubling .
Caps Year-to-Year Growth in Student Success Allocation. The Governor also proposes to limit growth in a district’s student success allocation such that it can increase no more than 10 percent each year . This proposal helps to constrain the total costs of the formula and limits the fiscal effects of student outcome data that is of potentially poor quality .
Assessment
A Few Key Considerations in Deciding Whether to Cover Apportionment Shortfall. On the one hand, the Legislature could cover the shortfall, thereby signaling support for the new funding formula, with its emphasis on improving community college student outcomes . On the other hand, the Legislature could choose not to the cover the shortfall . Were the shortfall not to be covered, current practice would result in each district having its apportionment amount prorated downward . Based on the current estimated shortfall, district apportionments would be reduced by about 1 percent . Some of the 72 community college districts likely would be affected by the reduction more than others . For the 18 “hold harmless” districts—which expected to receive their 2017-18 allotments adjusted by COLA—the shortfall would result in year-over-year growth slightly lower than COLA . These districts could be in a relatively difficult position if they increased employee salaries in 2018-19 based on COLA . For the other 54 districts—which expected to grow at rates higher than COLA—the prorated reduction likely would be less difficult to accommodate, with their annual growth rates still relatively high . (For purposes of this comparison, we exclude the new online community college district created last year .)
gutter
analysis full

www.lao.ca.gov
2 0 1 9 - 2 0 B U D G E T
7
Proposed Enrollment Growth Is in Line With Recent Systemwide Demand. The Governor proposes lower enrollment growth than the state has budgeted for CCC the past few years . The lower growth rate, however, is consistent with the growth districts have experienced the past few years . In 2016-17, districts used $38 million of $114 million budgeted for enrollment growth . In 2017-18, districts used $32 million out of $60 million budgeted for growth . For 2018-19, the administration projects districts will use $33 million of the $60 million provided . Given these trends, we think the $26 million proposed by the Governor for 2019-20 is reasonable .
Student Outcome Data Can Fluctuate Year to Year. The administration has expressed concern with anomalies in the preliminary 2017-18 student outcome data . For example, 2017-18 statewide growth in the number of associate degrees awarded was the highest reported growth rate since 2008-09 . Our review of historical data, however, shows student outcome data to be prone
to significant year-to-year variation (Figure 4) . The variability is particularly large when looking at individual districts . Although the number of associate degrees awarded annually has increased statewide by an average of 7 percent per year since 2008-09, almost all districts had at least one year where their awards declined from the previous year . During that same period, 59 districts had at least one year where the number of associate degrees awarded increased more than 20 percent . Similar variability also exists in historical data for certificates of greater than 18 units . Were these trends to continue, districts could see substantial year-to-year variation in their student success allocations .
Likely Several Causes of Data Variability. Because this data has not traditionally been audited or reviewed by external entities, the data may not be accurate or collected consistently . The degree counts for any particular year also could be affected by administrative decisions or delays in the actual processing or reporting of degrees .
2009-10 2010-11 2011-12 2012-13 2013-14 2014-15 2015-16 2016-17 2017-18
Mendocino
El Camino
Palomar
Note: Shows change in associate degrees and associate degrees for transfer. The three community college districts selected reflect the variation among small, medium, and large districts.
Statewide
Annual Change in Degrees AwardedAssociate Degrees Awarded Vary Significantly Year to Year
Figure 4
-30
-20
-10
10
20
30%
gutter
analysis full
L E G I S L A T I V E A N A L Y S T ’ S O F F I C E
2 0 1 9 - 2 0 B U D G E T
8
(Some students who complete their coursework in May, for example, might not receive their degree until July due to processing issues .) Data also could vary by year because of differences in student cohorts, with larger incoming cohorts producing a larger set of outcomes in subsequent years . Finally, some of the changes could be due to specific local circumstances . For example, a district might see an increase in its number of transfer students if a local CSU campus were to increase its transfer admissions rate that year .
Chancellor’s Office Plans to Add Auditing Guidelines for All Funding Formula Data. The 2018-19 audit manual released by the Chancellor’s Office does not require auditors to review the data used to calculate the supplemental and student success allocations of the apportionments formula . The Chancellor’s Office indicates it will update auditing guidelines for 2019-20 to include a review of this additional data . These new guidelines will provide the state with greater assurance that the data is being properly collected, tabulated, and reported .
Chancellor’s Office Plans to Conduct Review of Data Collection Processes This Spring. In addition to updating the audit manual, the Chancellor’s Office plans to hire an independent entity this spring to review the data collection and reporting processes of a random sample of districts . The goal of this review is to identify ways to improve the consistency and quality of data reported by districts . The review is expected to be completed by early May, such that its findings and recommendations could be incorporated into the final 2019-20 budget .
Cap on Student Success Allocation Is a Crude Approach to Containing Formula Costs. In adopting the new funding formula, the Legislature tied a portion of funding to student outcomes to ensure districts had strong financial incentives to focus on student success . Capping the entire student success allocation is a crude approach that could work counter to this purpose . Most notably, the cap could reduce financial incentives for districts that are making genuine improvements in student outcomes .
Recommendations
Use a Three-Year Rolling Average to Distribute Student Success Allocation. Given initial concerns with student outcome data, we recommend adopting the Governor’s proposal to postpone the scheduled changes in funding formula rates . Although postponing the changes and implementing new audit guidelines likely will help improve data quality and reliability, we are concerned that accurate and reliable data might still be prone to significant year-to-year volatility . To limit volatility in districts’ annual funding levels, we recommend the student success allocation be calculated using a three-year rolling average of student outcome data . This approach is similar to the approach used to smooth out enrollment funding in the base allocation . Using a rolling average would mitigate the fluctuations that might occur because of data irregularities while still creating incentives for districts to improve outcomes over the long run .
Consider Ways to Promote Genuine Improvements Instead of Capping Student Success Allocation. Rather than implementing a cap on all outcomes-based funding, we recommend the Legislature explore other cost-containment options that continue to provide strong incentives for districts to make genuine improvements in student outcomes . For example, the Legislature could limit the amount of outcomes-based funding generated by an individual student to the highest award earned in any particular year . Under such an approach, a student who earns an associate degree and a certificate would only generate outcomes-based funding for the associate degree . This would prevent districts from generating additional funding by encouraging associate degree students to obtain unnecessary certificates, yet still reward districts that see improvement in student completion . Targeted modifications of this type would allow the state to reduce formula costs without reducing the incentive for districts to improve outcomes for students .
COLLEGE PROMISE PROGRAM
Below, we (1) provide background on the Board of Governors (BOG) fee waiver program and the
gutter
analysis full

www.lao.ca.gov
2 0 1 9 - 2 0 B U D G E T
9
California College Promise program, (2) describe the Governor’s proposal to increase funding for the College Promise program, (3) assess that proposal, and (4) make an associated recommendation .
Background
Longstanding Program Provides Fee Waivers for CCC Students With Financial Need. When the Legislature introduced a CCC enrollment fee in 1984, it created the BOG fee waiver program . This program waives enrollment fees—currently $46 per unit—for students who have some financial need . (Financial need is defined as the difference between the total cost of attendance and the amount a student’s family can contribute toward that cost, as calculated by a federal formula .) Students apply for a fee waiver by completing either the Free Application for Federal Student Aid (FAFSA) or a shorter form developed by the Chancellor’s Office . Students may receive this fee waiver for any number of units taken . In 2017-18, 41 percent of CCC students—representing almost two-thirds of units taken—had their enrollment fees fully waived through this program .
State Recently Created New Program With Multiple Objectives. Chapter 735 of 2017 (AB 19, Santiago) created the California College Promise program . This program was inspired by tuition-free college programs in other states (as explained in the box on page 10), but it had broader goals beyond affordability . The Legislature’s stated intent in creating the program was to support CCC in increasing college readiness, improving student outcomes, and reducing achievement gaps . The state provided $46 million for the program in 2018-19, the first year it was funded . Colleges are permitted—but not required—to use these funds to provide fee waivers to first-time, full-time students without financial need during their first year of college . To be eligible for these waivers, students must have no prior
postsecondary coursework, enroll in 12 or more units per semester, and submit a FAFSA . Under the program, colleges also are permitted to use their College Promise funds for a broad range of other purposes, such as providing supplemental services to students .
Statute Requires Colleges to Meet Six Requirements to Receive College Promise Funds. Figure 5 shows these requirements . The requirements are intended to incentivize colleges to adopt certain promising student support practices . In 2018-19, 105 colleges have indicated they are meeting all six requirements and are, in turn, receiving College Promise funds . Nine colleges have opted out of the program, primarily out of concern that the sixth requirement—offering federal student loans—will increase their cohort default rates . (Colleges must maintain cohort default rates below a certain threshold to remain eligible for federal financial aid, including the Pell Grant program .)
Some Colleges Are Using Funds for Purposes Other Than Fee Waivers. The Chancellor’s Office allocates College Promise funds primarily based on the estimated number of students at each college who are eligible for fee waivers under this program . According to the Chancellor’s Office, 85 of the 105 colleges receiving College Promise
Figure 5
Colleges Must Meet Six Requirements to Receive College Promise FundsParticipating Community Colleges Must:
9 Partner with school districts on college outreach efforts.
9 Partner with school districts to support practices that improve college readiness and reduce the need for remediation.
9 Use evidence-based practices for the assessment and placement of incoming students.
9 Implement Guided Pathways to help students enter and stay on a defined academic path.
9 Ensure students complete the Free Application for Federal Student Aid or California Dream Act Application.
9 Participate in federal student loan program.
gutter
analysis full

L E G I S L A T I V E A N A L Y S T ’ S O F F I C E
2 0 1 9 - 2 0 B U D G E T
10
funds are using some or all of their funds to provide fee waivers to first-time, full-time students without financial need . The remaining colleges are using the funds for other purposes . Examples of other uses include book stipends for financially needy students and additional financial aid staff positions . The Chancellor’s Office indicates that some colleges are opting to use College Promise funds for other purposes because they already had local programs waiving fees for students without financial need .
Governor’s Proposal
Governor Proposes $40 Million Ongoing for College Promise Expansion. The Governor proposes to augment funding for the program based on the estimated cost of waiving enrollment fees for first-time, full-time CCC students in their first two years of college who do not have financial need under the BOG fee waiver program . Under the Governor’s proposal, total ongoing funding for the program would be $80 million . (Though the 2018-19 Budget Act included $46 million for the College Promise program, the administration now estimates that first-year fee waivers cost only $40 million—the same as its estimated cost for second-year fee waivers .) Consistent with the existing design
of the program, colleges could use their additional College Promise funds to waive enrollment fees for qualifying students or for other purposes, such as student support services . The proposal does not change the six requirements colleges must meet to receive funds under this program .
Assessment
Outcomes From First Year of Program Are Not Yet Known. The state first funded the College Promise program in 2018-19 . As of this writing, current-year data from the colleges is not available . This means the state does not yet know the effect of the program on overall enrollment, full-time enrollment, financial aid participation, and other student outcomes . Without this information, the Legislature may consider it premature to expand the program .
Proposal Likely to Primarily Benefit Students Without Financial Need. Although the Chancellor’s Office does not know exactly how much colleges spent on College Promise fee waivers, it reports that 85 of the 105 participating colleges are using some or all of their allocation for fee waivers . We anticipate that many colleges would use the proposed augmentation for the same purpose .
College Promise Programs in National Context
In Other States, College Promise Programs Are Primarily Intended to Increase Affordability. California’s College Promise program was inspired by other states’ College Promise programs, which primarily focused on providing tuition-free college . These other programs typically emerged in states that had not previously waived tuition for students with financial need . Accordingly, the programs are intended to reduce financial barriers to enrollment and simplify the messaging around affordability . Some programs are limited to full-time students, with the intent of incentivizing students to take a higher course load that allows them to graduate more quickly .
In California, Existing Programs Already Addressed Affordability Goal. Before the California College Promise program, the BOG fee waiver program already waived enrollment fees for California Community Colleges (CCC) students with financial need, regardless of course load or prior academic experience . California also was already funding the Cal Grant program, which helps CCC recipients cover a portion of their living costs . In 2016-17, the state began providing additional incentives for financially needy CCC students to enroll full time . Specifically, the Student Success Completion Grant provides full-time CCC students receiving a Cal Grant with up to an additional $4,000 each year for living expenses . Because of these existing financial aid programs, California’s College Promise program is not as strictly focused on affordability as other states’ programs .
gutter
analysis full

www.lao.ca.gov
2 0 1 9 - 2 0 B U D G E T
11
Because the students qualifying for fee waivers under this program are not considered financially needy, the Legislature may have higher priorities for these funds . Were the Legislature to reject the Governor’s proposal, CCC students with financial need would continue to have their second-year enrollment fees covered by the BOG fee waiver program .
Colleges Have Other Stronger Fiscal Incentives to Improve Student Support. The College Promise program was designed to create a financial incentive for colleges to adopt six student support practices . Since creating the program, the Legislature has adopted other reforms that provide more explicit requirements and stronger financial incentives for colleges to improve student support . Chapter 745 of 2017 (AB 705, Irwin) requires colleges to use multiple measures to determine whether incoming students can be placed into transfer-level coursework—one of the six practices required under the College Promise program . The Student Equity and Achievement Program, a $475 million block grant created in 2018-19, requires colleges to adopt practices that overlap with two of the College Promise program requirements . The 2018-19 budget package also created a new funding formula that bases a portion (roughly $800 million in the current year) of a college’s general purpose apportionments on student outcomes . Together, these recent reforms create incentives that are similar to—and considerably larger than—those created under the College Promise program .
Recommendation
Reject Governor’s Proposal to Increase Funding for College Promise Program. Because (1) it is too soon for the Legislature to evaluate the current College Promise program, (2) the program primarily benefits students without financial need, and (3) colleges now have stronger incentives to provide student support and improve student outcomes, we recommend the Legislature reject the Governor’s proposed $40 million augmentation . Rejecting the proposal would free up a like amount of funding for other Proposition 98 priorities .
FACILITIES
In this section, we provide background on CCC facilities, describe the Governor’s proposal to authorize 12 new community college projects, assess the Governor’s proposal, and offer associated recommendations .
Background
State Funds Community College Facilities Through General Obligation Bonds. The state typically issues general obligation bonds to cover a portion of the cost of community college facility projects . A majority of voters must approve these bonds . From 1998 through 2006, voters approved four facility bonds that provided a total of $4 billion for community college facilities . Virtually no funding remains from these facility bonds .
New State Bond Approved in 2016. After a ten-year gap, voters approved Proposition 51 in November 2016 . The measure authorizes the state to sell $2 billion in general obligation bonds for community college projects . The funds may be used for an array of CCC projects, including buying land, constructing new buildings, modernizing existing buildings, and purchasing equipment .
Community College Districts Raise Local Funding for Facilities. The bulk of community college facility costs are covered with local funds . Districts typically sell local general obligation bonds to raise this support . Districts currently must get at least 55 percent of their voters to approve the sale of these local bonds . Since 1998 (when the voting threshold for local facility bonds was reduced from two-thirds), community college districts have sold $26 billion in local general obligation bonds for facility projects .
Community College Facility Projects Ranked by Chancellor’s Office and Reviewed by the State. To receive state bond funding, community college districts must submit project proposals to the Chancellor’s Office . The Chancellor’s Office ranks all submitted facility projects using prioritization criteria adopted by the Board of Governors . Projects are prioritized in the following order:
gutter
analysis full

L E G I S L A T I V E A N A L Y S T ’ S O F F I C E
2 0 1 9 - 2 0 B U D G E T
12
• Life safety projects, projects to address seismic deficiencies or risks, and infrastructure projects (such as utility systems) at risk of failure .
• Projects to increase instructional capacity .
• Projects to modernize instructional space .
• Projects to complete campus build-outs .
• Projects that house institutional support services .
Within these categories, projects with a local contribution receive greater consideration . After ranking the projects, the Chancellor’s Office submits capital outlay project proposals to the Legislature and Governor in the fall . The projects are reviewed as part of the annual state budget process .
Review Process Works Somewhat Differently for Life Safety Projects. To be approved in the highest-priority category under the Chancellor’s Office process, a district must (1) have a third party entity identify the facility as an imminent danger to the occupants and (2) submit a project scope that is the least costly option for permanently addressing the problem . A project to address immediate electrical safety issues, for example, could not include renovations related to other building issues .
Almost Two Dozen Proposition 51 Projects Already Approved, Many More Recommended by Chancellor’s Office. To date, the state has approved 21 Proposition 51-funded community college projects . The total state cost for all phases of these projects is estimated to be $587 million . For 2019-20, the Chancellor’s Office is recommending 39 additional projects . Of the 39 projects, 6 projects were proposed last year but not funded . The remaining 34 projects were newly approved by the Chancellor’s Office in fall 2018 . Of the projects, the Chancellor’s Office ranked 3 in the highest-priority category, 15 in the second highest-priority category, 15 in the third category, and 6 in the fourth category . The projects are estimated to have total state costs of $689 million .
Governor’s Proposals
Governor Proposes Funding 12 New CCC Projects for 2019-20. The administration
proposes to fund 12 of the 39 projects submitted by the Chancellor’s Office . As Figure 6 shows, the Governor’s budget includes $18 million in Proposition 51 funds for these projects . The funding would cover the cost of preliminary plans and working drawings . Total state costs for all phases of the projects, including construction, are estimated to be $254 million . Of the 12 projects, 1 is in the Chancellor’s Office’s highest-priority category, 3 are in the second priority category, 5 are in the third priority category, and 3 are in the fourth category . The administration indicates it funded all projects that address life safety issues and include substantial local matches . (For two projects with little or no local match, the administration indicates it included the projects because the districts demonstrated financial hardship .)
Governor Supports Next Phase of 15 Previously Approved Projects. The Governor’s budget also includes $341 million in Proposition 51 funds for the construction phase of 15 projects that were initially approved in 2017-18 or 2018-19 (Figure 7) .
Governor Postpones Additional Funding for Five Previously Approved Projects. For five projects that previously received funding for preliminary plans and working drawings, the administration proposes postponing construction funding . Figure 8 (see page 14) lists these projects, the year they were initially approved, and their estimated construction cost . Most of these projects have encountered delays with earlier project phases and, in three cases, the administration is concerned districts still are contributing little or no local match toward the project .
Assessment
Governor Proposes More Projects Than in Previous Years. The Newsom administration shows a greater commitment to allocating Proposition 51 bond funding than the previous administration . Compared to the 12 projects Governor Newsom is proposing, the Brown administration proposed only five projects each of the past two years . Despite proposing more projects, the state still would be on a somewhat slow track to expend all Proposition 51 bond funds . Accounting for all phases of all projects to date
gutter
analysis full

www.lao.ca.gov
2 0 1 9 - 2 0 B U D G E T
13
(including the 12 proposed projects), the state would have committed $668 million of the $2 billion authorized by Proposition 51 . (This amount excludes construction funding for the postponed projects .) At this pace, the state would be on track to exhaust
Proposition 51 bond funding in about nine years (by 2025-26) . Given the amount of projects approved by the Chancellor’s Office, this somewhat slow pace is driven by state-level decisions, not lack of demand from community colleges .
Figure 6
Governor Proposes to Fund 12 New CCC Capital Outlay Projects(In Thousands)
College Project2019-20
State Cost
All Years
State Cost Total Costa
San Bernardino Technology replacement building $2,313 $34,411 $75,647Redwoods Physical education replacement building 5,379 60,648 60,648American River Technology replacement building 1,258 29,959 57,966Saddleback New Gateway Building 1,719 26,080 52,338Alameda Auto and diesel technologies replacement building 1,278 17,044 33,650Los Angeles City Theater arts replacement building 1,112 15,140 30,095Merced New agricultural science and industrial technologies complex 431 12,974 25,629Santa Monica Art replacement complex 793 10,901 21,526Rio Hondo Music/Wray theater renovation 847 9,873 20,486Sequoias Basic skills replacement center 1,365 15,635 17,350Fresno Child development replacement center 1,036 13,520 16,850Butte Technology building renovation 518 8,088 10,722
Totals $18,049 $254,273 $422,907 a Community college districts typically issue local general obligation bonds to pay for a share of project costs.
Figure 7
State Would Support 15 Continuing CCC Capital Outlay Projects(In Thousands)
College Project2019-20
State Cost
All Years
State Cost Total Costa
Santa Monica Science and mathematics building addition $37,031 $39,615 $78,102Laney Learning resource replacement center 22,812 24,417 75,686Mount San Antonio New physical education complex 53,993 57,541 72,238Santa Rosa Science and mathematics replacement building 30,882 33,076 65,589Orange Coast Language arts and social sciences replacement building 28,305 30,353 59,803Allan Hancock Fine arts replacement complex 22,873 24,526 48,318Golden West Language arts replacement complex 21,925 23,540 46,478West Hills (North District Center) New library and instructional facility 40,275 42,403 43,285Santa Ana Russell Hall replacement 19,192 20,729 40,948Solano Library replacement building 17,396 20,148 39,739Compton Instructional replacement building 14,891 16,167 24,995Mission Portables replacement 10,073 10,814 21,500Merritt New child development center 5,692 6,128 20,013Imperial Academic buildings renovation 8,647 9,043 17,741Long Beach (Pacific Coast Campus) Construction trades building renovation, phase 1 6,712 7,304 13,107
Totals $340,699 $365,804 $667,542 a Community college districts typically issue local general obligation bonds to pay for a share of project costs.
gutter
analysis full

L E G I S L A T I V E A N A L Y S T ’ S O F F I C E
2 0 1 9 - 2 0 B U D G E T
14
Different Approaches to Life Safety Issues Is Creating Confusion for Districts. Although the Chancellor’s Office has a specific process for addressing life safety issues, the administration has its own approach . The administration reviews every project approved by the Chancellor’s Office and prioritizes those that appear to be addressing life safety issues, even if life safety is not the primary reason for the project . In contrast, the Chancellor’s Office may deem a project higher priority because it addresses a lack of instructional capacity, even if no life safety issues are involved . Inconsistency in how the two agencies are reviewing projects is resulting in confusion for districts, as their projects are effectively being subjected to two competing standards .
Unclear if Prioritizing Life Safety Is the Right Approach for Community Colleges. The administration’s approach to prioritizing community college projects is consistent with the approach generally used for state-owned buildings, where the state is directly responsible for safety . This approach, however, might not be the right approach within the context of community college facilities . Community college districts are the ones directly responsible for any life safety issues related to their facilities . Additionally, the administration’s approach can reward districts that have done a poor job maintaining their facilities . For example, if two districts submit requests to modernize buildings that are of the same age, the administration’s approach prioritizes the project that has a life safety issue . The life safety issue,
however, could be the result of poor district maintenance practices . The Chancellor’s Office approach, which requires third-party review and limits the scope of life safety projects, does not create these poor incentives to the same degree .
Recommendations
Consider Approving Additional CCC Projects. Given the somewhat slow pace of project approvals and our concerns with the administration’s rationale for which projects it has included in its budget, the Legislature may want to consider approving more projects than the Governor . In choosing which projects to fund, the Legislature could evaluate the projects based on the Chancellor’s Office priority categories or work with the Chancellor’s Office and administration to develop another set of clear, agreed-upon criteria . Figure 9 lists the projects approved by the Chancellor’s Office but not funded in the Governor’s budget .
Explore Better Ways to Address Life Safety Concerns. We recommend directing the administration and the Chancellor’s Office to develop one agreed-upon framework for how life safety issues should be considered in the review of community college projects . If the administration and Chancellor’s Office cannot come to an agreement, we recommend the Legislature codify an approach in statute . We believe the framework should ensure state funding is available in case of a facility emergency but also have strong incentives for districts to maintain their facilities in good condition . Additionally, we think the framework
Figure 8
Five Previously Approved Projects Not Receiving Construction Funding in 2019-20(In Thousands)
College ProjectYear Initially
Approved
Estimated Construction Cost
State Total
San Francisco (Ocean Campus) Utility infrastructure replacementa 2017-18 $76,257 $76,257Pasadena City Armen Sarafian building seismic replacementb 2017-18 53,458 55,523Redwoods Arts building replacementc 2018-19 22,191 22,191Fullerton Business 300 and Humanities 500 Renovationc 2017-18 15,714 30,115San Francisco (Alemany Center) Seismic and code renovationsa 2017-18 14,398 14,398a Both project delays and insufficient local match.b Insufficient local match.c Project delays. For Redwoods project, district demonstrated financial hardship and no local match is expected.
gutter
analysis full

www.lao.ca.gov
2 0 1 9 - 2 0 B U D G E T
15
should ensure districts provide a local contribution based on their local resources . Creating one set of rules will simplify the process, clarify expectations
for districts, and help the state more thoughtfully prioritize among projects .
CALIFORNIA STATE UNIVERSITY
In this section, we provide an overview of CSU’s budget, then assess the Governor’s proposals to fund (1) compensation and other operational cost increases, (2) enrollment growth, (3) the Graduation Initiative, (4) Project Rebound, and (5) a set of
facility projects . We conclude by discussing options for how the Legislature might cover the costs associated with these budget priorities or other priorities it identifies .
Figure 9
Projects Approved by Chancellor’s Office but Not Included in Governor’s Budget(In Thousands)
College ProjectPriority
Categorya2019-20
State Costb
All Years
State Cost Total Cost
Folsom Lake Instructional buildings phase 2 2 $1,280 $31,374 $58,488 Mount San Jacinto Math and Sciences building 2 1,560 26,816 50,673
Clovis Applied Technology building 2 1,794 26,091 49,893 Irvine Valley Fine arts building 2 1,624 23,202 45,072 Long Beach City Music/theatre complex 2 1,681 23,212 44,606 Mount San Jacinto Science and Technology building 2 1,854 23,203 44,071 Santa Barbara City Physical education replacement 1 3,189 41,103 41,928 West Valley Learning resource center renovation 3 1,623 19,993 40,132 Los Rios (Natomas Education Center) Natomas Center phases 2 and 3 2 886 27,805 39,386
Woodland Performing arts facility 4 1,427 19,426 37,659 West Hills Lemoore Instructional Center phase 1 2 1,634 23,413 31,726 Kern (Delano Center) LRC multipurpose building 2 1,191 16,106 31,242 Skyline Workforce development center 3 860 14,621 28,750 Laney Theater buildings renovation 3 709 8,213 26,454 Chaffey Instructional Building 1 2 951 12,990 26,132 Cerritos Health Sciences Building 26 renovation 3 1,054 12,665 24,712 Merritt Horticulture building replacement 3 755 10,065 24,506 Cañada Instructional center renovation 3 676 8,253 23,682 Lake Tahoe RFE and Science renovation 3 1,447 11,056 21,564 Porterville Allied health building 2 835 10,919 20,827 Monterey Peninsula Public safety center phase 1 4 714 9,223 19,058 Los Rios (Elk Grove Center) Elk Grove Center phase 2 2 410 8,946 17,013
Reedley New child development center 4 818 10,388 14,366 Canyons Boykin Hall renovation 3 334 4,057 7,755 Cabrillo Buildings 500, 600 and 1600 renovation 3 252 3,622 7,268 Monterey Peninsula Music facilities phase 1 renovation 3 222 2,454 6,347 San Mateo Water supply tank replacement 1 505 5,669 6,298
Totals $30,285 $434,885 $789,608a Reflect’s Chancellor’s Office priority categories.b Reflects cost of preliminary plans and working drawings.
gutter
analysis full

L E G I S L A T I V E A N A L Y S T ’ S O F F I C E
2 0 1 9 - 2 0 B U D G E T
16
OVERVIEW
Below, we provide an overview of the Governor’s proposed budget for CSU, highlighting how CSU’s core and noncore funding levels would change .
CSU Receives Its Funding From Four Main Sources. In 2018-19, CSU is receiving a total of $10 .9 billion in funding from all sources . As Figure 10 shows, about two-thirds ($7 .4 billion) comes from core funds—a combination of state General Fund, student tuition and fees, and other state funds (primarily lottery funds) . The remaining one-third ($3 .5 billion) comes from federal funds and other CSU funds (which includes revenue from various campus enterprises such as parking facilities and student dormitories) .
Under Governor’s Budget, CSU Funding Would Increase by a Total of $504 Million (4.6 Percent). Funding from all sources (core and noncore funds) would grow to $11 .4 billion in 2019-20 . The Governor’s budget assumes that federal funds and other CSU funds are flat year over year, with all of the increase coming from core funds . Greater state General Fund support accounts for the bulk of the increase ($465 million, 11 .3 percent) . Student tuition and fee revenue would increase slightly ($39 million, 1 .2 percent) due to proposed enrollment growth . In 2019-20, General Fund and tuition support for CSU would be $4 .6 billion and $3 .3 billion, respectively .
Ongoing Core Funding Would Increase by $404 Million (5.6 Percent). Figure 11 looks at only ongoing core funding for CSU, removing noncore and one-time funding . As with CSU’s overall budget, greater state General Fund support accounts for the bulk of the proposed increase in ongoing core funding . Year-over-year ongoing General Fund support would increase by $364 million (9 .2 percent) . Figure 12 shows the specific ongoing General Fund
spending increases the Governor proposes . The Governor links his proposed funding increases with an expectation that CSU not increase tuition in 2019-20 . On a per-student basis, ongoing core funding in 2019-20 would increase by $661 (3 .7 percent)—reaching $18,445 .
Governor Proposes $264 Million in One-Time Initiatives. The Governor’s budget package also contains three one-time initiatives for CSU . The largest is $247 million for CSU to undertake additional deferred maintenance projects or expand its campus child care facilities . Building off certain budget actions last year, the Governor also proposes $15 million to further CSU’s partnerships with social services agencies to address student food and housing insecurity . In addition, the Governor proposes $2 million for the Chancellor’s Office to conduct a study of a potential new campus in Stockton .
COMPENSATION AND OTHER OPERATIONAL COSTS
Below, we provide background on CSU employee compensation and other operating costs,
CSU Relies on Four Major Fund Sources
Other State Funds
Figure 10
FederalFunds
State General Fund
Core Funds
Noncore Funds
Student Tuition and Fee Revenue
2018-19
CSU Funds
gutter
analysis full

www.lao.ca.gov
2 0 1 9 - 2 0 B U D G E T
17
then describe the Governor’s associated proposals, assess those proposals, and identify issues for legislative consideration .
Background
Compensation Is the Largest Component of CSU’s Core Budget. Like other state agencies, salaries and benefits make up a significant share of CSU’s core budget (about 75 percent) . Compensation almost always represents CSU’s largest cost pressure each year .
Most CSU Employees Are Represented by a Union. Currently, CSU has more than 50,000 permanent employees across 23 campuses and the Chancellor’s Office . About 90 percent of these employees (primarily consisting of faculty and support staff) are represented, while the remaining 10 percent of employees (primarily consisting of managers and supervisors) are nonrepresented . Throughout the year, CSU also employs more than 15,000 student assistants and other temporary staff . These groups are not part of a bargaining unit .
Board of Trustees, Not the Legislature, Approves CSU Collective Bargaining Agreements. The California Department of Human Resources typically represents the Governor in labor negotiations between the state and its employees . The resulting bargaining agreements must be ratified by the Legislature before going into effect and the state directly funds the associated
cost of the agreements . In the case of CSU, state law gives the Board of Trustees authority to negotiate collective bargaining agreements . The Chancellor’s Office represents the Trustees during these negotiations and the resulting agreements must be ratified by the Trustees before going into effect . The Trustees are expected to manage the cost of these agreements within CSU’s overall budget . The Trustees also have delegated authority to the Chancellor and campus presidents to set salary levels for nonrepresented employees and any associated salary increases must be funded within CSU’s overall budget .
Figure 11
Ongoing Core Funding for CSU Increases Under Governor’s Budget(Dollars in Millions Except Funding Per Student)
2017-18 Actual
2018-19 Revised
2019-20 Proposed
Change From 2018-19
Amount Percent
State General Fund $3,713 $3,959 $4,324a $364 9.2%Tuition and Feesb 3,275 3,251 3,290 39 1.2Other State Fundsc 57 44 44 — —
Totals $7,046 $7,254 $7,657 $404 5.6%
FTE studentsd 410,060 407,867 415,133 7,266 1.8%Funding per student $17,182 $17,784 $18,445 $661 3.7%a In addition, Governor’s budget includes $7 million ongoing General Fund to the Department of Social Services for provision of legal services to
undocumented students and immigrants at CSU campuses. b Includes funds that CSU uses to provide tuition discounts and waivers to certain students. In 2019-20, CSU plans to provide $701 million in such aid.c Includes lottery funds and $2 million ongoing from the State Transportation Fund for transportation research. d One FTE represents 30 credit units for an undergraduate and 24 credit units for a graduate student. Includes resident and nonresident students. FTE = full-time equivalent.
Figure 12
Governor’s Budget Includes Six Ongoing General Fund Increases for CSU(In Millions)
Compensation and other operational costs $193.0Enrollment growth (2 percent) 62.0Graduation Initiative 45.0Pension costs 44.2Retiree health benefit costs 19.8Project Rebound 0.3
Total $364.2a
a In addition, the Governor’s budget proposes $7 million ongoing General Fund to the Department of Social Services for provision of legal services to undocumented students and immigrants at CSU campuses.
gutter
analysis full

L E G I S L A T I V E A N A L Y S T ’ S O F F I C E
2 0 1 9 - 2 0 B U D G E T
18
CSU Participates in CalPERS, Is Directly Responsible for a Share of Its Pension Costs. CalPERS administers pension benefits for CSU and most other state employees . Employer contributions to CalPERS are set by the CalPERS board . Historically, the state directly funded all of CSU’s employer costs in the annual budget . Several years ago, the state modified its approach to covering CSU pension costs . Under the new approach, CSU is to take into account pension costs when it makes new staffing and salary decisions . Any new pension costs incurred beyond the 2013-14 payroll level are CSU’s direct responsibility .
No Clear Expectation on How CSU Is to Cover Its Share of Pension Costs. In 2015-16 and 2016-17, the state provided sufficient unrestricted funding to CSU for it to cover its direct pension costs . In the last two fiscal years, CSU’s unrestricted augmentation has not been sufficient to cover all of its bargaining agreements and direct pension costs . CSU indicates it covered its direct pension costs these past two years by redirecting funds from other activities .
CalPERS Also Administers CSU’s Health Plans. Every year, CalPERS negotiates with health care providers to establish the premiums for the plans offered to state employees, including CSU employees . Like other state employers, CSU’s contribution amount to employee health benefits is determined by identifying the four health plans with the highest enrollment of state employees and calculating a weighted average of the premiums for these plans . Statute sets a default contribution level whereby CSU pays 100 percent of the average premium cost for employees and 90 percent of the average additional premium costs for dependents (known as the “100/90” formula) . Though the 100/90 formula is a default, statute permits CSU to collectively bargain a different formula for employees . (In practice, the 100/90 formula applies to nearly all CSU employees .) Each year when the average premium cost increases, CSU must cover the associated cost for its active employees . The state directly covers the associated cost for retired CSU employees .
Some CSU Workers Subject to State’s Minimum Wage Law. Like other employers,
CSU is subject to California’s minimum wage law . According to the Chancellor’s Office, only student assistants and other temporary staff earn the minimum wage at CSU . All other CSU employees (represented and nonrepresented) currently earn more than minimum wage . Chapter 4 of 2016 (SB 3, Leno) increases the statewide minimum wage over a period of several years, reaching $15 per hour by January 2022 .
Virtually All Represented Employees Currently Under Contract Through 2019-20. The CSU system has 13 represented employee groups . The largest group is the California Faculty Association (CFA), which represents more than 25,000 CSU faculty, librarians, counselors, and coaches . In November 2017, the Trustees ratified a contract with CFA that provides a 3 .5 percent general salary increase in November 2018, followed by a 2 .5 percent increase in July 2019 . In January 2017, the Trustees ratified an agreement with CSU’s second largest group (CSU Employees Union), which represents more than 15,000 employees across four bargaining units . Under the agreement, represented employees receive a 3 percent salary increase retroactive to 2017-18 and 3 percent increases in both 2018-19 and 2019-20 . Of the remaining eight bargaining units (which collectively represent less than one-quarter of CSU employees), seven have approved contracts in place through the end of 2019-20 . CSU’s approximately 300-member police association currently is the only bargaining unit with an open contract for 2019-20 .
Salary Costs for Represented and Nonrepresented Employees to Increase by $148 Million in 2019-20. CSU’s contract obligations for salary increases totaled $122 million in 2018-19 . The state effectively covered this cost by providing an unrestricted base augmentation of a like amount in the 2018-19 Budget Act . CSU estimates that these continuing bargaining agreements, coupled with a planned 3 percent salary increase for nonrepresented employees, will total $148 million in additional costs in 2019-20 .
CSU Has Identified Four Other Operational Cost Pressures. In addition to new salary costs in 2019-20, CSU has identified three other ongoing compensation-related cost increases:
gutter
analysis full

www.lao.ca.gov
2 0 1 9 - 2 0 B U D G E T
19
• $26 million attributed to retirement costs above CSU’s 2013-14 pensionable payroll level . (Of this amount, $14 million is associated with 2019-20, $5 million with 2018-19, and $7 million with 2017-18 . Though CSU redirected funds on a short-term basis to cover the prior-year amounts, it would like an ongoing increase to cover the costs moving forward .)
• $7 .3 million resulting from a 1 .3 percent increase in CalPERS-negotiated employer health care premium costs .
• $6 .8 million resulting from an increase in the state minimum wage from $11 to $12 per hour beginning January 2019 .
In addition to these operational costs, CSU is scheduled to open about 400,000 square feet of new facility space in 2019-20 . Based on past analysis, CSU estimates the cost to fund the regular operation of these facilities (such as utilities, general upkeep, and basic repairs) is $11 .75 per square foot . Based on this amount, CSU estimates that it will incur $4 .7 million in costs associated with this new space in the budget year .
Governor’s Proposal
Proposes $193 Million Ongoing for Compensation and Other Operational Costs. According to the administration, this amount is intended to cover CSU’s $148 million in higher salary costs, as well as its four other identified operational cost pressures . (The amount includes the $12 million CSU requested to cover its direct pension cost increases in 2017-18 and 2018-19 .)
Provides $64 Million Ongoing for Some Pension Costs and Retiree Health Care Costs. Due to higher CalPERS-determined employer contribution rates for 2019-20, the budget provides CSU a $44 million adjustment . This amount is based on CSU’s 2013-14 payroll level, per current policy . In addition, the budget provides a $20 million adjustment to cover higher health benefit costs for CSU retirees . This adjustment is due to an anticipated increase in the number of retirees in the budget year as well as higher premium costs .
Assessment
Recent Bargaining Agreements Generally Have Been More Favorable to CSU Employees Than Other State Employees. Though collective bargaining agreements vary among state bargaining units and strict comparisons among the agreements are difficult, represented CSU employees generally have received better terms than their state employee counterparts the past few years . This is because most state agreements are now requiring employees to pay a larger share of their pension and retiree health care costs . In contrast, CSU agreements have not been requiring these higher employee contributions . As a result, the roughly 3 percent annual salary increases that have been granted the past few years to CSU and other state workers are stretching farther for CSU workers .
Legislature May Want to Revisit Approach to Funding CSU Staffing and Pension Costs. The policy that the state enacted in 2013-14 is predicated on CSU being able to control any new staffing and salary decisions . One might hold this view given CSU is responsible for its bargaining agreements and the Legislature does not ratify them . Another perspective is that CSU has limited ability to control these costs given legislative expectations most years for CSU to grow enrollment, hire associated faculty, provide cost-of-living adjustments, and offer other salary enhancements . Going forward, the Legislature may want to revisit how prescriptive it wishes to be with CSU staffing decisions, including whether to fund all CSU pension costs directly or devolve full responsibility for these costs to CSU and its bargaining agreements .
Opportunity for Legislature to Signal Its Expectations on Future CSU Contracts. At a minimum, the Legislature has an opportunity to signal to the Chancellor’s Office what it thinks is reasonable to fund in bargaining contracts for 2020-21 . For example, the Legislature could signal its expectation that CSU salary increases be aligned with inflation . Prior to negotiations, the Legislature also could encourage the Chancellor’s Office to commission an analysis comparing CSU faculty and staff compensation levels with peer institutions . Such an analysis could include an
gutter
analysis full

L E G I S L A T I V E A N A L Y S T ’ S O F F I C E
2 0 1 9 - 2 0 B U D G E T
20
examination of employee retention rates and the extent to which campuses report having sufficient candidate pools for open positions . Considerations such as these could assist CSU and the Legislature in negotiating and funding new agreements .
ENROLLMENT GROWTH
Below, we provide background on the state’s eligibility policies and CSU enrollment levels, describe the Governor’s proposal to fund enrollment growth, and highlight factors for the Legislature to consider when deciding on an enrollment level for CSU in the budget year .
Background
Longstanding State Policies Determine Which Students Are Eligible to Attend CSU. Under the state’s 1960 Master Plan for Higher Education, community college students who complete their lower-division work with a minimum 2 .0 grade point average (GPA) are eligible to attend CSU as upper-division undergraduate students . The Master Plan limits freshman admission to CSU to the top one-third of high school graduates . To draw from the top 33 percent, CSU has historically structured its admission policies to require high school students to (1) complete a specified set of college-preparatory coursework and (2) attain a certain mix of high school GPA and standardized aptitude test scores (historically SAT or ACT scores) . Through periodic eligibility studies, CSU is able to determine if it is drawing its freshman admits from its Master Plan eligibility pool . If CSU is drawing from a smaller or larger pool, the state traditionally has expected CSU to adjust its admission requirements accordingly .
CSU Has Higher Admission Standards for Impacted Campuses and Programs. While CSU has minimum systemwide eligibility requirements for transfer and freshman applicants, some “impacted” campuses and programs (those with more student demand than available slots) adopt stricter admissions criteria . Currently, six campuses are fully impacted—having higher admissions criteria for all their programs . Most campuses have at least one impacted program, often nursing .
State Typically Sets Enrollment Growth Target and Funds Growth According to Per-Student Formula. In most years, the Legislature provides funding in the annual budget act to support a specified level of enrollment growth at CSU . The total amount of funding provided each year is based on the number of additional students the Legislature wants CSU to enroll multiplied by a per-student funding rate (derived by a “marginal cost” formula) . The formula takes into account the additional faculty, support services, and other resources that are required to serve each additional student . The per-student costs are shared by the state General Fund and student tuition revenue . In 2019-20, CSU’s marginal cost is $11,322 per FTE student, with a state share of $8,499 .
CSU Enrollment Is at an All-Time High. Figure 13 shows that resident enrollment levels at CSU have increased each year since 2010-11, growing at an average annual rate of about 2 percent over the period . In 2017-18, CSU enrolled 386,000 FTE students, about 30,000 more than campuses were serving in 2008-09 (its previous peak) .
Legislature Provided CSU One-Time Enrollment Growth Funding in 2018-19. Typically, the Legislature provides ongoing funding for enrollment growth . In a departure from traditional practice, the 2018-19 budget provided CSU with $120 million one time for enrollment growth . Provisional language permits CSU to spend these funds over a four-year period to support a student cohort of 3,641 FTE students (1 percent over the 2017-18 level) . For 2018-19, CSU has allocated $21 .9 million of the $120 million to campuses (representing 2,677 FTE students) . Campuses are using these funds for various purposes, including hiring temporary faculty to teach more course sections in spring 2019 .
Governor’s Proposal
Provides $62 Million Ongoing for 2 Percent Enrollment Growth. This amount would fund about 7,300 resident FTE students in 2019-20 . The administration has indicated its intention that this funding be for resident undergraduate students . In addition, CSU plans to use about $30 million of the $120 million in one-time funding the state provided
gutter
analysis full

www.lao.ca.gov
2 0 1 9 - 2 0 B U D G E T
21
in 2018-19 for enrollment growth . CSU intends to support about 3,600 additional FTE students in 2019-20 with these funds .
Assessment
Several Factors to Consider in Deciding Enrollment Growth. The Legislature has at least four key factors to consider when setting a CSU enrollment target, discussed below . Whereas most factors suggest enrollment growth funding may not be needed in the budget year, a few factors suggest that some level of enrollment growth may be justified .
Demographic Projections Show Decline in High School Graduates. The number of high school graduates in the state is expected to decrease by 0 .8 percent in 2018-19 . This means that, all other factors staying the same, enrollment demand for freshman slots in 2019-20 would decrease accordingly . High school graduates in 2019-20 also are projected to decrease (by 0 .4 percent) .
CSU Drawing From Notably Beyond Its Historic Eligibility Pool. The state’s most recent
eligibility study found that CSU has been drawing from beyond its Master Plan pool . Specifically, CSU in 2014-15 was drawing from the top 41 percent of high school graduates rather than the top one-third . Updated information from the California Department of Education on the proportion of high school graduates completing college-preparatory coursework (known as “A through G” courses) suggests that CSU likely is drawing from an even larger pool today . Despite this knowledge, CSU has not changed its freshman eligibility requirements in over a decade . Going forward, the Legislature will need to decide whether CSU should be permitted to continue drawing from such a large pool or whether its admissions criteria should be realigned with the Master Plan expectations . By taking a larger share of students than the Master Plan envisioned, CSU is drawing students away from community colleges, increasing CSU costs, and increasing the state’s overall cost to provide Californians with access to higher education .
CSU Reports Some Eligible Students Are Being Denied Access. Likely due in part to drawing beyond its traditional eligibility pool,
290,000
300,000
310,000
320,000
330,000
340,000
350,000
360,000
370,000
380,000
390,000
400,000
05-06 07-08 09-10 11-12 13-14 15-16 17-1806-07 08-09 10-11 12-13 14-15 16-17
Full-Time Equivalent Resident Students
After Dropping During the Last Recession, CSU Enrollment Has Reached an All-Time High
Figure 13
gutter
analysis full
L E G I S L A T I V E A N A L Y S T ’ S O F F I C E
2 0 1 9 - 2 0 B U D G E T
22
CSU indicates that about 19,000 freshman and 12,000 transfer applicants who met CSU’s eligibility requirements for fall 2018 were not accepted at any CSU campus to which they applied . (These students are commonly referred to as “denied eligible” students .) These students include an unknown mix of eligible students denied access to their local campus and eligible students applying to an out-of-region campus . Chancellor’s Office data indicates that most denied eligible students applied to just one CSU campus . Some of these students may have applied to and been accommodated by colleges in other segments (such as CCC, UC, or a private institution) .
New Redirection Policy Likely to Increase Enrollment. In response to legislative direction, CSU is implementing a redirection policy . Beginning in 2019-20, CSU will notify all denied eligible applicants of the opportunity to enroll in a CSU campus with capacity . Applicants will be informed of the available campuses and asked to select their first and second choice . CSU is unable to predict the impact of this new policy on its enrollment (take) rates . If 10 percent of the approximately 30,000 denied eligible students end up enrolling at CSU, it would mean about 3,000 additional students (headcount), or 2,500 FTE students, would need to be accommodated . CSU intends to use the second year of one-time enrollment monies the Legislature provided in 2018-19 to fund these redirected students . If redirected students have about a 10 percent take rate in 2019-20, CSU likely has enough funding for that cohort of students through 2021-22 . (Depending upon the results of the new policy, pressure could emerge in 2020-21 to fund another cohort of redirected students .)
GRADUATION INITIATIVE
Below, we provide background on CSU’s Graduation Initiative goals and activities, describe the Governor’s proposal to augment funding for the initiative, assess several issues related to the initiative, and make associated recommendations .
Background
CSU Is Seeking to Improve Graduation Rates. Historically, CSU’s six-year graduation rate for incoming freshmen has been below 50 percent and its four-year rate has been below 15 percent . To address its low graduation rates, CSU launched the Graduation Initiative in 2009 . CSU has set a goal to increase six- and four-year graduation rates for first-time freshmen to 70 percent and 40 percent, respectively, by 2025 . The Graduation Initiative also seeks to increase graduation rates for transfer students . In addition, CSU has a goal to eliminate achievement gaps among student groups .
CSU Is Currently Designating $198 Million Ongoing for the Graduation Initiative. Funding for this initiative has increased over the past few years, with a $75 million General Fund augmentation in 2018-19 . The Chancellor’s Office allocates almost all Graduation Initiative funds directly to campuses, reserving a small portion of funds (about $2 million) for systemwide coordination and technical assistance . While the Chancellor’s Office gives campuses flexibility on how to spend their allocation, most campuses have used their funds to hire additional faculty, offer more course sections in high-demand areas, and provide more student support services . The Chancellor’s Office reported in January 2019 that campuses used $75 million in 2017-18 to add more than 2,800 course sections, equating to about 80,000 new seats for students . In tandem with adding more course sections, the Chancellor’s Office reports that the system has been able to increase the average unit load for students from 13 .0 in fall 2015 to 13 .3 in fall 2018—equating to about 8,500 FTE students . In addition, a number of campuses report using funds to provide targeted outreach and support services to student groups with historically low graduation rates, including former foster youth and African American males .
CSU Is Revising Assessment and Remedial Policies for Incoming Freshmen. Historically, CSU has relied heavily on placement tests to assess students’ college readiness . In recent years, the Legislature has expressed concern with this practice, citing national research that suggests such tests routinely place students in remedial math and English classes when they could have
gutter
analysis full

www.lao.ca.gov
2 0 1 9 - 2 0 B U D G E T
23
succeeded in college-level coursework . A growing amount of research is finding that a better way to assess college readiness is to use multiple measures (typically data from students’ high school records) to place students . In an effort to improve student outcomes, the 2017-18 Budget Act included provisional language requiring the Trustees to adopt new assessment policies that include placing “significant weight” on incoming students’ high school grades in math and English . In August 2017, the Chancellor issued an executive order that requires campuses to discontinue using CSU’s math and English placement tests and instead rely on high school grades and other data (such as Smarter Balanced assessment results and SAT scores) to place students . In addition, the executive order limits the number of remedial (noncredit-bearing) units that academically underprepared students can be required to take and requires campuses to provide students with academic support (such as targeted tutoring) . CSU reports that campuses are designating some Graduation Initiative funds for professional development so faculty can redesign math and English curriculum for underprepared students and evaluate results .
CSU Is Also Seeking to Reduce Students’ Excess Unit Taking. Standard requirements for graduation typically total 120 semester units (180 quarter units) for a bachelor’s degree . Historically, CSU students have accumulated notably more units than required for graduation . CSU has identified a number of factors that likely have been contributing to excess unit accumulation, including insufficient access to the courses that students need to fulfill degree requirements and too few academic advisors . To help reduce excess unit taking, a number of campuses report that they are using data from students’ education plans to better inform which courses to offer each term . In addition, campuses have hired additional academic advisors and acquired technology-enhanced advising tools (known as “eAdvising”) .
Governor’s Proposal
Provides $45 Million Ongoing Augmentation for Graduation Initiative. This would bring ongoing funding for the Graduation Initiative to $243 million .
Though CSU does not have a specific spending plan for the additional funds, the Chancellor’s Office indicates campuses likely would use the bulk of the funds to hire additional faculty, offer more sections of high-demand courses, and provide more academic advising and other support services, particularly to students at risk of not graduating . These activities are similar to CSU’s current Graduation Initiative spending priorities .
Assessment
Graduation Rates Continue Upward Trajectory. As Figure 14 (see next page) shows, graduation rates have been increasing steadily over time for both first-time freshmen and transfer students . For first-time freshmen, both four-year and six-year graduation rates have shown improvement . For students transferring to CSU from a community college, both two-year and three-year graduation rates continue to increase .
Achievement Gaps Narrowing Slightly, With Much More Progress to Be Made. Historically, graduation rates for low-income students and students from other traditionally underrepresented groups have been significantly lower than other students . The most recent data shows the six-year gap in graduation rates between low-income and non-low-income students has declined slightly (narrowing from an 11 percentage point gap to a 10 percentage point gap) . Figure 15 (see next page) shows the six-year graduation gap between some racial/ethnic groups also was slightly smaller for the cohort entering in 2012 than the cohort that began six years earlier .
Excess Unit Taking Gradually Decreasing. Data indicates that the average number of units per CSU graduate is starting to decline . Figure 16 (see page 25) breaks out unit accumulation by freshman entrants and transfer students . Average unit accumulation among freshman entrants has fallen three of the past six years, with average unit accumulation down three units in 2017-18 compared with four years earlier . For transfer students, average unit accumulation did not begin decreasing until 2016-17, when it dropped one unit . Average unit accumulation for transfer students dropped another unit in 2017-18 .
gutter
analysis full

L E G I S L A T I V E A N A L Y S T ’ S O F F I C E
2 0 1 9 - 2 0 B U D G E T
24
CSU Graduation Rates Continue to Improve
10
20
30
40
50
60
70
80%
2000 2001 2002 2003 2004 2005 2006 2007 2008 2009 2010 2011 2012 2013 2014 2015 2016
Three-Year Rate for Transfers
Six-Year Rate for First-Time Freshmen
Two-Year Rate for Transfers
Four-Year Rate for First Time Freshmen
Figure 14
Cohort Rates
10
20
30
40
50
60
70
80
90%
2006 2007 2008 2009 2010 2011 2012
White
Asian
LatinoBlack
Six-Year Graduation Rates for First-Time Freshman Cohorts by Race/Ethnicity
Achievement Gaps Among Some Groups Are Narrowing Slightly
Figure 15
gutter
analysis full

www.lao.ca.gov
2 0 1 9 - 2 0 B U D G E T
25
Opportunities Exist for CSU to Further Reduce Excess Units. While CSU appears to be making some progress reducing excess unit taking, two institutional policies are working at cross purposes with CSU’s goal of improving timely graduation . First, students can receive a State University Grant (which covers tuition costs for qualifying financially needy students) for up to 150 semester units—one full year’s worth of units beyond what is typically required for a bachelor’s degree . By contrast, state law limits Cal Grants to four years of full-time attendance or the equivalent (120 semester units) . Second, Chancellor’s Office policy permits campuses to let students take courses multiple times to improve on previous grades . Most campuses allow students to take the same course up to three times . (Students repeat courses either because they previously failed the course or passed but received a C-minus or D grade .) Students typically are allowed to repeat up to 28 units of coursework in this way . The Chancellor’s Office allows campuses to adopt alternate course-repeat policies, and some campuses allow students to take the same course twice (rather than three times) .
Reducing Excess Unit Taking Would Have Benefits for Students and the State. Students who accrue more units than their degree requires generally take longer to graduate, generate higher costs for the state and themselves, and crowd out other students . In a January 2018 report, the Chancellor’s Office calculated that if all CSU graduates reduced their excess units by 1 unit, CSU could free up 1,333 additional course sections . Using this calculation, reducing excess unit taking by half (an average of about 10 semester units per graduate) would be the equivalent of freeing up more than 10,000 course sections—representing about 30,000 FTE students and $250 million in General Fund support for the system .
Recommendations
Place Key Expectations on Graduation Initiative Funding. Overall, CSU has shown improvement in a number of areas pertaining to student performance . If the Legislature chooses to continue supporting the Graduation Initiative going forward, we recommend it link funding for the initiative to an expectation that CSU continue to make progress on key student outcomes .
2011-12 2012-13 2013-14 2014-15 2015-16 2016-17 2017-18
Average Number of Semester Units Earned by Bachelor's Degree RecipientsCSU Seeing a Decline in Units Accumulated by Its Graduates
Figure 16
120
122
124
126
128
130
132
134
136
138
140
Freshman Entrants CCC Transfer Students
142
gutter
analysis full

L E G I S L A T I V E A N A L Y S T ’ S O F F I C E
2 0 1 9 - 2 0 B U D G E T
26
At a minimum, we recommend expecting CSU to continue: (1) improving four- and six-year graduation rates for first-time freshmen, (2) improving two- and three-year graduation rates for transfer students, (3) narrowing achievement gaps among student groups, and (4) reducing excess units .
Direct CSU to Align State University Grant With Cal Grant Unit Limit. To create a better incentive for students to avoid excess unit accumulation and maximize aid for other students who are on track, we recommend the Legislature direct CSU to limit institutional grants to no more than four years of full-time attendance or its equivalent . This modification would align CSU’s policy with the state’s policy for Cal Grants .
Direct Chancellor’s Office to Tighten Up Course-Repeat Policy. We recommend the Legislature direct the Chancellor’s Office to modify its systemwide policy on repeating courses . Specifically, we suggest systemwide policy limit students to taking the same course twice . Given that the Chancellor’s Office does not currently collect data on units accumulated due to course repetition, we further recommend the Legislature require CSU to report this data as part of its statutorily required annual performance report . The experience in other states suggests that course failures and repeats can significantly exacerbate excess unit taking . Moreover, by allowing struggling students to take the same course multiple times, campuses may be to contributing to students staying in a course or program that is inappropriate for them .
PROJECT REBOUND
Below, we provide background on the Project Rebound program, describe the Governor’s proposal to provide state support for the program, assess the proposal, and make an associated recommendation .
Background
Program Provides Outreach and Support Services to Formerly Incarcerated CSU Students. The purpose of Project Rebound is to help program participants enroll, stay on track,
graduate, and pursue a career after release from jail or prison . To that end, Project Rebound staff provide academic advising, personal counseling, mentoring, and other services to students . Project Rebound seeks to create a space for students with similar backgrounds to support each other .
Program Operated on One CSU Campus for Many Years, Recently Expanded to Eight Other Campuses. The program was founded in the late 1960s at San Francisco State University . Until 2016, no other CSU campus offered the program . In 2016, the Opportunity Institute, a nonprofit organization based in Berkeley, provided a total of $1 .7 million (spread over three years) for Project Rebound to expand to other campuses . The Chancellor’s Office provided $600,000 in one-time matching funds for the grant . Currently, 9 of CSU’s 23 campuses have a program . As of fall 2018, Project Rebound was serving a total of 295 students (headcount), the vast majority of whom were undergraduate students . According to the Chancellor’s Office, most program participants are transfer students . Many formerly incarcerated students find their way to the program after enrolling at CSU . Other program participants first learn about the program through outreach activities that program staff undertake at community colleges, correctional facilities, and elsewhere .
Project Rebound Is Staffed by a Mix of Full- and Part-Time Staff. Staffing size varies by campus, with generally between two and seven full- or part-time staff employed at each program . Several programs also employ part-time student assistants .
Program Outcome Data Are Limited but Appears to Be Promising. The Chancellor’s Office does not centrally collect data on graduation rates of Project Rebound students, and eight of CSU’s nine Project Rebound campuses have only been launched within the past three years . The Chancellor’s Office, however, recently conducted a survey of Project Rebound campuses . These campuses reported having a total of 119 program participants graduate in either 2016-17 or 2017-18 . Of that number, 104 students (87 percent) either found employment after graduating or enrolled in graduate school . According to the survey, none of the graduates have reoffended to date .
gutter
analysis full
www.lao.ca.gov
2 0 1 9 - 2 0 B U D G E T
27
Governor’s Proposal
Provides $250,000 Ongoing State Support for the Program. The administration’s intent is for CSU to expand the program to new campuses or increase program enrollment among the nine campuses currently operating Project Rebound . The administration does not have a detailed expenditure plan specifying how CSU is to use the state funding .
Assessment
Project Rebound Provides Support to a Group of Students Facing Notable Challenges. As nontraditional students, many Project Rebound participants report feeling doubt about whether they belong on a university campus and question whether they can succeed academically . Formerly incarcerated students also may be unfamiliar with using academic technology (such as how to use a course management system) . Additionally, given their criminal records, these students may need special assistance exploring the career options that are open to them . Project Rebound can help students address these kinds of issues .
CSU Serves Other Student Groups That Face Tough Challenges Too. In addition to formerly incarcerated students, campuses serve many other nontraditional students with unique needs . These include undocumented students, former foster care youth, military veterans transitioning back to civilian life, and students from historically underserved and educationally disadvantaged backgrounds . To succeed, these students may need additional support too, including mentorship, enhanced academic advising, personal counseling, and job counseling .
State and CSU Provide Funding for At-Risk Student Groups Through Graduation Initiative. As noted in the previous section, campuses use Graduation Initiative funds and general operating funds to address the unique needs of various student groups . Though specific priorities vary among campuses, campuses use these funds to provide additional support for former foster youth, African American males, veterans, and undocumented students, among other high-priority groups . Given that formerly incarcerated students
have many challenges too, this funding also is appropriate for supporting them .
Recommendation
Address Goals of Project Rebound by Leveraging Resources the State Already Provides. Given the state’s interest in rehabilitating offenders, the Legislature might agree with the Governor that serving this population of at-risk students is a high priority . The Legislature also might be encouraged by the success to date of Project Rebound participants . If so, we believe Project Rebound efforts would benefit more from leveraging larger existing pots of funding for student support than the very small Project Rebound augmentation proposed by the Governor . Specifically, to improve outreach and support services for formerly incarcerated students across the CSU system, the Legislature could encourage CSU to place a high priority on using Graduation Initiative funding for this purpose . To better monitor outcomes for this student group, the Legislature also may want to begin requiring the Chancellor’s Office to include this group in CSU’s regular performance reports . Specifically, these reports could begin including the number of students participating in Project Rebound programs, their graduation and recidivism rates, and the amount of Graduation Initiative and other funding campuses are providing to support these students .
FACILITIES
Below, we provide background on CSU capital outlay, describe CSU’s 2019-20 capital outlay proposals, describe the Governor’s proposal relating to deferred maintenance, and assess those proposals .
Background
Since 2014-15, CSU Has Been Authorized to Issue Its Own Bonds. Prior to 2014-15, the state sold bonds to support CSU’s academic facilities and paid the associated debt service . Beginning in 2014-15, the state altered this approach by authorizing CSU to begin issuing its own university bonds for academic facilities . In a related action, the 2014-15 budget package shifted $302 million
gutter
analysis full

L E G I S L A T I V E A N A L Y S T ’ S O F F I C E
2 0 1 9 - 2 0 B U D G E T
28
in ongoing base funding into CSU’s main support appropriation . The amount equated to what the state was paying for CSU debt service at the time . Moving forward, CSU is expected to pay off all debt—both for outstanding state bonds and any new university bonds—from its main General Fund appropriation . The new process limits the university to spending a maximum of 12 percent of its main General Fund appropriation on debt service and pay-as-you-go academic facility projects . By combining capital outlay and support into one CSU budget item, the state intended to incentivize CSU to weigh the trade-offs of supporting more operating costs (such as compensation increases and enrollment growth) with funding new capital projects .
Administration and Legislature Review CSU’s Project Proposals. Under the process now in place, CSU must notify the Legislature and receive approval from the administration on the projects it intends to pursue with its General Fund support . State law establishes the following project approval timeline:
• In December, CSU submits written documentation (commonly referred to as “capital outlay budget change proposals”) for review by the Legislature and administration .
• In February, the administration submits a list of projects it preliminarily approves to the Legislature .
• No sooner than April, the administration submits a final list of approved projects to the Legislature .
Under this process, the Legislature can influence which projects are undertaken by (1) signaling its broad infrastructure priorities to the administration and CSU, (2) conveying any concerns with specific project proposals during February and March legislative hearings, and (3) adjusting CSU’s General Fund appropriation to reflect changes in debt service costs or authorized pay-as-you-go projects .
CSU Has Identified Large Backlog of Deferred Maintenance. CSU recently contracted with a third party to visit and assess the condition of its academic buildings and infrastructure . Based primarily on that comprehensive assessment,
CSU has identified $3 .7 billion in building systems and components that have reached the end of their useful life and need to be replaced . The Chancellor’s Office maintains a campus-by-campus list of deferred maintenance needs and their associated costs . Identified deferred maintenance costs vary widely by campus, from $8 million at the Bakersfield campus to nearly $368 million at San Jose State University (the oldest campus in the CSU system) . Additionally, CSU estimates that it would need as a system to set aside $337 million annually to prevent its maintenance backlog from growing .
Past Deferred Maintenance Projects Have Been Funded Through Mix of Direct State Funding and CSU Bonds. Over the past five years, the state has been providing one-time General Fund appropriations to a number of state agencies, including CSU, to address deferred maintenance . Through 2018-19, these statewide initiatives have provided CSU a total of $145 million . In addition to these one-time funds, CSU uses university bonds to finance deferred maintenance projects . Whether funded with one-time General Fund or university bonds, CSU sometimes funds targeted deferred maintenance projects, such as replacing a heating, ventilation, and air conditioning system in a particular building . In other cases, particularly with the use of university bonds, CSU finances the renovation or replacement of an entire building that has many components beyond their useful life .
Proposals
CSU Proposes 18 Projects for 2019-20. Figure 17 lists these proposed projects . The first project shown consists of various infrastructure improvements throughout the CSU system . (Many of these improvements address campuses’ deferred maintenance .) The remaining 17 projects are campus-specific proposals to renovate an existing building, demolish an old building and replace it with a new one, construct a building addition, or construct a new building to add capacity . The $1 .5 billion in state costs for these projects would be covered with university bonds and some one-time state General Fund . The total cost of these projects is $1 .8 billion when campus
gutter
analysis full
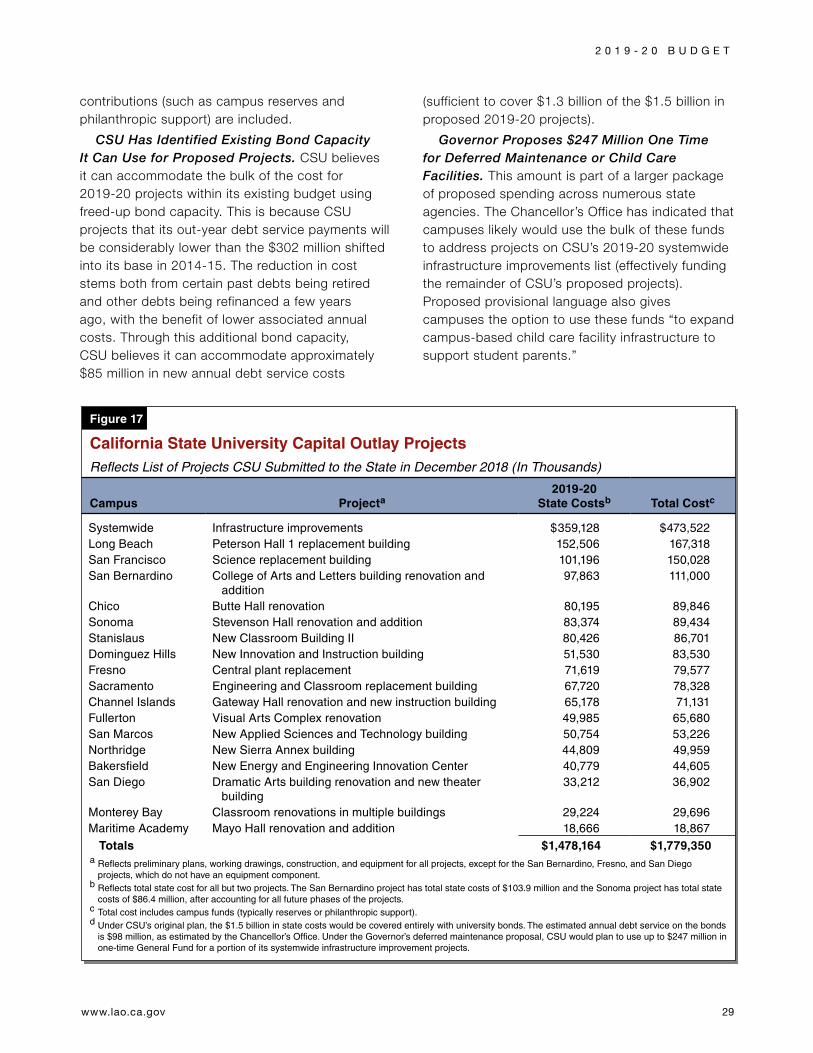
www.lao.ca.gov
2 0 1 9 - 2 0 B U D G E T
29
contributions (such as campus reserves and philanthropic support) are included .
CSU Has Identified Existing Bond Capacity It Can Use for Proposed Projects. CSU believes it can accommodate the bulk of the cost for 2019-20 projects within its existing budget using freed-up bond capacity . This is because CSU projects that its out-year debt service payments will be considerably lower than the $302 million shifted into its base in 2014-15 . The reduction in cost stems both from certain past debts being retired and other debts being refinanced a few years ago, with the benefit of lower associated annual costs . Through this additional bond capacity, CSU believes it can accommodate approximately $85 million in new annual debt service costs
(sufficient to cover $1 .3 billion of the $1 .5 billion in proposed 2019-20 projects) .
Governor Proposes $247 Million One Time for Deferred Maintenance or Child Care Facilities. This amount is part of a larger package of proposed spending across numerous state agencies . The Chancellor’s Office has indicated that campuses likely would use the bulk of these funds to address projects on CSU’s 2019-20 systemwide infrastructure improvements list (effectively funding the remainder of CSU’s proposed projects) . Proposed provisional language also gives campuses the option to use these funds “to expand campus-based child care facility infrastructure to support student parents .”
Figure 17
California State University Capital Outlay ProjectsReflects List of Projects CSU Submitted to the State in December 2018 (In Thousands)
Campus Projecta2019-20
State Costsb Total Costc
Systemwide Infrastructure improvements $359,128 $473,522 Long Beach Peterson Hall 1 replacement building 152,506 167,318San Francisco Science replacement building 101,196 150,028San Bernardino College of Arts and Letters building renovation and
addition97,863 111,000
Chico Butte Hall renovation 80,195 89,846Sonoma Stevenson Hall renovation and addition 83,374 89,434Stanislaus New Classroom Building II 80,426 86,701Dominguez Hills New Innovation and Instruction building 51,530 83,530Fresno Central plant replacement 71,619 79,577Sacramento Engineering and Classroom replacement building 67,720 78,328Channel Islands Gateway Hall renovation and new instruction building 65,178 71,131Fullerton Visual Arts Complex renovation 49,985 65,680San Marcos New Applied Sciences and Technology building 50,754 53,226Northridge New Sierra Annex building 44,809 49,959Bakersfield New Energy and Engineering Innovation Center 40,779 44,605San Diego Dramatic Arts building renovation and new theater
building33,212 36,902
Monterey Bay Classroom renovations in multiple buildings 29,224 29,696Maritime Academy Mayo Hall renovation and addition 18,666 18,867
Totals $1,478,164 $1,779,350a Reflects preliminary plans, working drawings, construction, and equipment for all projects, except for the San Bernardino, Fresno, and San Diego
projects, which do not have an equipment component. b Reflects total state cost for all but two projects. The San Bernardino project has total state costs of $103.9 million and the Sonoma project has total state
costs of $86.4 million, after accounting for all future phases of the projects. c Total cost includes campus funds (typically reserves or philanthropic support).d Under CSU’s original plan, the $1.5 billion in state costs would be covered entirely with university bonds. The estimated annual debt service on the bonds
is $98 million, as estimated by the Chancellor’s Office. Under the Governor’s deferred maintenance proposal, CSU would plan to use up to $247 million in one-time General Fund for a portion of its systemwide infrastructure improvement projects.
gutter
analysis full

L E G I S L A T I V E A N A L Y S T ’ S O F F I C E
2 0 1 9 - 2 0 B U D G E T
30
Assessment
Overall, Quality of CSU’s Capital Outlay Proposals Is an Improvement Over Last Year. In The 2018-19 Budget: Higher Education Analysis, we identified several serious deficiencies with CSU’s 2018-19 capital outlay requests and supporting documentation . As a result, we recommended the Legislature direct CSU to compile standard information, including stronger justification for each project, and resubmit its proposals . (The state ended up authorizing 5 of CSU’s 27 proposed projects last year .) In reviewing CSU’s 2019-20 project proposals, we generally find them to be of higher quality—containing more detail and better justification than last year . We do have concerns, however, with four proposed projects . We discuss these concerns below .
High Costs Not Justified for Long Beach Peterson Hall 1 Replacement Building. The Long Beach project entails demolishing the 39,800 assignable square feet (asf)/65,000 gross square feet (gsf) Peterson Hall 1 and two temporary faculty office buildings . CSU has identified these buildings, which are more than 50 years old, as in need of significant repair, energy efficiencies, and more flexible collaborative space for students and faculty . These buildings would be replaced with a notably larger 99,600 asf/153,200 gsf building . We have two concerns with this proposed project .
• Significant Increase in Cost Without Satisfying Explanation. The campus submitted a proposal for a nearly identical project in 2018-19 . At the time, the project was estimated to cost $130 million . Due to various concerns with the project, the state did not approve it last year . CSU has resubmitted the project for 2019-20 but with a new estimated cost of $167 million—a 28 percent cost increase in just one year . The proposal lacks an explanation as to why project costs have changed so significantly in such a short period of time .
• Less Costly Alternatives Likely to Exist. The proposal acknowledges that a replacement building would cost roughly 10 percent more than renovating the existing buildings . The proposal indicates that the less costly
renovation alternative was rejected . In its documentation, CSU indicates the option was rejected because the existing Peterson Hall 1 building is “utilitarian” and CSU would prefer a “signature facility to match the aspirations of the students and faculty that come to the campus .”
Given the significantly higher costs of the proposed project compared with last year and the higher cost of replacing rather than renovating the existing buildings, the Legislature may wish to have CSU address these issues and come back next year . At that time, CSU could either submit a revised project proposal or offer more compelling justification for the project as currently proposed .
Premature to Approve New Applied Sciences and Technology Building at San Marcos. The San Marcos project involves constructing a new 43,000 asf/69,000 gsf facility . The facility would, accommodate an additional 545 FTE students (70 FTE students in lecture space and 475 FTE students in laboratory space) and 35 faculty offices . We have three concerns with this project . First, the proposal is not clear as to which department or programs would be supported in the new facility . Some parts of the supporting documentation indicate the new building would house the biological sciences, chemistry and biochemistry, and physics departments . Other parts indicate the building is needed to accommodate two new engineering programs that the campus plans to add . Second, according to a recent report by the Chancellor’s Office, as of fall 2017 the campus is somewhat underutilizing its existing laboratory space . The proposal does not provide any analysis of why the campus needs to construct new laboratory space as opposed to more fully use the space it already has . Finally, the proposal does not provide any alternatives to constructing a new building, stating only that the “campus is currently studying alternatives .” Without a clear statement of the project’s purpose, justification of space needs, and a more thorough evaluation of alternatives, we believe state approval for this project is premature .
Space Proposed for New Energy and Engineering Innovation Center at Bakersfield Is Not Justified. This project entails construction
gutter
analysis full

www.lao.ca.gov
2 0 1 9 - 2 0 B U D G E T
31
of a new 36,000 asf/57,000 gsf building to house the physics and engineering departments, research space, teaching laboratories, office space, and a 240-seat auditorium . The project would accommodate an additional 730 FTE students (681 FTE students in lecture space and 49 FTE students in laboratory space) and 28 faculty offices . We have two concerns with this project . Our primary concern is that CSU has not justified the need for additional space, particularly lecture space . The Chancellor’s Office’s most recent facilities report indicates that the campus’ classroom utilization was 71 percent in fall 2017, the second lowest in the CSU system . Laboratory utilization also was below legislative guidelines, at 86 percent . Moreover, enrollment and capacity projections for the campus indicate overall facility utilization is likely to fall even further below legislative guidelines by 2025-26 (dropping to 68 percent) . Our other concern is that the proposal did not consider any alternatives . In the “Recommended Solutions” section of the proposal, the narrative states, “Only one solution was considered, that being construction of a new facility .” Given the considerable amount of current and projected excess space, we would expect the campus to have at least studied the option of repurposing available space in existing facilities to accommodate programmatic needs . Due to these concerns, we do not believe this proposal is justified at this time .
Trade-Offs to Consider for Theater Projects at San Diego. This proposal entails two theater-related projects . First, CSU proposes to renovate 12,300 asf/18,800 gsf of theater space within the campus’ Dramatic Arts building . The renovation project would address over $3 million in deferred maintenance issues and provide seating, restrooms, a lobby, and sound/light booth space that is accessible to persons with disabilities . These modifications would result in the loss of 150 seats in the theater, leaving 350 remaining seats . Second, CSU proposes to construct at an adjacent location a new 4,100 asf/6,600 gsf theater with 150 seats . The new theater would offset the loss of seats from the renovation project . CSU acknowledges that, based on findings from an earlier feasibility study, 350 seats is sufficient for the renovated
theater as the campus “rarely needs more than [that amount] for its largest performances .” By building a second theater, however, the campus would be able to stage “multiple simultaneous productions for music, dance and theater .” The proposal notes that an alternative would be to just renovate the existing theater without adding a second theater . This alternative would cost about $17 million less (about half the cost) of the combined renovation-and-new-theater proposal . In assessing this proposal, the Legislature may wish to weigh whether the benefit of having two theaters on campus that are available for simultaneous arts performances outweighs the additional cost and the other possible projects that could be supported with $17 million .
Recommend Providing Funds for Deferred Maintenance but Requiring Reporting and a Plan to Eliminate Backlog. We think that providing funds for deferred maintenance, as proposed by the Governor, is a prudent use of one-time funds . To promote transparency and legislative oversight of these funds, however, we recommend the Legislature require (1) CSU to report at spring hearings on the specific projects it plans to undertake and (2) the Department of Finance to report no later than January 1, 2023 on the status of the various CSU projects that were funded . In addition, we recommend the Legislature require CSU to submit by December 1, 2019 a long-term plan for eliminating its existing backlog of deferred maintenance . This plan should identify funding sources and propose a multiyear schedule of payments to retire the backlog . In addition, to prevent the backlog from growing or reemerging in future years, we recommend the Legislature work with CSU to identify ways to improve existing maintenance practices . For example, CSU could commit to setting aside the necessary level of funds for its scheduled maintenance or the state could earmark a like amount of funds directly in the annual budget act for that purpose .
Withhold Recommendation on Proposal to Use One-Time Funds for Campus Child Care Facilities. As of this writing, the administration had not provided any specific information on the Governor’s proposal to permit CSU to use some one-time facility funds for campus child care
gutter
analysis full
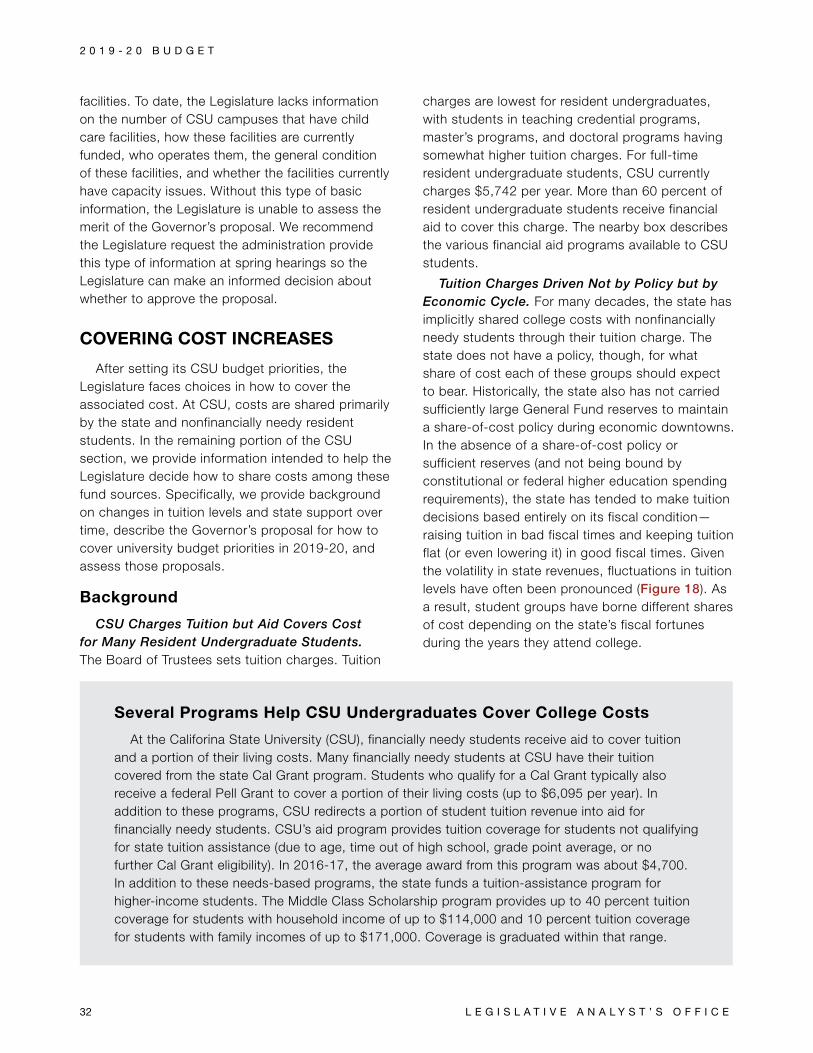
L E G I S L A T I V E A N A L Y S T ’ S O F F I C E
2 0 1 9 - 2 0 B U D G E T
32
facilities . To date, the Legislature lacks information on the number of CSU campuses that have child care facilities, how these facilities are currently funded, who operates them, the general condition of these facilities, and whether the facilities currently have capacity issues . Without this type of basic information, the Legislature is unable to assess the merit of the Governor’s proposal . We recommend the Legislature request the administration provide this type of information at spring hearings so the Legislature can make an informed decision about whether to approve the proposal .
COVERING COST INCREASES
After setting its CSU budget priorities, the Legislature faces choices in how to cover the associated cost . At CSU, costs are shared primarily by the state and nonfinancially needy resident students . In the remaining portion of the CSU section, we provide information intended to help the Legislature decide how to share costs among these fund sources . Specifically, we provide background on changes in tuition levels and state support over time, describe the Governor’s proposal for how to cover university budget priorities in 2019-20, and assess those proposals .
Background
CSU Charges Tuition but Aid Covers Cost for Many Resident Undergraduate Students. The Board of Trustees sets tuition charges . Tuition
charges are lowest for resident undergraduates, with students in teaching credential programs, master’s programs, and doctoral programs having somewhat higher tuition charges . For full-time resident undergraduate students, CSU currently charges $5,742 per year . More than 60 percent of resident undergraduate students receive financial aid to cover this charge . The nearby box describes the various financial aid programs available to CSU students .
Tuition Charges Driven Not by Policy but by Economic Cycle. For many decades, the state has implicitly shared college costs with nonfinancially needy students through their tuition charge . The state does not have a policy, though, for what share of cost each of these groups should expect to bear . Historically, the state also has not carried sufficiently large General Fund reserves to maintain a share-of-cost policy during economic downtowns . In the absence of a share-of-cost policy or sufficient reserves (and not being bound by constitutional or federal higher education spending requirements), the state has tended to make tuition decisions based entirely on its fiscal condition—raising tuition in bad fiscal times and keeping tuition flat (or even lowering it) in good fiscal times . Given the volatility in state revenues, fluctuations in tuition levels have often been pronounced (Figure 18) . As a result, student groups have borne different shares of cost depending on the state’s fiscal fortunes during the years they attend college .
Several Programs Help CSU Undergraduates Cover College Costs
At the Califorina State University (CSU), financially needy students receive aid to cover tuition and a portion of their living costs . Many financially needy students at CSU have their tuition covered from the state Cal Grant program . Students who qualify for a Cal Grant typically also receive a federal Pell Grant to cover a portion of their living costs (up to $6,095 per year) . In addition to these programs, CSU redirects a portion of student tuition revenue into aid for financially needy students . CSU’s aid program provides tuition coverage for students not qualifying for state tuition assistance (due to age, time out of high school, grade point average, or no further Cal Grant eligibility) . In 2016-17, the average award from this program was about $4,700 . In addition to these needs-based programs, the state funds a tuition-assistance program for higher-income students . The Middle Class Scholarship program provides up to 40 percent tuition coverage for students with household income of up to $114,000 and 10 percent tuition coverage for students with family incomes of up to $171,000 . Coverage is graduated within that range .
gutter
analysis full

www.lao.ca.gov
2 0 1 9 - 2 0 B U D G E T
33
CSU Generates Some Tuition and Fee Revenue From Nonresident Students. Nonresident students attending CSU pay the base tuition amount charged to resident students as well as a supplemental tuition charge . Nonresident undergraduate students attending full time currently pay a $11,880 supplemental charge . For 2018-19, we estimate that CSU is generating $412 million revenue from the tuition and supplemental fee that nonresident students pay .
State Still Comprises Largest Share of Core Funds. We estimate the state’s current share of core funds at CSU is 70 percent . This share includes direct General Fund and lottery support that the state annually provides CSU as well as state-funded tuition coverage provided to CSU students . Through this state support, financially needy resident students have all of their education costs covered . Of the remaining portion of core funding, we estimate that nonfinancially needy resident students contribute 23 percent and nonresident students contribute 7 percent . Figure 19 (see next page) shows that the state’s share declined during the economic downtown, but has since rebounded . As the figure shows, the state’s current share is virtually the same as in 2008-09 . Meanwhile, students’ share increased during the recession but has declined in recent years .
Proposals
Governor Proposes No Tuition Increase, With State Covering Proposed Cost Increases. The Governor expects CSU not to increase resident tuition in 2019-20 . To create a strong incentive for CSU to hold resident tuition charges flat, the Governor proposes to retain budget
provisional language that effectively triggers a reduction in General Fund support if the Board of Trustees adopts a tuition increase for the coming academic year . The language ties the General Fund reduction to the additional Cal Grant and Middle Class Scholarship costs associated with the tuition increase, thereby making CSU’s action fiscally neutral to the state . The Governor is proposing to cover virtually all of his identified proposed cost increases with state support . In the Governor’s Budget Summary, the Governor also expresses a desire to work with CSU to provide fiscal certainty for students and their households moving forward .
Tuition Levels at CSU Tend to Follow the Economic Cycle
Figure 18
Change From Prior Year, Systemwide Tuition for Resident Undergraduates
-5
5
10
15
20
25
30
35
40%
1990-91 1994-95 1999-00 2004-05 2009-10 2014-15 2018-19-10
gutter
analysis full
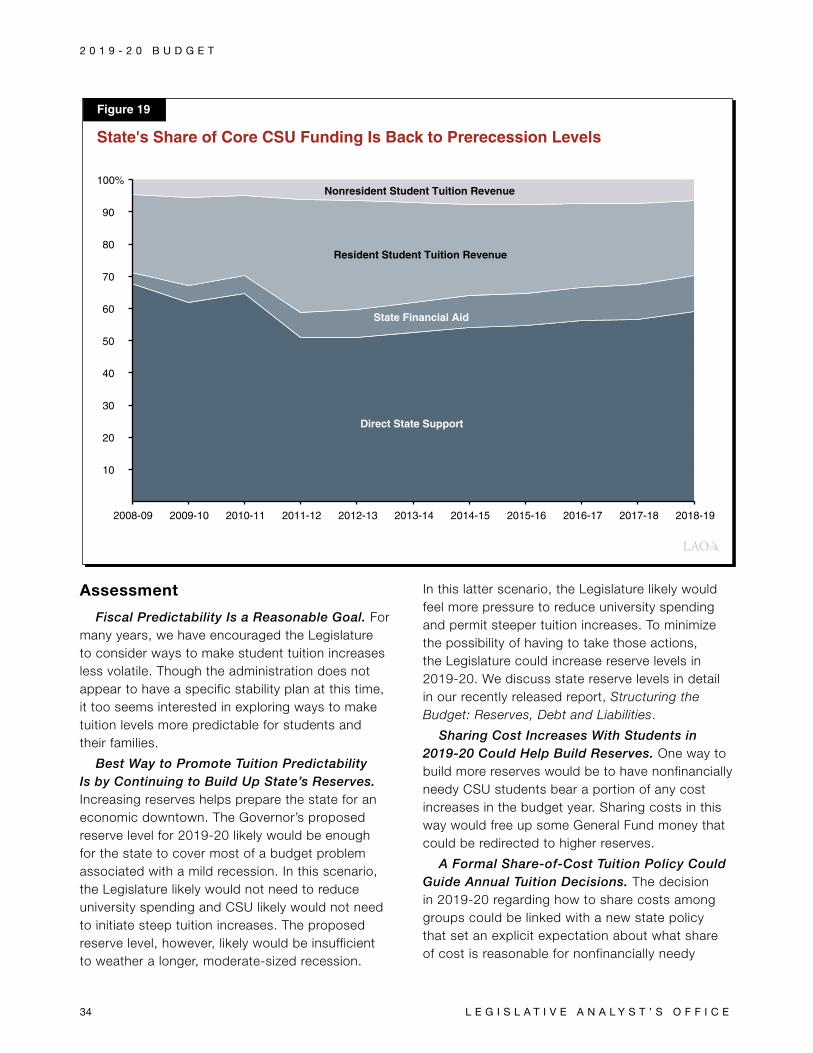
L E G I S L A T I V E A N A L Y S T ’ S O F F I C E
2 0 1 9 - 2 0 B U D G E T
34
Assessment
Fiscal Predictability Is a Reasonable Goal. For many years, we have encouraged the Legislature to consider ways to make student tuition increases less volatile . Though the administration does not appear to have a specific stability plan at this time, it too seems interested in exploring ways to make tuition levels more predictable for students and their families .
Best Way to Promote Tuition Predictability Is by Continuing to Build Up State’s Reserves. Increasing reserves helps prepare the state for an economic downtown . The Governor’s proposed reserve level for 2019-20 likely would be enough for the state to cover most of a budget problem associated with a mild recession . In this scenario, the Legislature likely would not need to reduce university spending and CSU likely would not need to initiate steep tuition increases . The proposed reserve level, however, likely would be insufficient to weather a longer, moderate-sized recession .
In this latter scenario, the Legislature likely would feel more pressure to reduce university spending and permit steeper tuition increases . To minimize the possibility of having to take those actions, the Legislature could increase reserve levels in 2019-20 . We discuss state reserve levels in detail in our recently released report, Structuring the Budget: Reserves, Debt and Liabilities .
Sharing Cost Increases With Students in 2019-20 Could Help Build Reserves. One way to build more reserves would be to have nonfinancially needy CSU students bear a portion of any cost increases in the budget year . Sharing costs in this way would free up some General Fund money that could be redirected to higher reserves .
A Formal Share-of-Cost Tuition Policy Could Guide Annual Tuition Decisions. The decision in 2019-20 regarding how to share costs among groups could be linked with a new state policy that set an explicit expectation about what share of cost is reasonable for nonfinancially needy
10
20
30
40
50
60
70
80
90
100%
2008-09 2009-10 2010-11 2011-12 2012-13 2013-14 2014-15 2015-16 2016-17 2017-18 2018-19
Nonresident Student Tuition Revenue
Resident Student Tuition Revenue
State Financial Aid
Direct State Support
State's Share of Core CSU Funding Is Back to Prerecession Levels
Figure 19
gutter
analysis full

www.lao.ca.gov
2 0 1 9 - 2 0 B U D G E T
35
students to bear . A share-of-cost policy would give the Board of Trustees and the Legislature a transparent rationale for setting tuition levels each year . Though the Governor does not set an explicit share-of-cost expectation, his approach of covering costs solely from the General Fund implies the current share of cost for nonfinancially needy students is too high . Under the Governor’s proposal, these students’ share of cost would drop from an estimated 23 percent in 2018-19 to
21 percent in 2019-20 . If the Legislature wanted to build higher reserves in 2019-20 and share cost increases with nonfinancially needy students, it could keep these students’ share at 23 percent . Alternatively, the Legislature could choose to set a higher or lower share of cost as a policy target . The overriding goal in setting an explicit target would be to treat cohorts of students similarly—whether they happen to enter college during an economic recovery or recession .
UNIVERSITY OF CALIFORNIA
In this section, we provide an overview of UC’s budget, then assess the Governor’s proposals to fund (1) compensation and other operational cost increases; (2) enrollment growth; (3) student success initiatives; (4) extended education; and (5) facility maintenance, renovation, and construction . We conclude by discussing options for how the Legislature might cover the costs associated with these budget priorities or other priorities it identifies .
OVERVIEW
UC Estimated to Receive $36.5 Billion From All Sources in 2018-19. As Figure 20 shows, one quarter of UC funding comes from core funds (primarily General Fund and student tuition revenue) that support the university’s educational programs . The remainder of UC funding comes primarily from its five medical centers, sales and services (including housing, bookstores, and extended education) and the federal government (primarily for research and student financial aid) .
Governor’s Budget Assumes $1.7 Billion (4.7 Percent) Increase in Total Funding in
2019-20. As Figure 21 (see next page) shows, the Governor’s budget assumes nearly half of this increase would come from UC’s five medical
UC Relies on Many Fund Sources
Figure 20
Core Funds
Other Funds
State General Fund
Student Tuitiona
Medical Centers
Sales andServices
Federal
PrivateOther
Total Funds of $36.5 Billion, 2018-19
a Includes Student Services Fee and a small amount of other core funds (lottery, a portion of overhead on federal research contracts, and a portion of patent royalty income).
gutter
analysis full

L E G I S L A T I V E A N A L Y S T ’ S O F F I C E
2 0 1 9 - 2 0 B U D G E T
36
centers, reflecting a 7 percent increase in hospital revenues over the revised 2018-19 level . The Governor also assumes sizeable increases in sales and services (5 .3 percent) and privately donated funds (8 .4 percent) . Total core funding would grow more slowly . In 2019-20, core funding would increase $184 million (2 .0 percent)—rising to $9 .5 billion .
Provides $299 Million (3.3 Percent) Increase in Ongoing Core Funding. As Figure 22 shows, most of the increase in ongoing core support would come from the state General Fund, with a smaller portion coming from student tuition and fee revenue . The increase in tuition and fee revenue is based on projected growth in nonresident enrollment coupled with a proposed increase in nonresident supplemental tuition . The Governor ties his proposed General Fund increase to UC not
Some UC Fund Sources Projected to Grow Notably
Figure 21
Medical CentersSales and Services
Core Funds
Other Funds
Private
State General Fund
Student TuitionaOther
Growth of $1.7 Billion, 2018-19 to 2019-20
a Includes Student Services Fee and a small amount of other core funds (lottery, a portion of overhead on federal research grants, and a portion of patent royalty income).
Figure 22
State Covers Bulk of Proposed Increase in Ongoing Core Funds for UC(Dollars in Millions Except Funding Per Student)
2017-18 Actual
2018-19 Revised
2019-20 Proposed
Change From 2018-19
Amount Percent
State General Fund $3,367 $3,475 $3,715 $240 6.9%Student tuition and fee revenue 5,012 5,206 5,269 63 1.2Lottery 43 27 27 —a -0.1Other core fundsb 388 384 381 -3 -0.9
Totals $8,811 $9,093 $9,393 $299 3.3%
FTE studentsc 272,104 279,002 279,802 800 0.3%Funding per student $32,381 $32,593 $33,569 $977 3.0a Less than $500,000.b Includes a portion of overhead on federal and state grants, a portion of patent royalty income, and Proposition 56 funding designated for graduate
medical education.c One FTE represents 30 credit units for an undergraduate and 24 credit units for a graduate student. Includes resident and nonresident students. FTE = full-time equivalent.
gutter
analysis full

www.lao.ca.gov
2 0 1 9 - 2 0 B U D G E T
37
increasing resident tuition or the Student Services Fee in 2019-20 .
Ties General Fund Increases to Specific Priorities. Figure 23 shows the specific ongoing General Fund spending increases the Governor proposes for UC . Half of the ongoing increase would be for certain compensation and operational cost increases, with the remainder for student success initiatives, sustaining enrollment growth from the previous year, and various other priorities . In contrast to the General Fund, the administration does not set expectations regarding the use of additional nonresident tuition and fee revenue .
Funds Two One-Time Initiatives. In addition to the proposed ongoing augmentations, the Governor provides a total of $153 million General Fund for two one-time initiatives . The largest one-time proposal is $138 million to support deferred maintenance projects across the system . The remaining $15 million would provide start-up funding for UC extended education programs . These one-time funds are intended to establish degree completion programs and other course-taking opportunities for adults who have some college experience but no degree .
COMPENSATION AND OTHER OPERATIONAL COSTS
Below, we provide background on UC employee compensation and other operational costs, describe the Governor’s associated proposals, and assess those proposals .
Background
Compensation Is the Largest Component of UC’s Core Budget. Like most state and educational agencies, salaries and benefits comprise a significant share of UC’s budget . In 2017-18, 67 percent of UC’s core budget was for salaries and benefits . The remaining share of UC’s budget was for equipment and utilities (17 percent) and student financial aid (16 percent) .
A Portion of UC Employees Are Supported by Core Funds. In 2017-18, UC employed 159,000 FTE faculty and staff, of which 41,000 (26 percent) were supported by core funds . Core funds support faculty, librarians, academic advisors, and other
academic employees . Noncore funds generally cover staff, such as medical center employees and dining services staff, who are involved in other aspects of the university’s operations . In some cases, UC uses a mix of funds to support employees who oversee both core and noncore functions of the university . For example, UC uses a mix of core funds, federal grants, and private philanthropy to pay graduate teaching assistants and research assistants .
Many UC Employees Are Not Represented by a Union. Tenured and tenure-track faculty at UC, along with many academic administrators and certain other employees, are not represented by a union . Approximately one-third of UC employees who are supported by core funds are represented by a union . These employees are members of one of 13 systemwide bargaining units . Examples of represented employees include lecturers, teaching assistants, librarians, clerical workers, and custodial staff .
UC, Rather Than Legislature, Approves Compensation Increases. Unlike most other state agencies, state law grants the UC Board of Regents authority to negotiate collective bargaining agreements directly with its employee unions . The Office of the President represents the board during these negotiations and the resulting agreements must be ratified by the board . (As with CSU’s bargaining agreements, the Legislature does not ratify UC’s bargaining agreements .) The board also grants the UC President authority
Figure 23
Governor Sets Priorities for UC Ongoing General Fund Increases(In Millions)
Operational cost increases $120Student success initiatives 50Graduate medical educationa 40Student food and housing initiatives 15Additional enrollment in 2018-19 10Student mental health services 5
Total $240a Proposal effectively allows a like amount of Proposition 56 funds to
support physician residency programs on an ongoing basis.
gutter
analysis full

L E G I S L A T I V E A N A L Y S T ’ S O F F I C E
2 0 1 9 - 2 0 B U D G E T
38
to determine compensation increases for nonrepresented employees . The President typically determines compensation increases for tenured and tenure-track faculty after consulting with the Academic Senate .
UC Also Determines Employee and Retiree Health Benefits. In addition to setting salary increases, UC operates its own health benefit programs for current employees and retirees . Under the program, the Office of the President negotiates premiums with health care providers . The Board of Regents, in turn, adopts policies establishing what share of premium costs UC and its employees each pay . Under existing policy, UC’s share of premium costs depends on the employees’ health plan and salary level . On average, UC estimates it covers 87 percent of premium costs for active employees . For retirees, the maximum UC share of premium costs is 70 percent .
UC Operates Its Own Pension Program. UC’s pension program is known as the UC Retirement Program . Like most other state employees, UC pensions are based on employees’ salary and years of service upon retiring . The Board of Regents oversees UC’s pension program and is responsible for determining benefits, establishing the plan’s funding policy, and setting contribution rates .
In Recent Years, State Has Mostly Supported Compensation Costs With Unrestricted Increases. Because of UC’s substantial control over its staffing and compensation costs, the state is not required to cover compensation decisions made by the Board of Regents . Nonetheless, the Legislature historically has recognized UC’s compensation-related cost pressures . Consistent with past practice, the state in recent years has generally provided unrestricted, ongoing General Fund augmentations to help UC cover these costs .
UC Also Incurs Operational Costs for Equipment and Utilities. In addition to compensation decisions, the university purchases equipment that supports its operations . Academic-related equipment includes laboratory supplies, computers, and library materials . Campuses also have utility costs . Similar to compensation, equipment and utility costs that are not related to the university’s academic mission are supported by noncore funds .
Proposal
Proposes $120 Million for Certain Compensation and Operational Cost Increases. The Governor proposes to fund several operational components of UC’s budget request . As Figure 24 shows, the largest single component supports utility and equipment cost increases . For planning purposes, UC assumes this portion of its budget will grow roughly at the rate of inflation . The next largest component supports negotiated salary increases for represented employees . According to the university, the anticipated cost increase reflects a mix of final contracts and contracts that are still under negotiation . The remaining increase would cover projected cost increases for UC’s employee health, pension, and retiree health programs . The increase relating to health benefits is due to an anticipated 4 percent increase in premium costs, as well as growth in the number of retirees . Pension cost increases are based on projected growth in payroll .
Governor’s Budget Does Not Provide Funding for Nonrepresented Employee Salary Increases. The Department of Finance has offered two explanations as to why the administration chose not to support salary increases for tenured and tenure-track faculty and other nonrepresented staff . First, it notes that UC’s budget request described compensation increases for these employees as a lower priority compared with increases for represented employees and covering benefit costs . The lower prioritization is because nonrepresented employees do not receive salary increases under contract . Second, the administration notes that UC
Figure 24
Governor Proposes Funding Certain UC Operational Cost Increases(In Millions)
Operating expenses and equipment $41Salary increases for represented employees 30Health benefit cost increases 21Pension benefit cost increases 20Retiree health cost increases 7
Total $120
gutter
analysis full

www.lao.ca.gov
2 0 1 9 - 2 0 B U D G E T
39
identified some nonstate funds in its budget request that could be used to address additional priorities, such as salary increases for these employees .
Assessment
Funding a Few Key Operational Cost Increases Is a Reasonable Starting Point. Absent making changes to its existing policies, UC very likely will face cost increases in the budget year for its health and pension benefits . It also likely will face cost increases for its equipment purchases and utilities . The state may want to start its UC budget planning by recognizing these cost increases .
Recommend Considering Recruitment and Retention Issues When Making Compensation Decisions. With regard to whether to provide compensation increases in the budget year, we encourage the Legislature to consider UC’s ability to recruit and retain employees—whether they are represented or nonrepresented . At a minimum, the Legislature could consider UC’s ability to attract top candidates to open positions, retain existing employees, and offer competitive compensation . If UC is able to recruit top candidates and retain tenured and tenure-track faculty but not represented staff, for example, the Legislature might agree with the Governor’s proposal to prioritize additional funding for represented employees . Alternatively, the Legislature might wish to target compensation increases toward different groups or provide higher or lower compensation increases . At the time of this analysis, UC was not able to provide data on these key indicators to our office . As we note in the box on page 40, however, some data suggest UC is competitive in recruiting faculty .
ENROLLMENT GROWTH
Below, we provide background on UC eligibility and admission policies, the state’s approach to budgeting for enrollment growth, recent enrollment trends, and the state’s expectations regarding enrollment growth in 2018-19 . We then describe the Governor’s proposal to sustain a portion of 2018-19 enrollment growth . Next, we assess the proposal and offer associated recommendations .
Background
State Policy Determines Which Students Are Eligible to Attend UC. Under longstanding state policy, UC is expected to draw from the top 12 .5 percent of California high school graduates for freshman admission . Historically, UC has set its admission criteria to align with this freshman eligibility pool . Specifically, UC traditionally has required completion of a set of college preparatory work, certain grades in those courses, and certain scores on standardized tests . In past years, UC typically adjusted its admission criteria in response to freshman eligibility studies, with UC tightening its criteria if found to be drawing from a pool larger than 12 .5 percent of high school graduates and loosening its criteria if drawing from a smaller pool . Students who do not qualify for admission as freshmen can still become eligible for transfer admission if they complete their lower-division coursework at a community college with a minimum 2 .4 grade point average .
Eligible Students Have Access to UC System, Not First-Choice Campus. For both freshman and transfer applicants, eligibility guarantees admission to the UC system but not to a particular campus . When applicants are not admitted to their campus of choice, UC refers them to less-selective campuses . Currently, Merced serves as the referral campus for freshman applicants, whereas both Riverside and Merced serve as referral campuses for transfer applicants .
State Budget Traditionally Includes Enrollment Targets and Provides Ongoing Funds to Support Growth. The state typically sets enrollment targets for UC in the annual budget act . Similar to CSU, the state typically covers the cost of enrollment growth at UC using a formula that is linked to the marginal cost of instruction . The formula estimates the cost to hire new faculty and teaching assistants, purchase instructional equipment, and cover other ongoing costs to support new students . The total cost is then shared between the state General Fund and student tuition revenue . In 2018-19, the marginal cost of instruction was $18,900 per student, with a state share of $10,000 .
gutter
analysis full
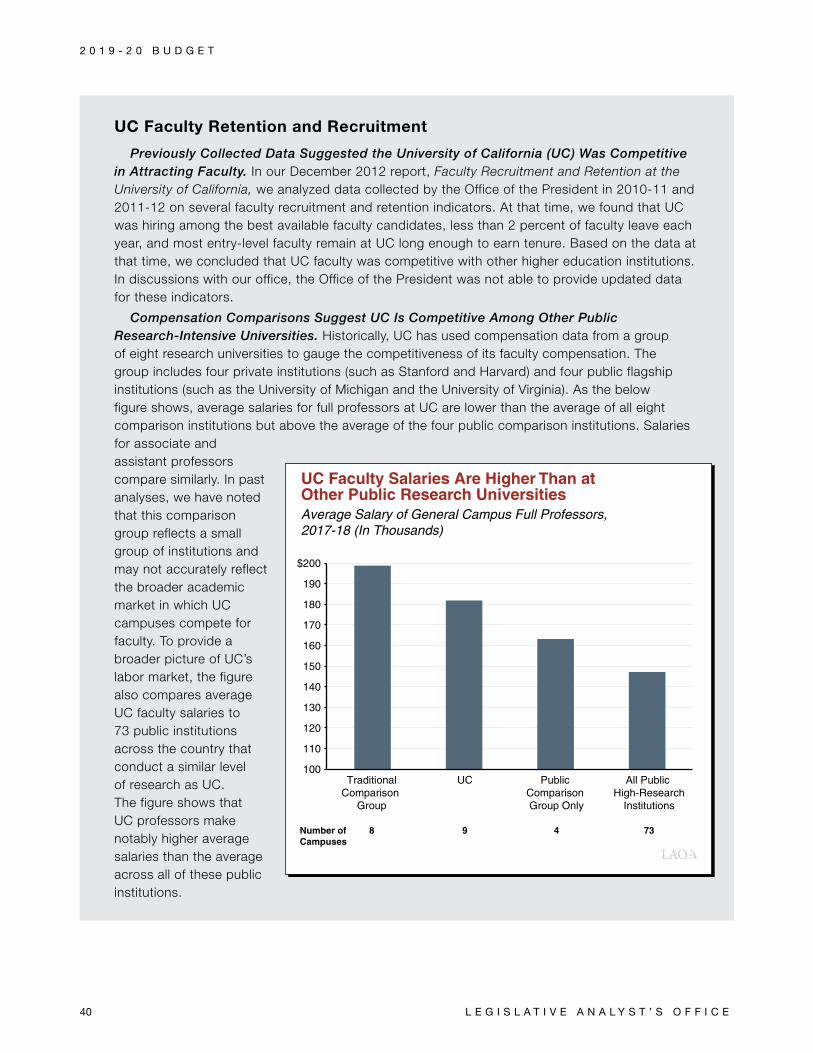
L E G I S L A T I V E A N A L Y S T ’ S O F F I C E
2 0 1 9 - 2 0 B U D G E T
40
UC Faculty Retention and Recruitment
Previously Collected Data Suggested the University of California (UC) Was Competitive in Attracting Faculty. In our December 2012 report, Faculty Recruitment and Retention at the University of California, we analyzed data collected by the Office of the President in 2010-11 and 2011-12 on several faculty recruitment and retention indicators . At that time, we found that UC was hiring among the best available faculty candidates, less than 2 percent of faculty leave each year, and most entry-level faculty remain at UC long enough to earn tenure . Based on the data at that time, we concluded that UC faculty was competitive with other higher education institutions . In discussions with our office, the Office of the President was not able to provide updated data for these indicators .
Compensation Comparisons Suggest UC Is Competitive Among Other Public Research-Intensive Universities. Historically, UC has used compensation data from a group of eight research universities to gauge the competitiveness of its faculty compensation . The group includes four private institutions (such as Stanford and Harvard) and four public flagship institutions (such as the University of Michigan and the University of Virginia) . As the below figure shows, average salaries for full professors at UC are lower than the average of all eight comparison institutions but above the average of the four public comparison institutions . Salaries for associate and assistant professors compare similarly . In past analyses, we have noted that this comparison group reflects a small group of institutions and may not accurately reflect the broader academic market in which UC campuses compete for faculty . To provide a broader picture of UC’s labor market, the figure also compares average UC faculty salaries to 73 public institutions across the country that conduct a similar level of research as UC . The figure shows that UC professors make notably higher average salaries than the average across all of these public institutions .
UC Faculty Salaries Are Higher Than at Other Public Research UniversitiesAverage Salary of General Campus Full Professors, 2017-18 (In Thousands)
Number of Campuses
8 9 4 73
100
110
120
130
140
150
160
170
180
190
$200
TraditionalComparison
Group
UC Public Comparison Group Only
All Public High-Research
Institutions
gutter
analysis full

www.lao.ca.gov
2 0 1 9 - 2 0 B U D G E T
41
State Recently Started Setting Enrollment Expectations for the Following School Year. Traditionally, the state has set enrollment expectations for the academic year starting a few months after budget enactment . For example, the 2007-08 budget set an enrollment target for the 2007-08 academic year . This traditional approach does not align well with the timing of UC admission decisions . UC makes most admission decisions for the coming academic year in early spring, prior to enactment of the state budget in June . This means the state budget is enacted too late to influence UC’s admission decisions that year . To have a more significant influence on UC’s admission decisions, the state has begun setting enrollment expectations for the following academic year . In the 2015-16 budget, for example, the state set UC enrollment expectations for the 2016-17 academic year . Subsequent budgets in 2016-17 and 2017-18 continued the practice of setting enrollment targets one year in advance .
UC Resident Undergraduate Enrollment Increasing. From 2008-09 to 2015-16, resident undergraduate enrollment at UC hovered between 170,000 and 175,000 FTE students (Figure 25) . UC’s enrollment trend changed notably beginning in 2016-17 . In each of the past three years, UC has exceeded its enrollment targets . The state has counted the over-target students as part of UC’s enrollment base when setting its growth target for the following year . (Though the state has reset the base to reflect the higher-than-expected growth, it has not funded UC directly for the over-target students .) In 2018-19, resident undergraduate enrollment is at an all-time high of 189,000 FTE students .
State Used Mix of Ongoing and One-Time Funds to Support Enrollment Growth in 2018-19. Last year, the state departed from
the practice it had used the past three years and did not set a 2019-20 enrollment target . Instead, it set an expectation that UC meet a higher growth target in 2018-19 than initially set in the 2017-18 Budget Act . Accounting for growth funded in both the 2017-18 and 2018-19 budgets, the total enrollment target in 2018-19 was 2,000 resident FTE undergraduate students . The state identified $20 million in ongoing funds to support this growth (based on the marginal cost of instruction) . The 2018-19 budget also included $105 million in one-time funding for UC . Provisional language specified legislative intent that UC use the one-time funding to enroll additional resident undergraduate students as well as fund services and programs that improve student outcomes . The language did not specify the number of additional students UC was expected to enroll with the one-time funds .
UC Enrollment Level Is at All-Time High
Figure 25
Full-Time Equivalent Resident Undergraduate Students
150,000
155,000
160,000
165,000
170,000
175,000
180,000
185,000
190,000
2008-09 10-11 12-13 14-15 16-17 18-19
Target
Actual
09-10 11-12 13-14 15-16 17-18
gutter
analysis full

L E G I S L A T I V E A N A L Y S T ’ S O F F I C E
2 0 1 9 - 2 0 B U D G E T
42
UC Currently Estimates Substantial Enrollment Growth in 2018-19. As of January 2019, UC estimates resident undergraduate enrollment is growing in 2018-19 by 3,900 FTE students . This amount is 1,900 more FTE students than explicitly expected by the state that year . According to UC, the additional growth was largely unplanned and the result of campuses under-predicting the percent of applicants who would accept an admission offer . In conversations with our office, staff at the Office of the President indicate that at least some of the one-time $105 million General Fund provided in 2018-19 is being used to support the additional enrollment growth .
Proposal
Proposes $10 Million Ongoing to Sustain a Portion of 2018-19 Enrollment Growth. According to the Department of Finance, the $10 million would support an additional 1,000 FTE students above the explicit 2018-19 enrollment target . The $10 million is based on a $10,000 per-student state rate using the marginal cost of instruction . Effectively, the funds would support a little more than half of the additional 1,900 students UC is enrolling this academic year .
Does Not Propose Enrollment Targets for Coming Few Years. The Governor does not propose enrollment targets or enrollment growth funding for either 2019-20 or 2020-21 .
Assessment
Language Guiding Use of One-Time Funding in 2018-19 Is Confusing. Whereas the 2018-19 Budget Act contained a clear 2018-19 enrollment target for the ongoing funds the state provided UC (2,000 FTE students), it did not specify how many more students UC should enroll with the $105 million in one-time funding . In addition, the provisional language offered no explanation for how UC was to support the ongoing costs of higher 2018-19 enrollment moving forward . As a result, the Legislature has little basis to assess whether UC’s 2018-19 enrollment level meets its expectation or determine whether ongoing funding is now warranted .
Enrollment Targets Set Clear Priorities. The ambiguities regarding the one-time funds in 2018-19 demonstrate the importance of setting clear expectations in the budget . Without clear enrollment expectations, the university may make enrollment decisions that differ from the state’s intentions . Once students are enrolled, the higher enrollment level also puts added pressure on the Legislature to provide ongoing support .
Setting Targets in Advance Ensures State Can Influence UC Admission Decisions. In addition to the importance of setting clear expectations, we think the state’s practice of setting those expectations for the following academic year has merit . Because of the timing of UC’s admission decisions, the state has already lost most of its ability to influence UC’s 2019-20 admission decisions . By setting a target for 2020-21, however, the state could still influence UC’s upcoming admission decisions .
Recommendations
Governor’s 2018-19 Enrollment Growth Proposal Is Reasonable. Given the provisional budget language connected to the $105 million in one-time 2018-19 funding is confusing, the Legislature will need to consider how it wants to respond now . The Legislature could adopt the Governor’s proposal and provide ongoing funding to support about half of the students UC enrolled above last year’s explicit enrollment target . Given the ambiguity of what was intended last year, we think this approach is reasonable . Alternatively, the Legislature could decide to fund any higher or lower enrollment level . Funding all of the additional students UC enrolled in 2018-19 would require an additional $9 million ongoing above the amount included in the Governor’s budget .
Recommend Adopting Enrollment Target for 2020-21. To influence UC’s future admission decisions, we recommend the Legislature set an enrollment target for the 2020-21 academic year . The target could be to hold enrollment flat or increase it . If the Legislature wishes to grow enrollment, we recommend (1) using the marginal cost formula to derive the associated state cost and (2) covering the cost with ongoing funds . In deciding upon a 2020-21 target, we suggest the
gutter
analysis full

www.lao.ca.gov
2 0 1 9 - 2 0 B U D G E T
43
Legislature consider several factors, discussed below .
UC Drawing From Beyond Its Traditional Eligibility Pool. According to the state’s most recent eligibility study, UC drew from 13 .9 percent of high school graduates in 2015-16 . This is higher than UC’s traditional pool (12 .5 percent) . More recent studies undertaken by the UC Academic Senate also conclude that UC is drawing from beyond its traditional eligibility pool . Given UC is already meeting its historical commitment to freshman access, the Legislature could treat further enrollment growth at the university as a lower priority .
High School Graduates Projected to Decline Slightly. The Department of Finance projects a 0 .8 percent decline in the number of high school graduates in 2018-19 and a 0 .4 percent decline in 2019-20 . This means that, all other factors staying the same, enrollment demand for freshman slots in 2020-21 would decrease accordingly . This slight decline in high school graduates over the next two years also suggests that enrollment growth at UC could be a lower priority for the Legislature .
Many Students Not Getting Into Campus of Choice . Although UC is admitting all eligible freshman applicants, some of these applications are redirected to Merced . In fall 2017, 10,700 eligible freshman applicants (14 percent) were referred to Merced . Very few of these students (119 or 1 .1 percent) elected to enroll at that campus . Students who do not accept admission at UC may end up attending CSU, a private school, or a community college (then transferring to a four-year school, including UC, upon completing their lower-division coursework) . Supporting more enrollment growth could enable UC to accommodate more applicants at their campus of choice . The Legislature could weigh this benefit against its other budget priorities .
STUDENT SUCCESS
Below, we provide background on student outcomes at UC as well as the university’s new graduation improvement plan . We then describe the Governor’s proposal to support UC’s efforts to
improve graduation rates, assess the proposal, and offer associated recommendations .
Background
UC Has Highest Graduation Rates of Three Public Higher Education Segments. UC students graduate at higher rates than CSU and CCC students . Of freshman students entering UC in fall 2011, 84 percent graduated within six years . This rate is 25 percentage points higher than at CSU and 36 percentage points higher than at CCC . The six-year rate at UC has increased slightly over the last two decades . The fall 1997 freshman cohort had a six-year graduation rate of 80 percent . Compared to the six-year rate, the four-year graduation rate has improved more notably . Of freshman students entering UC in fall 1997, 46 percent graduated in four years, compared to 66 percent for the fall 2013 cohort . Compared to freshmen, transfer students at UC are less likely to graduate on time . Of transfer students entering in fall 2015, 57 percent graduated within two years . Transfer students, however, have slightly higher overall graduation rates (with a four-year graduation rate of 89 percent) .
UC’s Graduation Rates Vary Among Campuses and Student Groups. UC’s relatively high systemwide graduation rates mask differences among campuses . As Figure 26 (see next page) shows, Berkeley and Los Angeles (UC’s most selective campuses) have six-year graduation rates at or near 90 percent . By contrast, the six-year rate for Merced (UC’s least selective campus) is 67 percent . In addition, as Figure 27 (see next page) shows, student outcomes vary by race/ethnicity . For example, the difference in six-year graduation rates between Latino and white students ranged between 8 and 13 percentage points for freshman cohorts entering from 2001 through 2011 . While outcomes also vary by socioeconomic status, the gaps are somewhat smaller . For example, the six-year graduation rate for Pell grant recipients is 5 percentage points lower than for students who did not receive a Pell grant .
UC Recently Adopted Improvement Plan. In November 2018, UC laid out a 12-year undergraduate improvement plan . In January 2019,
gutter
analysis full
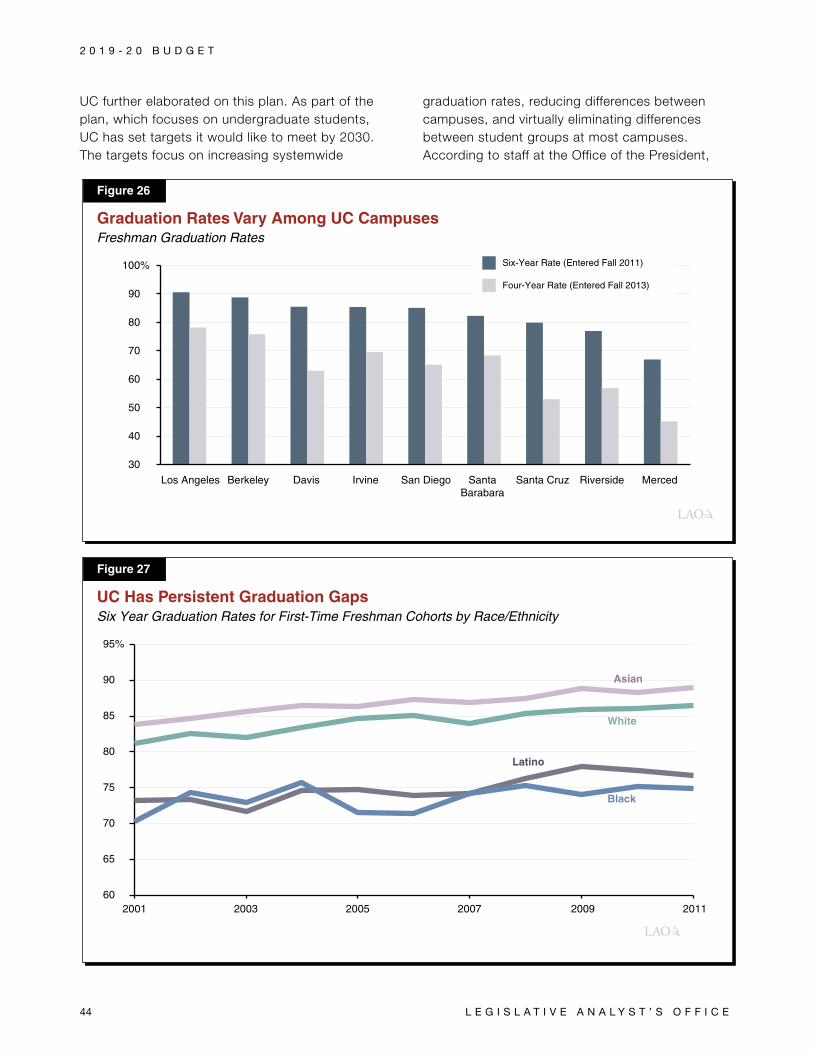
L E G I S L A T I V E A N A L Y S T ’ S O F F I C E
2 0 1 9 - 2 0 B U D G E T
44
UC further elaborated on this plan . As part of the plan, which focuses on undergraduate students, UC has set targets it would like to meet by 2030 . The targets focus on increasing systemwide
graduation rates, reducing differences between campuses, and virtually eliminating differences between student groups at most campuses . According to staff at the Office of the President,
Freshman Graduation RatesGraduation Rates Vary Among UC Campuses
Figure 26
30
40
50
60
70
80
90
100%
Los Angeles Berkeley Davis Irvine San Diego SantaBarabara
Santa Cruz Riverside Merced
Six-Year Rate (Entered Fall 2011)
Four-Year Rate (Entered Fall 2013)
Asian
White
Latino
Black
UC Has Persistent Graduation Gaps
Figure 27
60
65
70
75
80
85
90
95%
2001 2003 2005 2007 2009 2011
Six Year Graduation Rates for First-Time Freshman Cohorts by Race/Ethnicity
gutter
analysis full

www.lao.ca.gov
2 0 1 9 - 2 0 B U D G E T
45
the plan is part of a broader policy framework to enhance education and research activities in the system . The office indicates that it will present the Board of Regents with a separate plan focused on graduate education, faculty, and research in its March 2019 meeting .
Proposal
Provides $50 Million Ongoing to Support UC’s Improvement Plan. The Governor indicates the funds are intended to support UC’s improvement plan . UC would have flexibility to use the funds, though the administration suggests activities might include hiring additional faculty, increasing academic counseling services, and addressing facility needs .
UC Has Identified Some Possible Uses of Proposed Funds. In its improvement plan, UC highlights several strategies campuses have undertaken in recent years to increase student retention and graduation . These strategies include offering summer bridge and orientation programs, creating new student learning communities, expanding and streamlining student tutoring and academic counseling services, and developing online courses . The plan notes that campuses hope to expand programs and services such as these to improve graduation rates . At the time of our analysis, university officials indicated it could not provide further detail as to how campuses specifically would use the ongoing funds included in the Governor’s budget . The Office of the President also notes that it has not yet released the second part of its long-term plan, which is intended to focus on graduate education and faculty issues (such as retention, diversity, and research opportunities) . Campuses, however, might use a portion of the Governor’s proposed funds to address those goals .
Assessment
For UC, State Has Tended to Focus More on Access and Cost Than Student Success. Because UC has the highest graduation rates among the segments, the state typically has not focused on funding specific initiatives designed to improve UC student outcomes . Especially in recent years, the state has been more focused on
improving student outcomes at CSU and CCC . Though student success at UC has been less of a concern, the state has taken actions to try to ensure UC remains accessible and affordable . Regarding accessibility, the state has attempted to improve resident students’ access to selective campuses by limiting nonresident enrollment at those campuses . The state has attempted to contain costs for resident students by having UC achieve operational efficiencies, redirecting funds previously supporting nonresident students, and identifying alternative fund sources to support costs .
Legislature May Want to Address UC Achievement Gaps. Though the state has been focused more on improving outcomes of the other segments and has tended not to fund specific student success initiatives at UC, the Legislature may wish to address UC’s achievement gaps . The Legislature could weigh this priority against other possible UC priorities (such as increasing access, reducing cost, enhancing graduate education, and addressing faculty issues) .
Proposal Lacks Critical Information. We have several specific concerns with the Governor’s proposal .
• Proposal Lacks Focus. UC indicates the funds will support its improvement plan, which includes many objectives that go far beyond reducing undergraduate achievement gaps .
• No Justification for Proposed Amount. Without clarity on the specific objectives to be addressed, the Legislature cannot determine if $50 million is justified . The amount could be too little or too much, depending on the objectives .
• Proposal Lacks Accountability. The proposal neither specifies allowable uses of the funds nor establishes performance expectations . Without this information, the Legislature would not have any basis in future years to evaluate whether funding is being used to meet its goals .
Recommendations
If the Legislature decides to provide UC with state funding to improve in one or more areas, we
gutter
analysis full

L E G I S L A T I V E A N A L Y S T ’ S O F F I C E
2 0 1 9 - 2 0 B U D G E T
46
recommend making several enhancements to the Governor’s proposal, discussed below .
Direct UC to Focus on a Set of Explicit Goals. We recommend the Legislature identify a few core objectives . In particular, the Legislature would want to decide whether to focus on undergraduates, graduate students, faculty, or research .
Establish Performance Expectations. After determining its core objectives, we recommend the Legislature establish clear performance goals . For example, were the Legislature to focus on undergraduates, it could establish targets for reducing or eliminating gaps in graduation rates among campuses and student groups .
Direct UC to Develop an Expenditure Plan. After determining a one-time or ongoing funding amount sufficient to accomplish identified goals, we recommend the Legislature direct the university to develop an associated expenditure plan and present it at spring hearings . In the plan, UC should explain how it would allocate the funds among campuses, how each campus would use its allocation, and how planned activities align with identified objectives .
Require Regular Reporting. We also recommend the Legislature require UC to report on how it uses improvement funds and track the progress it has made toward achieving identified objectives . The Legislature could model its reporting expectations based on the existing reporting requirements for CSU’s Graduation Initiative . Alternatively, the state already requires UC to report annually on systemwide graduation rates . As part of this report, UC establishes performance targets for the coming three years . Were the state interested in addressing achievement gaps by campus and race/ethnicity, it could incorporate these expectations into this existing performance report .
EXTENDED EDUCATION
Below, we provide background on extended education, describe the Governor’s proposal to fund the development of additional UC extended education programs, assess the proposal, and offer an associated recommendation .
Background
Extended Education Offers Classes to Adults Outside of Campuses’ Regular Academic Programs . In California, all three public higher education segments operate extended education programs . At UC, each of the nine general campuses has its own extended education division called UC Extension . UC Extension primarily serves lifelong learners and working professionals . Students enrolling in UC Extension do not have to meet the same academic standards as students seeking admission to UC’s regular academic programs . Whereas the state intends for UC is to enroll any eligible freshmen or transfer student into its undergraduate degree programs, extended education classes and programs generally are offered on a first-come, first-served basis .
Extended Education Is Self-Supporting. Extension programs do not receive state funding . Instead, programs are self-supporting—generally receiving their support from course fees charged to students . (In some cases, professional organizations or state agencies offer their employees extended education opportunities and pay the associated course fees for them .) Because they must earn enough money to cover costs, extension divisions tend to be entrepreneurial . Extension staff develop and offer courses largely based on market research that gauges student demand . Extension divisions cover some marketing costs as part of their annual operating budgets . They also maintain reserves to cover special one-time costs associated with developing new courses .
UC Extended Education Programs Generally Offer Three Types of Courses. First, campuses offer a variety of noncredit classes and seminars covering topics ranging from conflict resolution to music appreciation . Extension divisions have considerable latitude to develop these classes . Second, extended education offers programs that confer professional certificates and awards . In contrast to noncredit courses, UC has developed common academic standards for professional certification programs . For example, these programs must contain at least 120 hours of instruction . Third, UC offers a limited number of courses that confer academic credit toward a UC
gutter
analysis full

www.lao.ca.gov
2 0 1 9 - 2 0 B U D G E T
47
degree . To develop a degree-applicable course, extended education divisions must undergo the same Academic Senate approval process as regular degree programs . These courses tend to be taught by regular UC faculty . In 2016-17, 52 percent of extended education was in noncredit courses, 41 percent in professional certification courses, and 7 percent in degree courses .
Unlike UC, CSU Grants Some Bachelor’s Degrees Through Its Extended Education Programs. Although certain classes can count for credit toward a degree, UC Extension currently does not confer bachelor’s degrees . In a limited number of cases, academic departments have partnered with their campus’s extension division to offer graduate degrees . In these partnerships, UC Extension provides much of the administrative support, such as marketing the degree and providing student services . UC faculty develop the curriculum and instruct students in these programs . In contrast to UC, CSU campuses offer both bachelor’s and master’s degrees through extended education . CSU’s extended education bachelor’s degree programs focus on upper-division instruction (with the expectation that applicants complete lower-division coursework at a community college or elsewhere before applying) . Currently, CSU campuses offer a total of 38 bachelor’s degree completion programs through their extended education divisions . Many of these programs are offered online or in a hybrid format (a combination of online and face-to-face instruction) to make them more accessible, particularly for students with work and family responsibilities .
Proposal
Funds Expansion of UC Extended Education. In the Governor’s Budget Summary, the Governor notes that millions of Californians have some college experience but have no degree and are not currently enrolled in college . To address the issue, the Governor’s proposes $15 million one time for UC Extension . The only detail the Governor has on the proposal is a budget bill provision indicating that the funds are “to develop or expand degree and certificate completion programs .” In discussions with our office, the Department of Finance has indicated the funds would support
initial planning, curriculum development, outreach, and other start-up costs for the new programs . The budget bill specifies that the funds would remain available until June 30, 2024 . The Governor expects the new programs would be offered on a fee-basis and self-supporting after initial start-up .
Assessment
Proposal Lacks Explanation of Why Existing Re-Entry Options Are Inadequate. Currently, former students who did not complete a degree program have several options for returning to school . An individual could apply for readmission to the school . Depending on how much time has elapsed since the student last attended and the student’s academic standing at the time of withdrawal, an institution can decide whether to permit re-enrollment . Another potential option for students is to transfer to another institution . For example, a student who completed the first two years of college coursework before withdrawing could apply as an upper-division transfer student to CSU or UC . Additionally, some private schools cater to returning students . For example, Brandman University, a nonprofit institution with campuses located throughout the state, specializes in degree completion for working adults and other nontraditional students . Beyond these options, a student could enroll in one of CSU’s bachelor’s degree completion programs . The administration has not provided data indicating that these existing re-entry options are insufficient to meet students’ needs .
Proposal’s Objectives Are Not Well Defined. In addition to lacking a clear problem statement, the proposal does not have clear objectives . While it is true that millions of Californians have some college experience but no degree, the Governor’s proposal does not specify whether the new UC programs would be for former UC students only or for a larger group of Californians who previously attended other schools . In addition, the Governor’s proposal suggests various possible uses of the funds—each of which is centered around a different objective . Under the Governor’s proposal, UC could use the funds to create new degree completion programs, add professional certificate programs, or undertake outreach to noncompleters . Without
gutter
analysis full
L E G I S L A T I V E A N A L Y S T ’ S O F F I C E
2 0 1 9 - 2 0 B U D G E T
48
clearer objectives, the Legislature would not be able to assess whether the proposal was ultimately effective .
Unclear Why State Funding Needed for Extension Education. Even were the administration able to provide compelling evidence that existing re-entry options were inadequate and clarify its specific objectives, state funds might not be needed to expand extended education options . As a self-supporting enterprise, UC Extension routinely identifies new courses and programs that are of interest to potential students . It then supports the planning and development of those offerings using existing funding, including its reserves of fee revenue . Given this current practice, UC Extension would not need state General Fund support for the purpose of developing new programs aimed at re-entry students .
Recommendation
Recommend Rejecting Proposal. For the reasons stated above, we recommend the Legislature reject the Governor’s proposal . To the extent the Legislature remains interested in further expanding higher education opportunities for re-entry students, we recommend it direct the administration and UC to present a more complete analysis next year . At a minimum, such an analysis should include research into which groups of students are interested in returning, why the state’s current array of re-entry options for them are inadequate, how UC Extension would fill the unmet need better than CSU or other possible alternatives, and why state General Fund support would be needed to build out program offerings .
FACILITIES
Below, we provide background on UC capital outlay, describe UC’s 2019-20 capital outlay proposals, describe the Governor’s proposal relating to deferred maintenance, and assess those proposals .
Background
UC Authorized to Issue Its Own Bonds. Prior to 2013-14, the state sold bonds to support UC’s academic facilities and paid the associated debt
service . Beginning in 2013-14, the state altered this approach by authorizing UC to begin issuing its own university bonds . In a related action, the 2013-14 budget package transferred ongoing base funds into UC’s main General Fund appropriation in an amount equal to what the state was then paying on UC debt service . Moving forward, UC is expected to pay off all debt—for both previous state bonds and new university bonds—from its main General Fund appropriation . By combining capital outlay and support into one UC budget item, the state intended to incentivize UC to weigh the tradeoffs of supporting more operating costs (such as enrollment growth and compensation increases) with funding new capital projects . To ensure adequate resources are available for operations, state law limits debt service on university bonds to 15 percent of UC’s General Fund support .
State Also Revised Project Approval Process. Under the process now in use, UC must notify the Legislature and receive approval from the administration on the projects it intends to pursue with its General Fund support . The timeline for review of UC projects is almost identical to the timeline for CSU projects, with the exception that UC submits its project proposals in September (rather than December) . As with the review process for CSU projects, the Legislature can influence which projects are undertaken by (1) signaling its infrastructure priorities to the administration and UC, (2) conveying its concerns with specific project proposals during February and March legislative hearings, and (3) adjusting UC’s General Fund appropriation to reflect changes in debt service costs or authorized pay-as-you-go projects .
UC Currently Studying Maintenance Needs. Like other state agencies, UC is expected to maintain facilities as part of its ongoing operations . Over the years, UC, as well as many other state agencies, have deferred undertaking maintenance projects to address other operating costs and budget priorities . Currently, the university maintains a running list of state-supportable maintenance projects for each campus . As of September 2018, the list of projects totaled $4 .4 billion . Although this list currently is the best estimate of the university’s maintenance backlog, the Office of the President reports that campuses used different definitions
gutter
analysis full

www.lao.ca.gov
2 0 1 9 - 2 0 B U D G E T
49
and methodologies to identify their projects and estimate associated costs . As a result, UC believes the list does not completely and accurately reflect its maintenance needs . To provide a more detailed and standardized estimate of the condition of its facilities, UC is funding a team of experts to visit each campus and provide an assessment of each facility . The study, which UC anticipates completing by the end of 2020, is funded by $15 million in university bonds, which the state authorized in 2017-18 .
Deferred Maintenance Funded Through Mix of One-Time General Fund and University Bonds. In recent years, the state has tended to provide one-time General Fund to address deferred maintenance projects across many state agencies . From 2014-15 through 2018-19, these statewide initiatives provided UC a total of $145 million . In addition to these one-time funds, the state recently expanded UC’s bond authority to include the ability to finance deferred maintenance projects . Since 2017-18, the state has authorized UC to issue $70 million in bond funds for deferred maintenance projects .
Proposals
UC Proposes Seven Projects for 2019-20. As Figure 28 shows, the total cost of these projects (including private donations, campus reserves, and other UC funds) would be $314 million, with state
costs of $213 million . The proposed projects fall into four categories, described below .
• New Facilities ($140 Million). The Santa Barbara and Santa Cruz campuses have projects to construct new academic buildings (with classrooms, computer laboratories, and faculty office space) . A third project at Irvine would consolidate and expand various student service programs into one building .
• Deferred Maintenance ($35 Million). Similar to the previous two fiscal years, UC would use its bonds to fund deferred maintenance projects across the system . At the time of this analysis, UC had not provided a list of the specific projects to be funded . In its proposal, UC indicates that it may use a portion of the $35 million to support a one-time condition assessment of campus utilities and other infrastructure . This study would be separate from the facility assessment described earlier .
• Renovations ($19 Million). The Riverside campus proposes renovating existing laboratory space in Pierce Hall, with the goal of modernizing certain spaces and converting some research space into teaching laboratories . The Berkeley campus proposes a project to improve the seismic rating of University Hall, an administrative building .
Figure 28
UC Proposes Seven Capital Outlay Projects for 2019-20(In Thousands)
Campus ProjectaState Cost in
2019-20bTotal Cost
Across All Years
Systemwide Deferred maintenance $35,000 $35,000Santa Barbara New classroom building 79,787 97,133Irvine New Student Wellness and Success Building 13,000 69,606Santa Cruz New Kresge College academic building 47,200 53,000Riverside Pierce Hall renovation 13,000 22,747ANR Renovation of research and extension centers 19,237 19,237Berkeley University Hall seismic renovation 6,050 17,475
Totals $213,274 $314,198a At the Santa Cruz project, state funds supported the working drawings phase in 2018-19. All other previous phases for all projects were supported by
nonstate funds.b Funded by university bonds. The annual debt service on the bonds is estimated to be $16 million. ANR = Agriculture and Natural Resources.
gutter
analysis full

L E G I S L A T I V E A N A L Y S T ’ S O F F I C E
2 0 1 9 - 2 0 B U D G E T
50
• Agriculture and Natural Resources (ANR) ($19 Million). As Figure 29 shows, UC proposes a mix of new space to expand outreach activities, renovations, and abatement projects at four regional ANR research and extension centers located throughout the state .
Debt Service on Proposed 2019-20 Projects Anticipated to Be Paid in Future Years. UC estimates it would pay $16 million annually in debt service costs from financing the seven projects . According to the university, it will not begin paying debt service on the projects until 2021-22 . The lag is due to the university’s practice of waiting a few years after receiving state approval to issue bonds . (The projects’ initial costs would be covered through low-interest interim borrowing . UC would repay this initial borrowing with a portion of the bonds’ proceeds .) After adding the $16 million in costs, UC estimates its total debt service costs would peak at 6 .8 percent of its General Fund support in 2023-24 . Although the seven projects would not increase UC’s debt service costs immediately, the university expects to begin financing several previously approved projects . The financing of those projects would increase UC’s debt service costs, as highlighted in the nearby box .
Governor Proposes $138 Million One-Time General Fund for Additional Deferred Maintenance Projects. This one-time amount would be in addition to the $35 million in deferred maintenance projects that UC proposes to finance with university bonds . As of this writing, the administration had not provided a list of
projects that would be funded with the proposed appropriation .
Assessment
Concerns With a Few Proposals. We have concerns with the proposed new classroom building at Santa Barbara, the new Kresge College academic building at Santa Cruz, and UC’s preliminary plan to use university bonds to fund an infrastructure conditions assessment . We also believe the Legislature could improve upon the Governor’s deferred maintenance proposal by adding some transparency and accountability provisions . We discuss these issues below .
Demand for Large Lecture Halls at Santa Barbara Could Be Met Instead Through Online Education. The new building would contain 53,940 asf/95,250 gsf of new lecture hall and small classroom space . According to the campus, the primary purpose of the project is to add more lecture hall space . The campus states that demand for large lectures exceeds capacity, and it currently must use large assembly and event spaces to accommodate demand . The campus intends to redirect instruction from these assembly and event spaces into the new building once it is complete . In so doing, the campus would free up more special-event space for its intended uses (such as musical performances and public lectures) . Our primary concern is that the Santa Barbara project continues UC’s traditional approach of delivering instruction in large in-person lectures . Over the past decade, the state has been moving in a different direction—providing UC with ongoing funds to develop and expand its online course
Figure 29
Agriculture and Natural Resources Proposal Has Several ComponentsProject Costs in 2019-20 (Dollars in Thousands)
South Coast Desert Elkus Ranch Kearney Total
Construct new building $7,200 $5,400 — — $12,600Upgrade fire suppression system
and roadways428 — $3,000 — 3,428
Abate hazardous materials 305 607 — 950 1,862Improve accessibility 275 380 — 390 1,045Upgrade water treatment system — — — 302 302
Totals $8,208 $6,387 $3,000 $1,642 $19,237
gutter
analysis full

www.lao.ca.gov
2 0 1 9 - 2 0 B U D G E T
51
offerings . Through online courses, UC can reach a large number of students without the added infrastructure costs . Given the impersonal nature of traditional lectures and the state’s current efforts to increase online instruction, the Legislature may deem the Santa Barbara project a lower priority .
Two Concerns With Santa Cruz Project. This project would add 25,000 asf/36,000 gsf in space to Kresge College—one of Santa Cruz’s ten residential colleges . Specifically, the new building would accommodate two lecture halls (one with 600 seats and one with 150 seats), two classrooms (one with 50 seats and one with 35 seats), and one computer lab (48 seats) . The project also would add administrative space, consisting mostly of faculty offices and conference rooms . We describe our two concerns below .
• Online Education an Alternative to Large Lecture Space. Here too we think using online education would mitigate demand for the proposed large lecture spaces . The project’s proposed smaller classrooms and computing laboratory, by contrast, is justified given current capacity constraints in the campus’s existing space .
• Administrative Space Shifts Personnel Around Campus. According to the campus, the project would relocate various academic divisions from existing buildings into the new offices . Vacated buildings resulting from the project either would be demolished or reprogrammed in future projects for student services and housing supported by nonstate funds . In its proposal to the state, the campus argues that relocating these divisions into one building will give Kresge College more of an academic anchor upon which its students can
identify . The Legislature may consider shifting personnel around the campus to one central location a relatively low priority .
Several Concerns With Proposed Infrastructure Conditions Assessment. The university has not satisfactorily explained why it needs new resources—rather than using existing resources—to assess its utilities and related infrastructure . It also has not explained how it plans to support ongoing infrastructure monitoring after the initial assessment . We also think using long-term bond funding for a one-time needs assessment is poor budget practice . (We raised these same types of concerns regarding UC’s use of bond funds to support its facility condition assessment in 2017-18 .) For these reasons, we encourage the Legislature to reject UC’s proposal to use bond funds for the infrastructure assessment .
Recommend Adding Transparency and Accountability to Governor’s Deferred Maintenance Proposal. We think that providing funds for deferred maintenance, as proposed by the Governor, is a prudent use of one-time funds . To promote greater transparency and legislative oversight of these funds, we recommend the Legislature require UC to report at spring hearings on the specific projects it plans to undertake . We recommend requiring the Department of Finance to report no later than January 1, 2023 on the status of the various projects that are undertaken . In addition, we recommend the Legislature require UC to submit a long-term plan for eliminating its backlog once it completes its facility condition assessment (anticipated by December 31, 2020) . UC’s plan should identify funding sources and propose a multiyear schedule of payments to
UC Debt Service Costs Rising in 2019-20
According to the Office of the President, the university plans to issue bonds in March 2019 to finance several previously approved projects . The bond issuance will increase the University of California’s (UC’s) debt service costs . To cover these costs, the university has requested $15 million in additional state General Fund . The Governor’s budget proposal does not include funds for this cost increase . The Legislature may wish to factor this higher cost into its budget decisions for the university .
gutter
analysis full

L E G I S L A T I V E A N A L Y S T ’ S O F F I C E
2 0 1 9 - 2 0 B U D G E T
52
eliminate its backlog . To prevent the backlog from growing or reemerging in future years, we recommend the Legislature require UC to identify ways to improve existing maintenance practices . UC, for example, could commit to setting aside the necessary level of funds for its scheduled maintenance or the Legislature could earmark a like amount of funds directly in the annual budget act for that purpose .
COVERING COST INCREASES
After setting its UC budget priorities, the Legislature faces choices in how to cover the associated cost . At UC, costs are shared primarily by the state, nonfinancially needy resident students, and nonresident students (who effectively subsidize a small but growing portion of education costs for resident students) . In recent years, UC also has identified other fund sources (such as redirected savings from lower-cost procurement contracts) that it uses to support cost increases . In the remaining portion of the UC section, we provide information intended to help the Legislature decide how to share costs among these possible fund sources . Specifically, we provide background on changes in tuition levels and state support over time, describe the Governor’s as well as UC’s proposals for how to cover university budget priorities in 2019-20, and assess those proposals .
Background
UC Charges Nonfinancially Needy Resident Students Tuition. UC charges resident undergraduate and graduate academic students the same systemwide tuition amount, with professional school students (for example, law school students) paying higher charges that vary by program . In addition, UC charges all students a Student Services Fee, which supports counseling, career guidance, cultural activities, student health services, and other student-related activities . The Board of Regents, rather than the Legislature, sets the systemwide charges . In 2018-19, the total systemwide charge for an undergraduate student is $12,570 ($11,442 for tuition and $1,128 for the Student Services Fee) . Though UC charges all resident undergraduate students tuition and the Student Services Fee, more than half of these students receive financial aid to cover the charges . The nearby box describes the financial aid programs available to UC students .
Tuition Charges Driven Not by Policy but by Economic Cycle. For many decades, the state has implicitly shared college costs with nonfinancially needy students through their tuition charge . The state does not have a policy, though, for what share of cost each of these groups should expect to bear . Historically, the state also has not maintained sufficiently large General Fund reserves to maintain a share-of-cost policy during economic
Several Programs Help UC Undergraduates Cover College Costs
At the University of California (UC), financially needy students receive aid to cover tuition and a portion of their living costs . Many financially needy students have their tuition covered from the state Cal Grant program . Students who qualify for a Cal Grant typically also receive a federal Pell Grant to cover a portion of their living costs (up to $6,095 per year) . In addition to these programs, UC redirects a portion of student tuition and fee revenue to need-based financial aid . UC reports that about two-thirds of this aid provides tuition coverage, with the remainder providing living coverage . In 2016-17, the average award from this program was $7,498 . Much of the tuition coverage provided by UC’s aid program assists financially needy students in their fifth year (after their four years of Cal Grant eligibility have been used) . In addition to these needs-based programs, the state funds a tuition-assistance program for higher-income students attending UC . The Middle Class Scholarship program provides up to 40 percent tuition coverage for students with household income of up to $114,000 and 10 percent tuition coverage for students with family incomes of up to $171,000 . Coverage is graduated within that range .
gutter
analysis full

www.lao.ca.gov
2 0 1 9 - 2 0 B U D G E T
53
downtowns . In the absence of a share-of-cost policy or sufficient reserves (as well as constitutional or federal higher education spending requirements), the state has tended to let economic developments drive its university spending and tuition decisions . When economic times are good, state funding for UC tends to increase and tuition remains flat . Conversely, when economic times are poor, state funding for UC tends to decrease and tuition increases . Given the volatility in state revenues, fluctuations in tuition levels have often been pronounced (Figure 30) .
Resident Systemwide Tuition and Fees Fluctuations Continue This Reactive Trend. As Figure 31 shows, charges for resident undergraduates notably increased from 2008-09 to 2011-12 (a period encompassing the Great Recession) . Most of the increase during that period was the result of steep tuition hikes enacted in 2010-11 and 2011-12 . These increases were intended to partially offset reductions in state funding those years . Since the last tuition increase in 2011-12, systemwide charges have remained virtually flat the past seven years
UC Has Turned to Relying More on Nonresident Enrollment and Tuition Revenue. All nonresident undergraduate students pay supplemental tuition in addition to systemwide tuition and fees . The additional charge is intended to cover costs the state General Fund would otherwise subsidize for resident students . Nonresident undergraduate students at UC, however, pay more than their education costs (effectively subsidizing resident students) . In recent years, UC has notably increased
both nonresident enrollment and nonresident supplemental tuition . In 2018-19, nonresident undergraduate enrollment is 4 .8 times the level in 2008-09 . By comparison, resident undergraduate enrollment grew by 10 percent over same period . Including both base tuition and the supplemental charge, nonresident tuition is 53 percent higher in 2018-19 compared to the 2008-09 level .
Tuition Levels at UC Tend to Follow the Economic Cycle
Figure 30
Change From Prior Year, Systemwide Tuition and Fees for Resident Undergraduates
-5
5
10
15
20
25
30
35
40%
1990-91 1994-95 1998-99 2002-03 2006-07 2010-11 2014-15 2018-19
Steep Hikes Followed by Virtually Flat UC Tuition Levels
Figure 31
Systemwide Tuition and Fees for Resident Undergraduates
6,000
7,000
8,000
9,000
10,000
11,000
12,000
13,000
14,000
$15,000
2008-09 2010-11 2012-13 2014-15 2016-17 2018-19
Adjusted (2018-19 Dollars)
Unadjusted
gutter
analysis full

L E G I S L A T I V E A N A L Y S T ’ S O F F I C E
2 0 1 9 - 2 0 B U D G E T
54
UC Also Has Turned to Relying More on Other Alternative Fund Sources. UC has undertaken a number of strategies in recent years to improve operations and increase funding from nonstate sources . Some of these activities UC has initiated, whereas others the state directed UC to implement . UC initiatives include improving procurement practices to realize operational savings, soliciting private donations to cover operating costs, and increasing investment earnings by shifting cash reserves into investment pools with higher returns . In addition, the state in 2015-16 directed UC to begin phasing out financial aid it was offering nonresident students . In its annual budget request, UC identifies the projected savings and funds from these activities as available resources to cover costs .
State Still Comprises Largest Share of Core Funds. We estimate the state’s current share of core UC funds in 2018-19 is 60 percent . This share includes direct General Fund and lottery support that the state annually provides UC as well as state-funded tuition coverage provided to UC students . Through this state support, financially needy resident students have 100 percent of their education costs covered . Of the remaining portion of core funding, we estimate nonfinancially needy resident students contribute 13 percent and nonresident students contribute 27 percent . Though the state provides a majority of core funding, its share has declined since 2008-09 . As Figure 32 shows, the state’s share in 2008-09 was notably higher, whereas the nonresident student
Share of Core Funding From Each SourceRevenue From Nonresident Students Is a Growing Share of Core UC Funds
Figure 32
10
20
30
40
50
60
70
80
90
100%
2008-09 2010-11 2012-13 2014-15 2016-17 2018-19
Direct State Support
Resident StudentTuition Revenue
Nonresident StudentTuition Revenue
State Financial Aid
gutter
analysis full

www.lao.ca.gov
2 0 1 9 - 2 0 B U D G E T
55
share was notably smaller . The share resident students and their households pay has been relatively stable . In 2008-09, the state share was 73 percent, the resident share was 17 percent, and the nonresident share was 10 percent .
Proposals
Governor Proposes No Tuition Increase, With State Covering All of Proposed Cost Increases. In the Governor’s Budget Summary, the Governor expresses his expectation that UC not increase resident tuition . To create a strong incentive for UC to hold resident tuition charges flat, the Governor proposes to retain budget provisional language adopted in 2018-19 that effectively triggers a reduction in General Fund support if the Board of Regents adopts a tuition increase for 2019-20 . The language ties the General Fund reduction to the additional Cal Grant and Middle Class Scholarship costs associated with the tuition increase, thereby making UC’s action fiscally neutral to the state . The Governor is proposing to cover all of his identified proposed cost increases with state support . In the Governor’s Budget Summary, the Governor also expresses a desire to work with UC to provide fiscal certainty for students and their households moving forward .
UC Proposes to Increase Nonresident Enrollment and Supplemental Tuition Charge. In its budget request to the state, UC indicates its plans to grow nonresident undergraduate enrollment by 800 students (2 .2 percent) and increase nonresident supplemental tuition by $762 (2 .6 percent) . The combined enrollment growth and tuition increase would provide $53 million in ongoing funds to the university . Of this amount, we estimate UC would have to spend $9 .2 million for additional instructors, teaching assistants, and other costs to support the additional nonresident students . The remaining $43 million would be available for other ongoing priorities .
UC Proposes to Use $74 Million in Other Funds and Savings for Core Costs. The additional ongoing resources would come from many of the activities described earlier, including savings from improved procurement practices, increased philanthropy, investment returns on reserves, and phasing out financial aid for nonresident students .
Assessment
Fiscal Predictability Is a Reasonable Goal. For many years, we have encouraged the Legislature to consider ways to make student tuition increases less volatile . Though the administration does not appear to have a specific plan at this time, it too seems interested in exploring ways to make tuition levels more predictable for students and their families .
Best Way to Promote Tuition Predictability Is by Continuing to Build Up State’s Reserves. Increasing reserves helps prepare the state for an economic downturn . The Governor’s proposed reserve level for 2019-20 likely would be enough for the state to cover most of a budget problem associated with a mild recession . In this scenario, the Legislature likely would not need to reduce university spending and UC likely would not need to initiate steep tuition increases . The proposed reserve level, however, likely would be insufficient to weather a longer, moderate-sized recession . In this latter scenario, the Legislature likely would feel more pressure to reduce university spending and permit steeper tuition increases . To minimize the possibility of having to take those actions, the Legislature could increase reserve levels in 2019-20 .
Sharing Cost Increases With Students in 2019-20 Could Help Build Reserves. One way to build more reserves would be to have nonfinancially needy UC students bear a portion of any cost increases in the budget year . Sharing costs in this way would free up some General Fund money that could be redirected to higher reserves .
A Formal Share-of-Cost Tuition Policy Could Guide Annual Tuition Decisions. The decision in 2019-20 regarding how to share costs among groups could be linked with a new state policy that set an explicit expectation about what share of cost is reasonable for nonfinancially needy students to bear . A share-of-cost policy would give the Board of Regents and the Legislature a transparent rationale for setting tuition levels each year . Though the Governor does not set an explicit share-of-cost expectation, his approach of covering costs solely from the General Fund implies the current share of cost for nonfinancially needy students is
gutter
analysis full

L E G I S L A T I V E A N A L Y S T ’ S O F F I C E
2 0 1 9 - 2 0 B U D G E T
56
too high . Under the Governor’s proposal, these students’ share of cost would drop from an estimated 13 percent in 2018-19 to 12 percent in 2019-20 . If the Legislature wanted to build higher reserves in 2019-20 and share cost increases with nonfinancially needy students, it could keep these students’ share at 13 percent . Alternatively, the Legislature could choose to set a higher or lower share of cost as a policy target . The overriding goal in setting an explicit target would be to treat cohorts of students similarly—whether they happen to enter college during an economic recovery or recession .
Legislature’s Decisions About Nonresident Enrollment Could Impact Associated Revenue Available in Budget Year. There is some uncertainty whether UC’s planned nonresident enrollment growth and $43 million in associated net revenue will be available to help cover costs in 2019-20 . In the Supplemental Report of the 2018-19 Budget Act, the state directed UC to develop a plan to reduce nonresident students to 10 percent of enrollment at every campus by 2030 . UC must submit the plan in April 2019 .
Were the Legislature to direct UC to implement the plan and begin reducing nonresident enrollment in 2019-20, UC would receive less, rather than more, nonresident tuition revenue .
Factor All Available Resources Into Budget Decisions for UC. Although UC has identified additional resources to cover costs in 2019-20, the Governor does not indicate which additional budget priorities he expects these funds will cover . We encourage the Legislature to account for UC’s identified alternative revenues and anticipated operational savings (as well as any nonresident revenue increases that do materialize) and factor all those resources into its budget decisions for the university . These nonstate funds could be applied to any UC budget priority . Though we encourage the Legislature to account for these alternative fund sources, some of them are less reliable sources to support ongoing operations . Most notably, UC is applying $30 million in higher investment income to its ongoing programs, but investment returns may rise or fall with the state’s economy, putting those programs at some risk of future reductions .
CALIFORNIA STUDENT AID COMMISSION
In this section, we provide an overview of the Governor’s proposed budget for the California Student Aid Commission (CSAC) . We then (1) assess the Governor’s Cal Grant cost estimates, (2) analyze his proposal to expand Cal Grant nontuition coverage for student parents, (3) analyze his proposal to increase the number of Cal Grant competitive awards, and (4) assess his cost estimates for the Middle Class Scholarship program .
OVERVIEW
Governor Proposes $2.7 Billion for CSAC in 2019-20. As Figure 33 shows, the Governor proposes a $289 million (12 percent) increase for CSAC over the revised 2018-19 level . The two main fund sources for CSAC are state General Fund and federal Temporary Assistance for Needy Families
(TANF) . Under the Governor’s CSAC proposal, General Fund support increases by $289 million (22 percent) whereas TANF funds remain flat .
Cal Grant Spending Accounts for Nearly All of Proposed Increase. As Figure 34 shows, the Governor proposes three Cal Grant augmentations—together accounting for nearly all new CSAC spending . The remaining small increases in proposed CSAC spending are offset by spending reductions, largely from the phase out of a loan assumption program and the removal of one-time 2018-19 funds .
CAL GRANTS
Below, we provide background on the Cal Grant program and review the Governor’s cost estimates for the program .
gutter
analysis full

www.lao.ca.gov
2 0 1 9 - 2 0 B U D G E T
57
Background
State Offers Multiple Types of Cal Grant Awards. In the late 1970s, the state consolidated its financial aid programs into the Cal Grant program . As Figure 35 (see next page) shows, there are three types of Cal Grant awards today . One type, Cal Grant A, covers full systemwide tuition and fees at the public universities and up to a fixed dollar amount toward tuition costs at private colleges . The second type, Cal Grant B, covers tuition in all but the first year of college and provides additional aid to help pay for nontuition expenses, including books, supplies, and transportation . The third type of award, Cal Grant C, provides a fixed amount of aid for tuition and nontuition expenses for students enrolled in career technical
Figure 33
California Student Aid Commission Budget(Dollars in Millions)
2017-18 Actual
2018-19 Revised
2019-20 Proposed
Change From 2018-19
Amount Percent
SpendingLocal Assistance Cal Grants $2,105 $2,271 $2,560 $289 12.7% Middle Class Scholarships 100 103 106 3 2.8 Chafee Foster Youth Program 13 18 18 — — Student Opportunity and Access Program 8 8 8 — — Assumption Program of Loans for Education 5 3 1 -2 -55.2 Other programsa 3 6 3 -3 -47.8 Subtotals ($2,234) ($2,408) ($2,696) ($288) (11.9%)State Operations $16 $21 $22 $1 4.1%
Totals $2,249 $2,430 $2,719 $289 11.9%
FundingGeneral Fund $1,185 $1,337 $1,626 $289 21.6%Federal TANF 1,043 1,066 1,066 — —Other federal funds and reimbursements 16 21 21 —b 0.1College Access Tax Credit Fund 5 6 6 — —a Includes Cash for College, Child Development Teacher/Supervisor Grants, Every Kid Counts, John R. Justice Program, Law Enforcement Personnel
Dependents Scholarships, Military Department GI Bill Awards, and State Nursing Assumption Program of Loans for Education for Nursing Faculty.b Less than $500,000. TANF = Temporary Assistance for Needy Families.
Figure 34
California Student Aid Commission Spending Changes (In Millions)2018-19 Revised Spending $2,429.8
Local AssistanceCal Grant baseline cost increases $158.1Additional Cal Grant nontuition coverage for student parents 121.6Additional Cal Grant competitive awards 9.6Middle Class Scholarship baseline cost increases 2.9Assumption Program of Loans for Education phase out -1.6Other financial aid programs —a
Removal of one-time 2018-19 funds -2.9 Subtotal ($287.8)
State OperationsGrant Delivery System modernization (one time) $6.2Financial aid program administration 0.3Foster youth eligibility expansion (one time) 0.1Removal of one-time 2018-19 funds -5.7 Subtotal ($0.9)
Total Changes $288.7
2019-20 Proposed Spending $2,718.5a Net spending increases less than $100,000 for all the following programs combined: Cash for
College, Chafee Foster Youth Program, John R. Justice Program, Law Enforcement Personnel Dependents Scholarships, Military Department GI Bill Awards, Student Opportunity and Access Program, and State Nursing Assumption Program of Loans for Education for Nursing Faculty.
gutter
analysis full

L E G I S L A T I V E A N A L Y S T ’ S O F F I C E
2 0 1 9 - 2 0 B U D G E T
58
education programs . A student may receive a Cal Grant A or B award for up to the equivalent of four years of full-time study, whereas a Cal Grant C award is available for up to two years . Students apply for Cal Grants by submitting a Free Application for Federal Student Aid (FAFSA) or California Dream Act Application . They must reapply each year in which they wish to renew their award .
Entitlement and Competitive Programs Have Certain Eligibility Criteria. In 2000, the Legislature restructured Cal Grants into a relatively large entitlement program and a smaller competitive program . As Figure 36 shows, students must meet certain income and asset criteria to qualify for these programs . The entitlement program also has age requirements . Specifically, only recent high school graduates and transfer students under age 28 are eligible for entitlement awards . The competitive program is designed for those students ineligible for entitlement awards—typically older students who have been out of school for at a least a few years . Both programs generally require a minimum GPA ranging from 2 .0 to 3 .0 .
Cost Estimates
CSAC’s Cal Grant Caseload Estimates Are Largely Based on Previous Trends. Each fall and spring, CSAC estimates Cal Grant participation for the current year and budget year . For the current year, CSAC looks at how many awards have been offered to date and then assumes a certain share of these awards will be taken based on recent paid rates within each segment . For the budget year, CSAC takes the current-year estimate and projects it forward using various assumptions, such as the expected share of new awards that will convert into renewal awards within each segment .
Governor’s Budget Reflects Higher Spending in 2018-19 and 2019-20 Largely Due to Growth
in Participation. The budget revises 2018-19 Cal Grant spending upward by $33 million from the 2018-19 Budget Act level . This upward revision is due entirely to higher-than-expected caseload . Compared with the revised 2018-19 level, the budget provides a $158 million (7 .0 percent) increase for 2019-20, excluding augmentations for proposed policy changes . The budget-year increase is due to a projected 6 .1 percent increase in recipients coupled with a small increase ($48 or 0 .8 percent) in average award size . The cost estimate for 2019-20 assumes no changes in tuition and fees at UC and CSU .
Cost Estimates Appear Reasonable. From 2013-14 to 2017-18, Cal Grant caseload increased by an average annual rate of 5 .8 percent . For 2018-19, caseload is estimated to increase 7 .6 percent . Given these recent growth rates, we think CSAC’s projection that caseload will increase by 6 .1 percent in 2019-20 is reasonable . Regarding average award size, CSAC’s estimated increase for 2019-20 (0 .8 percent) is somewhat higher than the average annual increase in award size from 2013-14 to 2017-18 (0 .1 percent) . We think the higher adjustment is reasonable because caseload is expected to grow faster at the universities than
Figure 35
Cal Grant Award AmountsMaximum Annual Award for Full-Time Students, 2018-19
Cal Grant ATuition awards for up to four years.Full systemwide tuition and fees ($12,570) at UC.Full systemwide tuition and fees ($5,742) at CSU.Fixed amount ($9,084) at nonprofit colleges.Fixed amount ($8,056) at WASC-accredited for-profit colleges.Fixed amount ($4,000) for other for-profit colleges.
Cal Grant BTuition coverage comparable to A award for all but first year.$1,648 toward nontuition expenses for up to four years.a
Cal Grant C$2,462 for tuition and fees at private colleges for up to two years.$1,094 for nontuition expenses at CCC for up to two years.$547 for nontuition expenses at private colleges for up to two years.a Excludes $24 add-on from College Access Tax Credit. WASC = Western Association of Schools and Colleges.
gutter
analysis full

www.lao.ca.gov
2 0 1 9 - 2 0 B U D G E T
59
at CCC in 2019-20 . (Awards for students attending UC and CSU cost more than awards for students attending CCC .) We anticipate that CSAC will update its current- and budget-year cost estimates at the May Revision to reflect the latest Cal Grant data available .
Governor Assumes No Reduction in Award Size for Nonprofit Colleges. Last year, the state placed a new condition on Cal Grant awards at private nonprofit colleges . Specifically, this sector must admit at least 2,000 students with an associate degree for transfer in 2018-19 or the award amount for all Cal Grant recipients at that sector will be reduced from $9,084 to $8,056 in 2019-20 . (The target number of students admitted with an associate degree for transfer is scheduled to increase in subsequent years .) The Governor’s budget assumes that the sector will meet its target, thus maintaining the higher award amount for 2019-20 . The administration will report at the May Revision as to whether the sector is on track to meet the target . Were the sector not to meet the goal, we estimate that the associated Cal Grant costs would decline by $9 million in 2019-20 .
NONTUITION COVERAGE FOR STUDENT PARENTS
Below, we provide background on financial aid programs that assist undergraduate students with nontuition costs such as housing, food, and transportation . Then, we discuss the Governor’s proposal to increase nontuition coverage for CCC, CSU, and UC undergraduates who have dependent children (referred to as student parents) . Next, we assess the proposal and offer an associated recommendation .
Background
Total Cost of Attendance Includes Both Tuition and Living Costs. Apart from tuition, college students incur costs for housing, food, transportation, books, and personal expenses . For many students, these nontuition costs exceed their tuition costs .
State Provides Cal Grant B and C Recipients With Nontuition Coverage. The nontuition component of these awards is described below .
• Cal Grant B Access Award. The Legislature created this award in the late 1960s with the intent of helping students from disadvantaged backgrounds pursue higher education . Today, this award provides low-income students with up to $1,648 annually to cover living costs . In 2017-18, about 243,000 students across
Figure 36
Cal Grant Eligibility Criteria2018-19
Financial Criteriaa
Cal Grant A and CFamily income ceiling: $88,900 to $114,300, depending on family size.Asset ceiling: $76,500.
Cal Grant BFamily income ceiling: $41,500 to $62,800, depending on family size. Asset ceiling: same as A and C.
Other Major Criteria
High School Entitlement (A and B)• High school senior or graduated from high school within the last year.• Minimum high school GPA of 3.0 for A award and 2.0 for B award.
Transfer Entitlement (A and B)• CCC student under age 28 transferring to a four-year school.• Minimum community college GPA of 2.4.
Competitive (A and B)• An individual ineligible for one of the entitlement awards, typically due to
age or time out of high school.• Minimum GPA requirements same as for entitlement awards.
Competitive (C)• Must be enrolled in career technical education program at least four
months long.• No minimum GPA.a Reflects criteria for dependent students. Different criteria apply to independent students
(generally those over age 24). GPA = grade point average.
gutter
analysis full

L E G I S L A T I V E A N A L Y S T ’ S O F F I C E
2 0 1 9 - 2 0 B U D G E T
60
all segments (public and private) received this award .
• Cal Grant C Book and Supply Award. The Legislature created this award in the early 1970s to help financially needy students pursue career technical education . Originally, students were required to use the award on training-related costs such as equipment, clothing, and transportation . Chapter 692 of 2014 (SB 1029, Jackson) expanded the allowable uses of the award to include living costs . Today, this award provides low- and middle-income students with $1,094 annually at CCC and $547 annually at private colleges . In 2017-18, about 8,000 students received this award .
In addition to Cal Grants, other state and federal aid programs assist students with their living expenses . We describe these programs in the nearby box .
Student Parents Comprise 9 Percent of Cal Grant Recipients. In 2017-18, about 371,000 students received a Cal Grant A, B, or C . As Figure 37 shows, about 32,000 (9 percent) of these students had a dependent child or children . Most student parents awarded a Cal Grant received a competitive award . Two-thirds of student parents awarded a Cal Grant attended CCC, and 20 percent attended CSU .
Most Student Parents Eligible for a Cal Grant Do Not Receive an Award. Under state law, only recent high school graduates and university students who transferred from a community college by a certain age are guaranteed a Cal Grant entitlement award . Most student parents do not meet these criteria and must instead apply for a competitive award . State law authorizes a limited number of competitive awards annually . Each year, the number of eligible applicants for new awards significantly exceeds the number of authorized new awards . Of about
62,000 student parents who were eligible for a new competitive award in 2017-18, about 44,000 (71 percent) did not receive one .
Governor’s Proposal
Governor Proposes $122 Million Ongoing to Increase Nontuition Coverage for Student Parents. As Figure 38 shows, the proposal would create a Cal Grant A Access award and would increase the size of the Cal Grant B Access award and Cal Grant C Book and Supply award for eligible student parents . The maximum grant for student parents attending full time would range from $4,000 to $6,000, depending on the award type . As with all Cal Grants, the award amount would be prorated downward for part-time students . Only student parents enrolled at CCC, CSU, and UC would be eligible for the higher grants . Student parents attending private colleges would be ineligible . The administration’s $122 million cost estimate assumes that most eligible student parents would receive the maximum award . The administration will likely adjust this estimate downward at May Revision to account for student parents who enroll part time .
Figure 37
Profile of Student Parents Receiving Cal Grants2017-18
Number Percent
Recipients by Award Type:a
Competitive award 25,215 79%Cal Grant C 3,149 10High School Entitlement award 2,217 7Transfer Entitlement award 1,270 4
Totals 31,851 100%
Recipients by Segment:California Community Colleges 21,392 67%California State University 6,475 20Private for-profit schools 1,600 5Private nonprofit schools 1,589 5University of California 766 2Other public schools 29 —b
Totals 31,851 100%a Reflects new and renewal awards.b Less than 0.5 percent.
gutter
analysis full

www.lao.ca.gov
2 0 1 9 - 2 0 B U D G E T
61
Assessment
Governor Identifies Potentially Important Area of Need, but Proposal Has Downsides. Student parents typically have higher living costs than other students . Beyond paying for child care, student parents provide food and cover other living costs for their dependents . Though student parents might benefit from additional financial aid, the Governor’s specific proposal for addressing their needs raises several concerns . Below, we describe three concerns with the proposal, then we discuss two areas where we believe additional information would allow policymakers to support student parents more effectively .
Proposal Further Complicates Financial Aid System for Students. Over the past few years, the Legislature has expressed an interest in making the state’s financial aid system easier for students to understand and navigate . Much of this conversation has centered around streamlining the Cal Grant program, which currently consists of multiple award types that each have different rules regarding eligibility and award amounts . The Governor’s
proposal to increase nontuition coverage for student parents acts counter to this objective . Rather than streamlining the Cal Grant program, the Governor’s proposal creates a new award (the Cal Grant A Access award), adds tiers to two existing awards (the Cal Grant B Access award and the Cal Grant C Book and Supply award), and introduces a new set of eligibility criteria and rules that applies only to one subset of financially needy students .
Proposal Does Not Strictly Target Aid Toward Highest-Need Students. A student’s financial need is determined primarily by a federal formula, which takes into account family size . While all Cal Grant recipients have financial need, the level of need varies widely . Because the Governor’s proposal provides additional aid based on a
Other Programs Assist Low-Income Students With Living Costs
Students May Receive Assistance From Other Financial Aid Programs. The federal Pell Grant program provides low-income students with awards of up to $6,095 annually that can be used for tuition or other expenses . Because Pell Grant recipients at California’s public segments typically receive tuition coverage through Cal Grants or other state-funded fee waivers, these students commonly use Pell Grants for living costs . At some segments, students with financial need also qualify for nontuition coverage beyond that provided through the Cal Grant program . At California Community Colleges, Cal Grant recipients who enroll full time are eligible for Student Success Completion Grants, which provide up to $4,000 annually for living costs . In addition, University of California’s institutional aid program provides grants on a sliding scale to assist with students’ living costs .
Qualifying Students Also May Participate in Public Assistance Programs. Some low-income students are also eligible for programs such as CalWORKs (cash assistance), CalFresh (food assistance), and subsidized child care and preschool . While student financial aid programs are administered by the California Student Aid Commission and the segments, public assistance programs are primarily administered by state and local social services agencies .
Figure 38
Proposed Increase in Nontuition Coverage for Student ParentsMaximum Annual Award for Full-Time Students at Public Segments
AwardCurrent
Award SizeAward Size Under
Governor’s Proposal
Cal Grant A Access — $6,000Cal Grant B Accessa $1,648 6,000Cal Grant C Book and Supply 1,094 4,000a Excludes $24 add-on from College Access Tax Credit.
gutter
analysis full

L E G I S L A T I V E A N A L Y S T ’ S O F F I C E
2 0 1 9 - 2 0 B U D G E T
62
student’s parental status rather than financial need, the proposal could have unintended distributional consequences . For example, the proposal could provide an additional $6,000 in aid to a student parent receiving a Cal Grant A award, while providing no additional aid to a lower-income dependent student receiving a Cal Grant B award . This is inconsistent with a need-based approach to prioritizing funding .
Under Proposal, Most Student Parents Still Would Not Receive a Cal Grant. Based on recent caseload data, the administration estimates that about 29,000 student parents would receive the proposed Cal Grant awards . Tens of thousands of other financially needy student parents, however, would not benefit from the proposal . Specifically, we estimate about 44,000 eligible student parents with financial need would not receive any Cal Grant award because of the limited number of competitive awards authorized each year . Additionally, we estimate another 3,000 student parents would not benefit from the proposal because they are attending private colleges .
More Information Needed on Other Public Assistance for Student Parents. Currently, state agencies do not collect and report comprehensive data on student parents’ participation in programs such as CalWORKs, CalFresh, and subsidized child care and preschool . As a result, policymakers have a limited understanding of the total benefits that student parents receive across these programs . Data on this issue would allow the Legislature to better understand the extent to which these programs collectively meet student parents’ needs and how much unmet need remains . The Legislature also may wish to explore options for (1) improving coordination between student financial aid and public assistance programs or (2) delivering students’ nontuition coverage all through one system . (As the Legislature evaluates its options, it likely will face tradeoffs between expanding nontuition coverage for students and expanding public assistance for low-income individuals more broadly .)
State in Midst of Collecting Updated Cost of Attendance Data. CSAC is currently administering the Student Expenses and Resources Survey (SEARS) for the first time since 2006-07 .
This survey collects data on what students in various demographic groups (including students with dependents) spend on housing, food, transportation, child care, and other living costs . CSAC anticipates that survey results will be available in fall 2019 . These data on living costs, coupled with information on unmet financial need, would allow the Legislature to make more informed decisions about nontuition coverage for student parents .
Recommendation
Reject Governor’s Proposal, but Consider Further Study of Student Parents’ Unmet Needs. The Governor’s proposal to expand nontuition coverage for student parents would further complicate the state’s financial aid system and could have unintended distributional effects . For these reasons, we recommend the Legislature reject this proposal . The proposal, however, raises important questions about the unmet financial need of student parents . If the Legislature wishes to pursue further information in this area, it could request that CSAC, the segments, and relevant social services agencies assess the costs facing student parents and the extent to which current financial aid and public assistance programs meet student parents’ needs .
CAL GRANT COMPETITIVE AWARDS
Below, we provide background on the Cal Grant competitive program, describe the Governor’s proposal to increase the number of competitive awards, assess the proposal, and offer an associated recommendation .
Background
CSAC Selects Competitive Award Recipients Based on Several Criteria. Cal Grant applicants who do not qualify for an entitlement award are considered for a limited number of competitive awards . CSAC uses a scoring matrix to prioritize among applicants . Each applicant is assigned a score out of a maximum 1,000 points . Those with the highest scores receive award offers . As Figure 39 shows, the scoring matrix places greatest weight on an applicant’s financial
gutter
analysis full

www.lao.ca.gov
2 0 1 9 - 2 0 B U D G E T
63
need . Applicants also receive points for certain socioeconomic factors and their GPA .
Statute Authorizes 25,750 New Competitive Awards Annually. The Legislature most recently expanded the competitive program in 2015-16, when it increased the number of new awards authorized annually from 22,500 to 25,750 . Under state law, half of the authorized awards are reserved for students attending CCC, while the remaining awards are available to students at all segments . Although competitive award recipients are eligible for either Cal Grant A or Cal Grant B, nearly all of them receive Cal Grant B (signifying they are lower income) .
Governor’s Proposal
Proposes Increasing Number of Competitive Awards. The Governor proposes to augment ongoing Cal Grant funding by $9 .6 million to support 4,250 additional competitive awards . This proposal would increase the total number of new competitive awards authorized annually to 30,000 . Consistent with current law, half of these awards would be reserved for students attending CCC .
Assessment
Number of Eligible Applicants Far Exceeds Current Supply of Awards. Since the competitive program was last expanded, between 295,000 and 325,000 eligible students have applied for a competitive award annually . Each year, only 11 percent of applicants have been offered awards . We estimate expanding the number of authorized awards by 4,250 would increase the share of eligible applicants offered an award to 12 percent, assuming no change in the number of eligible applicants or the associated paid rate .
Students Receiving Awards Have Relatively Low Income. The average income among students offered a competitive award in 2017-18 was under $8,000 . This is considerably lower than the average income of students offered a high school entitlement award (about $32,000) and students offered a transfer entitlement award (about $30,000) . In contrast, competitive recipients have an average high school GPA that is comparable to that of entitlement recipients (3 .1) .
Remaining Unserved Applicants Also Have High Financial Need. In 2017-18, the average income among approximately 290,000 eligible applicants not offered a competitive award was about $26,000 . This suggests that the Legislature could expand the supply of competitive awards by a substantial amount and still serve students who have high financial need . (As discussed in the box on page 64, additional data on Cal Grant recipients’ outcomes could further inform legislative decisions regarding potential expansion of the competitive program .)
Recommendation
Recommend Legislature Prioritize Increasing the Number of Competitive Awards. If the Legislature chooses to augment funding for Cal Grants, we think that increasing the number of competitive awards would be a reasonable use of funds . Currently, the number of applicants vastly exceeds the number of authorized awards, and the applicant pool is relatively low income . Should the Legislature wish to increase the number of new competitive awards beyond the 4,250 proposed by the Governor, we estimate that every $1 million would allow the state to authorize about 440 additional awards . (This estimate assumes no changes in tuition, the distribution of awards across
Figure 39
Competitive Award Scoring Matrix2018‑19
Component Maximum Points
Expected family contributiona 250Family income and size 250Dependentsb 100Parents’ educational level 100Disadvantaged high school experiencec 100Disadvantaged family experienced 100Grade point average 100
Total 1,000a Refers to how much a student’s family is expected to pay for college, as calculated
by a federal need-based formula.b Points awarded to single independent students with dependents.c Points awarded to students who attended schools with high poverty rates, schools
with low college-going rates, or continuation schools.d Points awarded to students who are foster youth, orphans, wards of the court,
unaccompanied, or at risk of homelessness.
gutter
analysis full

L E G I S L A T I V E A N A L Y S T ’ S O F F I C E
2 0 1 9 - 2 0 B U D G E T
64
segments and award types, and the percentage of available awards that are paid .)
MIDDLE CLASS SCHOLARSHIPS
Below, we provide background on the Middle Class Scholarship program and assess the Governor’s cost estimates for the program .
Background
Middle Class Scholarship Program Provides Partial Tuition Coverage at UC and CSU. Created in 2014-15, this state program benefits students at CSU and UC . To receive an award, students must complete a FAFSA or California Dream Act Application, but the program is not need-based according to the federal government’s financial aid formula . Students qualify for the program if they have household income and assets under a specified ceiling ($171,000 in 2018-19) . In 2018-19, a student with a household income of up to $114,000 qualified for the maximum award—40 percent of tuition and systemwide fees when combined with all other public financial aid . Awards are graduated downward as household income increases, with the minimum award set at 10 percent of tuition and systemwide fees .
Program Funding Is Capped Under State Law. Unlike Cal Grants, Middle Class Scholarships are not considered entitlements, and the program funding level has a statutory cap . If program funding is insufficient to cover the intended award amounts, awards are prorated downward . To date, CSAC has not had to prorate awards . Current law appropriates $101 million in 2018-19 and $117 million each year thereafter .
Cost Estimates
Governor’s Budget Reflects Higher Spending in 2018-19 and 2019-20. The administration revises the cost estimate for Middle Class Scholarships upward in 2018-19 by $1 .6 million (1 .6 percent) . Compared with the revised 2018-19 level, the administration projects a $2 .9 million (2 .8 percent) increase in 2019-20 . As Figure 40 shows, the increase for 2019-20 is driven by modest projected growth in both the number of recipients and average award amount . Based on the limited data available on trends over time, the administration’s estimates appear reasonable .
More Data on Competitive Cal Grant Recipients’ Outcomes Could Inform Future Legislative Decisions
The California Student Aid Commission currently does not track the impact of competitive awards on students’ academic and labor market outcomes . As a result, little is known about how the program affects key student outcomes, including degree completion, employment, earnings, college borrowing, and default rates . Moving forward, additional information on outcomes such as these would allow the Legislature to make more informed decisions about the competitive program .
Figure 40
Middle Class Scholarships—Key Cost Information
2017-18 Actual
2018-19 Revised
2019-20 Proposed
Change From 2018-19
Amount Percent
Recipients 51,293 51,848 52,420 572 1.1%Average award $1,948 $1,986 $2,019 $33 1.7Total cost (in millions) $100 $103 $106 $2.9 2.8
gutter
analysis full

www.lao.ca.gov
2 0 1 9 - 2 0 B U D G E T
65
SUMMARY OF RECOMMENDATIONS
CALIFORNIA COMMUNITY COLLEGES
Apportionments
• Adopt the Governor’s proposal to postpone the scheduled changes in apportionment formula rates by one year, allowing time for improvements in data quality .
• To limit volatility in state and district apportionment funding, use a three-year rolling average of student outcome data for distributing the student success allocation .
• Reject the Governor’s proposal to set a cap on annual growth in districts’ student success allocations . The cap is a crude cost-containment approach that would reduce the incentives districts have for making genuine improvements in student outcomes .
• Explore cost-containment options that retain strong incentives for districts to make genuine improvements in student outcomes . For example, link outcomes-based funding to the highest award a student earns .
College Promise
• Reject the Governor’s proposal to provide a $40 million ongoing augmentation for the California College Promise program because (1) first-year results of the program are not yet available, (2) the program primarily benefits students without financial need, and (3) colleges now have stronger incentives to boost student support .
Facilities
• Consider approving more capital outlay projects than proposed by the Governor . Evaluate projects based on the Chancellor’s Office priority categories or develop another set of clear, agreed-upon criteria .
• Direct the administration and the Chancellor’s Office to develop an agreed-upon framework for assessing life safety issues .
• If the administration and Chancellor’s Office cannot come to an agreement, codify a life safety framework in statute that (1) ensures state funding is available in case of a facility emergency, (2) has strong incentives for districts to maintain their facilities in good condition, and (3) ensures districts provide a local contribution based on their local resources .
gutter
analysis full

L E G I S L A T I V E A N A L Y S T ’ S O F F I C E
2 0 1 9 - 2 0 B U D G E T
66
CALIFORNIA STATE UNIVERSITY (CSU)
Compensation and Other Operational Costs
• Consider revisiting how prescriptive to be with CSU staffing decisions, including whether to fund all CSU pension costs directly or give full responsibility for those costs to CSU and its bargaining units .
• Prior to the next round of collective bargaining negotiations, encourage the Chancellor’s Office to commission a staffing and compensation analysis .
• Signal to CSU legislative expectations on employee contracts that will be negotiated for 2020-21 .
Enrollment
• Set an enrollment expectation for CSU in the budget year . Consider several demographic and policy factors in setting the expectation . Whereas most factors suggest holding CSU enrollment flat in 2019-20, a few factors suggest some enrollment growth may be justified .
Graduation Initiative
• If funding is provided for the Graduation Initiative, set an expectation that CSU continue to make progress on key student outcomes, including improving graduation rates for all students, narrowing achievement gaps, and reducing excess unit taking .
• To create a stronger incentive for students to avoid excess unit accumulation and maximize aid for other students, direct CSU to limit its State University Grants to four years of full-time attendance or its equivalent in units .
• To reduce excess unit taking, direct CSU to allow a student to repeat a course only once for the purpose of earning a higher grade .
• Require CSU to submit data on course repetition as part of its statutorily required annual performance report .
Project Rebound
• Rather than providing a very small augmentation ($250,000) for Project Rebound, as proposed by the Governor, encourage CSU to place a high priority on leveraging Graduation Initiative and campus funding to support formerly incarcerated students .
• Consider requiring the Chancellor’s Office to report regularly on the academic outcomes of formerly incarcerated students .
gutter
analysis full

www.lao.ca.gov
2 0 1 9 - 2 0 B U D G E T
67
Facilities
• Direct CSU to examine less-costly alternatives to the Peterson Hall 1 replacement building project at the Long Beach campus .
• Signal to the administration to reject the proposed new Applied Sciences and Technology Building at the San Marcos campus given the proposal’s lack of (1) a clear statement about its purpose, (2) justification for space needs, and (3) a thorough evaluation of alternatives .
• Signal to the administration to reject the proposed new Energy and Engineering Innovation Center at the Bakersfield campus given that additional space is not justified based upon a utilization analysis of the campus’ existing facilities .
• Consider the cost/benefit tradeoffs of building a new theater at the San Diego campus in addition to renovating an existing theater at the campus .
• Adopt proposed $247 million in one-time General Fund support for deferred maintenance on the condition that CSU report at spring hearings on the specific projects it plans to undertake . Require Department of Finance to report no later than January 1, 2023 on the status of these projects .
• Require CSU to submit by December 1, 2019 a long-term plan for eliminating its maintenance backlog .
• Withhold recommendation on permitting CSU to use one-time monies for campus child care facilities pending receipt of additional information and justification from the administration on the proposal .
Covering Cost Increases
• To improve tuition predictability for nonfinancially needy students and their households, consider increasing the state’s budget reserve beyond the level proposed in the Governor’s budget .
• Consider having student tuition cover a share of CSU’s 2019-20 cost increases to free up state General Fund that could be used for building higher reserves .
• Adopt a policy explicitly establishing what share of costs nonfinancially needy students should pay . Such a policy improves budget transparency and signals to students an expectation that they be treated similarly whether enrolling in college during an economic recovery or recession .
gutter
analysis full

L E G I S L A T I V E A N A L Y S T ’ S O F F I C E
2 0 1 9 - 2 0 B U D G E T
68
UNIVERSITY OF CALIFORNIA (UC)
Compensation and Other Operational Costs
• Recognize $89 million in estimated 2019-20 cost increases for UC’s equipment purchases, utilities, employee health program, pension program, and retiree health program .
• Consider recruitment and retention issues when evaluating UC’s compensation decisions for represented and nonrepresented employees .
Enrollment Growth
• Consider how to cover the ongoing cost of enrollment growth that UC supported with one-time funds in 2018-19 . The Governor’s proposal to provide $10 million ongoing to sustain about half of that growth is one reasonable approach .
• Align the state’s budget decisions with the timing of UC’s admission decisions by adopting an enrollment target for 2020-21 .
• Regarding whether to grow enrollment in 2020-21, consider (1) UC’s recent practice of drawing beyond its traditional freshman eligibility pool, (2) the slight decline in the projected number of high school graduates in spring 2019, and (3) the notable number of eligible freshman applicants who are referred to Merced .
• If enrollment growth is desired in 2020-21, fund it based upon the marginal per-student cost of instruction and support with ongoing funds .
Student Success
• Before approving funding for a new student success initiative at UC:
» Identify a few explicit objectives, such as increasing graduation rates at all campuses and narrowing undergraduate achievement gaps .
» Set clear performance targets, such as increasing graduation rates at all campuses to a specified level and eliminating achievement gaps among student groups within a specified timeframe .
» To ensure funding aligns with the cost of meeting performance expectations, direct UC to develop an expenditure plan .
• If funding is provided, require UC to report annually on its progress in meeting performance targets and campuses’ use of the funds .
Extended Education
• Reject the Governor’s proposal to provide UC $15 million in one-time funding to expand its extended education programs, as the existing proposal lacks adequate justification .
• If the administration and UC remain interested in expanding these programs, direct them to present a more complete analysis next year . Such an analysis should include research into which groups of students are interested in returning, why the state’s current array of
gutter
analysis full
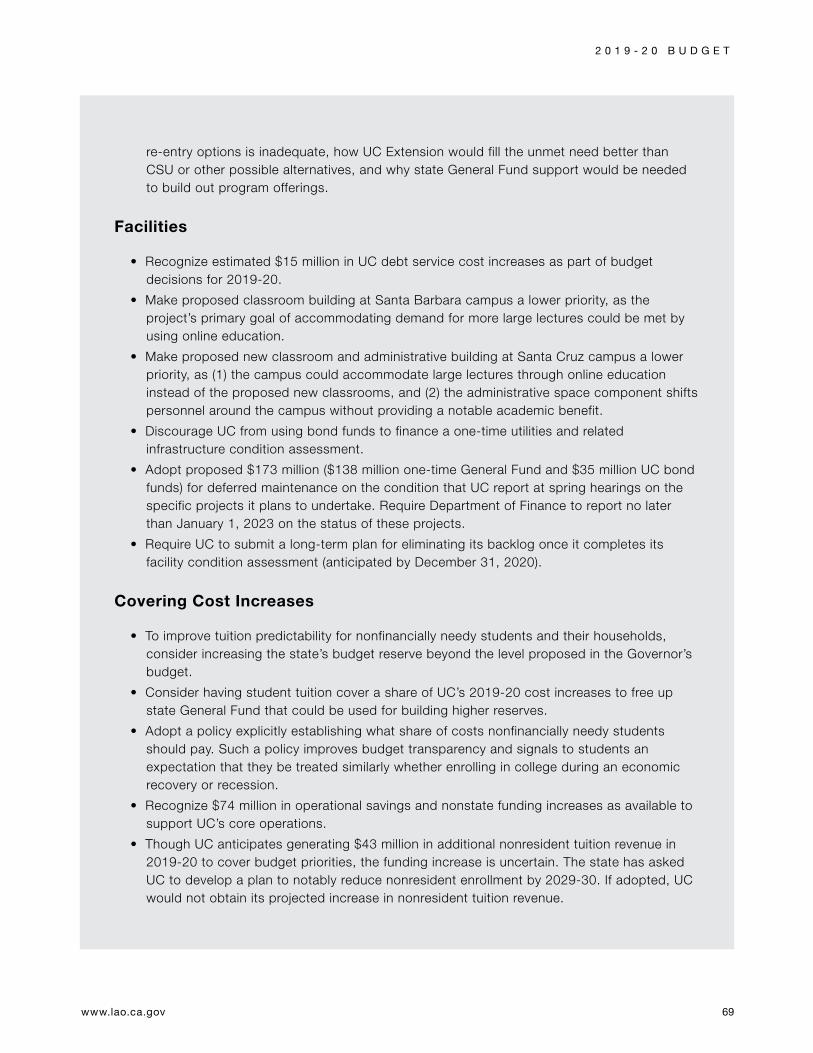
www.lao.ca.gov
2 0 1 9 - 2 0 B U D G E T
69
re-entry options is inadequate, how UC Extension would fill the unmet need better than CSU or other possible alternatives, and why state General Fund support would be needed to build out program offerings .
Facilities
• Recognize estimated $15 million in UC debt service cost increases as part of budget decisions for 2019-20 .
• Make proposed classroom building at Santa Barbara campus a lower priority, as the project’s primary goal of accommodating demand for more large lectures could be met by using online education .
• Make proposed new classroom and administrative building at Santa Cruz campus a lower priority, as (1) the campus could accommodate large lectures through online education instead of the proposed new classrooms, and (2) the administrative space component shifts personnel around the campus without providing a notable academic benefit .
• Discourage UC from using bond funds to finance a one-time utilities and related infrastructure condition assessment .
• Adopt proposed $173 million ($138 million one-time General Fund and $35 million UC bond funds) for deferred maintenance on the condition that UC report at spring hearings on the specific projects it plans to undertake . Require Department of Finance to report no later than January 1, 2023 on the status of these projects .
• Require UC to submit a long-term plan for eliminating its backlog once it completes its facility condition assessment (anticipated by December 31, 2020) .
Covering Cost Increases
• To improve tuition predictability for nonfinancially needy students and their households, consider increasing the state’s budget reserve beyond the level proposed in the Governor’s budget .
• Consider having student tuition cover a share of UC’s 2019-20 cost increases to free up state General Fund that could be used for building higher reserves .
• Adopt a policy explicitly establishing what share of costs nonfinancially needy students should pay . Such a policy improves budget transparency and signals to students an expectation that they be treated similarly whether enrolling in college during an economic recovery or recession .
• Recognize $74 million in operational savings and nonstate funding increases as available to support UC’s core operations .
• Though UC anticipates generating $43 million in additional nonresident tuition revenue in 2019-20 to cover budget priorities, the funding increase is uncertain . The state has asked UC to develop a plan to notably reduce nonresident enrollment by 2029-30 . If adopted, UC would not obtain its projected increase in nonresident tuition revenue .
gutter
analysis full

L E G I S L A T I V E A N A L Y S T ’ S O F F I C E
2 0 1 9 - 2 0 B U D G E T
70
CALIFORNIA STUDENT AID COMMISSION (CSAC)
Cal Grants
• Reject providing $122 million ongoing for nontuition coverage for student parents receiving Cal Grants, as proposal would complicate the state’s financial aid system and could have unintended distributional effects .
• Consider requesting additional information from CSAC, the segments, and relevant social services agencies on the extent to which financial aid and public assistance programs currently meet student parents’ needs .
• Prioritize the Governor’s proposal to provide $9 .6 million ongoing for 4,250 additional Cal Grant competitive awards, as the current number of financially needy applicants greatly exceeds the number of authorized awards .
• For each additional $1 million, the Legislature could authorize 440 additional Cal Grant competitive awards .
gutter
analysis full

www.lao.ca.gov
2 0 1 9 - 2 0 B U D G E T
71
gutter
analysis full

L E G I S L A T I V E A N A L Y S T ’ S O F F I C E
2 0 1 9 - 2 0 B U D G E T
72
LAO PUBLICATIONS
This report was reviewed by Jennifer Kuhn Pacella. The Legislative Analyst’s Office (LAO) is a nonpartisan office that provides fiscal and policy information and advice to the Legislature.
To request publications call (916) 445-4656. This report and others, as well as an e-mail subscription service, are available on the LAO’s website at www.lao.ca.gov. The LAO is located at 925 L Street, Suite 1000, Sacramento, CA 95814.
Contact Information
Edgar Cabral California Community Colleges 916-319-8343 [email protected]
Jason Constantouros University of California 916-319-8322 [email protected]
Lisa Qing California Student Aid Commission 916-319-8306 [email protected]
Paul Steenhausen California State University 916-319-8303 [email protected]
gutter
analysis full