
THE 2017 CEFOR NOMIS OCEAN HULL REPORT reports/2017/2017 Cefor... · The Nordic Marine Insurance...
57
THE 2017 CEFOR NOMIS OCEAN HULL REPORT (VESSELS WITH REGISTERED IMO NUMBER) Nordic Marine Insurance Statistics as of 31 December 2017
Transcript of THE 2017 CEFOR NOMIS OCEAN HULL REPORT reports/2017/2017 Cefor... · The Nordic Marine Insurance...
THE 2017 CEFOR NOMIS OCEAN HULL REPORT(VESSELS WITH REGISTERED IMO NUMBER)
Nordic Marine Insurance Statistics as of 31 December 2017
OCEAN HULL REPORT – INCLUDED DATA
• Underwriting years 1996-2017
• Vessels with a registered IMO-number.
(For statistics on small coastal tonnage, see
«The 2017 Cefor NoMIS COASTAL Hull report»)
• If not indicated otherwise on the slide, figures are presented
‐ on accident year basis (claims allocated to the calendar year in
which the claim occurred).
‐ as reported by 31 December 2017 (i.e. without IBNR loading for
claims not yet registered or incurred by this date).
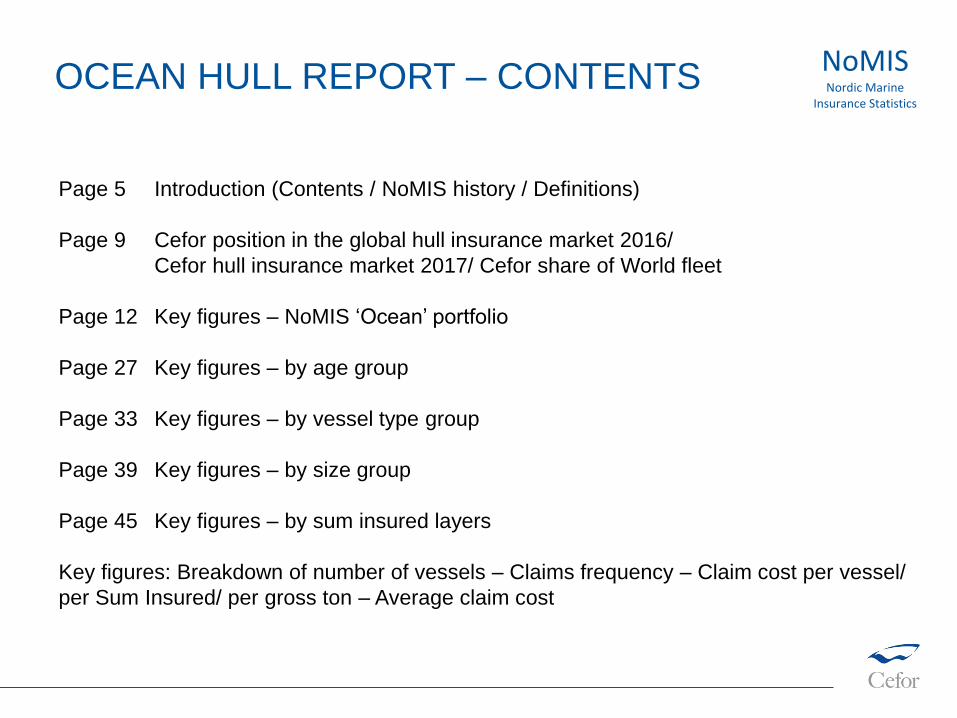
Page 5 Introduction (Contents / NoMIS history / Definitions)
Page 9 Cefor position in the global hull insurance market 2016/
Cefor hull insurance market 2017/ Cefor share of World fleet
Page 12 Key figures – NoMIS ‘Ocean’ portfolio
Page 27 Key figures – by age group
Page 33 Key figures – by vessel type group
Page 39 Key figures – by size group
Page 45 Key figures – by sum insured layers
Key figures: Breakdown of number of vessels – Claims frequency – Claim cost per vessel/
per Sum Insured/ per gross ton – Average claim cost
OCEAN HULL REPORT – CONTENTSNoMISNordic Marine
Insurance Statistics
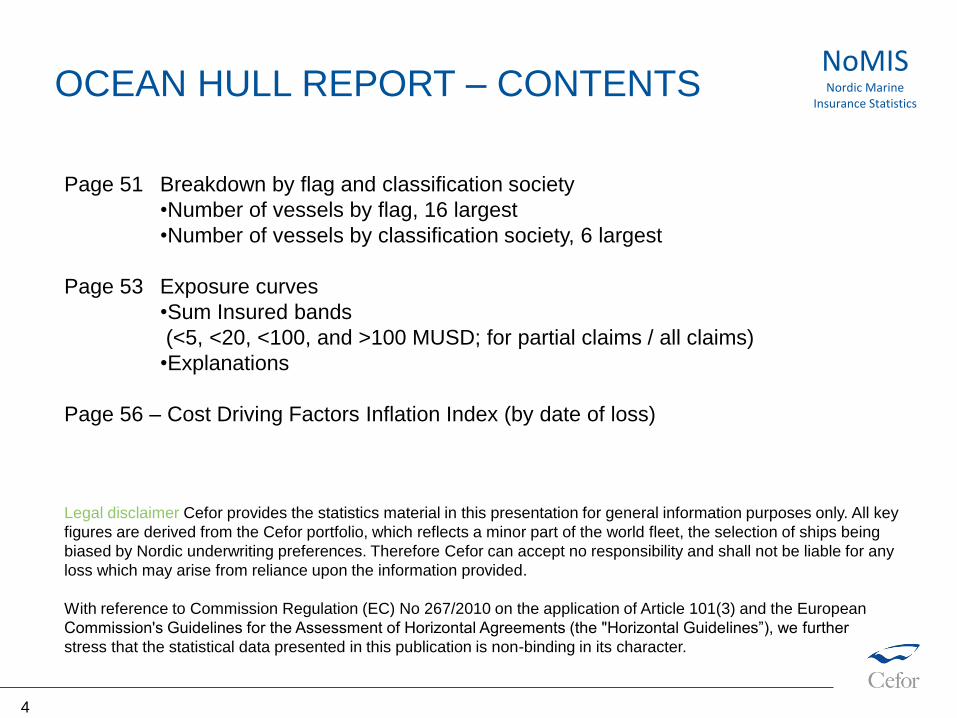
Page 51 Breakdown by flag and classification society
•Number of vessels by flag, 16 largest
•Number of vessels by classification society, 6 largest
Page 53 Exposure curves
•Sum Insured bands
(<5, <20, <100, and >100 MUSD; for partial claims / all claims)
•Explanations
Page 56 – Cost Driving Factors Inflation Index (by date of loss)
Legal disclaimer Cefor provides the statistics material in this presentation for general information purposes only. All key
figures are derived from the Cefor portfolio, which reflects a minor part of the world fleet, the selection of ships being
biased by Nordic underwriting preferences. Therefore Cefor can accept no responsibility and shall not be liable for any
loss which may arise from reliance upon the information provided.
With reference to Commission Regulation (EC) No 267/2010 on the application of Article 101(3) and the European
Commission's Guidelines for the Assessment of Horizontal Agreements (the "Horizontal Guidelines”), we further
stress that the statistical data presented in this publication is non-binding in its character.
OCEAN HULL REPORT – CONTENTS
4
NoMISNordic Marine
Insurance Statistics
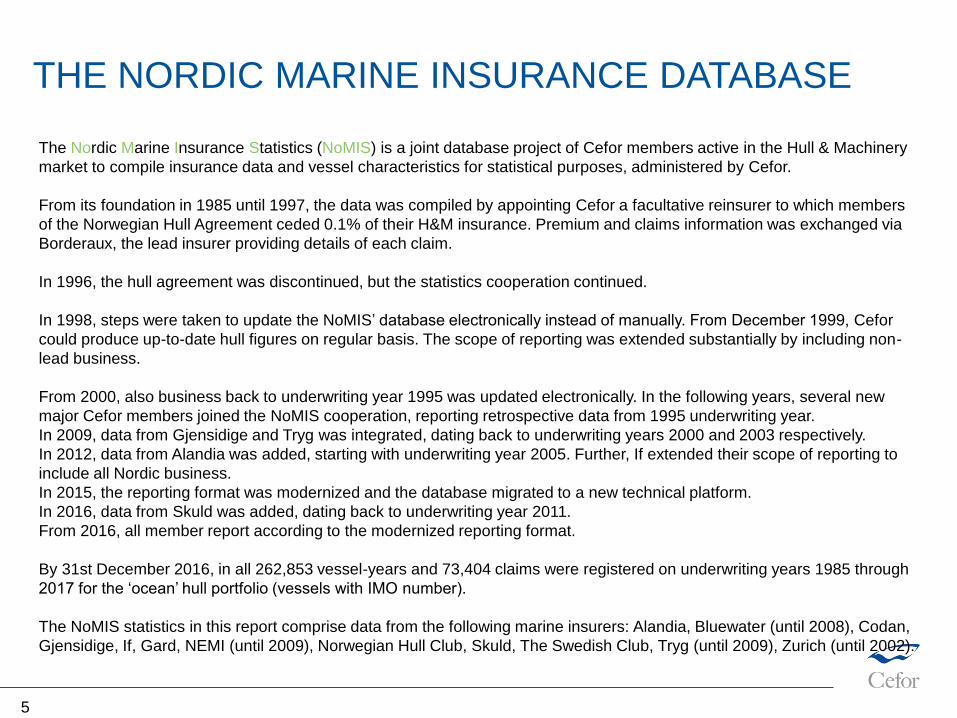
The Nordic Marine Insurance Statistics (NoMIS) is a joint database project of Cefor members active in the Hull & Machinery
market to compile insurance data and vessel characteristics for statistical purposes, administered by Cefor.
From its foundation in 1985 until 1997, the data was compiled by appointing Cefor a facultative reinsurer to which members
of the Norwegian Hull Agreement ceded 0.1% of their H&M insurance. Premium and claims information was exchanged via
Borderaux, the lead insurer providing details of each claim.
In 1996, the hull agreement was discontinued, but the statistics cooperation continued.
In 1998, steps were taken to update the NoMIS’ database electronically instead of manually. From December 1999, Cefor
could produce up-to-date hull figures on regular basis. The scope of reporting was extended substantially by including non-
lead business.
From 2000, also business back to underwriting year 1995 was updated electronically. In the following years, several new
major Cefor members joined the NoMIS cooperation, reporting retrospective data from 1995 underwriting year.
In 2009, data from Gjensidige and Tryg was integrated, dating back to underwriting years 2000 and 2003 respectively.
In 2012, data from Alandia was added, starting with underwriting year 2005. Further, If extended their scope of reporting to
include all Nordic business.
In 2015, the reporting format was modernized and the database migrated to a new technical platform.
In 2016, data from Skuld was added, dating back to underwriting year 2011.
From 2016, all member report according to the modernized reporting format.
By 31st December 2016, in all 262,853 vessel-years and 73,404 claims were registered on underwriting years 1985 through
2017 for the ‘ocean’ hull portfolio (vessels with IMO number).
The NoMIS statistics in this report comprise data from the following marine insurers: Alandia, Bluewater (until 2008), Codan,
Gjensidige, If, Gard, NEMI (until 2009), Norwegian Hull Club, Skuld, The Swedish Club, Tryg (until 2009), Zurich (until 2002).
THE NORDIC MARINE INSURANCE DATABASE
5
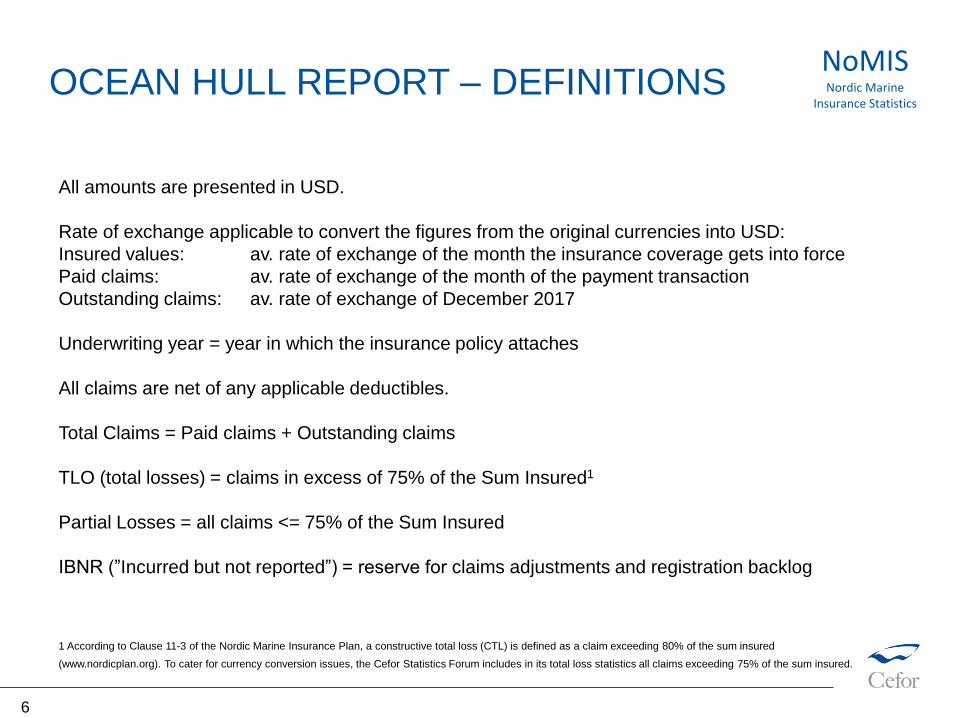
All amounts are presented in USD.
Rate of exchange applicable to convert the figures from the original currencies into USD:
Insured values: av. rate of exchange of the month the insurance coverage gets into force
Paid claims: av. rate of exchange of the month of the payment transaction
Outstanding claims: av. rate of exchange of December 2017
Underwriting year = year in which the insurance policy attaches
All claims are net of any applicable deductibles.
Total Claims = Paid claims + Outstanding claims
TLO (total losses) = claims in excess of 75% of the Sum Insured1
Partial Losses = all claims <= 75% of the Sum Insured
IBNR (”Incurred but not reported”) = reserve for claims adjustments and registration backlog
OCEAN HULL REPORT – DEFINITIONS
6
NoMISNordic Marine
Insurance Statistics
1 According to Clause 11-3 of the Nordic Marine Insurance Plan, a constructive total loss (CTL) is defined as a claim exceeding 80% of the sum insured
(www.nordicplan.org). To cater for currency conversion issues, the Cefor Statistics Forum includes in its total loss statistics all claims exceeding 75% of the sum insured.
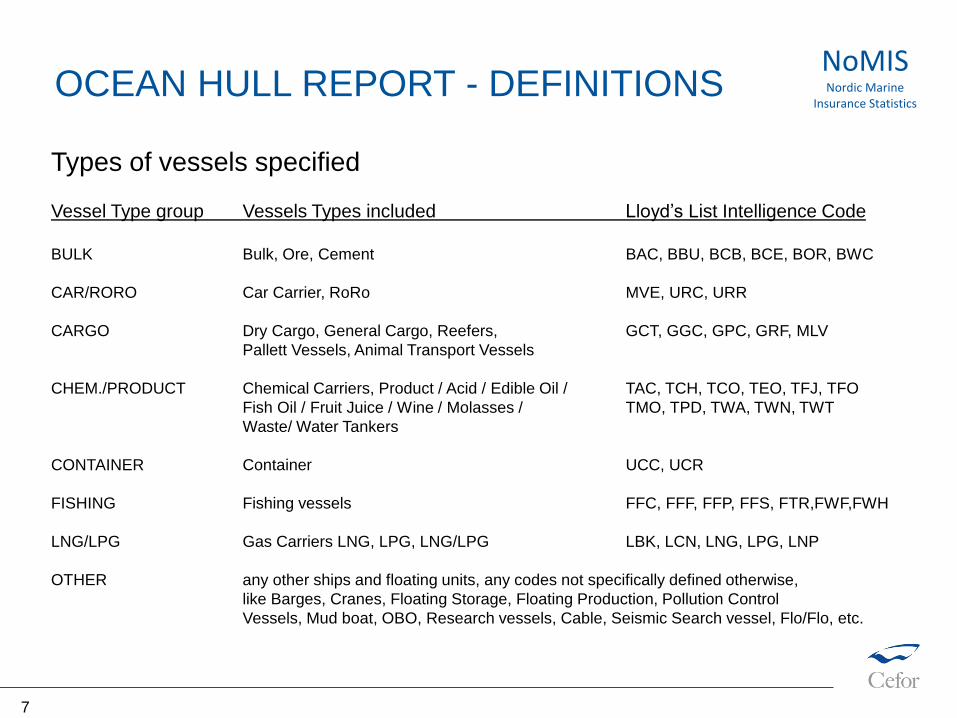
Types of vessels specified
Vessel Type group Vessels Types included Lloyd’s List Intelligence Code
BULK Bulk, Ore, Cement BAC, BBU, BCB, BCE, BOR, BWC
CAR/RORO Car Carrier, RoRo MVE, URC, URR
CARGO Dry Cargo, General Cargo, Reefers, GCT, GGC, GPC, GRF, MLV
Pallett Vessels, Animal Transport Vessels
CHEM./PRODUCT Chemical Carriers, Product / Acid / Edible Oil / TAC, TCH, TCO, TEO, TFJ, TFO
Fish Oil / Fruit Juice / Wine / Molasses / TMO, TPD, TWA, TWN, TWT
Waste/ Water Tankers
CONTAINER Container UCC, UCR
FISHING Fishing vessels FFC, FFF, FFP, FFS, FTR,FWF,FWH
LNG/LPG Gas Carriers LNG, LPG, LNG/LPG LBK, LCN, LNG, LPG, LNP
OTHER any other ships and floating units, any codes not specifically defined otherwise,
like Barges, Cranes, Floating Storage, Floating Production, Pollution Control
Vessels, Mud boat, OBO, Research vessels, Cable, Seismic Search vessel, Flo/Flo, etc.
OCEAN HULL REPORT - DEFINITIONSNoMISNordic Marine
Insurance Statistics
7
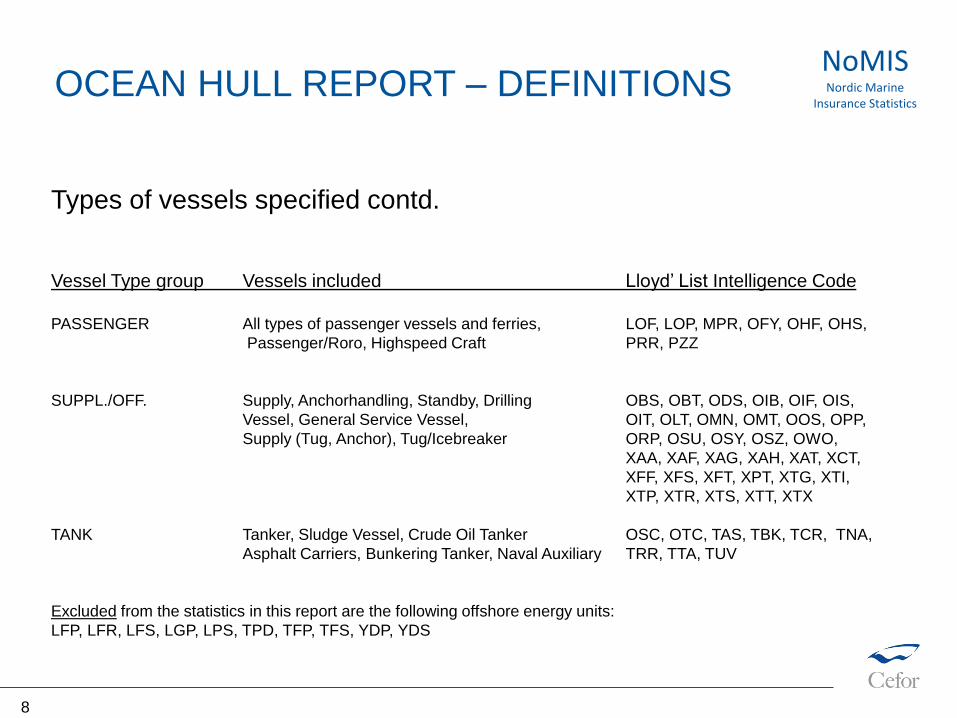
Types of vessels specified contd.
Vessel Type group Vessels included Lloyd’ List Intelligence Code
PASSENGER All types of passenger vessels and ferries, LOF, LOP, MPR, OFY, OHF, OHS,
Passenger/Roro, Highspeed Craft PRR, PZZ
SUPPL./OFF. Supply, Anchorhandling, Standby, Drilling OBS, OBT, ODS, OIB, OIF, OIS,
Vessel, General Service Vessel, OIT, OLT, OMN, OMT, OOS, OPP,
Supply (Tug, Anchor), Tug/Icebreaker ORP, OSU, OSY, OSZ, OWO,
XAA, XAF, XAG, XAH, XAT, XCT,
XFF, XFS, XFT, XPT, XTG, XTI,
XTP, XTR, XTS, XTT, XTX
TANK Tanker, Sludge Vessel, Crude Oil Tanker OSC, OTC, TAS, TBK, TCR, TNA,
Asphalt Carriers, Bunkering Tanker, Naval Auxiliary TRR, TTA, TUV
Excluded from the statistics in this report are the following offshore energy units:
LFP, LFR, LFS, LGP, LPS, TPD, TFP, TFS, YDP, YDS
OCEAN HULL REPORT – DEFINITIONS NoMISNordic Marine
Insurance Statistics
8
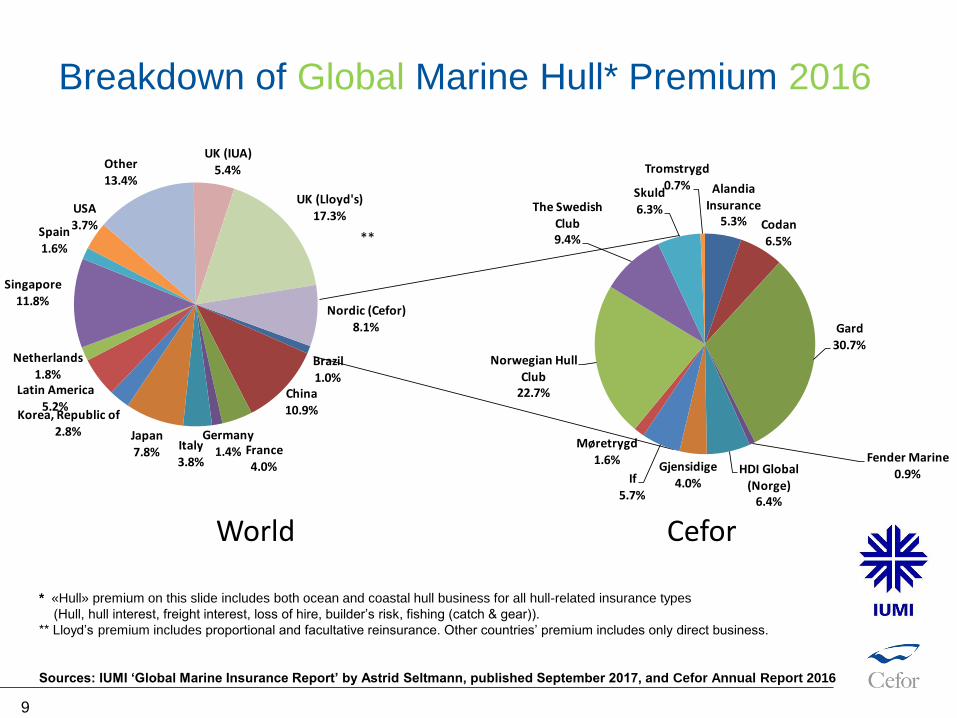
Brazil1.0%
China10.9%
France4.0%
Germany1.4%Italy
3.8%
Japan7.8%
Korea, Republic of
2.8%
Latin America5.2%
Netherlands1.8%
Singapore11.8%
Spain
1.6%
USA
3.7%
Other13.4%
UK (IUA)5.4%
UK (Lloyd's)17.3%
Nordic (Cefor)8.1%
Alandia Insurance
5.3% Codan6.5%
Gard
30.7%
Fender Marine0.9%HDI Global
(Norge)6.4%
Gjensidige4.0%If
5.7%
Møretrygd
1.6%
Norwegian Hull Club
22.7%
The Swedish Club9.4%
Skuld6.3%
Tromstrygd0.7%
Breakdown of Global Marine Hull* Premium 2016
World Cefor
* «Hull» premium on this slide includes both ocean and coastal hull business for all hull-related insurance types
(Hull, hull interest, freight interest, loss of hire, builder’s risk, fishing (catch & gear)).
** Lloyd’s premium includes proportional and facultative reinsurance. Other countries’ premium includes only direct business.
Sources: IUMI ‘Global Marine Insurance Report’ by Astrid Seltmann, published September 2017, and Cefor Annual Report 2016
**
9
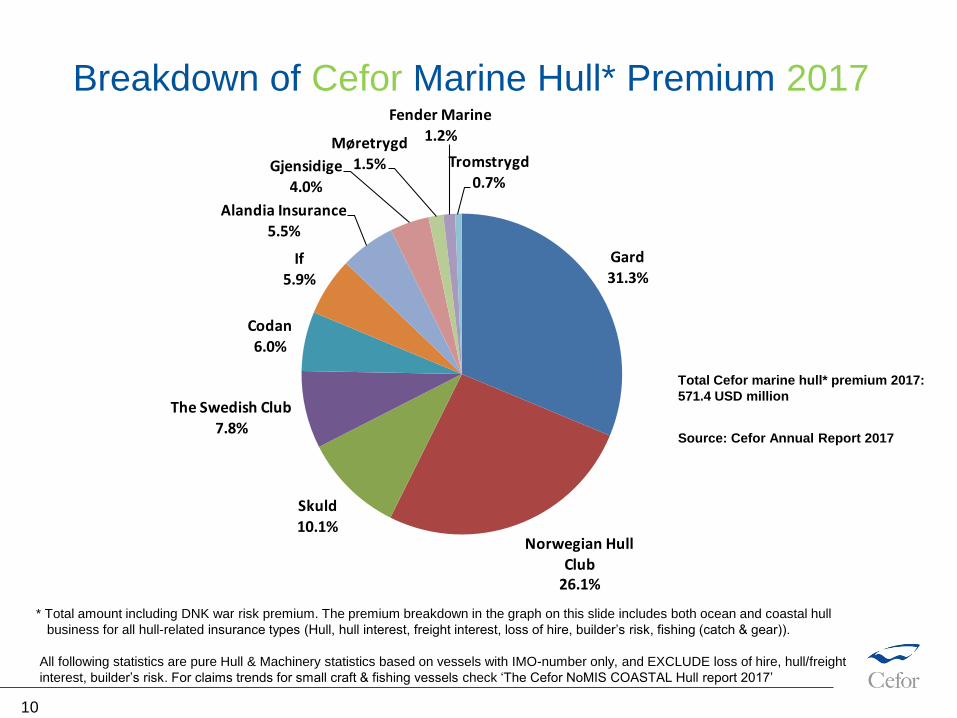
Gard
31.3%
Norwegian Hull Club
26.1%
Skuld
10.1%
The Swedish Club7.8%
Codan6.0%
If5.9%
Alandia Insurance
5.5%
Gjensidige4.0%
Møretrygd
1.5%
Fender Marine1.2%
Tromstrygd
0.7%
Breakdown of Cefor Marine Hull* Premium 2017
* Total amount including DNK war risk premium. The premium breakdown in the graph on this slide includes both ocean and coastal hull
business for all hull-related insurance types (Hull, hull interest, freight interest, loss of hire, builder’s risk, fishing (catch & gear)).
All following statistics are pure Hull & Machinery statistics based on vessels with IMO-number only, and EXCLUDE loss of hire, hull/freight
interest, builder’s risk. For claims trends for small craft & fishing vessels check ‘The Cefor NoMIS COASTAL Hull report 2017’
Total Cefor marine hull* premium 2017:
571.4 USD million
10
Source: Cefor Annual Report 2017
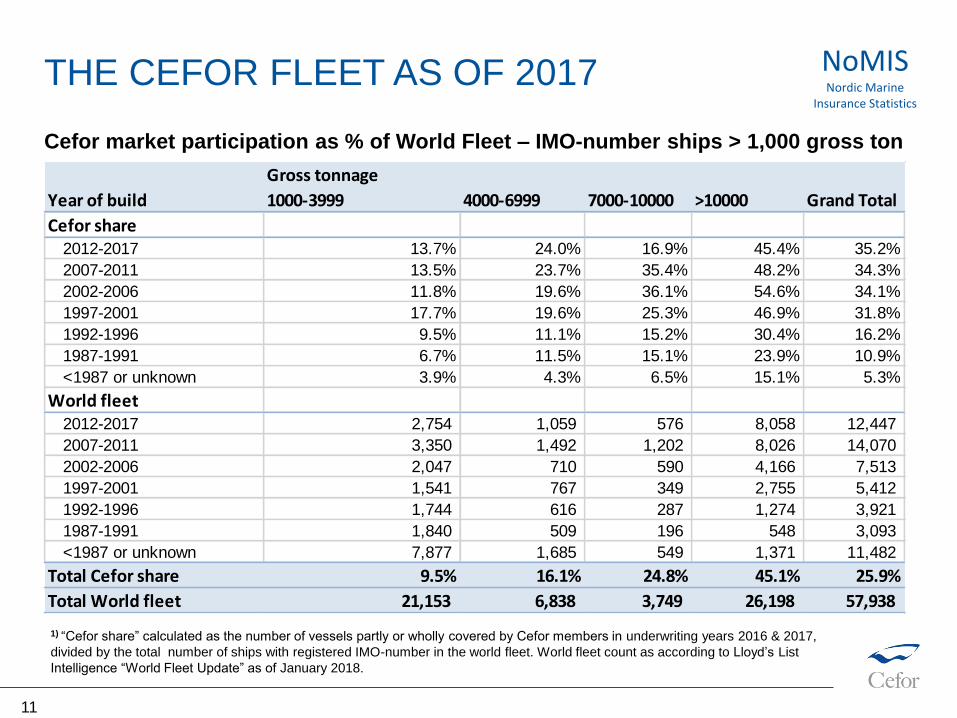
Cefor market participation as % of World Fleet – IMO-number ships > 1,000 gross ton
1) “Cefor share” calculated as the number of vessels partly or wholly covered by Cefor members in underwriting years 2016 & 2017,
divided by the total number of ships with registered IMO-number in the world fleet. World fleet count as according to Lloyd’s List
Intelligence “World Fleet Update” as of January 2018.
1)
THE CEFOR FLEET AS OF 2017 NoMISNordic Marine
Insurance Statistics
11
Gross tonnage
Year of build 1000-3999 4000-6999 7000-10000 >10000 Grand Total
Cefor share2012-2017 13.7% 24.0% 16.9% 45.4% 35.2%
2007-2011 13.5% 23.7% 35.4% 48.2% 34.3%
2002-2006 11.8% 19.6% 36.1% 54.6% 34.1%
1997-2001 17.7% 19.6% 25.3% 46.9% 31.8%
1992-1996 9.5% 11.1% 15.2% 30.4% 16.2%
1987-1991 6.7% 11.5% 15.1% 23.9% 10.9%
<1987 or unknown 3.9% 4.3% 6.5% 15.1% 5.3%
World fleet2012-2017 2,754 1,059 576 8,058 12,447
2007-2011 3,350 1,492 1,202 8,026 14,070
2002-2006 2,047 710 590 4,166 7,513
1997-2001 1,541 767 349 2,755 5,412
1992-1996 1,744 616 287 1,274 3,921
1987-1991 1,840 509 196 548 3,093
<1987 or unknown 7,877 1,685 549 1,371 11,482
Total Cefor share 9.5% 16.1% 24.8% 45.1% 25.9%
Total World fleet 21,153 6,838 3,749 26,198 57,938
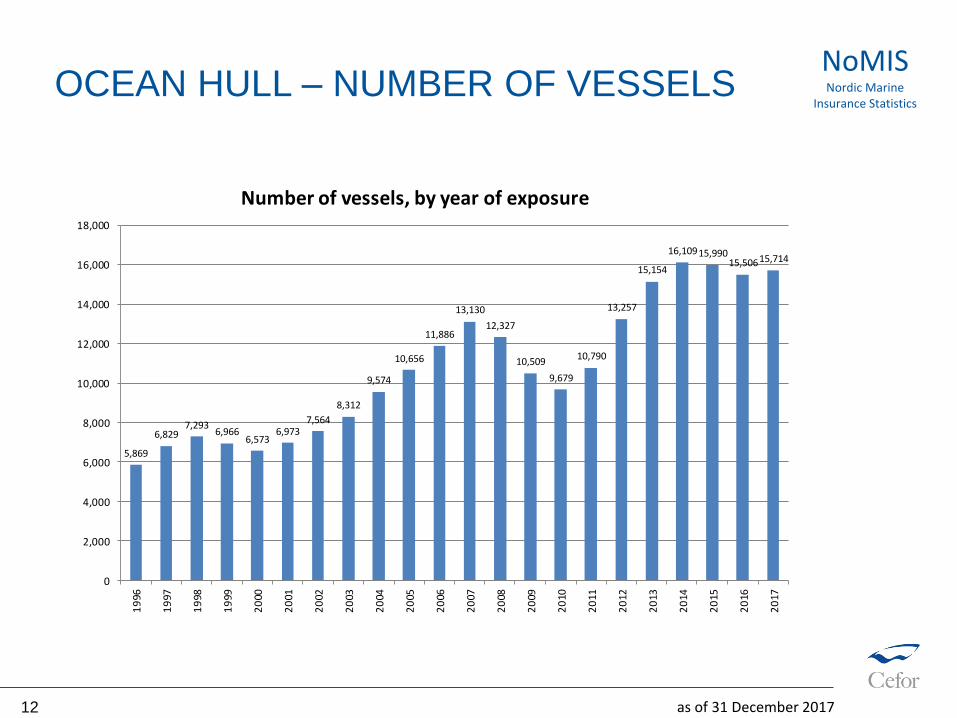
OCEAN HULL – NUMBER OF VESSELS
as of 31 December 2017
NoMISNordic Marine
Insurance Statistics
12
5,869
6,8297,293
6,9666,573
6,9737,564
8,312
9,574
10,656
11,886
13,130
12,327
10,509
9,679
10,790
13,257
15,154
16,10915,99015,50615,714
0
2,000
4,000
6,000
8,000
10,000
12,000
14,000
16,000
18,000
19
96
19
97
19
98
19
99
20
00
20
01
20
02
20
03
20
04
20
05
20
06
20
07
20
08
20
09
20
10
20
11
20
12
20
13
20
14
20
15
20
16
20
17
Number of vessels, by year of exposure
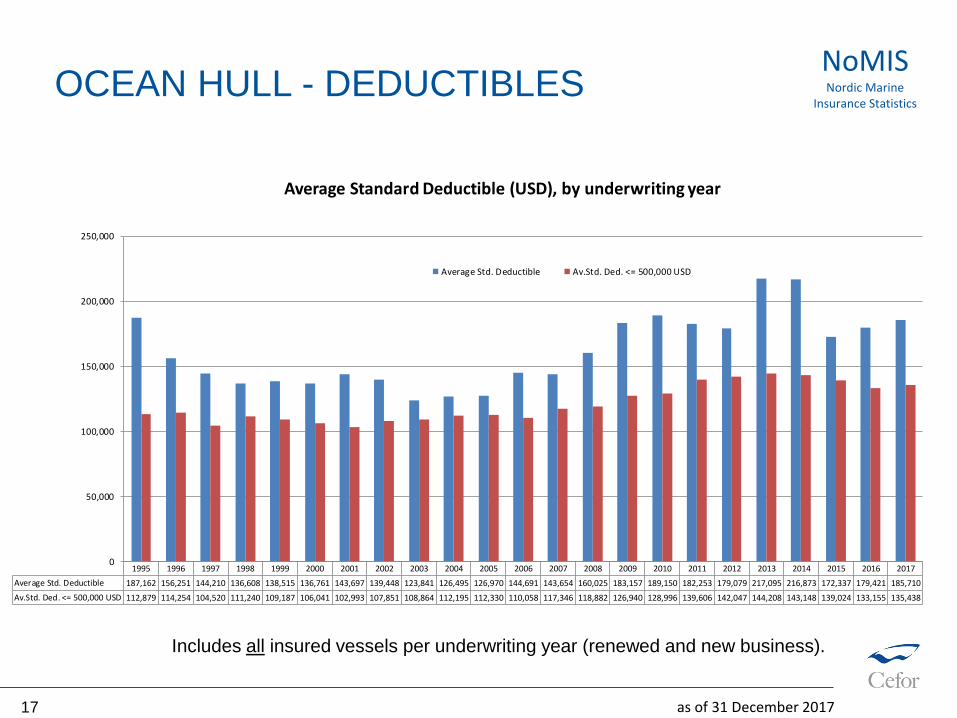
Includes all insured vessels per underwriting year (renewed & new business).
OCEAN HULL – INSURED VALUES
as of 31 December 2017
NoMISNordic Marine
Insurance Statistics
13
0
5,000,000
10,000,000
15,000,000
20,000,000
25,000,000
30,000,000
35,000,000
40,000,000
19
95
19
96
19
97
19
98
19
99
20
00
20
01
20
02
20
03
20
04
20
05
20
06
20
07
20
08
20
09
20
10
20
11
20
12
20
13
20
14
20
15
20
16
20
17
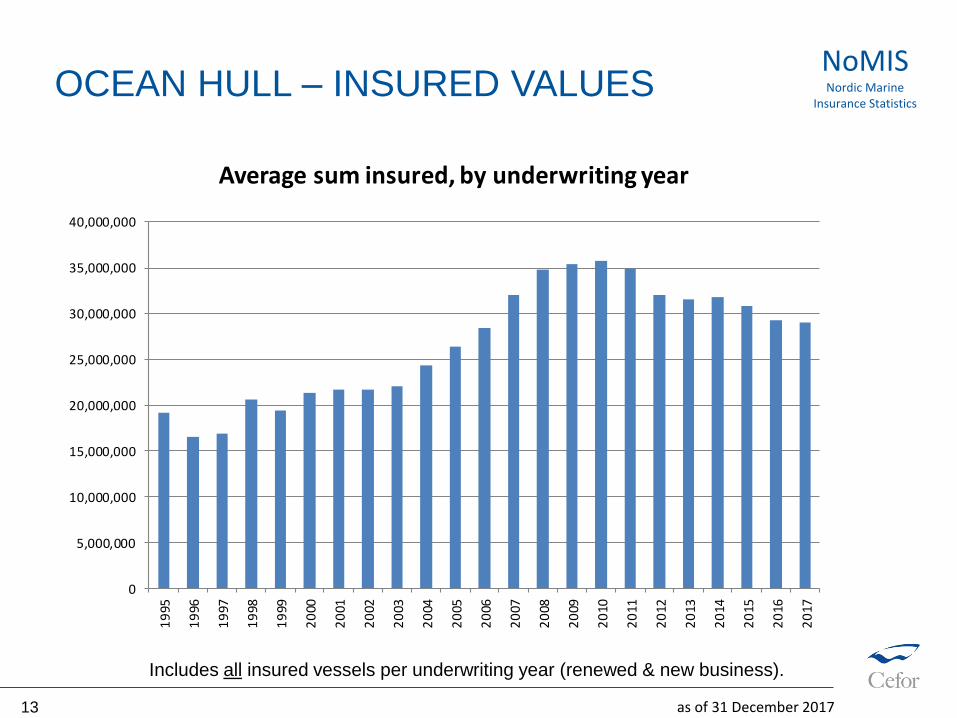
Average sum insured, by underwriting year
Includes all insured vessels per underwriting year (renewed and new business).
OCEAN HULL – INDEX
as of 31 December 2017
NoMISNordic Marine
Insurance Statistics
14
50%
100%
150%
200%
250%
19
95
19
96
19
97
19
98
19
99
20
00
20
01
20
02
20
03
20
04
20
05
20
06
20
07
20
08
20
09
20
10
20
11
20
12
20
13
20
14
20
15
20
16
20
17
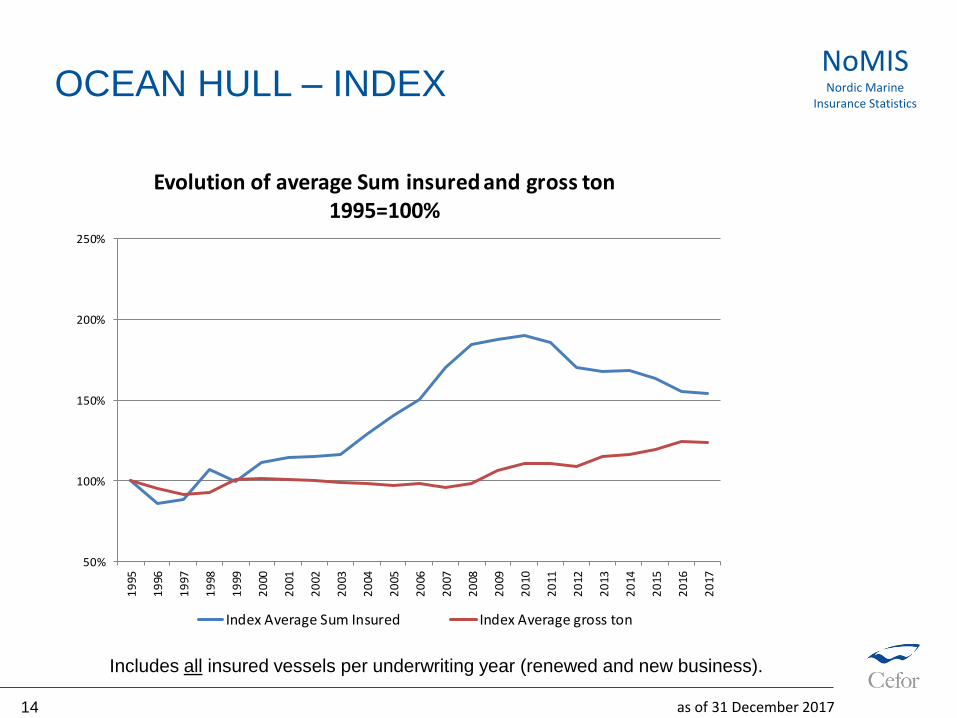
Evolution of average Sum insured and gross ton1995=100%
Index Average Sum Insured Index Average gross ton
5.9%
2.3%
8.7%
2.4%
-14.8%
-7.9%
-4.3%
-6.4%-6.2%-6.0%
-9.3%-7.4%
-5.2%
-20.0%
-15.0%
-10.0%
-5.0%
0.0%
5.0%
10.0%
15.0%
2005
2006
2007
2008
2009
2010
2011
2012
2013
2014
2015
2016
2017
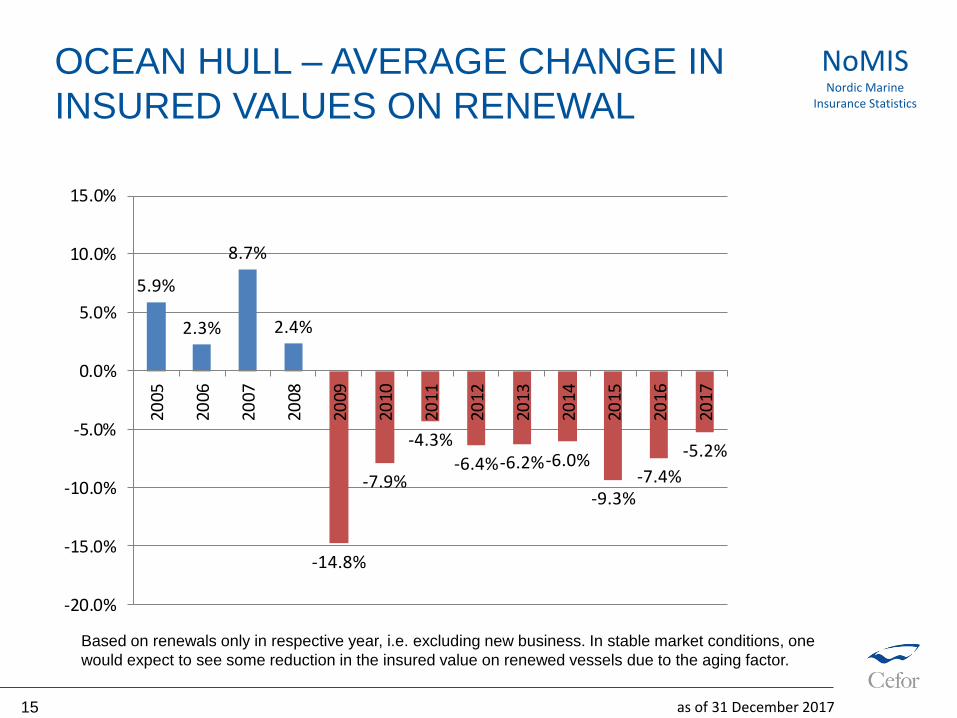
Based on renewals only in respective year, i.e. excluding new business. In stable market conditions, one
would expect to see some reduction in the insured value on renewed vessels due to the aging factor.
OCEAN HULL – AVERAGE CHANGE IN
INSURED VALUES ON RENEWAL
as of 31 December 2017
NoMISNordic Marine
Insurance Statistics
15
OCEAN HULL – AGE
as of 31 December 2017
NoMISNordic Marine
Insurance Statistics
16
13.0
13.5
13.914.1
14.0 14.1 14.113.9
13.7
13.313.4
13.213.4
13.2
12.9
12.011.9 11.8
12.0 12.0 12.1
12.4
13.2
10.0
10.5
11.0
11.5
12.0
12.5
13.0
13.5
14.0
14.5
19
95
19
96
19
97
19
98
19
99
20
00
20
01
20
02
20
03
20
04
20
05
20
06
20
07
20
08
20
09
20
10
20
11
20
12
20
13
20
14
20
15
20
16
20
17
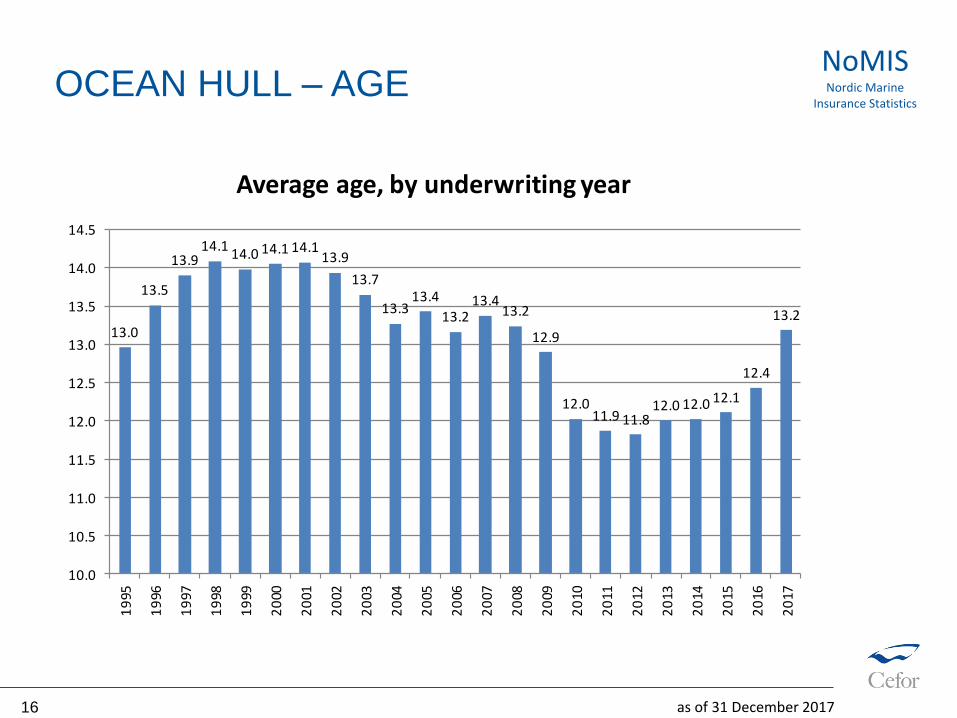
Average age, by underwriting year
Includes all insured vessels per underwriting year (renewed and new business).
OCEAN HULL - DEDUCTIBLES
as of 31 December 2017
NoMISNordic Marine
Insurance Statistics
17
1995 1996 1997 1998 1999 2000 2001 2002 2003 2004 2005 2006 2007 2008 2009 2010 2011 2012 2013 2014 2015 2016 2017
Average Std. Deductible 187,162 156,251 144,210 136,608 138,515 136,761 143,697 139,448 123,841 126,495 126,970 144,691 143,654 160,025 183,157 189,150 182,253 179,079 217,095 216,873 172,337 179,421 185,710
Av.Std. Ded. <= 500,000 USD 112,879 114,254 104,520 111,240 109,187 106,041 102,993 107,851 108,864 112,195 112,330 110,058 117,346 118,882 126,940 128,996 139,606 142,047 144,208 143,148 139,024 133,155 135,438
0
50,000
100,000
150,000
200,000
250,000
Average Standard Deductible (USD), by underwriting year
Average Std. Deductible Av.Std. Ded. <= 500,000 USD
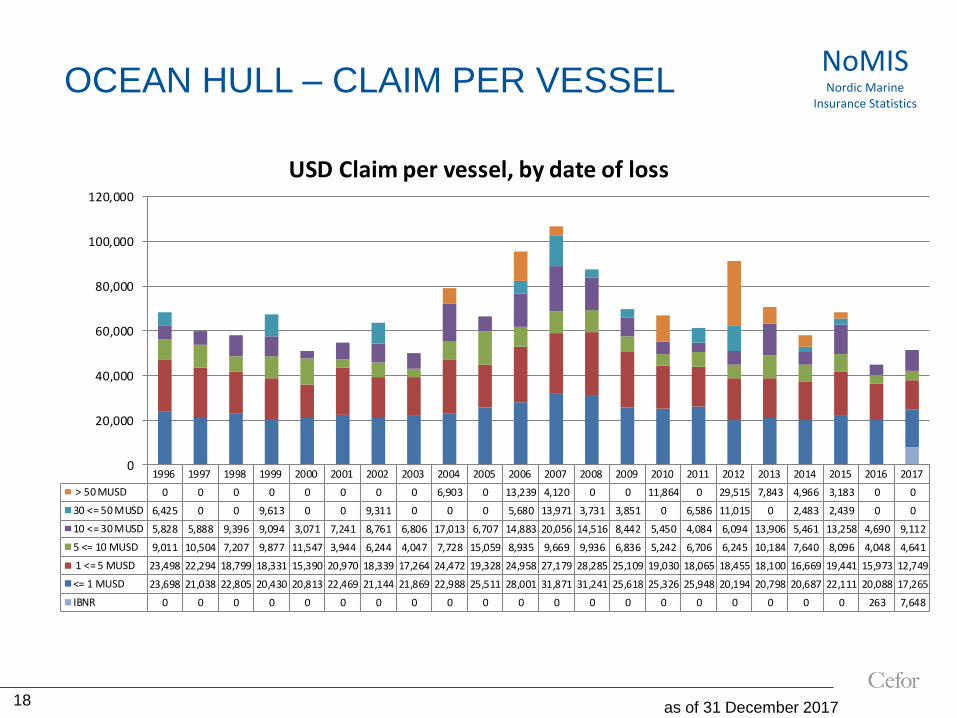
Claim bands:
OCEAN HULL – CLAIM PER VESSEL
as of 31 December 201718
NoMISNordic Marine
Insurance Statistics
1996 1997 1998 1999 2000 2001 2002 2003 2004 2005 2006 2007 2008 2009 2010 2011 2012 2013 2014 2015 2016 2017
> 50 MUSD 0 0 0 0 0 0 0 0 6,903 0 13,239 4,120 0 0 11,864 0 29,515 7,843 4,966 3,183 0 0
30 <= 50 MUSD 6,425 0 0 9,613 0 0 9,311 0 0 0 5,680 13,971 3,731 3,851 0 6,586 11,015 0 2,483 2,439 0 0
10 <= 30 MUSD 5,828 5,888 9,396 9,094 3,071 7,241 8,761 6,806 17,013 6,707 14,883 20,056 14,516 8,442 5,450 4,084 6,094 13,906 5,461 13,258 4,690 9,112
5 <= 10 MUSD 9,011 10,504 7,207 9,877 11,547 3,944 6,244 4,047 7,728 15,059 8,935 9,669 9,936 6,836 5,242 6,706 6,245 10,184 7,640 8,096 4,048 4,641
1 <= 5 MUSD 23,498 22,294 18,799 18,331 15,390 20,970 18,339 17,264 24,472 19,328 24,958 27,179 28,285 25,109 19,030 18,065 18,455 18,100 16,669 19,441 15,973 12,749
<= 1 MUSD 23,698 21,038 22,805 20,430 20,813 22,469 21,144 21,869 22,988 25,511 28,001 31,871 31,241 25,618 25,326 25,948 20,194 20,798 20,687 22,111 20,088 17,265
IBNR 0 0 0 0 0 0 0 0 0 0 0 0 0 0 0 0 0 0 0 0 263 7,648
0
20,000
40,000
60,000
80,000
100,000
120,000
USD Claim per vessel, by date of loss
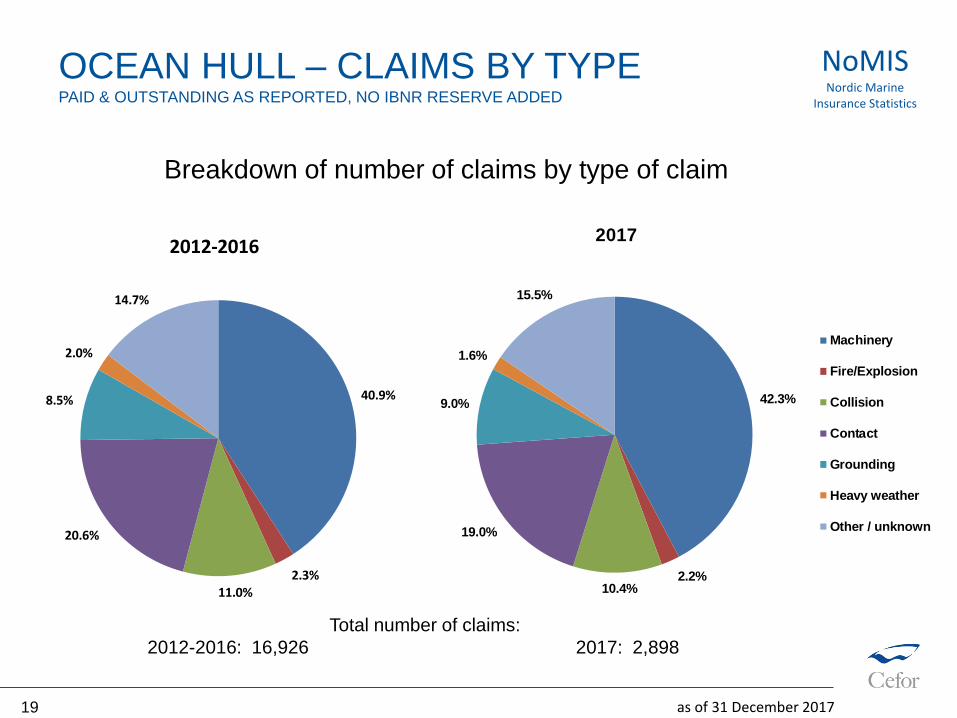
40.9%
2.3%11.0%
20.6%
8.5%
2.0%
14.7%
2012-2016
Machinery
Fire/Explosion
Collision
Contact
Grounding
Heavy weather
Other / unknown
42.3%
2.2%10.4%
19.0%
9.0%
1.6%
15.5%
2017
Machinery
Fire/Explosion
Collision
Contact
Grounding
Heavy weather
Other / unknown
Breakdown of number of claims by type of claim
Total number of claims:
2012-2016: 16,926 2017: 2,898
as of 31 December 201719
NoMISNordic Marine
Insurance Statistics
OCEAN HULL – CLAIMS BY TYPEPAID & OUTSTANDING AS REPORTED, NO IBNR RESERVE ADDED
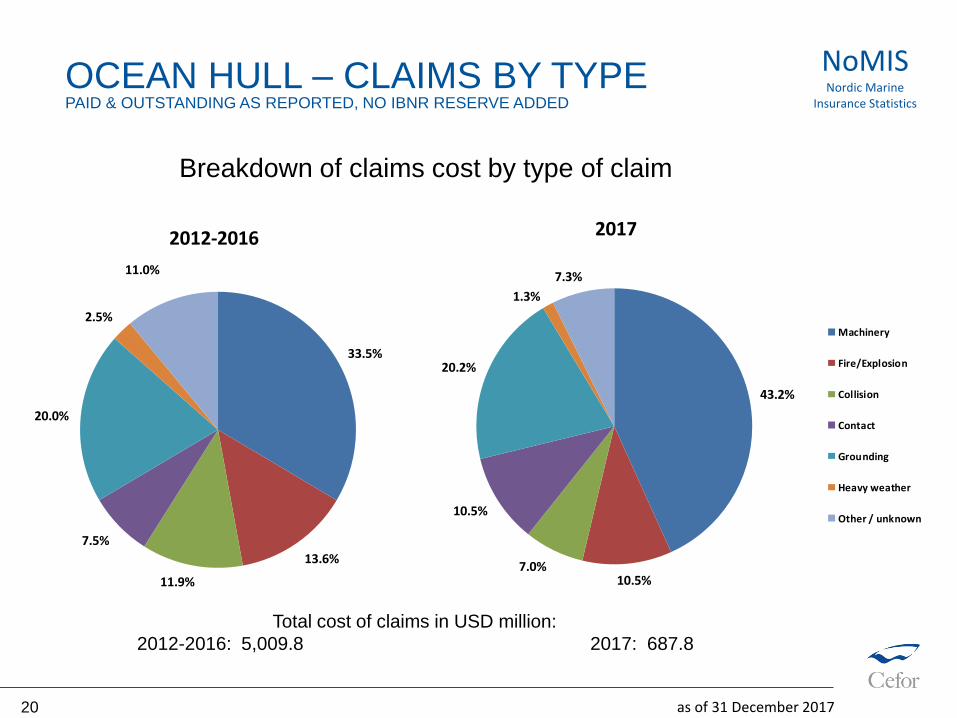
33.5%
13.6%
11.9%
7.5%
20.0%
2.5%
11.0%
2012-2016
Machinery
Fire/Explosion
Collision
Contact
Grounding
Heavy weather
Other / unknown
43.2%
10.5%7.0%
10.5%
20.2%
1.3%
7.3%
2017
Machinery
Fire/Explosion
Collision
Contact
Grounding
Heavy weather
Other / unknown
Breakdown of claims cost by type of claim
OCEAN HULL – CLAIMS BY TYPEPAID & OUTSTANDING AS REPORTED, NO IBNR RESERVE ADDED
Total cost of claims in USD million:
2012-2016: 5,009.8 2017: 687.8
as of 31 December 201720
NoMISNordic Marine
Insurance Statistics
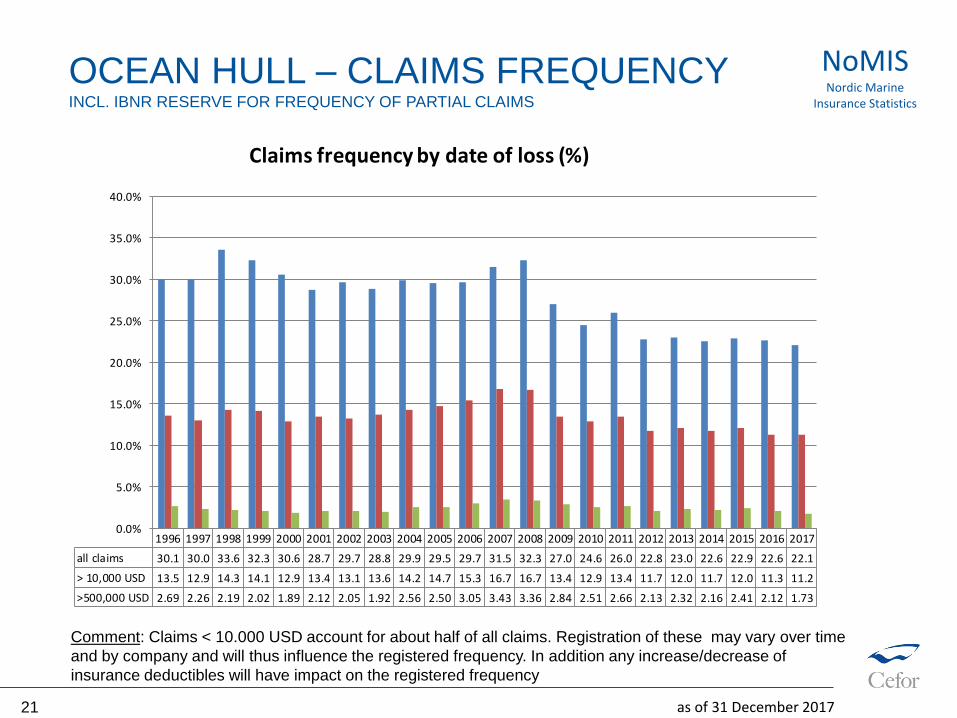
1996 1997 1998 1999 2000 2001 2002 2003 2004 2005 2006 2007 2008 2009 2010 2011 2012 2013 2014 2015 2016 2017
all claims 30.1 30.0 33.6 32.3 30.6 28.7 29.7 28.8 29.9 29.5 29.7 31.5 32.3 27.0 24.6 26.0 22.8 23.0 22.6 22.9 22.6 22.1
> 10,000 USD 13.5 12.9 14.3 14.1 12.9 13.4 13.1 13.6 14.2 14.7 15.3 16.7 16.7 13.4 12.9 13.4 11.7 12.0 11.7 12.0 11.3 11.2
>500,000 USD 2.69 2.26 2.19 2.02 1.89 2.12 2.05 1.92 2.56 2.50 3.05 3.43 3.36 2.84 2.51 2.66 2.13 2.32 2.16 2.41 2.12 1.73
0.0%
5.0%
10.0%
15.0%
20.0%
25.0%
30.0%
35.0%
40.0%
Claims frequency by date of loss (%)
Comment: Claims < 10.000 USD account for about half of all claims. Registration of these may vary over time
and by company and will thus influence the registered frequency. In addition any increase/decrease of
insurance deductibles will have impact on the registered frequency
OCEAN HULL – CLAIMS FREQUENCYINCL. IBNR RESERVE FOR FREQUENCY OF PARTIAL CLAIMS
as of 31 December 201721
NoMISNordic Marine
Insurance Statistics
as of 31 December 201722
NoMISNordic Marine
Insurance Statistics
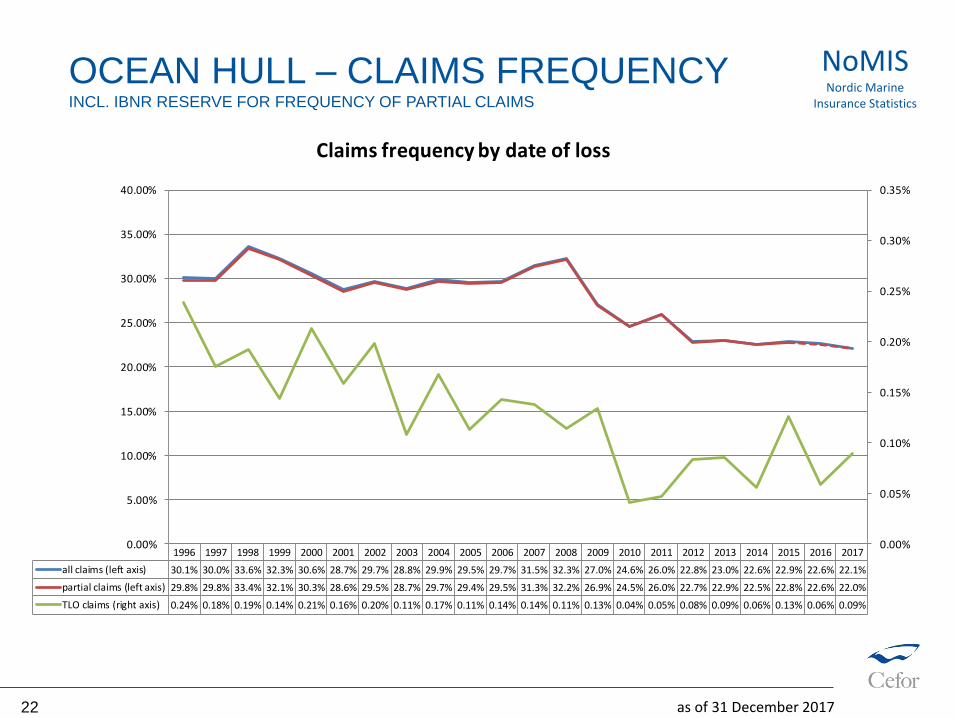
OCEAN HULL – CLAIMS FREQUENCYINCL. IBNR RESERVE FOR FREQUENCY OF PARTIAL CLAIMS
1996 1997 1998 1999 2000 2001 2002 2003 2004 2005 2006 2007 2008 2009 2010 2011 2012 2013 2014 2015 2016 2017
all claims (left axis) 30.1% 30.0% 33.6% 32.3% 30.6% 28.7% 29.7% 28.8% 29.9% 29.5% 29.7% 31.5% 32.3% 27.0% 24.6% 26.0% 22.8% 23.0% 22.6% 22.9% 22.6% 22.1%
partial claims (left axis) 29.8% 29.8% 33.4% 32.1% 30.3% 28.6% 29.5% 28.7% 29.7% 29.4% 29.5% 31.3% 32.2% 26.9% 24.5% 26.0% 22.7% 22.9% 22.5% 22.8% 22.6% 22.0%
TLO claims (right axis) 0.24% 0.18% 0.19% 0.14% 0.21% 0.16% 0.20% 0.11% 0.17% 0.11% 0.14% 0.14% 0.11% 0.13% 0.04% 0.05% 0.08% 0.09% 0.06% 0.13% 0.06% 0.09%
0.00%
0.05%
0.10%
0.15%
0.20%
0.25%
0.30%
0.35%
0.00%
5.00%
10.00%
15.00%
20.00%
25.00%
30.00%
35.00%
40.00%
Claims frequency by date of loss
as of 31 December 201723
NoMISNordic Marine
Insurance Statistics
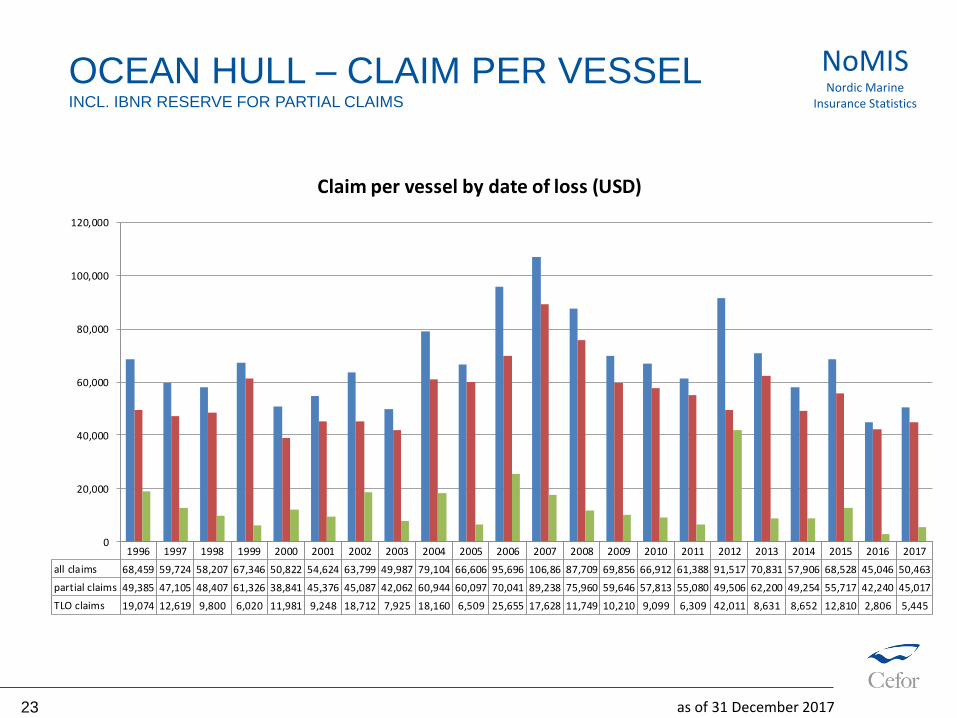
OCEAN HULL – CLAIM PER VESSELINCL. IBNR RESERVE FOR PARTIAL CLAIMS
1996 1997 1998 1999 2000 2001 2002 2003 2004 2005 2006 2007 2008 2009 2010 2011 2012 2013 2014 2015 2016 2017
all claims 68,459 59,724 58,207 67,346 50,822 54,624 63,799 49,987 79,104 66,606 95,696 106,86 87,709 69,856 66,912 61,388 91,517 70,831 57,906 68,528 45,046 50,463
partial claims 49,385 47,105 48,407 61,326 38,841 45,376 45,087 42,062 60,944 60,097 70,041 89,238 75,960 59,646 57,813 55,080 49,506 62,200 49,254 55,717 42,240 45,017
TLO claims 19,074 12,619 9,800 6,020 11,981 9,248 18,712 7,925 18,160 6,509 25,655 17,628 11,749 10,210 9,099 6,309 42,011 8,631 8,652 12,810 2,806 5,445
0
20,000
40,000
60,000
80,000
100,000
120,000
Claim per vessel by date of loss (USD)
as of 31 December 201724
NoMISNordic Marine
Insurance Statistics
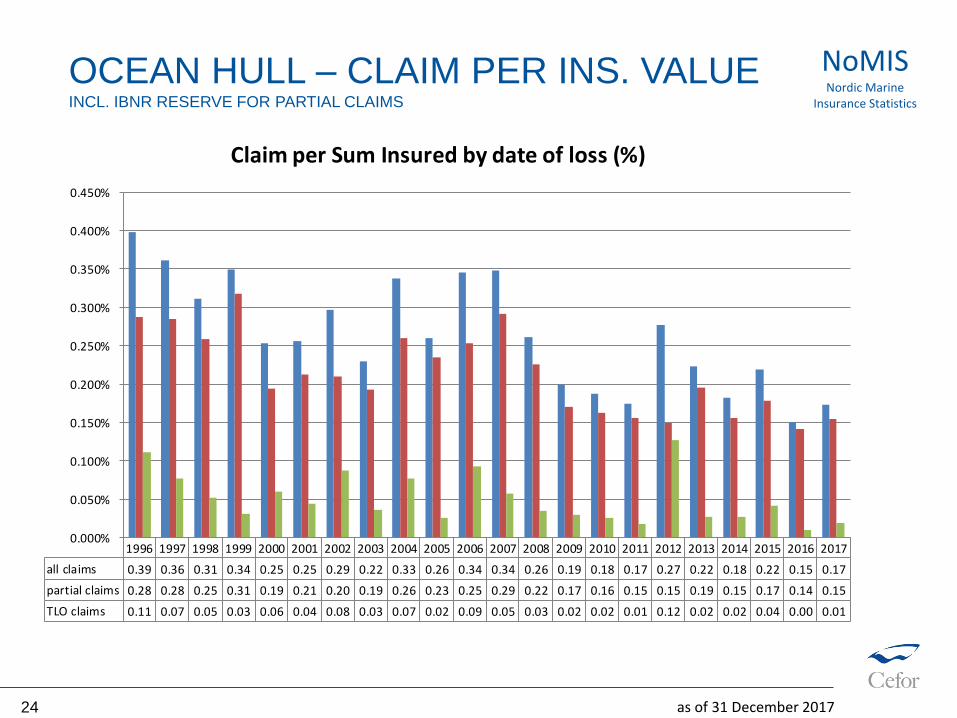
OCEAN HULL – CLAIM PER INS. VALUEINCL. IBNR RESERVE FOR PARTIAL CLAIMS
1996 1997 1998 1999 2000 2001 2002 2003 2004 2005 2006 2007 2008 2009 2010 2011 2012 2013 2014 2015 2016 2017
all claims 0.39 0.36 0.31 0.34 0.25 0.25 0.29 0.22 0.33 0.26 0.34 0.34 0.26 0.19 0.18 0.17 0.27 0.22 0.18 0.22 0.15 0.17
partial claims 0.28 0.28 0.25 0.31 0.19 0.21 0.20 0.19 0.26 0.23 0.25 0.29 0.22 0.17 0.16 0.15 0.15 0.19 0.15 0.17 0.14 0.15
TLO claims 0.11 0.07 0.05 0.03 0.06 0.04 0.08 0.03 0.07 0.02 0.09 0.05 0.03 0.02 0.02 0.01 0.12 0.02 0.02 0.04 0.00 0.01
0.000%
0.050%
0.100%
0.150%
0.200%
0.250%
0.300%
0.350%
0.400%
0.450%
Claim per Sum Insured by date of loss (%)
as of 31 December 201725
NoMISNordic Marine
Insurance Statistics
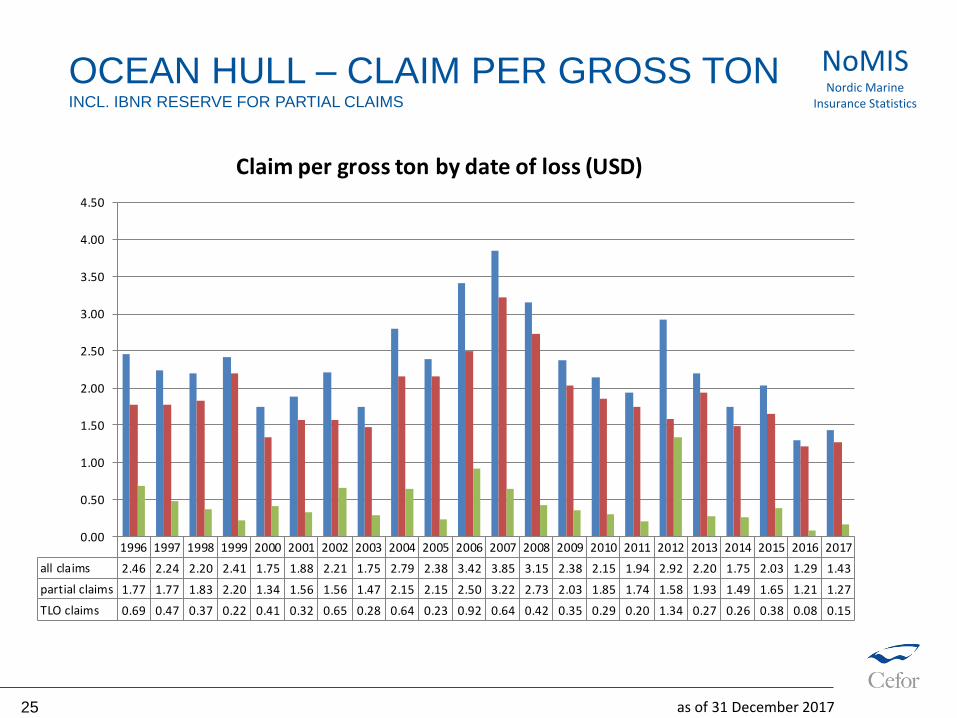
OCEAN HULL – CLAIM PER GROSS TONINCL. IBNR RESERVE FOR PARTIAL CLAIMS
1996 1997 1998 1999 2000 2001 2002 2003 2004 2005 2006 2007 2008 2009 2010 2011 2012 2013 2014 2015 2016 2017
all claims 2.46 2.24 2.20 2.41 1.75 1.88 2.21 1.75 2.79 2.38 3.42 3.85 3.15 2.38 2.15 1.94 2.92 2.20 1.75 2.03 1.29 1.43
partial claims 1.77 1.77 1.83 2.20 1.34 1.56 1.56 1.47 2.15 2.15 2.50 3.22 2.73 2.03 1.85 1.74 1.58 1.93 1.49 1.65 1.21 1.27
TLO claims 0.69 0.47 0.37 0.22 0.41 0.32 0.65 0.28 0.64 0.23 0.92 0.64 0.42 0.35 0.29 0.20 1.34 0.27 0.26 0.38 0.08 0.15
0.00
0.50
1.00
1.50
2.00
2.50
3.00
3.50
4.00
4.50
Claim per gross ton by date of loss (USD)
as of 31 December 201726
NoMISNordic Marine
Insurance Statistics
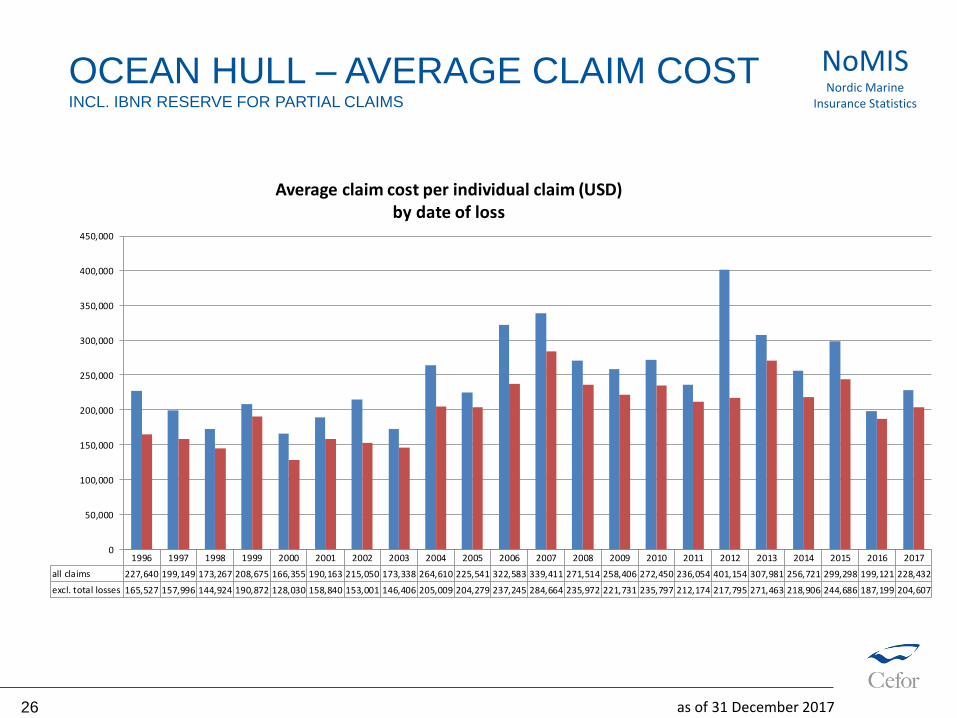
OCEAN HULL – AVERAGE CLAIM COSTINCL. IBNR RESERVE FOR PARTIAL CLAIMS
1996 1997 1998 1999 2000 2001 2002 2003 2004 2005 2006 2007 2008 2009 2010 2011 2012 2013 2014 2015 2016 2017
all claims 227,640 199,149 173,267 208,675 166,355 190,163 215,050 173,338 264,610 225,541 322,583 339,411 271,514 258,406 272,450 236,054 401,154 307,981 256,721 299,298 199,121 228,432
excl. total losses 165,527 157,996 144,924 190,872 128,030 158,840 153,001 146,406 205,009 204,279 237,245 284,664 235,972 221,731 235,797 212,174 217,795 271,463 218,906 244,686 187,199 204,607
0
50,000
100,000
150,000
200,000
250,000
300,000
350,000
400,000
450,000
Average claim cost per individual claim (USD) by date of loss
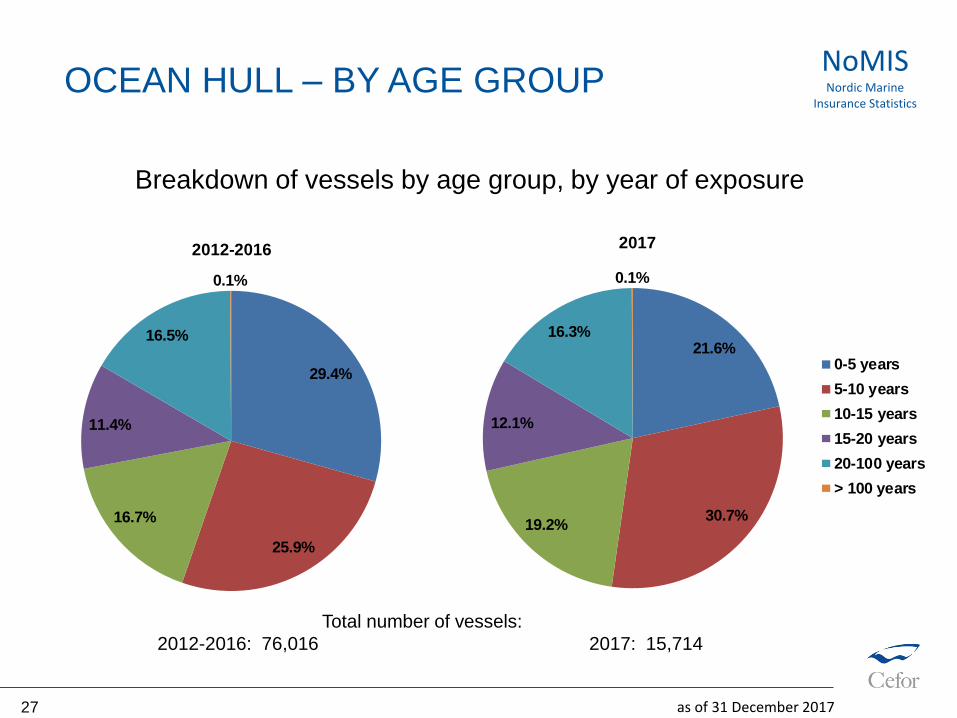
29.4%
25.9%
16.7%
11.4%
16.5%
0.1%
2012-2016
0-5 years
5-10 years
10-15 years
15-20 years
20-100 years
> 100 years
21.6%
30.7%19.2%
12.1%
16.3%
0.1%
2017
0-5 years
5-10 years
10-15 years
15-20 years
20-100 years
> 100 years
Breakdown of vessels by age group, by year of exposure
OCEAN HULL – BY AGE GROUP
Total number of vessels:
2012-2016: 76,016 2017: 15,714
as of 31 December 201727
NoMISNordic Marine
Insurance Statistics
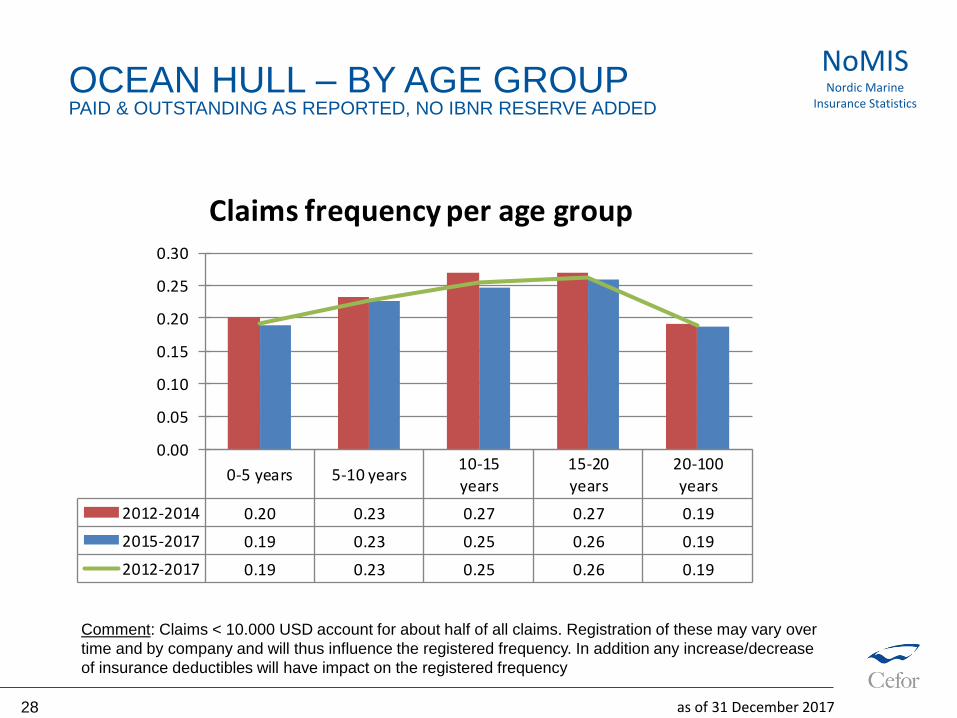
Comment: Claims < 10.000 USD account for about half of all claims. Registration of these may vary over
time and by company and will thus influence the registered frequency. In addition any increase/decrease
of insurance deductibles will have impact on the registered frequency
as of 31 December 201728
NoMISNordic Marine
Insurance StatisticsOCEAN HULL – BY AGE GROUPPAID & OUTSTANDING AS REPORTED, NO IBNR RESERVE ADDED
0-5 years 5-10 years10-15
years
15-20
years
20-100
years
2012-2014 0.20 0.23 0.27 0.27 0.19
2015-2017 0.19 0.23 0.25 0.26 0.19
2012-2017 0.19 0.23 0.25 0.26 0.19
0.00
0.05
0.10
0.15
0.20
0.25
0.30
Claims frequency per age group
as of 31 December 201729
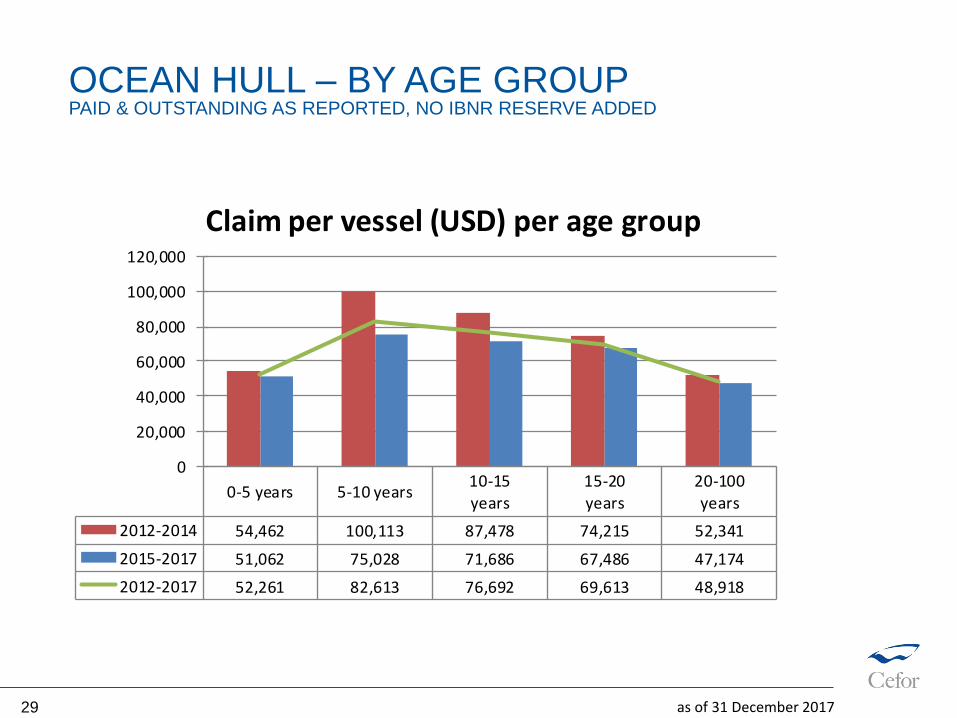
OCEAN HULL – BY AGE GROUPPAID & OUTSTANDING AS REPORTED, NO IBNR RESERVE ADDED
0-5 years 5-10 years10-15
years
15-20
years
20-100
years
2012-2014 54,462 100,113 87,478 74,215 52,341
2015-2017 51,062 75,028 71,686 67,486 47,174
2012-2017 52,261 82,613 76,692 69,613 48,918
0
20,000
40,000
60,000
80,000
100,000
120,000
Claim per vessel (USD) per age group
as of 31 December 201730
NoMISNordic Marine
Insurance StatisticsOCEAN HULL – BY AGE GROUPPAID & OUTSTANDING AS REPORTED, NO IBNR RESERVE ADDED
0-5 years 5-10 years10-15
years
15-20
years
20-100
years
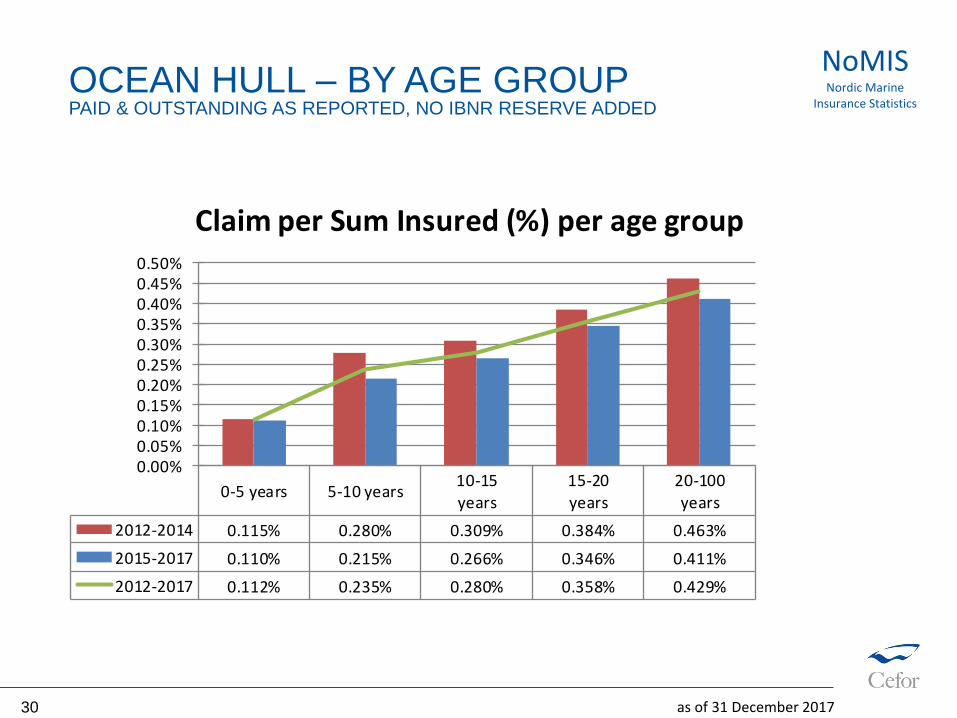
2012-2014 0.115% 0.280% 0.309% 0.384% 0.463%
2015-2017 0.110% 0.215% 0.266% 0.346% 0.411%
2012-2017 0.112% 0.235% 0.280% 0.358% 0.429%
0.00%0.05%0.10%0.15%0.20%0.25%0.30%0.35%0.40%0.45%0.50%
Claim per Sum Insured (%) per age group
as of 31 December 201731
NoMISNordic Marine
Insurance StatisticsOCEAN HULL – BY AGE GROUPPAID & OUTSTANDING AS REPORTED, NO IBNR RESERVE ADDED
0-5 years 5-10 years 10-15 years 15-20 years20-100
years
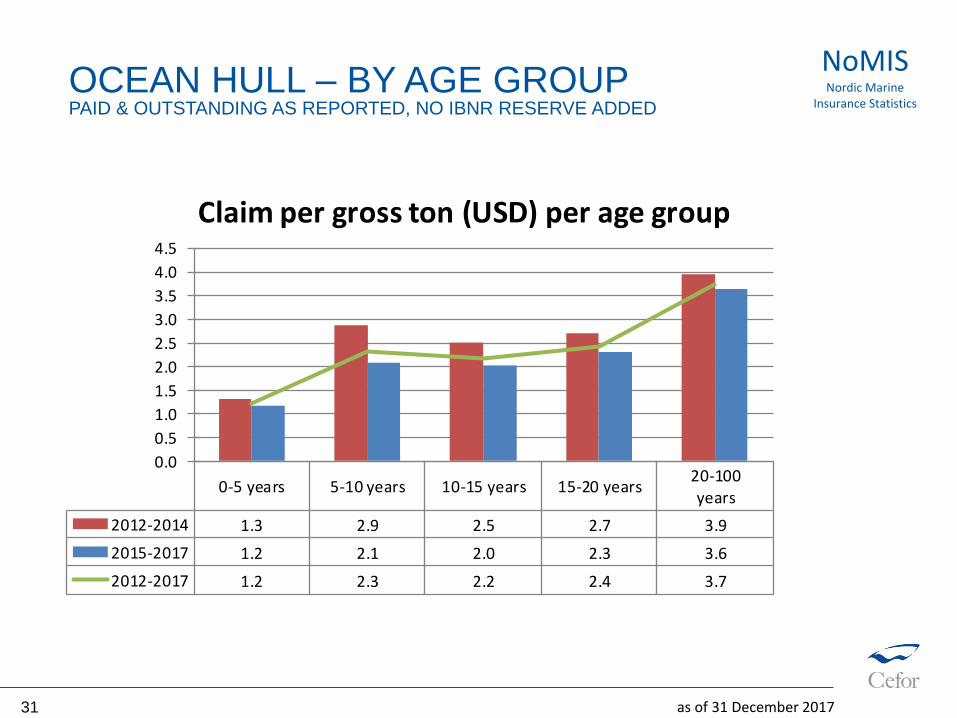
2012-2014 1.3 2.9 2.5 2.7 3.9
2015-2017 1.2 2.1 2.0 2.3 3.6
2012-2017 1.2 2.3 2.2 2.4 3.7
0.0
0.5
1.0
1.5
2.0
2.5
3.0
3.5
4.0
4.5
Claim per gross ton (USD) per age group
as of 31 December 201732
NoMISNordic Marine
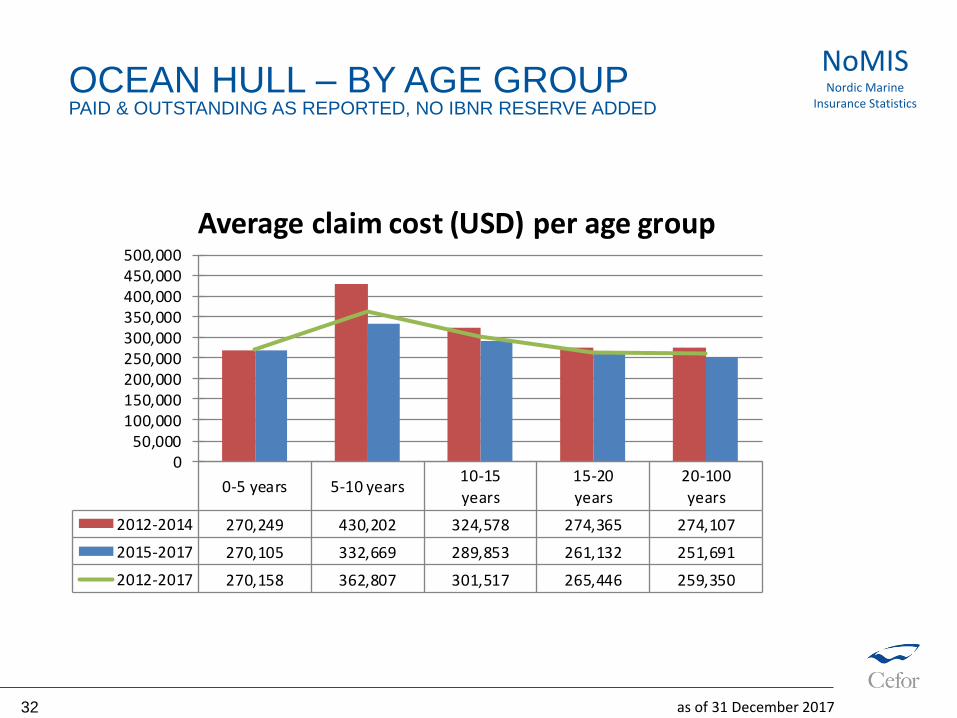
Insurance StatisticsOCEAN HULL – BY AGE GROUPPAID & OUTSTANDING AS REPORTED, NO IBNR RESERVE ADDED
0-5 years 5-10 years10-15
years
15-20
years
20-100
years
2012-2014 270,249 430,202 324,578 274,365 274,107
2015-2017 270,105 332,669 289,853 261,132 251,691
2012-2017 270,158 362,807 301,517 265,446 259,350
050,000
100,000150,000200,000250,000300,000350,000400,000450,000500,000
Average claim cost (USD) per age group
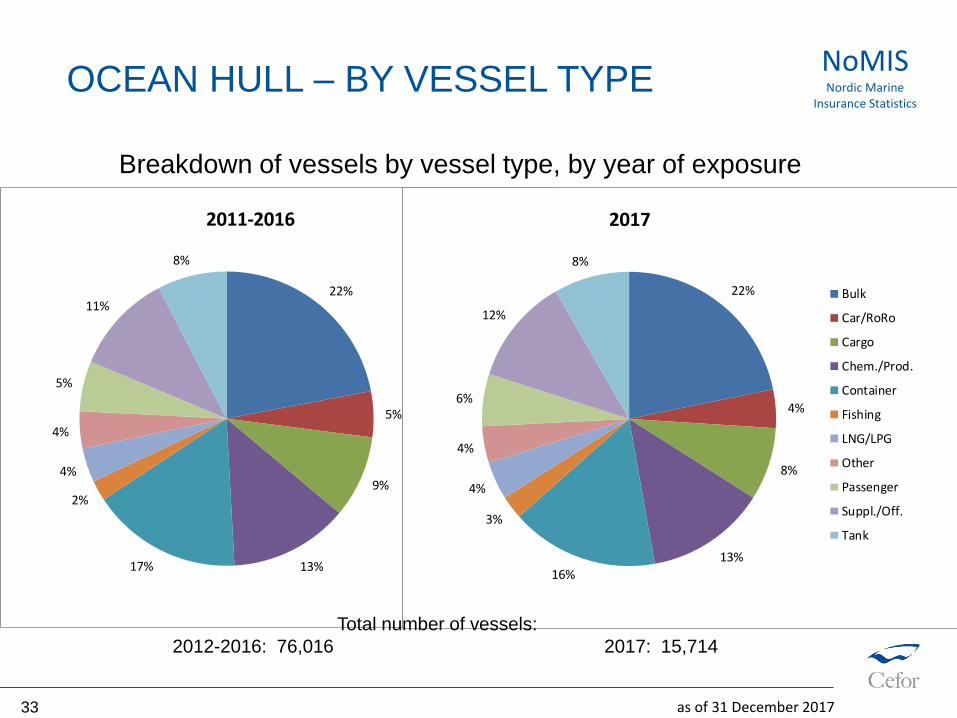
22%
5%
9%
13%17%
2%
4%
4%
5%
11%
8%
2011-2016
Bulk
Car/RoRo
Cargo
Chem./Prod.
Container
Fishing
LNG/LPG
Other
Passenger
Suppl./Off.
Tank
22%
4%
8%
13%
16%
3%
4%
4%
6%
12%
8%
2017
Bulk
Car/RoRo
Cargo
Chem./Prod.
Container
Fishing
LNG/LPG
Other
Passenger
Suppl./Off.
Tank
Breakdown of vessels by vessel type, by year of exposure
as of 31 December 201733
NoMISNordic Marine
Insurance StatisticsOCEAN HULL – BY VESSEL TYPE
Total number of vessels:
2012-2016: 76,016 2017: 15,714
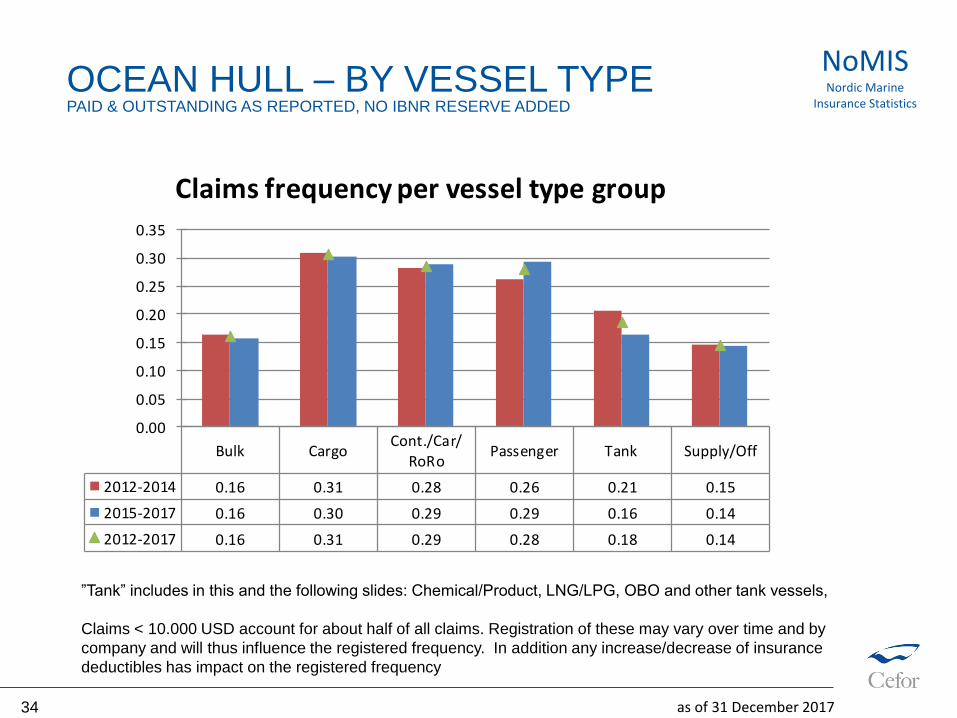
Bulk CargoCont./Car/
RoRoPassenger Tank Supply/Off
2012-2014 0.16 0.31 0.28 0.26 0.21 0.15
2015-2017 0.16 0.30 0.29 0.29 0.16 0.14
2012-2017 0.16 0.31 0.29 0.28 0.18 0.14
0.00
0.05
0.10
0.15
0.20
0.25
0.30
0.35
Claims frequency per vessel type group
”Tank” includes in this and the following slides: Chemical/Product, LNG/LPG, OBO and other tank vessels,
Claims < 10.000 USD account for about half of all claims. Registration of these may vary over time and by
company and will thus influence the registered frequency. In addition any increase/decrease of insurance
deductibles has impact on the registered frequency
as of 31 December 201734
NoMISNordic Marine
Insurance StatisticsOCEAN HULL – BY VESSEL TYPEPAID & OUTSTANDING AS REPORTED, NO IBNR RESERVE ADDED
as of 31 December 201735
NoMISNordic Marine
Insurance StatisticsOCEAN HULL – BY VESSEL TYPEPAID & OUTSTANDING AS REPORTED, NO IBNR RESERVE ADDED
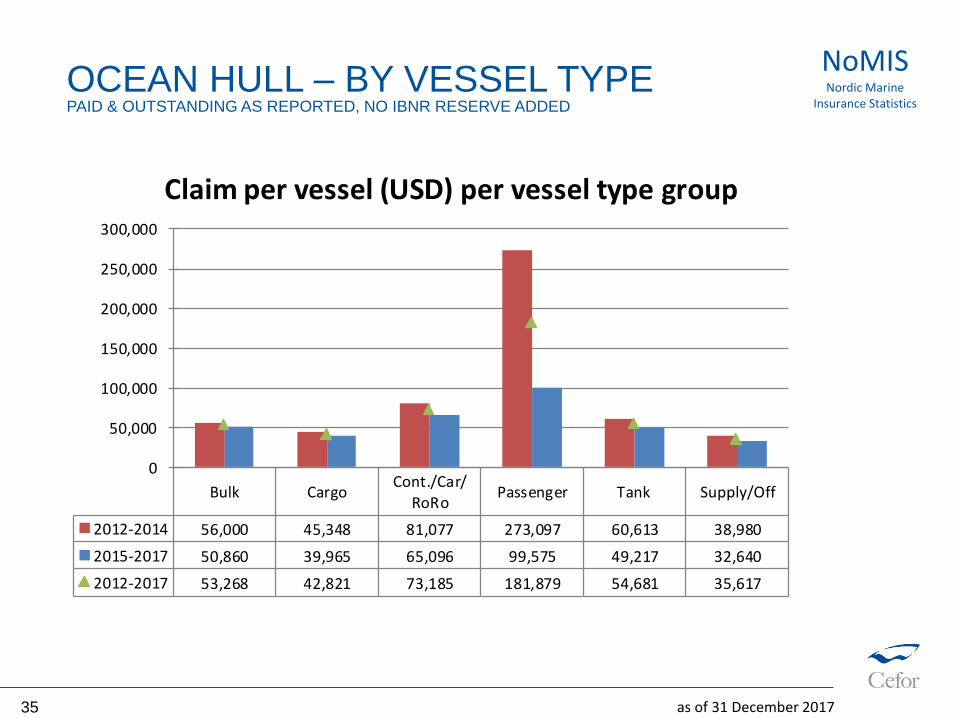
Bulk CargoCont./Car/
RoRoPassenger Tank Supply/Off
2012-2014 56,000 45,348 81,077 273,097 60,613 38,980
2015-2017 50,860 39,965 65,096 99,575 49,217 32,640
2012-2017 53,268 42,821 73,185 181,879 54,681 35,617
0
50,000
100,000
150,000
200,000
250,000
300,000
Claim per vessel (USD) per vessel type group
as of 31 December 201736
NoMISNordic Marine
Insurance StatisticsOCEAN HULL – BY VESSEL TYPEPAID & OUTSTANDING AS REPORTED, NO IBNR RESERVE ADDED
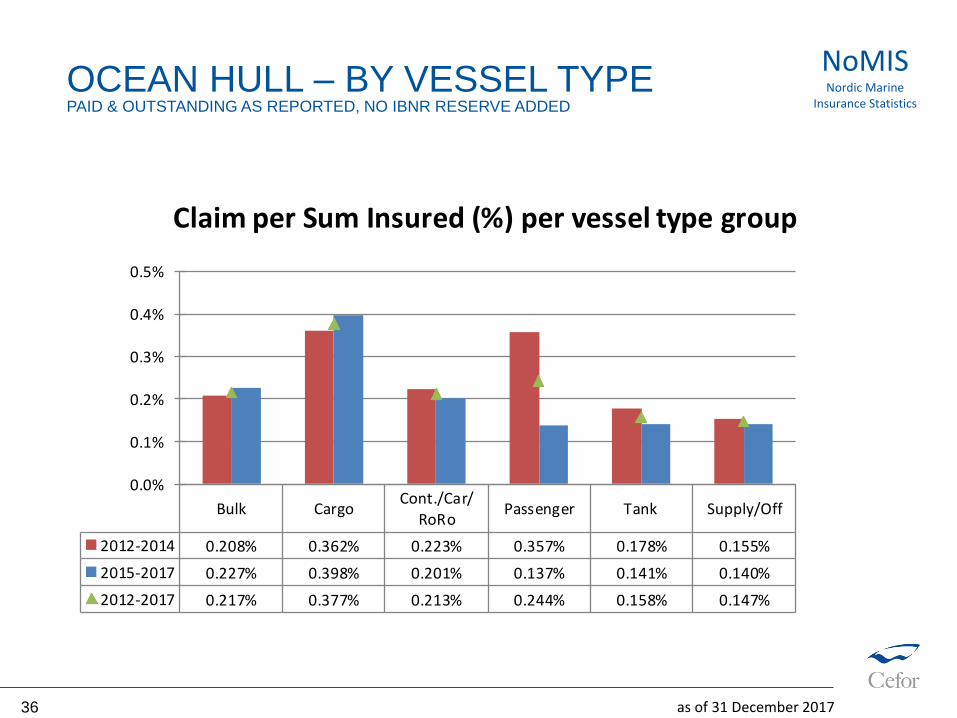
Bulk CargoCont./Car/
RoRoPassenger Tank Supply/Off
2012-2014 0.208% 0.362% 0.223% 0.357% 0.178% 0.155%
2015-2017 0.227% 0.398% 0.201% 0.137% 0.141% 0.140%
2012-2017 0.217% 0.377% 0.213% 0.244% 0.158% 0.147%
0.0%
0.1%
0.2%
0.3%
0.4%
0.5%
Claim per Sum Insured (%) per vessel type group
as of 31 December 201737
NoMISNordic Marine
Insurance StatisticsOCEAN HULL – BY VESSEL TYPEPAID & OUTSTANDING AS REPORTED, NO IBNR RESERVE ADDED
Bulk CargoCont./Car/
RoRoPassenger Tank Supply/Off
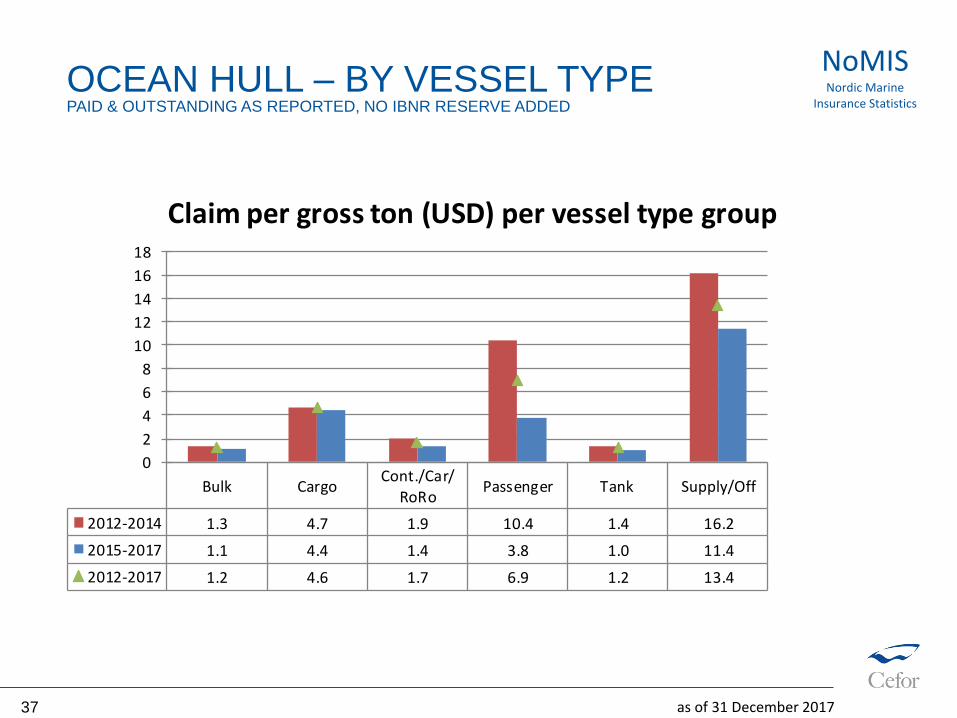
2012-2014 1.3 4.7 1.9 10.4 1.4 16.2
2015-2017 1.1 4.4 1.4 3.8 1.0 11.4
2012-2017 1.2 4.6 1.7 6.9 1.2 13.4
0
2
4
6
8
10
12
14
16
18
Claim per gross ton (USD) per vessel type group
as of 31 December 201738
NoMISNordic Marine
Insurance StatisticsOCEAN HULL – BY VESSEL TYPEPAID & OUTSTANDING AS REPORTED, NO IBNR RESERVE ADDED
Bulk CargoCont./Car/R
oRoPassenger Tank Supply/Off
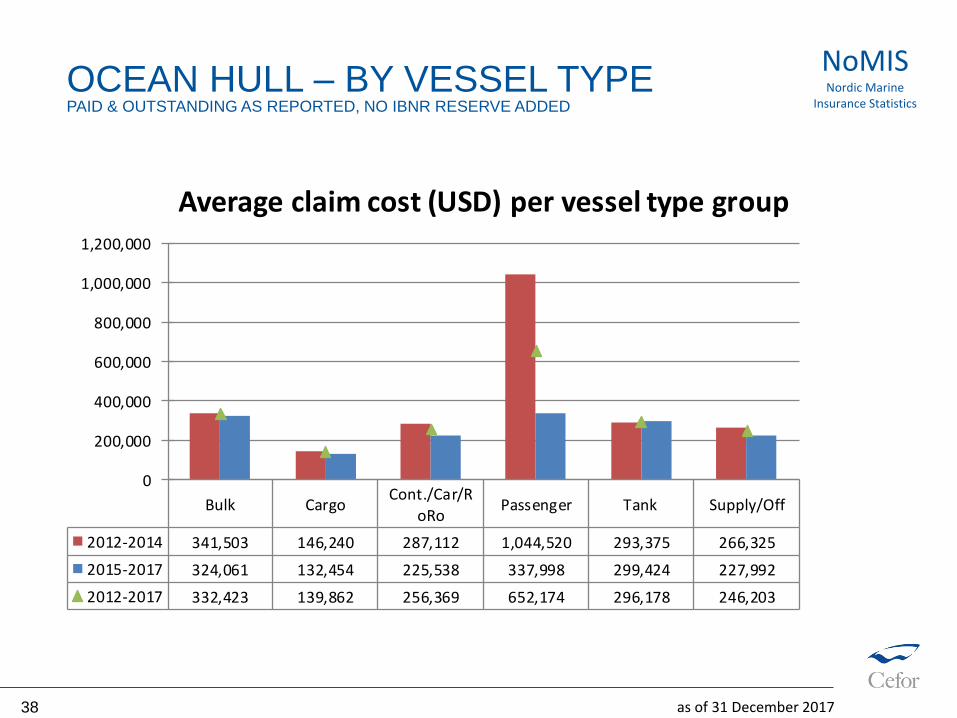
2012-2014 341,503 146,240 287,112 1,044,520 293,375 266,325
2015-2017 324,061 132,454 225,538 337,998 299,424 227,992
2012-2017 332,423 139,862 256,369 652,174 296,178 246,203
0
200,000
400,000
600,000
800,000
1,000,000
1,200,000
Average claim cost (USD) per vessel type group
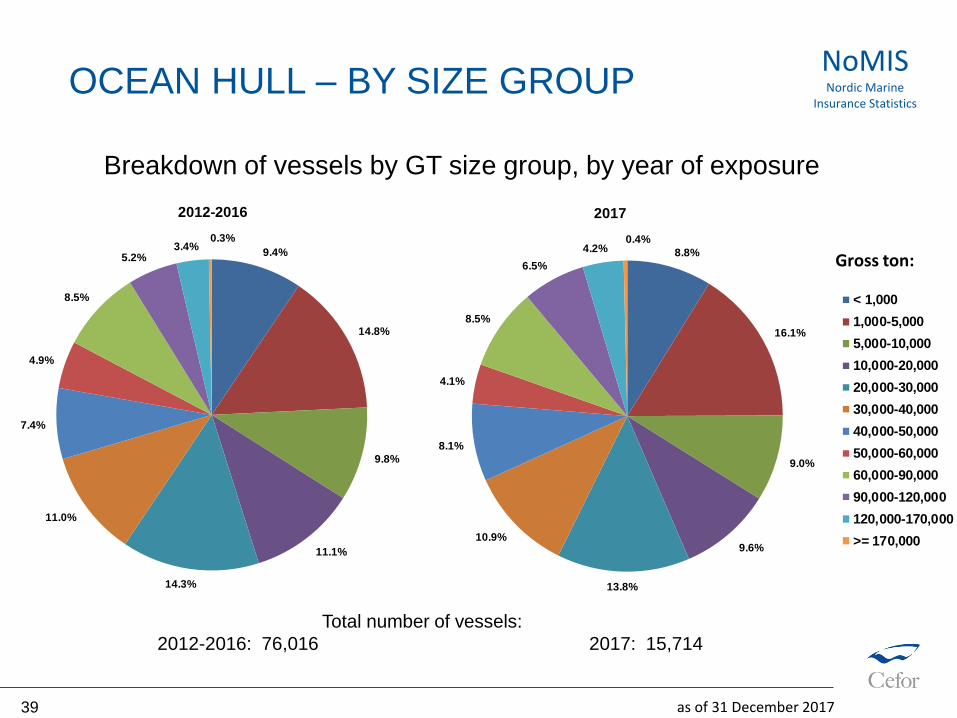
9.4%
14.8%
9.8%
11.1%
14.3%
11.0%
7.4%
4.9%
8.5%
5.2%3.4%
0.3%
2012-2016
< 1,000
1,000-5,000
5,000-10,000
10,000-20,000
20,000-30,000
30,000-40,000
40,000-50,000
50,000-60,000
60,000-90,000
90,000-120,000
120,000-170,000
>= 170,000
8.8%
16.1%
9.0%
9.6%
13.8%
10.9%
8.1%
4.1%
8.5%
6.5%
4.2%0.4%
2017
< 1,000
1,000-5,000
5,000-10,000
10,000-20,000
20,000-30,000
30,000-40,000
40,000-50,000
50,000-60,000
60,000-90,000
90,000-120,000
120,000-170,000
>= 170,000
Breakdown of vessels by GT size group, by year of exposure
Gross ton:
as of 31 December 201739
NoMISNordic Marine
Insurance StatisticsOCEAN HULL – BY SIZE GROUP
Total number of vessels:
2012-2016: 76,016 2017: 15,714
< 1,0001,000-
5,000
5,000-
10,000
10,000-
20,000
20,000-
30,000
30,000-
40,000
40,000-
50,000
50,000-
60,000
60,000-
90,000
90,000-
120,000
120,000-
170,000
>=
170,000
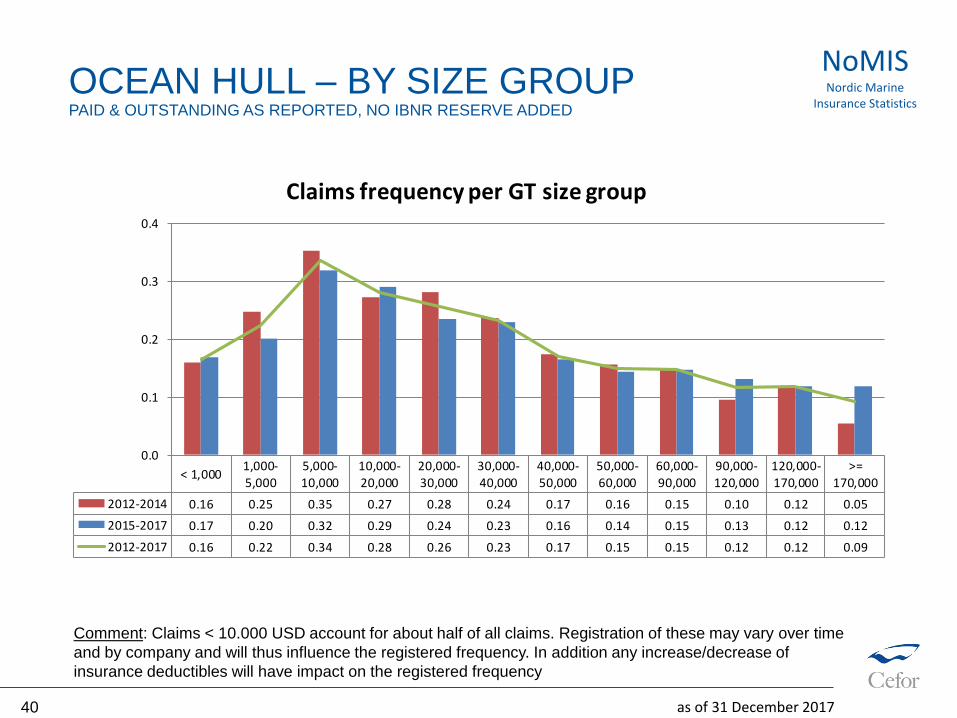
2012-2014 0.16 0.25 0.35 0.27 0.28 0.24 0.17 0.16 0.15 0.10 0.12 0.05
2015-2017 0.17 0.20 0.32 0.29 0.24 0.23 0.16 0.14 0.15 0.13 0.12 0.12
2012-2017 0.16 0.22 0.34 0.28 0.26 0.23 0.17 0.15 0.15 0.12 0.12 0.09
0.0
0.1
0.2
0.3
0.4
Claims frequency per GT size group
Comment: Claims < 10.000 USD account for about half of all claims. Registration of these may vary over time
and by company and will thus influence the registered frequency. In addition any increase/decrease of
insurance deductibles will have impact on the registered frequency
as of 31 December 201740
NoMISNordic Marine
Insurance StatisticsOCEAN HULL – BY SIZE GROUPPAID & OUTSTANDING AS REPORTED, NO IBNR RESERVE ADDED
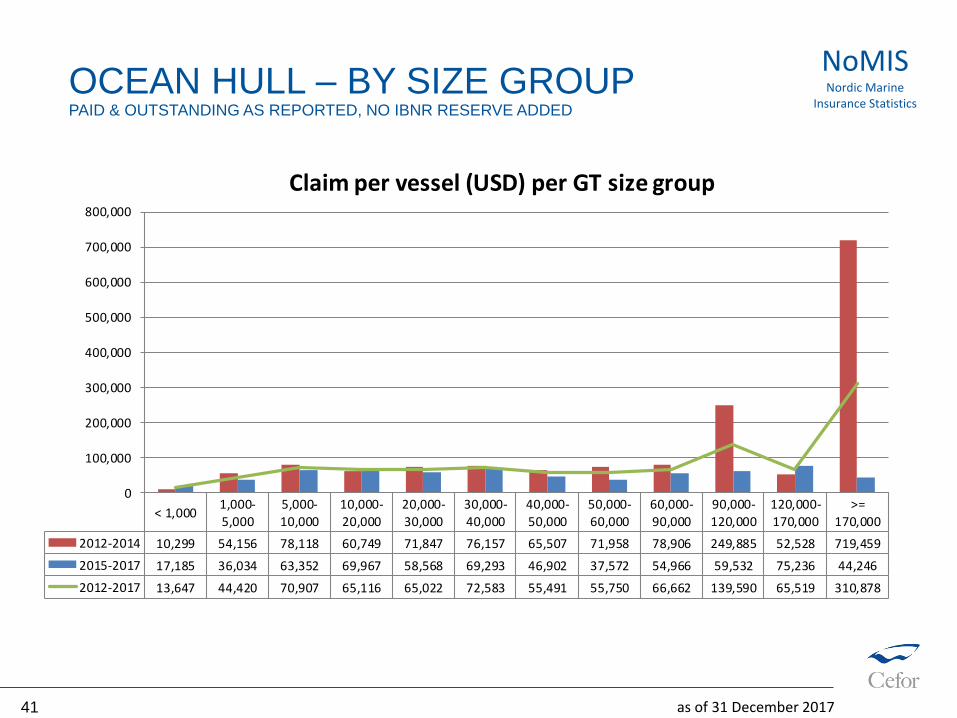
as of 31 December 201741
NoMISNordic Marine
Insurance StatisticsOCEAN HULL – BY SIZE GROUPPAID & OUTSTANDING AS REPORTED, NO IBNR RESERVE ADDED
< 1,0001,000-
5,000
5,000-
10,000
10,000-
20,000
20,000-
30,000
30,000-
40,000
40,000-
50,000
50,000-
60,000
60,000-
90,000
90,000-
120,000
120,000-
170,000
>=
170,000
2012-2014 10,299 54,156 78,118 60,749 71,847 76,157 65,507 71,958 78,906 249,885 52,528 719,459
2015-2017 17,185 36,034 63,352 69,967 58,568 69,293 46,902 37,572 54,966 59,532 75,236 44,246
2012-2017 13,647 44,420 70,907 65,116 65,022 72,583 55,491 55,750 66,662 139,590 65,519 310,878
0
100,000
200,000
300,000
400,000
500,000
600,000
700,000
800,000
Claim per vessel (USD) per GT size group
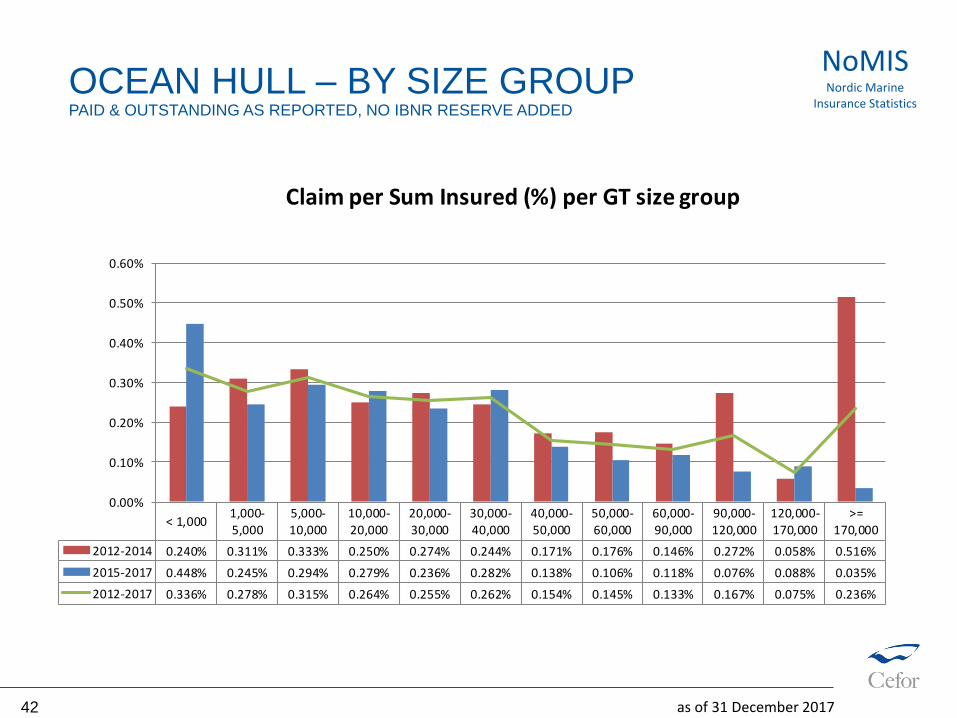
as of 31 December 201742
NoMISNordic Marine
Insurance StatisticsOCEAN HULL – BY SIZE GROUPPAID & OUTSTANDING AS REPORTED, NO IBNR RESERVE ADDED
< 1,0001,000-
5,000
5,000-
10,000
10,000-
20,000
20,000-
30,000
30,000-
40,000
40,000-
50,000
50,000-
60,000
60,000-
90,000
90,000-
120,000
120,000-
170,000
>=
170,000
2012-2014 0.240% 0.311% 0.333% 0.250% 0.274% 0.244% 0.171% 0.176% 0.146% 0.272% 0.058% 0.516%
2015-2017 0.448% 0.245% 0.294% 0.279% 0.236% 0.282% 0.138% 0.106% 0.118% 0.076% 0.088% 0.035%
2012-2017 0.336% 0.278% 0.315% 0.264% 0.255% 0.262% 0.154% 0.145% 0.133% 0.167% 0.075% 0.236%
0.00%
0.10%
0.20%
0.30%
0.40%
0.50%
0.60%
Claim per Sum Insured (%) per GT size group
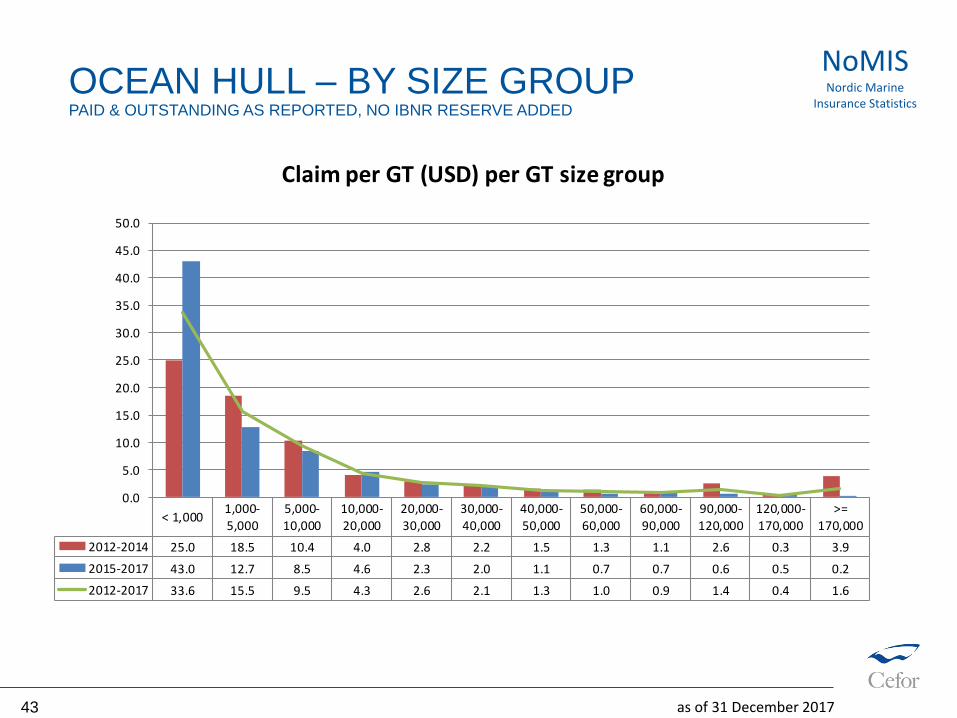
as of 31 December 201743
NoMISNordic Marine
Insurance StatisticsOCEAN HULL – BY SIZE GROUPPAID & OUTSTANDING AS REPORTED, NO IBNR RESERVE ADDED
< 1,0001,000-
5,000
5,000-
10,000
10,000-
20,000
20,000-
30,000
30,000-
40,000
40,000-
50,000
50,000-
60,000
60,000-
90,000
90,000-
120,000
120,000-
170,000
>=
170,000
2012-2014 25.0 18.5 10.4 4.0 2.8 2.2 1.5 1.3 1.1 2.6 0.3 3.9
2015-2017 43.0 12.7 8.5 4.6 2.3 2.0 1.1 0.7 0.7 0.6 0.5 0.2
2012-2017 33.6 15.5 9.5 4.3 2.6 2.1 1.3 1.0 0.9 1.4 0.4 1.6
0.0
5.0
10.0
15.0
20.0
25.0
30.0
35.0
40.0
45.0
50.0
Claim per GT (USD) per GT size group
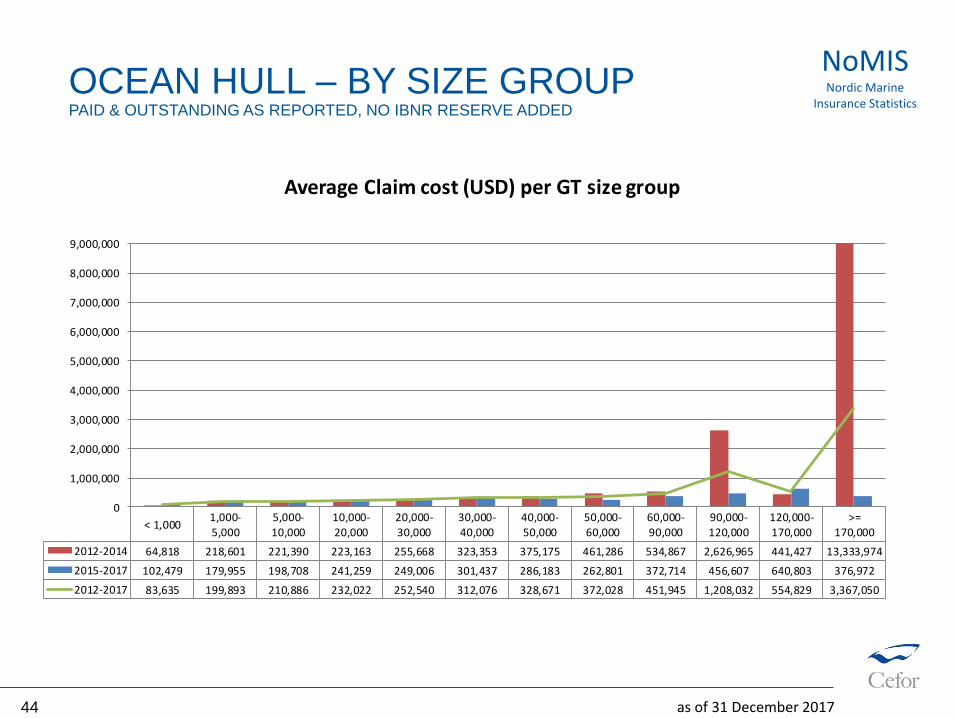
as of 31 December 201744
NoMISNordic Marine
Insurance StatisticsOCEAN HULL – BY SIZE GROUPPAID & OUTSTANDING AS REPORTED, NO IBNR RESERVE ADDED
< 1,0001,000-
5,000
5,000-
10,000
10,000-
20,000
20,000-
30,000
30,000-
40,000
40,000-
50,000
50,000-
60,000
60,000-
90,000
90,000-
120,000
120,000-
170,000
>=
170,000
2012-2014 64,818 218,601 221,390 223,163 255,668 323,353 375,175 461,286 534,867 2,626,965 441,427 13,333,974
2015-2017 102,479 179,955 198,708 241,259 249,006 301,437 286,183 262,801 372,714 456,607 640,803 376,972
2012-2017 83,635 199,893 210,886 232,022 252,540 312,076 328,671 372,028 451,945 1,208,032 554,829 3,367,050
0
1,000,000
2,000,000
3,000,000
4,000,000
5,000,000
6,000,000
7,000,000
8,000,000
9,000,000
Average Claim cost (USD) per GT size group
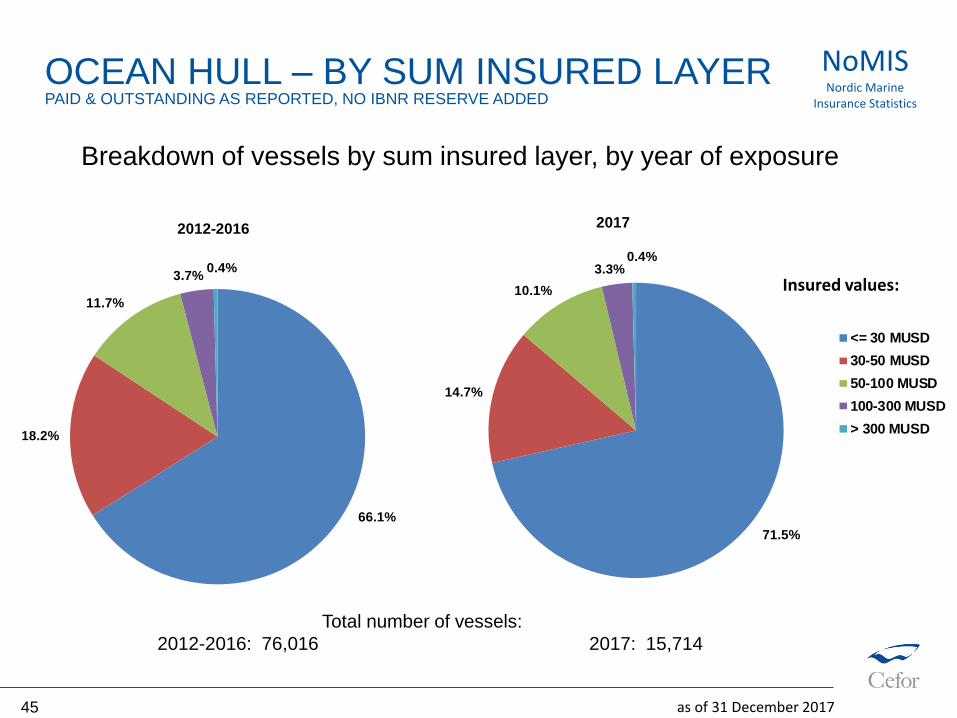
66.1%
18.2%
11.7%
3.7%0.4%
2012-2016
<= 30 MUSD
30-50 MUSD
50-100 MUSD
100-300 MUSD
> 300 MUSD
71.5%
14.7%
10.1%
3.3%0.4%
2017
<= 30 MUSD
30-50 MUSD
50-100 MUSD
100-300 MUSD
> 300 MUSD
Breakdown of vessels by sum insured layer, by year of exposure
Insured values:
as of 31 December 201745
NoMISNordic Marine
Insurance Statistics
OCEAN HULL – BY SUM INSURED LAYERPAID & OUTSTANDING AS REPORTED, NO IBNR RESERVE ADDED
Total number of vessels:
2012-2016: 76,016 2017: 15,714
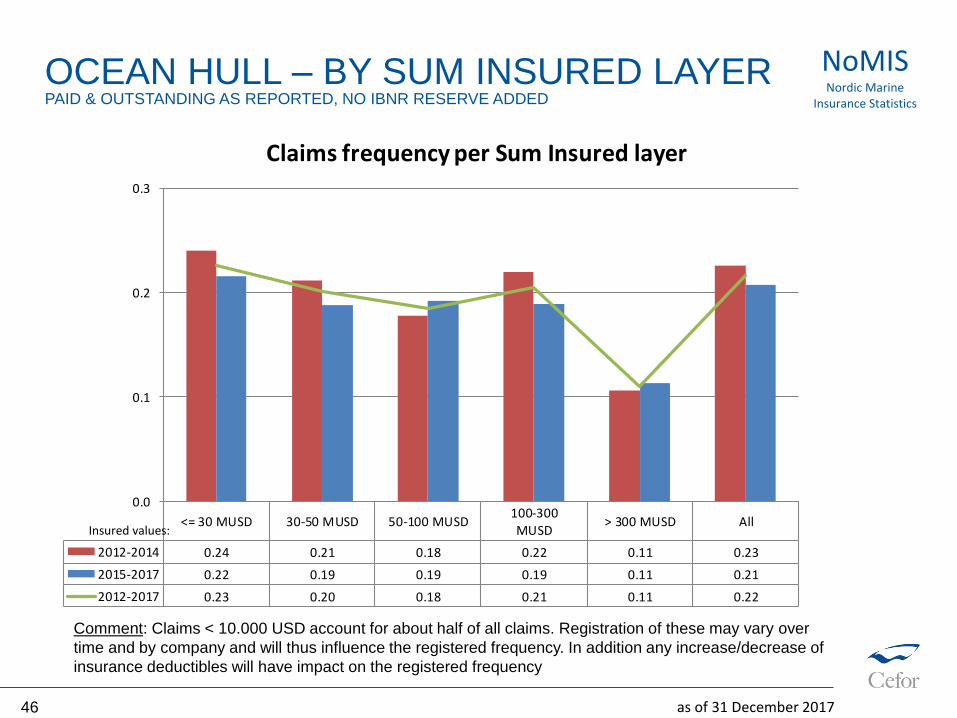
<= 30 MUSD 30-50 MUSD 50-100 MUSD100-300
MUSD> 300 MUSD All
2012-2014 0.24 0.21 0.18 0.22 0.11 0.23
2015-2017 0.22 0.19 0.19 0.19 0.11 0.21
2012-2017 0.23 0.20 0.18 0.21 0.11 0.22
0.0
0.1
0.2
0.3
Claims frequency per Sum Insured layer
Comment: Claims < 10.000 USD account for about half of all claims. Registration of these may vary over
time and by company and will thus influence the registered frequency. In addition any increase/decrease of
insurance deductibles will have impact on the registered frequency
Insured values:
as of 31 December 201746
NoMISNordic Marine
Insurance Statistics
OCEAN HULL – BY SUM INSURED LAYERPAID & OUTSTANDING AS REPORTED, NO IBNR RESERVE ADDED
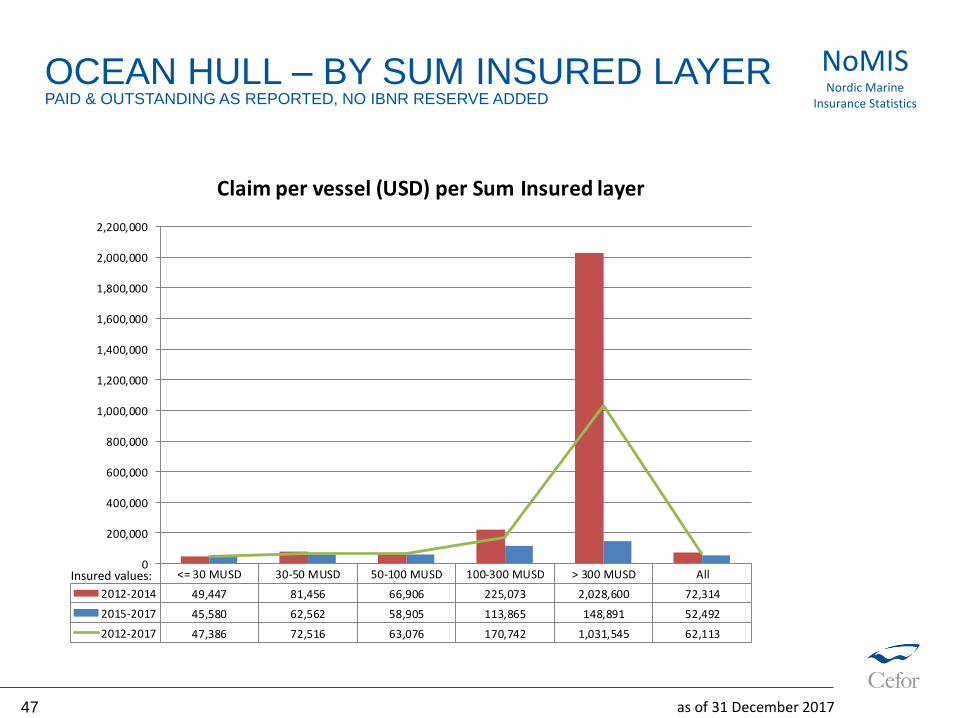
<= 30 MUSD 30-50 MUSD 50-100 MUSD 100-300 MUSD > 300 MUSD All
2012-2014 49,447 81,456 66,906 225,073 2,028,600 72,314
2015-2017 45,580 62,562 58,905 113,865 148,891 52,492
2012-2017 47,386 72,516 63,076 170,742 1,031,545 62,113
0
200,000
400,000
600,000
800,000
1,000,000
1,200,000
1,400,000
1,600,000
1,800,000
2,000,000
2,200,000
Claim per vessel (USD) per Sum Insured layer
Insured values:
as of 31 December 201747
NoMISNordic Marine
Insurance Statistics
OCEAN HULL – BY SUM INSURED LAYERPAID & OUTSTANDING AS REPORTED, NO IBNR RESERVE ADDED
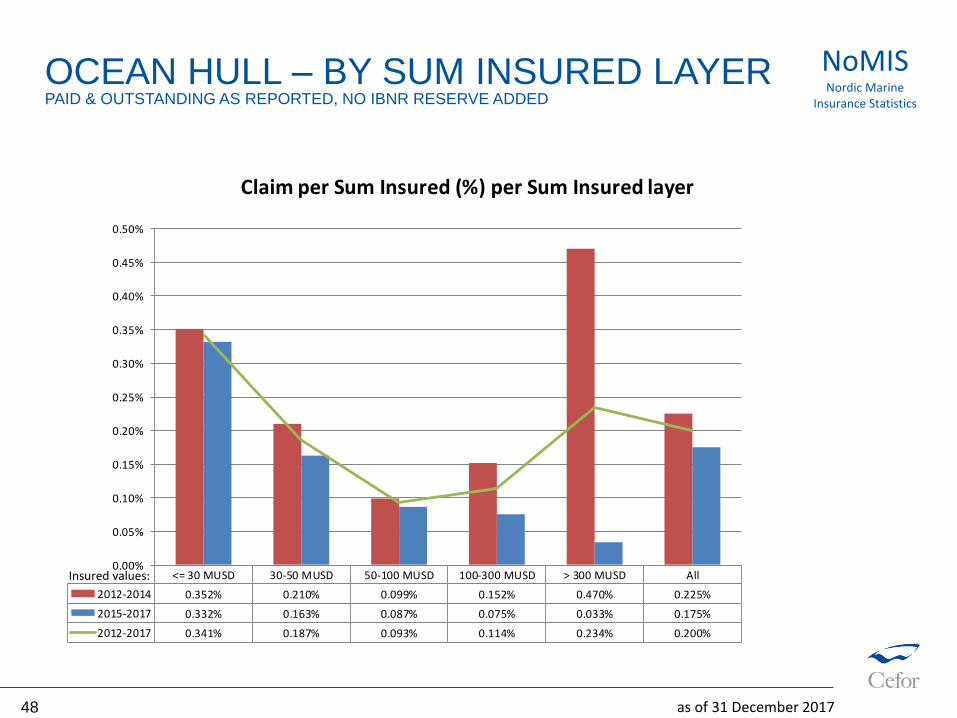
<= 30 MUSD 30-50 MUSD 50-100 MUSD 100-300 MUSD > 300 MUSD All
2012-2014 0.352% 0.210% 0.099% 0.152% 0.470% 0.225%
2015-2017 0.332% 0.163% 0.087% 0.075% 0.033% 0.175%
2012-2017 0.341% 0.187% 0.093% 0.114% 0.234% 0.200%
0.00%
0.05%
0.10%
0.15%
0.20%
0.25%
0.30%
0.35%
0.40%
0.45%
0.50%
Claim per Sum Insured (%) per Sum Insured layer
Insured values:
as of 31 December 201748
NoMISNordic Marine
Insurance Statistics
OCEAN HULL – BY SUM INSURED LAYERPAID & OUTSTANDING AS REPORTED, NO IBNR RESERVE ADDED
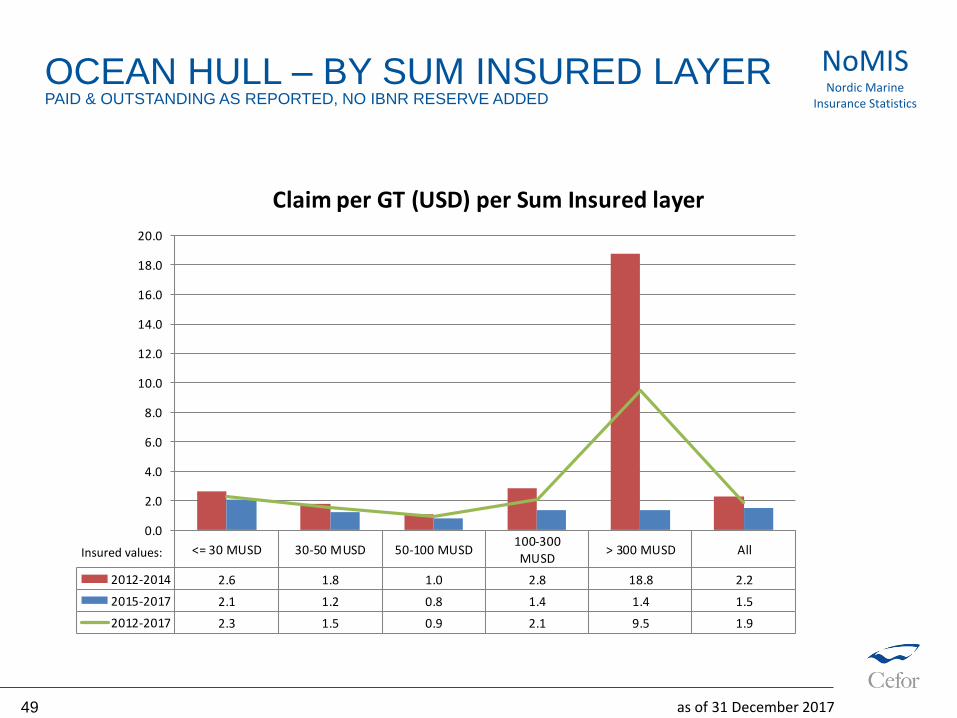
<= 30 MUSD 30-50 MUSD 50-100 MUSD100-300
MUSD> 300 MUSD All
2012-2014 2.6 1.8 1.0 2.8 18.8 2.2
2015-2017 2.1 1.2 0.8 1.4 1.4 1.5
2012-2017 2.3 1.5 0.9 2.1 9.5 1.9
0.0
2.0
4.0
6.0
8.0
10.0
12.0
14.0
16.0
18.0
20.0
Claim per GT (USD) per Sum Insured layer
Insured values:
as of 31 December 201749
NoMISNordic Marine
Insurance Statistics
OCEAN HULL – BY SUM INSURED LAYERPAID & OUTSTANDING AS REPORTED, NO IBNR RESERVE ADDED
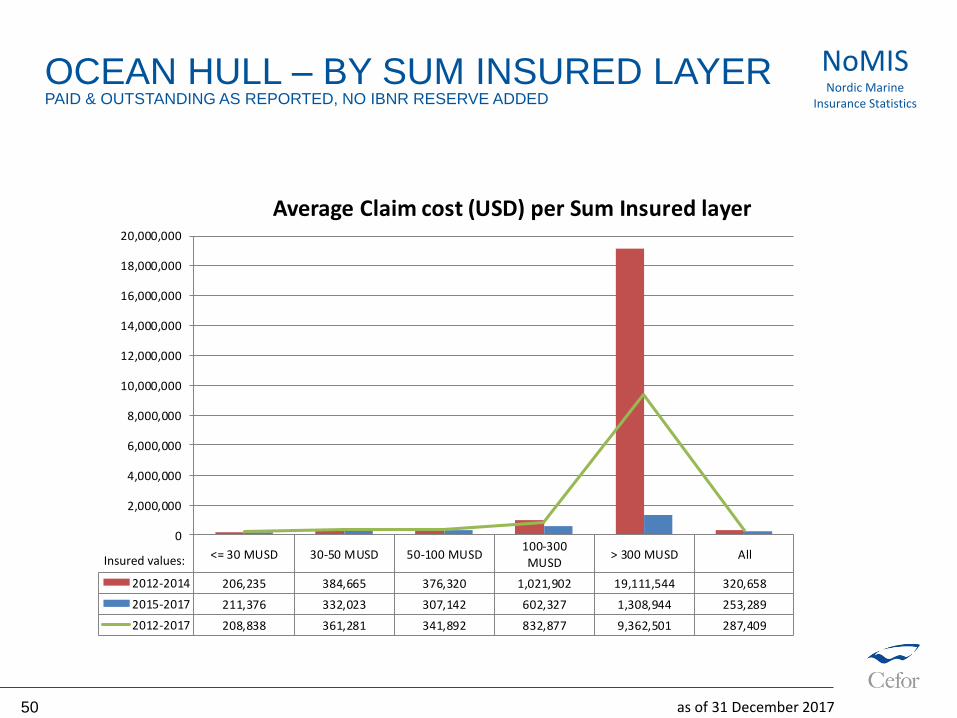
<= 30 MUSD 30-50 MUSD 50-100 MUSD100-300
MUSD> 300 MUSD All
2012-2014 206,235 384,665 376,320 1,021,902 19,111,544 320,658
2015-2017 211,376 332,023 307,142 602,327 1,308,944 253,289
2012-2017 208,838 361,281 341,892 832,877 9,362,501 287,409
0
2,000,000
4,000,000
6,000,000
8,000,000
10,000,000
12,000,000
14,000,000
16,000,000
18,000,000
20,000,000
Average Claim cost (USD) per Sum Insured layer
Insured values:
as of 31 December 201750
NoMISNordic Marine
Insurance Statistics
OCEAN HULL – BY SUM INSURED LAYERPAID & OUTSTANDING AS REPORTED, NO IBNR RESERVE ADDED
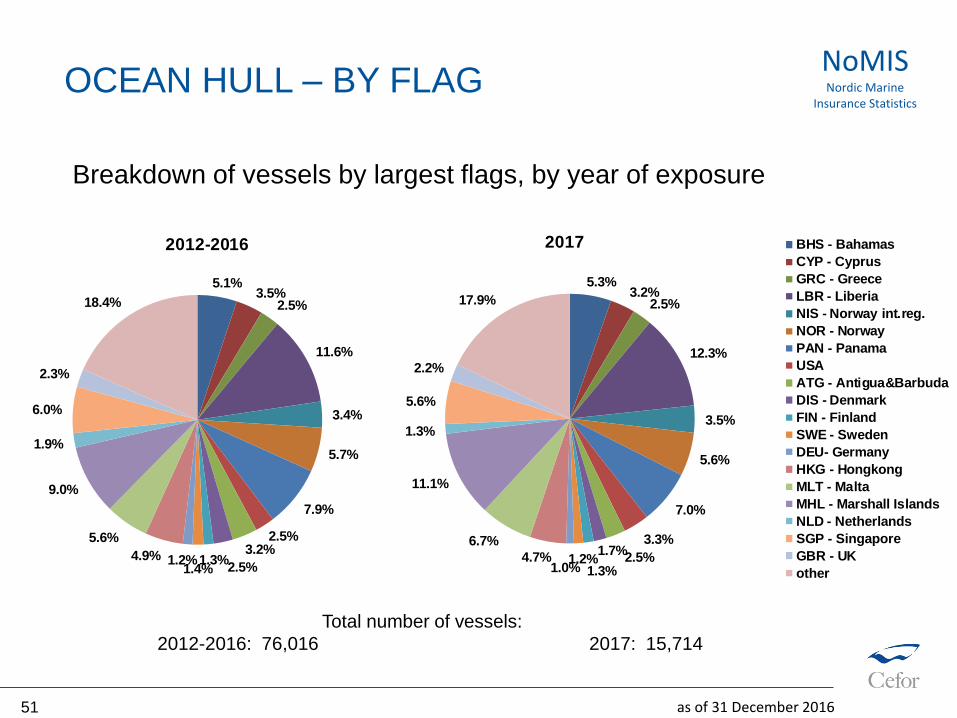
Breakdown of vessels by largest flags, by year of exposure
OCEAN HULL – BY FLAG
as of 31 December 201651
NoMISNordic Marine
Insurance Statistics
Total number of vessels:
2012-2016: 76,016 2017: 15,714
5.1%3.5%
2.5%
11.6%
3.4%
5.7%
7.9%
2.5%3.2%
2.5%1.3%
1.4%1.2%4.9%
5.6%
9.0%
1.9%
6.0%
2.3%
18.4%
2012-2016 BHS - Bahamas
CYP - Cyprus
GRC - Greece
LBR - Liberia
NIS - Norway int.reg.
NOR - Norway
PAN - Panama
USA
ATG - Antigua&Barbuda
DIS - Denmark
FIN - Finland
SWE - Sweden
DEU- Germany
HKG - Hongkong
MLT - Malta
MHL - Marshall Islands
NLD - Netherlands
SGP - Singapore
GBR - UK
other
5.3%3.2%
2.5%
12.3%
3.5%
5.6%
7.0%
3.3%
2.5%1.7%
1.3%1.2%
1.0%4.7%
6.7%
11.1%
1.3%
5.6%
2.2%
17.9%
2017 BHS - Bahamas
CYP - Cyprus
GRC - Greece
LBR - Liberia
NIS - Norway int.reg.
NOR - Norway
PAN - Panama
USA
ATG - Antigua&Barbuda
DIS - Denmark
FIN - Finland
SWE - Sweden
DEU- Germany
HKG - Hongkong
MLT - Malta
MHL - Marshall Islands
NLD - Netherlands
SGP - Singapore
GBR - UK
other
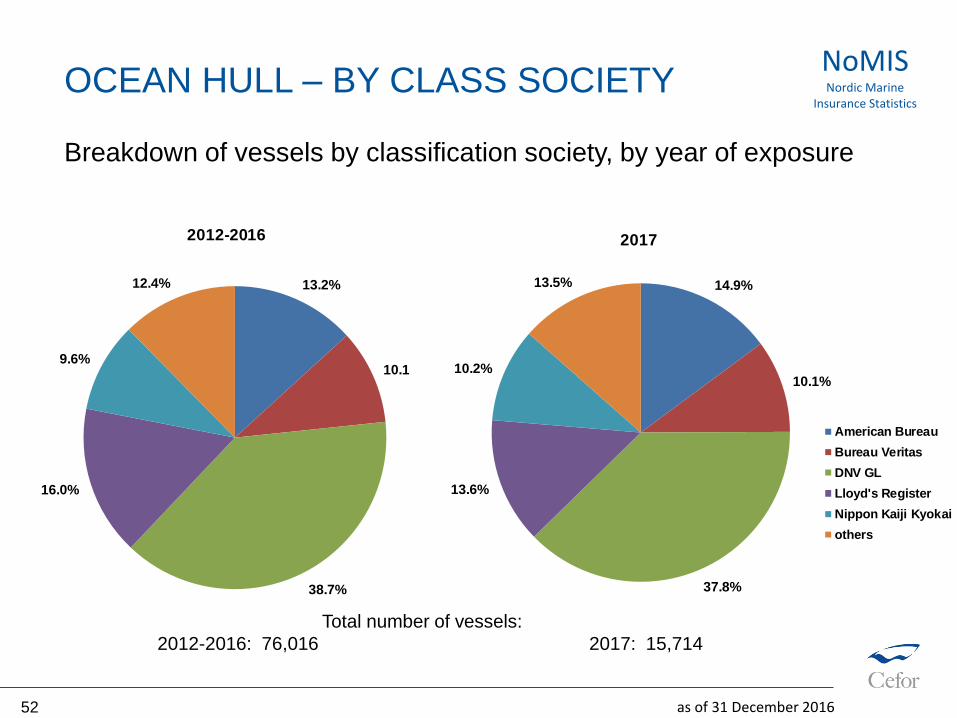
13.2%
10.1%
38.7%
16.0%
9.6%
12.4%
2012-2016
American Bureau
Bureau Veritas
DNV GL
Lloyd's Register
Nippon Kaiji Kyokai
others
14.9%
10.1%
37.8%
13.6%
10.2%
13.5%
2017
American Bureau
Bureau Veritas
DNV GL
Lloyd's Register
Nippon Kaiji Kyokai
others
Breakdown of vessels by classification society, by year of exposure
OCEAN HULL – BY CLASS SOCIETY
as of 31 December 201652
NoMISNordic Marine
Insurance Statistics
Total number of vessels:
2012-2016: 76,016 2017: 15,714
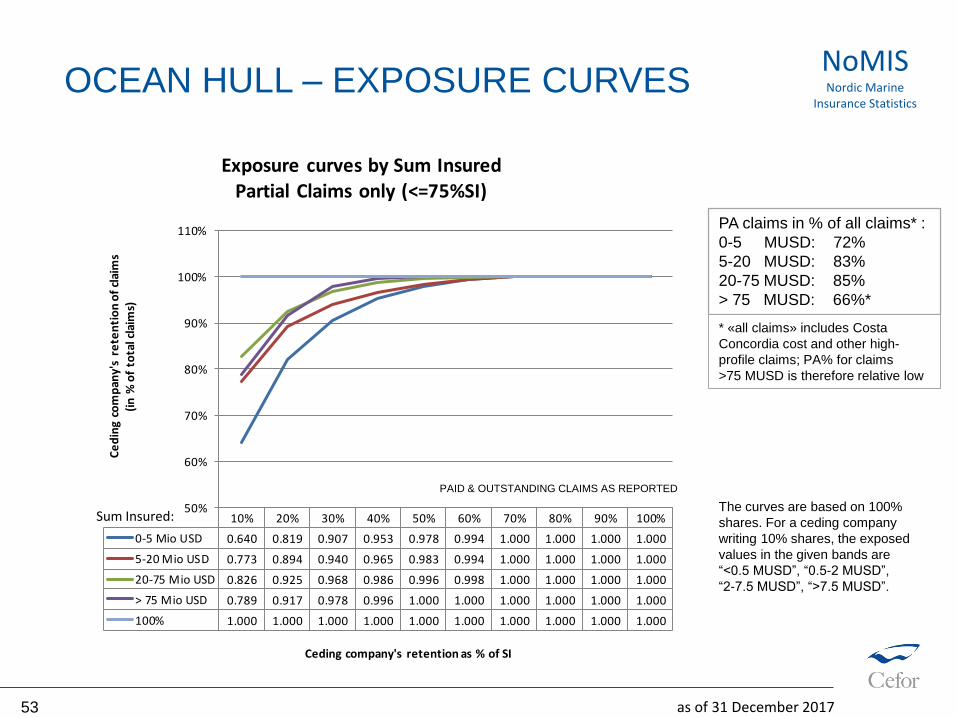
10% 20% 30% 40% 50% 60% 70% 80% 90% 100%
0-5 Mio USD 0.640 0.819 0.907 0.953 0.978 0.994 1.000 1.000 1.000 1.000
5-20 Mio USD 0.773 0.894 0.940 0.965 0.983 0.994 1.000 1.000 1.000 1.000
20-75 Mio USD 0.826 0.925 0.968 0.986 0.996 0.998 1.000 1.000 1.000 1.000
> 75 Mio USD 0.789 0.917 0.978 0.996 1.000 1.000 1.000 1.000 1.000 1.000
100% 1.000 1.000 1.000 1.000 1.000 1.000 1.000 1.000 1.000 1.000
50%
60%
70%
80%
90%
100%
110%
Ce
din
g co
mp
any'
s re
ten
tio
n o
f cl
aim
s (i
n %
of
tota
l cla
ims)
Ceding company's retention as % of SI
Exposure curves by Sum InsuredPartial Claims only (<=75%SI)
Sum Insured:
PA claims in % of all claims* :
0-5 MUSD: 72%
5-20 MUSD: 83%
20-75 MUSD: 85%
> 75 MUSD: 66%*
* «all claims» includes Costa
Concordia cost and other high-
profile claims; PA% for claims
>75 MUSD is therefore relative low
OCEAN HULL – EXPOSURE CURVES
The curves are based on 100%
shares. For a ceding company
writing 10% shares, the exposed
values in the given bands are
“<0.5 MUSD”, “0.5-2 MUSD”,
“2-7.5 MUSD”, “>7.5 MUSD”.
as of 31 December 201753
NoMISNordic Marine
Insurance Statistics
PAID & OUTSTANDING CLAIMS AS REPORTED
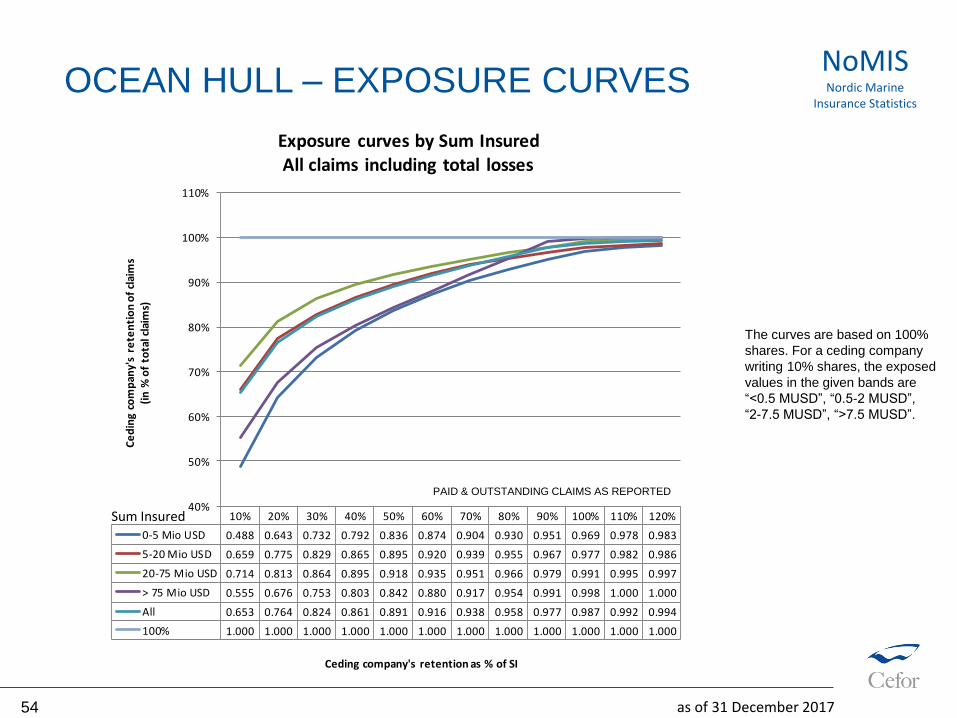
10% 20% 30% 40% 50% 60% 70% 80% 90% 100% 110% 120%
0-5 Mio USD 0.488 0.643 0.732 0.792 0.836 0.874 0.904 0.930 0.951 0.969 0.978 0.983
5-20 Mio USD 0.659 0.775 0.829 0.865 0.895 0.920 0.939 0.955 0.967 0.977 0.982 0.986
20-75 Mio USD 0.714 0.813 0.864 0.895 0.918 0.935 0.951 0.966 0.979 0.991 0.995 0.997
> 75 Mio USD 0.555 0.676 0.753 0.803 0.842 0.880 0.917 0.954 0.991 0.998 1.000 1.000
All 0.653 0.764 0.824 0.861 0.891 0.916 0.938 0.958 0.977 0.987 0.992 0.994
100% 1.000 1.000 1.000 1.000 1.000 1.000 1.000 1.000 1.000 1.000 1.000 1.000
40%
50%
60%
70%
80%
90%
100%
110%
Ce
din
g co
mp
any'
s re
ten
tio
n o
f cl
aim
s (i
n %
of
tota
l cla
ims)
Ceding company's retention as % of SI
Exposure curves by Sum InsuredAll claims including total losses
Sum Insured
OCEAN HULL – EXPOSURE CURVES
The curves are based on 100%
shares. For a ceding company
writing 10% shares, the exposed
values in the given bands are
“<0.5 MUSD”, “0.5-2 MUSD”,
“2-7.5 MUSD”, “>7.5 MUSD”.
as of 31 December 201754
NoMISNordic Marine
Insurance Statistics
PAID & OUTSTANDING CLAIMS AS REPORTED
Exposure Curves
• Exposure curves are used by reinsurers to price excess of loss reinsurance.
• The curves indicate the ceding company's retained share of PA claims after ceding
claims in excess of a given percentage of a vessel’s sum insured.
• The curves should be applied on individual vessels or groups of vessels with similar
values and written shares.
• The curves are calculated for 100% values. In applications the choice of curve should
thus also be based on 100% values.
• The curves are based on USD claims amounts. Due to exchange rate fluctuations,
the ratio between claim cost and insured value may deviate in the original currency.
Exposure Curves technicalities
• The curves are based on H&M covers only for vessels with valid IMO-No.
• The curves are based on claims incurred in the years 2012-2017
(16,441 partial claims; 16,517 claims in all; only claims with cost > 1USD included)
• The curves are calculated as follows:
x = percentage retained
C = Individual claims 1)
V = Vessel value
f(x) = Σ min[C, V*x]/ Σ C
1) First set of exposure curves: based on partial claims only; Second set of exposure curves: based on
all claims, including total losses / claims exceeding the Sum Insured
OCEAN HULL – EXPOSURE CURVES
as of 31 December 201755
NoMISNordic Marine
Insurance Statistics
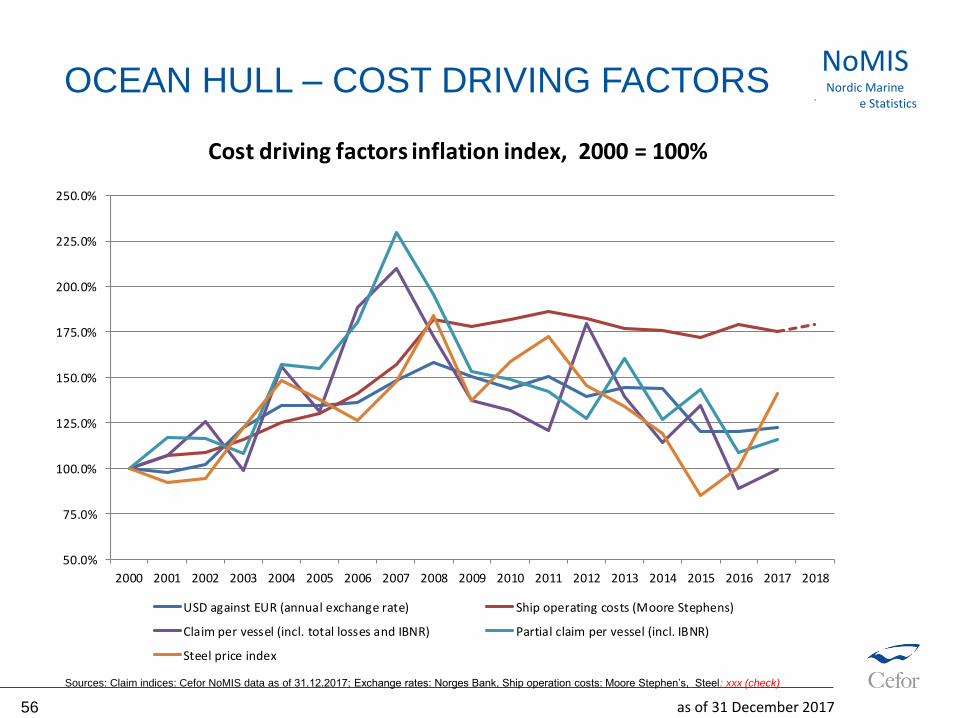
Sources: Claim indices: Cefor NoMIS data as of 31.12.2017; Exchange rates: Norges Bank, Ship operation costs: Moore Stephen’s, Steel: xxx (check)
OCEAN HULL – COST DRIVING FACTORS
as of 31 December 201756
NoMISNordic Marine
Insurance Statistics
50.0%
75.0%
100.0%
125.0%
150.0%
175.0%
200.0%
225.0%
250.0%
2000 2001 2002 2003 2004 2005 2006 2007 2008 2009 2010 2011 2012 2013 2014 2015 2016 2017 2018
Cost driving factors inflation index, 2000 = 100%
USD against EUR (annual exchange rate) Ship operating costs (Moore Stephens)
Claim per vessel (incl. total losses and IBNR) Partial claim per vessel (incl. IBNR)
Steel price index
Cefor marine insurance statistics publications at www.cefor.no/statistics :
(check the ‘NoMIS’ section)
• Cefor Annual Report 2017
• The 2017 Cefor NoMIS OCEAN Hull Report
• The 2017 Cefor NoMIS COASTAL Hull Report
• Half-yearly Claims Update Fact Sheet
Other marine insurance statistics:
• IUMI (International Union of Marine Insurance) –
Statistics issued by IUMI’s Facts & Figures Committee: https://iumi.com/statistics
NOMIS REPORTS 2016
as of 31 December 201757
NoMISNordic Marine
Insurance Statistics


