The 2014 U.S Pharmaceutical · PDF file2014 Strategic management presentation . ... 7 Proton...
55
April 2013 IMS Health Overview The 2014 U.S Pharmaceutical Market: Trends, Issues & Outlook Prepared for GPhA By Doug Long VP Industry Relations [email protected] February 11, 2015
-
Upload
nguyenhuong -
Category
Documents
-
view
226 -
download
0
Transcript of The 2014 U.S Pharmaceutical · PDF file2014 Strategic management presentation . ... 7 Proton...
April 2013
IMS Health Overview
The 2014 U.S Pharmaceutical Market: Trends, Issues
& Outlook
Prepared for
GPhA
By Doug Long
VP Industry Relations
February 11, 2015

All reproduction rights, quotations, broadcasting, publications reserved. No part of this publication may be reproduced or transmitted in any form or by any means, electronic or mechanical, including photocopy, recording, or any information storage and retrieval system, without express written consent of IMS HEALTH.
2014 Strategic management presentation

Top US Pharmaceutical events of 2014
• HEP C
• Double digit dollar growth is back caused by Innovation and
list price increases
• Patent Expiries
− the ones that didn’t happen and the ones that did
• Branded formulary blocks
• The “end” of the Inversion fad
• 42 NMEs launched (41 approved) most in more than a decade, and 18 orphans most in a year ever (and one more than last year’s record 17)
• The withdrawal of Incivek and Victrelis (i.e. launched in 2011 and done by late 2014 – a product’s life is not 10-15 years in these cases)
•

5.2%
1.1%
4.1%
0.7%
-2.8%
3.5%3.4%
1.4%
12.4%
1.9%
12.9%
1.7%
-4%
-2%
0%
2%
4%
6%
8%
10%
12%
14%
Sales TRx
2010 2011 2012 2013 MAT Nov 2014 YTD Nov 2014
US Market Sales and Dispensed Prescription growth
Source: IMS Health, National Sales Perspectives, Nov 2014 IMS Health, National Prescription Audit, Nov 2014
% Growth of sales and prescription of products Total market

12.4% 12.0%
14.2%
0%
5%
10%
15%
20%
25%
MAT Nov 2014
% G
RO
WTH
1.9%
-6.8%
4.0%
-10%
-5%
0%
5%
MAT Nov 2014 %
GR
OW
TH
Source: IMS Health, National Prescription Audit, Branded generics disaggregated, Nov 2014
Source: IMS Health, National Sales Perspectives, Branded generics disaggregated, Nov 2014
Twelve months ending Nov 2014 Twelve months ending Nov 2014 % Growth US$ % Growth TRx
Total market Brands Generics
Brands and Generics sales and TRx growth (MAT)
Specialty $ Growth is 25.1%

Reasons for Generic Price Inflation
Regulatory/Quality and other costs – with the increased scrutiny from the FDA, manufacturers need to invest more into their quality systems and when a quality / supply issue arises due to 483s, it creates the opportunity to increase prices to recoup part of their investment
Customer consolidation – with the increased purchasing power of the customers, manufacturers need to make up value on products where they can
Fewer new product launches – generic manufacturers make money by launching new products, reducing CGS, M&A activity and raising prices; with fewer launches, it puts more pressure on the “in-line” product portfolio which again is a driver to increase prices

What are people thinking about?
• Pharmacies
• Purchasing Alliances
• Controlled Substances abuse
• Access to Specialty Drugs
• Generic Price Inflation
• Track and Trace
• Wholesalers
• Purchasing Alliances
• Controlled Substances abuse
• Access to Specialty Drugs
• Generic Price Inflation
• Track and Trace
• Payors
• Soaring costs of Specialty Drugs
• Generic Price Inflation
• Pruning formularies
• Generic Manufacturers
• Purchasing Alliances
• Portfolio Optimization
• Brand drugs
• Proposed labeling changes
• Tax Inversion
• Brand/Specialty Manufacturers
• Price backlash
• Becoming more specialized
• Oral Specialty
• Orphan Drugs
• Tax Inversion
• Consumers
• Rising costs
• Specialty Tiers
• Losing Insurance

Top Molecules on a TRX Basis- 2014 (MAT November)
Rank Molecule TRx (000) Share Growth
1 ACETAMINOPHEN-HYDROCODONE 120,945 2.8% -6.5%
2 LEVOTHYROXINE 118,386 2.8% 3.4%
3 LISINOPRIL 102,975 2.4% 2.0%
4 METOPROLOL 84,397 2.0% 0.9%
5 ATORVASTATIN 80,207 1.9% 19.3%
6 AMLODIPINE 77,104 1.8% 5.0%
7 METFORMIN 76,082 1.8% 5.5%
8 OMEPRAZOLE 73,773 1.7% 5.1%
9 SIMVASTATIN 72,304 1.7% -9.2%
10 ALBUTEROL 66,362 1.5% 4.6%
TRx
Source: IMS Health, National Prescription Audit, November 2014

Which Molecules gained and lost TRX Volume in 2014?
TRX Gains Gain (Mil.) TRX Losses Loss (Mil.)
ATORVASTATIN 12,981,907 ATENOLOL -1,880,428
GABAPENTIN 6,640,749 FLUTICASONE-SALMETEROL -2,066,815
LOSARTAN 5,733,362 CODEINE-GUAIFENESIN -2,186,187
FLUTICASONE 4,923,766 VALSARTAN -2,191,013
PANTOPRAZOLE 4,307,358 WARFARIN -2,377,544
METFORMIN 3,954,260 ESOMEPRAZOLE -2,868,577
LEVOTHYROXINE 3,884,443 ZOLPIDEM -2,896,754
AMLODIPINE 3,674,845 AZITHROMYCIN -3,761,959
OMEPRAZOLE 3,553,121 SIMVASTATIN -7,360,451
ESCITALOPRAM 3,402,867 ACETAMINOPHEN-HYDROCODONE -8,389,680
12 Months ending Nov. 2014

Source: IMS Health, National Sales Perspectives, Nov 2014
Top specialty products – MAT Nov 2014
Sales ($MN) Share Growth
U.S. Specialty Market 116,257 100.0% 25.1%
1 Sovaldi 7,570 6.5% - - -
2 Humira 7,005 6.0% 28.0%
3 Enbrel 5,419 4.7% 15.8%
4 Remicade 4,487 3.9% 8.9%
5 Copaxone 3,833 3.3% 2.6%
6 Neulasta 3,817 3.3% 7.0%
7 Rituxan 3,448 3.0% 4.1%
8 Atripla 2,956 2.5% 2.8%
9 Avastin 2,864 2.5% 5.9%
10 Tecfidera 2,477 2.1% 237.4%
Top 10 43,876 37.7% 40.6%

Source: IMS Health, National Sales Perspectives, Nov 2014
Top specialty products – MAT Nov 2014
Sales ($MN) Share Growth
11 Truvada 2,466 2.1% 9.6%
12 Epogen 2,413 2.1% 7.4%
13 Gleevec 2,269 2.0% 20.9%
14 Herceptin 2,165 1.9% 11.1%
15 Olysio 1,888 1.6% - - -
16 Stelara 1,422 1.2% 51.6%
17 Tysabri 1,407 1.2% 64.5%
18 Stribild 1,265 1.1% 133.1%
19 Gilenya 1,250 1.1% 19.1%
20 Alimta 1,217 1.0% 2.3%
Top 20 61,638 53.0% 39.8%

Products Company US$mn% Market
Share% Growth
US Industry 368,784 100.0 12.4
1 Abilify® OTS 7,725 2.1 19.7
2 Sovaldi® GS- 7,570 2.1
3 Humira® AV1 7,005 1.9 28.0
4 Nexium® AZN 6,016 1.6 -1.8
5 Crestor® AZN 5,808 1.6 9.0
6 Enbrel® AAI 5,419 1.5 15.8
7 Advair Diskus® GSK 4,857 1.3 -5.7
8 Remicade® JAN 4,487 1.2 8.9
9 Lantus Solostar® S.A 4,343 1.2 45.3
10 Copaxone® TVN 3,833 1.0 2.6
Top 10 57,062 15.5 29.5
MAT Nov 2014
Sales of leading products
Source: IMS Health, National Sales Perspectives, Nov 2014

Products Company US$mn% Market
Share% Growth
11 Neulasta® AAI 3,817 1.0 7.0
12 Rituxan® GTC 3,448 0.9 4.1
13 Januvia® MSD 3,393 0.9 19.5
14 Lantus® S.A 3,331 0.9 32.1
15 Spiriva Handihaler® B.I 3,311 0.9 9.5
16 Lyrica® PFZ 3,031 0.8 26.6
17 Atripla® BMG 2,956 0.8 2.8
18 Avastin® GTC 2,864 0.8 5.9
19 Celebrex® PFZ 2,583 0.7 15.8
20 Levemir® N-N 2,505 0.7 55.9
Top 20 88,302 23.9 24.1
MAT Nov 2014
Sales of 11-20 products
Source: IMS Health, National Sales Perspectives, Nov 2014

Products Company US$mn% Market
Share% Growth
21 Oxycontin® PUF 2,501 0.7 -3.1
22 Tecfidera® BGE 2,477 0.7 237.4
23 Truvada® GS- 2,466 0.7 9.6
24 Epogen® AAI 2,413 0.7 7.4
25 Gleevec® NVR 2,269 0.6 20.9
26 Symbicort® AZN 2,177 0.6 41.3
27 Herceptin® GTC 2,165 0.6 11.1
28 Vyvanse® SHI 2,055 0.6 17.6
29 Zetia® MU& 2,014 0.5 19.0
30 Xarelto® JAN 1,967 0.5 114.5
Top 30 110,805 30.0 25.0
MAT Nov 2014
Sales of 21-30 products
Source: IMS Health, National Sales Perspectives, Nov 2014

What do we mean by specialty pharmaceuticals? IMS has established an industry standard definition
• Initiated only by a specialist
• Generally not oral
• Require special handling
• Unique distribution
• High expense
• Warrants intensive patient counseling
• Requires reimbursement assistance
Medicines that treat specific, complex chronic diseases with four or more of the following attributes:

Top Specialty events to watch for!
• HEP C Innovation and Pricing
• Patient as a Payer
− Specialty tiers in exchanges
• Growing demand for value driven metrics (CE and RWE)/adoption of guidelines
• Copaxone ® 3X weekly and Copaxone ® generic?
• Specialty space gets more crowded with new entrants and more orals are coming
• The first Biosimilar applications are filed
• Co Pay programs cooperation by payers
• Possible 340B changes
• Gene Therapies & Orphan drugs price discussions

US$mn% Market
Share% Growth
US Industry 368,784 100.0 12.4
1 Analogs of human insulin 18,360 5.0 36.6
2 Antiarth,biol resp mod 14,443 3.9 23.9
3 Antipsychotics,oth 14,177 3.8 17.9
4 Lipid regulators 12,877 3.5 4.7
5 Antineo monoclonal antib 10,766 2.9 12.2
6 Viral Hepatitis Products 10,607 2.9 678.0
7 Proton pump inhib 8,783 2.4 -8.2
8 HIV antiviral combination 8,624 2.3 17.5
9 Analeptics 8,261 2.2 -2.2
10 Steroid,inhaled bronch 8,084 2.2 8.9
Top 10 114,982 31.2 23.4
MAT Nov 2014
Leading classes
Sales of leading therapy classes
Source: IMS Health, National Sales Perspectives, Nov 2014

US$mn% Market
Share% Growth
11 Neurological disorders 7,949 2.2 36.6
12 GI anti-inflam 7,945 2.2 12.7
13 Anti-depressants 6,785 1.8 -23.9
14 Dpp-4 Inhib 6,342 1.7 23.6
15 Angiotensin II antagonists 5,870 1.6 -9.4
16 Tyrosine kinase inhibitor 5,383 1.5 27.4
17 Codeine & comb 5,281 1.4 9.0
18 Seizure disorders 5,163 1.4 14.9
19 Immunologic interferons 4,869 1.3 -5.3
20 Immune system adjuncts 4,809 1.3 4.9
Top 20 175,378 47.6 17.1
MAT Nov 2014
Leading classes
Sales of 11-20 therapy classes
Source: IMS Health, National Sales Perspectives, Nov 2014

DollarsAC
US$mn Total Rx dispensed
AC
TRxs mn
Viral Hepatitis Products 9243.5 Anti-depressants 13.0
Analogs of human insulin 4920.4 Seizure disorders 10.1
Antiarth,biol resp mod 2790.7 Antiarth,plain 4.4
Antipsychotics,oth 2147.8 Thyroid hormone,synth 4.1
Neurological disorders 2131.0 Anticoagulants, Other 4.0
Anticoagulants, Other 1402.4 Proton pump inhib 3.7
HIV antiviral combination 1282.0 Steroid,inhaled nasal 3.7
Monoclonal antibodies 1261.8 Biguanides 3.4
Dpp-4 Inhib 1211.4 Antinauseant 5HT3 antag 3.1
Antineo monoclonal antib 1166.5 Angiotensin II antagonists 2.9
Largest absolute growth by leading therapy classes, Sales & TRx (MAT)
Source: IMS Health, National Sales Perspectives, Nov 2014, National Prescription Audit, Nov 2014

DollarsAC
US$mn Total Rx dispensed
AC
TRxs mn
Hormones,androgens -187.2 Diuretics,comb -1.1
Anti-migraine -221.2 Antidopa phenothiazine -1.1
Immunologic interferons -272.1 Hormones -1.2
Tetracyclines -428.5 Osteoclast Inhibitors -1.4
Non-barb,oth -462.2 Antihyperlipidemic agt -1.4
Antihyperlipidemic agt -491.0 Ace inhibitors -1.6
Heparins -519.8 Vitamin K Antagonists -2.4
Angiotensin II antagonists -608.2 Non-barb,oth -3.3
Proton pump inhib -780.9 Macrolides & related -3.6
Anti-depressants -2125.6 Codeine & comb -7.9
Largest absolute neg growth by leading therapy classes, Sales & TRx (MAT)
Source: IMS Health, National Sales Perspectives, Nov 2014, National Prescription Audit, Nov 2014

TRxs mn% Market
Share% Growth
US Industry 4,277 1.0 1.9
1 Anti-depressants 294 6.9 4.6
2 Lipid regulators 258 6.0 0.5
3 Codeine & comb 194 4.5 -3.9
4 Ace inhibitors 174 4.1 -0.9
5 Seizure disorders 144 3.4 7.5
6 Proton pump inhib 135 3.2 2.8
7 Beta blockers 135 3.1 -0.8
8 Thyroid hormone,synth 121 2.8 3.5
9 Calcium blockers 109 2.5 2.3
10 Antiarth,plain 98 2.3 4.7
Top 10 1,661 38.8 1.7
MAT Nov 2014
Leading therapy class
Dispensed prescriptions of leading therapy classes
Source: IMS Health, National Prescription Audit, Nov 2014

TRxs mn% Market
Share% Growth
11 Angiotensin II antagonists 94 2.2 3.2
12 Benzodiazepines 94 2.2 -0.4
13 O/C estrogen/progestogen 83 2.0 1.4
14 Biguanides 79 1.8 4.6
15 Beta agonists 70 1.6 2.8
16 Hormones,cort plain,oral 62 1.5 3.8
17 Penicillins 61 1.4 -1.5
18 Mus relx,non-surg 61 1.4 3.8
19 Analeptics 59 1.4 4.9
20 Macrolides & related 59 1.4 -5.7
Top 20 2,384 55.7 1.7
MAT Nov 2014
Leading therapy class
Dispensed prescriptions of 11-20 therapy classes
Source: IMS Health, National Prescription Audit, Nov 2014

Biologicals future loss of exclusivity
Twelve compounds will present a US$ 73 billion opportunity by 2020
Not considered existing biosimilars such as Epoetin Alfa expired in EU, but still patent protected in the US
Source: IMS MIDAS, 09/2013, IMS Patent focus
EU expiry date US expiry date
2018 2016
2015 2028 (extended)
2014 2018
2014 2015
Expired 2018
2019 2019
Expired Expired
2015 2016
2014 2019
2017 2014
2015 2015
2016 2016
5 0 10
Etanercept (Enbrel)
Adalimumab (Humira)
4.3
Infliximab (Remicade)
5.6
5.6
Trastuzumab (Herceptin)
4.8
5.1
7.5
Insulin Glargine (Lantus)
Interferon Beta-1A (Avonex, Rebif)
7.5
6.2
Ranibizumab (Lucentis)
Insulin Aspart (Novomix, Novorapid)
Pegfilgrastim (Neulasta)
Bevacizumab (Avastin)
Glatiramer Acetate (Copaxone)
Rituximab (Mabthera)
7.8
5.4
9.4
4.3
Global Sales (MAT 09/2013), US$ billion
Total ~ US$ 73
billion

Despite biosimilars gradually emerging
2012
ROW
Europe
2013
Italy, largest Biosimilars
market in EU*
Mar Jun
Biosimilar G-CSF (Zarzio)
prescribed more than originator
N° of Biosimilar applications
(EMA) all-time high (8)
Lilly & BI submission for insulin glargine
biosimilar
Market trends
Regulatory
2nd GSF approved in Japan
Inflectra# (Infliximab Biosimilar)
approved EU
2014
Market trends
Regulatory
Source: Secondary research. List not exhaustive. (*) at ex-manufacturer price levels, not including rebates and discounts. (#) Recommended for RA (Rheumatoid arthritis), CD (Crohn’s disease), UC (Ulcerative colitis), AS (Ankylosing spondylitis), PA (Psoriasis), PsA (Psoriatic arthritis)
Follitropin alfa biosimilar approved
Jul
FDA approved Tbo-filgrastim but filed in the
U.S. as BLA
Remsima (Infliximab Biosimilar)
launched in Korea
Teva announce launch of
GRANIX in USA
Nov
Sandoz Omnitrope to be sole subsidised
somatropin from Jan 2015 in NZ
Herzuma (Trastuzumab bs)
approved in Korea

In Europe, biosimilar uptake exhibits different paces
A few countries have reached or approached the maturity stage
-10%
0%
10%
20%
30%
40%
50%
60%
70%
80%
Mar-07 Dec-07 Jun-08 Dec-08 Jun-09 Dec-09 Jun-10 Dec-10 Jun-11 Dec-11 Jun-12 Dec-12 Jun-13 Dec-13
% U
pta
ke,
SU
Biosimilar uptake across Europe MAT 03/2007 – 12/2013 (Volumes, SU)
AUSTRIA BELGIUM FRANCE GERMANY HUNGARY
ITALY ROMANIA SPAIN SWEDEN UK
Total 10 countries 425M €
MAT 12/2013 Fast uptake at launch, now mature
Consistent uptake
Slow uptake, cultural resistance
Fast growing due to faster growing market trend
Payers incentivized Biosimilars
Source: IMS MIDAS, MAT Sep 2013

The global playing field continues to expand with players finding niches
Players differ not only in geographical spread but also a wider biologic portfolio
Emerging markets players
Domestic players
Serving domestic market only*
Serving 2+ countries
# Pharmerging markets only
Source: IMS Health, MIDAS, MAT Dec 2012. (*) restricted to MIDAS sales data and recombinant and synthesised prods only.
© 2013, IMS HEALTH
International Reach
Government backed players

0%
5%
10%
15%
20%
25%
30%
$0
$10
$20
$30
$40
$50
$60
$70
2010 2011 2012 2013 MAT Nov 2014
% G
RO
WTH
US$
US$BN
Generics Growth
Source: IMS Health, National Sales Perspectives, Branded generics disaggregated, Nov 2014
Generics Sales are $65 Billion and Growth is 14.2%

0%
5%
10%
15%
20%
25%
30%
2700
2800
2900
3000
3100
3200
3300
3400
3500
3600
2010 2011 2012 2013 MAT Nov
2014
% G
RO
WTH
TRx
TRx m
n
Generics Growth
Source: IMS Health, National Sales Perspectives, Branded generics disaggregated, Nov 2014
Generics TRx are 3.5 Billion and Growth is 4.2%

30.1
%
69.9
%
2010
18.0
%
82.0
%
MAT Nov 2014 87.3
%
12.7
%
2010
82.4
%
17.6
%
MAT Nov 2014
Source: IMS Health, National Sales Perspectives, Nov 2014, National Prescription Audit, Nov 2014, Branded generics disaggregated
sales: $315.7bn
sales: $368.8bn
TRx: $4bn
TRx: $4.3bn
% MARKET SHARE US$ % MARKET SHARE TRx
Generics
Brands
Share of Sales & TRx brands and generics
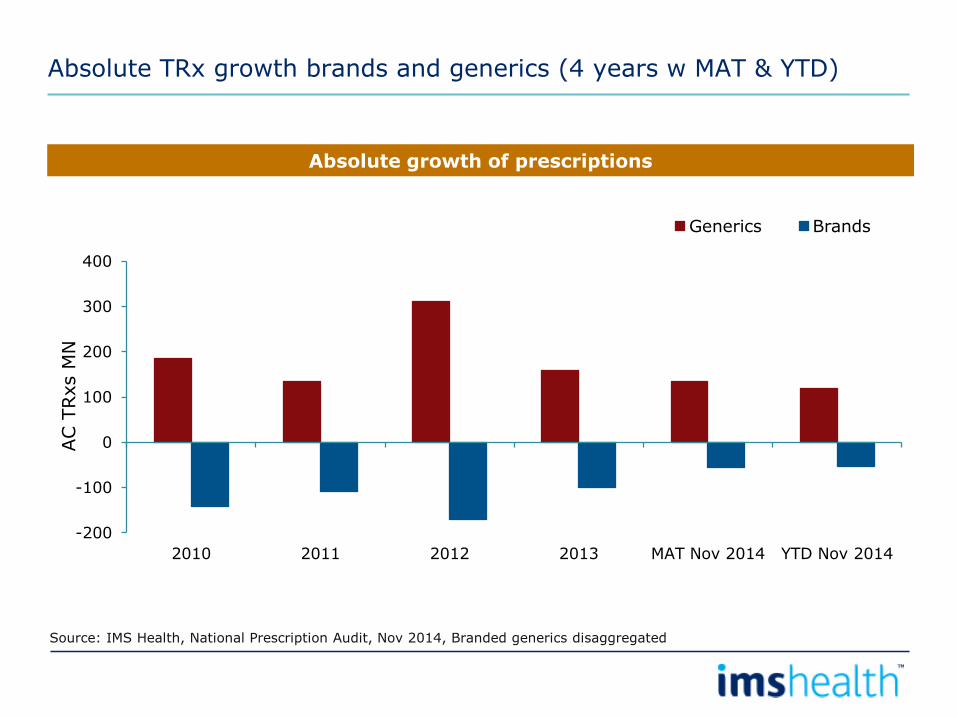
-200
-100
0
100
200
300
400
2010 2011 2012 2013 MAT Nov 2014 YTD Nov 2014
AC T
Rxs M
N
Generics Brands
Source: IMS Health, National Prescription Audit, Nov 2014, Branded generics disaggregated
Absolute growth of prescriptions
Absolute TRx growth brands and generics (4 years w MAT & YTD)

Top US Generics events
• Generic Price Inflation
• Mergers
• How does the Generic Labeling Rule Play Out?
• Copaxone ® & Nexium ® Generics- When?
• Abilify ®
• FDA Guidance on Biosimilars (Naming, etc.)
• Rx to OTC Switches (Nexium) Flonase
• Impact of Consolidated Global Generic Purchasing

Products facing LOE in the next 4 years are valued at $78.4Bn
$17.8
$15.4 $16.6
$32.8
$10.3 $11.0
$27.7
$18.9
$11.1
$20.7
$0
$5
$10
$15
$20
$25
$30
$35
2009 2010 2011 2012 2013 2014 2015 2016 2017 2018
Nexium, Abilify and Namenda face generic competition in 2015
U.S. Patent Expiry Exposure
Sales from year-prior to expiry for years 2009-14; sales in MAT Sep 2014 used for years 2015-18
Source: IMS Health, Dec 2014

US$mn% Market
Share% Growth
US Industry 368,784 100.0 12.4
1 Novartis (incl Sandoz) 19,625 5.3 3.2
2 Astrazeneca 19,453 5.3 7.9
3 Johnson & Johnson 18,719 5.1 36.6
4 Pfizer (incl Greenstone) 17,996 4.9 7.0
5 Roche (incl Genentech) 17,450 4.7 5.5
6 Merck & Co 17,358 4.7 6.5
7 Teva 17,294 4.7 12.5
8 Gilead Sciences 16,980 4.6 128.5
9 Amgen Corporation 16,264 4.4 10.9
10 Sanofi Aventis 14,380 3.9 20.0
Top 10 175,521 47.6 17.1
MAT Nov 2014
Leading corporations
Sales of leading corps
Source: IMS Health, National Sales Perspectives, Nov 2014

US$mn% Market
Share% Growth
11 Actavis US 13,824 3.7 -1.3
12 Abbvie Inc 12,449 3.4 3.0
13 GlaxoSmithKline 12,230 3.3 -3.8
14 Lilly 11,893 3.2 -22.6
15 Novo Nordisk 10,147 2.8 26.5
16 Mylan Labs, Inc. 8,642 2.3 9.2
17 Boehringer Ingelheim 8,198 2.2 6.2
18 Otsuka America Ph 8,084 2.2 20.9
19 Biogen Idec Corp 6,002 1.6 66.1
20 Shire US Corp 4,984 1.4 18.8
Top 20 271,974 73.7 12.3
MAT Nov 2014
Leading corporations
Sales of 11-20 corps
Source: IMS Health, National Sales Perspectives, Nov 2014

US$mn% Market
Share% Growth
US Industry 64,040 17.4 14.5
1 Teva 8,275 12.9 21.9
2 Mylan Labs, Inc. 7,009 10.9 4.9
3 Actavis US 5,737 9.0 -8.2
4 Sandoz (Novartis) 5,076 7.9 19.8
5 Sun Pharma 2,654 4.1 14.5
6 Par Pharm Corp 1,906 3.0 -10.9
7 Endo Pharm Inc. 1,845 2.9 63.0
8 Lupin Pharma 1,809 2.8 29.9
9 Dr Reddy Inc 1,687 2.6 22.2
10 Hospira Inc 1,438 2.2 6.4
Top 10 37,436 58.5 11.2
MAT Nov 2014
Sales of unbranded generics by leading
corporations
Sales of leading corps in Unbranded Generics
Source: IMS Health, National Sales Perspectives, Nov 2014

US$mn% Market
Share% Growth
11 Apotex Corp 1,378 2.2 11.2
12 Perrigo Inc 1,335 2.1 11.7
13 Mallinckrodt 1,333 2.1 29.3
14 Greenstone (Pfizer) 1,258 2.0 2.9
15 Roxane (BI) 1,245 1.9 24.6
16 Amneal Inc 1,223 1.9 43.8
17 Prasco Labs 1,025 1.6 50.5
18 Global Pharm Corp 944 1.5 40.7
19 Fresenius Kabi 892 1.4 -4.8
20 Glenmark Pharma 837 1.3 -2.7
Top 20 48,905 76.4 12.8
MAT Nov 2014
Sales of unbranded generics by
leading corporations
Sales of 11-20 corps in Unbranded Generics
Source: IMS Health, National Sales Perspectives, Nov 2014

TRxs mn% Market
Share% Growth
US Industry 4,277 100.0 1.9
1 Teva 538 12.6 -4.3
2 Mylan Labs, Inc. 342 8.0 -7.8
3 Novartis (incl Sandoz) 304 7.1 13.6
4 Actavis US 301 7.0 -9.2
5 Endo Pharma Inc. 237 5.5 13.6
6 Lupin Pharma 187 4.4 7.4
7 Amneal Inc 149 3.5 9.2
8 Pfizer (incl Greenstone) 133 3.1 -8.3
9 Zydus Pharma 116 2.7 15.8
10 Aurobindo Pharma 106 2.5 12.5
Top 10 2,413 56.4 0.9
MAT Nov 2014
Leading corporations
Dispensed prescriptions by leading corps
Source: IMS Health, National Prescription Audit, Nov 2014

TRxs mn% Market
Share% Growth
11 Dr Reddy Inc 99 2.3 7.2
12 Boehringer Ingelheim 92 2.1 5.8
13 Apotex Corp 92 2.1 17.0
14 Camber Pharma 80 1.9 18.9
15 Sun Pharma 64 1.5 7.2
16 Mallinckrodt 63 1.5 -24.0
17 Daiichi Sankyo 62 1.4 -18.1
18 Astrazeneca 60 1.4 -4.6
19 Internatl Labs 58 1.4 13.8
20 GlaxoSmithKline 50 1.2 -10.5
Top 20 3,134 73.3 0.9
MAT Nov 2014
Leading corporations
Dispensed prescriptions by 11-20 corps
Source: IMS Health, National Prescription Audit, Nov 2014

Dollars AC US$BN TRx AC TRx mn
Gilead Sciences 9.5 Novartis (incl Sandoz) 36.3
Johnson & Johnson 5 Endo Pharma Inc. 28.5
Biogen Idec Corp 2.4 Zydus Pharma 15.8
Sanofi Aventis 2.4 Legacy Pharma Pkg 15.3
Novo Nordisk 2.1 Apotex Corp 13.3
Teva 1.9 Accord Healthcare 13.1
Amgen Corporation 1.6 Lupin Pharma 12.9
Astrazeneca 1.4 Camber Pharma 12.8
Otsuka America Ph 1.4 Amneal Inc 12.6
Pfizer (incl Greenstone) 1.2 Aurobindo Pharma 11.8
Largest absolute growth by leading corporations, Sales & TRx (MAT)
Source: IMS Health, National Sales Perspectives, Nov 2014, National Prescription Audit, Nov 2014

Global Generic Dollars sales are approaching $200 Billon while Standard Units now are over 1 Trillion
$165,000
$170,000
$175,000
$180,000
$185,000
$190,000
$195,000
$200,000
2013 2014
Dollar Volume
Billion
940,000
950,000
960,000
970,000
980,000
990,000
1,000,000
1,010,000
1,020,000
1,030,000
2013 2014
Standard Units
12 Months ending Sept. 2014 vs. 12 Months ending Sept. 2013
10% 5%
Copyright IMS Health

Global Generic Rx market, Value, US$ at ex-mnf price
before rebates and discounts
The US and Pharmerging markets generate most of generic value sales; volume growth rate is declining
SOURCE: IMS HEALTH MIDAS Q2 2014
0%
2%
4%
6%
8%
10%
12%
14%
16%
18%
20%
-
20
40
60
80
100
120
140
160
180
200
US
$ B
illi
on
s
Japan Pharmerging
ROW Top 5 Europe
US Pharma Growth
Generics Growth
Global Generic Rx market, Volume, SU
0%
2%
4%
6%
8%
10%
12%
14%
16%
18%
20%
-
100
200
300
400
500
600
700
800
900
1,000
SU
Bil
lion
s
Japan Pharmerging
ROW Top 5 Europe
US Pharma Growth
Generics Growth
Copyright IMS Health

Top 10 Countries- Generic Dollar Value
Rank Country 2014 Volume
Market Share
Growth Absolute Change
Share of AC
Total Global 195,491,675,832 100% 10% 18,495,911,166 100.0%
1 US 64,908,401,739 29.3% 13% 7,535,049,346 40.7%
2 CHINA
23,906,352,664 10.9% 12% 2,510,348,439 13.6%
3 BRAZIL
10,898,527,967 4.8% 17% 1,580,639,532 8.5%
4 GERMANY 8,098,148,591 3.9% 5% 392,832,681 2.1%
5 FRANCE 7,218,739,038 3.7% -1% - 83,238,350 -0.5%
6 INDIA 6,882,357,031 3.2% 10% 653,840,471 3.5%
7 UK 6,076,419,529 2.9% 7% 403,282,641 2.2%
8 JAPAN 5,807,038,450 2.6% 14% 712,582,493 3.9%
9 CANADA 4,837,061,349 2.5% 0% 17,167,797 0.1%
10 ITALY 4,170,373,909 2.0% 7% 288,427,520 1.6%
Top 10 142,803,420,267 65.9% 11%
14,010,932,570 75.8%
12 months ending September 2014
Copyright IMS Health

Top 10 Countries- Generic Standard Units Volume
Rank Country 2014 Volume
Market Share
Growth Absolute Change
Share of AC
Total Global Total
1,017,003,480,555 100.0% 5% 45,252,127,400 100.0%
1 US
187,022,717,303 18.4% 3% 6,280,257,616 13.9%
2 INDIA
158,396,370,553 15.6% 6% 9,348,699,801 20.7%
3 CHINA
48,109,182,184 4.7% 8% 3,761,480,764 8.3%
4 JAPAN
43,734,396,861 4.3% 13% 5,086,684,951 11.2%
5 GERMANY
40,735,545,153 4.0% 3% 1,125,416,011 2.5%
6 UK
40,225,783,723 4.0% 5% 1,801,080,646 4.0%
7 BRAZIL
37,605,396,328 3.7% 11% 3,668,599,720 8.1%
8 PAKISTAN
34,205,392,455 3.4% 5% 1,569,781,422 3.5%
9 RUSSIA
30,837,136,751 3.0% 4% 1,157,718,669 2.6%
10 BANGLEDESH
27,034,037,988 2.7% 4% 921,024,493 2.0%
Top 10
647,905,959,299 63.7% 6% 34,720,744,093 76.7%
12 months ending September 2014
Copyright IMS Health

Generics are taking an increased share in all markets
REGIONAL GENERIC VOLUME MARKET SHARE (SU) 2004 VS. 2013, RX. RETAIL MARKET
LATAM : 46% 58%
USA: 52% 78%
Africa/Middle East: 46% 58%
Asia/Australasia : 34% 45%
Europe : 41% 56%
Canada: 56% 61%
Copyright IMS Health

61%
57%
31%
72%
27%
27%
58%
16%
12%
16%
11%
12%
World
Rest of the
world
Pharmerging
Developed
Brand Generic Other
Generics will represent a larger share of the market in value terms
Global spending, 2012 and 2017
2012
52%
52%
26%
67%
36%
31%
63%
21%
12%
17%
11%
12%
2017
$622Bn $650-680Bn
$224Bn $370-400Bn
$120Bn $125-155Bn
$965Bn $1,170-1,200Bn
Source: IMS Health Thought Leadership, September 2013
Copyright IMS Health

Buyers are for the first time exercising leverage on the Global market
RATIONALE FOR COMPANY MERGERS/CONSOLIDATION
Walgreen’s – Alliance Boots
- AmerisourceBergen
“...streamline the distribution of pharmaceuticals to Walgreens’ stores and
leverage global supply chain efficiencies while
improving patient access to affordable pharmaceuticals to increase the efficiency of the
healthcare system.”
Source: AmerisourceBergen Press Release March 2013
McKesson – Celesio –RITE AID
“A Celesio acquisition will allow McKesson to buy as much as $10 billion a year in generic
drugs for distribution, compared with $6 billion to $7
billion on its own”
Source:
http://www.bloomberg.com January 2014
CVS – Cardinal Health
“This partnership will enable us to maintain our leadership role
in navigating the dynamic U.S. generics market. With its combined volume and capabilities, the joint venture
will develop innovative purchasing strategies with generic manufacturers and
enhance supply chain efficiencies.”
Source: Cardinal health press
release1
84% of the US generic market consolidated to 4 buying consortia 15% of Europe added to the US consortia
SOURCE: 1http://ir.cardinalhealth.com/files/doc_news/2013/CAH%20Press%20Release%2012.10.13.pdf
Copyright IMS Health

All markets are potentially addressable – the issue is business model and profitability
• What is current addressable market?
• What changes are required to expand the addressable market?
• Who retains the “margin” – wholesaler or pharmacy?
• What will happen with generic prices and industry over time?
• How will generic manufacturers play with a consolidating supply chain?
Wh
o s
ele
cts
th
e m
an
ufa
ctu
rer?
Patient
Pre
scriber
Pharm
acy
/WH
S
Payer
How are prices set?
Tender Free pricing
Regulated
1
2 3
4
5
1. Tender markets
2. Regulated price & dispensing choice
3. Market driven pricing & dispensing choice
4. Regulated price & prescribing choice
5. Out of Pocket markets
Copyright IMS Health

Product mix is a result of payer actions and manufacturer responses in a given market
Volume dynamics (SU) of products in the Statin market
SOURCE: IMS HEALTH MIDAS YEAR 2013
0%
10%
20%
30%
40%
50%
60%
70%
80%
90%
100%
Q4 2000
Q1 2001
Q2 2001
Q3 2001
Q4 2001
Q1 2002
Q2 2002
Q3 2002
Q4 2002
Q1 2003
Q2 2003
Q3 2003
Q4 2003
Q1 2004
Q2 2004
Q3 2004
Q4 2004
Q1 2005
Q2 2005
Q3 2005
Q4 2005
Q1 2006
Q2 2006
Q3 2006
Q4 2006
Q1 2007
Q2 2007
Q3 2007
Q4 2007
Q1 2008
Q2 2008
Q3 2008
Q4 2008
Q1 2009
Q2 2009
Q3 2009
Q4 2009
Q1 2010
Q2 2010
Q3 2010
Q4 2010
Q1 2011
Q2 2011
Q3 2011
Q4 2011
Q1 2012
Q2 2012
Q3 2012
Volum
e m
arket share
Volume dynamics of products in the Irish C10A1 market
LIPITOR(atorvastatin)
CRESTOR(rosuvastatin)
PRAVACHOL(pravastatin)
ZOCOR(simvastatin)
GENERIC PRAVASTATIN
GENERICATORVASTATIN
GENERICSIMVASTATIN
LESCOL (fluvastatin)
LIPOBAY(cerviastatin)
GENERICROSUVASTATIN
0%
10%
20%
30%
40%
50%
60%
70%
80%
90%
100%
Q4 2000
Q1 2001
Q2 2001
Q3 2001
Q4 2001
Q1 2002
Q2 2002
Q3 2002
Q4 2002
Q1 2003
Q2 2003
Q3 2003
Q4 2003
Q1 2004
Q2 2004
Q3 2004
Q4 2004
Q1 2005
Q2 2005
Q3 2005
Q4 2005
Q1 2006
Q2 2006
Q3 2006
Q4 2006
Q1 2007
Q2 2007
Q3 2007
Q4 2007
Q1 2008
Q2 2008
Q3 2008
Q4 2008
Q1 2009
Q2 2009
Q3 2009
Q4 2009
Q1 2010
Q2 2010
Q3 2010
Q4 2010
Q1 2011
Q2 2011
Q3 2011
Q4 2011
Q1 2012
Q2 2012
Q3 2012
Volum
e m
arket share
Volume dynamics of products in the UK C10A1 market
INTRODUCTION OF CATEGORY M
LIPITOR(atorvastatin)
CRESTOR
PRAVACHOL(pravastatin)
ZOCOR(simvastatin)
GENERIC PRAVASTATIN
GENERICATORVASTATIN
GENERICSIMVASTATIN
LESCOL (fluvastatin)
LIPOBAY(cerviastatin)
Copyright IMS Health

What drives the ability to negotiate prices?
Type of formulation
• Complexity
− Oral solids the easiest
− Injectables & inhalers the most difficult
Time as generic
• Initial period hardest
• 2 – 10 years period highest opportunity
• >10 years more un-predictable
In addition to the relative size of the buyer, there is a series of factors that determine the ability to negotiate down price
Number of viable suppliers
• A high number (4+) essential for low prices
Copyright IMS Health

Target segment for international negotiations
The top 200 U.S./European generic molecules accounting for 88% of total value
9%
4%
Source: IMS MIDAS 2013
Highest Potential
Highest Potential
Europe only
target market for negotiations (63%)
U.S. only
Pre-2003
2003-11
2012-13
7%
34%
22%
7%
14% 9%
4%
1% 1%
% of sales for each category split by those products only present in the US, only present in Europe, present in both
% of sales for age band of products versus 1st US generics
Both
Copyright IMS Health

Conclusions
• Dollar growth is improving in the developed markets and softening a bit in Pharmerging markets
• As the small molecule opportunity drought hits and the specialty drug wave accelerates, payers will be desperate to get cost savings somewhere…
− Generics
− Biosimilars
− Better pricing
• Generic share will continue to grow but there will be more regulatory oversight
• Generics are the best solution

Key imperatives for Generic companies
• Quality, Quality, and Quality
• Control costs − Vertical integration
− Portfolio optimization
• Ample inventory
• New product launches − First to File
− Exclusive positions
− High barriers to entry products
• Ex US Tax treatment
• Geographical footprint
• M&A
• Brand/Specialty products
• Strategic pricing

The Big 5 to watch for
• The HEP C market
• Generic Price Inflation
• Biosimilars are closer than they have ever been in the US
• Regulation and Reimbursement Issues
• Tax Inversion

Generics are a great Solution!
• Generics saved the US $239 billion in 2013
• 14% increase over 2012
• $1.5 Trillion in savings from 2004-2013