
The 2014 Myanmar Population and Housing Census ......The 2014 Myanmar Population and Housing Census...
58
THE REPUBLIC OF THE UNION OF MYANMAR The 2014 Myanmar Populaon and Housing Census Department of Populaon Ministry of Labour, Immigraon and Populaon October 2017 Ngwehsaung Sub-Township Report AYEYAWADY REGION, PATHEIN DISTRICT
Transcript of The 2014 Myanmar Population and Housing Census ......The 2014 Myanmar Population and Housing Census...
THE REPUBLIC OF THE UNION OF MYANMAR
The 2014 Myanmar Population and Housing Census
Department of Population
Ministry of Labour, Immigration and Population
October 2017
Ngwehsaung Sub-Township ReportAYEYAWADY REGION, PATHEIN DISTRICT

The 2014 Myanmar Population and Housing Census
Ayeyawady Region, Pathein District
Ngwehsaung Sub-Township Report
Department of Population
Ministry of Labour, Immigration and Population
Office No.48
Nay Pyi Taw
Tel: +95 67 431062
www.dop.gov.mm
October 2017

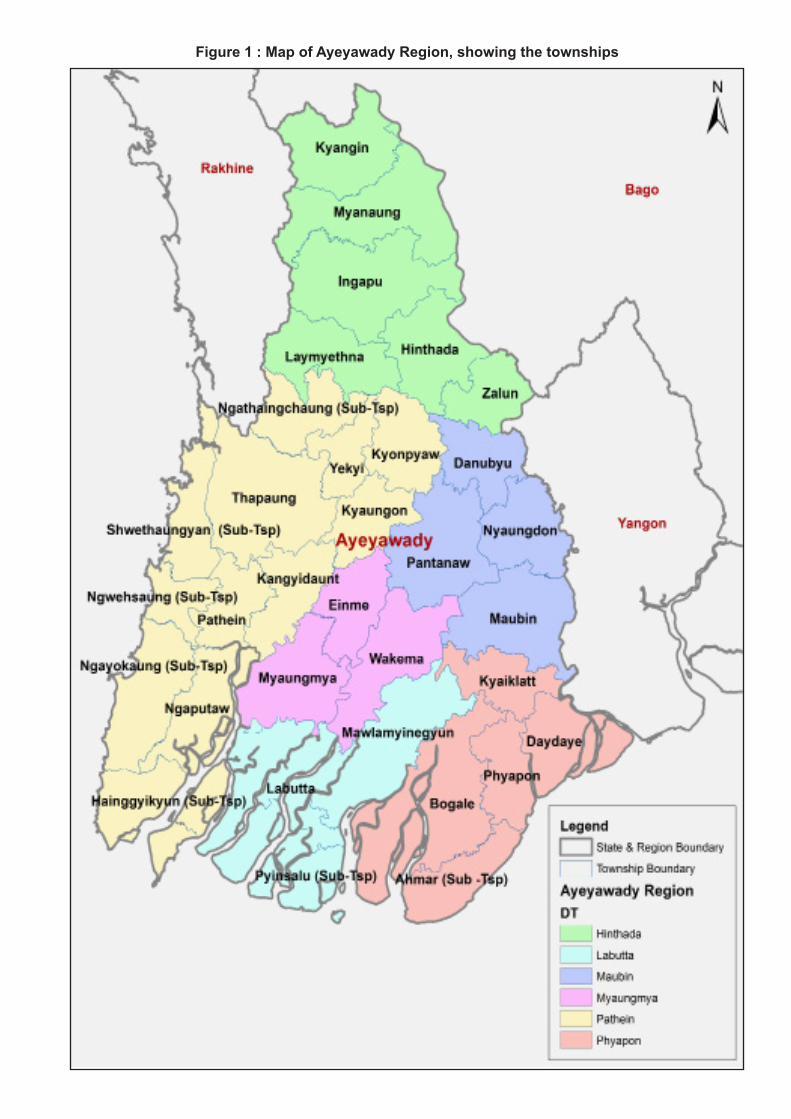
Figure 1 : Map of Ayeyawady Region, showing the townships


Ngwehsaung Sub -Township Figures at a Glance 1
Total Population 44,376 2
Population males 22,651 (51.0%)Population females 21,725 (49.0%)Percentage of urban population 32.7%Area (Km2) 597.3 3
Population density (per Km2) 74.3 personsMedian age 27.0 years
Number of wards 4Number of village tracts 9Number of private households 9,470Percentage of female headed households 14.7%Mean household size 4.1 persons 4
Percentage of population by age groupChildren (0 – 14 years) 29.1%Economically productive (15 – 64 years) 66.3%
Elderly population (65+ years) 4.6%
Dependency ratiosTotal dependency ratio 50.8Child dependency ratio 43.9Old dependency ratio 6.9
Ageing index 15.7
Sex ratio (males per 100 females) 104
Literacy rate (persons aged 15 and over) 91.2%Male 92.6%Female 89.7%
People with disability Number Per centAny form of disability 3,994 9.0Walking 1,366 3.1Seeing 2,567 5.8Hearing 916 2.1Remembering 1,455 3.3
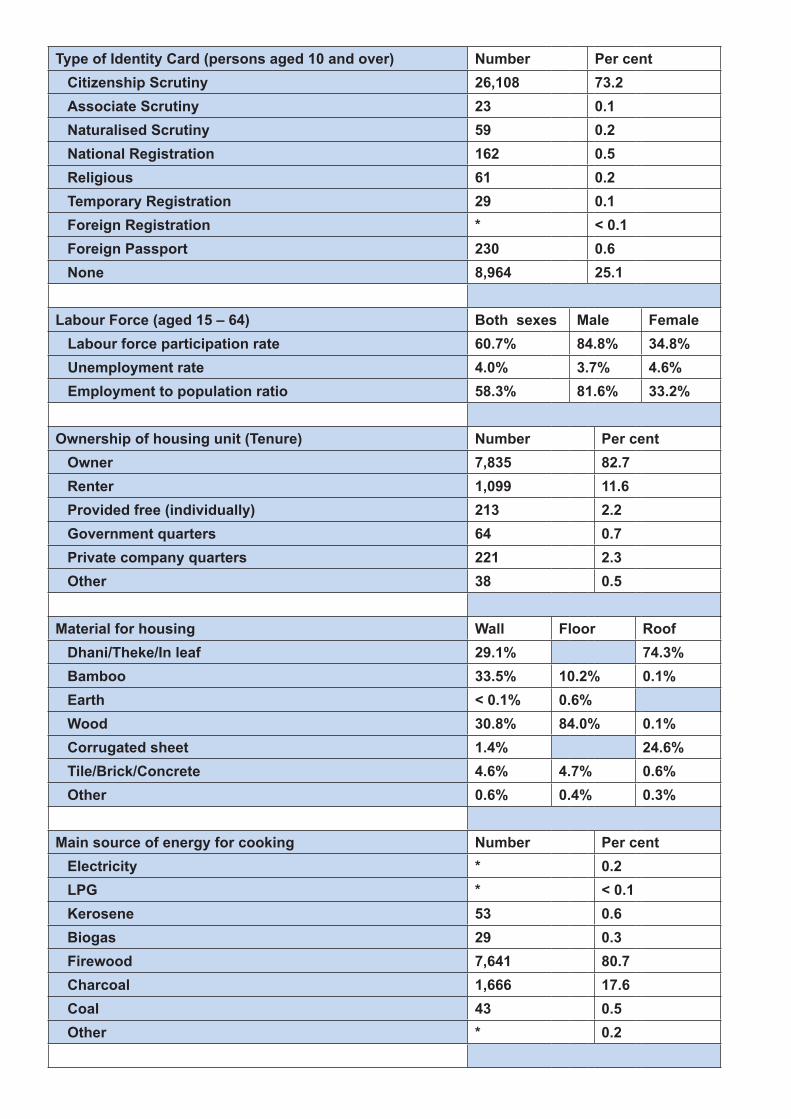
Type of Identity Card (persons aged 10 and over) Number Per centCitizenship Scrutiny 26,108 73.2Associate Scrutiny 23 0.1Naturalised Scrutiny 59 0.2National Registration 162 0.5Religious 61 0.2Temporary Registration 29 0.1Foreign Registration * < 0.1Foreign Passport 230 0.6None 8,964 25.1
Labour Force (aged 15 – 64) Both sexes Male Female Labour force participation rate 60.7% 84.8% 34.8% Unemployment rate 4.0% 3.7% 4.6% Employment to population ratio 58.3% 81.6% 33.2%
Ownership of housing unit (Tenure) Number Per centOwner 7,835 82.7Renter 1,099 11.6Provided free (individually) 213 2.2Government quarters 64 0.7Private company quarters 221 2.3Other 38 0.5
Material for housing Wall Floor RoofDhani/Theke/In leaf 29.1% 74.3%Bamboo 33.5% 10.2% 0.1%Earth < 0.1% 0.6%Wood 30.8% 84.0% 0.1%Corrugated sheet 1.4% 24.6%Tile/Brick/Concrete 4.6% 4.7% 0.6%Other 0.6% 0.4% 0.3%
Main source of energy for cooking Number Per centElectricity * 0.2LPG * < 0.1Kerosene 53 0.6Biogas 29 0.3Firewood 7,641 80.7Charcoal 1,666 17.6Coal 43 0.5Other * 0.2
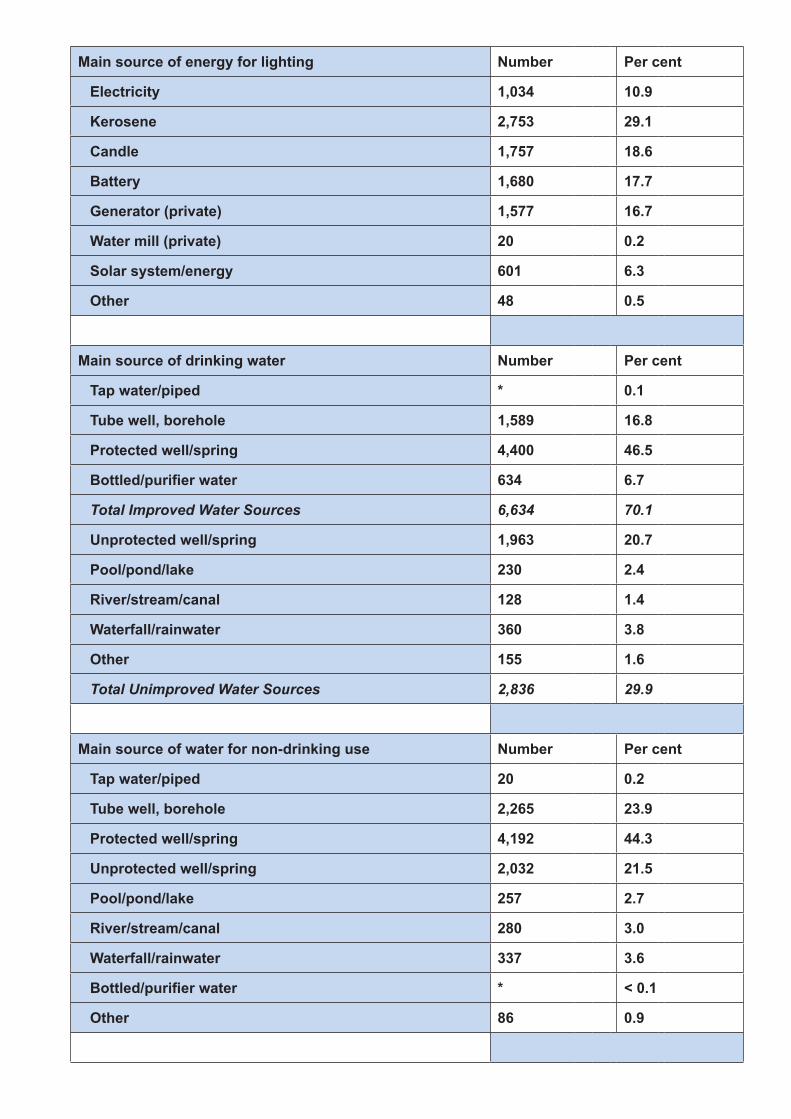
Main source of energy for lighting Number Per cent
Electricity 1,034 10.9
Kerosene 2,753 29.1
Candle 1,757 18.6
Battery 1,680 17.7
Generator (private) 1,577 16.7
Water mill (private) 20 0.2
Solar system/energy 601 6.3
Other 48 0.5
Main source of drinking water Number Per cent
Tap water/piped * 0.1
Tube well, borehole 1,589 16.8
Protected well/spring 4,400 46.5
Bottled/purifier water 634 6.7
Total Improved Water Sources 6,634 70.1
Unprotected well/spring 1,963 20.7
Pool/pond/lake 230 2.4
River/stream/canal 128 1.4
Waterfall/rainwater 360 3.8
Other 155 1.6
Total Unimproved Water Sources 2,836 29.9
Main source of water for non-drinking use Number Per cent
Tap water/piped 20 0.2
Tube well, borehole 2,265 23.9
Protected well/spring 4,192 44.3
Unprotected well/spring 2,032 21.5
Pool/pond/lake 257 2.7
River/stream/canal 280 3.0
Waterfall/rainwater 337 3.6
Bottled/purifier water * < 0.1
Other 86 0.9

Type of toilet Number Per cent
Flush 63 0.7
Water seal (Improved pit latrine) 6,724 71.0
Total Improved Sanitation 6,787 71.7
Pit (Traditional pit latrine) 261 2.7
Bucket (Surface latrine) 164 1.7
Other 26 0.3
None 2,232 23.6
Availability of communication amenities Number Per cent
Radio 3,907 41.3
Television 3,101 32.7
Landline phone 242 2.6
Mobile phone 3,436 36.3
Computer 100 1.1
Internet at home 456 4.8
Households with none of the items 3,111 32.9
Households with all of the items * 0.1
Availability of Transportation equipment Number Per cent
Car/Truck/Van 84 0.9
Motorcycle/Moped 2,762 29.2
Bicycle 2,003 21.2
4-Wheel tractor 36 0.4
Canoe/Boat 206 2.2
Motor boat 312 3.3
Cart (bullock) 1,988 21.0Note: 1 Population figures for Ngwehsaung Sub-Township are as of 29th March 2014.
2 Includes both household population and institution population.
3 Settlement and Land Record Department, Ministry of Agriculture, Livestock and Irrigation, (2014-2015)
4 Calculated based on conventional household population
* Less than 20.

1
Contents
Introduction ................................................................................................................................................3
Census information on Ngwehsaung Sub-Township ..................................................................................5
(A) Demographic Characteristics .........................................................................................................7
(B) Religion ........................................................................................................................................11
(C) Education .....................................................................................................................................12
(D) Economic Characteristics ............................................................................................................16
(E) Identity Cards ...............................................................................................................................22
(F) Disability ......................................................................................................................................23
(G) Housing Conditions and Household Amenities ............................................................................26
Type of housing unit .....................................................................................................................26
Type of toilet .................................................................................................................................27
Source of drinking water ..............................................................................................................29
Source of lighting .........................................................................................................................31
Type of cooking fuel .....................................................................................................................33
Communication and related amenities .........................................................................................35
Transportation items ....................................................................................................................37
(H) Fertility and Mortality ....................................................................................................................38
Fertility .........................................................................................................................................38
Childhood Mortality and Maternal Mortality ..................................................................................40
Definitions and Concepts .........................................................................................................................42
List of Contributors ...................................................................................................................................46


3
Introduction
In April 2014, the Government of the Republic of the Union of Myanmar conducted its latest census, after three decades without a Population and Housing Census. In the post-independence period, comprehensive population and housing censuses were only successfully undertaken in 1973, 1983 and most recently in April 2014.
Censuses are an important source of benchmark information on the characteristics of the population and households in every country. One unique feature of a census is its ability to provide information down to the lowest administrative level. Such information is vital for planning and evidence based decision-making at every level. Additional data uses include allocation of national resources; the review of administrative boundaries; the positioning of social infrastructures, drawing national development plans, service provision and developing social infrastructure, and for humanitarian preparedness and response.
The results of the 2014 Census have been published so far in a number of volumes. The first was the Provisional Results released in August 2014. The Census Main Results were launched in May 2015. These included The Union Report, Highlights of the Main Results, and reports of each of the 15 States and Regions. The reports on Occupation and Industry and Religion were launched in March 2016 and July 2016, respectively. All the publications are available online at http://www.dop.gov.mm/ and http://myanmar. unfpa.org/node/15104.
The current set of the 2014 Census publications comprise township and sub-township reports. Their preparation involved collaborative efforts of the Department of Population and UNFPA. This report contains selected demographic and socio-economic characteristics of Ngwehsaung Sub-Township in Ayeyawady Region. The information included in this report is the situation of 2014 March 29, Census night. Township level information is very important. However, the level of confidence of township estimates is not the same as Union level information. Some of the townships have relatively small populations; the interpretation of these estimates should be made with caution. Some of the indicators, such as IMR/U5MR, were adopted only after careful analysis considering a number of factors to ensure consistency in the results. Estimates for townships with relatively small number of observations should not be taken as exact estimates of the mortality level, but rather they should be regarded as reasonable indicators for the scale of mortality risk they experience, an indication of which townships are better off and which are in a more vulnerable situation.


5
Census information on Ngwehsaung Sub-Township


7
(A) Demographic Characteristics
Total population 44,376 *
Males 22,651
Females 21,725
Sex ratio 104 males per 100 females
Percentage of urban population 32.7%
Area (Km2) 597.3 **
Population density (persons per Km2) 74.3 persons
Number of wards 4
Number of village tracts 9
Total Urban Rural
Population in conventional households 39,257 10,732 28,525
Number of conventional households 9,470 2,675 6,795
Mean household size 4.1 persons ***
• In Ngwehsaung Sub-Township, there are less females than males with 104 males per 100 females.
• The majority of the people in the Sub-Township live in rural areas with only (32.7%) living in urban areas.
• The population density of Ngwehsaung Sub-Township is 74 persons per square kilometre.
• There are 4.1 persons living in each household in Ngwehsaung Sub-Township. This is slightly lower than the Union average.
Note: * Includes both household population and institution population.
** Settlement and Land Record Department, Ministry of Agriculture, Livestock and Irrigation, (2014-2015)
*** Calculated based on conventional household population
8
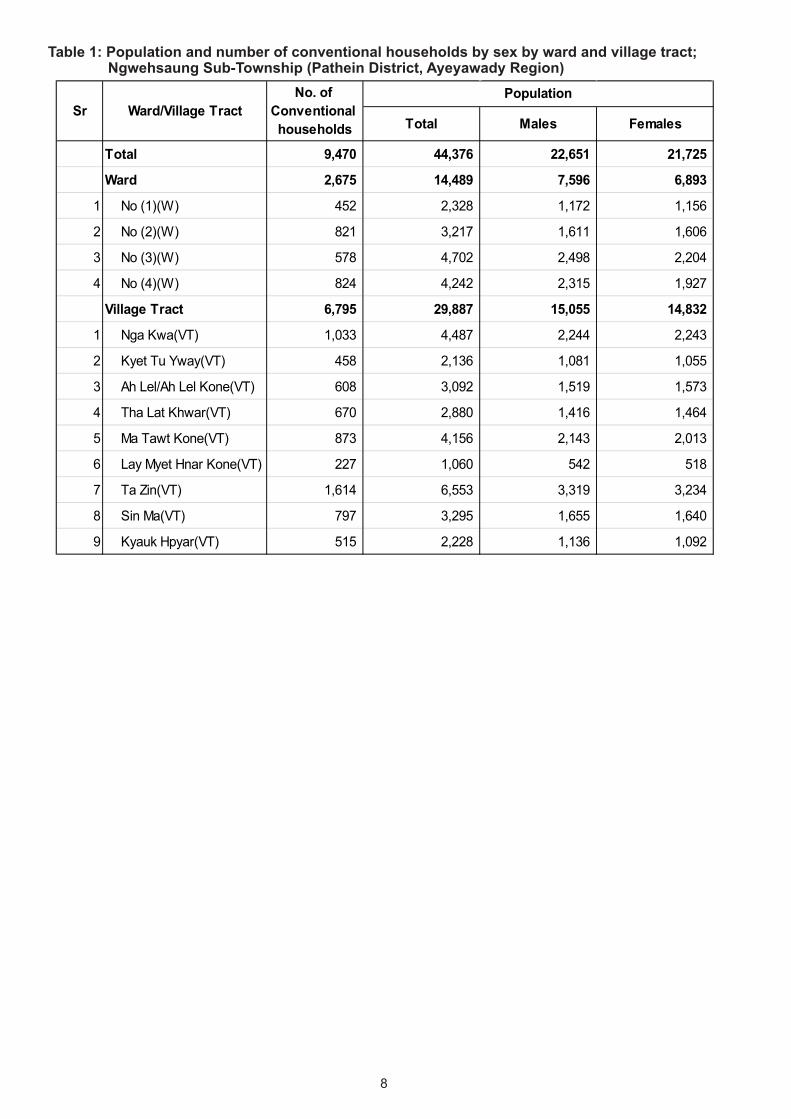
Table 1: Population and number of conventional households by sex by ward and village tract; Ngwehsaung Sub-Township (Pathein District, Ayeyawady Region)
Total Males Females
Total 9,470 44,376 22,651 21,725
Ward 2,675 14,489 7,596 6,893
1 No (1)(W) 452 2,328 1,172 1,156
2 No (2)(W) 821 3,217 1,611 1,606
3 No (3)(W) 578 4,702 2,498 2,204
4 No (4)(W) 824 4,242 2,315 1,927
Village Tract 6,795 29,887 15,055 14,832
1 Nga Kwa(VT) 1,033 4,487 2,244 2,243
2 Kyet Tu Yway(VT) 458 2,136 1,081 1,055
3 Ah Lel/Ah Lel Kone(VT) 608 3,092 1,519 1,573
4 Tha Lat Khwar(VT) 670 2,880 1,416 1,464
5 Ma Tawt Kone(VT) 873 4,156 2,143 2,013
6 Lay Myet Hnar Kone(VT) 227 1,060 542 518
7 Ta Zin(VT) 1,614 6,553 3,319 3,234
8 Sin Ma(VT) 797 3,295 1,655 1,640
9 Kyauk Hpyar(VT) 515 2,228 1,136 1,092
Sr Ward/Village TractNo. of
Conventional households
Population

9
Figure 2: Population by broad age groups, Ngwehsaung Sub-Township
Table 2: Population by 5-year age groups, Ngwehsaung Sub-Township
• The proportion of productive working population between 15 to 64 years of age in Ngwehsaung Sub-Township is 66.3 per cent.
• The proportion of children aged 14 and below together with the proportion of the elderly aged 65 and over are less than the proportion of the working age group population.
• Fewer proportions of children and elderly reduce the dependency of those age groups on the working age population.
Age groups Total Males Females
Total 44,376 22,651 21,725
0 - 4 4,318 2,205 2,113
5 - 9 4,411 2,165 2,246
10 - 14 4,198 2,140 2,058
15 - 19 3,814 1,989 1,825
20 - 24 3,902 1,999 1,903
25 - 29 3,916 1,995 1,921
30 - 34 3,751 1,964 1,787
35 - 39 3,192 1,683 1,509
40 - 44 2,880 1,538 1,342
45 - 49 2,543 1,327 1,216
50 - 54 2,420 1,221 1,199
55 - 59 1,745 866 879
60 - 64 1,253 644 609
65 - 69 730 347 383
70 - 74 542 231 311
75 - 79 358 165 193
80 - 84 240 103 137
85 - 89 120 50 70
90 + 43 19 24
10
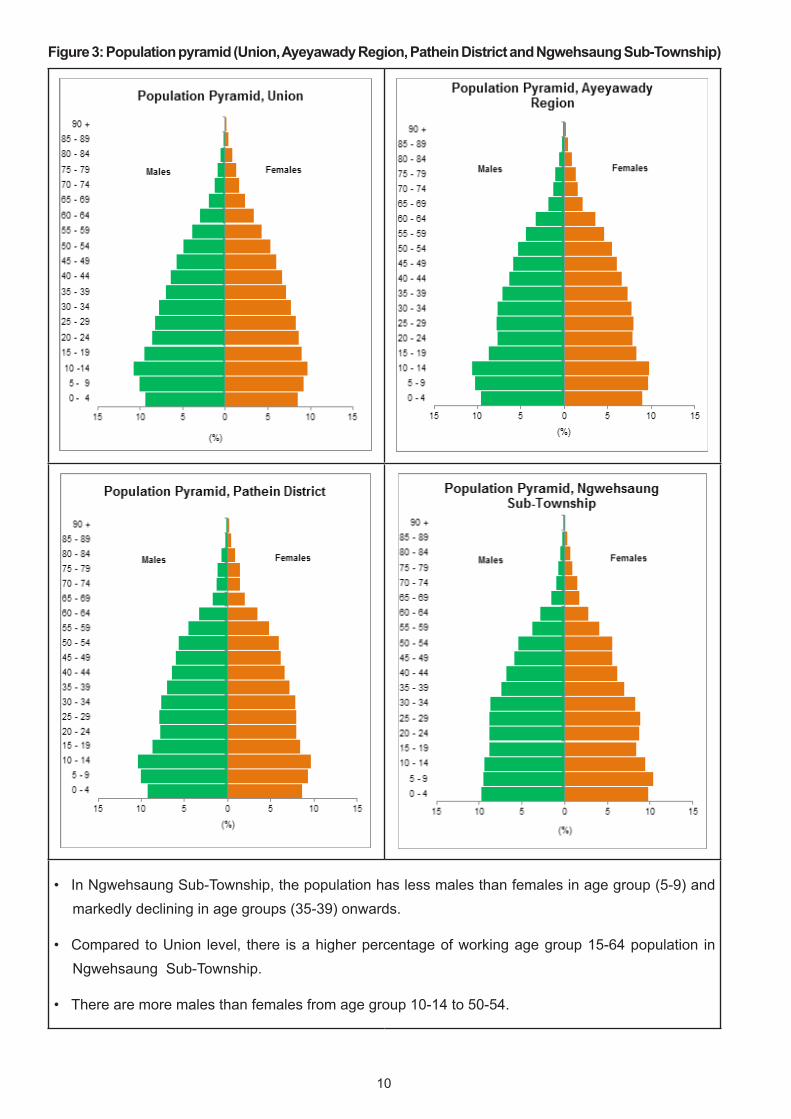
Figure 3: Population pyramid (Union, Ayeyawady Region, Pathein District and Ngwehsaung Sub-Township)
• In Ngwehsaung Sub-Township, the population has less males than females in age group (5-9) and markedly declining in age groups (35-39) onwards.
• Compared to Union level, there is a higher percentage of working age group 15-64 population in Ngwehsaung Sub-Township.
• There are more males than females from age group 10-14 to 50-54.
11
(B) Religion
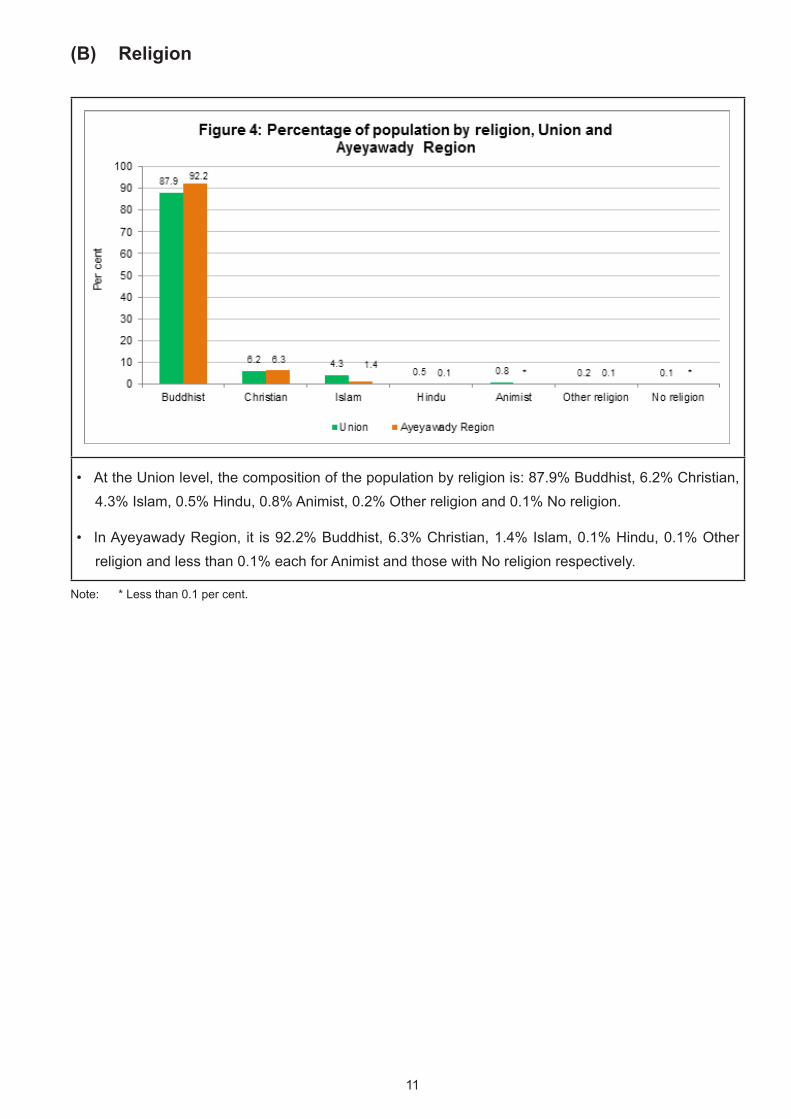
• At the Union level, the composition of the population by religion is: 87.9% Buddhist, 6.2% Christian, 4.3% Islam, 0.5% Hindu, 0.8% Animist, 0.2% Other religion and 0.1% No religion.
• In Ayeyawady Region, it is 92.2% Buddhist, 6.3% Christian, 1.4% Islam, 0.1% Hindu, 0.1% Other religion and less than 0.1% each for Animist and those with No religion respectively.
Note: * Less than 0.1 per cent.
12
(C) Education
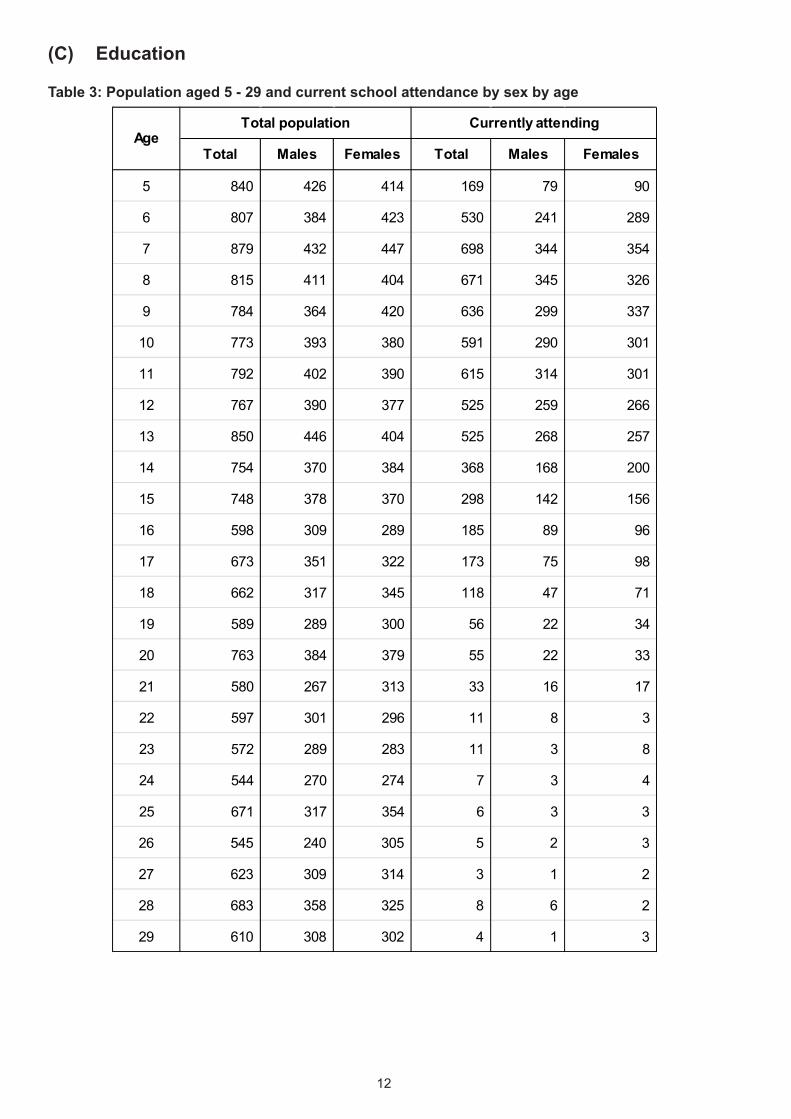
Table 3: Population aged 5 - 29 and current school attendance by sex by age
Total Males Females Total Males Females
5 840 426 414 169 79 90
6 807 384 423 530 241 289
7 879 432 447 698 344 354
8 815 411 404 671 345 326
9 784 364 420 636 299 337
10 773 393 380 591 290 301
11 792 402 390 615 314 301
12 767 390 377 525 259 266
13 850 446 404 525 268 257
14 754 370 384 368 168 200
15 748 378 370 298 142 156
16 598 309 289 185 89 96
17 673 351 322 173 75 98
18 662 317 345 118 47 71
19 589 289 300 56 22 34
20 763 384 379 55 22 33
21 580 267 313 33 16 17
22 597 301 296 11 8 3
23 572 289 283 11 3 8
24 544 270 274 7 3 4
25 671 317 354 6 3 3
26 545 240 305 5 2 3
27 623 309 314 3 1 2
28 683 358 325 8 6 2
29 610 308 302 4 1 3
Total population Currently attendingAge
13
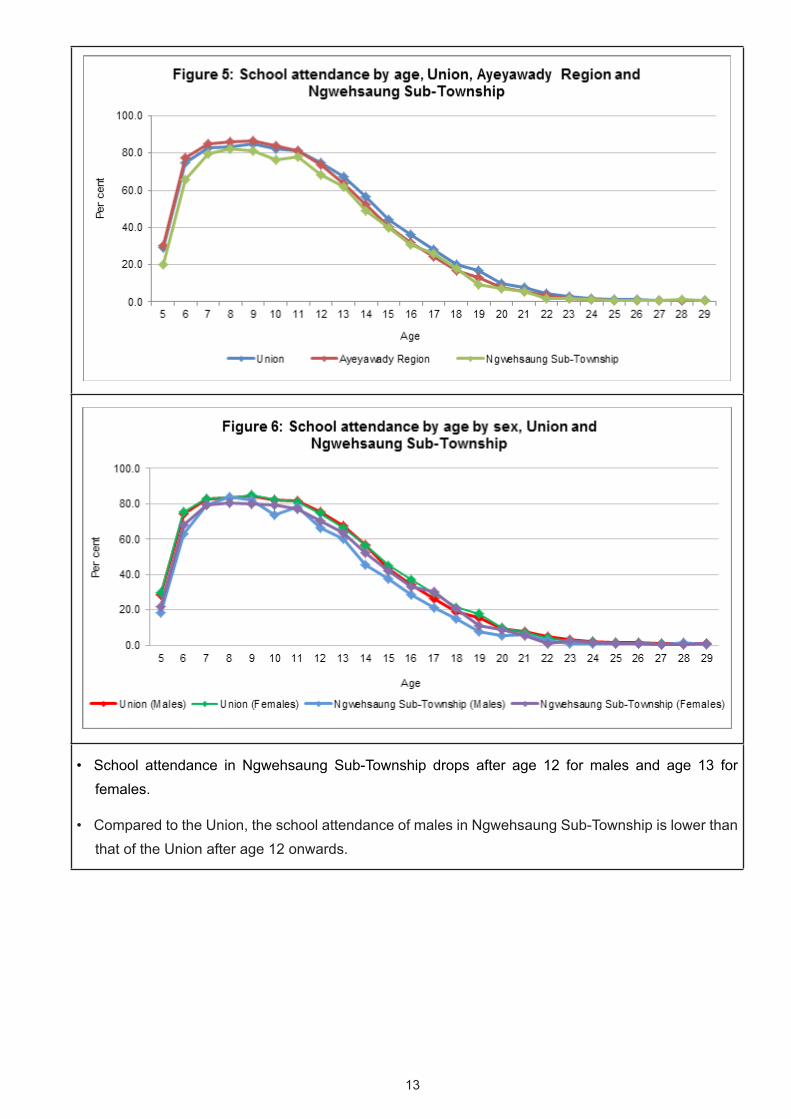
• School attendance in Ngwehsaung Sub-Township drops after age 12 for males and age 13 for females.
• Compared to the Union, the school attendance of males in Ngwehsaung Sub-Township is lower than that of the Union after age 12 onwards.
14
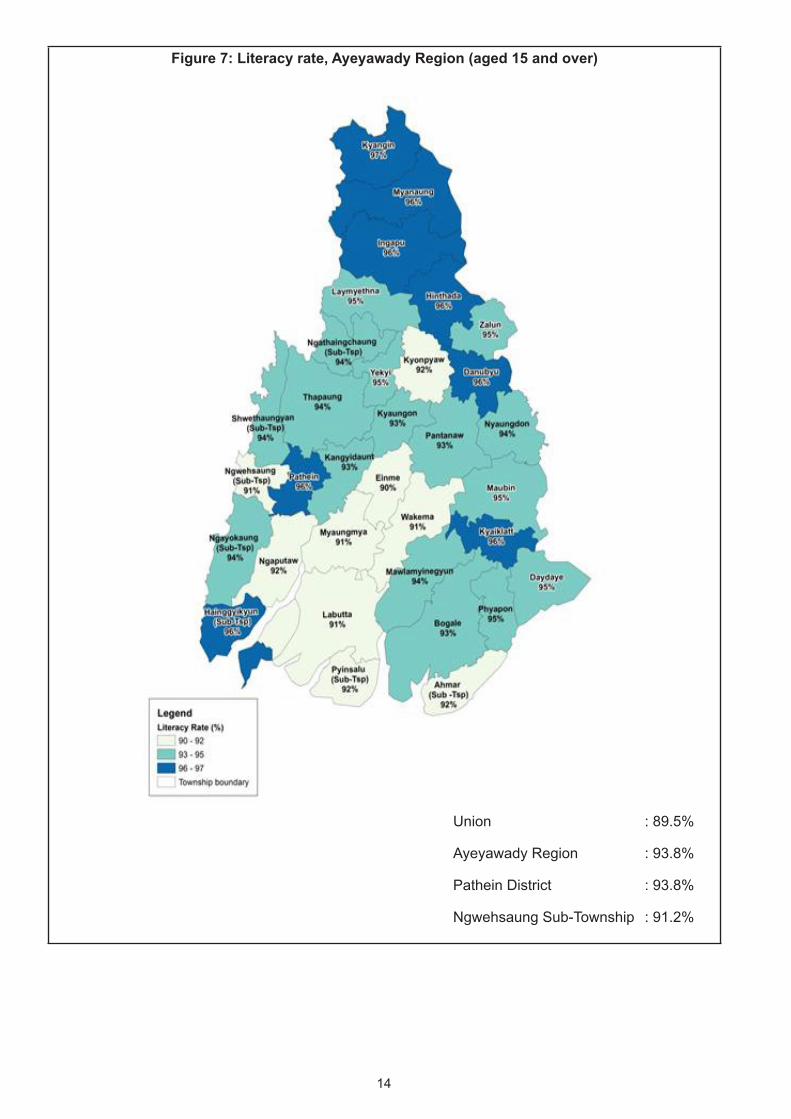
Figure 7: Literacy rate, Ayeyawady Region (aged 15 and over)
Union : 89.5%
Ayeyawady Region : 93.8%
Pathein District : 93.8%
Ngwehsaung Sub-Township : 91.2%

15
Table 4: Youth literacy rate (15 - 24), Ngwehsaung Sub-Township
• The literacy rate of those aged 15 and over in Ngwehsaung Sub-Township is 91.2 per cent. It is slightly lower than the literacy rate of Ayeyawady Region (93.8%) but higher than the Union (89.5%). Female literacy rate is 89.7 per cent and for the males it is 92.6 per cent.
• The literacy rate for youth aged 15-24 is 94.3 per cent with 94.3 per cent for females and males respectively.
Table 5: Population aged 25 and over by highest level of education completed, urban/rural and sex
• Some 13.9 per cent of the population aged 25 and over have never been to school.
• Of the rural population aged 25 and over, some 15.6 per cent have never been to school.
• There are 12.3 per cent of males aged 25 and over who have never attended school as against 15.6 per cent for females.
• Among those aged 25 and over, 16.8 per cent has completed primary school (grade 5) and only 8.5 per cent has completed university/college education.
SexTotal
Population(15 - 24)
Literacy Rate(15 - 24)
Total 6,326 94.3
Males 3,155 94.3
Females 3,171 94.3
(grade 1 - 4) (grade 5)
Total 23,733 3,304 13.9 8,245 3,978 4,023 1,832 35 2,016 90 12 198
Urban 8,332 906 10.9 1,975 1,123 1,657 962 21 1,525 79 4 80
Rural 15,401 2,398 15.6 6,270 2,855 2,366 870 14 491 11 8 118
Males 12,153 1,492 12.3 3,881 2,059 2,475 1,021 28 1,042 37 9 109
Females 11,580 1,812 15.6 4,364 1,919 1,548 811 7 974 53 3 89
OtherTotal None % Never attended
Primary school Middle school (grade 6 - 9)
High school (grade 10 - 11)
Diploma University/ College
Post-graduate and
above
Vocational training
16
(D) Economic Characteristics
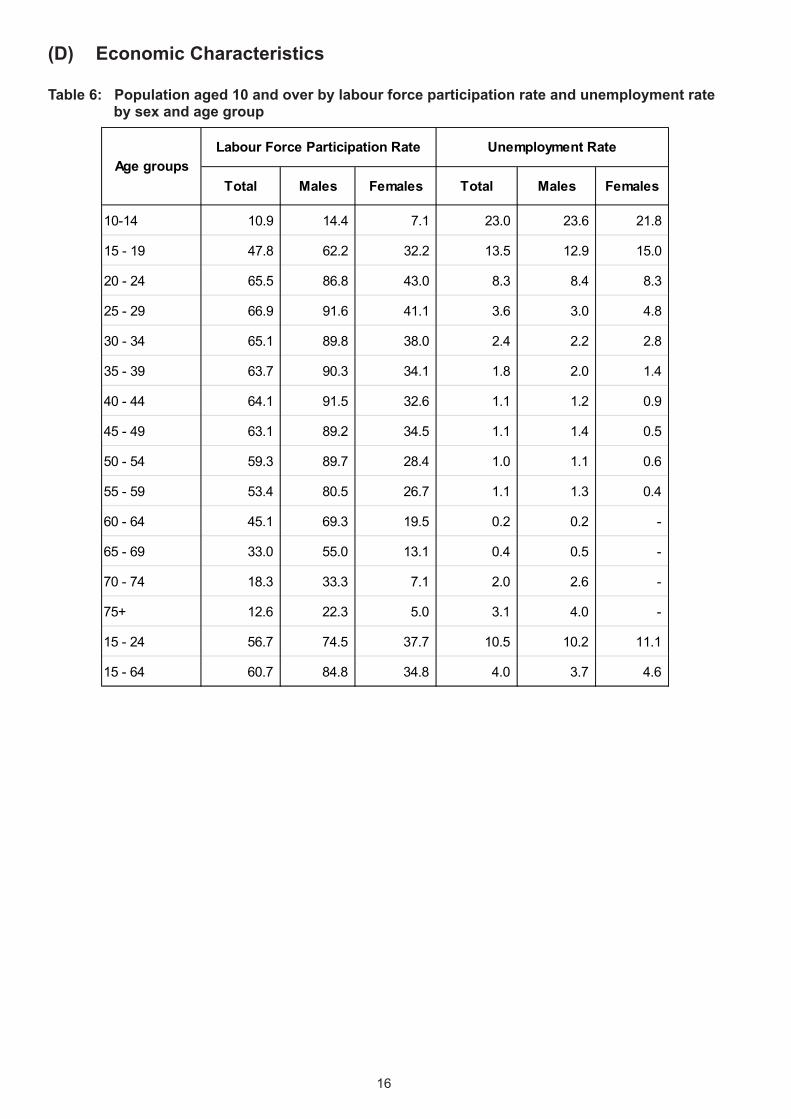
Table 6: Population aged 10 and over by labour force participation rate and unemployment rate by sex and age group
Total Males Females Total Males Females
10-14 10.9 14.4 7.1 23.0 23.6 21.8
15 - 19 47.8 62.2 32.2 13.5 12.9 15.0
20 - 24 65.5 86.8 43.0 8.3 8.4 8.3
25 - 29 66.9 91.6 41.1 3.6 3.0 4.8
30 - 34 65.1 89.8 38.0 2.4 2.2 2.8
35 - 39 63.7 90.3 34.1 1.8 2.0 1.4
40 - 44 64.1 91.5 32.6 1.1 1.2 0.9
45 - 49 63.1 89.2 34.5 1.1 1.4 0.5
50 - 54 59.3 89.7 28.4 1.0 1.1 0.6
55 - 59 53.4 80.5 26.7 1.1 1.3 0.4
60 - 64 45.1 69.3 19.5 0.2 0.2 -
65 - 69 33.0 55.0 13.1 0.4 0.5 -
70 - 74 18.3 33.3 7.1 2.0 2.6 -
75+ 12.6 22.3 5.0 3.1 4.0 -
15 - 24 56.7 74.5 37.7 10.5 10.2 11.1
15 - 64 60.7 84.8 34.8 4.0 3.7 4.6
Age groupsLabour Force Participation Rate Unemployment Rate

17
• Labour force participation rate for the population aged 15-64 in Ngwehsaung Sub-Township is 60.7 per cent.
• The labour force participation rate of females is 34.8 per cent and is much lower than that of their male counterparts which is 84.8 per cent.
• In Ngwehsaung Sub-Township, labour force participation rate for the population aged 10-14 is 10.9 per cent.
• The unemployment rate for those aged 15-64 in Ngwehsaung Sub-Township is 4.0 per cent. There is much difference between the unemployment rate for males (3.7%) and for females (4.6%).
• The unemployment rate for young females aged 15-24 is 11.1 per cent.
Table 7: Population aged 10 and over not in the labour force by usual activity status and sex
• Among those aged 10 and over who are not in the labour force, 42.1 per cent of males are full time students while 67.8 per cent of females are household workers.
Total Did not seek work
Full time student
Household worker
Pensioner, retired, elderly Ill, disabled Other
Total 16,901 1.0 24.4 50.2 8.7 1.8 13.8
Males 4,715 2.7 42.1 4.9 13.0 3.4 34.0
Females 12,186 0.4 17.6 67.8 7.0 1.2 6.0
SexUsual activity status

18
Table 8: Employed persons aged 15 - 64 by occupation by sex
Total Males Females Total Males Females
Total 13,611 10,109 3,502 100.0 100.0 100.0
Managers 35 21 14 0.3 0.2 0.4
Professionals 172 53 119 1.3 0.5 3.4
Technicians and Associate Professionals 158 111 47 1.2 1.1 1.3
Clerical Support Workers 679 431 248 5.0 4.3 7.1
Services and Sales Workers 1,803 892 911 13.2 8.8 26.0
Skilled Agricultural, Forestry and Fishery Workers 6,089 4,909 1,180 44.7 48.6 33.7
Craft and Related Trades Workers 1,269 1,026 243 9.3 10.1 6.9
Plant and Machine Operators and Assemblers 507 503 4 3.7 5.0 0.1
Elementary Occupations 2,427 1,953 474 17.8 19.3 13.5
Others - - - - - -
Not stated 472 210 262 3.5 2.1 7.5
Employed persons Per centOccupation

19
• In Ngwehsaung Sub-Township, 44.7 per cent of the employed persons aged 15-64 are skilled agricultural, forestry and fishery workers and is the highest proportion, followed by 17.8 per cent in elementary occupations.
• Analysis by sex shows that 48.6 per cent of males and 33.7 per cent of females are skilled agricultural, forestry and fishery workers.
• In Ayeyawady Region, 47.5 per cent are skilled agricultural, forestry and fishery workers and 23.6 per cent are in elementary occupations.
20
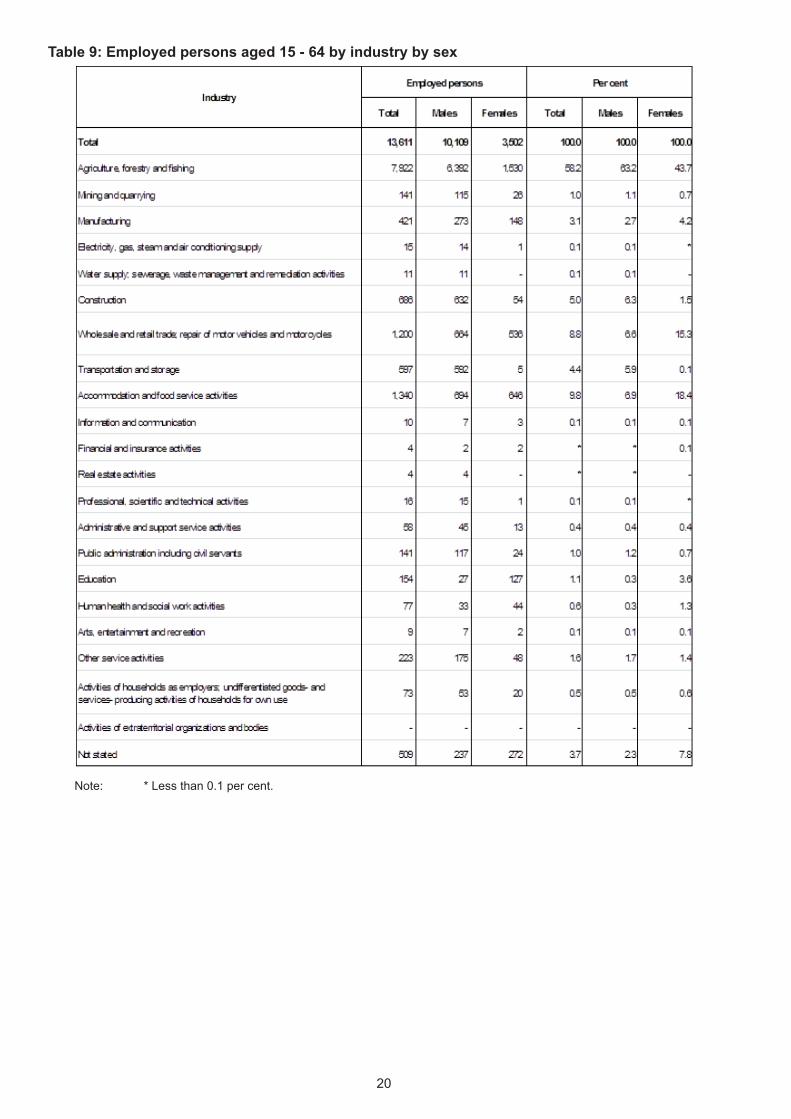
Table 9: Employed persons aged 15 - 64 by industry by sex
Note: * Less than 0.1 per cent.

21
• In Ngwehsaung Sub-Township, the proportion of employed persons working in the industry of “Agriculture, forestry and fishing” is the highest with 58.2 per cent.
• The second highest industry is “Accommodation and food service activities” at 9.8 per cent.
• There are 63.2 per cent of males and 43.7 per cent of females working in “Agriculture, forestry and fishing” industry.
• In Ayeyawady Region, there are 64.7 per cent of employed population working in “Agriculture, forestry and fishing” industry and 3.9 per cent in “Accommodation and food service activities” industry.
22
(E) Identity Cards
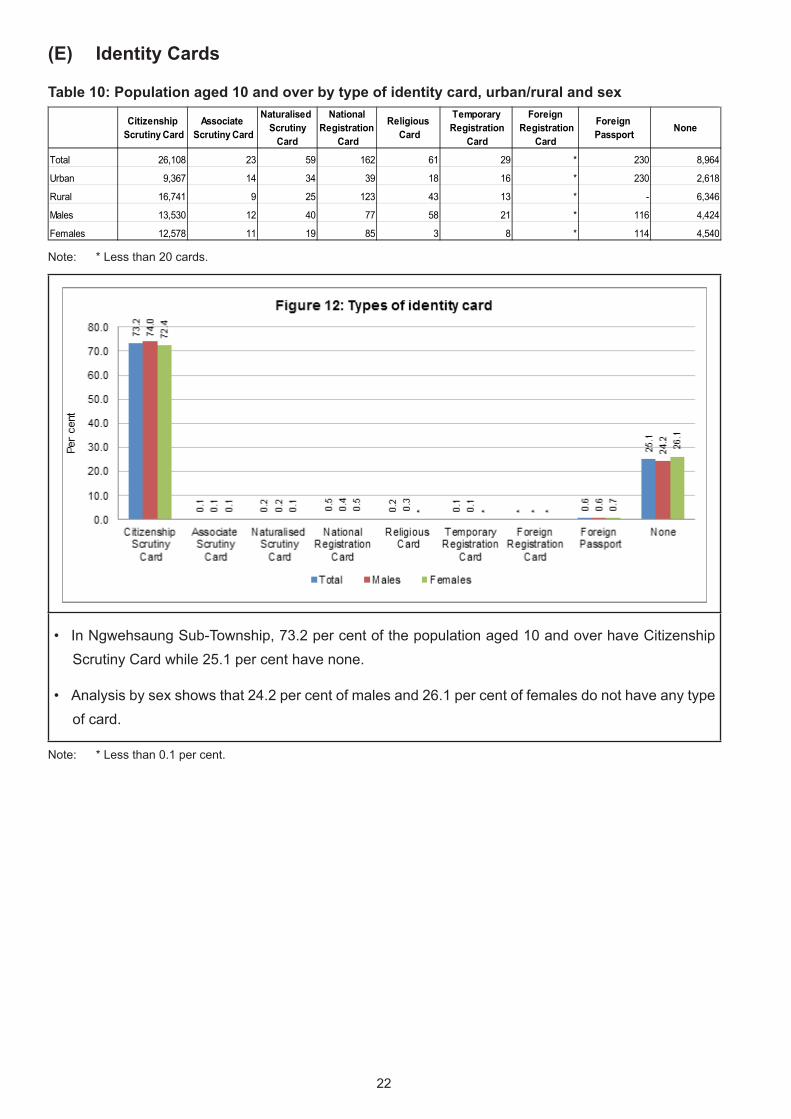
Table 10: Population aged 10 and over by type of identity card, urban/rural and sex
Note: * Less than 20 cards.
• In Ngwehsaung Sub-Township, 73.2 per cent of the population aged 10 and over have Citizenship Scrutiny Card while 25.1 per cent have none.
• Analysis by sex shows that 24.2 per cent of males and 26.1 per cent of females do not have any type of card.
Note: * Less than 0.1 per cent.
Citizenship Scrutiny Card
Associate Scrutiny Card
Naturalised Scrutiny
Card
NationalRegistration
Card
Religious Card
Temporary Registration
Card
Foreign Registration
Card
Foreign Passport None
Total 26,108 23 59 162 61 29 * 230 8,964
Urban 9,367 14 34 39 18 16 * 230 2,618
Rural 16,741 9 25 123 43 13 * - 6,346
Males 13,530 12 40 77 58 21 * 116 4,424
Females 12,578 11 19 85 3 8 * 114 4,540
23
(F) Disability
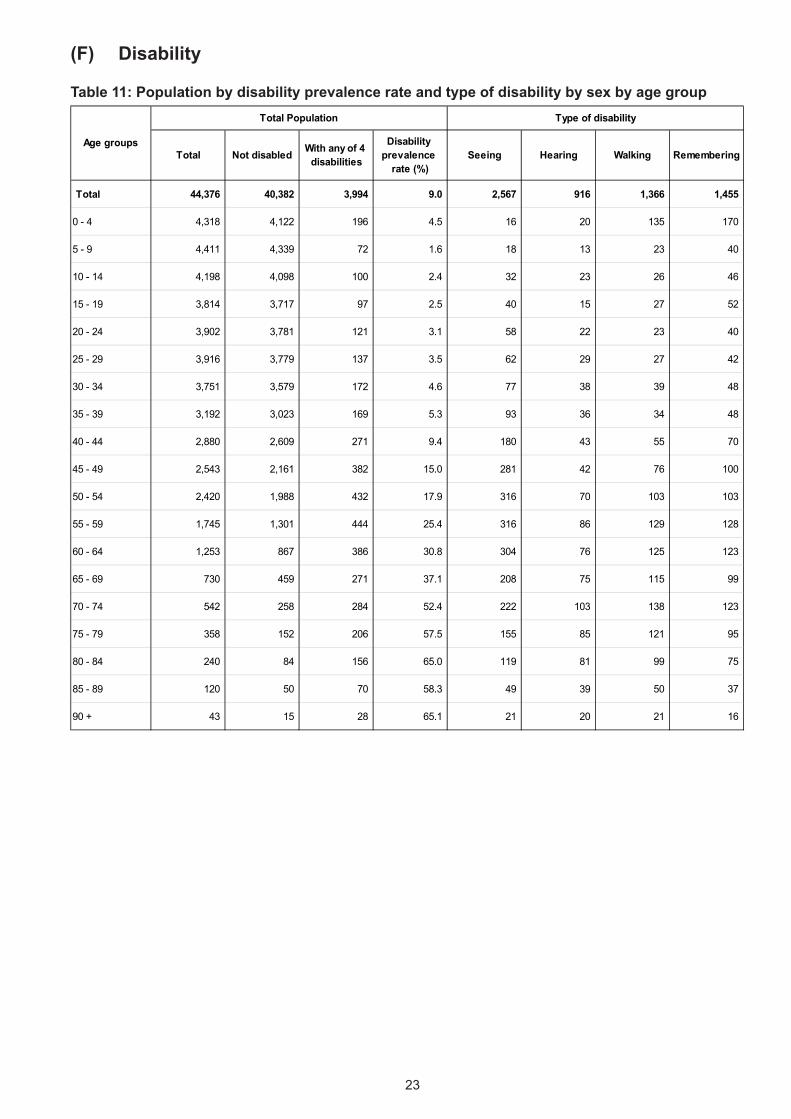
Table 11: Population by disability prevalence rate and type of disability by sex by age group
Total Not disabled With any of 4 disabilities
Disability prevalence
rate (%)Seeing Hearing Walking Remembering
Total 44,376 40,382 3,994 9.0 2,567 916 1,366 1,455
0 - 4 4,318 4,122 196 4.5 16 20 135 170
5 - 9 4,411 4,339 72 1.6 18 13 23 40
10 - 14 4,198 4,098 100 2.4 32 23 26 46
15 - 19 3,814 3,717 97 2.5 40 15 27 52
20 - 24 3,902 3,781 121 3.1 58 22 23 40
25 - 29 3,916 3,779 137 3.5 62 29 27 42
30 - 34 3,751 3,579 172 4.6 77 38 39 48
35 - 39 3,192 3,023 169 5.3 93 36 34 48
40 - 44 2,880 2,609 271 9.4 180 43 55 70
45 - 49 2,543 2,161 382 15.0 281 42 76 100
50 - 54 2,420 1,988 432 17.9 316 70 103 103
55 - 59 1,745 1,301 444 25.4 316 86 129 128
60 - 64 1,253 867 386 30.8 304 76 125 123
65 - 69 730 459 271 37.1 208 75 115 99
70 - 74 542 258 284 52.4 222 103 138 123
75 - 79 358 152 206 57.5 155 85 121 95
80 - 84 240 84 156 65.0 119 81 99 75
85 - 89 120 50 70 58.3 49 39 50 37
90 + 43 15 28 65.1 21 20 21 16
Age groups
Total Population Type of disability
24
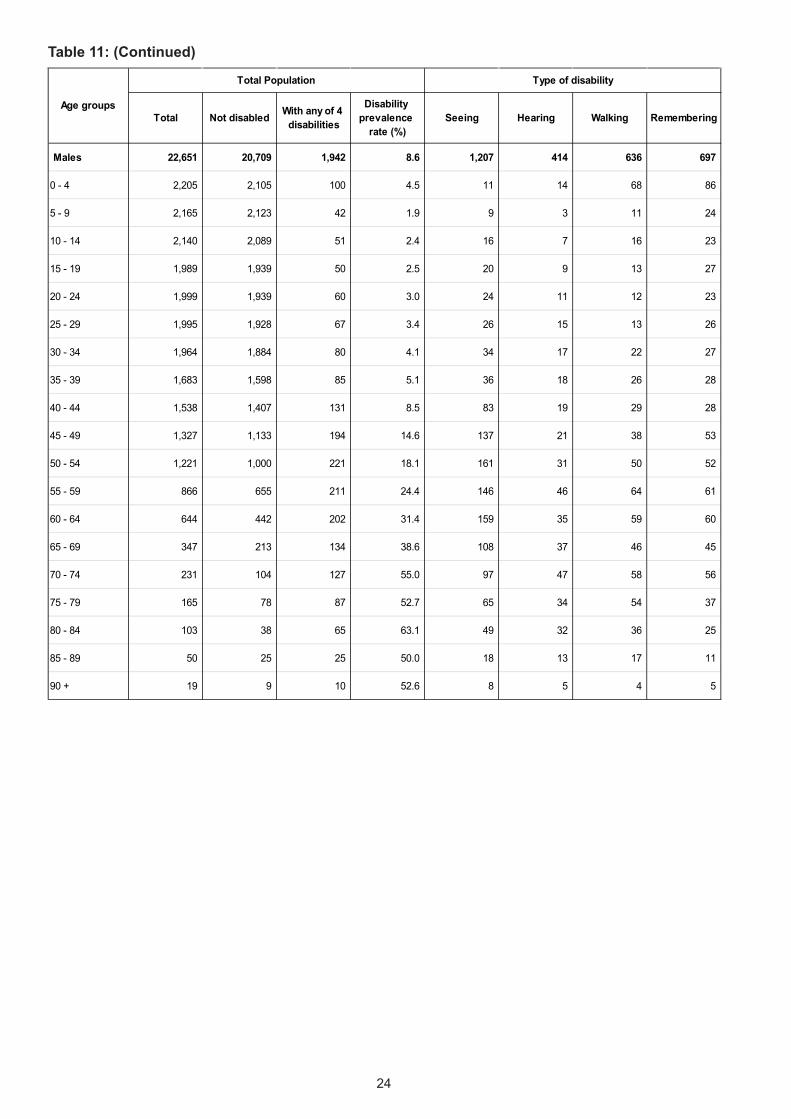
Table 11: (Continued)
Total Not disabled With any of 4 disabilities
Disability prevalence
rate (%)Seeing Hearing Walking Remembering
Males 22,651 20,709 1,942 8.6 1,207 414 636 697
0 - 4 2,205 2,105 100 4.5 11 14 68 86
5 - 9 2,165 2,123 42 1.9 9 3 11 24
10 - 14 2,140 2,089 51 2.4 16 7 16 23
15 - 19 1,989 1,939 50 2.5 20 9 13 27
20 - 24 1,999 1,939 60 3.0 24 11 12 23
25 - 29 1,995 1,928 67 3.4 26 15 13 26
30 - 34 1,964 1,884 80 4.1 34 17 22 27
35 - 39 1,683 1,598 85 5.1 36 18 26 28
40 - 44 1,538 1,407 131 8.5 83 19 29 28
45 - 49 1,327 1,133 194 14.6 137 21 38 53
50 - 54 1,221 1,000 221 18.1 161 31 50 52
55 - 59 866 655 211 24.4 146 46 64 61
60 - 64 644 442 202 31.4 159 35 59 60
65 - 69 347 213 134 38.6 108 37 46 45
70 - 74 231 104 127 55.0 97 47 58 56
75 - 79 165 78 87 52.7 65 34 54 37
80 - 84 103 38 65 63.1 49 32 36 25
85 - 89 50 25 25 50.0 18 13 17 11
90 + 19 9 10 52.6 8 5 4 5
Age groups
Total Population Type of disability
25
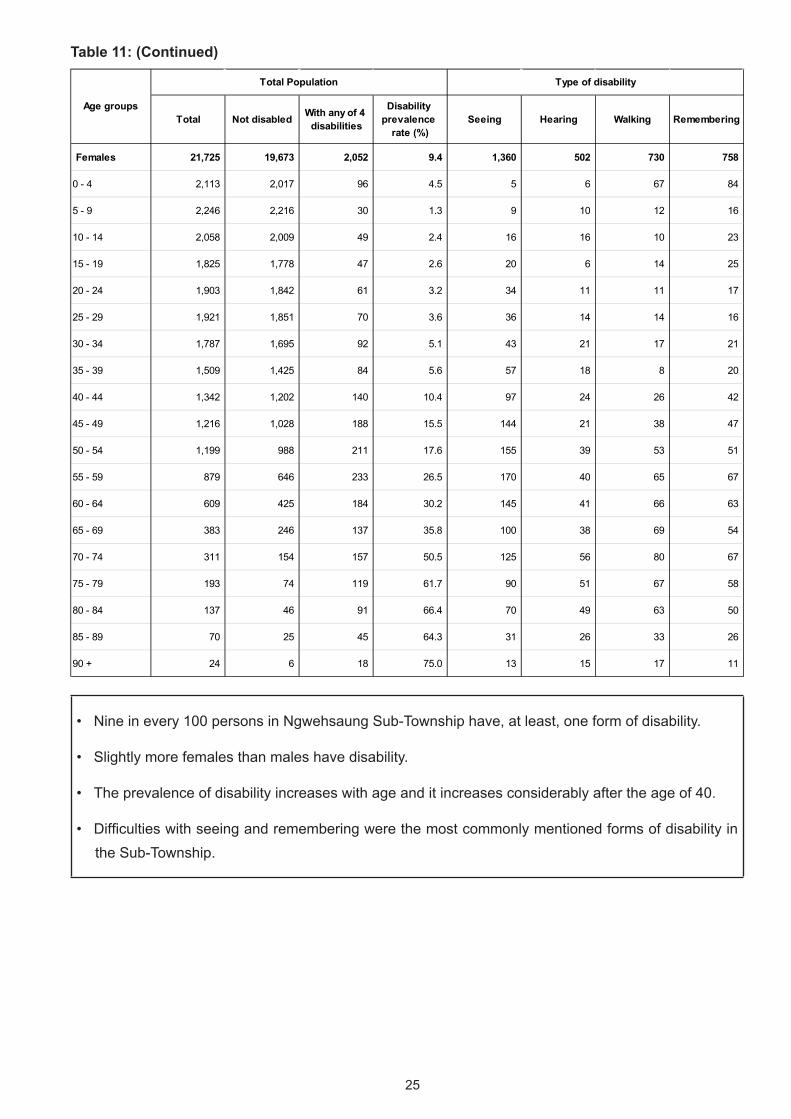
Table 11: (Continued)
• Nine in every 100 persons in Ngwehsaung Sub-Township have, at least, one form of disability.
• Slightly more females than males have disability.
• The prevalence of disability increases with age and it increases considerably after the age of 40.
• Difficulties with seeing and remembering were the most commonly mentioned forms of disability in the Sub-Township.
Total Not disabled With any of 4 disabilities
Disability prevalence
rate (%)Seeing Hearing Walking Remembering
Females 21,725 19,673 2,052 9.4 1,360 502 730 758
0 - 4 2,113 2,017 96 4.5 5 6 67 84
5 - 9 2,246 2,216 30 1.3 9 10 12 16
10 - 14 2,058 2,009 49 2.4 16 16 10 23
15 - 19 1,825 1,778 47 2.6 20 6 14 25
20 - 24 1,903 1,842 61 3.2 34 11 11 17
25 - 29 1,921 1,851 70 3.6 36 14 14 16
30 - 34 1,787 1,695 92 5.1 43 21 17 21
35 - 39 1,509 1,425 84 5.6 57 18 8 20
40 - 44 1,342 1,202 140 10.4 97 24 26 42
45 - 49 1,216 1,028 188 15.5 144 21 38 47
50 - 54 1,199 988 211 17.6 155 39 53 51
55 - 59 879 646 233 26.5 170 40 65 67
60 - 64 609 425 184 30.2 145 41 66 63
65 - 69 383 246 137 35.8 100 38 69 54
70 - 74 311 154 157 50.5 125 56 80 67
75 - 79 193 74 119 61.7 90 51 67 58
80 - 84 137 46 91 66.4 70 49 63 50
85 - 89 70 25 45 64.3 31 26 33 26
90 + 24 6 18 75.0 13 15 17 11
Age groups
Total Population Type of disability
26
(G) Housing Conditions and Household Amenities
Type of housing unit
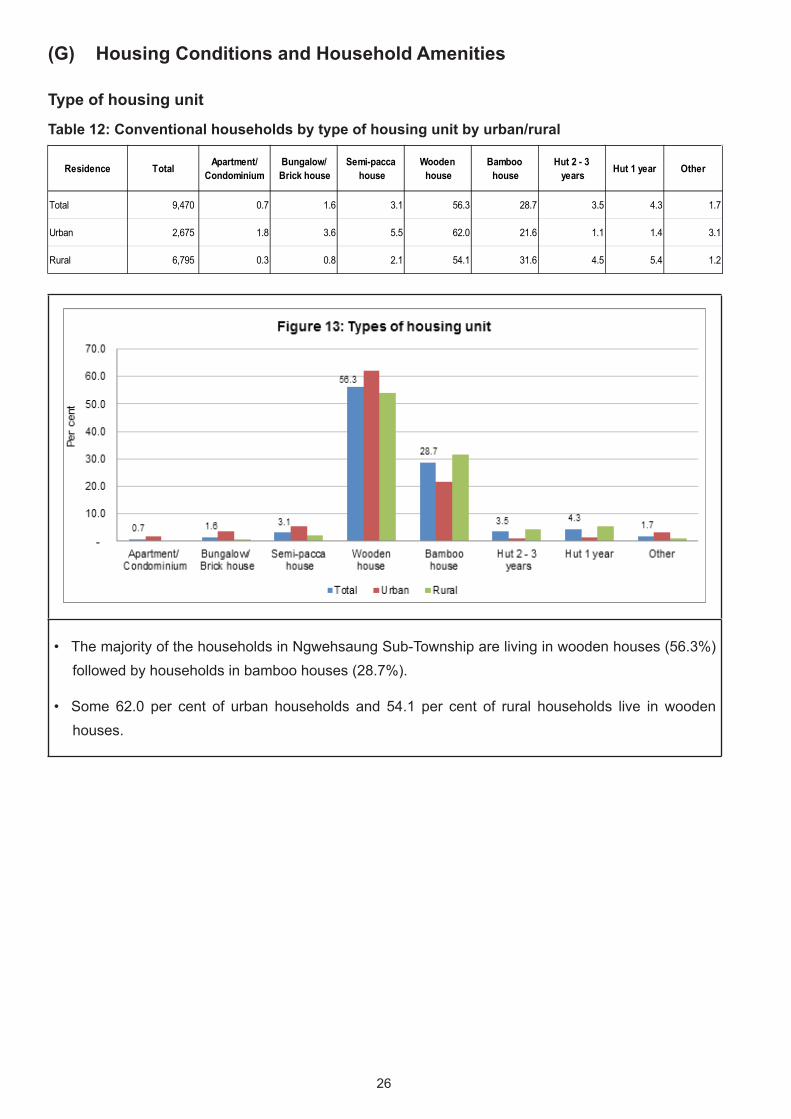
Table 12: Conventional households by type of housing unit by urban/rural
• The majority of the households in Ngwehsaung Sub-Township are living in wooden houses (56.3%) followed by households in bamboo houses (28.7%).
• Some 62.0 per cent of urban households and 54.1 per cent of rural households live in wooden houses.
Residence Total Apartment/Condominium
Bungalow/ Brick house
Semi-pacca house
Wooden house
Bamboo house
Hut 2 - 3 years Hut 1 year Other
Total 9,470 0.7 1.6 3.1 56.3 28.7 3.5 4.3 1.7
Urban 2,675 1.8 3.6 5.5 62.0 21.6 1.1 1.4 3.1
Rural 6,795 0.3 0.8 2.1 54.1 31.6 4.5 5.4 1.2

27
Type of toilet
Figure 14: Proportion of households with access to improved sanitation
v
Union : 74.3%
Ayeyawady Region : 74.9%
Pathein District : 76.0%
Ngwehsaung Sub-Township : 71.7%
28
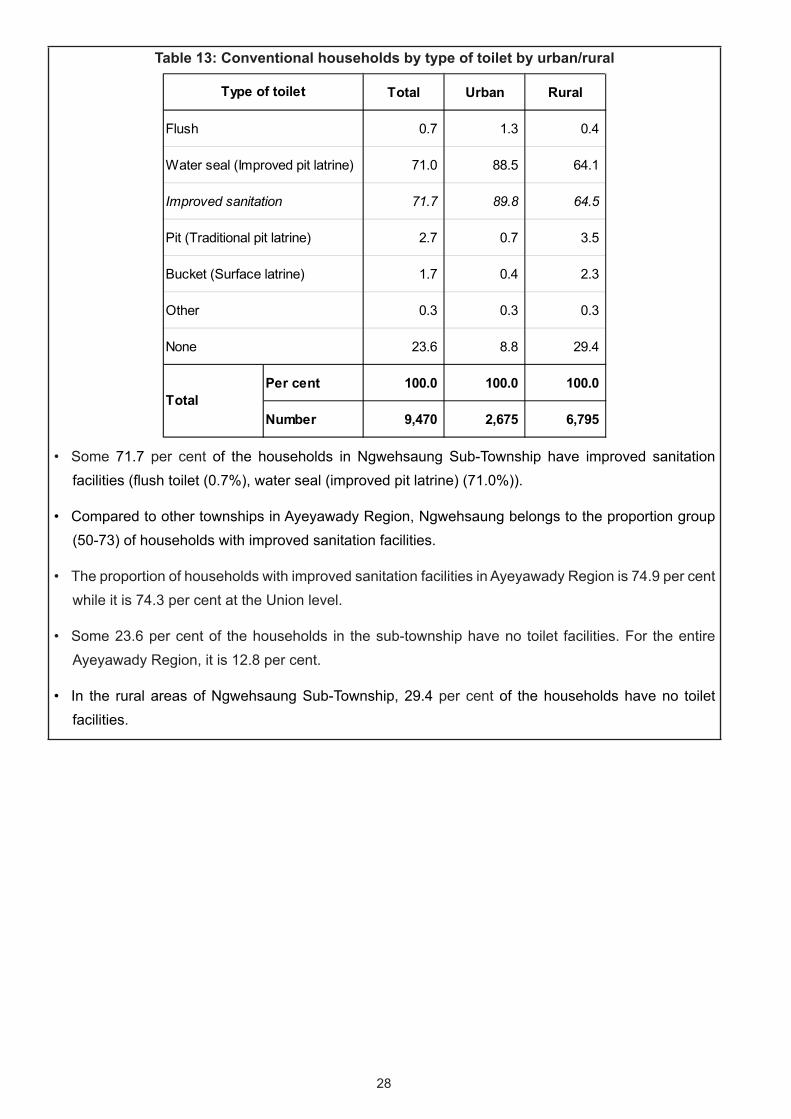
Table 13: Conventional households by type of toilet by urban/rural
• Some 71.7 per cent of the households in Ngwehsaung Sub-Township have improved sanitation facilities (flush toilet (0.7%), water seal (improved pit latrine) (71.0%)).
• Compared to other townships in Ayeyawady Region, Ngwehsaung belongs to the proportion group (50-73) of households with improved sanitation facilities.
• The proportion of households with improved sanitation facilities in Ayeyawady Region is 74.9 per cent while it is 74.3 per cent at the Union level.
• Some 23.6 per cent of the households in the sub-township have no toilet facilities. For the entire Ayeyawady Region, it is 12.8 per cent.
• In the rural areas of Ngwehsaung Sub-Township, 29.4 per cent of the households have no toilet facilities.
Total Urban Rural
0.7 1.3 0.4
71.0 88.5 64.1
71.7 89.8 64.5
2.7 0.7 3.5
1.7 0.4 2.3
0.3 0.3 0.3
23.6 8.8 29.4
Per cent 100.0 100.0 100.0
Number 9,470 2,675 6,795
Type of toilet
Total
Flush
Water seal (Improved pit latrine)
Improved sanitation
Pit (Traditional pit latrine)
Bucket (Surface latrine)
Other
None
29
Source of drinking water
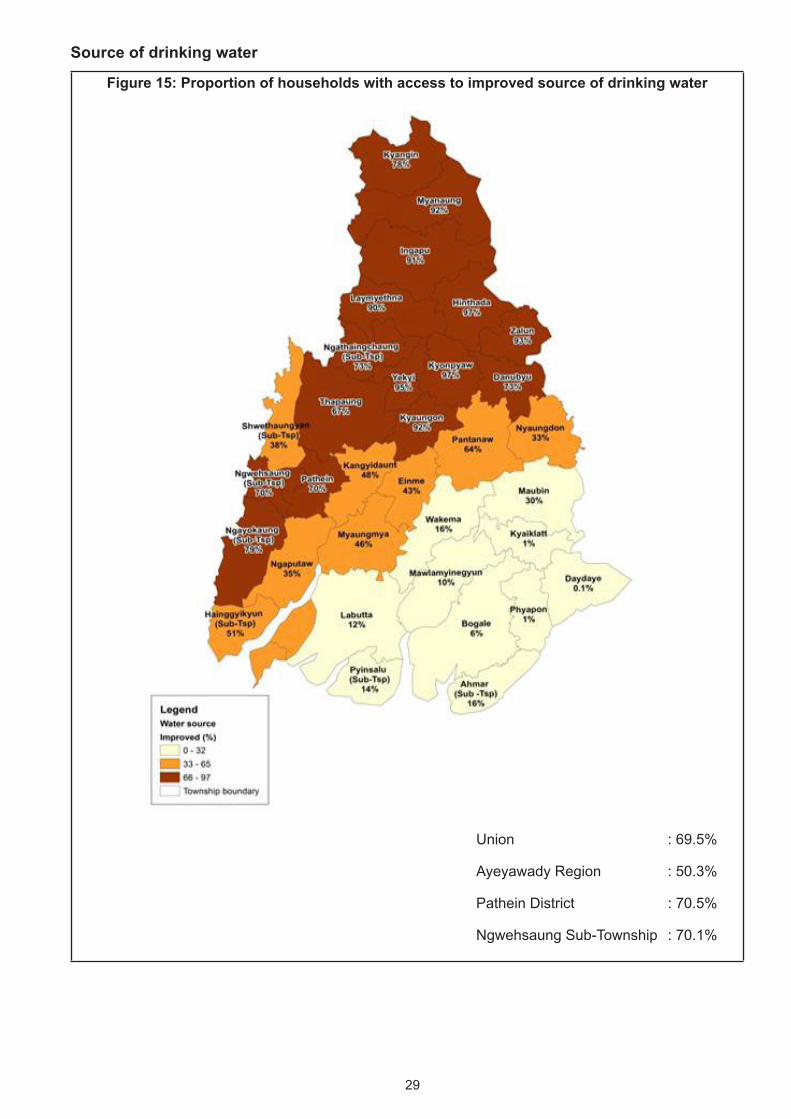
Figure 15: Proportion of households with access to improved source of drinking water
Union : 69.5%
Ayeyawady Region : 50.3%
Pathein District : 70.5%
Ngwehsaung Sub-Township : 70.1%

30
Table 14: Conventional households by source of drinking water by urban/rural
• In Ngwehsaung Sub-Township, 70.1 per cent of households use improved sources of drinking water (tap water/piped, tube well, borehole, protected well/spring and bottled water/water purifier).
• Compared to other townships in Ayeyawady Region, it is within the range of (66-97) and it is higher than the Union average (69.5%).
• Some 46.5 per cent of the households use water from protected well/spring and 20.7 per cent use water from unprotected well/spring.
• Some 29.9 per cent of the households use water from unimproved sources.
• In rural areas, 37.3 per cent of the households use water from unimproved sources for drinking water.
Note: * Less than 0.1 per cent.
Total Urban Rural
0.1 0.2 0.1
16.8 18.0 16.3
46.5 48.7 45.6
6.7 21.9 0.7
70.1 88.8 62.7
20.7 5.9 26.6
2.4 4.1 1.8
1.4 * 1.8
3.8 1.1 4.9
1.6 0.1 2.2
29.9 11.2 37.3
Per cent 100.0 100.0 100.0
Number 9,470 2,675 6,795 Total
Unprotected well/Spring
Pool/Pond/ Lake
River/stream/ canal
Waterfall/ Rain water
Other
Total unimproved drinking water
Total improved drinking water
Source of drinking water
Tap water/ Piped
Tube well, borehole
Protected well/ Spring
Bottled water/ Water purifier
31
Source of lighting
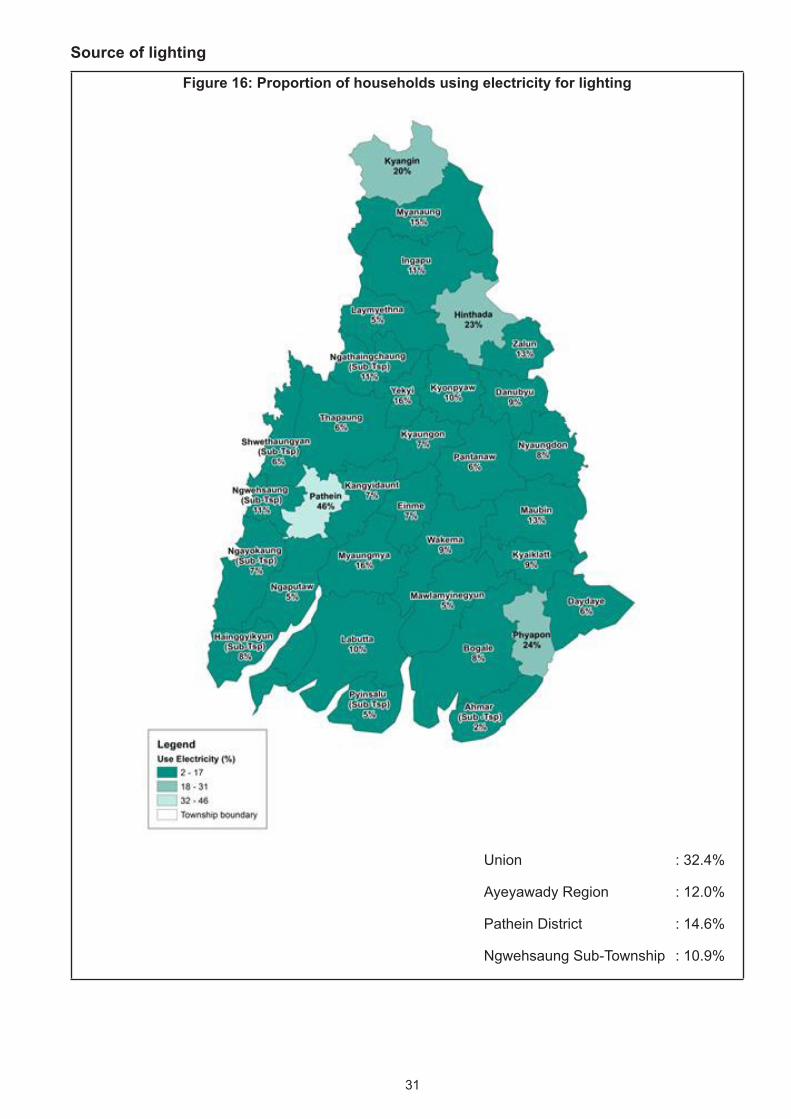
Figure 16: Proportion of households using electricity for lighting
Union : 32.4%
Ayeyawady Region : 12.0%
Pathein District : 14.6%
Ngwehsaung Sub-Township : 10.9%
32
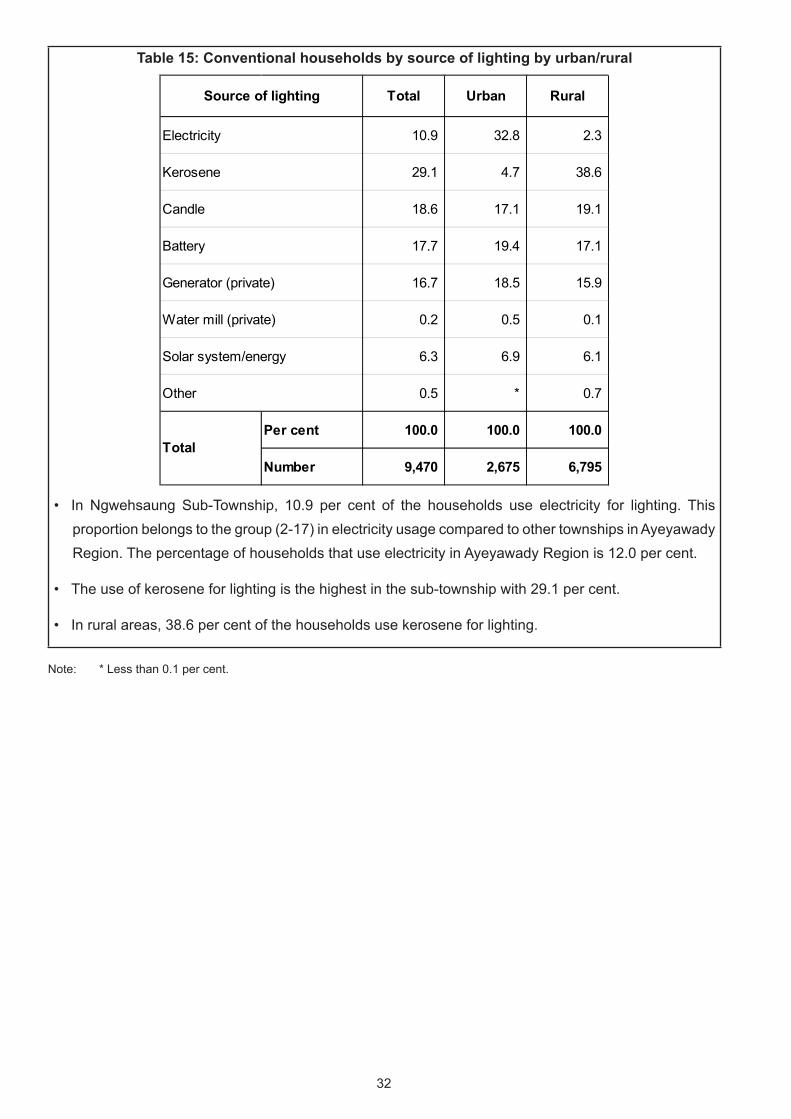
Table 15: Conventional households by source of lighting by urban/rural
• In Ngwehsaung Sub-Township, 10.9 per cent of the households use electricity for lighting. This proportion belongs to the group (2-17) in electricity usage compared to other townships in Ayeyawady Region. The percentage of households that use electricity in Ayeyawady Region is 12.0 per cent.
• The use of kerosene for lighting is the highest in the sub-township with 29.1 per cent.
• In rural areas, 38.6 per cent of the households use kerosene for lighting.
Note: * Less than 0.1 per cent.
Total Urban Rural
10.9 32.8 2.3
29.1 4.7 38.6
18.6 17.1 19.1
17.7 19.4 17.1
16.7 18.5 15.9
0.2 0.5 0.1
6.3 6.9 6.1
0.5 * 0.7
Per cent 100.0 100.0 100.0
Number 9,470 2,675 6,795
Water mill (private)
Solar system/energy
Other
Total
Generator (private)
Source of lighting
Electricity
Kerosene
Candle
Battery
33
Type of cooking fuel
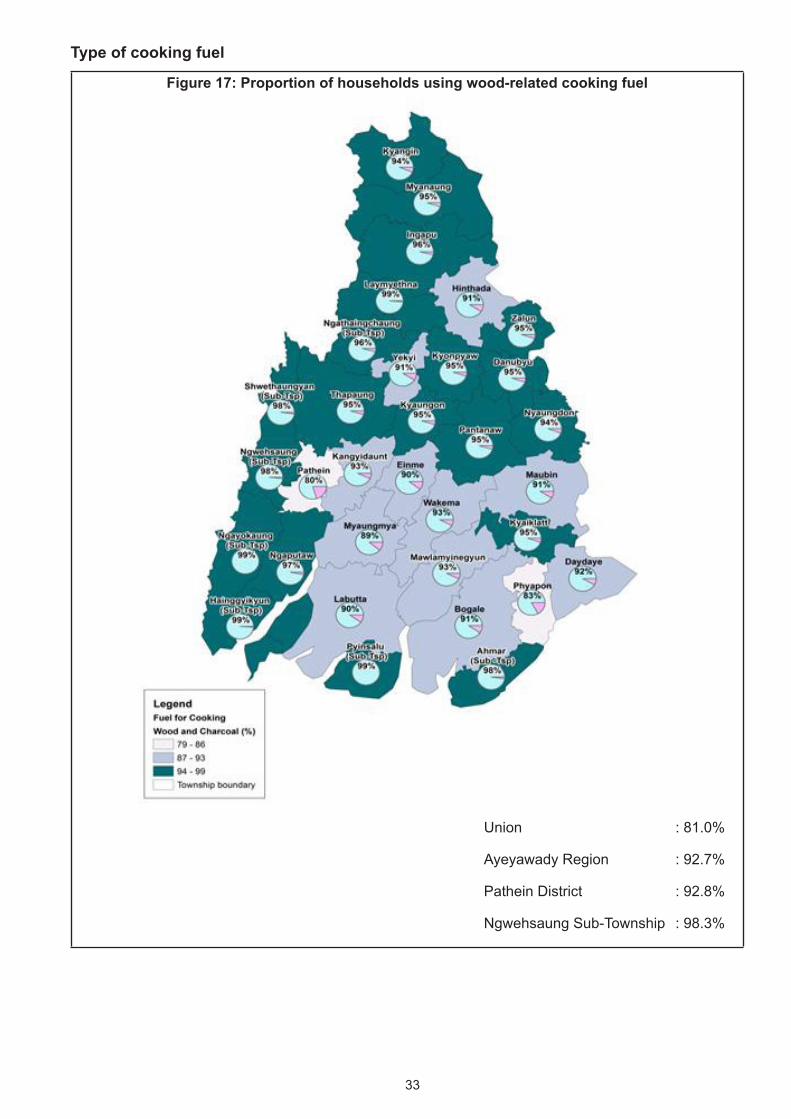
Figure 17: Proportion of households using wood-related cooking fuel
Union : 81.0%
Ayeyawady Region : 92.7%
Pathein District : 92.8%
Ngwehsaung Sub-Township : 98.3%

34
Table 16: Conventional households by type of cooking fuel by urban/rural
• In Ngwehsaung Sub-Township, households mainly use wood-related fuels for cooking with 80.7 per cent using firewood and 17.6 per cent using charcoal.
• Only 0.2 per cent of households use electricity for cooking.
• Some 86.3 per cent of households in rural areas use firewood and 12.3 per cent use charcoal.
Note: * Less than 0.1 per cent.
Total Urban Rural
0.2 0.4 0.1
* 0.1 *
0.6 0.1 0.7
0.3 0.8 0.1
80.7 66.4 86.3
17.6 31.1 12.3
0.5 0.6 0.4
0.2 0.4 0.1
Per cent 100.0 100.0 100.0
Number 9,470 2,675 6,795
Firewood
Type of cooking fuel
Electricity
LPG
Kerosene
BioGas
Charcoal
Coal
Other
Total
35
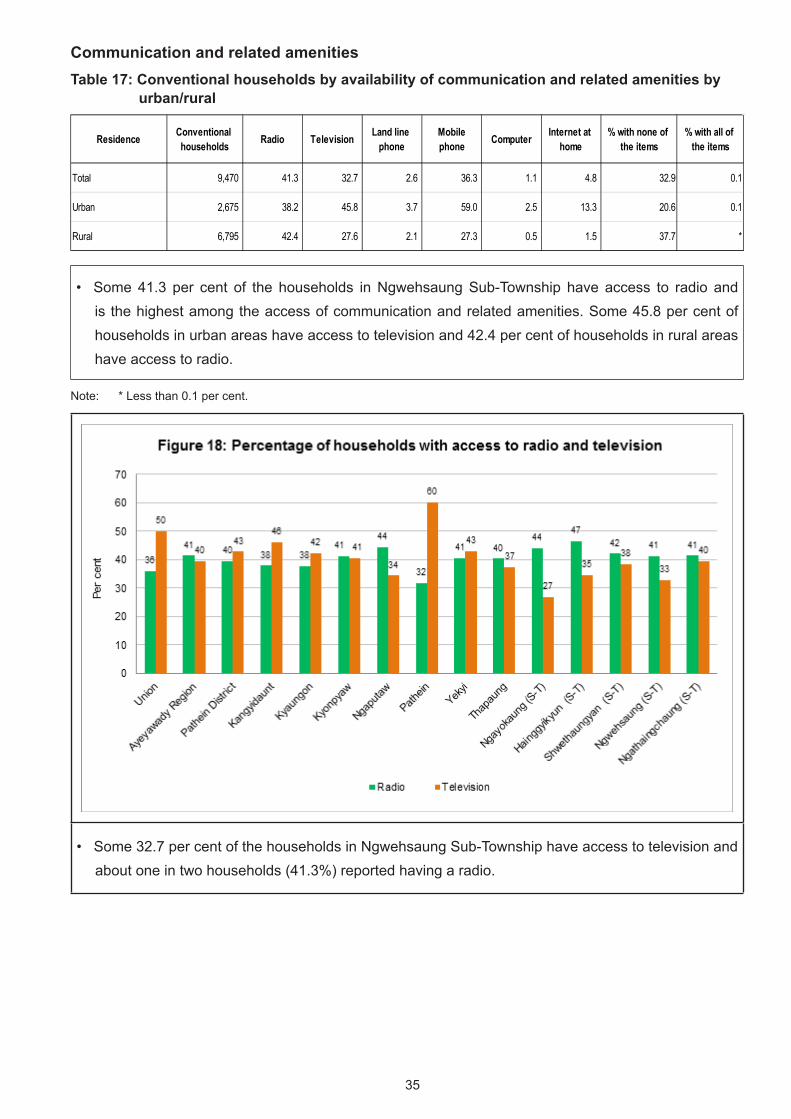
Communication and related amenities Table 17: Conventional households by availability of communication and related amenities by urban/rural
• Some 41.3 per cent of the households in Ngwehsaung Sub-Township have access to radio and is the highest among the access of communication and related amenities. Some 45.8 per cent of households in urban areas have access to television and 42.4 per cent of households in rural areas have access to radio.
Note: * Less than 0.1 per cent.
• Some 32.7 per cent of the households in Ngwehsaung Sub-Township have access to television and about one in two households (41.3%) reported having a radio.
Residence Conventional households Radio Television Land line
phoneMobilephone Computer Internet at
home% with none of
the items% with all of
the items
Total 9,470 41.3 32.7 2.6 36.3 1.1 4.8 32.9 0.1
Urban 2,675 38.2 45.8 3.7 59.0 2.5 13.3 20.6 0.1
Rural 6,795 42.4 27.6 2.1 27.3 0.5 1.5 37.7 *
36
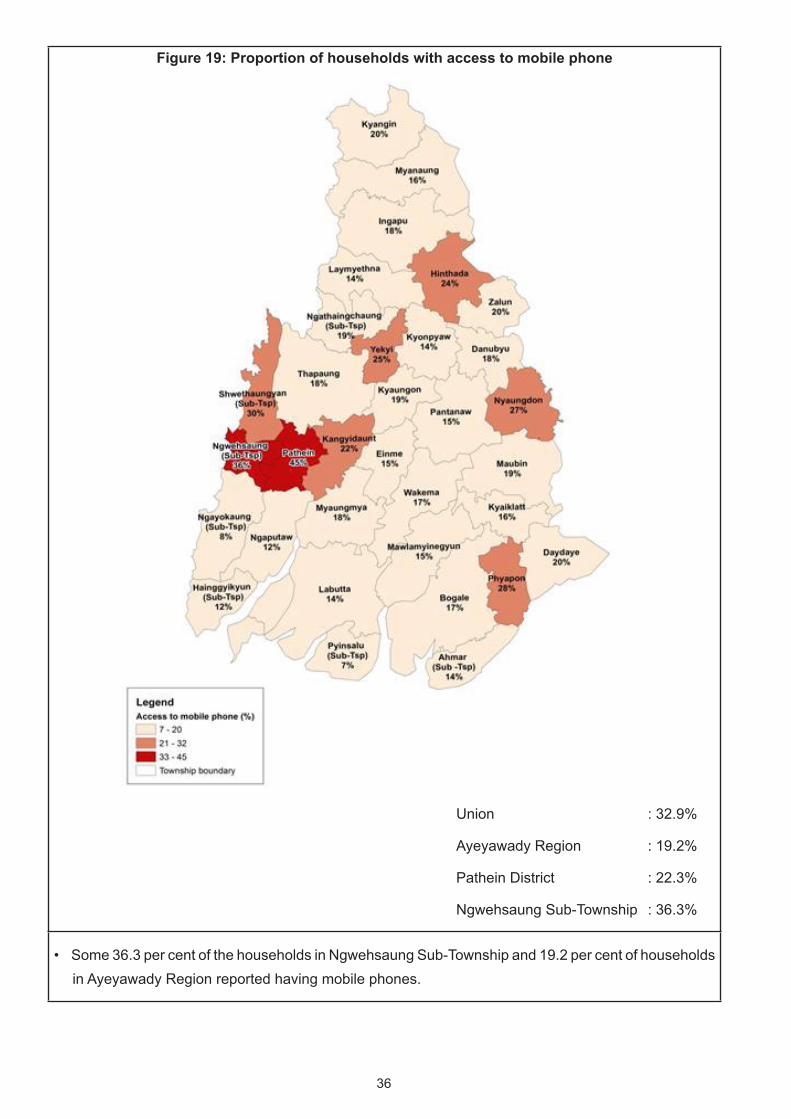
Figure 19: Proportion of households with access to mobile phone
• Some 36.3 per cent of the households in Ngwehsaung Sub-Township and 19.2 per cent of households in Ayeyawady Region reported having mobile phones.
Union : 32.9%
Ayeyawady Region : 19.2%
Pathein District : 22.3%
Ngwehsaung Sub-Township : 36.3%
37
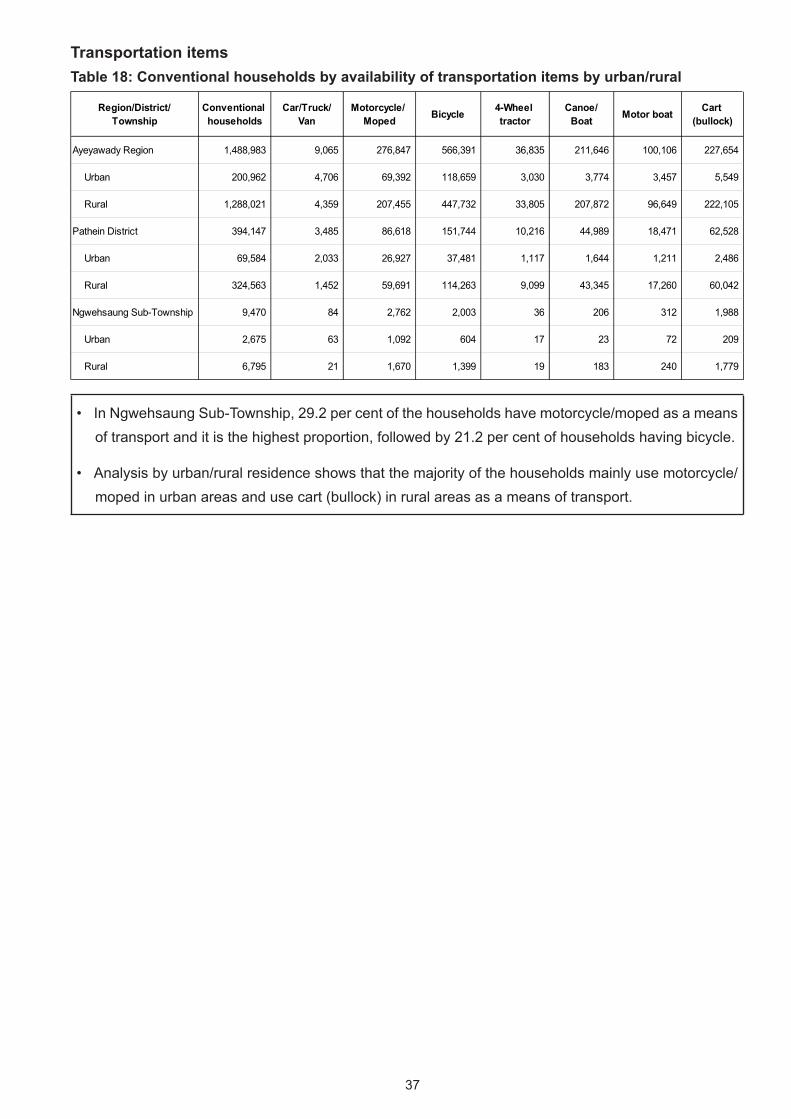
Transportation items Table 18: Conventional households by availability of transportation items by urban/rural
• In Ngwehsaung Sub-Township, 29.2 per cent of the households have motorcycle/moped as a means of transport and it is the highest proportion, followed by 21.2 per cent of households having bicycle.
• Analysis by urban/rural residence shows that the majority of the households mainly use motorcycle/moped in urban areas and use cart (bullock) in rural areas as a means of transport.
Region/District/Township
Conventional households
Car/Truck/Van
Motorcycle/ Moped Bicycle 4-Wheel
tractorCanoe/
Boat Motor boat Cart (bullock)
Ayeyawady Region 1,488,983 9,065 276,847 566,391 36,835 211,646 100,106 227,654
Urban 200,962 4,706 69,392 118,659 3,030 3,774 3,457 5,549
Rural 1,288,021 4,359 207,455 447,732 33,805 207,872 96,649 222,105
Pathein District 394,147 3,485 86,618 151,744 10,216 44,989 18,471 62,528
Urban 69,584 2,033 26,927 37,481 1,117 1,644 1,211 2,486
Rural 324,563 1,452 59,691 114,263 9,099 43,345 17,260 60,042
Ngwehsaung Sub-Township 9,470 84 2,762 2,003 36 206 312 1,988
Urban 2,675 63 1,092 604 17 23 72 209
Rural 6,795 21 1,670 1,399 19 183 240 1,779
38
(H) Fertility and Mortality
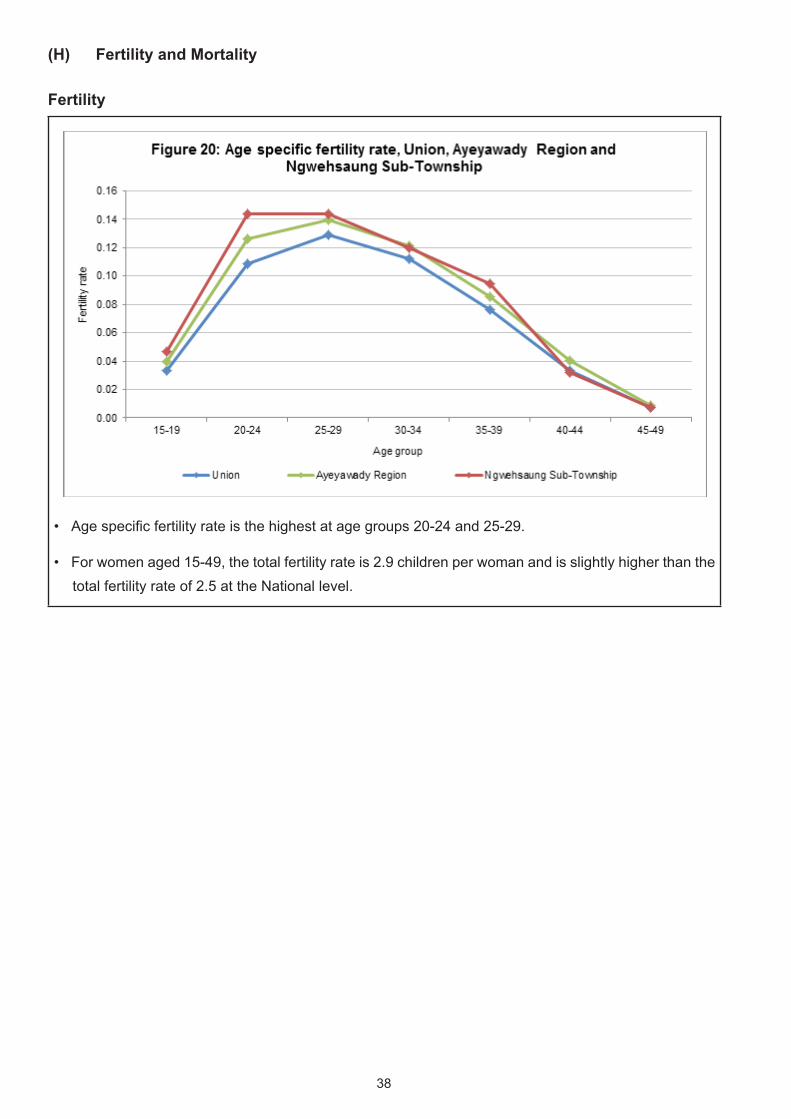
Fertility
• Age specific fertility rate is the highest at age groups 20-24 and 25-29.
• For women aged 15-49, the total fertility rate is 2.9 children per woman and is slightly higher than the total fertility rate of 2.5 at the National level.
39
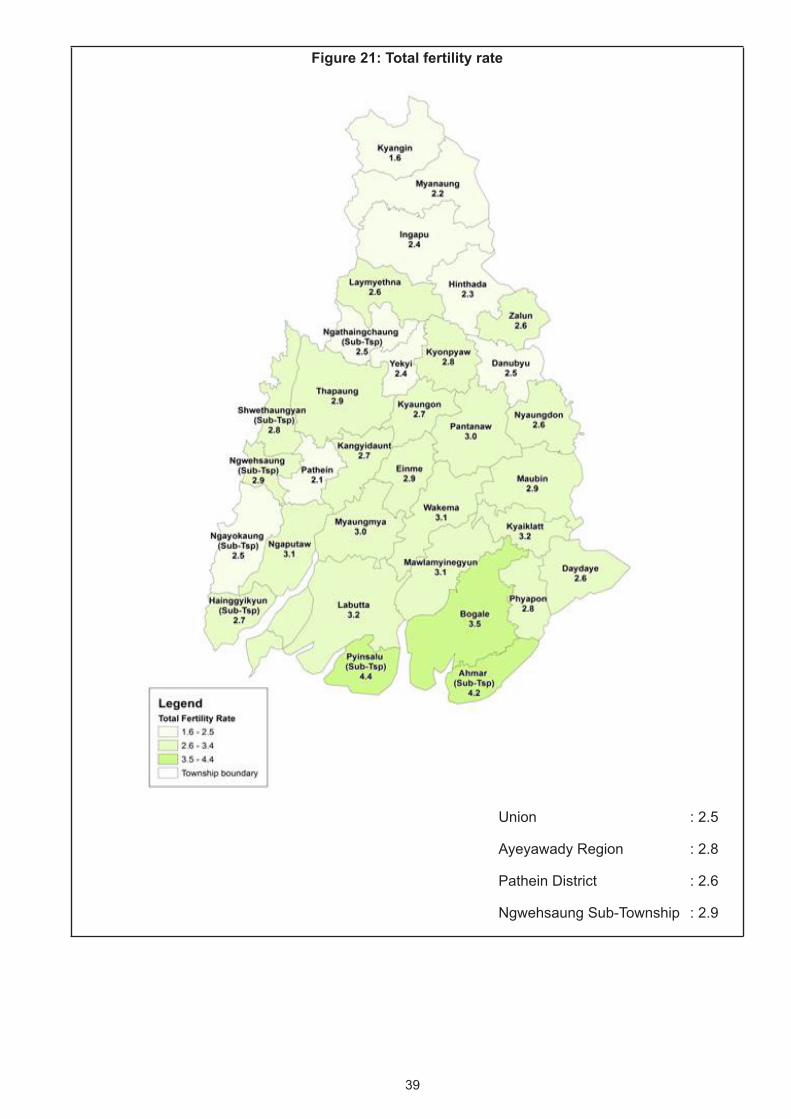
Figure 21: Total fertility rate
Union : 2.5
Ayeyawady Region : 2.8
Pathein District : 2.6
Ngwehsaung Sub-Township : 2.9
40
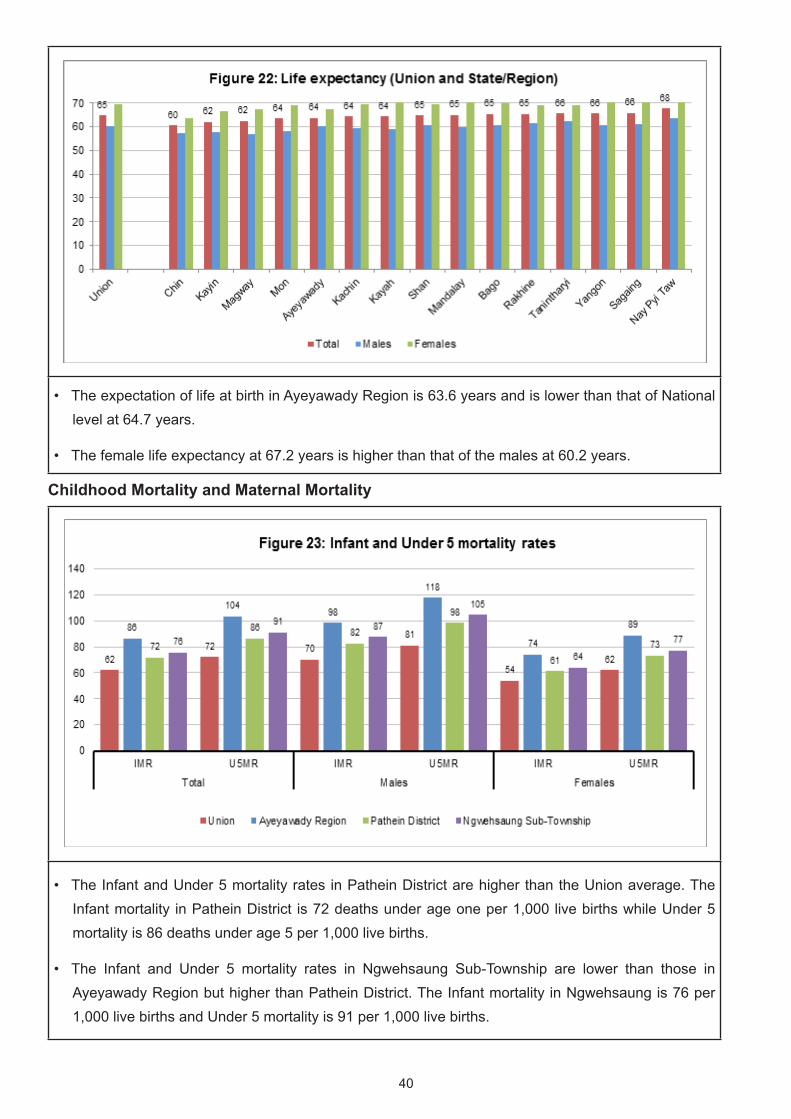
• The expectation of life at birth in Ayeyawady Region is 63.6 years and is lower than that of National level at 64.7 years.
• The female life expectancy at 67.2 years is higher than that of the males at 60.2 years.
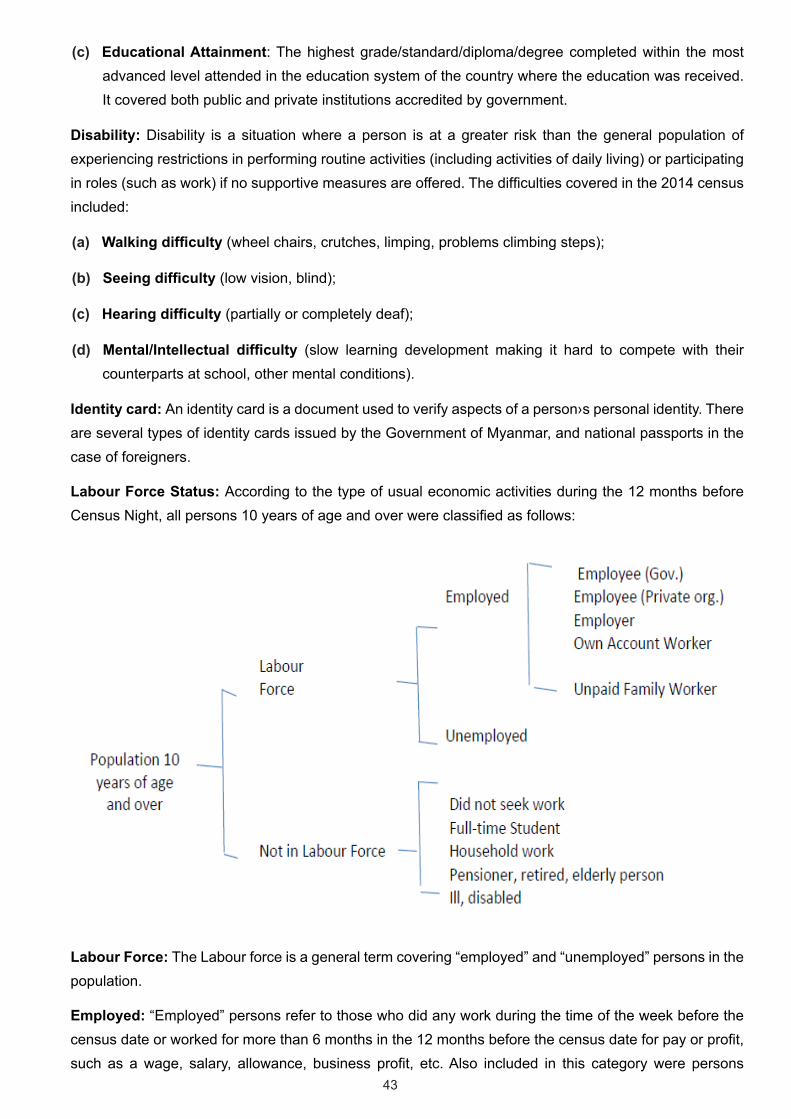
Childhood Mortality and Maternal Mortality
• The Infant and Under 5 mortality rates in Pathein District are higher than the Union average. The Infant mortality in Pathein District is 72 deaths under age one per 1,000 live births while Under 5 mortality is 86 deaths under age 5 per 1,000 live births.
• The Infant and Under 5 mortality rates in Ngwehsaung Sub-Township are lower than those in Ayeyawady Region but higher than Pathein District. The Infant mortality in Ngwehsaung is 76 per 1,000 live births and Under 5 mortality is 91 per 1,000 live births.

41
• In Ayeyawady Region, there are 354 women dying while during pregnancy/delivery or within 42 days of termination of pregnancy for every 100,000 live births.
• The maternal mortality ratio in Ayeyawady Region is higher than that of the Union level.
• Compared to the average maternal mortality ratio of 140 for Southeast Asian countries, the maternal mortality ratio of 282 for Myanmar is high.

42
Definitions and Concepts
Population: The population in this report corresponds to the de-facto population of Myanmar on Census Night (see below).
Census Night: The night between the 29th and the 30th March 2014. Every person in Myanmar was enumerated where they spent the Census Night.
Rural area: Areas classified by the Department of General Administration (GAD) as village tracts. Generally these are areas with low population density and a land use which is predominantly agricultural.
Urban area: Areas classified by the GAD as wards. Generally these areas have an increased density of building structures, population and better infrastructural development.
Population Density: The population density relates to the number of persons in a given administrative area to the surface of the area, expressed in square kilometres (Km2). Areas covered by water are excluded from the calculation.
Mean Household Size: The average number of persons per household (people living in households divided by number of conventional households).
Sex ratio: The number of males for every 100 females in a population.
Dependency ratio: The total dependency ratio is the ratio of dependents (people younger than 15 years and older than 64) to the population of working-age (age 15-64). Data are shown as the proportion of dependents per 100 working-age population. Three different measures can be calculated: total dependency ratio, child dependency ratio and old age dependency ratio.
Child Dependency Ratio: is the proportion of people younger than 15 years to the working age population (15-64).
Old Dependency Ratio: is the proportion of people older than 64 years to the working age population (15-64).
Ageing Index: The number of persons aged 65 years and over per 100 people under the age of 15 years.
Median Age: The age that divides a population into two numerically equal groups; that is, half the people are younger than this age and half are older.
Education: Education is the process by which people learn through instruction and teaching. The 2014 MPHC placed an emphasis on literacy skills, school attendance and educational attainment. The other categorisations used under education were:
(a) Literacy: The ability to read and write in any language with reasonable understanding.
(b) School attendance: The attendance at any regular educational institution or systematic instruction at any level of education during the last 12 months. This included schooling at pre-primary, primary, middle, high school and tertiary institutions of higher learning. The options were: (a) Currently attending; (b) Attended previously; (c) Never attended.
43
(c) Educational Attainment: The highest grade/standard/diploma/degree completed within the most advanced level attended in the education system of the country where the education was received. It covered both public and private institutions accredited by government.
Disability: Disability is a situation where a person is at a greater risk than the general population of experiencing restrictions in performing routine activities (including activities of daily living) or participating in roles (such as work) if no supportive measures are offered. The difficulties covered in the 2014 census included:
(a) Walking difficulty (wheel chairs, crutches, limping, problems climbing steps);
(b) Seeing difficulty (low vision, blind);
(c) Hearing difficulty (partially or completely deaf);
(d) Mental/Intellectual difficulty (slow learning development making it hard to compete with their counterparts at school, other mental conditions).
Identity card: An identity card is a document used to verify aspects of a person›s personal identity. There are several types of identity cards issued by the Government of Myanmar, and national passports in the case of foreigners.
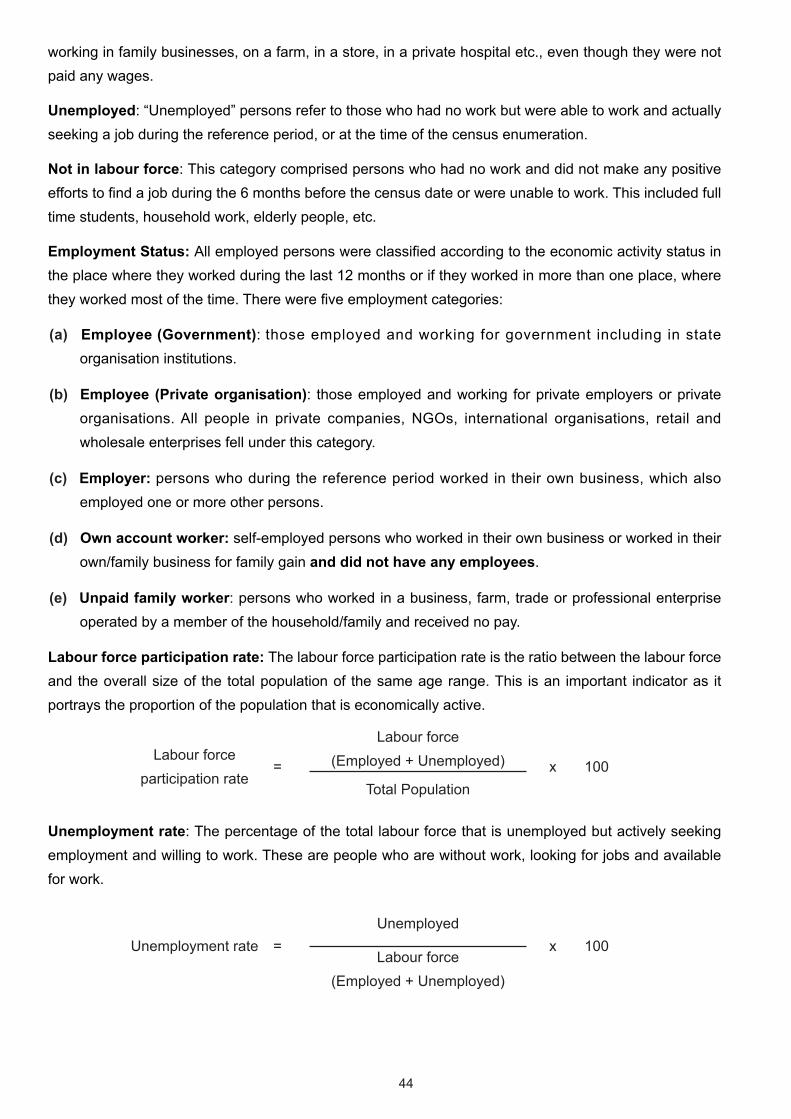
Labour Force Status: According to the type of usual economic activities during the 12 months before Census Night, all persons 10 years of age and over were classified as follows:
Labour Force: The Labour force is a general term covering “employed” and “unemployed” persons in the population.
Employed: “Employed” persons refer to those who did any work during the time of the week before the census date or worked for more than 6 months in the 12 months before the census date for pay or profit, such as a wage, salary, allowance, business profit, etc. Also included in this category were persons
44
working in family businesses, on a farm, in a store, in a private hospital etc., even though they were not paid any wages.
Unemployed: “Unemployed” persons refer to those who had no work but were able to work and actually seeking a job during the reference period, or at the time of the census enumeration.
Not in labour force: This category comprised persons who had no work and did not make any positive efforts to find a job during the 6 months before the census date or were unable to work. This included full time students, household work, elderly people, etc.
Employment Status: All employed persons were classified according to the economic activity status in the place where they worked during the last 12 months or if they worked in more than one place, where they worked most of the time. There were five employment categories:
(a) Employee (Government): those employed and working for government including in state organisation institutions.
(b) Employee (Private organisation): those employed and working for private employers or private organisations. All people in private companies, NGOs, international organisations, retail and wholesale enterprises fell under this category.
(c) Employer: persons who during the reference period worked in their own business, which also employed one or more other persons.
(d) Own account worker: self-employed persons who worked in their own business or worked in their own/family business for family gain and did not have any employees.
(e) Unpaid family worker: persons who worked in a business, farm, trade or professional enterprise operated by a member of the household/family and received no pay.
Labour force participation rate: The labour force participation rate is the ratio between the labour force and the overall size of the total population of the same age range. This is an important indicator as it portrays the proportion of the population that is economically active.
Labour force participation rate
=
Labour force (Employed + Unemployed) x 100
Total Population
Unemployment rate: The percentage of the total labour force that is unemployed but actively seeking employment and willing to work. These are people who are without work, looking for jobs and available for work.
Unemployment rate =Unemployed
x 100Labour force
(Employed + Unemployed)

45
Employment to population ratio: A statistical ratio that measures the proportion of the country’s working-age population (ages 15 to 64) that is employed. The International Labour Organization (ILO) states that a person is considered employed if they have worked at least 1 hour in “gainful” employment in the most recent week.
Employment to population ratio
=Employed
x 100Total Population
Occupation: Occupation refers to the kind of work an employed person did in the establishment during the 12 months (reference period) before the census date. Put differently, occupation is the kind of work done during the last 12 months by the person employed, regardless of the industry of the establishment. In the 2014 Myanmar Census, field data collectors were instructed to collect a detailed description of the work being done such as accounts clerk, data entry operator (clerk), legal secretary, domestic worker, fisherman, human resource manager, etc. If an employed person was engaged in two or more jobs, the kind of work was decided by the work in which he/she was mainly engaged in, that is in terms of time. The occupational classification is based on the ISCO 2008.
Industry: Industry refers to the main activity of the establishment where an employed person usually worked during the 12 months (reference period) before the census date. In the 2014 Myanmar Census, industry was explained to the enumerators as the type of economic activity carried out at the person’s place of work. It is defined in terms of the kind of goods produced or services supplied by the enterprise in which the person works and not necessarily the specific duties or functions of the person’s job. For example, a clerical officer working in stores within a factory that makes television sets. The industry should be recorded as manufacture of electrical goods. If an employed person worked in two or more establishments, “industry” was decided by the establishment where he/she worked most. The industrial classification is based on the ISIC Revision 4.
Live Birth: A live birth is one where the infant shows one or more of the following signs of life immediately after birth: crying or similar sounds, movement of the limbs or any other parts of the body and/or any other tangible signs of life. The census was concerned only with children born alive. Also collected was information on the last live birth of ever married female respondents.
Total fertility rate (TFR): The average number of children that a woman would give birth to if all women lived to the end of their childbearing years and bore children according to the current schedule of age-specific fertility rates.
Age specific fertility rate (ASFR): The age-specific fertility rate measures the annual number of births to women of a specified age or age group per 1,000 women in that age group. Unless otherwise specified, the reference period for the age-specific fertility rates is the calendar year.

46
List of ContributorsContributors to the Ayeyawady Region, Pathein District, Ngwehsaung Sub-Township Report
Name Institution RolePrepared by
Daw Mar Mar Oo Staff Officer,Department of Population Leader
Daw Naing Naing Lwin Assistant Immigration Officer, Department of Population Assistant
Daw Ni Ni Than Junior Clerk, Department of Population Assistant
Translator and Reviewer
Daw Khin May Than UNFPA Consultant Translation and Review
Data Processing and IT Team
Daw Sandar Myint Deputy Director, Department of Population Programming and generation of tables
Daw Su Myat Oo Immigration Assistant, Department of Population Generation of tables
Daw Aye Thiri Zaw Junior Clerk, Department of Population Generation of tables
Daw Lin Lin Mar Staff Officer, Department of Population Generation of maps
Daw Cho Cho Than Assistant Computer Operator, Department of Population Generation of maps
Daw Khine Sabbe Tun Junior Clerk, Department of Population Generation of maps
Designer
U Naing Phyo Kyaw Staff Officer, Department of Population Graphic Designer
U Win Ko Junior Clerk, Department of Population Graphic Designer

47
48
The Townships Reports
can be downloaded at :www.dop.gov.mm
or
http://myanmar.unfpa.org/census


