John L. Scott Convention Jessica Lautz National Association of REALTORS ® October 30, 2014.

THE 2006 NATIONALASSOCIATION OF REALTORS®
PROFILE OF HOMEBUYERS AND SELLERS
NATIONAL ASSOCIATION OF REALTORS®
The Voice For Real Estate®

4NatioNal associat ioN of RealtoRs ®
The 2006 NaTioNal associaTioN of RealToRs®
PRofile of home BuyeRs aNd selleRs
©2006 NatioNal associatioN of realtors®

2006 PRof ile of Home BuyeRs & selleRs
c o N t e N t s
Preface................................................................................................................................ 3
Highlights........................................................................................................................... 5
Chapter.1:.Characteristics.of.Home.Buyers..................................................................... 7
Chapter.2:.Characteristics.of.Homes.Purchased........................................................... 19
Chapter.3:.The.Home.Search.Process............................................................................. 32
Chapter.4:.Home.buying.and.Real.Estate.Professionals............................................... 45
Chapter.5:.Financing.the.Home.Purchase..................................................................... 55
Chapter.6:.Home.Sellers.and.Their.Selling.Experience................................................ 60
Chapter.7:.Home.Selling.and.Real.Estate.Professionals............................................... 73
Chapter.8:.For-Sale-by-Owner.Sellers.............................................................................. 79
Conclusion....................................................................................................................... 88
List.of.Exhibits.................................................................................................................. 89
2
N ovember 2006
NatioNal associat ioN of RealtoRs ®
them.in.many.aspects.of.the.home.sales.transaction..From.the.initial.search.to.the.
closing,.real.estate.agents.and.brokers.help.guide.home.buyers.through.the.many.
steps.that.culminate.in.a.successful.home.purchase..Real.estate.professionals.also.
help.home.sellers.by.developing.a.marketing.plan,.pricing.the.home.competitively.
and.utilizing.their.experience.to.assist.sellers.through.each.step.of.the.process..
The.NATIONAL.ASSOCIATION.OF.REALTORS®.surveys.home.buyers.and.sellers.
annually.to.gather.detailed.information.on.the.home.buying.and.selling.process...
These.surveys.provide.information.on.demographics,.housing.characteristics.and.
the.experience.of.buyers.and.sellers.in.the.housing.market...Buyers.and.sellers.also.
share.information.on.the.role.of.real.estate.professionals.in.home.sales.transactions...
The.2006 NATIONAL ASSOCIATION OF REALTORS® Profile of Home Buyers
and Sellers.describes.the.critical.role.that.real.estate.professionals.play.in.the.
real.estate.market..Buyers.report.that.they.depend.on.agents.and.brokers.to.help.
them.find.the.right.home.and.guide.them.through.the.process.of.completing.the.
purchase..Sellers.note.that.real.estate.professionals.are.key.to.marketing.their.home.
and.negotiating.the.best.price,.contingencies,.transaction.date.and.other.important.
elements.....
This.report.provides.REALTORS®.with.insights.into.the.characteristics.and.needs.
of.their.clients...It.also.helps.REALTORS®.to.improve.their.client.service..Others.
benefit.from.the.findings.of.this.research.by.better.understanding.the.housing.
market.and.how.the.unique.role.of.real.estate.professionals.continues.to.be.
important.as.the.housing.market.evolves...
THE HOUSING ENVIRONMENTAfter.more.than.a.decade.of.setting.one.sales.record.after.another,.the.housing.
market.entered.a.period.of.somewhat.lower.sales.and.less.robust.price.gains.in.
late.2005.and.early.2006..Existing-home.sales.peaked.at.over.7.2.million.units.in.the.
second.half.of.2005.but.have.declined.steadily.through.the.first.half.of.2006...At.the.
same.time,.the.inventory.of.homes.for.sale.rose.bringing.with.it.a.softening.of.home.
prices..
Reasons.for.the.readjustment.in.the.housing.market.are.obvious:.homes.in.many.
areas.of.the.country.became.too.pricey,.affordability.suffered.and.the.home.buying.
public.lost.confidence..Households.and.investors.moved.to.the.sidelines.with.many.
waiting.to.get.back.into.the.real.estate.market.when.property.prices.retreat.to.more.
suitable.levels.
As.the.housing.market.eases.from.the.frenzied.pace.of.the.past.few.years,.
home.buyers,.and.especially.first-time.buyers,.will.benefit..They.will.have.a.greater.
P R e fa c e
HHOME bUyERS aNd SEllERS REly ON REal ESTaTE pROfESSIONalS TO aSSIST
3
Paul C. Bishop, Ph.D
Harika Bickicioglu
Shonda D. Hightower
selection.of.homes.to.choose.from.while.reducing.the.odds.that.they.will.be.priced.
out.of.the.market.due.to.rapidly.escalating.prices..Although.mortgage.rates.have.
risen.modestly.from.their.recent.lows,.few.analysts.are.predicting.a.sharp.uptick.in.
rates.in.the.near-term..
Looking.beyond.to.the.intermediate.term,.the.fundamentals.for.the.housing.
market.remain.solid..The.U.S..Census.Bureau.projects.that.more.than.one.million.
new.households.will.be.formed.annually.over.the.next.several.years..This.pace.of.
household.formation.is.similar.to.the.growth.rate.during.the.past.decade..Most.of.
this.increase.will.stem.from.the.natural.formation.of.new.households.as.children.
leave.home..But.some.of.this.increase.will.also.be.attributable.to.population.
gains.from.immigration..Homeownership.of.non-native-born.households.meets.
and.exceeds.that.of.native-born.households.after.about.25.years..With.the.strong.
flow.of.legal.immigrants.to.the.United.States.over.the.past.30.years,.the.gains.in.
homeownership.from.this.segment.should.continue..
In.addition.to.the.demand.for.housing.based.on.increases.in.population,.
the.aging.of.the.U.S..population.is.also.an.important.factor..The.homeownership.
rate.approaches.80.percent.for.households.in.their.60s.and.peaks.at.nearly.83.
percent.for.households.in.their.early.70s..Baby.boomers,.now.just.reaching.age.60,.
will.continue.to.purchase.homes..Most.will.purchase.a.primary.residence,.but.a.
significant.share.will.also.purchase.a.vacation.home.or.investment.property.in.the.
years.ahead..
NOTESIn.August.2006,.the.NATIONAL.ASSOCIATION.OF.REALTORS®.mailed.an.eight-
page.questionnaire.to.129,500.consumers.who.bought.a.home.between.July.
2005.and.June.2006..The.survey.yielded.7,548.usable.responses.with.a.response.
rate,.after.adjusting.for.undeliverable.addresses,.of.6.3.percent...Consumer.names.
and.addresses.were.obtained.from.Experian,.a.firm.that.maintains.an.extensive.
database.of.recent.home.buyers.derived.from.county.records...Information.about.
sellers.comes.from.those.buyers.who.also.sold.a.home...
All.information.in.this.Profile.is.characteristic.of.the.12-month.period.ending.
June.2006,.with.the.exception.of.income.data,.which.was.reported.for.2005...In.
some.sections.comparisons.are.also.given.for.results.obtained.in.previous.surveys...
Not.all.results.are.directly.comparable.due.to.changes.in.questionnaire.design..
Some.results.are.presented.for.the.four.Census.regions:..Northeast,.Midwest,.South.
and.West...The.median.is.the.primary.statistical.measure.used.throughout.this.
report...Due.to.rounding.and.omissions.for.space,.percentage.distributions.may.not.
add.to.100.percent...
4 2006 PRof ile of Home BuyeRs & selleRs

NatioNal associat ioN of RealtoRs ®
RePoRt HigHligHts
HEN bUyING OR SEllING a HOME, TOday’S REal ESTaTE cONSUMERS HaVEWW more.choices.than.ever...For.home.buyers.there.are.numerous.ways.to.search.for.and.find.a.home,.a.broad.array.of.mortgage.products.with.which.they.can.finance.their.home.and.a.growing.list.of.services.that.their.agent.can.provide.to.assist.them.in.the.process..Home.sellers.can.choose.to.sell.their.home.themselves.or.enlist.the.professional.assistance.of.an.agent.who.can.provide.various.levels.of.service.to.best.suit.each.home.seller’s.needs...Because.the.real.estate.market.is.always.evolving,.it.is.important.for.real.estate.professionals.to.have.a.clear.picture.of.today’s.home.buyers.and.sellers...The.2006 NATIONAL ASSOCIATION OF REALTORS® Profile of Home Buyers and Sellers describes.the.characteristics.and.motivations.of.recent.home.buyers.and.sellers.and.in.so.doing.helps.real.estate.professionals.track.the.changing.demands.of.consumers.in.a.dynamic.market.
cHaRacTERISTIcS Of HOME bUyERSn The.typical.home.buyer.was.41.years.old...Among.first-time.buyers,.the.
median.age.was.32.n More.than.one-quarter.of.buyers.reported.a.2005.household.income.of.at.
least.$100,000.n Sixty-one.percent.of.recent.home.buyers.were.married.n For.repeat.buyers,.the.most.important.reason.for.their.purchase.was.a.desire.
for.a.larger.home.
cHaRacTERISTIcS Of HOMES pURcHaSEdn One.in.five.homes.purchased.by.recent.buyers.was.newly.built.n Three-quarters.of.homes.purchased.were.detached.single-family.homes.n Neighborhood.quality.was.the.most.important.factor.for.buyers.in.selecting.
a.location.n The.typical.buyer.purchased.a.home.that.was.slightly.more.than.1,800.
square.feet.in.size.
THE HOME SEaRcH pROcESSn Eighty-five.percent.of.home.buyers.used.a.real.estate.agent.during.their.
search.for.a.home.n Nearly.three-quarters.of.buyers.viewed.the.Internet.as.a.very.useful.tool.in.
their.home.search.n A.majority.of.buyers.reported.that.they.drove.by.a.home.viewed.online..n Typical.buyers.searched.for.eight.weeks.before.finding.the.home.they.
purchased.
HOME bUyING aNd REal ESTaTE pROfESSIONalSn Over.three-quarters.of.buyers.used.a.real.estate.agent.to.purchase.their.
home.
5

2006 PRof ile of Home BuyeRs & selleRs
n Nearly.half.of.first-time.buyers.found.their.agent.through.a.referral.from.a.friend.or.relative.
n The.most.frequently.cited.benefit.that.buyers.received.when.using.a.real.estate.agent.was.help.understanding.the.home.buying.process.
n The.agent’s.reputation.and.trustworthiness.were.the.two.most.important.factors.buyers.considered.when.choosing.an.agent..
fINaNcING THE HOME pURcHaSEn Ninety-two.percent.of.buyers.financed.their.home.purchase.with.a.
mortgage.n First-time.buyers.most.often.relied.on.savings.for.their.downpayment,.while.
repeat.buyers.relied.on.equity.in.the.home.they.sold..n A.majority.of.buyers.view.their.home.as.a.better.financial.investment.than.
stocks.
HOME SEllERS aNd THEIR SEllING EXpERIENcEn Over.three-quarters.of.sellers.sold.a.detached.single-family.home.n Half.of.sellers.traded.up.to.a.larger.home.n The.typical.home.seller.owned.their.previous.home.for.six.years.n Among.sellers.at.least.65.years.old,.the.most.frequently.cited.reason.for.
selling.their.home.was.a.desire.to.move.closer.to.friends.or.family.
HOME SEllERS aNd REal ESTaTE pROfESSIONalSn Eighty-four.percent.of.sellers.used.a.real.estate.agent.to.sell.their.home.n Four.in.10.sellers.found.their.real.estate.agent.through.a.referral.from.a.
friend.or.relative.n When.choosing.an.agent,.the.reputation.of.the.agent.was.the.most.
important.factor.n Half.of.sellers.used.the.same.agent.in.both.their.home.sale.and.purchase.
fOR-SalE-by-OWNER (fSbO) SEllERSn FSBO.sellers.more.frequently.sold.a.home.in.a.small.town.or.rural.area.
compared.with.sellers.who.were.assisted.by.a.real.estate.agent.n The.typical.FSBO.seller.has.owned.two.homes.including.the.one.they.just.
sold.n FSBO.sellers.relied.on.word-of-mouth.and.yard.signs.most.often.to.market.
their.home.n One.of.the.most.difficult.tasks.for.FSBO.sellers.was.preparing.or.fixing.up.
their.home.for.sale.n FSBOs.accounted.for.about.12.percent.of.all.sales,.with.two.out.of.five.FSBO.
transactions.being.between.families.and.aquaintances.
6

UUcHaPteR cHaRacteRistics of Home BuyeRs
NdERSTaNdING WHO TOday’S HOME bUyERS aRE IS aN IMpORTaNT facTOR
in.assessing.the.state.of.the.housing.market.and.in.anticipating.how.emerging.
changes.in.the.characteristics.of.buyers.will.affect.the.market.in.the.future..While.
age.and.income.are.two.fundamental.ways.to.characterize.home.buyers,.the.
influence.of.different.household.and.family.arrangements,.as.well.as.changing.
racial.and.ethic.characteristics.of.buyers,.are.also.significant...As.this.Profile.shows,.
today’s.home.buyers.are.more.racially.diverse.and.approach.the.home.buying.
transaction.with.a.variety.of.motivations,.many.of.them.tied.to.their.age.and.
experience.
II
For three-quarters of first-time buyers,
the desire to own a home and establish
their own household was the primary
motivating factor underlying their
home purchase.
7NatioNal associat ioN of RealtoRs ®

2006 PRof ile of Home BuyeRs & selleRs
aGEHome.buyers.in.the.current.survey.
reported.a.median.age.of.41.years..
Buyers.in.the.Midwest.were.typically.
the.youngest,.with.a.median.age.of.38,.
while.buyers.in.the.West.and.the.South.
reported.the.highest.median.age.at.42.
years..Forty.percent.of.buyers.in.the.
Midwest.were.34.years.old.or.younger.
compared.with.33.percent.of.buyers.in.
other.regions.
Exhibit 1-1
aGE Of HOME bUyERS, by REGION(Percentage Distribution)
INcOMEThe.2005.median.income.of.home.
buyers.was.$71,800,.nearly.unchanged.
from.the.2004.median.income.of.
buyers.in.the.previous.survey...Buyers.
in.the.Midwest.reported.the.lowest.
median.income.($65,800).while.buyers.
in.the.West.had.the.highest.median.
income.($78,200)..The.median.income.
of.buyers.in.the.Northeast.was.5.7.
percent.higher.and.3.7.percent.higher.
in.the.West.compared.with.results.from.
the.2005.Profile..Median.incomes.of.
buyers.in.the.Midwest.and.South.were.
1.5.percent.and.3.3.percent.lower,.
respectively...Twenty-eight.percent.of.
buyer.households.reported.an.income.
of.at.least.$100,000;.over.one-third.of.
buyers.in.the.West.had.an.income.in.
this.range..
Exhibit 1-2
HOUSEHOld INcOME Of HOME bUyERS, 2005(Percentage Distribution)
all buyers Northeast Midwest South West
less than $25,000 4% 3% 5% 5% 3%
$25,000 - $34,999 8 8 9 9 6
$35,000 - $44,999 9 9 10 9 8
$45,000 - $54,999 10 8 12 11 9
$55,000 - $64,999 11 11 13 10 11
$65,000 - $74,999 10 10 10 12 10
$75,000 - $84,999 9 11 8 9 10
$85,000 - $99,999 9 11 10 9 9
$100,000 - $124,999 11 11 10 10 14
$125,000 - $149,999 6 7 5 6 8
$150,000 - $174,999 4 4 2 4 5
$175,000 - $199,999 2 2 1 2 2
$200,000 or more 5 7 4 5 6
median income (2005) $71,800 $75,600 $65,800 $70,100 $78,200
all buyers Northeast Midwest South West
less than 25 years 5% 3% 7% 4% 5%
25 - 34 years 30 30 33 29 28
35 - 44 years 25 28 25 23 24
45 - 54 years 19 19 17 21 19
55 - 64 years 13 12 10 13 15
65 - 74 years 6 6 5 7 7
75 years or older 2 2 2 3 2
median age (years) 41 41 38 42 42
bUyERS WHO pURcHaSEd a HOME IN THE:
bUyERS WHO pURcHaSEd a HOME IN THE:
cHaPteR 1: cHaRacteRist ics of Home BuyeRs8

NatioNal associat ioN of RealtoRs ®
HOUSEHOld cOMpOSITIONThe.composition.of.households.that.
recently.purchased.homes.was.virtually.
unchanged.from.the.previous.year..
Over.the.past.decade,.however,.there.
are.trends.that.reflect.many.ongoing.
demographic.changes..The.share.of.
married-couple.home.buyers.has.
trended.downward.from.70.percent.in.
the.mid-1990s.to.61.percent.currently..
Offsetting.this.decline.is.an.increase.in.
single-female.home.buyers;.22.percent.
of.recent.buyers.were.single.females,.
compared.with.14.percent.in.1995..The.
shares.of.single-male.and.unmarried-
couple.home.buyers.have.changed.
little.during.the.past.decade.
Exhibit 1-3
adUlT cOMpOSITION Of HOME bUyER HOUSEHOldS(Percentage Distribution)
1995 1997 1999 2001 2003 2004 2005 2006
married couple 70% 64% 66% 68% 59% 62% 61% 61%
single female 14 18 18 15 21 18 21 22
single male 9 11 9 7 11 8 9 9
unmarried couple 6 5 6 7 8 9 7 7
other 1 2 1 3 1 2 2 1
One17%
None62%
Two15%
Three ormore6%
Exhibit 1-4cHIldRENMost.home.buyers.(62.percent).
have.no.children.under.the.age.of.
18.residing.in.the.home,.a.finding.
consistent.with.characteristics.of.home.
buyers.in.recent.years..Fewer.then.one.
in.five.buyers.have.one.child.under.18.
years.old,.with.15.percent.reporting.that.
two.children.reside.in.the.home..
Exhibit 1-4
NUMbER Of cHIldREN UNdER THE aGE Of 18 RESIdING IN HOUSEHOld(Percentage Distribution of Households)
9

2006 PRof ile of Home BuyeRs & selleRs
RacE aNd ETHNIcITyThe.racial.composition.of.home-
buying.households.is.evolving.over.
time,.although.changes.from.one.
year.to.the.next.are.small...Eighty-
one.percent.of.recent.home.buyers.
describe.themselves.as.white,.
compared.with.83.percent.in.the.2005.
Profile...Across.each.region,.the.share.
of.white.home.buyers.is.down.slightly.
The.share.of.non-white.home.buyers.
is.greatest.in.the.West.and.South.and.
smallest.in.the.Midwest.
Exhibit 1-5
RacE/ETHNIcITy Of HOME bUyERS, by REGION(Percent of Respondents)
all buyers Northeast Midwest South West
White/caucasian 81% 84% 88% 79% 77%
Black/african-american 7 4 6 11 3
Hispanic/latino 6 5 3 6 9
asian/Pacific islander 5 5 2 4 10
other 2 1 1 2 3
Note: Respondents were permitted to select as many races and ethnicities as they felt applicable. The percentage distribution may therefore sum to more than 100 percent.
laNGUaGEOverall,.5.percent.of.home.buyers.
reported.that.they.primarily.speak.a.
language.other.than.English..Buyers.in.
the.Northeast.and.the.West.were.most.
likely.to.speak.a.language.other.than.
English.
Exhibit 1-6
pRIMaRy laNGUaGE SpOKEN IN HOME bUyER HOUSEHOld, by REGION(Percentage Distribution)
all buyers Northeast Midwest South West
english 95% 93% 97% 96% 94%
other 5 7 3 4 6
fOREIGN-bORN bUyERSForeign-born.buyers.are.an.
important.component.of.the.housing.
market..Eleven.percent.of.recent.home.
buyers.reported.that.they.were.born.
somewhere.other.than.the.United.
States..The.share.of.foreign-born.buyers.
was.greatest.in.the.Northeast..
(15.percent).and.lowest.in.the.Midwest.
(6.percent)..
Exhibit 1-7
NaTIONal ORIGIN Of HOME bUyERS, by REGION(Percentage Distribution)
all buyers Northeast Midwest South West
Born in u.s. 89% 85% 94% 90% 87%
Not born in u.s. 11 15 6 10 13
bUyERS WHO pURcHaSEd a HOME IN THE:
bUyERS WHO pURcHaSEd a HOME IN THE:
bUyERS WHO pURcHaSEd a HOME IN THE:
10 cHaPteR 1: cHaRacteRist ics of Home BuyeRs

NatioNal associat ioN of RealtoRs ®
fIRST-TIME bUyERSFirst-time.buyers.are.another.
important.segment.of.home-buying.
consumers...They.are.at.the.leading.
edge.of.changes.in.the.market.and.
foretell.many.of.the.emerging.trends.in.
demographics.that.will.influence.real.
estate.markets.for.several.years...Among.
recent.buyers,.first-timers.accounted.
for.36.percent,.down.four.percentage.
points.from.the.previous.survey...Rising.
home.prices,.especially.along.the.
coasts,.pushed.many.first-time.buyers.
out.of.the.market.at.the.same.time.that.
investors.and.vacation.home.buyers.
ramped.up.their.purchases..The.net.
effect.was.a.decrease.in.the.share.of.
homes.purchased.by.first-time.buyers..
The.largest.declines.in.the.share.
of.first-time.home.buyers.were.in.
the.Northeast.and.Midwest..While.40.
percent.of.recent.sales.in.the.Northeast.
were.to.first-time.buyers,.this.share.is.
down.from.47.percent.reported.in.the.
2005.Profile...Similarly,.the.share.fell.
to.40.percent.from.45.percent.in.the.
Midwest..The.share.of.first-time.buyers,.
at.34.percent.in.the.South.and.the.West,.
was.little.changed.from.the.percentage.
reported.one.year.earlier..
Exhibit 1-8
fIRST-TIME HOME bUyERS(Percent of all Home buyers)
50%
45%
40%
35%
30%
25%
20%1995 1997 1999 2001 2003 2004 2005 2006
36%
40%40%40%
42%42%42%42%
Exhibit 1-9
fIRST-TIME HOME bUyERS, by REGION
50%
45%
40%
35%
30%
25%
20%U.S. Northeast Midwest South West
34% 34%
40%40%
36%
(Percent of all Home Buyers)
(Percent of all Home Buyers)
11

2006 PRof ile of Home BuyeRs & selleRs
aGE Of fIRST-TIME aNd REpEaT bUyERS
The.typical.first-time.buyer.was.
32.years.old.while.the.typical.repeat.
buyer.was.47.years.old.--.in.both.cases.
little.changed.from.results.in.the.2005.
Profile..Half.of.first-time.buyers.were.
between.25.and.34.years.of.age,.while.
more.than.one-quarter.of.repeat.buyers.
were.between.35.and.44.years.old.and.
slightly.less.than.one-quarter.were.
between.45.and.54.years.old..
The.median.age.varies.by.
household.composition.among.both.
first-time.and.repeat.buyers..While.the.
typical.first-time.buyer.who.is.married.
was.32.years.old,.the.typical.first-time.
buyer.who.is.a.single.female.was.
somewhat.older.at.34.years..Unmarried-
couple,.first-time.buyers.tend.to.be.
the.youngest.with.a.median.age.of.29..
Among.typical.repeat.buyers,.married.
couples.are.younger.than.single.buyers.
of.either.sex.
Exhibit 1-10
fIRST-TIME aNd REpEaT HOME bUyERS by HOUSEHOld TypE(Percentage Distribution of Households)
Married couple 67%
Other 1%
Unmarriedcouple
5%Singlemale 9%
Singlefemale 18%
Other 2%
Unmarriedcouple 11%Single
male 11%
Singlefemale 27%
Married couple 49%
all buyers first-time buyers Repeat buyers
less than 25 years 5% 12% 1%
25-34 years 30 51 18
35-44 years 25 20 27
45-54 years 19 12 23
55-64 years 13 3 18
65-74 years 6 1 9
75 years or older 2 * 3
median age 41 years 32 years 47 years
married couple 40 years 32 years 45 years
single female 43 years 34 years 51 years
single male 42 years 31 years 50 years
unmarried couple 35 years 29 years 46 years
other 49 years 46 years 54 years
* Less than one percent
Exhibit 1-11
aGE Of fIRST-TIME aNd REpEaT bUyERS(Percentage Distribution)
fIRST-TIME HOME bUyERS
REpEaT HOME bUyERS
Married couple 67%
Other 1%
Unmarriedcouple
5%Singlemale 9%
Singlefemale 18%
Other 2%
Unmarriedcouple 11%Single
male 11%
Singlefemale 27%
Married couple 49%
fIRST-TIME bUyER HOUSEHOld cOMpOSITION
Half.of.first-time.buyers.are.married.
couples.compared.with.67.percent.
of.repeat.buyers..Larger.shares.of.first-
timers.are.single.females.(27.percent.
vs..18.percent).and.unmarried.couples.
(11.percent.vs..5.percent)..There.is.little.
difference.in.the.share.of.first-time.and.
repeat.buyers.who.are.single.males
cHaPteR 1: cHaRacteRist ics of Home BuyeRs12
NatioNal associat ioN of RealtoRs ®
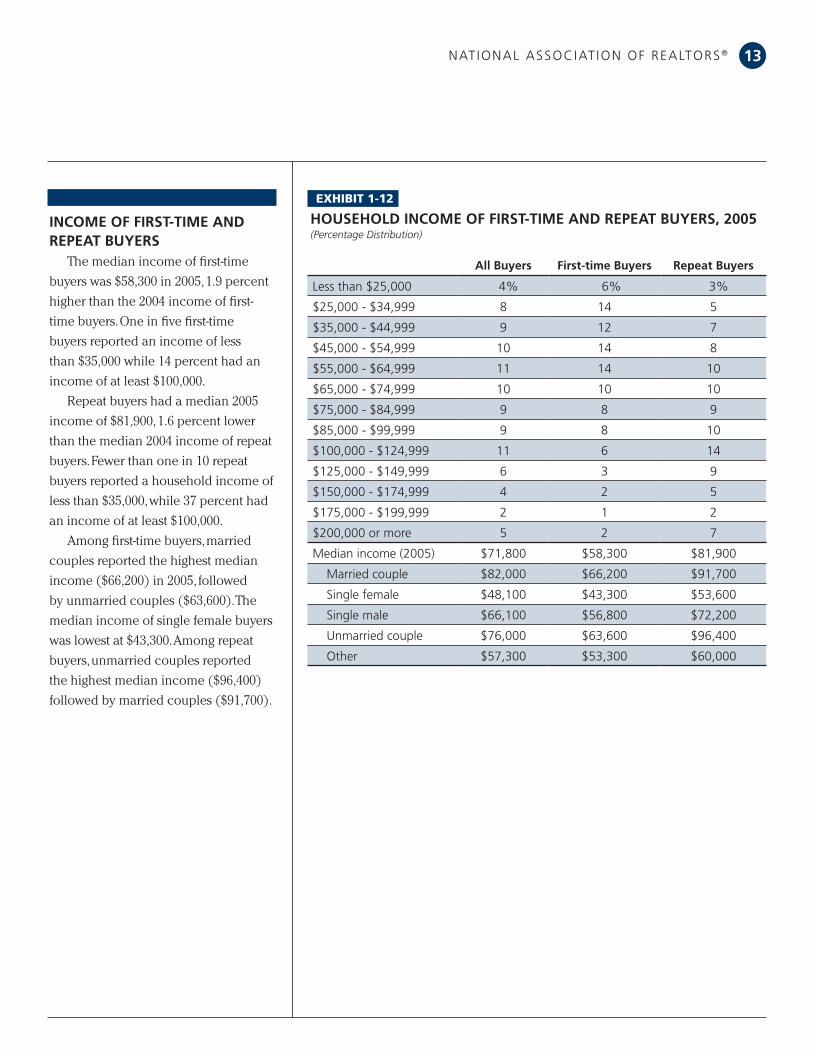
INcOME Of fIRST-TIME aNd REpEaT bUyERS
The.median.income.of.first-time.
buyers.was.$58,300.in.2005,.1.9.percent.
higher.than.the.2004.income.of.first-
time.buyers..One.in.five.first-time.
buyers.reported.an.income.of.less.
than.$35,000.while.14.percent.had.an.
income.of.at.least.$100,000..
Repeat.buyers.had.a.median.2005.
income.of.$81,900,.1.6.percent.lower.
than.the.median.2004.income.of.repeat.
buyers..Fewer.than.one.in.10.repeat.
buyers.reported.a.household.income.of.
less.than.$35,000,.while.37.percent.had.
an.income.of.at.least.$100,000..
Among.first-time.buyers,.married.
couples.reported.the.highest.median.
income.($66,200).in.2005,.followed.
by.unmarried.couples.($63,600)..The.
median.income.of.single.female.buyers.
was.lowest.at.$43,300..Among.repeat.
buyers,.unmarried.couples.reported.
the.highest.median.income.($96,400).
followed.by.married.couples.($91,700).
Exhibit 1-12
HOUSEHOld INcOME Of fIRST-TIME aNd REpEaT bUyERS, 2005(Percentage Distribution)
all buyers first-time buyers Repeat buyers
less than $25,000 4% 6% 3%
$25,000 - $34,999 8 14 5
$35,000 - $44,999 9 12 7
$45,000 - $54,999 10 14 8
$55,000 - $64,999 11 14 10
$65,000 - $74,999 10 10 10
$75,000 - $84,999 9 8 9
$85,000 - $99,999 9 8 10
$100,000 - $124,999 11 6 14
$125,000 - $149,999 6 3 9
$150,000 - $174,999 4 2 5
$175,000 - $199,999 2 1 2
$200,000 or more 5 2 7
median income (2005) $71,800 $58,300 $81,900
married couple $82,000 $66,200 $91,700
single female $48,100 $43,300 $53,600
single male $66,100 $56,800 $72,200
unmarried couple $76,000 $63,600 $96,400
other $57,300 $53,300 $60,000
13

2006 PRof ile of Home BuyeRs & selleRs
RacE, ETHNIcITy aNd laNGUaGE
While.four.of.five.buyers,.overall,.
were.white,.there.are.some.notable.
differences.when.comparing.first-time.
and.repeat.buyers..Less.than.three-
quarters.of.first-time.buyers.described.
themselves.as.white..African.Americans.
and.Hispanics/Latinos.each.accounted.
for.about.one.in.10.first-time.buyers,.
with.Asians.accounting.for.7.percent..
Among.repeat.buyers,.86.percent.
described.themselves.as.white..Repeat.
buyers.were.about.half.as.likely.to.be.
a.minority.compared.with.first-time.
buyers.
The.greater.share.of.first-time.buyers.
who.are.minorities.is.also.reflected.in.
the.percentage.of.first-time.and.repeat.
buyers.who.primarily.speak.a.language.
other.than.English...Among.first-time.
buyers,.7.percent.report.that.English.is.
not.their.primary.language,.compared.
with.4.percent.of.repeat.buyers..
Exhibit 1-13
RacE/ETHNIcITy Of fIRST-TIME aNd REpEaT bUyERS(Percent of Respondents)
all buyers first-time buyers Repeat buyers
White/caucasian 81% 73% 86%
Black/african-american 7 11 5
Hispanic/latino 6 9 4
asian/Pacific islander 5 7 4
other 2 3 1
Note: Respondents were permitted to select as many races and ethnicities as they felt applicable. The percentage distribution may therefore sum to more than 100 percent.
fOREIGN-bORN bUyERSWhile.11.percent.of.all.buyers.
reported.that.they.were.not.born.in.the.
United.States,.the.share.is.higher.among.
first-time.buyers.(14.percent)..
Exhibit 1-14
pRIMaRy laNGUaGE SpOKEN IN fIRST-TIME aNd REpEaT bUyER HOUSEHOld(Percentage Distribution)
all buyers first-time buyers Repeat buyers
english 95% 93% 96%
other 5 7 4
Exhibit 1-15
NaTIONal ORIGIN Of fIRST-TIME aNd REpEaT bUyERS(Percentage Distribution)
all buyers first-time buyers Repeat buyers
Born in u.s. 89% 86% 91%
Not born in u.s. 11 14 9
cHaPteR 1: cHaRacteRist ics of Home BuyeRs14

NatioNal associat ioN of RealtoRs ®
pRIOR lIVING aRRaNGEMENTSeventy-five.percent.of.first-time.
buyers.rented.an.apartment.or.house.
prior.to.purchasing.their.first.home..
A.significant.share.(17.percent).lived.
with.parents.or.relatives..Among.repeat.
buyers,.three-quarters.moved.from.the.
home.they.owned.to.the.home.they.
recently.purchased...Seventeen.percent..
noted.that.they.most.recently.moved.
from.an.apartment.or.house.that.they.
rented,.having.owned.a.home.at.some.
point.in.the.past..
(Percentage Distribution)
Exhibit 1-16
pRIOR lIVING aRRaNGEMENT Of fIRST-TIME aNd REpEaT bUyERS
all buyers first-time buyers Repeat buyers
owned previous residence 49% 4% 75%
Rented an apartment or house 38 75 17
lived with parents, relatives or friends
9 17 4
Rented the home buyer ultimately purchased
2 3 1
Not applicable or no change in living arrangement
2 1 2
Note: After selling their previous home, buyers may have rented a home or apartment before purchasing their next home. A first-time buyer could have acquired ownership of their previous home (as an inheritance or gift, for example) without having been the buyer of the home. Thus, a first-time buyer could have owned a home prior to their first home purchase.
15
Among repeat buyers, three-quarters moved from the home they owned to the home they recently purchased.

2006 PRof ile of Home BuyeRs & selleRs
REaSON fOR HOME pURcHaSEFor.three-quarters.of.first-time.
buyers,.the.desire.to.own.a.home.and.
establish.their.own.household.was.the.
primary.motivating.factor.underlying.
their.home.purchase..All.other.reasons.
were.of.relatively.minor.importance..
The.motivation.for.repeat.buyers.is.
somewhat.different,.however...Although.
one.in.10.repeat.buyers.reported.
that.the.desire.to.own.a.home.was.
the.primary.reason.for.their.home.
purchase,.other.factors.more.strongly.
motivated.repeat.buyers..For.example,.
one.in.five.repeat.buyers.was.motivated.
by.a.desire.for.a.larger.home,.while.
16.percent.reported.that.a.job-related.
relocation.spurred.their.recent.home.
purchase..Roughly.equal.percentages.
–.one.in.10.–.said.that.a.change.in.
their.own.family.situation,.a.desire.to.
live.in.a.better.area.or.a.desire.for.a.
more.convenient.location.closer.to.
their.job,.school.or.relatives.was.the.
most.important.reason.for.their.home.
purchase..
all buyers first-time buyers Repeat buyers
Desire to own a home of my own/establish household
32% 74% 9%
Desire for larger home 14 4 20
Job-related relocation or move 12 4 16
change in family situation 9 8 10
Desire for a home in a better area
8 3 11
Desire to be closer to job, school, relatives or transit
7 2 10
Desire for smaller home 5 1 7
Retirement 4 1 6
Desire for vacation home/ investment property
1 1 2
Purchased home for family member or relative
1 * 1
other 6 2 9
*Less than one percent
Exhibit 1-17
pRIMaRy REaSON fOR pURcHaSING a HOME, fIRST-TIME aNd REpEaT bUyERS(Percentage Distribution)
cHaPteR 1: cHaRacteRist ics of Home BuyeRs16

NatioNal associat ioN of RealtoRs ®
REaSON fOR a HOME pURcHaSE aNd bUyER aGE
Motivations.for.a.home.purchase.
can.be.influenced.by.factors.other.
than.a.buyer’s.experience.in.the.
housing.market..Several.differences.in.
motivation.for.purchase.are.evident.
across.age.groups.as.well..For.buyers.
18.to.24.years.old,.70.percent.reported.
that.a.desire.for.a.home.of.their.own.
was.the.most.important.reason.for.
purchasing.a.home..The.desire.to.own.
a.home.was.the.primary.motivation.
for.41.percent.of.buyers.in.the.25-to-44.
age.range.and.for.one.in.five.buyers.in.
the.45-to-54.age.range..The.desire.for.a.
larger.home.and.job-related.relocation.
were.also.significant.factors.for.buyers.
25.to.64.years.old..Among.buyers.65.
years.or.older,.the.primary.motivations.
shift.to.factors.such.as.a.desire.to.own.a.
smaller.home.(22.percent),.relocations.
due.to.retirement.(20.percent).and.
a.desire.to.be.closer.to.a.job,.school,.
relatives.or.transit.(15.percent)..
Exhibit 1-18
pRIMaRy REaSON fOR pURcHaSING a HOME, by aGE(Percentage Distribution)
all buyers 18-24 25-44 45-64 65 or older
Desire to own a home of my own/establish household
32% 70% 41% 19% 4%
Desire for larger home 14 5 18 12 6
Job-related relocation or move
12 4 14 12 1
change in family situation
9 11 8 11 10
Desire for a home in a better area
8 2 7 9 8
Desire to be closer to job, school, relatives or transit
7 4 6 8 15
Desire for smaller home 5 1 1 8 22
Retirement 4 N/a * 8 20
Desire for vacation home/investment property
1 1 1 2 1
Purchased home for family member or relative
1 1 * 1 2
other 6 2 4 9 11
aGE
*Less than one percent N/A not applicable
17

2006 PRof ile of Home BuyeRs & selleRs
SEcONd-HOME bUyERSMost.homes.are.purchased.with.the.
intention.of.using.them.as.the.buyer’s.
primary.residence..Others,.collectively.
referred.to.as.second.homes,.are.
purchased.as.a.vacation.home.or.as.
an.investment.property..Second.homes.
are.often.purchased.by.those.who.
already.own.their.primary.residence.
and.consequently,.second-home.buyers.
tend.to.be.older.and.have.a.somewhat.
higher.income.than.buyers.of.primary.
residences..
The.median.age.of.buyers.of.
primary.residences.was.41.compared.
with.52.among.those.that.purchased.
a.second.home..Seventeen.percent.of.
second-home.buyers.were.at.least.65.
years.old.compared.with.just.8.percent.
of.primary.residence.buyers.
Compared.with.all.buyers.who.
purchased.a.primary.residence.–.both.
first-time.and.repeat.buyers.–.second-
home.buyers’.income.is.somewhat.
higher..The.2005.median.income.of.
buyers.of.primary.residences.was.
$71,800,.compared.with.$73,500.among.
second-home.buyers..Furthermore,.28.
percent.of.primary.residence.buyers.
reported.2005.incomes.of.at.least.
$100,000,.compared.with.36.percent.of.
second-home.buyers...
Exhibit 1-19
aGE Of HOME bUyERS, by INTENdEd USE Of HOME(Percentage Distribution)
primary ResidenceNon-primary Residence/
Second Home
less than 25 years 5% 1%
25 - 34 years 31 13
35 - 44 years 25 21
45 - 54 years 19 24
55 - 64 years 13 23
65 - 74 years 6 15
75 years or older 2 2
median age 41 years 52 years
bUyERS WHO pURcHaSEd a:
Exhibit 1-20
HOUSEHOld INcOME Of bUyERS, by INTENdEd USE Of HOME(Percentage Distribution)
bUyERS WHO pURcHaSEd a:
primary ResidenceNon-primary Residence/
Second Home
less than $25,000 4% 6%
$25,000 - $34,999 8 9
$35,000 - $44,999 9 7
$45,000 - $54,999 10 10
$55,000 - $64,999 11 12
$65,000 - $74,999 10 8
$75,000 - $84,999 9 4
$85,000 - $99,999 9 9
$100,000 - $124,999 11 12
$125,000 - $149,999 6 8
$150,000 - $174,999 4 4
$175,000 - $199,999 2 4
$200,000 or more 5 8
median income (2005) $71,800 $73,500
. .
18 cHaPteR 1: cHaRacteRist ics of Home BuyeRs
primary ResidenceNon-primary Residence/
Second Home
less than $25,000 4% 6%
$25,000 - $34,999 8 9
$35,000 - $44,999 9 7
$45,000 - $54,999 10 10
$55,000 - $64,999 11 12
$65,000 - $74,999 10 8
$75,000 - $84,999 9 4
$85,000 - $99,999 9 9
$100,000 - $124,999 11 12
$125,000 - $149,999 6 8
$150,000 - $174,999 4 4
$175,000 - $199,999 2 4
$200,000 or more 5 8
median income (2005) $71,800 $73,500
. .
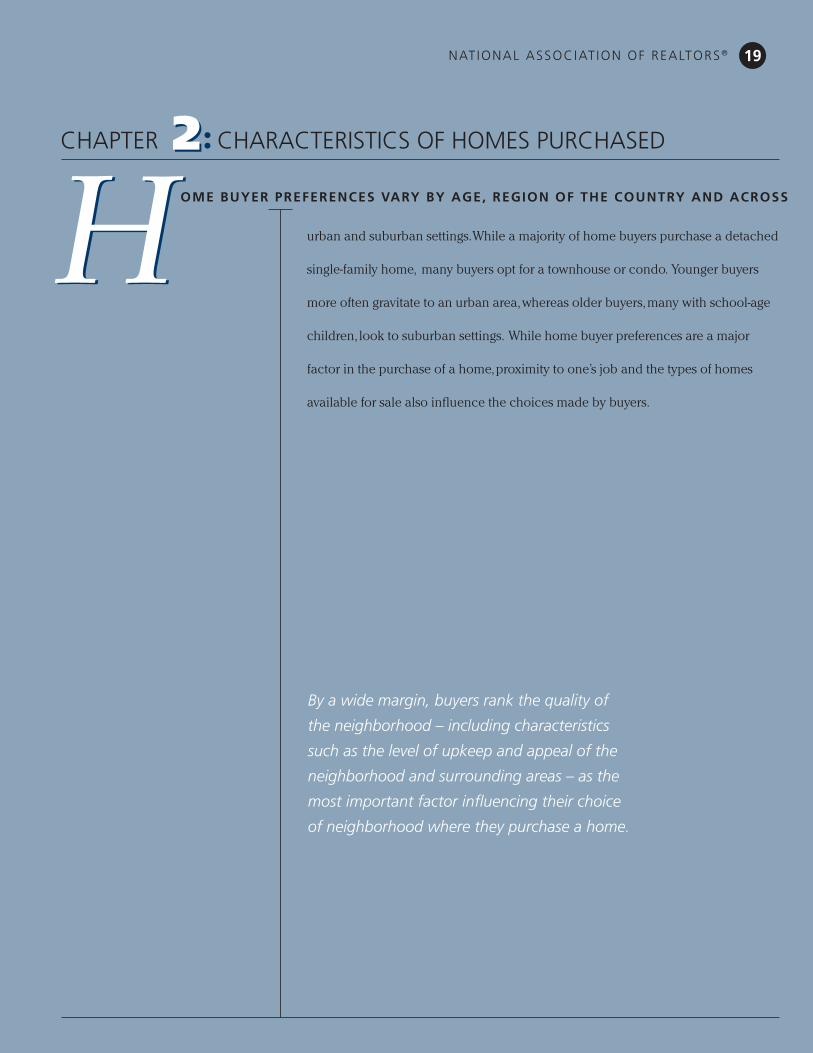
HHcHaPteR cHaRacteRistics of Homes PuRcHaseD
OME bUyER pREfERENcES VaRy by aGE, REGION Of THE cOUNTRy aNd acROSS
urban.and.suburban.settings..While.a.majority.of.home.buyers.purchase.a.detached.
single-family.home,..many.buyers.opt.for.a.townhouse.or.condo...Younger.buyers.
more.often.gravitate.to.an.urban.area,.whereas.older.buyers,.many.with.school-age.
children,.look.to.suburban.settings...While.home.buyer.preferences.are.a.major.
factor.in.the.purchase.of.a.home,.proximity.to.one’s.job.and.the.types.of.homes.
available.for.sale.also.influence.the.choices.made.by.buyers..
22
By a wide margin, buyers rank the quality of
the neighborhood – including characteristics
such as the level of upkeep and appeal of the
neighborhood and surrounding areas – as the
most important factor influencing their choice
of neighborhood where they purchase a home.
19NatioNal associat ioN of RealtoRs ®

2006 PRof ile of Home BuyeRs & selleRs
NEW aNd pREVIOUSly OWNEd HOMES
New.home.construction.is.an.
important.part.of.the.residential.real.
estate.market...As.demographic.patterns.
shift.and.households.relocate,.homes.
will.be.built.to.accommodate.new.
households..Nationally,.the.share.of.
new.homes.purchased.has.remained.
at.slightly.over.20.percent.for.a.
number.of.years..In.2006,.22.percent.
of.recent.home.buyers.reported.that.
they.purchased.a.new.home,.while.
the.remaining.78.percent.of.buyers.
purchased.a.previously.owned.home.
Exhibit 2-1
NEW aNd pREVIOUSly OWNEd HOMES pURcHaSEd, 1995-2006(Percentage Distribution)
78%76%82%
79% 79%
72%77%78%
22%22%24%18%
23%21%21%
28%
100%
1995 1997 1999
New Previously Owned
2001 2003 2004 2005 2006
80%
60%
40%
20%
0%
EXHIBIT 2-1
Exhibit 2-2
NEW aNd pREVIOUSly OWNEd HOMES pURcHaSEd, by REGION(Percentage Distribution)
all buyers Northeast Midwest South West
New 22% 13% 21% 26% 22%
Previously owned 78 87 79 74 78
REGIONal paTTERNSHome.buyers.in.the.South.
purchased.new.homes.more.frequently.
than.buyers.in.other.regions.of.the.
country...More.than.one-quarter.of.
homes.recently.purchased.in.the.
South.were.newly.built..About.one.in.
five.buyers.in.the.Midwest.and.West.
purchased.a.new.home..In.the.more.
densely.populated.Northeast,.where.
buildable.land.is.in.shorter.supply.and.
construction.costs.are.higher,.only.13.
percent.of.recent.home.sales.were.of.
newly.built.homes..
bUyERS WHO pURcHaSEd a HOME IN THE:
cHaPteR 2: cHaRacteRist ics of Homes PuRcHaseD
20

NatioNal associat ioN of RealtoRs ®
all buyers Northeast Midwest South West
New 22% 13% 21% 26% 22%
Previously owned 78 87 79 74 78
TypE Of HOME pURcHaSEdJust.as.the.share.of.new.and.existing.
homes.purchased.varies.by.region,.so.do.the.types.of.homes.buyers.in.each.region.purchase..Overall,.three-quarters.of.recent.home.sales.were.detached.single-family.homes...Some.of.the.regional.purchase.patterns.reflect.buyer.preferences,.but.they.also.are.affected.by.differences.in.the.composition.of.the.local.housing.stock...Buyers.in.the.Northeast,.for.example,.were.somewhat.less.likely.than.buyers.in.other.regions.to.purchase.a.detached.single-family.home;.about.one.in.10.homes.purchased.were.townhouses.or.row.houses,.and.about.one.in.10.were.condos.in.buildings.with.five.or.more.
units..
HOMES Of fIRST-TIME aNd REpEaT bUyER
First-time.and.repeat.buyers.also.have.different.preferences.and.purchase.patterns...For.example,.66.percent.of.first-time.buyers.purchased.a.detached.single-family.home,.compared.with.80.percent.of.repeat.buyers..Since.detached.single-family.homes.are.frequently.more.costly.than.other.types.of.homes,.some.of.this.difference.reflects.the.more.limited.financial.resources.of.many.first-time.buyers...Instead,.first-time.buyers.were.nearly.twice.as.likely.to.purchase.a.townhouse,.row.house.or.condo.in.a.
building.with.five.or.more.units..
Exhibit 2-4
TypE Of HOME pURcHaSEd by fIRST-TIME aNd REpEaT bUyERS(Percentage Distribution)
all buyers first-time buyers Repeat buyers
Detached single-family home 75% 66% 80%
townhouse/row house 9 13 7
apartment/condo in building with 5 or more units
8 11 6
Duplex/apartment/condo in 2 to 4 unit building
3 3 3
other 5 6 4
Exhibit 2-3
TypE Of HOME pURcHaSEd, by REGION(Percentage Distribution)
all buyers Northeast Midwest South West
Detached single-family home 75% 70% 77% 76% 75%
townhouse/row house 9 11 8 10 8
apartment/condo in building with 5 or more units
8 8 8 7 10
Duplex/apartment/condo in 2 to 4 unit building
3 5 4 2 2
other 5 5 3 6 5
bUyERS WHO pURcHaSEd a HOME IN THE:
21
2006 PRof ile of Home BuyeRs & selleRs
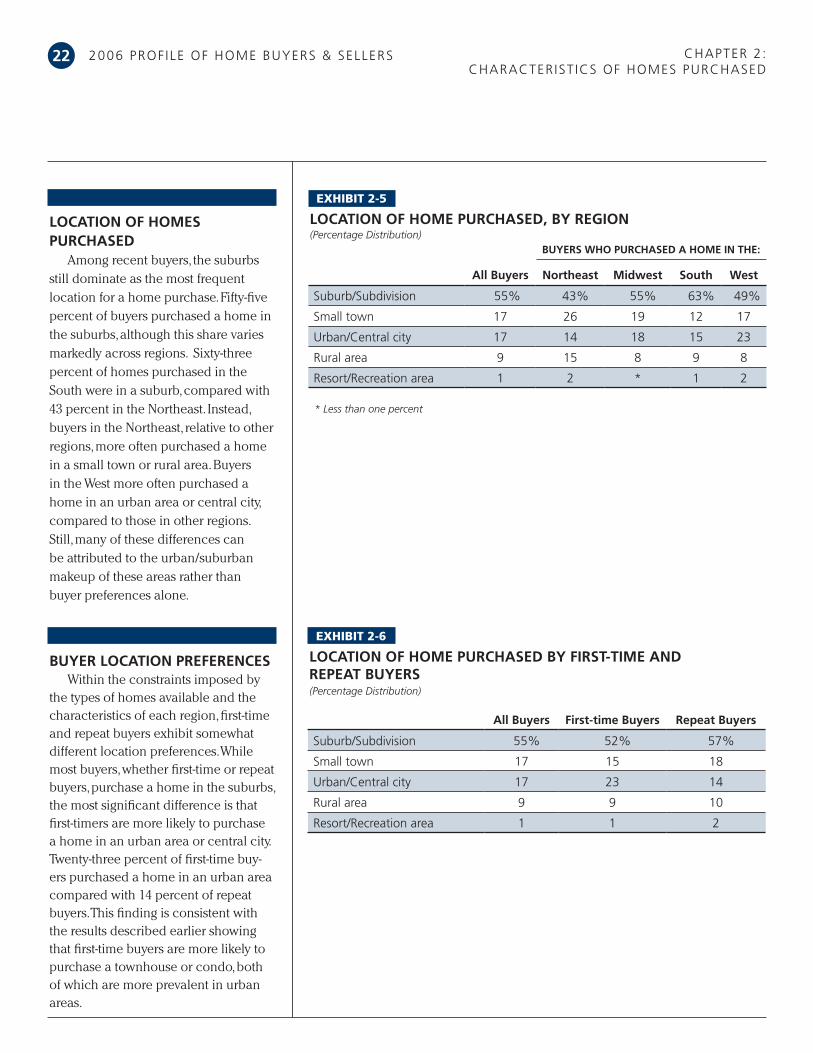
lOcaTION Of HOMES pURcHaSEd
Among.recent.buyers,.the.suburbs.still.dominate.as.the.most.frequent.location.for.a.home.purchase..Fifty-five.percent.of.buyers.purchased.a.home.in.the.suburbs,.although.this.share.varies.markedly.across.regions...Sixty-three.percent.of.homes.purchased.in.the.South.were.in.a.suburb,.compared.with.43.percent.in.the.Northeast..Instead,.buyers.in.the.Northeast,.relative.to.other.regions,.more.often.purchased.a.home.in.a.small.town.or.rural.area..Buyers.in.the.West.more.often.purchased.a.home.in.an.urban.area.or.central.city,.compared.to.those.in.other.regions..Still,.many.of.these.differences.can.be.attributed.to.the.urban/suburban.makeup.of.these.areas.rather.than.buyer.preferences.alone.
all buyers first-time buyers Repeat buyers
suburb/subdivision 55% 52% 57%
small town 17 15 18
urban/central city 17 23 14
Rural area 9 9 10
Resort/Recreation area 1 1 2
Exhibit 2-6
lOcaTION Of HOME pURcHaSEd by fIRST-TIME aNd REpEaT bUyERS(Percentage Distribution)
Exhibit 2-5
lOcaTION Of HOME pURcHaSEd, by REGION(Percentage Distribution)
all buyers Northeast Midwest South West
suburb/subdivision 55% 43% 55% 63% 49%
small town 17 26 19 12 17
urban/central city 17 14 18 15 23
Rural area 9 15 8 9 8
Resort/Recreation area 1 2 * 1 2
* Less than one percent
bUyERS WHO pURcHaSEd a HOME IN THE:
bUyER lOcaTION pREfERENcESWithin.the.constraints.imposed.by.
the.types.of.homes.available.and.the.characteristics.of.each.region,.first-time.and.repeat.buyers.exhibit.somewhat.different.location.preferences..While.most.buyers,.whether.first-time.or.repeat.buyers,.purchase.a.home.in.the.suburbs,.the.most.significant.difference.is.that.first-timers.are.more.likely.to.purchase.a.home.in.an.urban.area.or.central.city..Twenty-three.percent.of.first-time.buy-ers.purchased.a.home.in.an.urban.area.compared.with.14.percent.of.repeat.buyers..This.finding.is.consistent.with.the.results.described.earlier.showing.that.first-time.buyers.are.more.likely.to.purchase.a.townhouse.or.condo,.both.of.which.are.more.prevalent.in.urban.areas...
22 cHaPteR 2: cHaRacteRist ics of Homes PuRcHaseD

NatioNal associat ioN of RealtoRs ®
cHaNGES IN lOcaTIONFor.those.buyers.who.also.sold.a.
home,.most.purchase.a.home.in.the.same.type.of.location.as.their.previous.home..For.example,.40.percent.of.buyers.sold.a.home.in.the.suburbs.and.also.purchased.a.home.located.in.the.suburbs..
Exhibit 2-7
lOcaTION Of HOME pURcHaSEd VERSUS lOcaTION Of HOME SOld(Percentage Distribution Among those that Sold a Home)
Suburb/ Subdivision
Small town
Urban/ central
cityRural area
Resort/ Recreation
area
suburb/subdivision 40% 5% 3% 4% 1%
small town 4 7 1 1 *
urban area/central city 8 3 7 2 *
Rural area 4 3 1 3 *
Resort/Recreation area 1 * * * *
lOcaTION Of HOME SOld
lOcaTION Of HOME pURcHaSEd
*Less than one percent
dISTaNcE fROM pREVIOUS HOME
Recent.buyers.moved.a.median.of.13.miles...Buyers.in.the.Northeast.tended.to.move.the.shortest.distance.from.their.previous.residence.(a.median.of.10.miles),.while.buyers.in.the.South.moved.the.greatest.distance.(a.median.of.15.miles)..
13
10
12
15
12
0
2
4
6
8
10
12
14
16
18
20
U.S. Northeast Midwest South West
Exhibit 2-8
dISTaNcE bETWEEN HOME pURcHaSEd aNd pREVIOUS RESIdENcE(Median Miles)
23

2006 PRof ile of Home BuyeRs & selleRs
NEIGHbORHOOd cHOIcEThere.are.a.number.of.factors.that.
determine.the.specific.location.where.buyers.purchase.a.home...Some.of.these.reflect.constraints.such.as.the.location.of.a.buyer’s.job,.whether.or.not.there.are.school-age.children.present.in.the.home,.and.the.financial.resources.a.buyer.has.to.devote.to.the.purchase.of.a.home...By.a.wide.margin,.buyers.rank.the.quality.of.the.neighborhood.–.including.characteristics.such.as.the.level.of.upkeep.and.appeal.of.the.neighborhood.and.surrounding.areas.–.as.the.most.important.factor.influencing.their.choice.of.neighborhood.where.they.purchase.a.home..A.convenient.location.near.the.home.buyer’s.job.was.ranked.as.the.next.most.important.feature,.followed.by.convenience.of.the.location.to.friends.and.family..
Buyers.choose.different.locations.for.a.variety.of.reasons,.however..Urban.buyers.were.more.likely.to.rank.convenience.to.their.job.and.to.shopping.as.more.important.characteristics.of.a.neighborhood.than.buyers.in.a.small.town.or.rural.area..The.quality.of.the.school.district.was.less.important.in.neighborhood.choice.for.urban.and.resort.buyers.than.suburban.buyers..
Exhibit 2-9
facTORS INflUENcING NEIGHbORHOOd cHOIcE, by lOcaTION(Percent of Respondents)
all buyers
Suburb/ Subdivision
Small town
Urban/ central
cityRural area
Resort/ Recreation
area
Quality of the neighborhood
63% 69% 60% 57% 51% 55%
convenient to job 48 49 42 54 40 32
convenient to friends/family
36 36 39 38 28 43
Design of neighborhood
28 31 27 25 21 33
convenient to shopping
28 31 22 30 15 33
Quality of the school district
27 32 24 13 25 16
convenient to schools
19 21 20 15 17 12
convenient to entertainment/leisure activities
19 19 12 33 9 42
convenient to parks/recreational facilities
16 15 14 23 8 31
convenient to health facilities
11 12 11 10 6 24
Home in a planned community
11 13 10 5 6 24
convenient to airport
7 8 4 9 3 15
convenient to public transportation
7 5 4 17 2 6
other 9 7 11 8 23 10
bUyERS WHO pURcHaSEd a HOME IN a:
24 cHaPteR 2: cHaRacteRist ics of Homes PuRcHaseD
NatioNal associat ioN of RealtoRs ® 25
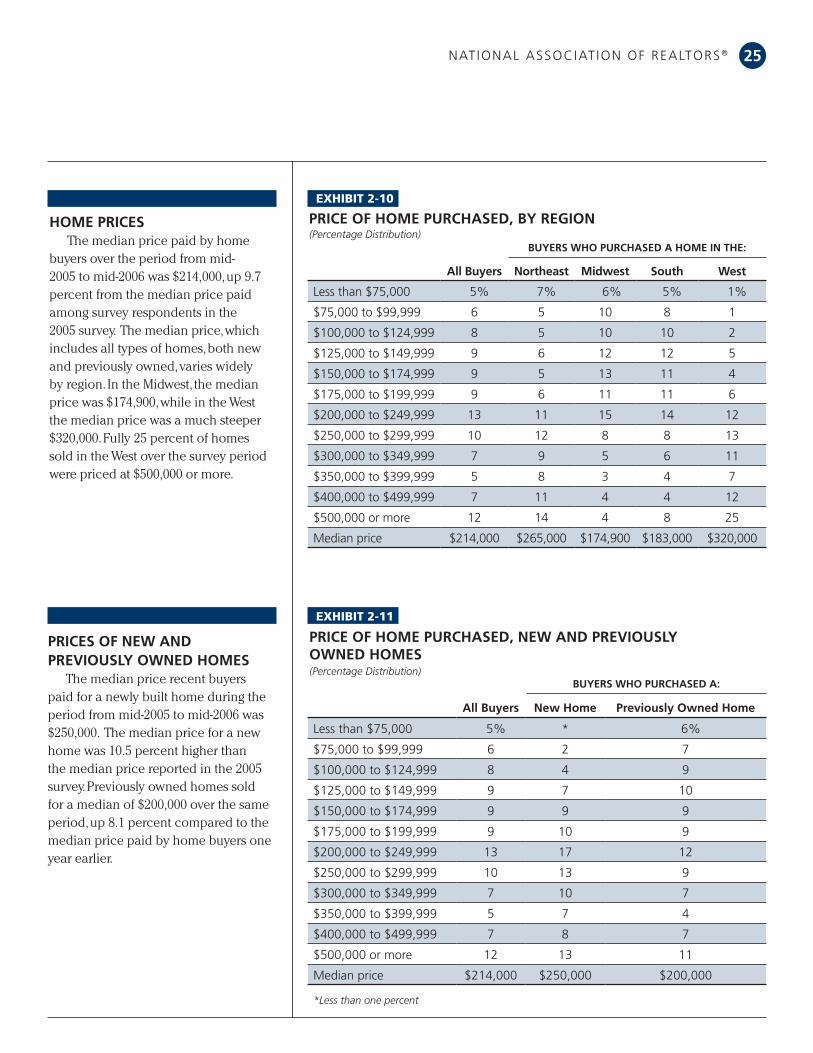
HOME pRIcESThe.median.price.paid.by.home.
buyers.over.the.period.from.mid-2005.to.mid-2006.was.$214,000,.up.9.7.percent.from.the.median.price.paid.among.survey.respondents.in.the.2005.survey...The.median.price,.which.includes.all.types.of.homes,.both.new.and.previously.owned,.varies.widely.by.region..In.the.Midwest,.the.median.price.was.$174,900,.while.in.the.West.the.median.price.was.a.much.steeper.$320,000..Fully.25.percent.of.homes.sold.in.the.West.over.the.survey.period.were.priced.at.$500,000.or.more.
Exhibit 2-10
pRIcE Of HOME pURcHaSEd, by REGION(Percentage Distribution)
all buyers Northeast Midwest South West
less than $75,000 5% 7% 6% 5% 1%
$75,000 to $99,999 6 5 10 8 1
$100,000 to $124,999 8 5 10 10 2
$125,000 to $149,999 9 6 12 12 5
$150,000 to $174,999 9 5 13 11 4
$175,000 to $199,999 9 6 11 11 6
$200,000 to $249,999 13 11 15 14 12
$250,000 to $299,999 10 12 8 8 13
$300,000 to $349,999 7 9 5 6 11
$350,000 to $399,999 5 8 3 4 7
$400,000 to $499,999 7 11 4 4 12
$500,000 or more 12 14 4 8 25
median price $214,000 $265,000 $174,900 $183,000 $320,000
bUyERS WHO pURcHaSEd a HOME IN THE:
bUyERS WHO pURcHaSEd a:
Exhibit 2-11
pRIcE Of HOME pURcHaSEd, NEW aNd pREVIOUSly OWNEd HOMES(Percentage Distribution)
all buyers New Home previously Owned Home
less than $75,000 5% * 6%
$75,000 to $99,999 6 2 7
$100,000 to $124,999 8 4 9
$125,000 to $149,999 9 7 10
$150,000 to $174,999 9 9 9
$175,000 to $199,999 9 10 9
$200,000 to $249,999 13 17 12
$250,000 to $299,999 10 13 9
$300,000 to $349,999 7 10 7
$350,000 to $399,999 5 7 4
$400,000 to $499,999 7 8 7
$500,000 or more 12 13 11
median price $214,000 $250,000 $200,000
*Less than one percent
pRIcES Of NEW aNd pREVIOUSly OWNEd HOMES
The.median.price.recent.buyers.paid.for.a.newly.built.home.during.the.period.from.mid-2005.to.mid-2006.was.$250,000...The.median.price.for.a.new.home.was.10.5.percent.higher.than.the.median.price.reported.in.the.2005.survey..Previously.owned.homes.sold.for.a.median.of.$200,000.over.the.same.period,.up.8.1.percent.compared.to.the.median.price.paid.by.home.buyers.one.year.earlier..

2006 PRof ile of Home BuyeRs & selleRs cHaPteR 2: cHaRacteRist ics of Homes PuRcHaseD
26
HOME pRIcE Of fIRST-TIME aNd REpEaT bUyERS
First-time.buyers.generally.purchase.less-expensive.homes.than.repeat.buyers..Over.the.most.recent.survey.period,.the.median.price.paid.by.first-time.buyers.was.$165,000,.versus.
$249,000.among.repeat.buyers..
Exhibit 2-12
pRIcE Of HOME pURcHaSEd, fIRST-TIME aNd REpEaT bUyERS(Percentage Distribution)
all buyers first-time buyers Repeat buyers
less than $75,000 5% 8% 3%
$75,000 to $99,999 6 11 4
$100,000 to $124,999 8 12 5
$125,000 to $149,999 9 13 7
$150,000 to $174,999 9 11 8
$175,000 to $199,999 9 9 9
$200,000 to $249,999 13 12 14
$250,000 to $299,999 10 8 11
$300,000 to $349,999 7 5 9
$350,000 to $399,999 5 3 6
$400,000 to $499,999 7 5 8
$500,000 or more 12 5 16
median price $214,000 $165,000 $249,000
Exhibit 2-13
pURcHaSE pRIcE cOMpaREd WITH aSKING pRIcE, by REGION(Percentage Distribution)
pURcHaSE pRIcE aNd aSKING pRIcE
In.most.cases.the.purchase.price.and.the.asking.price.of.a.home.differ...In.weak.markets,.sellers.may.have.to.lower.their.asking.price,.while.in.strong.markets.several.competing.bids.may.lead.to.a.final.purchase.price.in.excess.of.the.asking.price..Overall,.32.percent.of.homes.were.purchased.at.the.asking.price,.while.13.percent.sold.for.more.than.the.asking.price..However,.differences.emerge.when.comparing.price.patterns.across.regions...In.the.Midwest,.one-fourth.of.homes.sold.for.the.asking.price.and.9.percent.sold.for.more.than.the.asking.price,.while.in.the.West,.37.percent.sold.at.the.asking.price.
and.19.percent.sold.for.more..
percent of asking price: all buyers Northeast Midwest South West
less than 90% 8% 10% 10% 7% 5%
90% to 94% 13 17 16 12 9
95% to 99% 34 35 40 34 30
100% 32 28 25 35 37
101% to 110% 11 9 7 11 16
more than 110% 2 2 2 2 3
median (purchase price as a percent of asking price)
99% 98% 98% 99% 100%
bUyERS WHO pURcHaSEd a HOME IN THE:

NatioNal associat ioN of RealtoRs ® 27
HOME SIZEThe.typical.home.purchased.
was.1,815.square.feet.in.size..Homes.purchased.by.first-time.buyers.are.typically.smaller,.in.part.because.first-time.buyers.are.more.likely.to.purchase.condos.or.townhouses.than.detached.single-family.homes..Among.recent.first-time.buyers,.the.home.they.purchased.was.typically.1,516.square.feet.in.size,.while.repeat.buyers.purchased.a.somewhat.larger.home.that.was.a.
median.1,993.square.feet.
Exhibit 2-14
SIZE Of HOME pURcHaSEd, fIRST-TIME aNd REpEaT bUyERS(Percentage Distribution)
SIZE aNd cOSTA.home’s.cost.per.square.foot.varies.
by.type.of.home.and.by.region...Among.all.homes.purchased,.regardless.of.type,.the.median.price.per.square.foot.was.$118,.ranging.from.$187.per.square.foot.in.the.West.to.$98.per.square.foot.in.the.South...Some.of.this.variation.is.attributable.to.differences.in.the.mix.of.housing.types..On.a.square-foot.basis,.condos.in.buildings.with.at.least.five.units.were.the.most.costly,.while.detached.single-family.homes.were.the.least.costly...Detached.single-family.homes.in.the.South.tended.to.be.larger.and.less.costly;.they.were.just.over.half.the.cost.per.square.foot.of.a.slightly.smaller.home.in.the.West,.for.example...The.largest.variation.in.cost.per.square.foot.was.among.condos.in.buildings.with.at.least.five.units...The.typical.unit.in.the.West.was.approximately.25.percent.smaller.than.the.median.size.unit.in.the.Midwest,.but.more.than.
twice.the.price.per.square.foot..
all buyers first-time buyers Repeat buyers
1,000 sq ft or less 8% 14% 4%
1,001 to 1,500 sq ft 24 35 18
1,501 to 2,000 sq ft 30 31 29
2,001 to 2,500 sq ft 17 11 21
2,501 to 3,000 sq ft 10 5 13
3,001 to 3,500 sq ft 6 2 8
3,501 sq ft or more 6 2 8
median (sq ft) 1,815 1,516 1,993
Exhibit 2-15
HOME SIZE aNd pRIcE pER SQUaRE fOOT, by REGION(Median)
all buyers Northeast Midwest South West
all homes purchased
square feet 1,815 1,804 1,789 1,865 1,753
Price per square foot $118 $144 $104 $98 $187
detached single-family home
square feet 1,928 1,884 1,884 1,984 1,896
Price per square foot $112 $140 $101 $94 $180
Townhouse or row house
square feet 1,629 1,725 1,617 1,658 1,452
Price per square foot $136 $131 $120 $131 $219
duplex/apartment/condo in 2-4 unit building
square feet 1,587 1,751 1,577 1,589 1,334
Price per square foot $129 $143 $121 $121 $185
apartment/condo in building with 5 or more units
square feet 1,151 1,266 1,295 1,175 963
Price per square foot $189 $203 $123 $172 $296
bUyERS WHO pURcHaSEd a HOME IN THE:

2006 PRof ile of Home BuyeRs & selleRs28 cHaPteR 2: cHaRacteRist ics of Homes PuRcHaseD
MaKING cOMpROMISESHome.buyers.must.weigh.many.
factors.and.consider.trade-offs.that.make.one.home.more.or.less.desirable.than.another...The.most.frequent.compromise.that.buyers.reported.is.on.the.size.of.the.home..One.in.five.buyers.nationally.reported.compromising.on.the.size.of.their.home;.among.urban.buyers.26.percent.adjusted.their.expectations.on.home.size..The.price.of.the.home.was.the.next.most.cited.compromise,.especially.in.resort.and.urbans.areas.where.home.prices.are.often.much.higher...Urban.buyers.were.less.likely.than.buyers.in.other.areas.to.make.compromises.involving.distance.from.their.job,.while.rural.buyers.more.often.cited.distance.from.family.or.friends.as.a.compromise.they.made..Overall,.36.percent.of.buyers.reported.that.they.made.no.compromises.when.
purchasing.a.home.
Exhibit 2-16
cHaRacTERISTIcS Of HOME ON WHIcH bUyER cOMpROMISEd, by lOcaTION(Percent of Respondents)
all buyers
Suburb/ Subdivision
Small town
Urban/ central
cityRural area
Resort/ Recreation
area
size of home 19% 17% 18% 26% 18% 18%
Planned expenditures/ price of home
17 17 17 21 14 22
condition of home 15 13 17 19 16 11
lot size 14 14 15 13 17 12
style of home 14 13 13 16 14 11
Distance from job 13 13 12 8 18 11
Quality of the neighborhood
7 5 7 12 5 6
Distance from friends or family
7 6 6 5 12 8
Quality of the schools
3 3 2 4 3 5
Distance from school 2 2 1 1 3 3
other compromises not listed
6 6 6 6 9 7
None – made no compromises
36 37 37 32 33 41
bUyERS WHO pURcHaSEd a HOME IN a:

NatioNal associat ioN of RealtoRs ® 29
all buyers first-time buyers Repeat buyers
size of home 19% 24% 16%
Planned expenditures/ price of home
17 18 17
condition of home 15 16 15
lot size 14 13 15
style of home 14 16 13
Distance from job 13 16 11
Quality of the neighborhood 7 9 5
Distance from friends or family 7 8 6
Quality of the schools 3 4 3
Distance from school 2 2 1
other compromises not listed 6 5 6
None – made no compromises 36 32 37
Exhibit 2-17
cHaRacTERISTIcS Of HOME ON WHIcH bUyER cOMpROMISEd, fIRST-TIME aNd REpEaT bUyERS(Percent of Respondents)
cOMpROMISES by fIRST-TIME aNd REpEaT bUyERS
Given.the.varying.financial.resources,.preferences.and.demographic.characteristics.of.first-time.and.repeat.buyers,.it.is.not.surprising.that.differences.emerge.in.the.trade-offs.these.buyers.are.willing.to.make..One-quarter.of.first-time.buyers.compromised.on.the.size.of.their.homes.compared.with.16.percent.of.repeat.buyers..Nearly.equal.percentages.of.first-time.and.repeat.buyers.compromised.on.the.price.of.their.homes...First-time.buyers.were.somewhat.more.willing.than.repeat.buyers.to.compromise.on.the.home’s.style,.the.distance.from.work.and.the.quality.of.the.neighborhood..Thirty-two.percent.of.first-time.buyers.reported.that.they.made.no.compromises,.compared.with.37.percent.of.repeat.
buyers.
EXpEcTEd lENGTH Of TENUREBuyers.purchase.a.home.with.
various.expectations.about.how.long.they.will.own.that.home..First-time.buyers.may.plan.to.own.a.home.for.a.shorter.period.of.time.than.repeat.buyers.while.those.with.jobs.subject.to.relocation.may.have.a.shorter.time.horizon.than.buyers.with.a.more.predictable.employment.outlook..Overall,.recent.home.buyers.reported.that.they.expect.to.stay.in.the.home.they.purchased.a.median.of.eight.years..One-quarter.are.uncertain,.while.one.in.five.plans.to.remain.in.their.home.for.at.least.16.years..The.median.expected.tenure.among.first-time.buyers.is.six.years,.while.repeat.buyers.plan.to.remain.in.their.home.a.somewhat.longer.period.of.nine.years..
(Percentage Distribution)
Exhibit 2-18
EXpEcTEd lENGTH Of TENURE IN HOME pURcHaSEd, fIRST-TIME aNd REpEaT bUyERS
all buyers first-time buyers Repeat buyers
1 year or less 1% 1% 1%
2 to 3 years 11 14 10
4 to 5 years 18 25 14
6 to 7 years 7 8 7
8 to 10 years 12 11 13
11 to 15 years 6 4 7
16 or more years 20 16 22
Don’t Know 24 20 26
median (years) 8 6 9
2006 PRof ile of Home BuyeRs & selleRs cHaPteR 2: cHaRacteRist ics of Homes PuRcHaseD
Exhibit 2-19
30
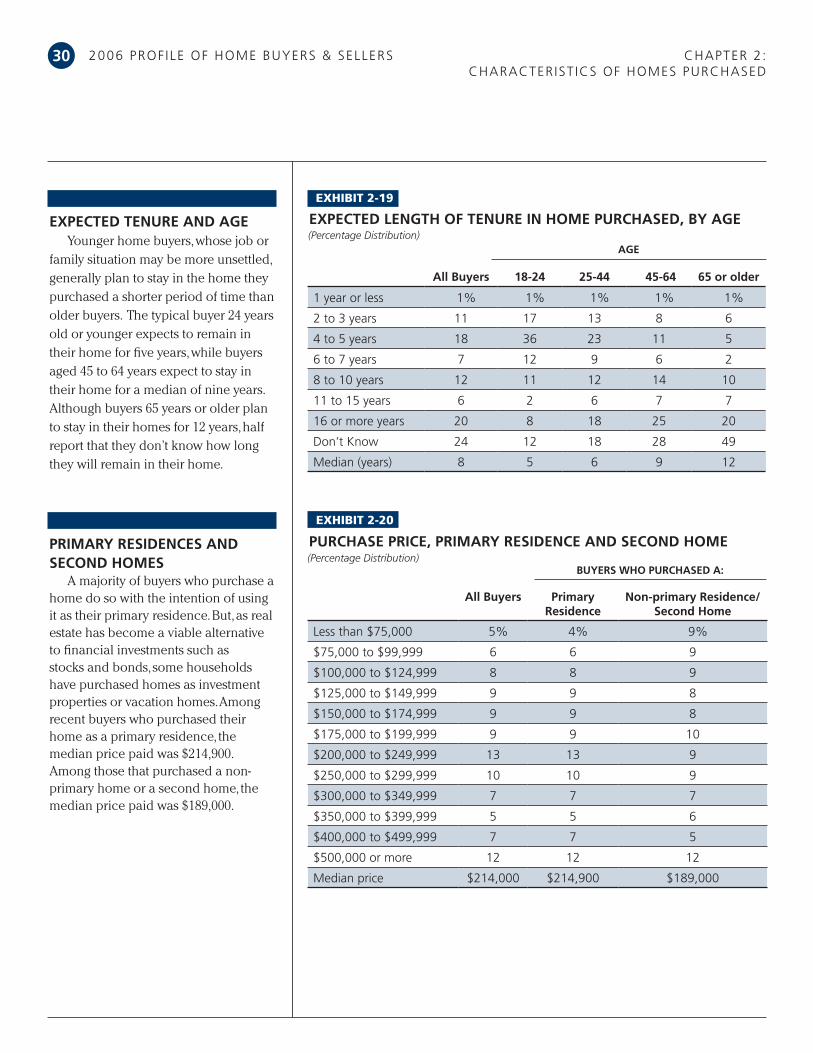
EXpEcTEd lENGTH Of TENURE IN HOME pURcHaSEd, by aGEEXpEcTEd TENURE aNd aGEYounger.home.buyers,.whose.job.or.
family.situation.may.be.more.unsettled,.generally.plan.to.stay.in.the.home.they.purchased.a.shorter.period.of.time.than.older.buyers...The.typical.buyer.24.years.old.or.younger.expects.to.remain.in.their.home.for.five.years,.while.buyers.aged.45.to.64.years.expect.to.stay.in.their.home.for.a.median.of.nine.years..Although.buyers.65.years.or.older.plan.to.stay.in.their.homes.for.12.years,.half.report.that.they.don’t.know.how.long.they.will.remain.in.their.home.
(Percentage Distribution)
all buyers 18-24 25-44 45-64 65 or older
1 year or less 1% 1% 1% 1% 1%
2 to 3 years 11 17 13 8 6
4 to 5 years 18 36 23 11 5
6 to 7 years 7 12 9 6 2
8 to 10 years 12 11 12 14 10
11 to 15 years 6 2 6 7 7
16 or more years 20 8 18 25 20
Don’t Know 24 12 18 28 49
median (years) 8 5 6 9 12
aGE
pRIMaRy RESIdENcES aNd SEcONd HOMES
A.majority.of.buyers.who.purchase.a.home.do.so.with.the.intention.of.using.it.as.their.primary.residence..But,.as.real.estate.has.become.a.viable.alternative.to.financial.investments.such.as.stocks.and.bonds,.some.households.have.purchased.homes.as.investment.properties.or.vacation.homes..Among.recent.buyers.who.purchased.their.home.as.a.primary.residence,.the.median.price.paid.was.$214,900..Among.those.that.purchased.a.non-primary.home.or.a.second.home,.the.median.price.paid.was.$189,000.
(Percentage Distribution)
Exhibit 2-20
pURcHaSE pRIcE, pRIMaRy RESIdENcE aNd SEcONd HOME
all buyers primary Residence
Non-primary Residence/ Second Home
less than $75,000 5% 4% 9%
$75,000 to $99,999 6 6 9
$100,000 to $124,999 8 8 9
$125,000 to $149,999 9 9 8
$150,000 to $174,999 9 9 8
$175,000 to $199,999 9 9 10
$200,000 to $249,999 13 13 9
$250,000 to $299,999 10 10 9
$300,000 to $349,999 7 7 7
$350,000 to $399,999 5 5 6
$400,000 to $499,999 7 7 5
$500,000 or more 12 12 12
median price $214,000 $214,900 $189,000
bUyERS WHO pURcHaSEd a:
Exhibit 2-19

NatioNal associat ioN of RealtoRs ® 31
TypES Of pRIMaRy RESIdENcES aNd SEcONd HOMES
Some.of.the.price.difference.between.homes.purchased.as.a.primary.residence.and.those.purchased.as.a.second.home.is.attributable.to.the.type.of.home.purchased..Over.three-quarters.of.homes.purchased.as.primary.residences.were.detached.single-family.homes,.compared.with.61.percent.of.second.homes..Condos.and.townhouses.account.for.a.higher.share.of.second.home.purchases.than.
primary.residences.
bUyERS WHO pURcHaSEd a:
TypE Of HOME, pRIMaRy RESIdENcE aNd SEcONd HOME(Percentage Distribution)
Exhibit 2-21
lOcaTION Of HOME, pRIMaRy RESIdENcE aNd SEcONd HOMElOcaTION Of pRIMaRy RESIdENcES aNd SEcONd HOMES
Primary.residences.and.second-homes.are.most.often.located.in.the.suburbs..However,.second.homes.are.more.likely.to.be.located.in.urban.areas.or.resort.locations.than.primary.residences..In.both.cases,.condos.are.a.popular.choice,.which.is.consistent.with.survey.findings.showing.a.higher.share.of.condo.purchases.among.second.home.buyers.than.among.buyers.of.primary.residences..
(Percentage Distribution)
Exhibit 2-22
all buyers
primary Residence
Non-primary Residence/ Second Home
Detached single-family home 75% 76% 61%
townhouse/row house 9 9 11
apartment/condo in building with 5 or more units
8 8 14
Duplex/apartment/condo in 2 to 4 unit building
3 3 5
other 5 5 9
bUyERS WHO pURcHaSEd a:
all buyers
primary Residence
Non-primary Residence/ Second Home
suburb/subdivision 55% 56% 49%
small town 17 17 16
urban/central city 17 17 21
Rural area 9 9 9
Resort/Recreation area 1 1 5

32
HHOME bUyERS caN TURN TO MaNy INfORMaTION SOURcES WHEN SEaRcHING
for.a.home...Real.estate.agents.and.the.Internet.are.two.of.the.most.often.used.and.
are.viewed.by.most.buyers.as.very.useful.when.searching.for.a.home..Buyers.most.
often.first.learn.about.the.home.they.purchase.through.a.real.estate.agent,.even.as.
a.growing.amount.of.home.buying.information.is.available.on.the.Internet..
cHaPteR tHe Home seaRcH PRocess33
2006 PRof ile of Home BuyeRs & selleRs
First-time buyers who used the Internet spent
a median of 10 weeks searching for a home,
somewhat longer than the typical Internet-using
repeat buyer who spent eight weeks.

NatioNal associat ioN of RealtoRs ® 33
lENGTH Of SEaRcHThe.typical.home.buyer.searched.
for.eight.weeks.and.viewed.nine.homes...The.length.of.search.and.the.number.of.homes.visited.has.varied.little.in.recent.years..On.a.regional.basis,.however,..buyers.in.the.Northeast.typically.searched.for.12.weeks,.50.percent.longer.than.buyers.in.other.regions...Although.buyers.in.the.West.searched.for.a.median.of.eight.weeks,.they.typically.saw.11.homes,.more.than.buyers.in.the.Northeast.with.a.longer.search.period.and.more.than.buyers.in.the.Midwest.and.South.who.searched.for.a.comparable.length.of.time..
Exhibit 3-1
SEaRcH acTIVITy Of HOME bUyERS, by REGION(Median)
bUyERS WHO pURcHaSEd a HOME IN THE:
Number of Weeks Searched all buyers Northeast Midwest South West
2001 7 7 7 7 7
2003 8 10 8 8 6
2004 8 12 8 8 8
2005 8 10 8 8 6
2006 8 12 8 8 8
Number of Homes Visited
2001 10 11 8 7 10
2003 10 9 10 9 12
2004 9 8 10 9 10
2005 9 8 11 9 9
2006 9 8 9 8 11
fIRST-TIME aNd REpEaT-bUyER SEaRcH
Both.first-time.and.repeat.buyers.searched.for.a.median.of.eight.weeks,.but.repeat.buyers.viewed.more.homes.during.that.period..The.typical.repeat.buyer.viewed.10.homes,.while.first-time.buyers.viewed.a.median.of.eight.homes..
Exhibit 3-2
SEaRcH acTIVITy Of fIRST-TIME aNd REpEaT bUyERS(Median)
12
10
8
6
4
2
0Number of Weeks Searched Number of Homes Visited
First-time Buyers Repeat Buyers
8 8 8
10
2006 PRof ile of Home BuyeRs & selleRs cHaPteR 3: tHe Home seaRcH PRocess34
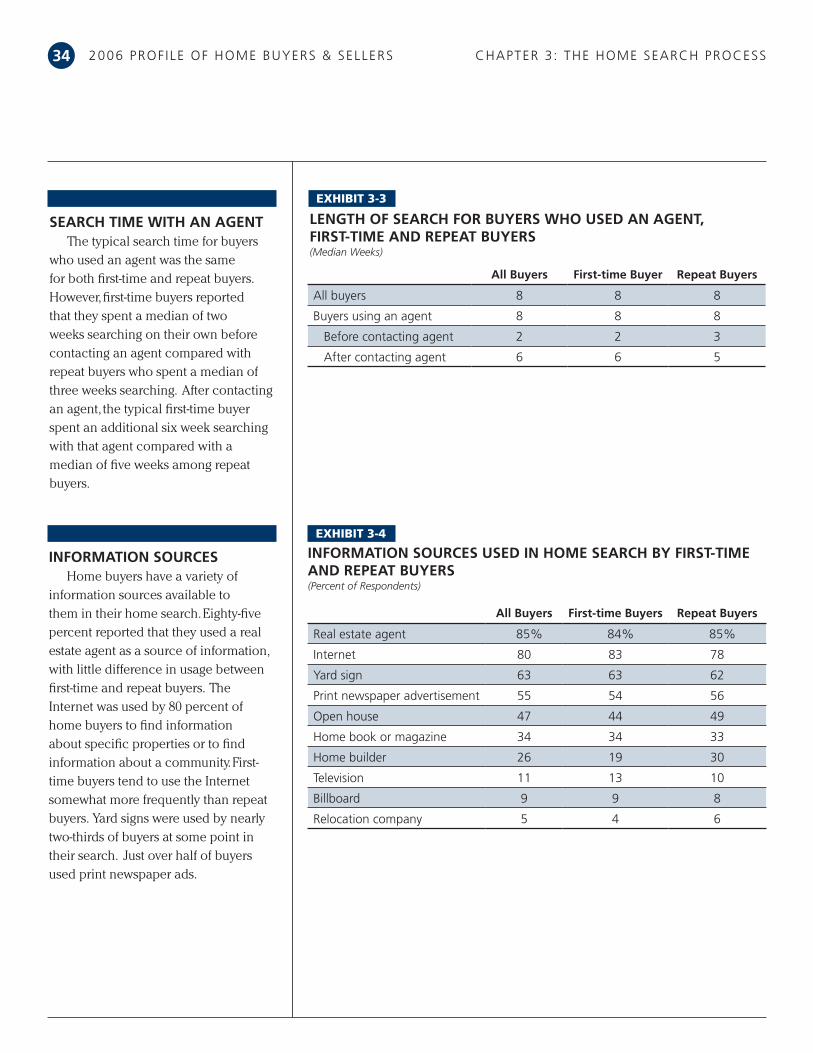
SEaRcH TIME WITH aN aGENTThe.typical.search.time.for.buyers.
who.used.an.agent.was.the.same.for.both.first-time.and.repeat.buyers..However,.first-time.buyers.reported.that.they.spent.a.median.of.two.weeks.searching.on.their.own.before.contacting.an.agent.compared.with.repeat.buyers.who.spent.a.median.of.three.weeks.searching...After.contacting.an.agent,.the.typical.first-time.buyer.spent.an.additional.six.week.searching.with.that.agent.compared.with.a.median.of.five.weeks.among.repeat.buyers..
Exhibit 3-3
lENGTH Of SEaRcH fOR bUyERS WHO USEd aN aGENT, fIRST-TIME aNd REpEaT bUyERS(Median Weeks)
all buyers first-time buyer Repeat buyers
all buyers 8 8 8
Buyers using an agent 8 8 8
Before contacting agent 2 2 3
after contacting agent 6 6 5
INfORMaTION SOURcESHome.buyers.have.a.variety.of.
information.sources.available.to.them.in.their.home.search..Eighty-five.percent.reported.that.they.used.a.real.estate.agent.as.a.source.of.information,.with.little.difference.in.usage.between.first-time.and.repeat.buyers...The.Internet.was.used.by.80.percent.of.home.buyers.to.find.information.about.specific.properties.or.to.find.information.about.a.community..First-time.buyers.tend.to.use.the.Internet.somewhat.more.frequently.than.repeat.buyers...Yard.signs.were.used.by.nearly.two-thirds.of.buyers.at.some.point.in.their.search...Just.over.half.of.buyers.used.print.newspaper.ads.
Exhibit 3-4
INfORMaTION SOURcES USEd IN HOME SEaRcH by fIRST-TIME aNd REpEaT bUyERS(Percent of Respondents)
all buyers first-time buyers Repeat buyers
Real estate agent 85% 84% 85%
internet 80 83 78
yard sign 63 63 62
Print newspaper advertisement 55 54 56
open house 47 44 49
Home book or magazine 34 34 33
Home builder 26 19 30
television 11 13 10
Billboard 9 9 8
Relocation company 5 4 6

NatioNal associat ioN of RealtoRs ®
Exhibit 3-5
USEfUlNESS Of INfORMaTION SOURcES(Percentage Distribution Among Buyers that Used Each Source)
Very Useful Somewhat Useful Not Useful
internet 73% 25% 2%
Real estate agent 69 20 11
yard sign 31 40 30
open house 22 30 48
Print newspaper advertisement 20 37 43
Home builder 15 17 68
Home book or magazine 11 24 65
Billboard 3 9 88
television 3 13 85
Relocation company 2 7 91
35
fREQUENcy Of INTERNET USaGE
Some.home.buyers.use.the.Internet.as.a.resource.more.frequently.than.others..Overall,.59.percent.of.home.buyers.noted.that.they.used.the.Internet.frequently.while.an.additional.21.percent.reported.that.they.used.it.occasionally...Buyers.in.the.Northeast.and.Midwest.used.the.Internet.more.intensively.than.buyers.in.other.regions...In.contrast,.buyers.in.the.South.and.West.used.the.Internet.less.intensively,.although.the.share.who.used.the.Internet.at.all.was.consistent.with.other.regions..
Exhibit 3-6
USE Of INTERNET TO SEaRcH fOR HOMES, by REGION(Percentage Distribution)
all buyers Northeast Midwest South West
frequently 59% 63% 61% 57% 56%
occasionally 21 19 19 22 25
Not at all 20 18 19 21 19
lOcaTION Of HOME pURcHaSEd:
USEfUlNESS Of INfORMaTION SOURcES
Seventy-three.percent.of.buyers.rated.the.Internet.as.very.useful.with.an.additional.25.percent.rating.it.somewhat.useful..Real.estate.agents.were.viewed.as.a.very.useful.information.source.by.69.percent.of.buyers..No.other.information.sources.were.considered.“very.useful”.by.more.than.half.of.home.buyers..

2006 PRof ile of Home BuyeRs & selleRs cHaPteR 3: tHe Home seaRcH PRocess36
INTERNET USaGE aNd bUyER aGE
Home.buyer.use.of.the.Internet.varies.considerably.by.age,.with.younger.home.buyers.using.it.more.frequently.than.older.buyers..Sixty-nine.percent.of.home.buyers.44.years.old.or.younger.reported.that.they.used.the.Internet.frequently.in.their.home.search..About.half.of.buyers.45.to.64.years.of.age.used.the.Internet.frequently,.while.only.one.in.five.buyers.65.or.older.used.it.frequently..
Frequently Occasionally
Exhibit 3-8
USE Of INTERNET TO SEaRcH fOR HOMES, by aGE
60%
50%
40%
30%
20%
10%
0%18-24
87% 87%
76%
44%
70%
80%
90%
100%
25-44 45-64 65 or older
69% 69%
18% 18%
49%
27%
23%
21%
fIRST-TIME bUyERS’ INTERNET USaGE
First-time.buyers.use.the.Internet.more.often.and.also.more.frequently.than.repeat.buyers..While.83.percent.of.first-time.buyers.used.the.Internet,.62.percent.report.that.they.used.it.frequently..In.contrast,.78.percent.of.repeat.buyers.used.the.Internet,.with.57.percent.reporting.that.they.used.it.frequently...Some.repeat.buyers.are.familiar.with.the.area.where.they.intend.to.purchase.a.home.or.rely.on.other.sources.such.as.open.houses.or.home.builders.more.often.than.first-time.buyers.
Exhibit 3-7
USE Of INTERNET TO SEaRcH fOR HOMES by fIRST-TIME aNd REpEaT bUyERS(Percentage Distribution)
60%
50%
40%
30%
20%
10%
0%
22%
70%62%
17%
22%
57%
22%
Frequently Occasionally Not at all
first-time buyers Repeat buyers

NatioNal associat ioN of RealtoRs ®
INTERNET USaGE TRENdSInternet.usage.in.the.home.search.
process.has.steadily.increased.over.the.past.decade..Not.only.is.overall.usage.up.from.71.percent.in.2003.to.80.percent.in.2006,.but.the.percentage.of.buyers.who.reported.that.they.used.the.Internet.frequently.has.risen.from.42.percent.to.59.percent.over.the.period..
Exhibit 3-9
USE Of INTERNET TO SEaRcH fOR HOMES, 2003-2006
60%
50%
40%
30%
20%
10%
0%2003
71%
77%79% 80%
70%
80%
90%
100%
2004 2005 2006
42%
53%
29%
24%
57%
22%21%
59%
Frequently Occasionally
37
acTIONS TaKENAfter.gathering.information.online,.
three-quarters.of.home.buyers.reported.that.they.drove.by.specific.properties,.while.61.percent.walked.through.a.property.viewed.online..Just.over.one.in.five.found.a.real.estate.agent.or.requested.more.information.about.a.property...First-time.buyers.more.often.requested.additional.information.about.a.home.viewed.online.
acTIONS TaKEN aS a RESUlT Of INTERNET HOME SEaRcH, fIRST-TIME aNd REpEaT bUyERS(Percent of Respondents Among Buyers Who Used the Internet)
Exhibit 3-10
all buyers first-time buyers Repeat buyers
Drove by or viewed a home 74% 75% 73%
Walked through a home viewed online
61 58 62
found the agent used to search for or buy a home
23 24 22
Requested more information 22 28 19
contacted builder or developer 11 8 13
Pre-qualified for a mortgage online
7 8 6
applied for a mortgage online 5 6 4
found a mortgage lender online
4 5 3

2006 PRof ile of Home BuyeRs & selleRs38 cHaPteR 3: tHe Home seaRcH PRocess
fIRST lEaRNING abOUT THE HOME ON THE INTERNET
The.rapidly.growing.volume.of.information.about.real.estate.on.a.wide.variety.of.Web.sites.provides.home.buyers.with.a.vast.number.of.ways.to.learn.about.homes.for.sale.and.the.home.buying.process..Consistent.with.results.published.in.the.2005.Profile,.24.percent.of.home.buyers.reported.that.they.first.learned.about.their.home.on.the.Internet...Although.unchanged.from.the.previous.year’s.results,.the.percentage.has.increased.sharply.from.2.percent.in.1997,.clearly.signaling.the.increasing.importance.of.online.information.in.the.search.process.for.most.buyers.
Exhibit 3-12
bUyERS WHO fOUNd THEIR HOME ON THE INTERNET, 1997-2006
25%
20%
15%
10%
5%
0%1997
2%
8%
15%
24%
30%
1999 2001 2003 2004 2005 2006
4%
11%
24%
fIRST lEaRNING abOUT HOME pURcHaSEd
Thirty-six.percent.of.home.buyers.first.found.out.about.the.home.they.purchased.through.a.real.estate.agent,.unchanged.from.the.percentage.reported.in.the.2005.Profile,.but.down.from.50.percent.in.1997...Twenty-four.percent.of.buyers.reported.that.they.first.learned.about.the.home.they.purchased.on.the.Internet..Consistent.with.past.years,.15.percent.of.home.buyers.reported.that.they.first.learned.about.the.home.they.purchased.from.a.yard.sign..
WHERE bUyER fOUNd THE HOME THEy pURcHaSEd, 1997-2006(Percentage Distribution)
Exhibit 3-11
1997 1999 2001 2003 2004 2005 2006
Real estate agent 50% 49% 48% 41% 38% 36% 36%
internet 2 4 8 11 15 24 24
yard sign 17 15 15 16 16 15 15
friend, neighbor or relative
9 8 8 7 7 7 8
Home builder or their agent
3 4 3 7 7 7 8
Print newspaper advertisement
8 8 7 7 5 5 5
Directly from sellers/Knew the sellers
4 3 4 4 5 3 3
Home book or magazine 3 3 2 1 2 1 1
other * 4 3 6 4 * *
* Less than one percent
NatioNal associat ioN of RealtoRs ® 39
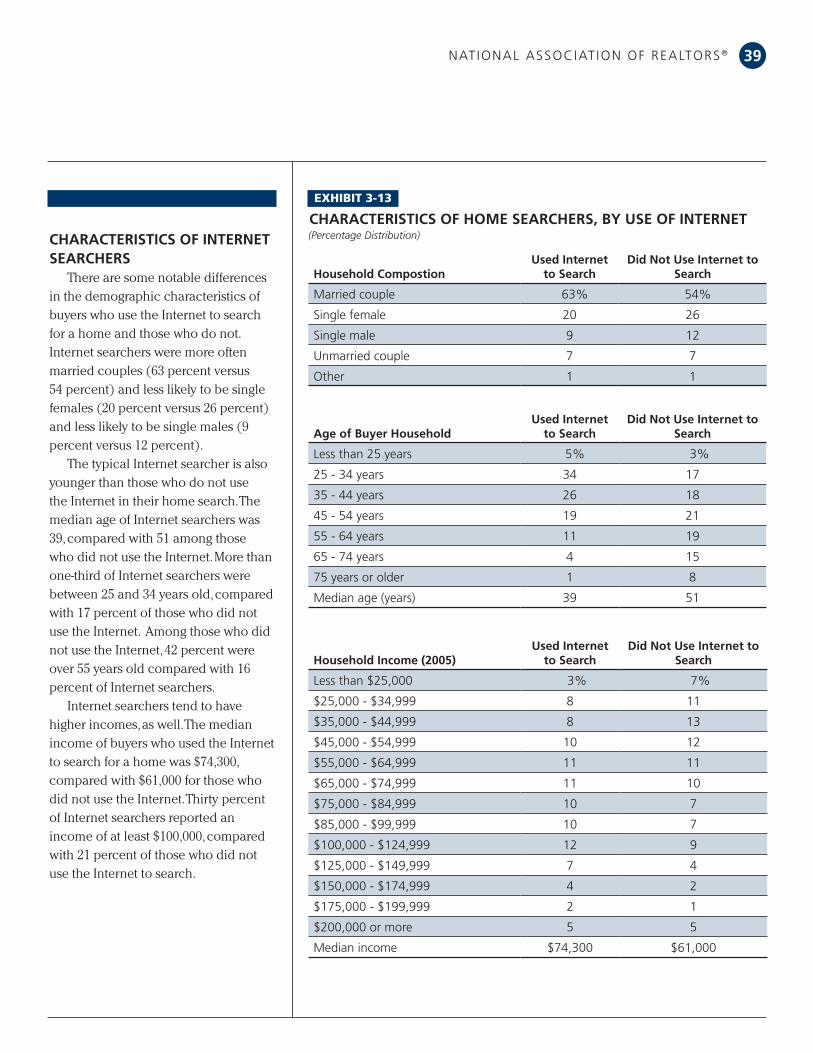
cHaRacTERISTIcS Of INTERNET SEaRcHERS
There.are.some.notable.differences.in.the.demographic.characteristics.of.buyers.who.use.the.Internet.to.search.for.a.home.and.those.who.do.not...Internet.searchers.were.more.often.married.couples.(63.percent.versus.54.percent).and.less.likely.to.be.single.females.(20.percent.versus.26.percent).and.less.likely.to.be.single.males.(9.percent.versus.12.percent)..
The.typical.Internet.searcher.is.also.younger.than.those.who.do.not.use.the.Internet.in.their.home.search..The.median.age.of.Internet.searchers.was.39,.compared.with.51.among.those.who.did.not.use.the.Internet..More.than.one-third.of.Internet.searchers.were.between.25.and.34.years.old,.compared.with.17.percent.of.those.who.did.not.use.the.Internet...Among.those.who.did.not.use.the.Internet,.42.percent.were.over.55.years.old.compared.with.16.percent.of.Internet.searchers..
Internet.searchers.tend.to.have.higher.incomes,.as.well..The.median.income.of.buyers.who.used.the.Internet.to.search.for.a.home.was.$74,300,.compared.with.$61,000.for.those.who.did.not.use.the.Internet..Thirty.percent.of.Internet.searchers.reported.an.income.of.at.least.$100,000,.compared.with.21.percent.of.those.who.did.not.use.the.Internet.to.search.
cHaRacTERISTIcS Of HOME SEaRcHERS, by USE Of INTERNET(Percentage Distribution)
Exhibit 3-13
Household compostionUsed Internet
to Searchdid Not Use Internet to
Search
married couple 63% 54%
single female 20 26
single male 9 12
unmarried couple 7 7
other 1 1
age of buyer HouseholdUsed Internet
to Searchdid Not Use Internet to
Search
less than 25 years 5% 3%
25 - 34 years 34 17
35 - 44 years 26 18
45 - 54 years 19 21
55 - 64 years 11 19
65 - 74 years 4 15
75 years or older 1 8
median age (years) 39 51
Household Income (2005)Used Internet
to Searchdid Not Use Internet to
Search
less than $25,000 3% 7%
$25,000 - $34,999 8 11
$35,000 - $44,999 8 13
$45,000 - $54,999 10 12
$55,000 - $64,999 11 11
$65,000 - $74,999 11 10
$75,000 - $84,999 10 7
$85,000 - $99,999 10 7
$100,000 - $124,999 12 9
$125,000 - $149,999 7 4
$150,000 - $174,999 4 2
$175,000 - $199,999 2 1
$200,000 or more 5 5
median income $74,300 $61,000

2006 PRof ile of Home BuyeRs & selleRs cHaPteR 3: tHe Home seaRcH PRocess40
lENGTH Of HOME SEaRcHThe.length.of.time.buyers.spend.
searching.for.a.home.depends.on.whether.or.not.they.use.the.Internet.as.part.of.their.search.strategy..Among.all.buyers.who.used.the.Internet.to.search,.the.typical.buyer.spent.eight.weeks.searching,.while.the.typical.buyer.who.did.not.use.the.Internet.spent.six.weeks...First-time.buyers.who.used.the.Internet.spent.a.median.of.10.weeks.searching.for.a.home,.somewhat.longer.than.the.typical.Internet-using.repeat.buyer.who.spent.eight.weeks...Buyers.who.used.an.agent.searched.for.the.same.length.of.time.as.all.buyers...However,.buyers.who.used.the.Internet.to.search.spent.a.median.of.two.weeks.searching.prior.to.contacting.an.agent.compared.with.a.median.of.three.weeks.among.buyers.who.did.not.use.the.Internet.to.search..
lENGTH Of SEaRcH, by USE Of INTERNET(Median Weeks)
Exhibit 3-14
Used Internet to Search
did Not Use Internet to Search
all buyers 8 6
first-time buyers 10 6
Repeat buyers 8 5
Buyers using an agent 8 6
Before contacting agent 2 3
after contacting agent 6 3
NUMbER Of HOMES VISITEdNot.only.do.home.buyers.who.
use.the.Internet.spend.a.longer.time.searching.for.a.home,.but.they.also.view.more.homes.than.buyers.who.do.not.use.the.Internet.to.search...The.typical.buyer.who.used.the.Internet.to.search.for.a.home.viewed.11.homes.compared.with.a.median.of.six.homes.among.those.buyers.who.did.not.use.the.Internet..Nearly.one.in.five.of.those.who.did.not.consult.the.Internet.reported.that.they.did.not.visit.any.homes.prior.to.making.a.purchase.
NUMbER Of HOMES VISITEd, by USE Of INTERNET(Percentage Distribution)
Exhibit 3-15
Used Internet to Search
did Not Use Internet to Search
None 3% 18%
1 to 4 17 27
5 to 9 26 23
10 to 14 20 15
15 to 19 11 6
20 to 24 7 5
25 or more 15 6
median (homes) 11 6
NatioNal associat ioN of RealtoRs ®
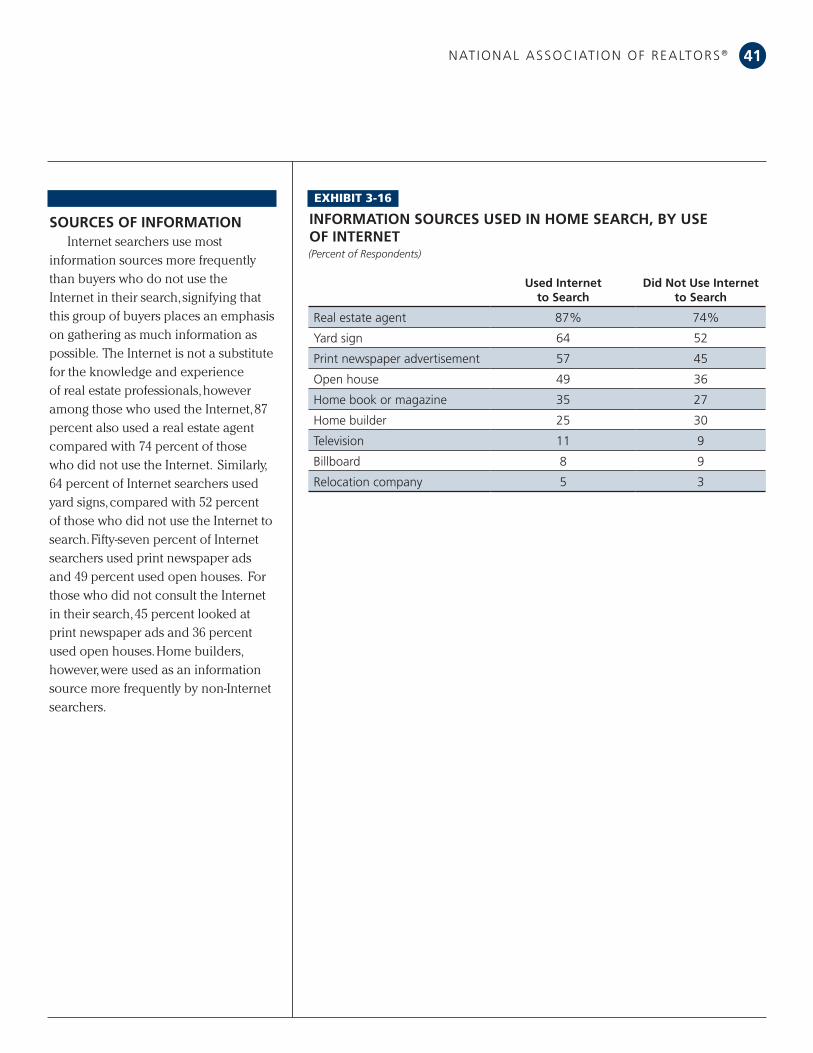
SOURcES Of INfORMaTIONInternet.searchers.use.most.
information.sources.more.frequently.than.buyers.who.do.not.use.the.Internet.in.their.search,.signifying.that.this.group.of.buyers.places.an.emphasis.on.gathering.as.much.information.as.possible...The.Internet.is.not.a.substitute.for.the.knowledge.and.experience.of.real.estate.professionals,.however.among.those.who.used.the.Internet,.87.percent.also.used.a.real.estate.agent.compared.with.74.percent.of.those.who.did.not.use.the.Internet...Similarly,.64.percent.of.Internet.searchers.used.yard.signs,.compared.with.52.percent.of.those.who.did.not.use.the.Internet.to.search..Fifty-seven.percent.of.Internet.searchers.used.print.newspaper.ads.and.49.percent.used.open.houses...For.those.who.did.not.consult.the.Internet.in.their.search,.45.percent.looked.at.print.newspaper.ads.and.36.percent.used.open.houses..Home.builders,.however,.were.used.as.an.information.source.more.frequently.by.non-Internet.searchers..
INfORMaTION SOURcES USEd IN HOME SEaRcH, by USE Of INTERNET(Percent of Respondents)
Exhibit 3-16
Used Internet to Search
did Not Use Internet to Search
Real estate agent 87% 74%
yard sign 64 52
Print newspaper advertisement 57 45
open house 49 36
Home book or magazine 35 27
Home builder 25 30
television 11 9
Billboard 8 9
Relocation company 5 3
41

2006 PRof ile of Home BuyeRs & selleRs42 cHaPteR 3: tHe Home seaRcH PRocess
fIRST lEaRNING abOUT THE HOME
Whether.or.not.home.buyers.use.the.Internet.to.search.for.a.home,.real.estate.agents.remain.the.most.frequent.way.that.buyers.first.learn.about.the.home.they.purchase..Among.home.buyers.who.used.the.Internet.to.search.for.a.home,.35.percent.reported.that.they.first.learned.about.their.home.through.a.real.estate.agent,.a.somewhat.lower.percentage.than.the.38.percent.of.non-Internet.searchers.who.found.their.home.through.a.real.estate.agent..Home.buyers.who.did.not.use.the.Internet.to.search.more.often.first.found.their.home.through.a.home.builder,.a.friend.or.a.relative.than.those.who.used.the.Internet.in.their.home.search..
WHERE bUyERS fOUNd THE HOME THEy pURcHaSEd, by USE Of INTERNET(Percentage Distribution)
Exhibit 3-17
Used Internet to Search
did Not Use Internet to Search
Real estate agent 35% 38%
internet 29 2
yard sign 15 15
Home builder or their agent 7 11
friend, relative or neighbor 6 17
Print newspaper advertisement 5 7
Directly from sellers/ Knew the sellers
2 7
Home book or magazine 1 2
METHOd Of pURcHaSEWhile.real.estate.agents.are.one.
of.the.most.important.sources.of.information.for.most.home.buyers,.some.forgo.the.assistance.of.an.agent...However,..81.percent.of.buyers.who.used.the.Internet.to.search.for.a.home.reported.that.they.used.a.real.estate.agent.in.their.home.purchase,.compared.with.63.percent.of.buyers.who.did.not.use.the.Internet.to.search..Non-Internet.searchers.were.more.than.twice.as.likely.to.purchase.their.home.directly.from.a.builder.and.five.times.as.likely.to.purchase.a.home.directly.from.the.previous.owner.whom.they.knew..
METHOd Of HOME pURcHaSE, by USE Of INTERNET(Percentage Distribution)
Exhibit 3-18
Used Internet to Search
did Not Use Internet to Search
through a real estate agent/broker 81% 63%
Directly from builder or builder’s agent
10 21
Directly from previous owner whom buyer didn’t know
5 5
Directly from previous owner whom buyer knew
2 10
foreclosure or trustee sale 1 *
other 1 1
* Less than one percent
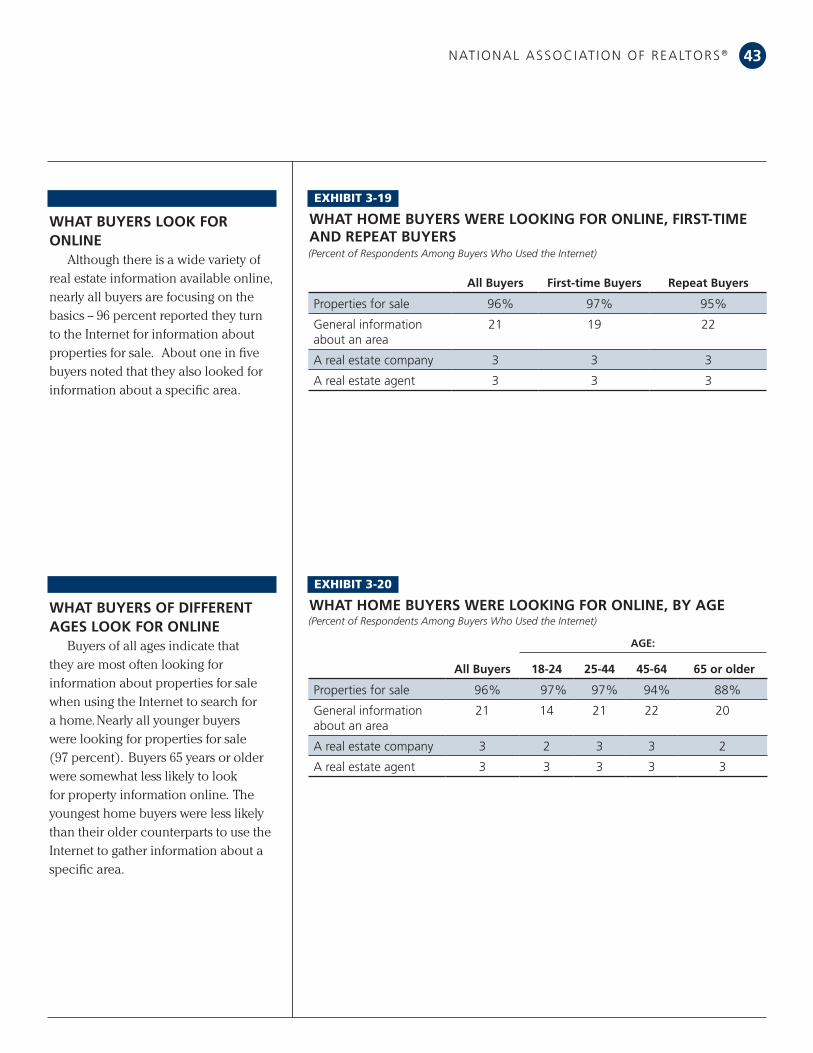
NatioNal associat ioN of RealtoRs ® 43
WHaT bUyERS lOOK fOR ONlINE
Although.there.is.a.wide.variety.of.real.estate.information.available.online,.nearly.all.buyers.are.focusing.on.the.basics.--.96.percent.reported.they.turn.to.the.Internet.for.information.about.properties.for.sale....About.one.in.five.buyers.noted.that.they.also.looked.for.information.about.a.specific.area..
WHaT HOME bUyERS WERE lOOKING fOR ONlINE, fIRST-TIME aNd REpEaT bUyERS(Percent of Respondents Among Buyers Who Used the Internet)
Exhibit 3-19
all buyers first-time buyers Repeat buyers
Properties for sale 96% 97% 95%
general information about an area
21 19 22
a real estate company 3 3 3
a real estate agent 3 3 3
WHaT bUyERS Of dIffERENT aGES lOOK fOR ONlINE
Buyers.of.all.ages.indicate.that.they.are.most.often.looking.for.information.about.properties.for.sale.when.using.the.Internet.to.search.for.a.home..Nearly.all.younger.buyers.were.looking.for.properties.for.sale.(97.percent)...Buyers.65.years.or.older.were.somewhat.less.likely.to.look.for.property.information.online...The.youngest.home.buyers.were.less.likely.than.their.older.counterparts.to.use.the.Internet.to.gather.information.about.a.specific.area..
WHaT HOME bUyERS WERE lOOKING fOR ONlINE, by aGE(Percent of Respondents Among Buyers Who Used the Internet)
Exhibit 3-20
all buyers 18-24 25-44 45-64 65 or older
Properties for sale 96% 97% 97% 94% 88%
general information about an area
21 14 21 22 20
a real estate company 3 2 3 3 2
a real estate agent 3 3 3 3 3
aGE:

2006 PRof ile of Home BuyeRs & selleRs cHaPteR 3: tHe Home seaRcH PRocess44
ValUE Of WEb SITE fEaTURESMost.real.estate.Web.sites.have.a.
number.of.features.to.assist.home.buyers.in.their.search.for.a.home..Photos.and.detailed.property.information.were.considered.very.useful.by.more.than.80.percent.of.buyers..Nearly.all.buyers.use.both.photos.and.property.information.when.viewing.Web.sites..A.substantial.majority.of.buyers.also.use.virtual.tours.
ValUE Of WEb SITE fEaTURES(Percentage of Distribution Among Buyers Who Used the Internet)
Exhibit 3-21
Very Useful
Somewhat Useful
Not Useful
did Not Use
Photos 83% 15% 1% 1%
Detailed property information 81 17 1 1
Virtual tours 60 28 6 6
interactive maps 43 38 9 10
Neighborhood information 37 44 10 9
Real estate agent contact information
31 37 13 19
WEb SITES USEd IN SEaRcHMultiple.listing.service.(MLS).Web.
sites.and.REALTOR.com®.were.used.by.over.half.of.recent.home.buyers.in.their.search...Buyers.in.the.Northeast.and.the.West.were.most.likely.to.use.an.MLS.Web.site,.while.buyers.in.the.Midwest.and.South.favored..REALTOR.com®.by.a.slim.margin...Buyers.in.the.West.were.least.likely.to.use.a.real.estate.company.or.real.estate.agent.Web.site.in.their.search.compared.with.buyers.elsewhere..
WEb SITES USEd by fIRST-TIME aNd REpEaT bUyERS
Over.half.of.first-time.and.repeat.buyers.used.an.MLS.Web.site.in.their.home.search...Repeat.buyers.were.more.likely.to.use.REALTOR.com®.than.first-time.buyers,.however...Among.other.types.of.Web.sites,.there.was.little.difference.in.usage.among.first-time.and.repeat.buyers..
WEb SITES USEd IN HOME SEaRcH, by REGION(Percent of Respondents Among Buyers Who Used the Internet)
Exhibit 3-22
all buyers Northeast Midwest South West
multiple listing services (mls) Web site
53% 56% 49% 52% 58%
RealtoR.com® 52 56 52 53 46
Real estate company Web site
41 44 48 41 32
Real estate agent Web site 40 42 42 40 38
Newspaper Web site 14 17 13 13 14
Real estate magazine Web site
6 6 4 7 7
other 10 6 8 12 10
bUyERS WHO pURcHaSEd a HOME IN THE:
WEb SITES USEd IN HOME SEaRcH by fIRST-TIME aNd REpEaT bUyERS(Percent of Respondents Among Buyers Who Used the Internet)
Exhibit 3-23
all buyers first-time buyers Repeat buyers
multiple listing services (mls) Web site
53% 54% 53%
RealtoR.com® 52 46 55
Real estate company Web site 41 43 40
Real estate agent Web site 40 41 40
Newspaper Web site 14 16 12
Real estate magazine Web site 6 7 6
other 10 9 10

45
RREal ESTaTE aGENTS aSSIST bUyERS IN MaNy WayS THROUGHOUT THE HOME
purchase.transaction...They.provide.a.valuable.source.of.information.to.first-time.
buyers.with.little.experience.in.the.real.estate.market,.while.also.providing.their.
expertise.to.more-experienced.buyers..Home.buyers.recognize.the.value.of.real.
estate.professionals...A.strong.majority.of.recent.buyers.reported.that.they.were.very.
satisfied.with.their.agent’s.knowledge.of.the.purchase.process.and.their.agent’s.
honesty.and.integrity...Both.of.these.attributes.speak.to.the.value.that.real.estate.
agents.bring.to.the.home.purchase.transaction.and.the.benefits.they.provide.to.
their.home-buying.clients.
NatioNal associat ioN of RealtoRs ®
cHaPteR Home BuyiNg aND Real estate PRofessioNals44
Among all buyers, 40 percent reported that
they chose their agents based on a referral, with
first-time buyers more likely than repeat buyers
to base their choice on recommendations from
someone else.

2006 PRof ile of Home BuyeRs & selleRs46 cHaPteR 4: Home BuyiNg aND Real estate PRofess ioNals
METHOd Of pURcHaSEThere.are.several.ways.that.home.
buyers.can.purchase.a.home,.including.working.with.an.agent,.buying.directly.from.the.builder.or.buying.directly.from.the.previous.owner...Over.three-quarters.of.home.buyers.work.with.a.real.estate.agent.when.purchasing.a.home,.a.percentage.consistent.with.the.surveys.of.the.past.several.years..Thirteen.percent.of.buyers.reported.that.they.purchased.their.home.directly.from.the.builder,.while.fewer.than.one.in.10.purchased.their.home.directly.from.the.previous.owner..
Exhibit 4-1
METHOd Of HOME pURcHaSE, 1995-2006(Percentage Distribution)
1995 1997 1999 2001 2003 2004 2005 2006
through a real estate agent or broker
81% 79% 79% 69% 75% 77% 77% 77%
Directly from builder or builder’s agent
9 9 11 15 14 12 12 13
Directly from the previous owner
9 11 9 15 9 9 9 9
through a foreclosure or trustee sale
1 1 1 1 1 1 * 1
*Less than one percent
METHOd Of pURcHaSE by REGION
While.three-quarters.of.home.buyers.work.with.real.estate.agents,.there.is.some.variation.among.regions..In.the.Northeast,.especially,.recent.buyers.more.often.work.with.real.estate.agents.than.do.buyers.in.other.regions..Elsewhere,.there.is.little.difference.in.the.frequency.with.which.buyers.use.agents.or.rely.on.home.builders.when.purchasing.a.home..
Exhibit 4-2
METHOd Of HOME pURcHaSE, by REGION(Percentage Distribution)
all buyers Northeast Midwest South West
through a real estate agent or broker
77% 82% 77% 75% 78%
Directly from builder or builder’s agent
13 7 13 14 15
Directly from the previous owner
9 9 10 10 6
Knew previous owner 4 5 4 4 4
Did not know previous owner
5 5 6 6 3
through a foreclosure or trustee sale
1 1 * 1 *
*Less than one percent
bUyERS WHO pURcHaSEd a HOME IN THE

NatioNal associat ioN of RealtoRs ® 47
pURcHaSING a NEW OR pREVIOUSly OWNEd HOME
Eighty-six.percent.of.buyers.who.purchased.a.previously.owned.home.used.a.real.estate.agent,.compared.with.just.under.half.of.new-home.buyers...Fifty-two.percent.of.new-home.buyers.worked.directly.with.the.builder.when.purchasing.a.home,.while.one.in.10.buyers.of.previously.owned.homes.worked.directly.with.the.previous.owner..
Exhibit 4-3
METHOd Of HOME pURcHaSE, NEW aNd pREVIOUSly OWNEd HOMES(Percentage Distribution)
all buyers
New Home
previously Owned Home
through a real estate agent or broker
77% 47% 86%
Directly from builder or builder’s agent
13 52 2
Directly from the previous owner 9 1 11
Knew previous owner 4 * 5
Did not know previous owner 5 1 6
through a foreclosure or trustee sale
1 * 1
*Less than one percent
bUyERS WHO pURcHaSEd a:
aGENT REpRESENTaTIONHome.buyers.should.be.aware.
of.whom.their.agent.represents.and.their.role.in.the.real.estate.transaction...In.most.cases,.real.estate.agents.require.the.buyer.to.sign.a.disclosure.statement.describing.whether.the.agent.represents.the.buyer.or.the.seller.in.the.transaction...Thirty.percent.of.buyers.reported.that.they.signed.a.disclosure.statement.at.the.first.meeting.with.the.agent,.while.an.additional.26.percent.signed.a.disclosure.when.the.sales.contract.was.written...Eight.percent.of.buyers.signed.a.disclosure.at.some.other.point.in.the.process...Repeat.buyers.were.more.likely.than.first-time.buyers.to.report.that.they.signed.a.disclosure.statement.at.the.first.meeting...Sixteen.percent.of.buyers.did.not.know.if.they.had.signed.a.disclosure.statement.at.any.point.in.the.process..
Exhibit 4-4
aGENT REpRESENTaTION dISclOSURE, fIRST-TIME aNd REpEaT bUyERS(Percentage Distribution)
disclosure Statement Signed? all buyers first-time buyers Repeat buyers
yes, at first meeting 30% 26% 32%
yes, when contract was written 26 26 26
yes, at some other time 8 9 8
No 20 23 18
Don’t know 16 16 16

2006 PRof ile of Home BuyeRs & selleRs cHaPteR 4: Home BuyiNg aND Real estate PRofess ioNals
48
bUyER REpRESENTaTIONSixty-four.percent.of.buyers.reported.
that.they.worked.with.an.agent.who.represented.their.interests.alone...Most.of.these.buyers.had.a.written.buyer.representation.agreement.with.their.agent...Repeat.buyers.were.somewhat.more.likely.to.have.a.written.agreement.than.first-time.buyers,.even.though.they.were.just.as.likely.to.have.a.buyer.representation.arrangement.with.their.agent..
Exhibit 4-5
bUyER REpRESENTaTIVE aRRaNGEMENT WITH aGENT, fIRST-TIME aNd REpEaT bUyERS(Percentage Distribution)
all buyers first-time buyers Repeat buyers
yes, a written arrangement 44% 41% 45%
yes, an oral arrangement 20 22 18
No 26 24 26
Don’t know 11 12 10
aGENT cOMpENSaTIONAmong.all.buyers,.65.percent.
reported.that.the.seller.paid.the.agent.who.assisted.them.in.their.home.purchase...Sixteen.percent.of.agents.were.paid.by.the.buyer.only;.among.those.with.a.buyer.representation.arrangement,.the.percentage.was.18.percent,.compared.with.14.percent.among.all.other.types.of.representation.arrangements..When.the.buyer.paid.the.agent,.in.nearly.all.cases.the.compensation.was.based.on.a.percentage.of.the.sales.price..
Exhibit 4-6
HOW REal ESTaTE aGENT WaS cOMpENSaTEd(Percentage Distribution)
all Types of Representation buyer Only
Seller or Seller and buyer
Paid by seller 65% 65% 66%
Paid by buyer and seller 9 9 10
Paid by buyer only 16 18 14
Percent of sales price 13 14 11
flat fee 2 2 1
other * * *
Don’t know 2 2 1
other 2 2 2
Don’t know 8 7 9
*Less than one percent
TypE Of aGENT REpRESENTaTION
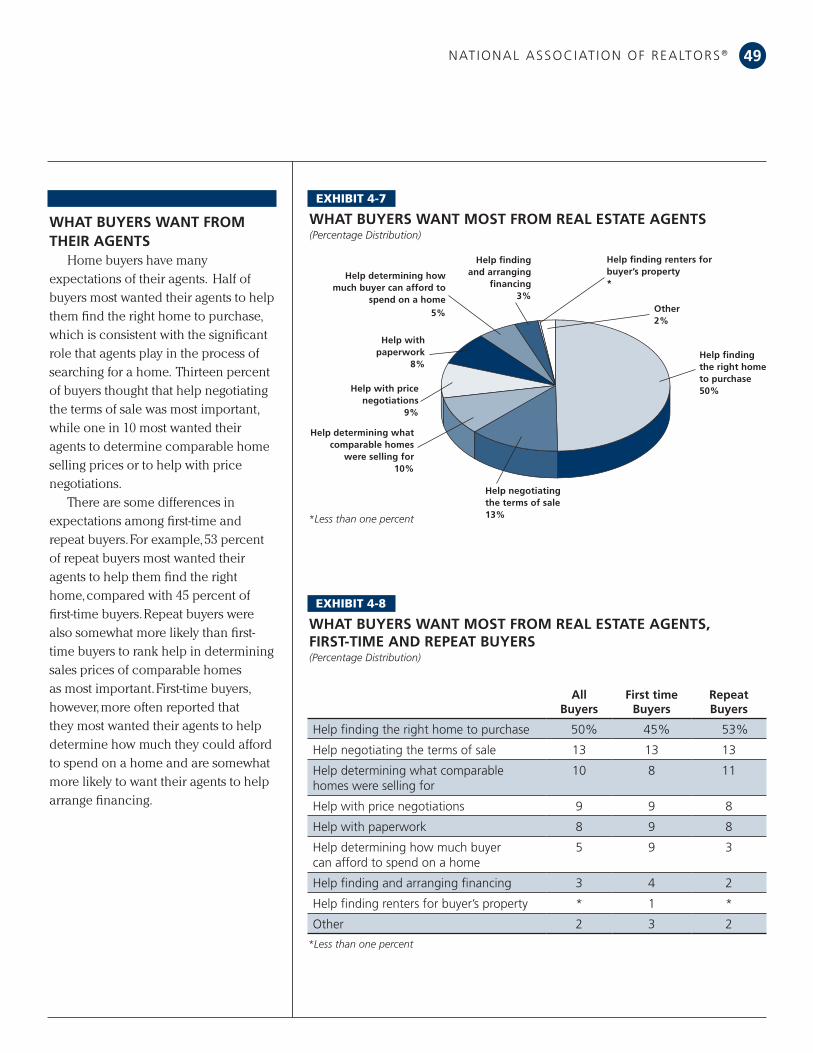
NatioNal associat ioN of RealtoRs ® 49
WHaT bUyERS WaNT fROM THEIR aGENTS
Home.buyers.have.many.expectations.of.their.agents...Half.of.buyers.most.wanted.their.agents.to.help.them.find.the.right.home.to.purchase,.which.is.consistent.with.the.significant.role.that.agents.play.in.the.process.of.searching.for.a.home...Thirteen.percent.of.buyers.thought.that.help.negotiating.the.terms.of.sale.was.most.important,.while.one.in.10.most.wanted.their.agents.to.determine.comparable.home.selling.prices.or.to.help.with.price.negotiations..
There.are.some.differences.in.expectations.among.first-time.and.repeat.buyers..For.example,.53.percent.of.repeat.buyers.most.wanted.their.agents.to.help.them.find.the.right.home,.compared.with.45.percent.of.first-time.buyers..Repeat.buyers.were.also.somewhat.more.likely.than.first-time.buyers.to.rank.help.in.determining.sales.prices.of.comparable.homes.as.most.important..First-time.buyers,.however,.more.often.reported.that.they.most.wanted.their.agents.to.help.determine.how.much.they.could.afford.to.spend.on.a.home.and.are.somewhat.more.likely.to.want.their.agents.to.help.arrange.financing.
Exhibit 4-8
WHaT bUyERS WaNT MOST fROM REal ESTaTE aGENTS, fIRST-TIME aNd REpEaT bUyERS(Percentage Distribution)
all buyers
first time buyers
Repeat buyers
Help finding the right home to purchase 50% 45% 53%
Help negotiating the terms of sale 13 13 13
Help determining what comparable homes were selling for
10 8 11
Help with price negotiations 9 9 8
Help with paperwork 8 9 8
Help determining how much buyer can afford to spend on a home
5 9 3
Help finding and arranging financing 3 4 2
Help finding renters for buyer’s property * 1 *
other 2 3 2
*Less than one percent
Exhibit 4-7
WHaT bUyERS WaNT MOST fROM REal ESTaTE aGENTS(Percentage Distribution)
*Less than one percent
WHAT BUYERS WANT MOST FROM REAL ESTATE PROFESSIONALS(Percentage Distribution)
Help finding the right home to purchase50%
Help finding renters for buyer’s property*
Help finding and arranging
financing 3%
Help determining how much buyer can afford to
spend on a home 5%
Help with paperwork
8%
Help with price negotiations
9%
Help determining what comparable homes
were selling for10%
Help negotiating the terms of sale 13%
Other2%
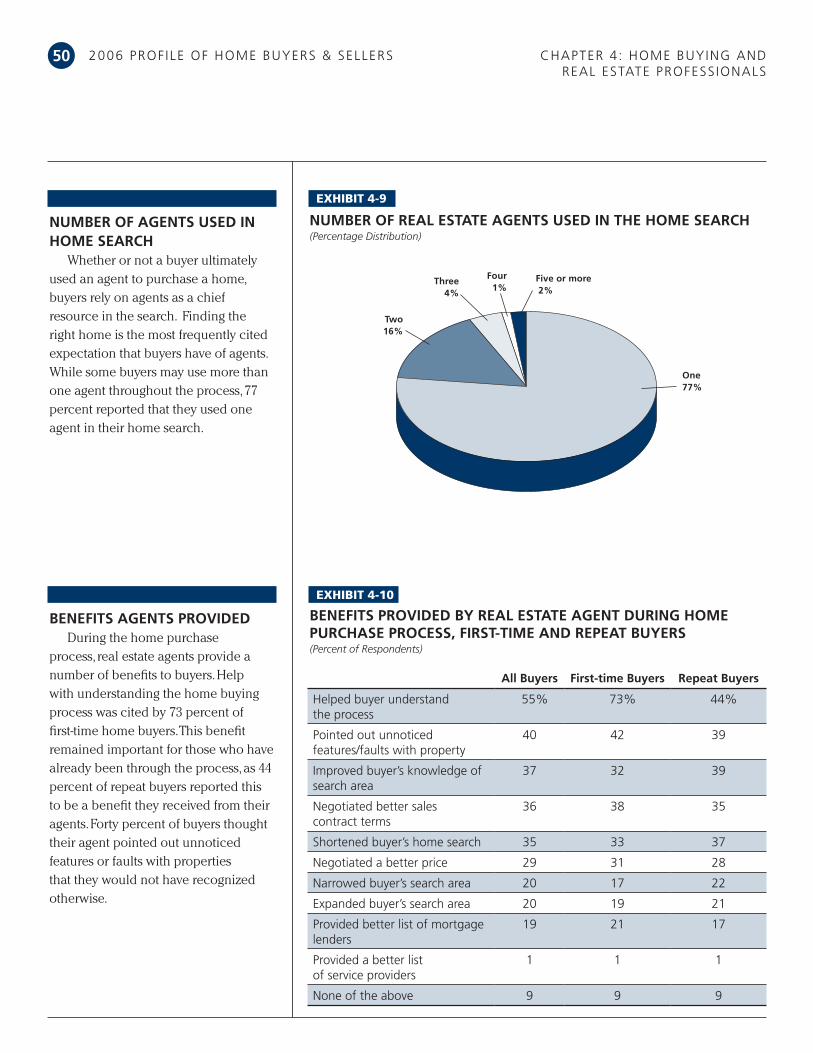
2006 PRof ile of Home BuyeRs & selleRs cHaPteR 4: Home BuyiNg aND Real estate PRofess ioNals
50
NUMbER Of aGENTS USEd IN HOME SEaRcH
Whether.or.not.a.buyer.ultimately.used.an.agent.to.purchase.a.home,.buyers.rely.on.agents.as.a.chief.resource.in.the.search...Finding.the.right.home.is.the.most.frequently.cited.expectation.that.buyers.have.of.agents..While.some.buyers.may.use.more.than.one.agent.throughout.the.process,.77.percent.reported.that.they.used.one.agent.in.their.home.search.
Exhibit 4-9
bENEfITS aGENTS pROVIdEdDuring.the.home.purchase.
process,.real.estate.agents.provide.a.number.of.benefits.to.buyers..Help.with.understanding.the.home.buying.process.was.cited.by.73.percent.of.first-time.home.buyers..This.benefit.remained.important.for.those.who.have.already.been.through.the.process,.as.44.percent.of.repeat.buyers.reported.this.to.be.a.benefit.they.received.from.their.agents..Forty.percent.of.buyers.thought.their.agent.pointed.out.unnoticed.features.or.faults.with.properties.that.they.would.not.have.recognized.otherwise.
Exhibit 4-10
bENEfITS pROVIdEd by REal ESTaTE aGENT dURING HOME pURcHaSE pROcESS, fIRST-TIME aNd REpEaT bUyERS(Percent of Respondents)
all buyers first-time buyers Repeat buyers
Helped buyer understand the process
55% 73% 44%
Pointed out unnoticed features/faults with property
40 42 39
improved buyer’s knowledge of search area
37 32 39
Negotiated better sales contract terms
36 38 35
shortened buyer’s home search 35 33 37
Negotiated a better price 29 31 28
Narrowed buyer’s search area 20 17 22
expanded buyer’s search area 20 19 21
Provided better list of mortgage lenders
19 21 17
Provided a better list of service providers
1 1 1
None of the above 9 9 9
Two16%
five or more 2%
four 1%
Three 4%
One77%
NUMbER Of REal ESTaTE aGENTS USEd IN THE HOME SEaRcH(Percentage Distribution)

NatioNal associat ioN of RealtoRs ® 51
*Less than one percent
fINdING aN aGENTPrevious.experience.with.a.specific.
agent.or.referrals.from.a.friend.or.relative.are.important.ways.in.which.buyers.find.an.agent..Among.all.buyers,.40.percent.reported.that.they.chose.their.agents.based.on.a.referral,.with.first-time.buyers.more.likely.than.repeat.buyers.to.base.their.choice.on.recommendations.from.someone.else...For.one.in.five.repeat.buyers,.experience.with.that.agent.in.an.earlier.transaction.was.the.primary.way.they.found.their.agent...Relatively.few.buyers.relied.on.other.ways.of.finding.an.agent,.such.as.the.Internet.or.visiting.open.houses..
Exhibit 4-11
HOW bUyER fOUNd REal ESTaTE aGENT, fIRST-TIME aNd REpEaT bUyERS(Percentage Distribution)
all buyers
first-time buyers
Repeat buyers
Referred by (or is) a friend, neighbor or relative
40% 49% 35%
used agent previously to buy or sell a home 13 2 19
internet Web site 7 8 7
Visited an open house and met agent 7 6 7
saw contact information on for sale sign 7 8 6
Referred by another real estate agent/broker
5 6 5
Walked into or called office and agent was on duty
4 4 4
Referred through employer or relocation company
4 2 5
Personal contact by agent (telephone, email, etc.)
3 3 3
Newspaper, yellow Pages or home book ad 2 2 1
Direct mail (newsletter, flyer, postcard, etc.) * * *
advertising specialty (calendar, magnet, etc.)
* 1 *
other 7 8 6
INTERVIEWING aGENTSBuyers.sometimes.interview.several.
agents.before.choosing.one.to.assist.them.in.their.home-buying.transaction...Among.all.buyers,.60.percent.interviewed.one.agent..First-time.buyers.were.more.likely.to.interview.more.than.one.agent,.in.part.because.they.have.less.experience.and.rarely.were.involved.in.a.previous.home.sale.transaction..Forty.percent.of.first-time.buyers.interviewed.at.least.two.agents,.compared.with.31.percent.of.repeat.buyers..
Exhibit 4-12
NUMbER Of REal ESTaTE aGENTS INTERVIEWEd by fIRST-TIME aNd REpEaT bUyERS(Percentage Distribution)
all buyers first-time buyers Repeat buyers
one 65% 60% 69%
two 20 23 18
three 10 11 9
four 2 3 2
five or more 3 3 3

2006 PRof ile of Home BuyeRs & selleRs cHaPteR 4: Home BuyiNg aND Real estate PRofess ioNals
IMpORTaNT facTORS WHEN cHOOSING aN aGENT
There.are.a.number.of.factors.that.buyers.consider.when.choosing.an.agent..Some.of.these.can.be.observed.directly,..such.as.an.agent’s.affiliation.with.a.particular.firm,.while.others.such.as.an.agent’s.reputation.are.often.based.on.the.buyer’s.experience.with.that.agent.or.on.referrals.from.family.or.friends...Twenty-five.percent.of.buyers.reported.that.the.most.important.factor.in.their.choice.of.an.agent.was.the.agent’s.honesty.and.trustworthiness,.followed.closely.by.the.agent’s.reputation.(23.percent)..For.16.percent.of.buyers,.a.personal.relationship.with.the.agent,.whether.as.a.family.member.or.friend,.was.the.most.important.factor..
Exhibit 4-13
MOST IMpORTaNT facTORS WHEN cHOOSING aN aGENT(Percentage Distribution)
QUalITIES bUyER WaNT IN aN aGENT
Real.estate.agents.possess.many.skills.and.qualities.that.buyers.find.important...Nearly.all.buyers.(97.percent).reported.that.the.agent’s.honesty.and.integrity.was.very.important.followed.by.knowledge.of.the.purchase.process.(93.percent),.responsiveness.(92.percent).and.knowledge.of.real.estate.markets.(91.percent)..Buyers.were.less.concerned.about.an.agent’s.skills.with.technology.
Exhibit 4-14
IMpORTaNcE Of REal ESTaTE aGENT SKIllS aNd QUalITIES(Percentage Distribution)
52
agent is friend or family member16%
agent’s honesty and trustworthiness25%
agent’s reputation23%
agent has a caring personality/good
listener12%
agent’s knowledge of the
neighborhood13%
agent’s association with a particular firm
4%
agent’s professional designations1% Other
5%
Very Important
Somewhat Important
Not Important
Honesty and integrity 97% 3% *
Knowledge of purchase process 93 6 1
Responsiveness 92 7 *
Knowledge of real estate market 91 9 *
communication skills 83 16 1
Negotiation skills 81 17 1
People skills 78 20 1
Knowledge of local area 76 22 2
skills with technology 39 50 12
*Less than one percent

NatioNal associat ioN of RealtoRs ®
QUalITIES fIRST-TIME aNd REpEaT bUyERS ValUE
Overall,.there.are.only.small.differences.in.how.first-time.and.repeat.buyers.evaluate.the.importance.of.various.skills.and.qualities.of.agents...Honesty.and.integrity.ranked.as.the.most.important.qualities.for.both.first-time.and.repeat.buyers..First-time.buyers.felt.somewhat.more.strongly.that.knowledge.of.the.purchase.process.was.very.important,.while.repeat.buyers.more.often.ranked.knowledge.of.the.real.estate.market.as.very.important..Repeat.buyers.more.frequently.than.first-time.buyers.(80.percent.versus.69.percent).indicated.that.knowledge.of.the.local.area.was.very.important.
Exhibit 4-15
aGENT SKIllS aNd QUalITIES cONSIdEREd ‘VERy IMpORTaNT’ by fIRST-TIME aNd REpEaT bUyERS(Percent of Respondents)
SaTISfacTION WITH REal ESTaTE aGENT QUalITIES
The.vast.majority.of.home.buyers.find.their.agents.to.possess.the.qualities.they.find.most.important.in.a.real.estate.agent...Eighty-four.percent.of.buyers.were.very.satisfied.with.their.agent’s.knowledge.of.the.purchase.process,.with.an.additional.13.percent.somewhat.satisfied..Eighty-three.percent.of.buyers.were.also.very.satisfied.with.the.honesty.and.integrity.of.their.agent,.with.an.additional.12.percent.somewhat.satisfied...These.two.qualities.not.only.were.the.most.desirable.in.a.real.estate.agent,.but.were.also.ones.buyers.found.most.satisfying.in.their.experience.with.an.agent..
Exhibit 4-16
SaTISfacTION WITH REal ESTaTE aGENT SKIllS aNd QUalITIES(Percentage Distribution)
53
all buyers
first-time buyers
Repeat buyers
Honesty and integrity 97% 96% 97%
Knowledge of purchase process 93 95 93
Responsiveness 92 93 92
Knowledge of real estate market 91 88 92
communication skills 83 84 82
Negotiation skills 81 83 80
People skills 78 78 78
Knowledge of local area 76 69 80
skills with technology 39 36 40
Very Satisfied
Somewhat Satisfied
Not Satisfied
Knowledge of purchase process 84% 13% 2%
Honesty and integrity 83 12 5
Knowledge of real estate market 81 16 3
People skills 80 17 4
Responsiveness 80 16 5
Knowledge of local area 78 19 3
communication skills 77 18 5
skills with technology 70 26 4
Negotiation skills 70 22 8

2006 PRof ile of Home BuyeRs & selleRs
REpEaT bUSINESS aNd REfERalS
The.ultimate.measure.of.an.agent’s.performance.is.whether.or.not.the.buyer.would.use.the.agent.again.or.recommend.the.agent.to.others..Referrals.from.friends.and.family.are.the.most.important.way.buyers.select.an.agent.and.reflect.confidence.in.the.agent’s.ability.to.assist.the.buyer.through.the.home.purchase.transaction..Among.all.buyers,.66.percent.reported.that.they.would.definitely.use.their.agents.again.or.recommend.that.agent.to.others...An.additional.19.percent.probably.would.recommend.the.agent.or.use.that.agent.again...Only.7.percent.of.buyers.reported.that.they.would.definitely.not.use.their.agents.again.or.recommend.their.agents.to.others...
Exhibit 4-17
WOUld bUyER USE REal ESTaTE aGENT aGaIN OR REcOMMENd TO OTHERS(Percentage Distribution)
54 cHaPteR 4: Home BuyiNg aND Real estate PRofess ioNals
60%
50%
40%
30%
20%
10%
0%
6%
70% 66%
2%7%
19%
definitely probably probably Not definitely Not don’t Know

55
FF OR MOST HOME bUyERS, f INaNcING THE HOME IS ONE Of SEVERal IMpORTaNT
aspects.of.the.overall.purchase.transaction...There.are.many.financing.options.
available.to.buyers.that.allow.them.to.consider.the.length.of.the.loan.term,.whether.
or.not.they.want.to.trade.the.security.of.a.fixed.interest.rate.for.a.lower.variable.
rate.loan.and.how.much.of.their.own.financial.resources.they.want.to.use.toward.
a.downpayment.. In.addition.to.the.satisfaction.that.buyers.receive.from.owning.a.
home,.most.also.view.their.home.purchase.as.a.good.financial.investment.
cHaPteR fiNaNciNg tHe Home PuRcHase55
NatioNal associat ioN of RealtoRs ®
Fifty-two percent of buyers view their home
as a better investment than stocks, while an
additional 29 percent consider their home about
as good an investment as stocks.
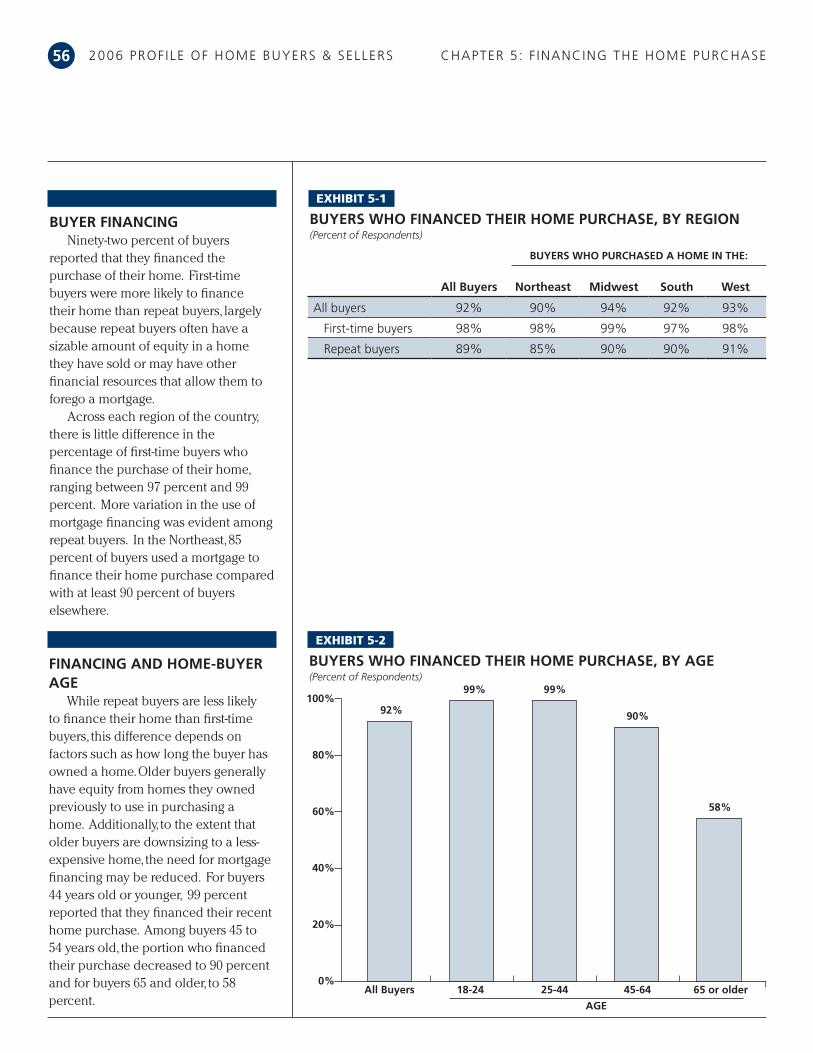
2006 PRof ile of Home BuyeRs & selleRs cHaPteR 5: f iNaNciNg tHe Home PuRcHase56
bUyER fINaNcINGNinety-two.percent.of.buyers.
reported.that.they.financed.the.purchase.of.their.home...First-time.buyers.were.more.likely.to.finance.their.home.than.repeat.buyers,.largely.because.repeat.buyers.often.have.a.sizable.amount.of.equity.in.a.home.they.have.sold.or.may.have.other.financial.resources.that.allow.them.to.forego.a.mortgage..
Across.each.region.of.the.country,.there.is.little.difference.in.the.percentage.of.first-time.buyers.who.finance.the.purchase.of.their.home,.ranging.between.97.percent.and.99.percent...More.variation.in.the.use.of.mortgage.financing.was.evident.among.repeat.buyers...In.the.Northeast,.85.percent.of.buyers.used.a.mortgage.to.finance.their.home.purchase.compared.with.at.least.90.percent.of.buyers.elsewhere.
Exhibit 5-1
bUyERS WHO fINaNcEd THEIR HOME pURcHaSE, by REGION(Percent of Respondents)
fINaNcING aNd HOME-bUyER aGE
While.repeat.buyers.are.less.likely.to.finance.their.home.than.first-time.buyers,.this.difference.depends.on.factors.such.as.how.long.the.buyer.has.owned.a.home..Older.buyers.generally.have.equity.from.homes.they.owned.previously.to.use.in.purchasing.a.home...Additionally,.to.the.extent.that.older.buyers.are.downsizing.to.a.less-expensive.home,.the.need.for.mortgage.financing.may.be.reduced...For.buyers.44.years.old.or.younger,..99.percent.reported.that.they.financed.their.recent.home.purchase...Among.buyers.45.to.54.years.old,.the.portion.who.financed.their.purchase.decreased.to.90.percent.and.for.buyers.65.and.older,.to.58.percent.
Exhibit 5-2
bUyERS WHO fINaNcEd THEIR HOME pURcHaSE, by aGE(Percent of Respondents)
all buyers Northeast Midwest South West
all buyers 92% 90% 94% 92% 93%
first-time buyers 98% 98% 99% 97% 98%
Repeat buyers 89% 85% 90% 90% 91%
bUyERS WHO pURcHaSEd a HOME IN THE:
60%
40%
20%
0%18-24
92%
99%
90%
80%
100%
25-44 45-64 65 or older
99%
58%
all buyers
aGE

NatioNal associat ioN of RealtoRs ® 57
aMOUNT fINaNcEdWhile.nearly.all.buyers.use.a.
mortgage.to.finance.their.home,.the.amount.of.that.mortgage.relative.to.the.purchase.prices.varies.considerably...The.typical.buyer.financed.91.percent.of.the.home.price...Twenty-nine.percent.financed.the.entire.purchase.price...Not.surprisingly,.first-time.buyers.with.generally.fewer.financial.resources.tended.to.finance.more.of.their.home.purchase...The.typical.first-time.buyer.financed.98.percent.of.the.purchase.price..More.than.four.in.10.first-time.buyers.financed.the.entire.purchase.price.of.their.home...Among.repeat.buyers,.the.median.percent.financed.was.somewhat.lower.at.84.percent,.with.19.percent.financing.the.entire.purchase.price..
Exhibit 5-3
pERcENT Of HOME fINaNcEd by fIRST-TIME aNd REpEaT bUyERS(Percentage Distribution)
aMOUNT fINaNcEd by REGIONThe.share.of.the.purchase.price.
financed.with.a.mortgage.varies.somewhat.by.region..The.typical.first-time.home.buyer.in.the.Northeast.financed.a.smaller.percentage.of.the.purchase.price.than.first-time.buyers.elsewhere..At.least.half.of.first-time.buyers.in.the.South.financed.the.full.purchase.price.of.their.home..Repeat.buyers.in.the.Northeast.also.tended.to.finance.a.smaller.share.of.the.purchase.price.of.their.home.(78.percent).with.buyers.in.the.South.typically.financing.the.largest.percentage.(87.percent)..
Exhibit 5-4
pERcENT Of HOME fINaNcEd, by REGION(Median)
all buyers first-time buyers Repeat buyers
less than 50% 9% 4% 12%
50% to 59% 4 1 6
60% to 69% 6 2 8
70% to 79% 11 5 15
80% to 89% 19 14 22
90% to 94% 10 11 10
95% to 99% 13 19 9
100% – financed the entire purchase price with a mortgage
29 45 19
median percent financed 91% 98% 84%
First-time Buyers Repeat Buyers
60%
40%
20%
0%all buyers
98%
80%
100%
Northeast Midwest South
84%
91%
West
All Buyers
96%
78%
87%
98%
85%
92%
100%
87%
93%
99%
82%
88%

2006 PRof ile of Home BuyeRs & selleRs cHaPteR 5: f iNaNciNg tHe Home PuRcHase58
SOURcES Of dOWNpayMENTFor.first-time.buyers,.savings.is.the.
chief.source.of.the.downpayment...Seventy-three.percent.of.first-time.buyers.used.their.savings.for.some.portion.of.the.downpayment,.while.22.percent.relied.to.some.extent.on.gifts.from.relatives.or.friends...One.in.10.first-time.buyers.also.sold.stocks.or.bonds.to.come.up.with.the.downpayment...Although.depending.on.it.somewhat.less.than.first-time.buyers,.40.percent.of.repeat.buyers.used.their.savings.for.a.portion.of.the.downpayment...A.majority.of.repeat.buyers.(62.percent).used.proceeds.from.the.sale.of.their.primary.residence.toward.the.downpayment.
Exhibit 5-5
SOURcES Of dOWNpayMENT, fIRST-TIME aNd REpEaT bUyERS(Percent of Respondents Among those who made a Downpayment)
TypE Of MORTGaGEToday.there.are.a.number.of.
different.types.of.mortgages.available.to.home.buyers..The.defining.characteristic.for.most.of.these.mortgages.is.whether.or.not.the.interest.rate.is.fixed.for.the.life.of.the.loan,.whether.it.is.fixed.only.for.some.initial.period.of.the.loan.or.whether.it.varies.from.the.start...Among.recent.home.buyers,.71.percent.reported.that.they.have.a.fixed-rate.mortgage.with.repeat.buyers.somewhat.more.likely.to.report.a.mortgage.of.this.type.than.first-time.buyers...In.contrast,.first-time.buyers.were.more.likely.to.have.a.mortgage.loan.that.begins.with.a.fixed.interest.rate.and.then.adjusts.periodically.
Exhibit 5-6
TypE Of MORTGaGE, fIRST-TIME aNd REpEaT bUyERS(Percentage Distribution Among those who Financed their Home Purchase)
all buyers
first-time buyers
Repeat buyers
savings 50% 73% 40%
Proceeds from sale of primary residence 44 4 62
gift from relative or friend 9 22 3
sale of stocks or bonds 7 10 6
equity from primary residence buyer continues to own
5 1 6
401k/pension fund including a loan 4 7 3
loan from relative or friend 4 8 2
Proceeds from sale of real estate other than primary residence
3 1 3
inheritance 2 3 2
individual Retirement account (iRa) 2 4 1
loan from financial institution other than a mortgage
2 3 1
sale of personal property 1 1 2
life insurance 1 1 1
investment property sales (1031 exchange) 1 1 1
other 4 6 3
all buyers
first-time buyers
Repeat buyers
fixed-rate mortgage 71% 67% 73%
fixed- then adjustable-rate mortgage 15 19 13
adjustable-rate mortgage 8 8 9
Don’t know 3 4 2
other 2 2 2
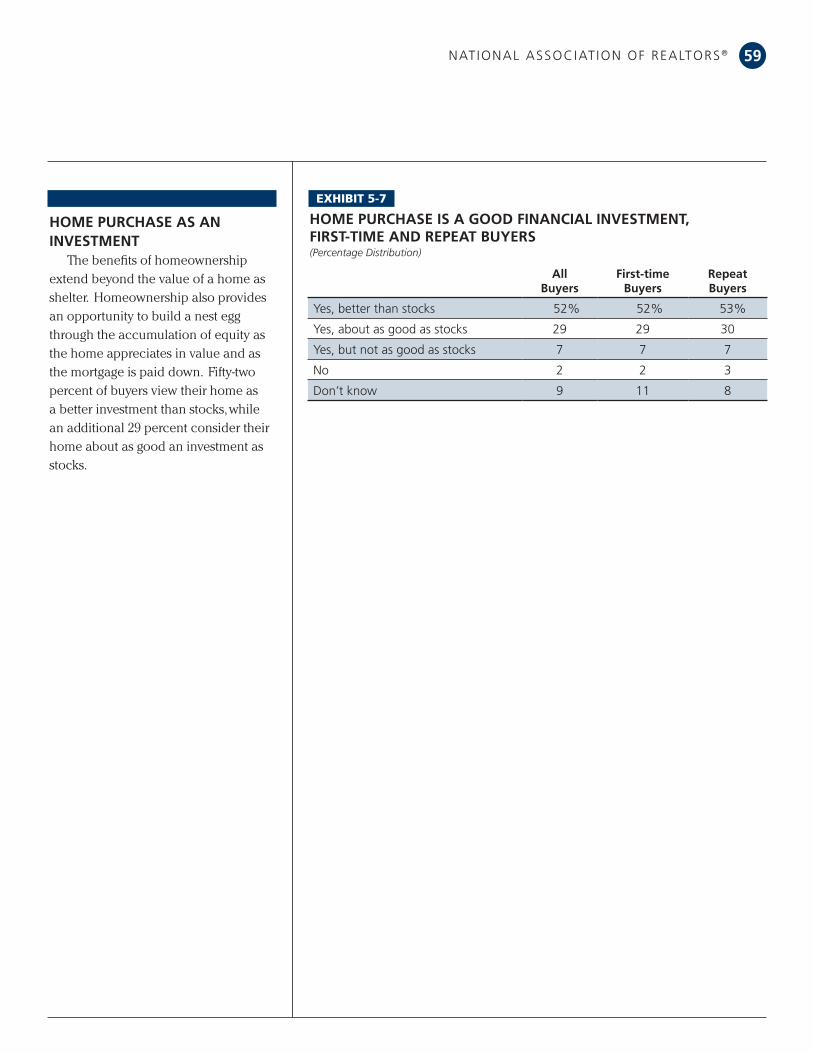
NatioNal associat ioN of RealtoRs ® 59
HOME pURcHaSE aS aN INVESTMENT
The.benefits.of.homeownership.extend.beyond.the.value.of.a.home.as.shelter...Homeownership.also.provides.an.opportunity.to.build.a.nest.egg.through.the.accumulation.of.equity.as.the.home.appreciates.in.value.and.as.the.mortgage.is.paid.down...Fifty-two.percent.of.buyers.view.their.home.as.a.better.investment.than.stocks,.while.an.additional.29.percent.consider.their.home.about.as.good.an.investment.as.stocks..
Exhibit 5-7
HOME pURcHaSE IS a GOOd fINaNcIal INVESTMENT, fIRST-TIME aNd REpEaT bUyERS(Percentage Distribution)
all buyers
first-time buyers
Repeat buyers
yes, better than stocks 52% 52% 53%
yes, about as good as stocks 29 29 30
yes, but not as good as stocks 7 7 7
No 2 2 3
Don’t know 9 11 8
60
HHOME OWNERS HaVE MaNy OpTIONS TO cONSIdER WHEN THEy GET REady TO
sell.their.home,.including.whether.or.not.to.use.an.agent...Even.when.using.an.
agent,.sellers.can.choose.the.level.of.service...They.can.work.with.an.agent.who.
offers.a.broad.range.of.services.and.manages.the.entire.transaction.or.opt.for.a.
more.hands-on.approach.by.completing.some.of.the.tasks.themselves...Overall,.
nearly.two-thirds.of.sellers.were.very.satisfied.with.the.process.of.selling.their.home.
cHaPteR Home selleRs aND tHeiR selliNg exPeRieNce66
2006 PRof ile of Home BuyeRs & selleRs
The share of home sellers who used an agent
or broker has risen over time from about 80
percent in the late 1990s to 84 percent today.

NatioNal associat ioN of RealtoRs ® 61
aGEThe.median.age.of.all.sellers.who.
sold.a.home.between.mid-2005.and.mid-2006.was.46.years..Home.sellers.who.purchased.a.home.in.the.Midwest.tended.to.be.somewhat.younger,.with.a.median.age.of.44.years,.compared.with.sellers.who.purchased.a.home.elsewhere..
Exhibit 6-1
aGE Of HOME SEllERS(Percentage Distribution)
INcOMEAmong.all.sellers,.the.median.
household.income.was.$83,800.in.2005...Thirty-nine.percent.reported.an.income.of.at.least.$100,000...Sellers.who.purchased.a.home.in.the.West.typically.had.a.higher.income.than.sellers.in.other.regions;.44.percent.of.households.reported.an.income.of.more.than.$100,000...Home.sellers.who.purchased.a.home.in.the.South.had.the.lowest.median.income..
Exhibit 6-2
HOUSEHOld INcOME Of HOME SEllERS, 2005(Percentage Distribution)
HOUSEHOld cOMpOSITIONA.majority.of.home.sellers.(72.
percent).were.married,.consistent.with.survey.results.from.recent.years...Single.females,.with.their.growing.influence.on.the.home.buying.market,.also.made.up.a.significant.share.of.sellers.(17.percent)...Relatively.few.home.sellers.were.single.males.or.unmarried.couples.
Exhibit 6-3
adUlT cOMpOSITION Of HOME SEllER HOUSEHOldS, 2004-2006(Percentage Distribution)
all Sellers Northeast Midwest South West
less than 25 years 1% 1% 1% 1% 1%
25 - 34 years 18 18 22 18 17
35 - 44 years 28 30 32 25 27
45 - 54 years 22 20 21 24 21
55 - 64 years 18 17 13 18 22
65 - 74 years 10 10 8 11 9
75 years or older 4 4 3 4 3
median age (years) 46 45 44 48 47
all Sellers Northeast Midwest South West
less than $25,000 3% 2% 4% 3% 3%
$25,000 - $34,999 5 4 5 6 2
$35,000 - $44,999 6 6 5 7 6
$45,000 - $54,999 7 6 7 7 6
$55,000 - $64,999 10 9 10 10 11
$65,000 - $74,999 11 10 9 12 10
$75,000 - $84,999 10 12 10 9 11
$85,000 - $99,999 10 11 15 9 8
$100,000 - $124,999 15 15 15 14 17
$125,000 - $149,999 9 9 8 9 9
$150,000 - $174,999 5 4 4 5 6
$175,000 - $199,999 2 2 2 3 3
$200,000 or more 8 10 7 7 9
median income (2005) $83,800 $85,400 $85,500 $80,400 $87,700
2004 2005 2006
married couple 74% 71% 72%
single female 15 17 17
single male 5 6 6
unmarried couple 5 3 4
other 1 1 1
SEllERS WHO pURcHaSEd a HOME IN THE:
SEllERS WHO pURcHaSEd a HOME IN THE:

2006 PRof ile of Home BuyeRs & selleRs cHaPteR 6: Home selleRs aND tHeiR sell iNg exPeRieNce
62
cHIldRENOverall,.59.percent.of.sellers.had.
no.children.under.age.18.living.in.the.home..About.one-third.of.seller.households.had.one.or.two.children.at.home.
Exhibit 6-4
NUMbER Of cHIldREN UNdER THE aGE Of 18 RESIdING IN HOME SEllER HOUSEHOld(Percentage Distribution)
RacE, ETHNIcITy aNd laNGUaGE
Home.sellers.are.less.racially.diverse.than.home.buyers,.largely.because.a.significant.number.of.buyers.are.first-time.buyers.who.as.a.group.tend.to.include.a.higher.percentage.of.racial/ethnic.minorities..Overall,.about.one.in.10.home.sellers.were.part.of.a.racial/ethnic.minority.
Nearly.all.(97.percent).home.sellers.considered.English.their.primary.language,.a.pattern.that.varied.little.across.regions.of.the.country..
Exhibit 6-5
RacE/ETHNIcITy Of HOME SEllERS, by REGION(Percent of Respondents)
Exhibit 6-6
pRIMaRy laNGUaGE SpOKEN IN HOME SEllER HOUSEHOld, by REGION(Percentage Distribution)
all Sellers Northeast Midwest South West
english 97% 96% 98% 97% 95%
other 3 4 2 3 5
SEllERS WHO pURcHaSEd a HOME IN THE:
all Sellers Northeast Midwest South West
White/caucasian 89% 92% 95% 87% 85%
Black/african-american 4 2 2 7 3
asian/Pacific islander 3 4 1 2 6
Hispanic/latino 4 2 1 4 6
other 1 1 1 1 1
SEllERS WHO pURcHaSEd a HOME IN THE:
Note: Respondents were permitted to select as many races and ethnicities as they felt applicable. The percentage distribution may therefore sum to more than 100 percent.
One16%
Two18%
None59%
Three or more7%

NatioNal associat ioN of RealtoRs ® 63
TypE Of HOME SOldOver.three-quarters.of.homes.
sold.during.the.survey.period.were.detached.single-family.homes...In.addition,.one.in.10.homes.sold.was.a.townhouse.or.row.house...A.somewhat.smaller.percentage.of.homes.sold.were.condos.in.buildings.with.five.or.more.units..
Exhibit 6-7
TypE Of HOME SOld(Percentage Distribution)
lOcaTION Of HOMES SOldFifty-three.percent.of.homes.sold.
were.in.a.suburb.and.20.percent.were.in.an.urban.area.or.central.city..
Exhibit 6-8
lOcaTION Of HOME SOld(Percentage Distribution)
lOcaTION aNd TypE Of HOME SOld
Most.homes.sold.are.detached.single-family.homes...Over.80.percent.of.homes.sold.in.suburban.and.small-town.locations.were.detached.single-family.homes....However,.in.urban.and.central.city.areas,.detached.single-family.homes.made.up.a.much.smaller.68.percent.of.sales..Offsetting.this.difference.was.a.higher.rate.of.condo.sales,.accounting.for.16.percent.of.homes.sold.
Exhibit 6-9
TypE Of HOME SOld by lOcaTION(Percentage Distribution)
all Sellers
Suburb/ Subdivision
Small town
Urban/ central
cityRural area
Resort/ Recreation
area
Detached single-family home
78% 81% 85% 68% 78% 62%
townhouse/row house
9 11 6 11 3 *
apartment/condo in building with 5 or more units
1 6 3 14 1 15
Duplex/apartment/condo in 2 to 4 unit building
7 * * 2 2 6
other 5 2 5 4 17 16
SEllERS WHO SOld a HOME IN a:
duplex/apartment/condo in 2 to 4 unit
building1%
Other5%
Townhouse or row house
9% detached single-family home78%
apartment/condo in building with 5 or more units7%
Small town13%
Resort/ Recreation area2%
Urban/ central city
20%
Suburb/ Subdivision53%
Rural area11%
*Less than one percent

2006 PRof ile of Home BuyeRs & selleRs64 cHaPteR 6: Home selleRs aND tHeiR sell iNg exPeRieNce
TRadING Up OR TRadING dOWN
One.basic.decision.for.home.sellers.is.whether.to.buy.a.larger.or.smaller.home...While.this.is.not.the.only.consideration.when.buying.a.home,.it.is.an.important.reflection.of.home.buyers’.preferences.
About.half.of.home.sellers.traded.up.to.a.larger.home..Nearly.one.in.five.repeat.buyers.sold.a.home.that.was.1,001.to.1,500.square.feet.in.size.and.purchased.a.home.that.was.larger...Most.buyers.in.this.group.purchased.a.home.that.was.moderately.larger.at.between.1,501.and.2,000.square.feet.in.size..
The.pattern.of.trading.up.or.trading.down.is.correlated.with.the.age.of.home.sellers...Sellers.who.were.54.or.younger.tended.to.buy.larger.homes,.while.sellers.55.and.older.tended.to.buy.smaller.homes...Among.sellers.44.years.old.or.younger,.the.typical.home.purchased.was.between.500.and.600.square.feet.larger.. While.older.sellers.tend.to.downsize,.the.median.difference.in.size.between.the.home.sold.and.the.home.purchased.is.relatively.small..For.example,..sellers.between.65.and.74.years.old.typically.purchased.homes.91.square.feet.smaller.than.the.homes.they.sold..
Exhibit 6-10
SIZE Of HOME pURcHaSEd cOMpaREd TO HOME REcENTly SOld(Percentage Distribution)
Exhibit 6-11
SIZE Of HOME pURcHaSEd cOMpaREd TO HOME REcENTly SOld, by aGE Of SEllER(Median square feet)
SIZE Of HOME SOld
1,000 sq ft
or less
1,001- 1,500 sq ft
1,501- 2,000 sq ft
2,001- 2,500 sq ft
2,501- 3,000 sq ft
More than 3,000 sq ft
1,000 sq ft or less 1 3% 2% 1% * *
1,001 to 1,500 sq ft 1 6 10 5 2 1
1,501 to 2,000 sq ft 1 4 9 8 4 4
2,001 to 2,500 sq ft * 2 4 4 3 4
2,501 to 3,000 sq ft * 1 2 2 2 3
more than 3,000 sq ft * * 2 2 2 5
Trading down Trading Up
SIZE Of HOME pURcHaSEd
Size of Home Sold Size of Home purchased difference
18 to 34 years 1,512 2,080 568
35 to 44 years 1,785 2,310 525
45 to 54 years 1,877 2,128 251
55 to 64 years 2,060 2,009 -51
65 to 74 years 1,913 1,822 -91
75 years or older 1,895 1,765 -130
*Less than one percent

NatioNal associat ioN of RealtoRs ®
SIZE Of HOME SOld
1,000 sq ft
or less
1,001- 1,500 sq ft
1,501- 2,000 sq ft
2,001- 2,500 sq ft
2,501- 3,000 sq ft
More than 3,000 sq ft
1,000 sq ft or less 1 3% 2% 1% * *
1,001 to 1,500 sq ft 1 6 10 5 2 1
1,501 to 2,000 sq ft 1 4 9 8 4 4
2,001 to 2,500 sq ft * 2 4 4 3 4
2,501 to 3,000 sq ft * 1 2 2 2 3
more than 3,000 sq ft * * 2 2 2 5
Trading down Trading Up
65
REaSONS fOR SEllING HOMEReasons.for.selling.a.home.vary.
somewhat.by.the.age.of.the.seller,.but.the.most.cited.one.is.that.the.home.is.too.small..Ninetten.percent.of.all.sellers.listed.this.as.a.reason..Thirteen.percent.of.all.sellers.sold.their.homes.because.the.neighborhood.became.less.desirable,.a.reason.more.often.reported.by.sellers.between.25.and.64.years.old.than.for.either.younger.or.older.sellers..Sellers.at.least.65.years.old.have.markedly.different.reasons.for.selling.compared.with.younger.sellers...For.these.sellers,.the.most.important.reasons.were.a.desire.to.move.closer.to.family.or.friends,.downsizing.to.a.smaller.home.or.retirement..
Exhibit 6-12
pRIMaRy REaSON fOR SEllING pREVIOUS HOME, by aGE(Percentage Distribution)
TENURE IN pREVIOUS HOMEAmong.recent.home.sellers,.those.
with.the.shortest.tenure.in.their.previous.home.are.sellers.of.condos.in.buildings.with.five.or.more.units...While.this.group.owned.their.homes.a.median.of.four.years,.over.40.percent.owned.their.condos.for.two.years.or.less...In.contrast,. sellers.of.detached.single-family.homes.reported.a.median.tenure.of.six.years,.with.more.than.one.in.10.owning.their.previous.homes.for.at.least.21.years..
Exhibit 6-13
TENURE IN pREVIOUS HOME, by TypE Of HOME(Percentage Distribution)
all Sellers 18-24 25-44 45-64 65 or older
Home is too small 19% 38% 30% 13% 3%
Neighborhood has become less desirable
13 10 14 13 8
change in family situation 11 5 11 13 8
Want to move closer to my job
10 * 14 8 1
Want to move closer to friends or family
9 14 5 8 28
Job relocation 9 5 12 9 *
Home is too large 7 * 2 9 19
moving due to retirement 5 N/a * 7 12
upkeep of home is too difficult due to health or finances
3 * 1 3 8
cannot afford the mortgage and other expenses of owning
3 14 2 3 2
other 12 14 10 15 10
aGE
*Less than one percentN/A Not applicable
all Typ
es
cabin
/cotta
ge
duplex/a
partm
ent i
n
2 to
4 unit
buildin
g
apartm
ent/c
ondo in b
uildin
g
with
5 or m
ore u
nits
Tow
nhouse/ro
w h
ouse
detac
hed si
ngle-fa
mily
hom
e
Mobile
/
man
ufactu
red h
ome
Other
less than 1 year 6% * * 7% 6% 6% 1% *
1 to 2 years 24 43 36 35 31 23 11 26
3 to 4 years 19 13 14 21 21 19 14 11
5 to 6 years 11 17 8 12 11 11 13 13
7 to 10 years 12 * 14 10 9 12 24 13
11 to 15 years 11 13 3 7 10 12 13 4
16 to 20 years 7 13 11 7 4 7 13 13
21 years or more 11 * 11 * 8 12 10 17
median 6 5 5 4 5 6 9 7
*Less than one percent

2006 PRof ile of Home BuyeRs & selleRs66 cHaPteR 6: Home selleRs aND tHeiR sell iNg exPeRieNce
NUMbER Of HOMES OWNEdThe.typical.home.seller.today.has.
owned.three.homes,.with.one-third.reporting.ownership.of.two.homes..Eighty-seven.percent.of.sellers.have.completed.at.least.two.home.sales.in.the.past...Some.home.sellers.have.considerable.experience.in.home.sales...Among.sellers.at.least.45.years.old,.29.percent.have.owned.at.least.five.homes.
Exhibit 6-14
NUMbER Of HOMES pREVIOUSly OWNEd, by aGE(Percentage Distribution)
dISTaNcE MOVEdThe.median.distance.that.sellers.
moved.after.selling.one.home.and.buying.another.was.17.miles..Sellers.who.bought.a.home.in.the.South.moved.the.greatest.distance.–.a.median.of.26.miles..
Exhibit 6-15
dISTaNcE bETWEEN HOME pURcHaSEd aNd HOME REcENTly SOld, by REGION(Median Miles)
all Sellers 18-44 45-64 65 or older
one 13% 18% 10% 9%
two 33 47 23 15
three 21 21 21 22
four 15 9 18 24
five or more 18 5 29 29
median 3 homes 2 homes 3 homes 3 homes
aGE
25%
20%
15%
10%
5%
0%all Sellers
17
13
16
30%
Northeast Midwest South West
12
26

NatioNal associat ioN of RealtoRs ® 67
TaSKS pERfORMEdSellers.have.many.choices.in.the.
level.of.service.they.choose.when.working.with.a.real.estate.agent..Some.sellers.want.their.agent.to.perform.many.tasks.and.manage.the.process.from.start.to.finish,.while.other.sellers.choose.to.take.on.the.responsibility.for.some.tasks.themselves...In.most.cases,.however,.real.estate.agents.assisted.sellers.with.a.large.number.of.tasks...For.example,.71.percent.of.sellers.worked.with.their.agent.to.determine.the.selling.price,.and.80.percent.were.assisted.by.their.agent.when.reviewing.contracts.and.purchase.offers..
The.task.that.sellers.most.often.did.themselves.without.assistance.was.determining.the.listing.price..On.the.other.hand,.sellers.were.least.likely.to.enter.the.property.on.the.Multiple.Listing.Service,.contact.buyers.or.arrange.advertising.on.the.Internet..
Not.all.sellers.choose.to.perform.or.seek.assistance.with.all.tasks..Thirty-eight.percent.of.sellers.did.not.hold.an.open.house.and.about.one-quarter.of.sellers.did.not.place.ads.in.newspapers.or.contact.potential.buyers.directly..
Exhibit 6-16
TaSKS pERfORMEd IN THE SEllING pROcESS(Percentage Distribution)
performed by Seller wihout
assistance
assisted by Real Estate agent
Seller paid another
professional for assistance
Task not performed
don’t Know
Determine asking price
24% 71% 3% 1% *
Hold open house 9 52 1 38 *
schedule showings with potential buyers
12 76 4 7 1
enter property in multiple listing service
3 80 1 14 1
Place ads in newspapers, mags, etc.
7 63 1 25 3
contact buyers by phone, mail, etc.
5 59 1 26 8
advertise or place listing on internet
5 74 2 16 3
Review sales contracts/purchase offers
8 80 6 6 1
Negotiate with buyers
13 78 3 6 1
coordinate appraisal, home inspection, etc.
13 72 7 6 2
Pre-qualify buyers for a mortgage
6 49 16 17 13
manage paperwork, contracts, etc.
9 78 9 3 1
attend closing 16 71 8 3 1
*Less than one percent
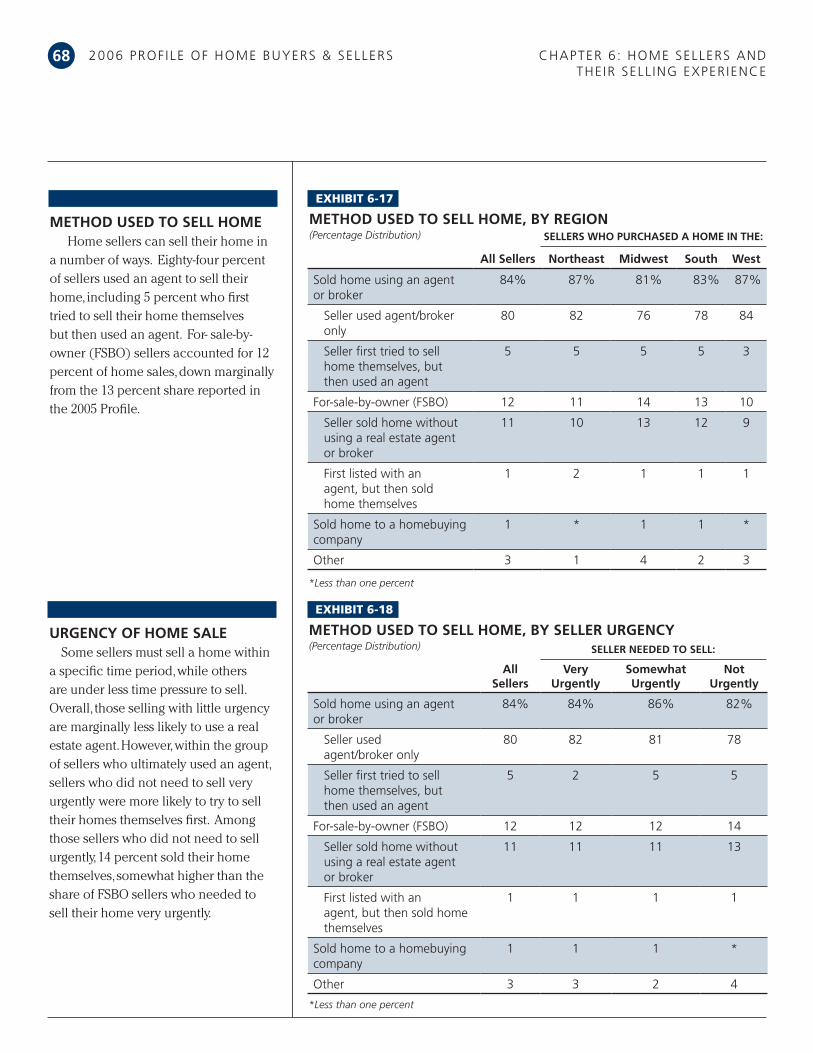
2006 PRof ile of Home BuyeRs & selleRs68
URGENcy Of HOME SalESome.sellers.must.sell.a.home.within.
a.specific.time.period,.while.others.are.under.less.time.pressure.to.sell...Overall,.those.selling.with.little.urgency.are.marginally.less.likely.to.use.a.real.estate.agent..However,.within.the.group.of.sellers.who.ultimately.used.an.agent,.sellers.who.did.not.need.to.sell.very.urgently.were.more.likely.to.try.to.sell.their.homes.themselves.first...Among.those.sellers.who.did.not.need.to.sell.urgently,.14.percent.sold.their.home.themselves,.somewhat.higher.than.the.share.of.FSBO.sellers.who.needed.to.sell.their.home.very.urgently.
Exhibit 6-18
METHOd USEd TO SEll HOME, by SEllER URGENcy(Percentage Distribution)
cHaPteR 6: Home selleRs aND tHeiR sell iNg exPeRieNce
METHOd USEd TO SEll HOMEHome.sellers.can.sell.their.home.in.
a.number.of.ways...Eighty-four.percent.of.sellers.used.an.agent.to.sell.their.home,.including.5.percent.who.first.tried.to.sell.their.home.themselves.but.then.used.an.agent...For-.sale-by-owner.(FSBO).sellers.accounted.for.12.percent.of.home.sales,.down.marginally.from.the.13.percent.share.reported.in.the.2005.Profile..
Exhibit 6-17
METHOd USEd TO SEll HOME, by REGION(Percentage Distribution)
all Sellers Northeast Midwest South West
sold home using an agent or broker
84% 87% 81% 83% 87%
seller used agent/broker only
80 82 76 78 84
seller first tried to sell home themselves, but then used an agent
5 5 5 5 3
for-sale-by-owner (fsBo) 12 11 14 13 10
seller sold home without using a real estate agent or broker
11 10 13 12 9
first listed with an agent, but then sold home themselves
1 2 1 1 1
sold home to a homebuying company
1 * 1 1 *
other 3 1 4 2 3
all Sellers
Very Urgently
Somewhat Urgently
Not Urgently
sold home using an agent or broker
84% 84% 86% 82%
seller used agent/broker only
80 82 81 78
seller first tried to sell home themselves, but then used an agent
5 2 5 5
for-sale-by-owner (fsBo) 12 12 12 14
seller sold home without using a real estate agent or broker
11 11 11 13
first listed with an agent, but then sold home themselves
1 1 1 1
sold home to a homebuying company
1 1 1 *
other 3 3 2 4
SEllERS WHO pURcHaSEd a HOME IN THE:
*Less than one percent
*Less than one percent
SEllER NEEdEd TO SEll:

NatioNal associat ioN of RealtoRs ® 69
bUyER aNd SEllER RElaTION-SHIp aNd METHOd Of SalE
Among.those.sellers.who.used.a.real.estate.agent,.96.percent.sold.their.home.to.someone.they.did.not.know.prior.to.the.sale...A.similar.percentage.of.those.who.first.tried.to.sell.their.home.as.a.FSBO.but.then.used.an.agent.also.sold.to.someone.they.did.not.know...In.contrast,.40.percent.of.those.sellers.who.sold.their.home.as.a.FSBO.sold.it.to.someone.they.knew.prior.to.the.transaction,.reflecting.a.high.percentage.of.FSBO.transactions.that.do.not.occur.in.the.open.market..
Among.sellers.who.sold.their.home.to.a.buyer.they.knew.prior.to.the.transaction,.38.ultimately.used.an.agent,.while.53.percent.sold.their.home.as.a.FSBO,.including.a.small.percentage.who.first.tried.to.sell.their.home.using.an.agent...Among.those.sellers.who.ultimately.sold.their.home.to.someone.they.did.not.know,.89.percent.used.an.agent..Only.8.percent.of.sales.among.unrelated.parties.who.did.not.know.each.other.prior.to.the.sale.were.open.market.FSBOs.
Exhibit 6-19
METHOd Of SalE, by bUyER aNd SEllER RElaTIONSHIp(Percentage Distribution)
Exhibit 6-20
METHOd USEd TO SEll HOME, 1995-2006(Percentage Distribution)
METHOd Of SalE OVER TIMEThe.share.of.home.sellers.who.used.
an.agent.or.broker.has.risen.over.time.from.about.80.percent.in.the.late.1990s.to.84.percent.today..At.the.same.time.the.share.of.FSBO.sellers.has.declined.from.18.percent.in.1997.to.12.percent.today..
1995 1997 1999 2001 2003 2004 2005 2006
sold home using an agent or broker
81% 80% 77% 79% 83% 82% 85% 84%
for-sale-by-owner (fsBo)
15 18 16 13 14 14 13 12
sold to home buying company
2 1 2 1 1 1 1 1
other 2 1 5 7 3 3 2 3
SEllER aNd bUyER RElaTIONSHIpSeller Knew
buyerSeller did not Know buyer
all sellers 9% 91%
sold home using an agent or broker 4 96
sold it using a licensed real estate agent or broker
4 96
seller first tried to sell home themselves, but then used an agent
6 94
for-sale-by-owner (fsBo) 40 60
sold home without ever using a real estate agent or broker
40 60
seller first listed with an agent, but then sold home themselves
43 57
other 23 77
METHOd Of HOME SalEall
SellersSeller Knew
buyerSeller did not Know buyer
sold home using an agent or broker 84% 38% 89%
sold it using a licensed real estate agent or broker
80 35 84
seller first tried to sell home them- selves, but then used an agent
5 3 5
for-sale-by-owner (fsBo) 12 53 8
sold home without ever using a real estate agent or broker
11 49 8
seller first listed with an agent, but then sold home themselves
1 4 1
other 3 8 3

2006 PRof ile of Home BuyeRs & selleRs cHaPteR 6: Home selleRs aND tHeiR sell iNg exPeRieNce
SalES pRIcE aNd URGENcy TO SEll
A.home.seller’s.urgency.to.sell.has.only.a.modest.impact.on.the.final.sales.price.in.most.cases..While.62.percent.of.all.buyers.who.needed.to.sell.very.urgently.sold.their.home.for.less.than.the.listing.price,.59.percent.of.sellers.who.were.not.urgent.to.sell.their.home.sold.for.less.than.the.listing.price..Thirty-one.percent.of.sellers.who.did.not.need.to.sell.urgently.indicated.that.they.sold.their.home.for.100.percent.of.the.listing.price.compared.with.25.percent.of.those.very.urgent.to.sell..
Exhibit 6-22
SalES pRIcE cOMpaREd WITH lISTING pRIcE, by SEllER URGENcy(Percentage Distribution of Sales Price as a Percent of Listing Price)
70
all Sellers
Very Urgently
Somewhat Urgently
Not Urgently
less than 90% 7% 7% 7% 6%
90% to 94% 14 16 16 10
95% to 99% 41 39 41 43
100% 26 25 23 31
101% to 110% 9 11 9 7
more than 110% 3 2 4 4
median (sales price as a percent of listing price)
98% 98% 98% 99%
SEllER NEEdEd TO SEll:
Exhibit 6-21
SalES pRIcE cOMpaREd WITH lISTING pRIcE, by REGION(Percentage Distribution of Sales Price as a Percent of Listing Price)
SalES pRIcE aNd lISTING pRIcESellers.typically.sell.their.homes.for.
98.percent.of.the.listing.price...Twelve.percent.of.sellers.sold.their.home.for.more.than.the.listing.price...Among.those.sellers.who.purchased.a.home.in.the.Midwest,.the.sales.price.for.the.typical.seller.was.97.percent.of.the.listing.price,.with.only.5.percent.selling.for.more...In.the.West,.one.in.five.homes.sold.for.more.than.the.listing.price.
all Sellers Northeast Midwest South West
less than 90% 7% 10% 7% 8% 3%
90% to 94% 14 17 15 14 11
95% to 99% 41 39 54 39 34
100% 26 22 18 27 32
101% to 110% 9 7 4 9 14
more than 110% 3 5 1 3 6
median (sales price as a percent of listing price)
98% 98% 97% 98% 100%
SEllERS WHO pURcHaSEd a HOME IN THE:

NatioNal associat ioN of RealtoRs ® 71
TIME ON THE MaRKETOverall,.the.typical.seller’s.home.
was.on.the.market.for.six.weeks;.for.one-third.of.sellers,.it.was.two.weeks.or.less...Time.on.the.market.varied.somewhat.across.regions...For.sellers.who.purchased.a.home.in.the.West,.the.median.number.of.weeks.on.the.market.was.four,.compared.with.eight.among.those.in.the.Midwest..
Exhibit 6-23
NUMbER Of WEEKS REcENTly SOld HOME WaS ON THE MaRKET, by REGION(Percentage Distribution)
TIME ON THE MaRKET aNd SalES pRIcE
Determining.the.right.price.for.a.home.is.one.of.the.most.important.considerations.when.selling..Generally,.the.longer.a.home.is.on.the.market,.the.more.likely.it.will.sell.for.less.than.the.listing.price...For.homes.on.the.market.less.than.one.week,.23.percent.sold.for.a.price.less.than.the.listing.price,.but.as.the.time.on.the.market.lengthens,.that.share.rises...For.homes.on.the.market.at.least.17.weeks,.87.percent.sold.for.less.than.the.listing.price..
Exhibit 6-24
SalES pRIcE cOMpaREd WITH lISTING pRIcE, by NUMbER Of WEEKS HOME WaS ON THE MaRKET(Percentage Distribution of Sales Price as a Percent of Listing Price)
all Sellers Northeast Midwest South West
less than 1 week 5% 4% 5% 6% 5%
1 to 2 weeks 27 29 21 27 30
3 to 4 weeks 15 10 14 15 18
5 to 6 weeks 7 8 8 6 7
7 to 8 weeks 8 6 11 9 7
9 to 10 weeks 4 5 4 5 3
11 to 16 weeks 16 15 16 16 16
17 or more weeks 18 24 22 17 13
median (weeks) 6 6 8 6 4
SEllERS WHO pURcHaSEd a HOME IN THE:
all Sellers
less than 1 week
1 to 2 weeks
3 to 4 weeks
5 to 8 weeks
9 to 16 weeks
17 or more
weeks
less than 90% 7% 4% 2% 2% 3% 8% 22%
90% to 94% 14 6 3 7 15 26 28
95% to 99% 41 13 38 49 57 43 37
100% 26 64 40 26 17 13 8
101% to 110% 9 12 14 14 6 6 2
more than 110% 3 1 4 3 2 4 3
median (sales price as a percent of listing price)
98% 100% 100% 99% 98% 97% 95%
SEllERS WHOSE HOME WaS ON THE MaRKET fOR:

2006 PRof ile of Home BuyeRs & selleRs cHaPteR 6: Home selleRs aND tHeiR sell iNg exPeRieNce
SaTISfacTION WITH THE SEllING pROcESS
Many.factors.contribute.to.the.ultimate.satisfaction.of.sellers.with.the.process.of.selling.their.home..Overall,.two-thirds.of.sellers.reported.that.they.were.very.satisfied.with.the.selling.process,.while.an.additional.25.percent.were.somewhat.satisfied..
Exhibit 6-26
SaTISfacTION WITH THE SEllING pROcESS(Percentage Distribution)
72
pRIcE REdUcTIONSThe.number.of.times.a.home’s.price.
is.reduced.is.also.related.to.the.time.on.the.market...Overall,.53.percent.of.home.sellers.did.not.reduce.their.asking.price,.while.34.percent.reduced.it.one.time...For.homes.on.the.market.for.one.week.or.less,.12.percent.reduced.their.asking.price.at.least.once,.while.for.those.homes.on.the.market.at.least.17.weeks.and.ultimately.sold,.79.percent.had.at.least.one.price.reduction...In.fact,.one.in.five.homes.in.this.latter.group.had.their.price.reduced.at.least.three.times.before.being.sold.
Exhibit 6-25
NUMbER Of TIMES aSKING pRIcE WaS REdUcEd, by NUMbER Of WEEKS HOME WaS ON THE MaRKET(Percentage Distribution)
all Sellers
less than 1 week
1 to 2 weeks
3 to 4 weeks
5 to 8 weeks
9 to 16 weeks
17 or more
weeks
None, i did not reduce my asking price
53% 88% 77% 67% 43% 33% 21%
one 34 12 21 31 50 47 37
two 8 * 1 2 7 14 19
three or more 5 * * * 1 5 22
SEllERS WHOSE HOME WaS ON THE MaRKET fOR:
Somewhat dissatisfied7%
Somewhat Satisfied
25%
Very dissatisfied4%
Very Satisfied65%
*Less than one percent
73
SS EllING a HOME ENTaIlS MaNy TaSKS INclUdING pREpaRING THE HOME fOR SalE
by.making.value-added.improvements,.developing.a.marketing.plan,..determining.
the.right.listing.price,.negotiating.with.potential.buyers.and.preparing.for.settlement...
Most.sellers.rely.on.real.estate.professionals.to.assist.them.in.this.process...Sellers.
indicate.that.the.most.important.service.they.expect.from.their.agents.is.help.
selling.the.home.within.a.specific.timeframe...When.searching.for.an.agent,.sellers.
most.often.consider.referrals.from.friends.or.neighbors,.or.use.the.same.agent.
who.helped.them.in.an.earlier.home.sale...Among.those.who.work.with.real.estate.
agents.to.sell.their.homes,.nearly.two-thirds.conclude.they.would.definitely.use.the.
same.agent.again.or.recommend.the.agent.to.others...
cHaPteR Home selliNg aND Real estate PRofessioNals77
NatioNal associat ioN of RealtoRs ®
Sixty-three percent of sellers reported they
would definitely use the same agent again or
recommend the agent to others.
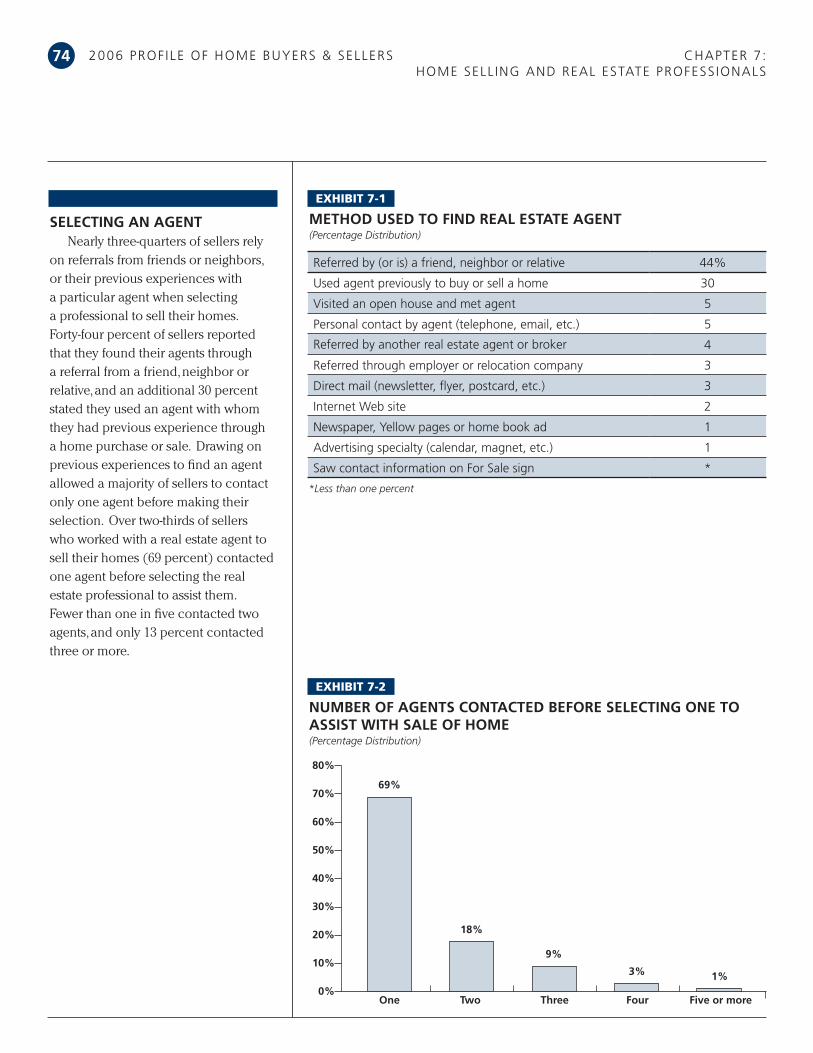
2006 PRof ile of Home BuyeRs & selleRs cHaPteR 7: Home sell iNg aND Real estate PRofess ioNals
74
SElEcTING aN aGENTNearly.three-quarters.of.sellers.rely.
on.referrals.from.friends.or.neighbors,.or.their.previous.experiences.with.a.particular.agent.when.selecting.a.professional.to.sell.their.homes....Forty-four.percent.of.sellers.reported.that.they.found.their.agents.through.a.referral.from.a.friend,.neighbor.or.relative,.and.an.additional.30.percent.stated.they.used.an.agent.with.whom.they.had.previous.experience.through.a.home.purchase.or.sale...Drawing.on.previous.experiences.to.find.an.agent.allowed.a.majority.of.sellers.to.contact.only.one.agent.before.making.their.selection...Over.two-thirds.of.sellers.who.worked.with.a.real.estate.agent.to.sell.their.homes.(69.percent).contacted.one.agent.before.selecting.the.real.estate.professional.to.assist.them...Fewer.than.one.in.five.contacted.two.agents,.and.only.13.percent.contacted.three.or.more...
Exhibit 7-1
METHOd USEd TO fINd REal ESTaTE aGENT(Percentage Distribution)
Exhibit 7-2
NUMbER Of aGENTS cONTacTEd bEfORE SElEcTING ONE TO aSSIST WITH SalE Of HOME(Percentage Distribution)
Referred by (or is) a friend, neighbor or relative 44%
used agent previously to buy or sell a home 30
Visited an open house and met agent 5
Personal contact by agent (telephone, email, etc.) 5
Referred by another real estate agent or broker 4
Referred through employer or relocation company 3
Direct mail (newsletter, flyer, postcard, etc.) 3
internet Web site 2
Newspaper, yellow pages or home book ad 1
advertising specialty (calendar, magnet, etc.) 1
saw contact information on for sale sign *
*Less than one percent
60%
50%
40%
30%
20%
10%
0%Two
69%
18%
3%
70%
80%
Three four five or more
9%
1%
One

NatioNal associat ioN of RealtoRs ® 75
SEllER EXpEcTaTIONSHome.sellers,.like.home.buyers,.have.
a.number.of.particular.expectations.of.their.real.estate.agent...One-quarter.of.sellers.most.wanted.their.agent.to.help.them.sell.their.home.within.a.specific.timeframe,.while.22.percent.most.wanted.help.finding.a.buyer.for.their.home...Sixteen.percent.of.sellers.most.wanted.their.agent.to.help.market.their.home.to.potential.buyers,.and.another.16.percent.most.wanted.assistance.in.pricing.the.home.competitively...
Exhibit 7-3
dId SEllER USE THE SaME REal ESTaTE aGENT fOR THEIR HOME pURcHaSE?(Percentage Distribution among Those Who Used an Agent to Purchase a Home)
Exhibit 7-4
WHaT SEllERS MOST WaNT fROM REal ESTaTE aGENTS(Percentage Distribution)
Help sell the home within specific timeframe 25%
Help find a buyer for home 22
Help seller market home to potential buyers 16
Help price home competitively 16
Help seller find ways to fix up home to sell it for more 10
Help with negotiation and dealing with buyers 4
Help with paperwork/inspections/preparing for settlement 3
Help see homes available for seller to purchase 1
other 2
yes50%
No50%
USING THE SaME aGENTSellers.often.purchase.another.
home.at.the.same.time.they.sell.their.current.residence...When.both.the.homes.sold.and.purchased.are.in.the.same.area,.they.may.choose.to.use.the.same.agent.for.both.transactions...Half.of.the.home.sellers.indicated.that.they.used.the.same.agent.who.assisted.them.with.their.recent.home.purchase....

2006 PRof ile of Home BuyeRs & selleRs
MaRKETING METHOdSThe.Internet.has.become.one.of.
the.most-used.marketing.tool.by.real.estate.agents.in.all.four.regions.of.the.country,.and.in.85.percent.of.home.sales.nationally...This.is.followed.by.yard.signs,.used.in.78.percent.of.home.sales,.and.open.houses,.used.in.56.percent.of.sales...While.print.newspaper.advertisements.remained.popular.in.the.Northeast.(60.percent).and.Midwest.(55.percent),.their.appeal.is.lower.in.the.South.and.the.West,.where.they.were.used.by.real.estate.agents.in.less.than.half.of.recent.home.sales...
Exhibit 7-6
METHOdS REal ESTaTE aGENT USEd TO MaRKET HOME, by REGION(Percent of Respondents who Used a Real Estate Agent to Sell)
all Sellers Northeast Midwest South West
listing on the internet 85% 85% 84% 86% 84%
yard sign 78 66 82 79 81
open house 56 65 56 51 61
Print newspaper advertisement
48 60 55 42 42
Real estate magazine 32 33 33 32 30
Direct mail (flyers, postcards, etc.)
22 20 17 21 29
television 4 4 4 4 4
other 5 7 5 5 6
SEllERS WHO pURcHaSEd a HOME IN THE:
Exhibit 7-5
MOST IMpORTaNT facTOR IN cHOOSING a REal ESTaTE aGENT TO SEll HOME(Percentage Distribution)
agent is friend or family member
15%
Reputation of real estate agent35%
agent is honest and trustworthy21%
agent has a caring personality/good
listener5%
agent’s knowledge of the
neighborhood11%
agent’s association with a particular firm
6%
professional designation(s) held by real estate agent2% Other
5%
MOST IMpORTaNT facTORS IN SElEcTING aN aGENT
When.choosing.a.real.estate.professional,.the.reputation.of.the.agent.was.the.most.important.factor.for.over.one-third.of.sellers.(35.percent).while.the.agent’s.honesty.and.trustworthiness.was.the.most.important.criteria.for.over.one-fifth.of.them...Fifteen.percent.of.sellers.mentioned.that.the.agent.they.worked.with.was.a.friend.or.a.family.member,.which.prompted.their.decision,.and.11.percent.reported.that.the.most.important.factor.they.considered.was.the.agent’s.knowledge.of.the.neighborhood...
cHaPteR 7: Home sell iNg aND Real estate PRofess ioNals
76

NatioNal associat ioN of RealtoRs ®
MUlTIplE lISTING SERVIcEThe.local.multiple.listing.service.
(MLS).is.one.of.the.most.frequently.used.tools.to.market.homes...The.MLS.allows.home.sellers.to.increase.the.exposure.of.their.property.among.thousands.of.real.estate.agents.assisting.home.buyers.in.their.home.search...Eighty-eight.percent.of.recent.home.sellers.reported.that.their.home.was.listed.on.an.MLS.
Exhibit 7-7
HOME lISTEd ON MUlTIplE lISTING SERVIcE(Percentage Distribution)
No5% yes
88%
don’t know6%
lEVEl Of SERVIcE pROVIdEd by THE aGENT
A.dominant.majority.(83.percent).of.home.sellers.reported.their.real.estate.agents.provided.a.broad.range.of.services.and.managed.most.aspects.of.their.home.sale...Among.sellers.using.a.real.estate.agent,.those.who.requested.only.a.limited.set.of.services.from.their.real.estate.agents.and.those.who.requested.their.agents.limit.services.to.the.listing.of.the.home.on.the.MLS.each.accounted.for.less.than.10.percent.of.recent.sellers...
Exhibit 7-8
lEVEl Of SERVIcE pROVIdEd by THE REal ESTaTE aGENT(Percentage Distribution)
a limited set of services as
requested by the seller
9%
a broad range of services and management of most aspects of the home sale, including an MlS listing.83%
The agent listed the home on the MlS and performed few if any additional services 8%
77

2006 PRof ile of Home BuyeRs & selleRs
aGENT cOMpENSaTIONMore.than.four.out.of.five.home.
sellers.reported.that.they,..rather.than.the.buyers,.compensated.the.real.estate.agent.who.assisted.with.the.transaction...In.three-quarters.of.the.sales.where.a.real.estate.agent.participated,.the.agent’s.compensation.was.a.percentage.of.the.sales.price...Eight.percent.of.sellers.using.an.agent.reported.that.both.the.buyer.and.seller.paid.the.real.estate.agent,.while.5.percent.of.sellers.noted.that.the.buyer.compensated.the.selling.agent..
Exhibit 7-10
WOUld SEllER USE REal ESTaTE aGENT aGaIN OR REcOMMENd TO OTHERS(Percentage Distribution)
USE THE aGENT aGaINSixty-three.percent.of.sellers.
reported.they.would.definitely.use.the.same.agent.again.or.recommend.the.agent.to.others...An.additional.19.percent.would.probably.use.or.recommend.the.agent...Only.7.percent.noted.they.would.definitely.not.use.their.agents.again.or.recommend.them.to.others..
Exhibit 7-9
HOW REal ESTaTE aGENT WaS cOMpENSaTEd(Percentage Distribution)
Paid by seller 81%
Percent of sales price 75
flat fee 4
Per task fee *
other 1
Don’t Know 2
Paid by buyer and seller 8
Paid by buyer only 5
other 4
Don’t Know 2
60%
50%
40%
30%
20%
10%
0%
8%
70%63%
2%7%
19%
definitely probably probably Not definitely Not don’t Know
78 cHaPteR 7: Home sell iNg aND Real estate PRofess ioNals
*Less than one percent

AASUccESSfUl HOME SalE REQUIRES THE pERfORMaNcE Of MaNy TaSKS SUcH aS
determining.the.listing.price,.preparing.the.home.for.sale.and.managing.all.of.the.
paperwork.necessary.to.complete.the.transaction...Some.sellers.choose.to.take.on.
these.tasks.and.sell.their.home.without.the.assistance.of.a.real.estate.agent..Many.of.
these.for-sale-by-owner.(FSBO).sellers.do.not.use.an.agent.because.they.were.able.
to.sell.their.home.to.someone.they.knew.prior.to.the.transaction.and.consequently.
did.not.require.the.services.of.an.agent...Those.FSBO.sellers.who.did.not.already.
have.a.potential.buyer.in.the.wings.engaged.in.a.home.sale.requiring.a.broader.
array.of.marketing.methods,.similar.to.those.used.by.agent-assisted.open-market.
transactions.
cHaPteR foR sale By oWNeR selleRs88
79NatioNal associat ioN of RealtoRs ®
Sellers in small towns and rural areas are more
likely to sell without an agent than sellers in the
suburbs, urban areas or resort locations.

fSbO SalESTwelve.percent.of.all.home.
sales.were.completed.by.the.sellers.themselves,.without.the.assistance.of.a.real.estate.agent...These.for-sale-by-owner.(FSBO).sellers.sometimes.choose.to.sell.without.an.agent.if.they.know.the.buyers.through.either.a.family.or.personal.relationship.prior.to.the.sale...Among.all.sellers,.5.percent.were.FSBOs.who.knew.the.buyer.and.7.percent.were.FSBO.sellers.who.did.not.know.the.buyer.
The.share.of.FSBO.sales.varies.by.location...Sellers.in.small.towns.and.rural.areas.are.more.likely.to.sell.without.an.agent.than.sellers.in.the.suburbs,.urban.areas.or.resort.locations..For.example,.17.percent.of.sellers.located.in.small.towns.were.FSBOs,.compared.with.11.percent.of.suburban.or.urban.sellers..
Exhibit 8-1
fSbO aNd aGENT-aSSISTEd SalES, by lOcaTION(Percentage Distribution)
fSbO SalES TRENdSOver.time.the.share.of.sellers.who.
do.not.use.a.real.estate.agent.has.trended.downward...The.share.has.fallen.from.14.percent.in.2003.and.2004.to.12.percent.today...A.consistent.5.percent.of.sales.were.between.a.seller.and.a.buyer.who.knew.each.other.prior.to.the.sale..Consequently,.the.open-market.FSBO.rate.in.recent.years.has.been.no.greater.than.one.in.10.sales..
Exhibit 8-2
fSbO aNd aGENT-aSSISTEd SalES, 2003-2006(Percentage Distribution)
all sellers
Suburb/ Subdivision
Small town
Urban/ central
cityRural area
Resort/ Recreation
area
for-sale-by-owner (fsBo)
12% 11% 17% 11% 16% 10%
seller knew buyer 5 4 7 6 7 6
seller did not know buyer
7 7 10 5 9 4
agent-assisted 84 86 80 86 81 85
other 3 3 3 4 3 5
SEllERS WHO SOld a HOME IN a:
2003 2004 2005 2006
all fsBo (for-sale-by-owner) 14% 14% 13% 12%
seller knew buyer 5 5 5 5
seller did not know buyer 9 10 8 7
agent-assisted 83 82 85 84
other 4 4 2 3
cHaPteR 8: foR sale By oWNeR selleRs80 2006 PRof ile of Home BuyeRs & selleRs

NatioNal associat ioN of RealtoRs ®
cHaRacTERISTIcS Of fSbO SEllERS
There.is.no.meaningful.difference.in.the.median.age.of.FSBO.sellers.(47.years.old).compared.with.those.who.were.assisted.by.a.real.estate.agent.(46.years.old)...FSBO.sellers.tend.to.have.a.somewhat.lower.median.income.($77,800).than.agent-assisted.sellers.($85,900)...Some.of.this.difference.is.a.reflection.of.the.higher.share.of.FSBO.sales.in.rural.and.small-town.areas.where.household.incomes.are.often.lower...Those.sellers.who.first.tried.to.sell.their.home.themselves,.but.then.used.a.real.estate.agent.were,.however,.younger.(43.years.old).and.had.a.lower.median.income.($70,700).than.the.typical.FSBO.seller..
Seventy-three.percent.of.agent-assisted.sellers.were.married,.compared.with.70.percent.of.FSBO.sellers...Sixteen.percent.of.FSBO.sellers.were.single.females,.similar.to.the.percentage.among.agent-assisted.sellers,.and.8.percent.were.single.males.
FSBO.sellers.have.owned.a.median.of.two.homes.(including.the.one.that.they.recently.sold),.compared.with.agent-assisted.sellers.who.have.owned.a.median.of.three.homes..One.in.five.FSBO.sellers.who.knew.the.buyer.were.selling.their.first.home..
Exhibit 8-3
cHaRacTERISTIcS Of fSbO aNd aGENT-aSSISTEd SEllERS
all Sellers all fSbO
Seller Knew buyer
Seller did not Know buyer
all agent-assisted
agent-assisted
only
first fSbO, then
agent-assisted
median age 46 47 48 46 46 46 43
median income
$83,800 $77,800 $78,300 $78,000 $85,900 $87,100 $70,700
Household composition
married couple
72% 70% 60% 78% 73% 73% 67%
single female
17 16 22 12 16 16 16
single male 6 8 10 6 6 6 7
unmarried couple
4 5 7 3 4 4 7
other 1 1 1 * 1 1 3
Number of homes owned
one 13% 14% 20% 11% 13% 11% 34%
two 33 36 35 37 33 33 27
three 21 21 19 21 22 22 21
four 15 14 12 15 14 15 7
five or more 18 15 13 16 18 19 11
median 3 2 2 3 3 3 2
Household composition
Number of homes owned
fSbO aGENT-aSSISTEd
81
*Less than one percent
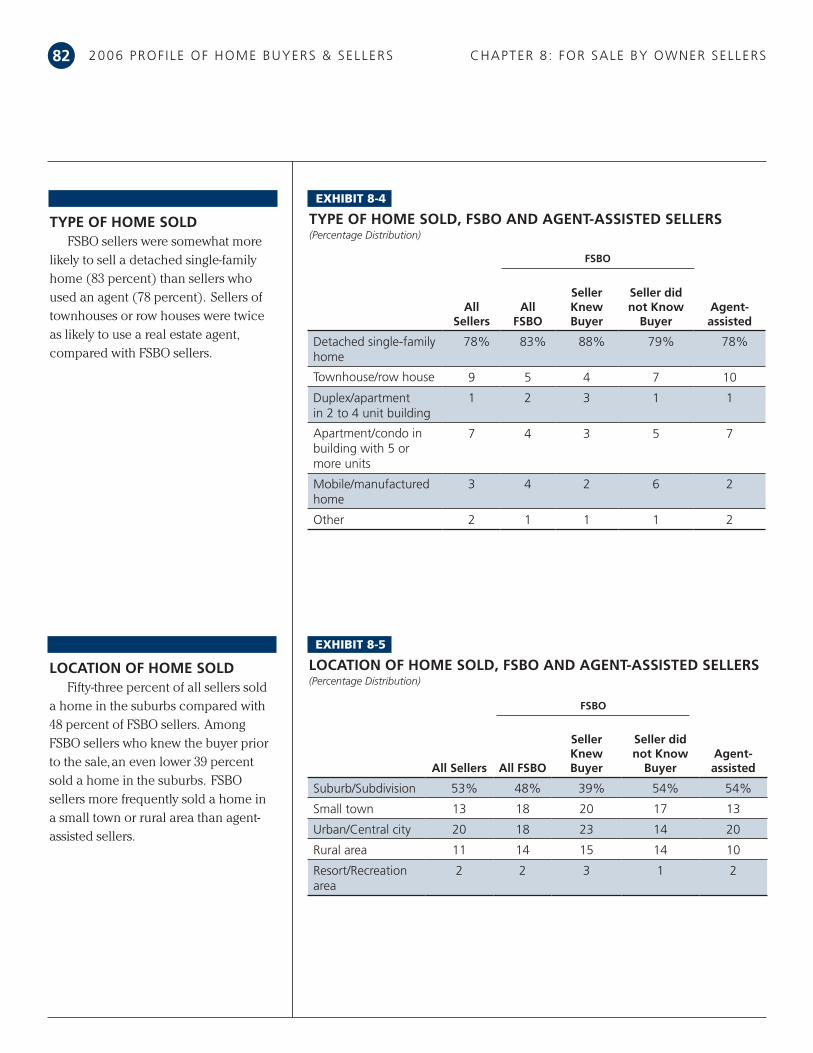
2006 PRof ile of Home BuyeRs & selleRs
TypE Of HOME SOldFSBO.sellers.were.somewhat.more.
likely.to.sell.a.detached.single-family.home.(83.percent).than.sellers.who.used.an.agent.(78.percent)...Sellers.of.townhouses.or.row.houses.were.twice.as.likely.to.use.a.real.estate.agent,.compared.with.FSBO.sellers.
Exhibit 8-4
TypE Of HOME SOld, fSbO aNd aGENT-aSSISTEd SEllERS(Percentage Distribution)
lOcaTION Of HOME SOldFifty-three.percent.of.all.sellers.sold.
a.home.in.the.suburbs.compared.with.48.percent.of.FSBO.sellers...Among.FSBO.sellers.who.knew.the.buyer.prior.to.the.sale,.an.even.lower.39.percent.sold.a.home.in.the.suburbs...FSBO.sellers.more.frequently.sold.a.home.in.a.small.town.or.rural.area.than.agent-assisted.sellers..
Exhibit 8-5
lOcaTION Of HOME SOld, fSbO aNd aGENT-aSSISTEd SEllERS(Percentage Distribution)
all Sellers
all fSbO
Seller Knew buyer
Seller did not Know
buyeragent-assisted
Detached single-family home
78% 83% 88% 79% 78%
townhouse/row house 9 5 4 7 10
Duplex/apartment in 2 to 4 unit building
1 2 3 1 1
apartment/condo in building with 5 or more units
7 4 3 5 7
mobile/manufactured home
3 4 2 6 2
other 2 1 1 1 2
fSbO
all Sellers all fSbO
Seller Knew buyer
Seller did not Know
buyeragent-assisted
suburb/subdivision 53% 48% 39% 54% 54%
small town 13 18 20 17 13
urban/central city 20 18 23 14 20
Rural area 11 14 15 14 10
Resort/Recreation area
2 2 3 1 2
fSbO
cHaPteR 8: foR sale By oWNeR selleRs82
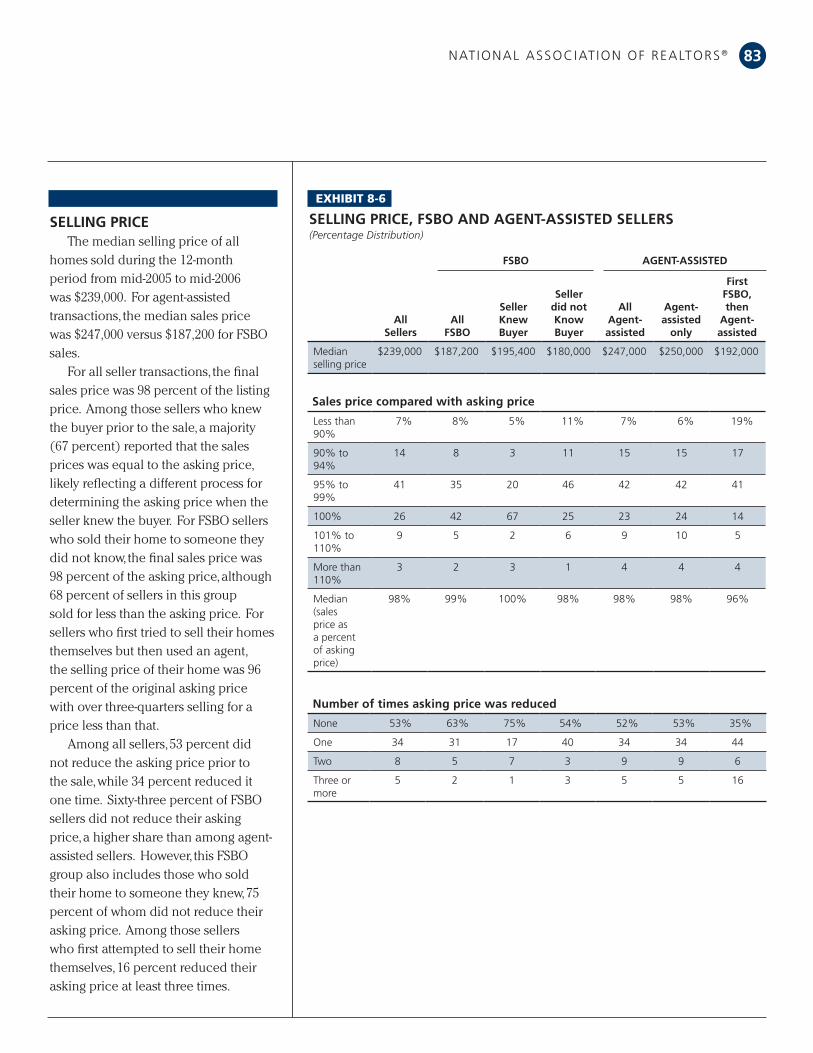
NatioNal associat ioN of RealtoRs ®
SEllING pRIcEThe.median.selling.price.of.all.
homes.sold.during.the.12-month.period.from.mid-2005.to.mid-2006.was.$239,000...For.agent-assisted.transactions,.the.median.sales.price.was.$247,000.versus.$187,200.for.FSBO.sales...
For.all.seller.transactions,.the.final.sales.price.was.98.percent.of.the.listing.price...Among.those.sellers.who.knew.the.buyer.prior.to.the.sale,.a.majority.(67.percent).reported.that.the.sales.prices.was.equal.to.the.asking.price,.likely.reflecting.a.different.process.for.determining.the.asking.price.when.the.seller.knew.the.buyer...For.FSBO.sellers.who.sold.their.home.to.someone.they.did.not.know,.the.final.sales.price.was.98.percent.of.the.asking.price,.although.68.percent.of.sellers.in.this.group.sold.for.less.than.the.asking.price...For.sellers.who.first.tried.to.sell.their.homes.themselves.but.then.used.an.agent,.the.selling.price.of.their.home.was.96.percent.of.the.original.asking.price.with.over.three-quarters.selling.for.a.price.less.than.that..
Among.all.sellers,.53.percent.did.not.reduce.the.asking.price.prior.to.the.sale,.while.34.percent.reduced.it.one.time...Sixty-three.percent.of.FSBO.sellers.did.not.reduce.their.asking.price,.a.higher.share.than.among.agent-assisted.sellers...However,.this.FSBO.group.also.includes.those.who.sold.their.home.to.someone.they.knew,.75.percent.of.whom.did.not.reduce.their.asking.price...Among.those.sellers.who.first.attempted.to.sell.their.home.themselves,.16.percent.reduced.their.asking.price.at.least.three.times.
Exhibit 8-6
SEllING pRIcE, fSbO aNd aGENT-aSSISTEd SEllERS(Percentage Distribution)
all Sellers
all fSbO
Seller Knew buyer
Seller did not Know buyer
all agent-assisted
agent-assisted
only
first fSbO, then
agent-assisted
median selling price
$239,000 $187,200 $195,400 $180,000 $247,000 $250,000 $192,000
sales price compared with listing price:
less than 90%
7% 8% 5% 11% 7% 6% 19%
90% to 94%
14 8 3 11 15 15 17
95% to 99%
41 35 20 46 42 42 41
100% 26 42 67 25 23 24 14
101% to 110%
9 5 2 6 9 10 5
more than 110%
3 2 3 1 4 4 4
median (sales price as a percent of asking price)
98% 99% 100% 98% 98% 98% 96%
Number of times listing price was reduced:
None 53% 63% 75% 54% 52% 53% 35%
one 34 31 17 40 34 34 44
two 8 5 7 3 9 9 6
three or more
5 2 1 3 5 5 16
Sales price compared with asking price
Number of times asking price was reduced
83
fSbO aGENT-aSSISTEd

2006 PRof ile of Home BuyeRs & selleRs
TIME ON THE MaRKETFor.all.sellers,.the.median.length.of.
time.their.home.was.on.the.market.was.six.weeks..For.FSBO.sellers,.the.time.on.the.market.was.a.shorter.three.weeks...However,.among.those.FSBO.sellers.who.sold.their.homes.to.someone.they.knew,.the.typical.time.on.the.market.was.one.week,.while.among.open-market.FSBO.transactions,.the.median.time.on.the.market.was.four.weeks..The.median.time.on.the.market.for.agent-assisted.transactions.was.six.weeks,.suggesting.that.these.transactions.had.a.longer.period.of.exposure.on.the.open.market.before.a.sale.occurred..
Exhibit 8-7
TIME ON THE MaRKET, fSbO aNd aGENT-aSSISTEd SEllERS(Percentage Distribution)
URGENcy TO SEllOne.in.five.FSBO.sellers.reported.a.
need.to.sell.very.urgently,.a.percentage.comparable.to.the.percentage.of.agent-assisted.sellers.needing.a.quick.sale...Among.FSBO.sellers,.13.percent.of.those.who.sold.to.a.buyer.they.knew.were.very.urgent.to.sell,.compared.with.23.percent.of.FSBO.sellers.who.sold.to.someone.they.did.not.know..
Exhibit 8-8
SEllER URGENcy, fSbO aNd aGENT-aSSISTEd SEllERS(Percentage Distribution)
all Sellers
all fSbO
Seller Knew buyer
Seller did not Know buyer
all agent-assisted
agent-assisted
only
first fSbO, then
agent-assisted
less than 1 week 5% 19% 40% 8% 3% 3% N/a
1 to 2 weeks 27 29 36 26 27 27 12
3 to 4 weeks 15 17 4 22 14 15 5
5 to 6 weeks 7 5 4 4 8 8 5
7 to 8 weeks 8 6 6 5 8 8 8
9 to 10 weeks 4 2 2 2 5 5 6
11 to 16 weeks 16 16 * 23 16 16 20
17 or more weeks
18 8 7 8 19 18 44
median weeks 6 3 1 4 6 6 12
fSbO aGENT-aSSISTEd
fSbO aGENT-aSSISTEd
Sellers needed to sell:
all Sellers
all fSbO
Seller Knew buyer
Seller did not Know buyer
all agent-assisted
agent-assisted
only
first fSbO, then
agent-assisted
Very urgently 20% 19% 13% 23% 20% 20% 10%
somewhat urgently
50 47 61 37 51 50 58
Not urgently 30 34 25 40 30 29 32
cHaPteR 8: foR sale By oWNeR selleRs84
*Less than one percent
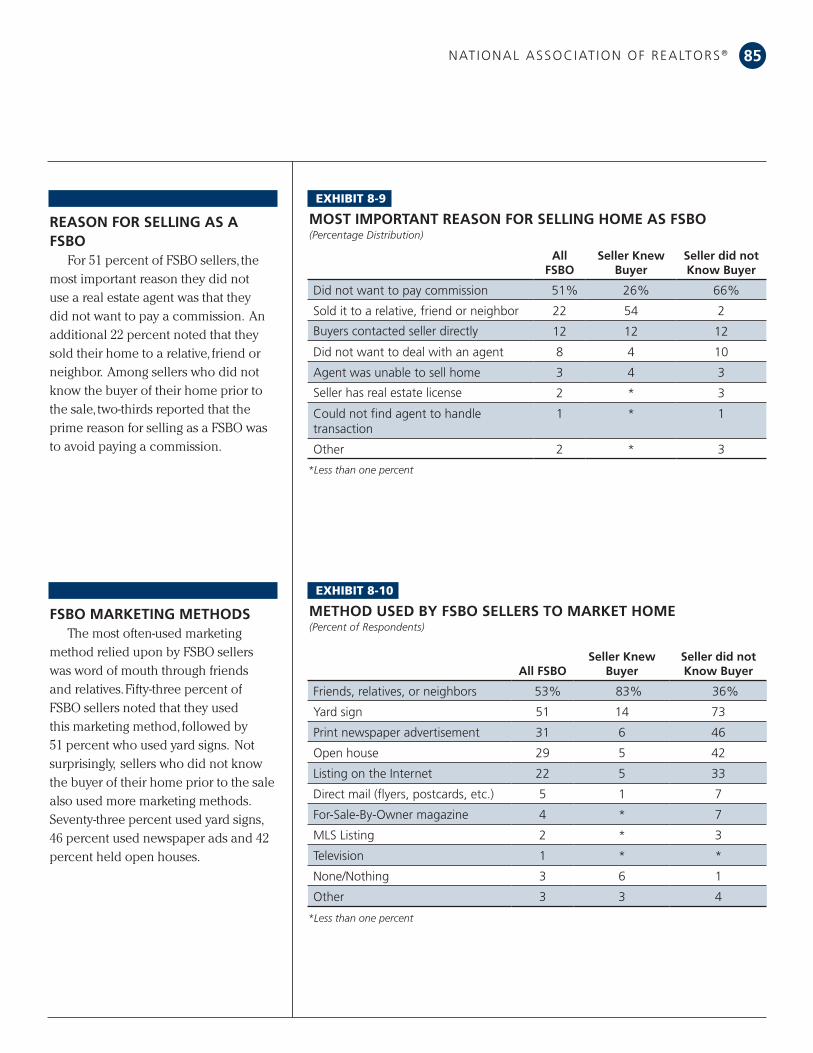
NatioNal associat ioN of RealtoRs ®
REaSON fOR SEllING aS a fSbO
For.51.percent.of.FSBO.sellers,.the.most.important.reason.they.did.not.use.a.real.estate.agent.was.that.they.did.not.want.to.pay.a.commission...An.additional.22.percent.noted.that.they.sold.their.home.to.a.relative,.friend.or.neighbor...Among.sellers.who.did.not.know.the.buyer.of.their.home.prior.to.the.sale,.two-thirds.reported.that.the.prime.reason.for.selling.as.a.FSBO.was.to.avoid.paying.a.commission.
Exhibit 8-9
MOST IMpORTaNT REaSON fOR SEllING HOME aS fSbO(Percentage Distribution)
fSbO MaRKETING METHOdSThe.most.often-used.marketing.
method.relied.upon.by.FSBO.sellers.was.word.of.mouth.through.friends.and.relatives..Fifty-three.percent.of.FSBO.sellers.noted.that.they.used.this.marketing.method,.followed.by.51.percent.who.used.yard.signs...Not.surprisingly,..sellers.who.did.not.know.the.buyer.of.their.home.prior.to.the.sale.also.used.more.marketing.methods...Seventy-three.percent.used.yard.signs,.46.percent.used.newspaper.ads.and.42.percent.held.open.houses..
Exhibit 8-10
METHOd USEd by fSbO SEllERS TO MaRKET HOME(Percent of Respondents)
all fSbOSeller Knew
buyerSeller did not Know buyer
friends, relatives, or neighbors 53% 83% 36%
yard sign 51 14 73
Print newspaper advertisement 31 6 46
open house 29 5 42
listing on the internet 22 5 33
Direct mail (flyers, postcards, etc.) 5 1 7
for-sale-By-owner magazine 4 * 7
mls listing 2 * 3
television 1 * *
None/Nothing 3 6 1
other 3 3 4
all fSbO
Seller Knew buyer
Seller did not Know buyer
Did not want to pay commission 51% 26% 66%
sold it to a relative, friend or neighbor 22 54 2
Buyers contacted seller directly 12 12 12
Did not want to deal with an agent 8 4 10
agent was unable to sell home 3 4 3
seller has real estate license 2 * 3
could not find agent to handle transaction
1 * 1
other 2 * 3
*Less than one percent
*Less than one percent
85
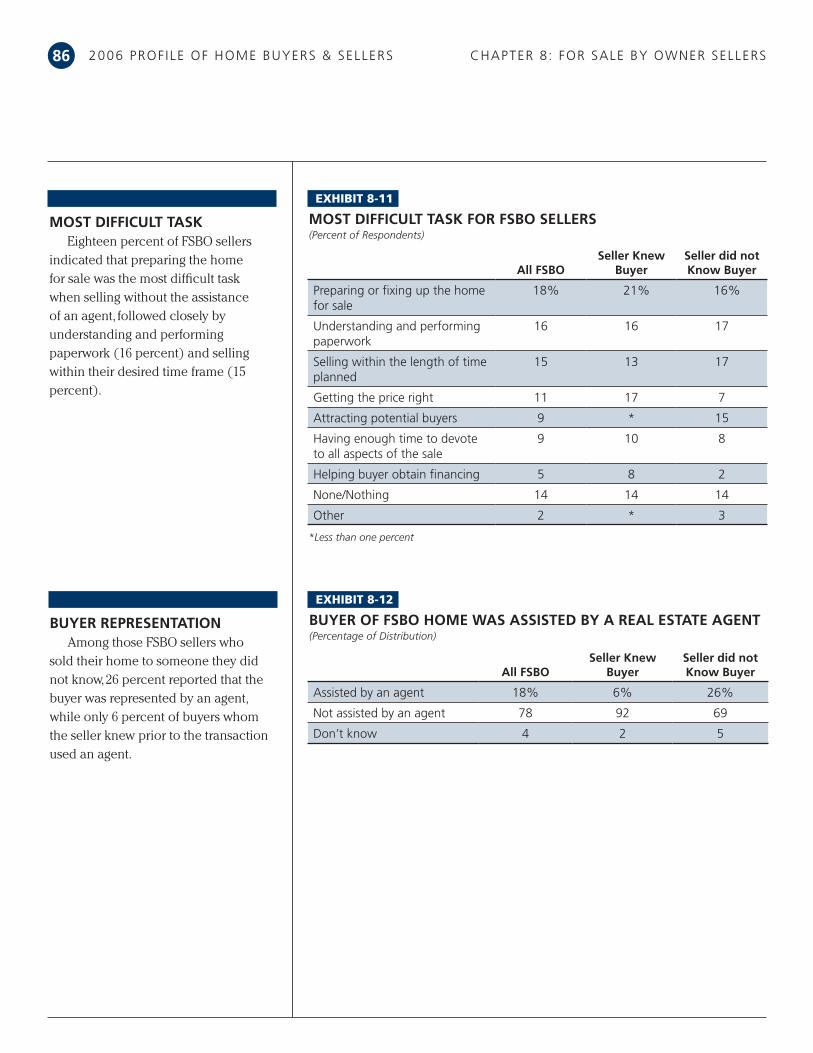
2006 PRof ile of Home BuyeRs & selleRs
MOST dIffIcUlT TaSKEighteen.percent.of.FSBO.sellers.
indicated.that.preparing.the.home.for.sale.was.the.most.difficult.task.when.selling.without.the.assistance.of.an.agent,.followed.closely.by.understanding.and.performing.paperwork.(16.percent).and.selling.within.their.desired.time.frame.(15.percent)..
Exhibit 8-11
MOST dIffIcUlT TaSK fOR fSbO SEllERS(Percent of Respondents)
all fSbOSeller Knew
buyerSeller did not Know buyer
Preparing or fixing up the home for sale
18% 21% 16%
understanding and performing paperwork
16 16 17
selling within the length of time planned
15 13 17
getting the price right 11 17 7
attracting potential buyers 9 * 15
Having enough time to devote to all aspects of the sale
9 10 8
Helping buyer obtain financing 5 8 2
None/Nothing 14 14 14
other 2 * 3
cHaPteR 8: foR sale By oWNeR selleRs86
*Less than one percent
bUyER REpRESENTaTIONAmong.those.FSBO.sellers.who.
sold.their.home.to.someone.they.did.not.know,.26.percent.reported.that.the.buyer.was.represented.by.an.agent,.while.only.6.percent.of.buyers.whom.the.seller.knew.prior.to.the.transaction.used.an.agent..
Exhibit 8-12
bUyER Of fSbO HOME WaS aSSISTEd by a REal ESTaTE aGENT(Percentage of Distribution)
all fSbOSeller Knew
buyerSeller did not Know buyer
assisted by an agent 18% 6% 26%
Not assisted by an agent 78 92 69
Don’t know 4 2 5
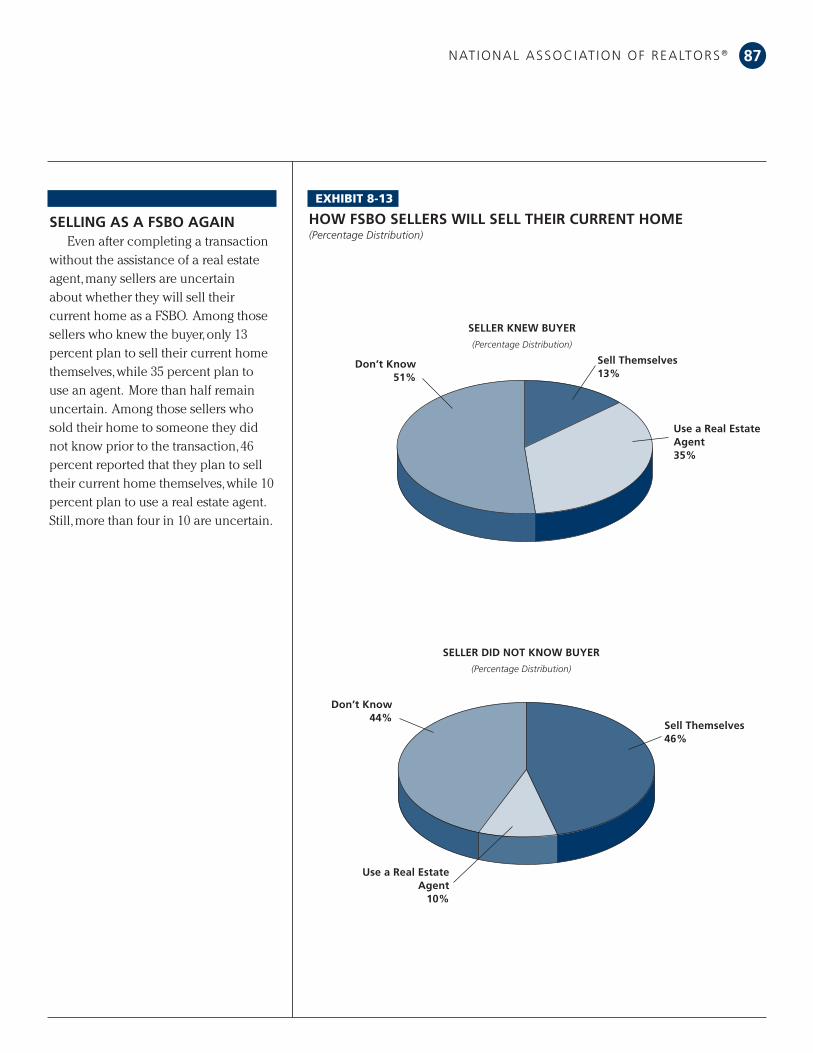
NatioNal associat ioN of RealtoRs ®
all fSbOSeller Knew
buyerSeller did not Know buyer
Preparing or fixing up the home for sale
18% 21% 16%
understanding and performing paperwork
16 16 17
selling within the length of time planned
15 13 17
getting the price right 11 17 7
attracting potential buyers 9 * 15
Having enough time to devote to all aspects of the sale
9 10 8
Helping buyer obtain financing 5 8 2
None/Nothing 14 14 14
other 2 * 3
87
SEllING aS a fSbO aGaINEven.after.completing.a.transaction.
without.the.assistance.of.a.real.estate.agent,.many.sellers.are.uncertain.about.whether.they.will.sell.their.current.home.as.a.FSBO...Among.those.sellers.who.knew.the.buyer,.only.13.percent.plan.to.sell.their.current.home.themselves,.while.35.percent.plan.to.use.an.agent...More.than.half.remain.uncertain...Among.those.sellers.who.sold.their.home.to.someone.they.did.not.know.prior.to.the.transaction,.46.percent.reported.that.they.plan.to.sell.their.current.home.themselves,.while.10.percent.plan.to.use.a.real.estate.agent...Still,.more.than.four.in.10.are.uncertain...
Exhibit 8-13
HOW fSbO SEllERS WIll SEll THEIR cURRENT HOME(Percentage Distribution)
Use a Real Estate agent35%
Sell Themselves13%
SEllER KNEW bUyER
(Percentage Distribution)
SEllER dId NOT KNOW bUyER
(Percentage Distribution)
don’t Know51%
Use a Real Estate agent
10%
don’t Know44%
Sell Themselves46%
88
EE VEN aS THE HOUSING MaRKET RETREaTS fROM THE RObUST pacE Of THE paST
several.years,.home.buying.and.selling.remains.an.important.segment.of.the.
national.and.local.economies...Buyers.and.sellers.continue.to.have.opportunities.to.
trade.up,.trade.down,.relocate.or.purchase.a.home...As.importantly,.first-time.buyers,.
accounting.for.36.percent.of.the.market,.are.discovering.and.capturing.the.benefits.
of.homeownership..
Consumers.rely.on.the.experience.and.expertise.of.real.estate.professionals.to.
assist.them.when.buying.and.selling.a.home..Working.in.an.extremely.competitive.
environment,.agents.and.brokers.provide.high.levels.of.service.to.meet.the.varied.
needs.of.home.buyers.and.sellers..The.value.that.consumers.place.on.the.services.
offered.by.real.estate.professionals.is.reflected.in.the.large.majority.of.both.buyers.
and.sellers.who.would.use.their.agents.again.or.recommend.them.to.others..
The.2006 NATIONAL ASSOCIATION OF REALTORS® Profile of Home Buyers
and Sellers.allows.real.estate.professionals.to.better.understand.their.clients.and.
how.their.needs.are.evolving.over.time...More.importantly,.the.information.in.this.
report.will.assist.REALTORS®.as.they.strive.to.offer.superior.service.to.America’s.
home.buyers.and.sellers.
coNclusioN
2006 PRof ile of Home BuyeRs & selleRs

89NatioNal associat ioN of RealtoRs ®
list of exHiBits
List of Exhibits
1-1. AGE.OF.HOME.BUYERS,.BY.REGION
1-2. HOUSEHOLD.INCOME.OF.HOME.BUYERS,.2005
1-3. ADULT.COMPOSITION.OF.HOME.BUYER.HOUSEHOLDS
1-4. NUMBER.OF.CHILDREN.UNDER.THE.AGE.OF.18.RESIDING.IN.HOUSEHOLD
1-5. RACE/ETHNICITY.OF.HOME.BUYERS,.BY.REGION
1-6. PRIMARY.LANGUAGE.SPOKEN.IN.HOME.BUYER.HOUSEHOLD,.BY.REGION
1-7. NATIONAL.ORIGIN.OF.HOME.BUYERS,.BY.REGION
1-8. FIRST-TIME.HOME.BUYERS
1-9. FIRST-TIME.HOME.BUYERS,.BY.REGION
1-10. FIRST-TIME.AND.REPEAT.HOME.BUYERS.BY.HOUSEHOLD.TYPE
1-11. AGE.OF.FIRST-TIME.AND.REPEAT.BUYERS
1-12. HOUSEHOLD.INCOME.OF.FIRST-TIME.AND.REPEAT.BUYERS,.2005
1-13. RACE/ETHNICITY.OF.FIRST-TIME.AND.REPEAT.BUYERS
1-14. PRIMARY.LANGUAGE.SPOKEN.IN.FIRST-TIME.AND.REPEAT.BUYER... HOUSEHOLD
1-15. NATIONAL.ORIGIN.OF.FIRST-TIME.AND.REPEAT.BUYERS
1-16. PRIOR.LIVING.ARRANGEMENT.OF.FIRST-TIME.AND.REPEAT.BUYERS
1-17. PRIMARY.REASON.FOR.PURCHASING.A.HOME,.FIRST-TIME.AND.REPEAT... BUYERS
1-18. PRIMARY.REASON.FOR.PURCHASING.A.HOME,.BY.AGE
1-19. AGE.OF.HOME.BUYERS,.BY.INTENDED.USE.OF.HOME
1-20. HOUSEHOLD.INCOME.OF.BUYERS,.BY.INTENDED.USE.OF.HOME
.
2-1. NEW.AND.PREVIOUSLY.OWNED.HOMES.PURCHASED,.1995-2006
2-2. NEW.AND.PREVIOUSLY.OWNED.HOMES.PURCHASED,.BY.REGION
2-3. TYPE.OF.HOME.PURCHASED,.BY.REGION
2-4. TYPE.OF.HOME.PURCHASED.BY.FIRST-TIME.AND.REPEAT.BUYERS
2-5. LOCATION.OF.HOME.PURCHASED,.BY.REGION
2-6. LOCATION.OF.HOME.PURCHASED.BY.FIRST-TIME.AND.REPEAT.BUYERS
2-7. LOCATION.OF.HOME.PURCHASED.VERSUS.LOCATION.OF.HOME.SOLD
2-8. DISTANCE.BETWEEN.HOME.PURCHASED.AND.PREVIOUS.RESIDENCE
2-9. FACTORS.INFLUENCING.NEIGHBORHOOD.CHOICE,.BY.LOCATION
2-10. PRICE.OF.HOME.PURCHASED,.BY.REGION
2-11. PRICE.OF.HOME.PURCHASED,.NEW.AND.PREVIOUSLY.OWNED.HOMES
2-12. PRICE.OF.HOME.PURCHASED,.FIRST-TIME.AND.REPEAT.BUYERS
2-13. PURCHASE.PRICE.COMPARED.WITH.ASKING.PRICE,.BY.REGION
2-14. SIZE.OF.HOME.PURCHASED,.FIRST-TIME.AND.REPEAT.BUYERS
2-15. HOME.SIZE.AND.PRICE.PER.SQUARE.FOOT,.BY.REGION
2-16. CHARACTERISTICS.OF.HOME.ON.WHICH.BUYER.COMPROMISED,... BY.LOCATION
2-17. CHARACTERISTICS.OF.HOME.ON.WHICH.BUYER.COMPROMISED,.FIRST-TIME... AND.REPEAT.BUYERS

2006 PRof ile of Home BuyeRs & selleRs90
2-18. EXPECTED.LENGTH.OF.TENURE.IN.HOME.PURCHASED,.FIRST-TIME.AND... REPEAT.BUYERS
2-19. EXPECTED.LENGTH.OF.TENURE.IN.HOME.PURCHASED,.BY.AGE
2-20. PURCHASE.PRICE,.PRIMARY.RESIDENCE.AND.SECOND.HOME
2-21. TYPE.OF.HOME,.PRIMARY.RESIDENCE.AND.SECOND.HOME
2-22. LOCATION.OF.HOME,.PRIMARY.RESIDENCE.AND.SECOND.HOME
.
3-1. SEARCH.ACTIVITY.OF.HOME.BUYERS,.BY.REGION. .
3-2. SEARCH.ACTIVITY.OF.FIRST-TIME.AND.REPEAT.BUYERS. .
3-3. LENGTH.OF.SEARCH.FOR.BUYERS.WHO.USED.AN.AGENT,.FIRST-TIME.AND... REPEAT.BUYERS. .
3-4. INFORMATION.SOURCES.USED.IN.HOME.SEARCH.BY.FIRST-TIME.AND... REPEAT.BUYERS. .
3-5. USEFULNESS.OF.INFORMATION.SOURCES. .
3-6. USE.OF.INTERNET.TO.SEARCH.FOR.HOMES,.BY.REGION. .
3-7. USE.OF.INTERNET.TO.SEARCH.FOR.HOMES.BY.FIRST-TIME.AND.REPEAT... BUYERS. .
3-8. USE.OF.INTERNET.TO.SEARCH.FOR.HOMES,.BY.AGE. .
3-9. USE.OF.INTERNET.TO.SEARCH.FOR.HOMES,.2003-2006..
3-10. ACTIONS.TAKEN.AS.A.RESULT.OF.INTERNET.HOME.SEARCH,.FIRST-TIME.AND... REPEAT.BUYERS. .
3-11. WHERE.BUYER.FOUND.THE.HOME.THEY.PURCHASED,.1997-2006
3-12. BUYERS.WHO.FOUND.THEIR.HOME.ON.THE.INTERNET,.1997-2006.
3-13. CHARACTERISTICS.OF.HOME.SEARCHERS,.BY.USE.OF.INTERNET
3-14. LENGTH.OF.SEARCH,.BY.USE.OF.INTERNET
3-15. NUMBER.OF.HOMES.VISITED,.BY.USE.OF.INTERNET
3-16. INFORMATION.SOURCES.USED.IN.HOME.SEARCH,.BY.USE.OF.INTERNET
3-17. WHERE.BUYERS.FOUND.THE.HOME.THEY.PURCHASED,.BY.USE.OF... INTERNET. .
3-18. METHOD.OF.HOME.PURCHASE,.BY.USE.OF.INTERNET..
3-19. WHAT.HOME.BUYERS.WERE.LOOKING.FOR.ONLINE,.FIRST-TIME.AND.REPEAT... BUYERS. .
3-20. WHAT.HOME.BUYERS.WERE.LOOKING.FOR.ONLINE,.BY.AGE. .
3-21. VALUE.OF.WEB.SITE.FEATURES. .
3-22. WEB.SITES.USED.IN.HOME.SEARCH,.BY.REGION. .
3-23. WEB.SITES.USED.IN.HOME.SEARCH.BY.FIRST-TIME.AND.REPEAT.BUYERS
4-1. METHOD.OF.HOME.PURCHASE,.1995-2006
4-2. METHOD.OF.HOME.PURCHASE,.BY.REGION
4-3. METHOD.OF.HOME.PURCHASE,.NEW.AND.PREVIOUSLY.OWNED.HOMES
4-4. AGENT.REPRESENTATION.DISCLOSURE,.FIRST-TIME.AND.REPEAT.BUYERS
4-5. BUYER.REPRESENTATIVE.ARRANGEMENT.WITH.AGENT,.FIRST-TIME.AND... REPEAT.BUYERS
4-6. HOW.REAL.ESTATE.AGENT.WAS.COMPENSATED
4-7. WHAT.BUYERS.WANT.MOST.FROM.REAL.ESTATE.AGENTS

91NatioNal associat ioN of RealtoRs ®
4-8. WHAT.BUYERS.WANT.MOST.FROM.REAL.ESTATE.AGENTS,.FIRST-TIME.AND... REPEAT.BUYERS
4-9. NUMBER.OF.REAL.ESTATE.AGENTS.USED.IN.THE.HOME.SEARCH
4-10. BENEFITS.PROVIDED.BY.REAL.ESTATE.AGENT.DURING.HOME.PURCHASE... PROCESS,.FIRST-TIME.AND.REPEAT.BUYERS
4-11. HOW.BUYER.FOUND.REAL.ESTATE.AGENT,.FIRST-TIME.AND.REPEAT.BUYERS
4-12. NUMBER.OF.REAL.ESTATE.AGENTS.INTERVIEWED.BY.FIRST-TIME.AND... REPEAT.BUYERS
4-13. MOST.IMPORTANT.FACTORS.WHEN.CHOOSING.AN.AGENT
4-14. IMPORTANCE.OF.REAL.ESTATE.AGENT.SKILLS.AND.QUALITIES
4-15. AGENT.SKILLS.AND.QUALITIES.CONSIDERED.‘VERY.IMPORTANT’.BY... FIRST-TIME.AND.REPEAT.BUYERS
4-16. SATISFACTION.WITH.REAL.ESTATE.AGENT.SKILLS.AND.QUALITIES
4-17. WOULD.BUYER.USE.REAL.ESTATE.AGENT.AGAIN.OR.RECOMMEND.TO... OTHERS
.
5-1. BUYERS.WHO.FINANCED.THEIR.HOME.PURCHASE,.BY.REGION
5-2. BUYERS.WHO.FINANCED.THEIR.HOME.PURCHASE,.BY.AGE
5-3. PERCENT.OF.HOME.FINANCED.BY.FIRST-TIME.AND.REPEAT.BUYERS
5-4. PERCENT.OF.HOME.FINANCED,.BY.REGION
5-5. SOURCES.OF.DOWNPAYMENT,.FIRST-TIME.AND.REPEAT.BUYERS
5-6. TYPE.OF.MORTGAGE,.FIRST-TIME.AND.REPEAT.BUYERS
5-7. HOME.PURCHASE.IS.A.GOOD.FINANCIAL.INVESTMENT,.FIRST-TIME.AND.... REPEAT.BUYERS
.
6-1. AGE.OF.HOME.SELLERS
6-2. HOUSEHOLD.INCOME.OF.HOME.SELLERS,.2005
6-3. ADULT.COMPOSITION.OF.HOME.SELLER.HOUSEHOLDS,.2004-2006
6-4. NUMBER.OF.CHILDREN.UNDER.THE.AGE.OF.18.RESIDING.IN.HOME.SELLER... HOUSEHOLD
6-5. RACE/ETHNICITY.OF.HOME.SELLERS,.BY.REGION
6-6. PRIMARY.LANGUAGE.SPOKEN.IN.HOME.SELLER.HOUSEHOLD,.BY.REGION
6-7. TYPE.OF.HOME.SOLD
6-8. LOCATION.OF.HOME.SOLD
6-9. TYPE.OF.HOME.SOLD.BY.LOCATION
6-10. SIZE.OF.HOME.PURCHASED.COMPARED.TO.HOME.RECENTLY.SOLD
6-11. SIZE.OF.HOME.PURCHASED.COMPARED.TO.HOME.RECENTLY.SOLD,.BY.AGE.. OF.SELLER
6-12. PRIMARY.REASON.FOR.SELLING.PREVIOUS.HOME,.BY.AGE
6-13. TENURE.IN.PREVIOUS.HOME,.BY.TYPE.OF.HOME
6-14. NUMBER.OF.HOMES.PREVIOUSLY.OWNED,.BY.AGE
6-15. DISTANCE.BETWEEN.HOME.PURCHASED.AND.HOME.RECENTLY.SOLD,... BY.REGION
6-16. TASKS.PERFORMED.IN.THE.SELLING.PROCESS
6-17. METHOD.USED.TO.SELL.HOME,.BY.REGION

2006 PRof ile of Home BuyeRs & selleRs92
6-18. METHOD.USED.TO.SELL.HOME,.BY.SELLER.URGENCY
6-19. METHOD.OF.SALE,.BY.BUYER.AND.SELLER.RELATIONSHIP
6-20. METHOD.USED.TO.SELL.HOME,.1995-2006
6-21. SALES.PRICE.COMPARED.WITH.LISTING.PRICE,.BY.REGION
6-22. SALES.PRICE.COMPARED.WITH.LISTING.PRICE,.BY.SELLER.URGENCY
6-23. NUMBER.OF.WEEKS.RECENTLY.SOLD.HOME.WAS.ON.THE.MARKET,.BY... REGION
6-24. SALES.PRICE.COMPARED.WITH.LISTING.PRICE,.BY.NUMBER.OF.WEEKS.. .. HOME.WAS.ON.THE.MARKET
6-25. NUMBER.OF.TIMES.ASKING.PRICE.WAS.REDUCED,.BY.NUMBER.OF.WEEKS... HOME.WAS.ON.THE.MARKET
6-26. SATISFACTION.WITH.THE.SELLING.PROCESS
7-1. METHOD.USED.TO.FIND.REAL.ESTATE.AGENT. .
7-2. NUMBER.OF.AGENTS.CONTACTED.BEFORE.SELECTING.ONE.TO.ASSIST.WITH... SALE.OF.HOME. .
7-3. DID.SELLER.USE.THE.SAME.REAL.ESTATE.AGENT.FOR.THEIR.HOME... PURCHASE?. .
7-4. WHAT.SELLERS.MOST.WANT.FROM.REAL.ESTATE.AGENTS
7-5. MOST.IMPORTANT.FACTOR.IN.CHOOSING.A.REAL.ESTATE.AGENT.TO.SELL... HOME. .
7-6. METHODS.REAL.ESTATE.AGENT.USED.TO.MARKET.HOME,.BY.REGION.
7-7. HOME.LISTED.ON.MULTIPLE.LISTING.SERVICE. .
7-8. LEVEL.OF.SERVICE.PROVIDED.BY.THE.REAL.ESTATE.AGENT. .
7-9. HOW.REAL.ESTATE.AGENT.WAS.COMPENSATED. .
7-10. WOULD.SELLER.USE.REAL.ESTATE.AGENT.AGAIN.OR.RECOMMEND.TO... OTHERS
8-1. FSBO.AND.AGENT-ASSISTED.SALES,.BY.LOCATION. . .
8-2. FSBO.AND.AGENT-ASSISTED.SALES,.2003-2006.. .
8-3. CHARACTERISTICS.OF.FSBO.AND.AGENT-ASSISTED.SELLERS. .
8-4. TYPE.OF.HOME.SOLD,.FSBO.AND.AGENT-ASSISTED.SELLERS. .
8-5. LOCATION.OF.HOME.SOLD,.FSBO.AND.AGENT-ASSISTED.SELLERS
8-6. SELLING.PRICE,.FSBO.AND.AGENT-ASSISTED.SELLERS
8-7. TIME.ON.THE.MARKET,.FSBO.AND.AGENT-ASSISTED.SELLERS
8-8. SELLER.URGENCY,.FSBO.AND.AGENT-ASSISTED.SELLERS
8-9. MOST.IMPORTANT.REASON.FOR.SELLING.HOME.AS.FSBO
8-10. METHOD.USED.BY.FSBO.SELLERS.TO.MARKET.HOME
8-11. MOST.DIFFICULT.TASK.FOR.FSBO.SELLERS
8-12. BUYER.OF.FSBO.HOME.WAS.ASSISTED.BY.A.REAL.ESTATE.AGENT
8-13. HOW.FSBO.SELLERS.WILL.SELL.THEIR.CURRENT.HOME
.

2006 OFFICERS
PresidentThomas M. Stevens, CRB
President-ElectPat A. Vredevoogd Combs, ABR, CRS, GRI, LTG
First Vice PresidentRichard F. Gaylord, GRI, CIPS, CRB, CRS
TreasurerBruce F. Wolf
Immediate Past PresidentAl Mansell, CRB
Vice President & Liaison to CommitteesStephen A. Hoover, GRI
Executive Vice President/CEODale Stinton
NATIONAL ASSOCIATION OF REALTORS®
430 N. Michigan AvenueChicago, IL 60611-40871-800-874-6500Web site: http://www.realtor.org
The NATIONAL ASSOCIATION OF REALTORS®, “The Voice for Real Estate,” is
America’s largest trade association, representing more than 1.3 million members,
including NAR’s institutes, societies and councils, involved in all aspects of the
residential and commercial real estate industries.
REALTOR®, REALTORS®, and REALTOR-ASSOCIATE® are registered collective
membership marks that identify,and may be used only by real estate professionals
who are members of the NATIONAL ASSOCIATION OF REALTORS® and subscribe
to its strict Code of Ethics.
For more information about the NATIONAL ASSOCIATION OF REALTORS®
and its network of strategic partners, visit the Association’s Web site at
www.REALTOR.org.
NATIONAL ASSOCIATIONOF REALTORS®
The Voice For Real Estate
NAR Realty CheckTM is your organizationÕ s source for custom information regarding
the real estate industry. Now your organization can take advantage of NAR Research's
forecasts, tracking capabilities, and analyses to broaden your understanding of the
marketplace and strengthen your business. NAR Realty CheckTM can help you stay on
top of your business by identifying growth opportunities in your market.To learn more
about NAR Realty CheckTM products and services please visit
www. NARRealtyCheck.com or contact Lynn Barber at (202) 383-1053, TJ Doyle at (202) 383-7535 or Hristina
Toshkova at (202) 383-7529.

NAR RESEARCH STAFF
Office of the Chief Economist
David A. Lereah, Ph.D.Senior Vice President and Chief Economist
Cassandra M. SimsSenior Executive Assistant
Real Estate Research
Robert D. BarrVice President,Research Division &Strategic Planning
Liz JohnsonCommunications Manager
Scott MacIntoshSenior Economist,Commercial andInvestment Real Estate
Quantitative Analysis and InternationalResearch
Lawrence Yun, Ph.D.Managing Director,Quantitative Research
Keunwon ChungStatistical Economist
Ken FearsManager,Regional Economics
Existing-Home Sales Statistics
Kevin J.ThorpeManager,Existing-Home Sales
Wannasiri ChompoopetSenior EHS Analyst
Michael HymanResearch Assistant
Business Research: Products and Services
Lynn BarberManaging Director,Business Research
Thomas DoyleManager,Research Marketing
Hristina ToshkovaManager,Research Business Strategies
National Center for Real EstateResearch (NCRER) and SurveyResearch
Paul C. Bishop, Ph.D.Manager,Real Estate Research andDirector of the National Center for RealEstate Research
Harika BickiciogluSenior Research Analyst
NATIONAL ASSOCIATION OF REALTORS®
RESEARCH DIVISION
The Research Division of the NATIONAL ASSOCIATION OF REALTORS® produces the premier
measurement of residential real estate activity – the existing-home sales series – and analyzes
how changes in the economy can impact the real estate business. It examines trends in real
estate practices and how NAR members are adapting technology in their business operations.
Additionally, NAR Research evaluates regulatory and legislative policy proposals for their
impact on REALTORS® and their clients, America’s property owners.
To find out about other products from NAR’s Research Division, visit www.REALTOR.org/research.
Learn more about NAR RealtyCheckTM products and services at www. www.NARRealtyCheck.com
NATIONAL ASSOCIATION OF REALTORS®
Research Division500 New Jersey Avenue, NWWashington, DC [email protected]

ITEM # 186-45-0506
NATIONAL ASSOCIATION OF REALTORS®
The Voice For Real Estate®