Thatcher Bay Nearshore Restoration Monitoring...
43
Thatcher Bay Nearshore Restoration Monitoring 2015 Thomas Peterman, University of Washington, June 2016 Prepared for: Skagit Fisheries Enhancement Group P.O. Box 2497 Mount Vernon, WA 98273 Phone: 360-336-0172
Transcript of Thatcher Bay Nearshore Restoration Monitoring...
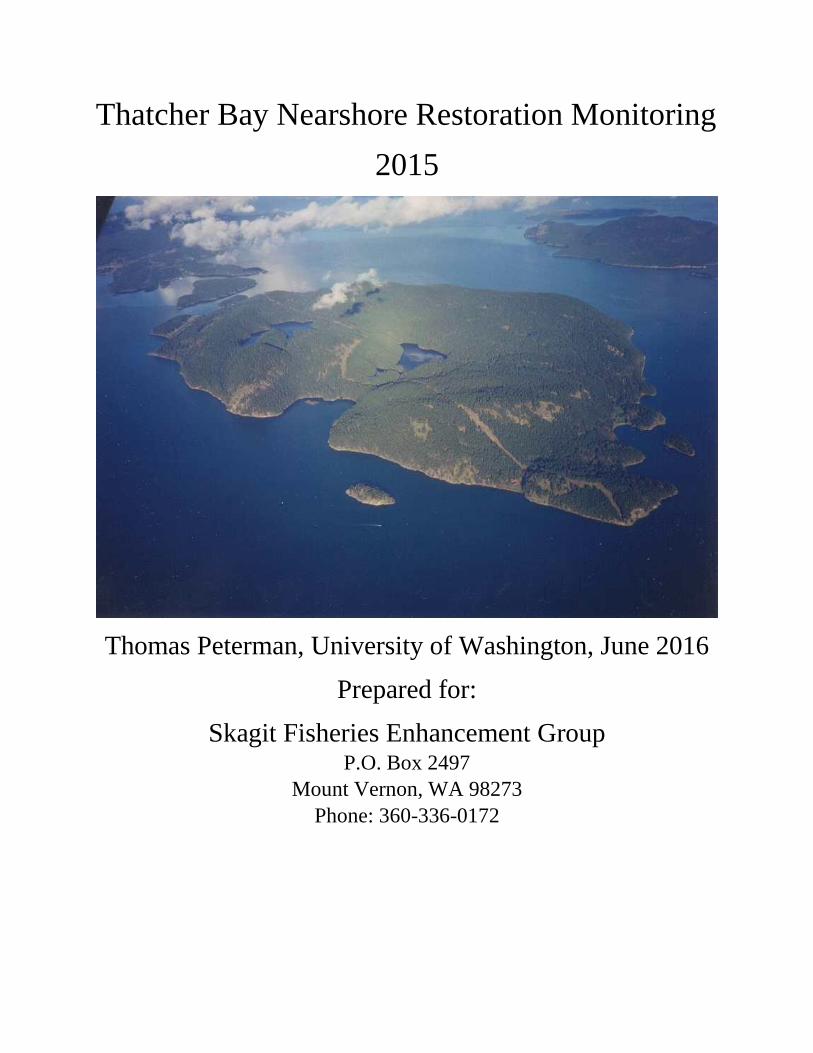
Thatcher Bay Nearshore Restoration Monitoring
2015
Thomas Peterman, University of Washington, June 2016
Prepared for:
Skagit Fisheries Enhancement Group
P.O. Box 2497
Mount Vernon, WA 98273
Phone: 360-336-0172
ii
Acknowledgements………………………………………………………………..iv
Executive Summary……………………………………………………………….v
1. Introduction………………………………………………………………………1
1.1 Goals and Objectives……………………………………………………………..2
1.2 Project History……………………………………………………………………2
1.3 Purpose of Monitoring and Project Elements ……………………………………4
2. Sediment Characterization…………………………………………………...5
2.1 Overview………………………………………………………………………….5
2.2 Methods…………………………………………………………………………...6
2.3 Results…………………………………………………………………………….8
3. Forage Fish Spawning Surveys…………………………………………….8
3.1 Overview………………………………………………………………………….8
3.2 Methods…………………………………………………………………………...9
3.3 Results……………………………………………………………………………10
4. Macroinvertebrate Assemblage Evaluation……………………………11
4.1Overview………………………………………………………………………….11
4.2Methods…………………………………………………………………………...12
4.3Results…………………………………………………………………………….12
5. Eelgrass (Zostera marina) Observations………………………………..15
5.1 Overview…………………………………………………………………………15
5.2 Methods…………………………………………………………………………..15
5.3 Results……………………………………………………………………………16
6. Discussion…………………………………………………………………………16
References…………………………………………………………………………….18
Appendix A: Additional Macroinvertebrate Results…………………...21
Appendix B: Forage Fish Survey Protocols……………………………....24
Appendix C: Sediment Analysis Protocols………………………………..25
iii
List of Figures
Figure 1. Location of the Thatcher Bay Nearshore Restoration Project…………………1
Figure 2. Spencer Mill…………………………………………………………………...3
Figure 3. “Sawdust beach”………………………………………………………………3
Figure 4. Sediment excavation in 2014………………………………………………….4
Figure 5. Location of dispersal site……………………………………………………...4
Figure 6. Location of sediment grabs……………………………………………………7
Figure 7. Surf smelt and sand lance……………………………………………………..9
Figure 8. Reference site locations map………………………………………………….10
Figure 9. Surf smelt eggs at 10x magnification from a June 2015 survey………………11
Figure 10. Invertebrate community indices for benthic and epibenthic………………….14
Figure 11. Map of previously documented Zostera marina and SUV transects………..16
List of Tables
Table 1. 2009 sediment analysis results from DMMP study.……………………………6
Table 2. Results of sediment characterization analysis from 9/28/15 collection.……….8
Table 3. Benthic and epibenthic invertebrate community metrics………………………13
Table 4. Top 4 species in benthic communities…………………………………………13

iv
Acknowledgements
The author would like to thank Alison Studley and Joe George of the Skagit Fisheries
Enhancement Group, Sandy Wylie-Echeverria of the UW’s Friday Harbor Labs, Kern Ewing and
Jim Fridley of the UW’s School of Environmental and Forestry Sciences, the Samish tribe’s
Department of Natural Resources, and Tana Bryn for assistance and support with this project.
The monitoring was funded through the Estuary and Salmon Restoration Program and the
Salmon Recovery Funding Board.
v
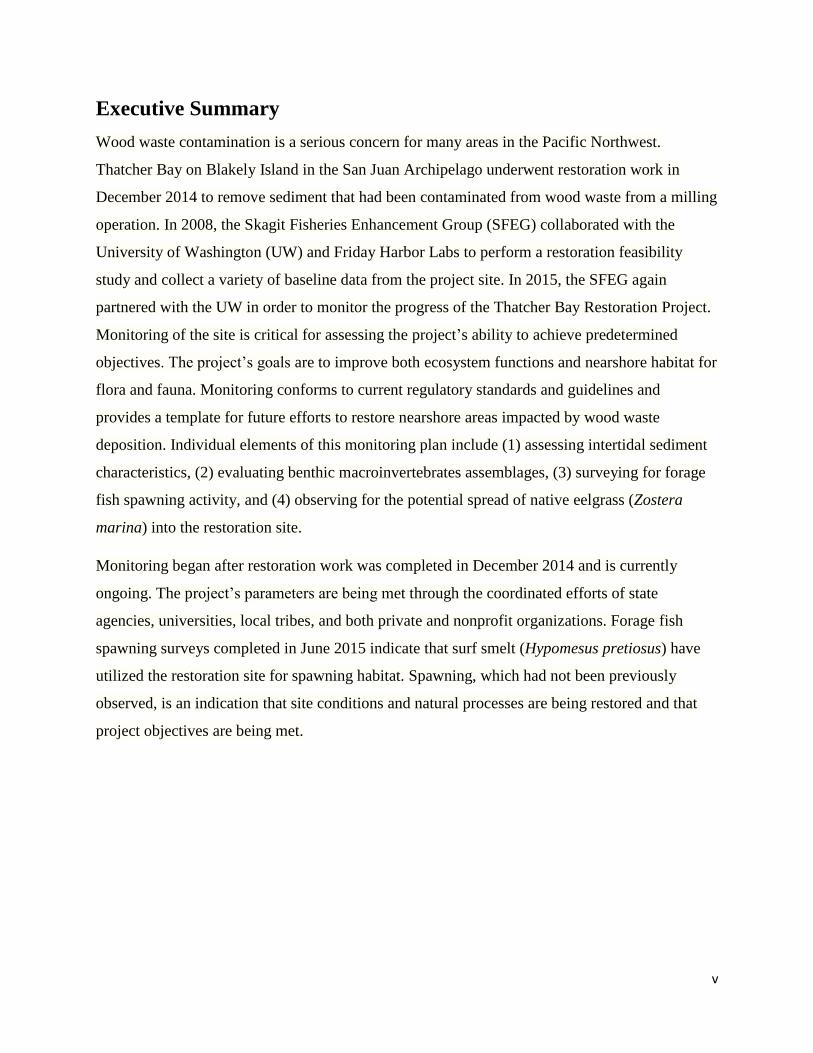
Executive Summary
Wood waste contamination is a serious concern for many areas in the Pacific Northwest.
Thatcher Bay on Blakely Island in the San Juan Archipelago underwent restoration work in
December 2014 to remove sediment that had been contaminated from wood waste from a milling
operation. In 2008, the Skagit Fisheries Enhancement Group (SFEG) collaborated with the
University of Washington (UW) and Friday Harbor Labs to perform a restoration feasibility
study and collect a variety of baseline data from the project site. In 2015, the SFEG again
partnered with the UW in order to monitor the progress of the Thatcher Bay Restoration Project.
Monitoring of the site is critical for assessing the project’s ability to achieve predetermined
objectives. The project’s goals are to improve both ecosystem functions and nearshore habitat for
flora and fauna. Monitoring conforms to current regulatory standards and guidelines and
provides a template for future efforts to restore nearshore areas impacted by wood waste
deposition. Individual elements of this monitoring plan include (1) assessing intertidal sediment
characteristics, (2) evaluating benthic macroinvertebrates assemblages, (3) surveying for forage
fish spawning activity, and (4) observing for the potential spread of native eelgrass (Zostera
marina) into the restoration site.
Monitoring began after restoration work was completed in December 2014 and is currently
ongoing. The project’s parameters are being met through the coordinated efforts of state
agencies, universities, local tribes, and both private and nonprofit organizations. Forage fish
spawning surveys completed in June 2015 indicate that surf smelt (Hypomesus pretiosus) have
utilized the restoration site for spawning habitat. Spawning, which had not been previously
observed, is an indication that site conditions and natural processes are being restored and that
project objectives are being met.
1
1. Introduction
Wood waste in Puget Sound is common due to the prevalence of lumber and paper industries
along the shoreline (Kendall 1997). Types of wood waste include sawdust, wood chips, large
logs, and other material that can become intermixed with nearshore sediment. Studies have
demonstrated that large amounts of wood waste are slow to degrade in an aquatic environment
and can persist for decades (Conlan 1977; Schultz and Berg 1976; Harmon et al. 1986). In
December 2014, the Skagit Fisheries Enhancement Group (SFEG) completed a restoration
project which involved the removal of wood waste from nearshore habitat in the San Juan
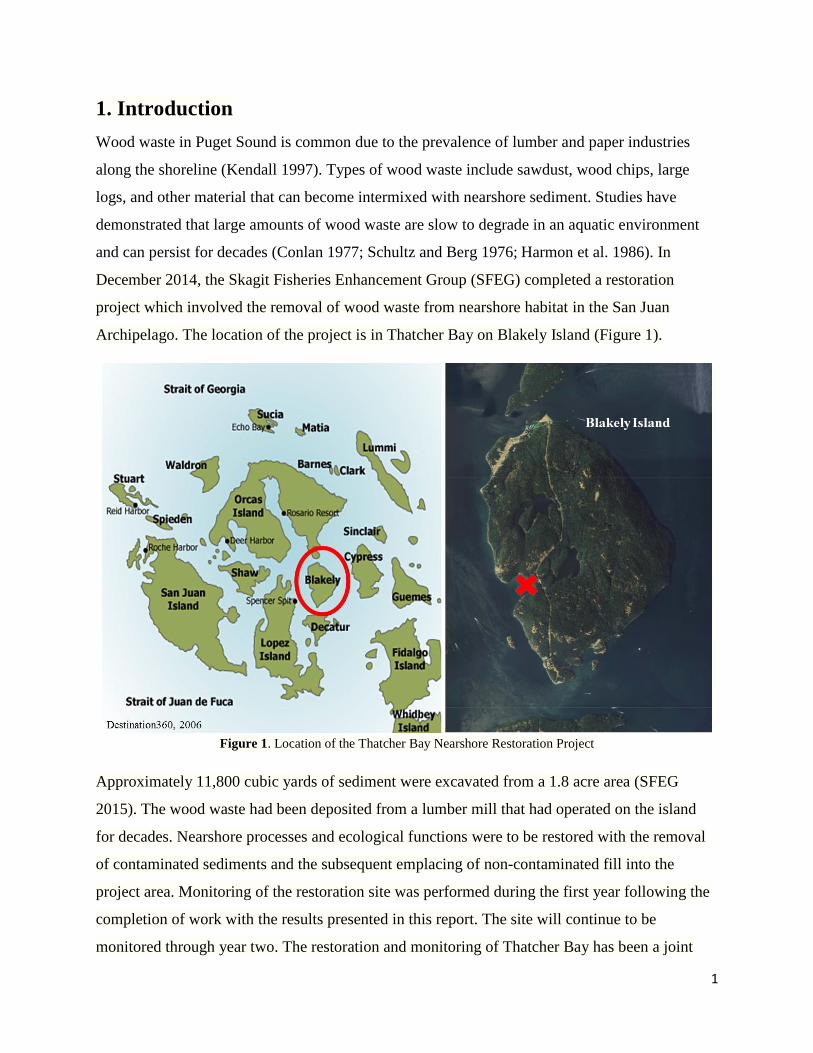
Archipelago. The location of the project is in Thatcher Bay on Blakely Island (Figure 1).
Figure 1. Location of the Thatcher Bay Nearshore Restoration Project
Approximately 11,800 cubic yards of sediment were excavated from a 1.8 acre area (SFEG
2015). The wood waste had been deposited from a lumber mill that had operated on the island
for decades. Nearshore processes and ecological functions were to be restored with the removal
of contaminated sediments and the subsequent emplacing of non-contaminated fill into the
project area. Monitoring of the restoration site was performed during the first year following the
completion of work with the results presented in this report. The site will continue to be
monitored through year two. The restoration and monitoring of Thatcher Bay has been a joint
2
effort between SFEG and the University of Washington which began in 2008 with the thesis
work of Joel Breems.
1.1 Goals and Objectives
The Skagit Fisheries Enhancement Group established that the goal of the Thatcher Bay
Nearshore Restoration project was to improve the natural processes and habitat functions of the
impacted nearshore area. The objectives included:
Eliminate toxic sulfide contamination with the removal of wood waste.
Restore the forage fish spawning habitat on the beach.
Restore intertidal areas to improve benthic flora & fauna habitat.
The goals of monitoring restoration actions for the site follow those described by the Monitoring
Framework established for the Puget Sound Nearshore Ecosystem Restoration Project (Brandon
et al. 2013). They include:
Assess the effectiveness of restoration actions in achieving defined objectives.
Determine where corrective action is needed to improve the effectiveness of restoration
actions, and inform decisions about how to take such corrective action.
Reduce risks and uncertainties associated with future restoration actions by increasing
understanding of the relationships between restoration actions and restored ecosystem
processes, structures, and functions for Puget Sound nearshore ecosystems.
1.2 Project History
Thatcher Bay is located on the western side of Blakely Island in Washington State’s San Juan
Islands. The island had been historically used by the Lummi and Samish tribes for fishing,
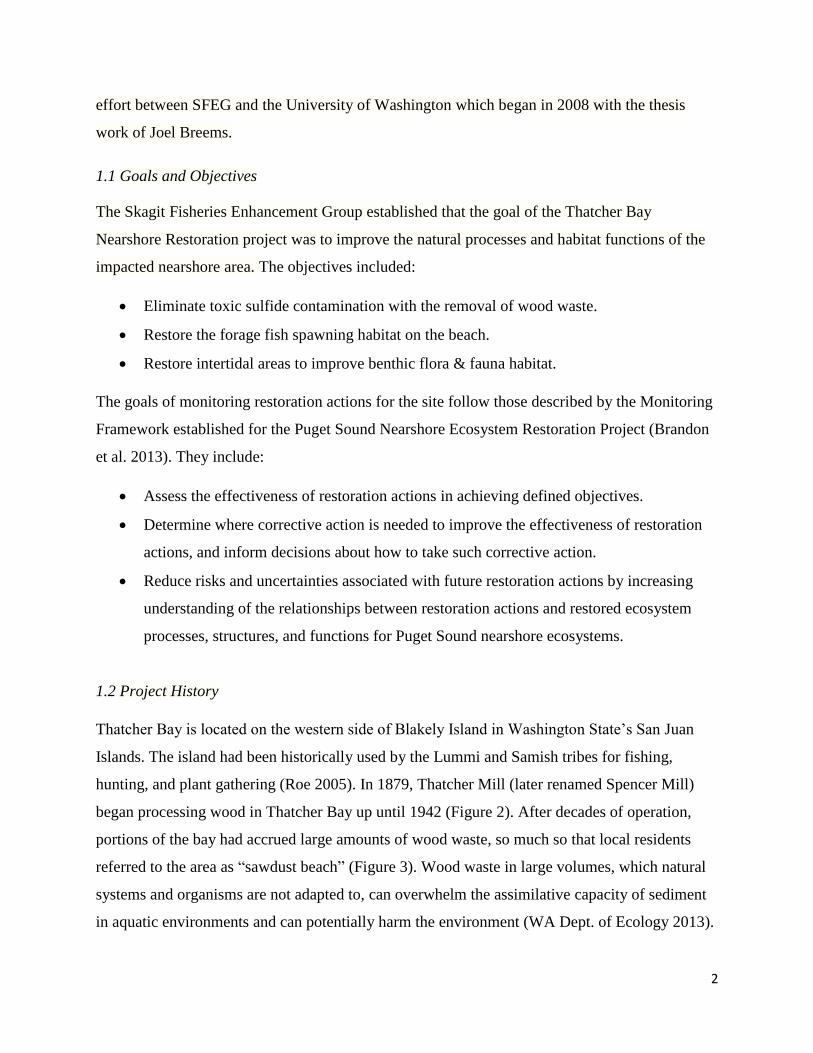
hunting, and plant gathering (Roe 2005). In 1879, Thatcher Mill (later renamed Spencer Mill)
began processing wood in Thatcher Bay up until 1942 (Figure 2). After decades of operation,
portions of the bay had accrued large amounts of wood waste, so much so that local residents
referred to the area as “sawdust beach” (Figure 3). Wood waste in large volumes, which natural
systems and organisms are not adapted to, can overwhelm the assimilative capacity of sediment
in aquatic environments and can potentially harm the environment (WA Dept. of Ecology 2013).
3
Figures 2 and 3. Spencer Mill (left), source Roe and “sawdust beach” (right) source: SFEG.
A 2009 study of the site done by the Skagit Fisheries Enhancement Group, the UW’s Friday
Harbor Labs, and Joel Breems, of the University of Washington, assessed both environmental
conditions and restoration feasibility options. That study, which estimated the amount and
distribution of the wood waste, concluded that the elevated total organic composition was
negatively impacting the nearshore habitat (Breems 2009). Sediment was analyzed at various
locations within the project site and the results showed that the depth of wood waste averaged
1.8 feet below Mean Lower Low Water (MLLW). A large amount of organic material such as
this is what likely facilitated an increase in anaerobic respiration and the production of sulfide.
Breems showed that redox potential and sulfide measurements taken from sediment cores were
elevated at Thatcher Bay when compared with data obtained from a nearby reference site.
Sulfide can be toxic to marine flora and fauna (Wang and Chapman 1999) and has been shown to
decrease benthic invertebrate species diversity and abundance (Hyland 2005).
The SFEG and UW study further concluded that the optimal method of improving the habitat
was the removal of the contaminated sediment from a water-based platform. This option was
preferred over alternative strategies like sediment capping or taking no action and allowing for
autogenic repair to improve conditions. With a capping strategy, the long term effectiveness of a
sediment cap is dubious in a dynamic intertidal environment like Thatcher Bay. Alternatively,
the strategy of taking no action was also eliminated as natural processes were unlikely to restore
the site to historical conditions before the mill existed.
4
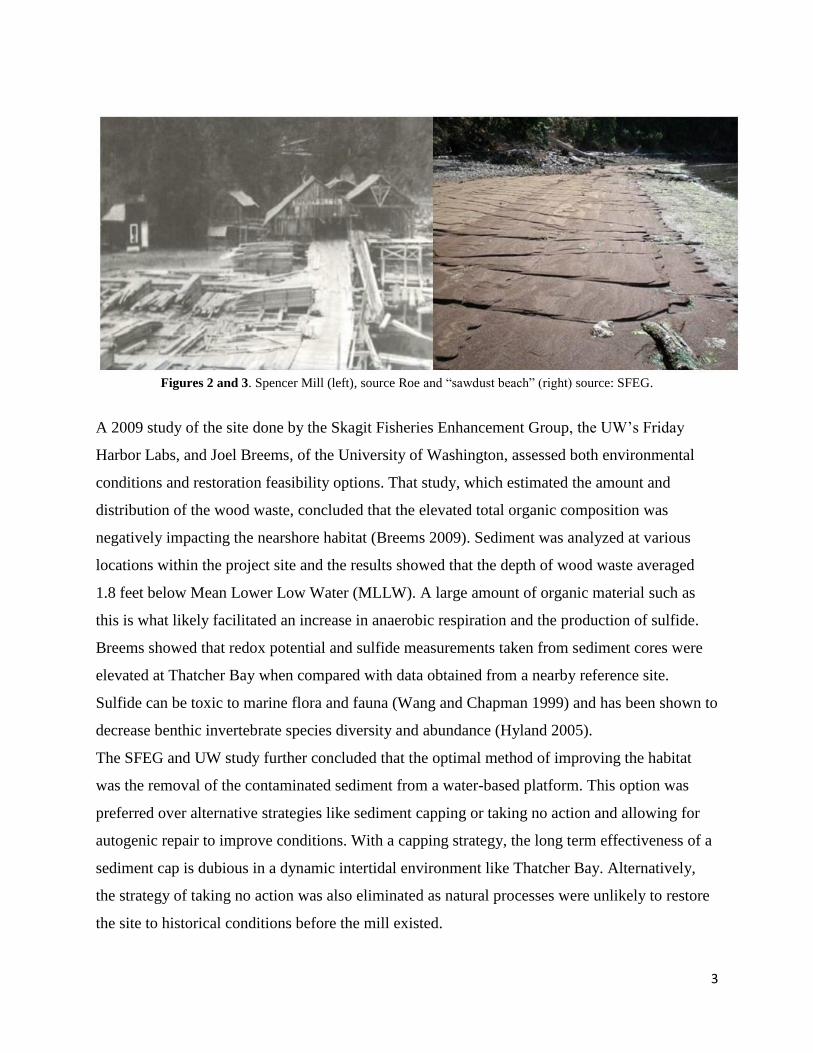
In November of 2014, using funds from the Salmon Recovery Funding Board, the SFEG
contracted with Pacific Pile & Marine to excavate 11,800 yd3 of contaminated sediment from the
project site (Figure 4). The contaminated sediment was then dispersed in open water at the
Rosario Strait dispersive site in the eastern San Juan Islands (Figures 5). In December of 2014, a
flat deck barge backfilled the project site with material obtained from Cowden Gravel & Ready
Mix’s Singer Pit in Whatcom County (SFEG 2015). The backfill material had chemical analysis
preformed on it before placement to ensure compliance with construction specifications to
maximize environmental protection. Upon completion of the restoration work, the SFEG began
monitoring of the site by collaborating with the University of Washington, the Samish tribe, and
both private and non-profit organizations.
Figures 4 and 5. Sediment excavation (left) and location of dispersal site (right). Source: SFEG.
1.3 Purpose of Monitoring
Monitoring is a vital component of any comprehensive restoration project. The success of
restoration work hinges on two stipulations; that ecosystems can be altered to recreate a desired
condition, and whether it can be determined if the alterations have produced the desired
condition (Keddy 2000). The scientific uncertainties involved in restoration outcomes are what
monitoring efforts try to better understand so that similar endeavors in the future can be
improved upon. The Thatcher Bay Restoration Project has benefited greatly from the variety of
pre-project data observations obtained by the UW’s Joel Breems. These data can be compared

5
with post-project monitoring results to help assess environmental changes. Another benefit of
having pre-project data for a restoration project is that suitable and attainable objectives can be
established that are based on the best current scientific understandings.
The Puget Sound Nearshore Restoration Project’s Monitoring Framework defines effectiveness
monitoring, which is what this project aims to accomplish, as evaluating whether or not
restoration actions are achieving their stated goals. For this project, a set of parameters were
established with the intention that monitoring would be accomplished according to the current
regulatory standards and guidelines for each element. Those elements include:
1) Assessing intertidal sediment characteristics
2) Evaluating benthic macroinvertebrates assemblages
3) Surveying for forage fish spawning activity
4) Observing for the potential spread native eelgrass (Zostera marina) into the restoration
site
One of the aims of this project is that it may offer as a model for future efforts to restore
nearshore areas altered and impacted by wood waste deposition. While there are currently only a
few sawmills in operation statewide, there were potentially hundreds of mills operating in
Washington State at the height of the timber industry (WA Dept. of Ecology 2013). It is likely to
assume that other sites in Puget Sound will undergo wood waste restoration work in the future.
The monitoring criteria established in this report can provide a template for those remediation
efforts that have goals and objectives similar to this project.
2. Sediment Characterization
2.1 Overview
The conventional analysis of sediments can provide a variety of uses when investigating the
consequences of restoration practices. The Washington Department of Ecology’s Toxics Cleanup
Program’s 2013 guidelines for wood waste investigations indicate, among other variables, that
analysis of quantitative grain size, the percentage of solids, and the percentage of total volatile
solids should be included as elements of a project’s goals and objectives. The Toxics Cleanup
Program’s Sediment Sampling and Analysis Plan (2008) attests that sediment grain size can
6
provide insights into the interpretation of sediment toxicity test data and benthic
macroinvertebrate abundance data as well as helping to evaluate sediment transport and
deposition. Results for the percentage of total solids in a sediment sample allow for the
expression of chemical concentrations on a dry-weight basis. Total volatile solids (TVS)
represents nitrogen, oxygen, and sulfur containing compounds and their associated hydrogen
atoms as well as the carbon content-associated sediment. TVS analysis may better correlate with
biological results than total organic carbon and can be used to assess the overall volume of wood
waste in a sample. TVS is the chemical indicator most often used to correlate with confirmatory
bioassay results and is often used to develop site-specific cleanup standards. TVS also provides
objective, reproducible measures of the overall organic content in sediment which can then be
used to assess the percentage of wood waste present in sediment (WA Dept. of Ecology 2013).
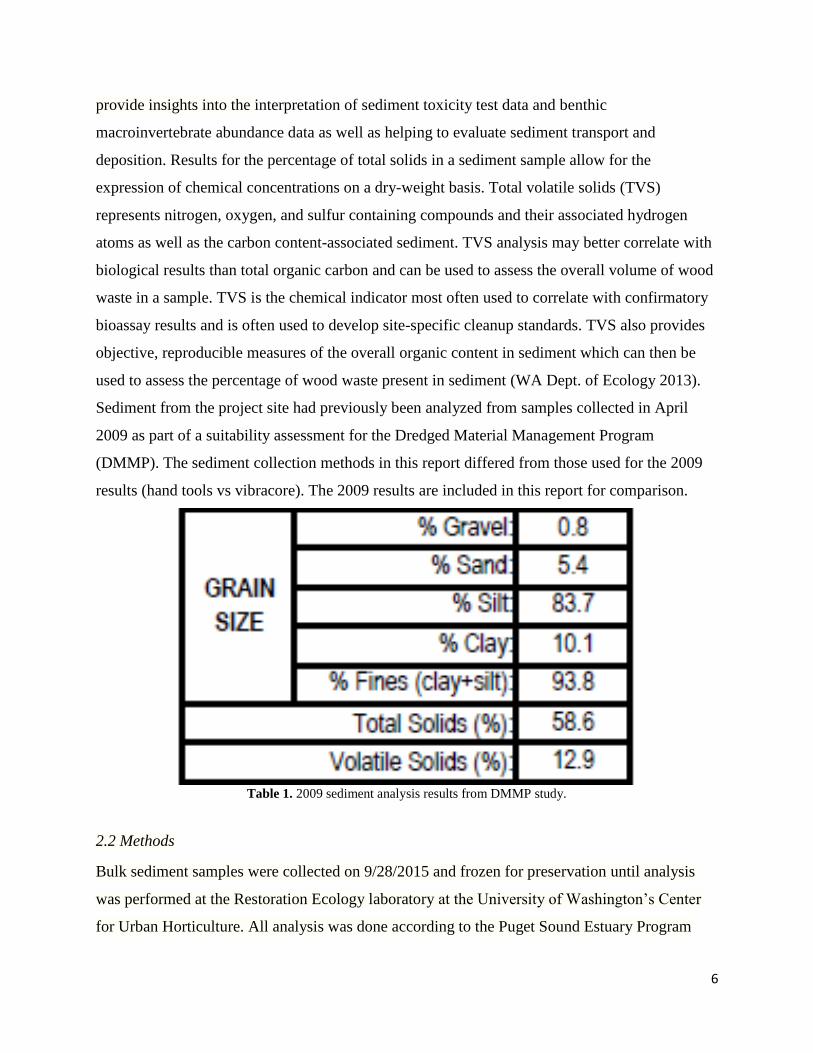
Sediment from the project site had previously been analyzed from samples collected in April
2009 as part of a suitability assessment for the Dredged Material Management Program
(DMMP). The sediment collection methods in this report differed from those used for the 2009
results (hand tools vs vibracore). The 2009 results are included in this report for comparison.
Table 1. 2009 sediment analysis results from DMMP study.
2.2 Methods
Bulk sediment samples were collected on 9/28/2015 and frozen for preservation until analysis
was performed at the Restoration Ecology laboratory at the University of Washington’s Center
for Urban Horticulture. All analysis was done according to the Puget Sound Estuary Program
7
(PSEP) 1986 protocols for sediment sampling and analysis (Appendix C). These methods are
originally derived from Plumb (1981) and are the most up to date guidelines for performing
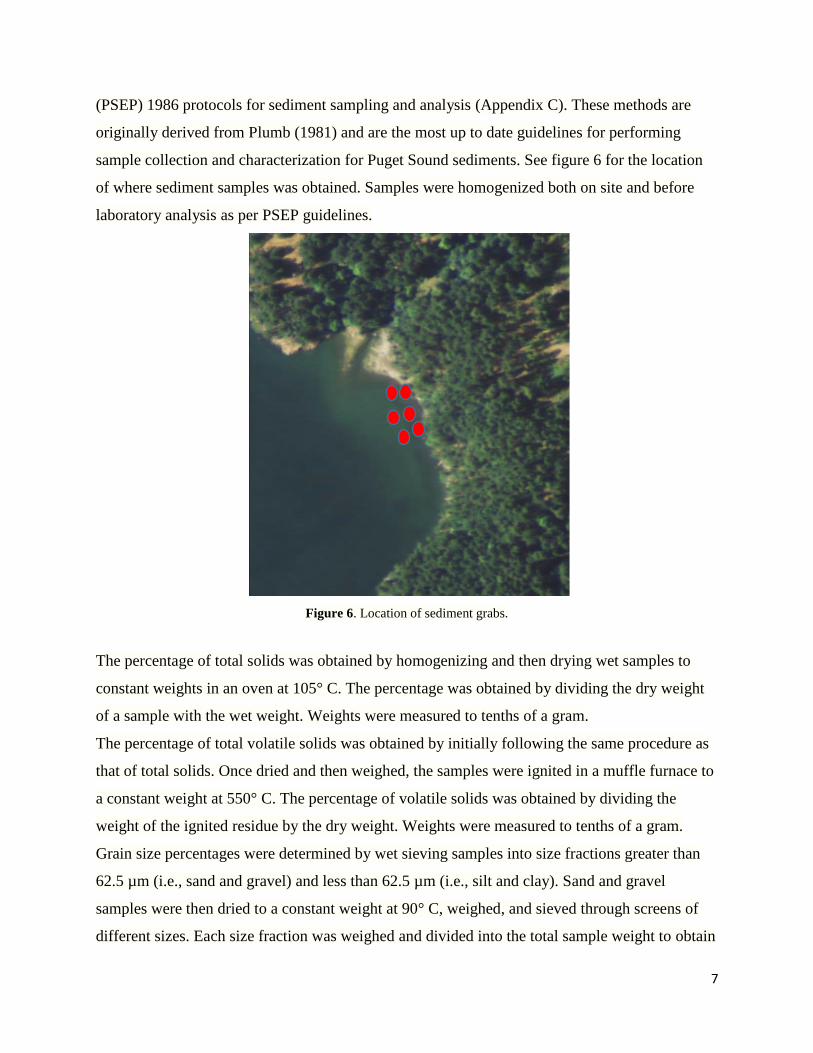
sample collection and characterization for Puget Sound sediments. See figure 6 for the location
of where sediment samples was obtained. Samples were homogenized both on site and before
laboratory analysis as per PSEP guidelines.
Figure 6. Location of sediment grabs.
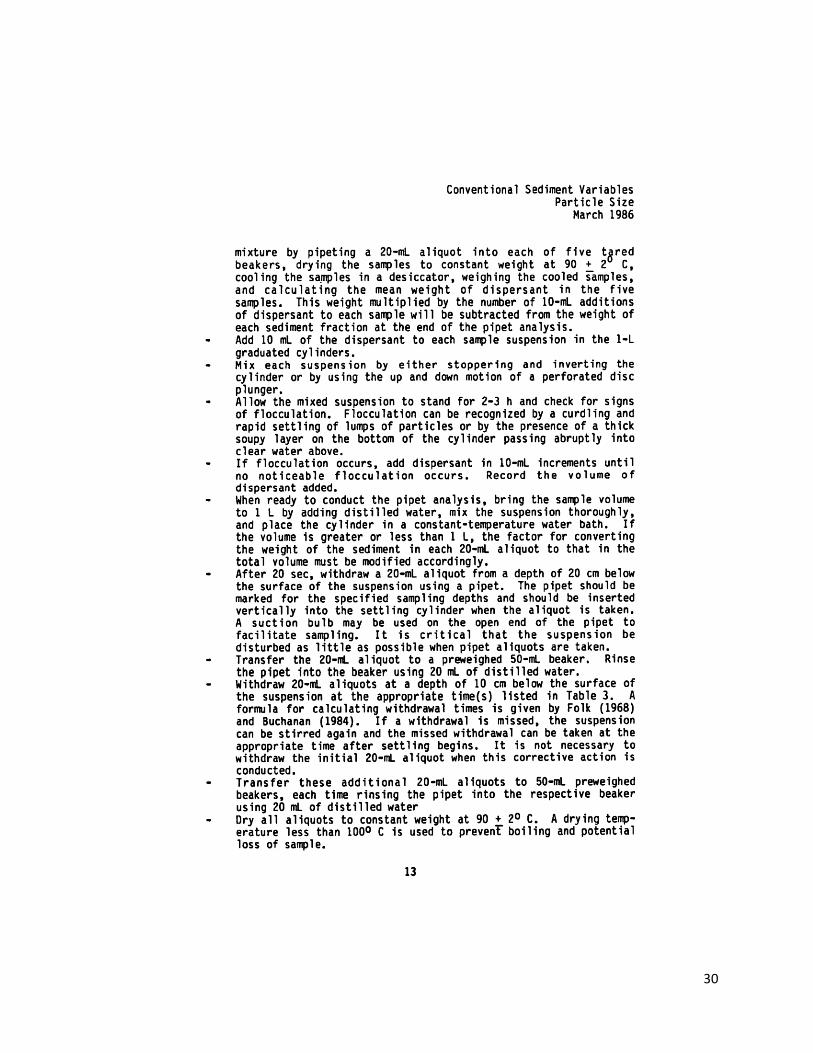
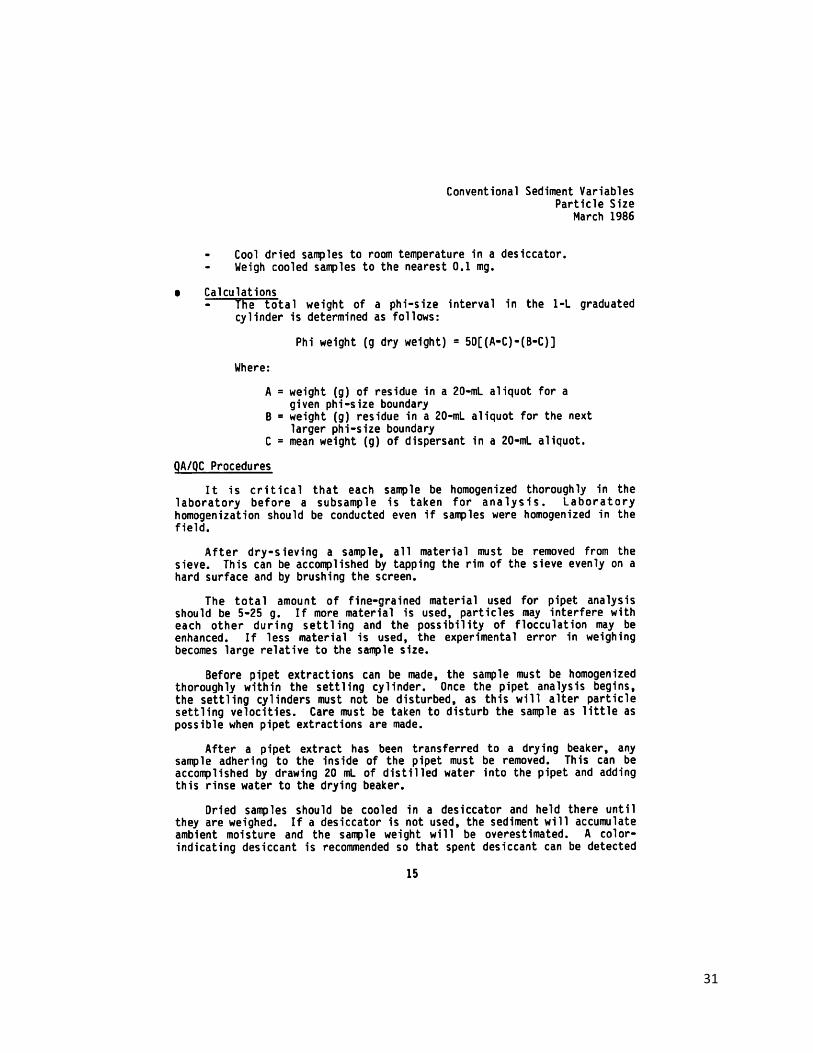
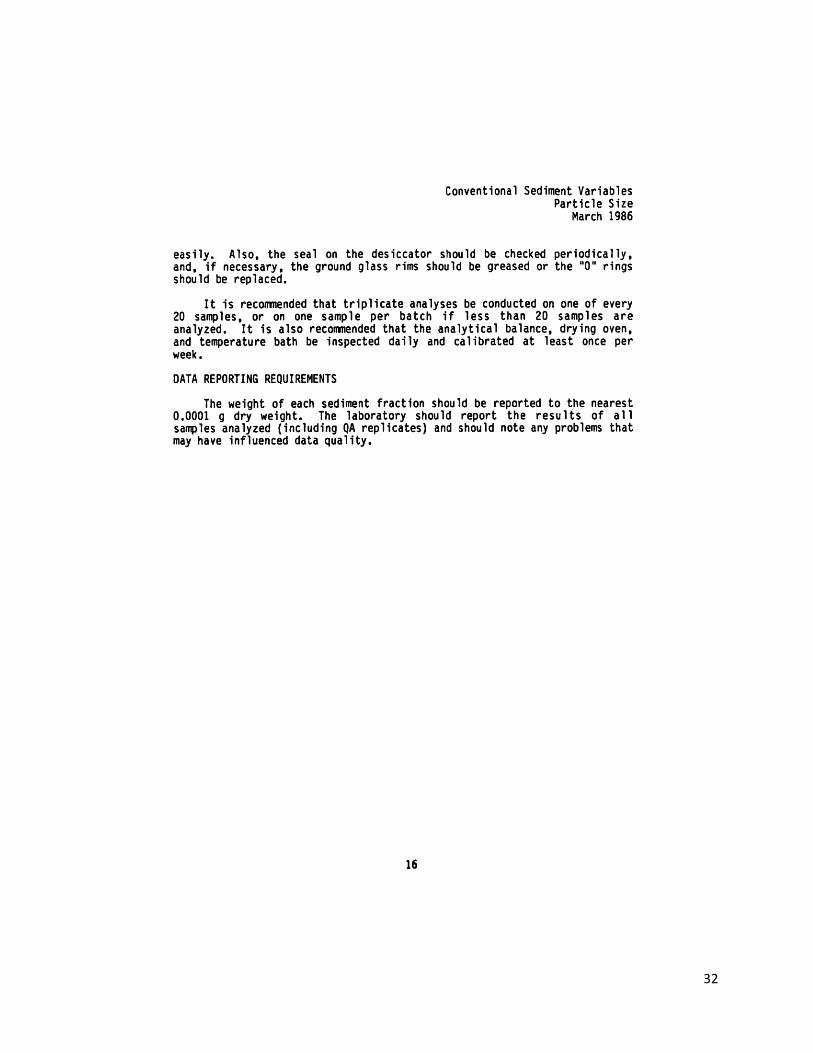
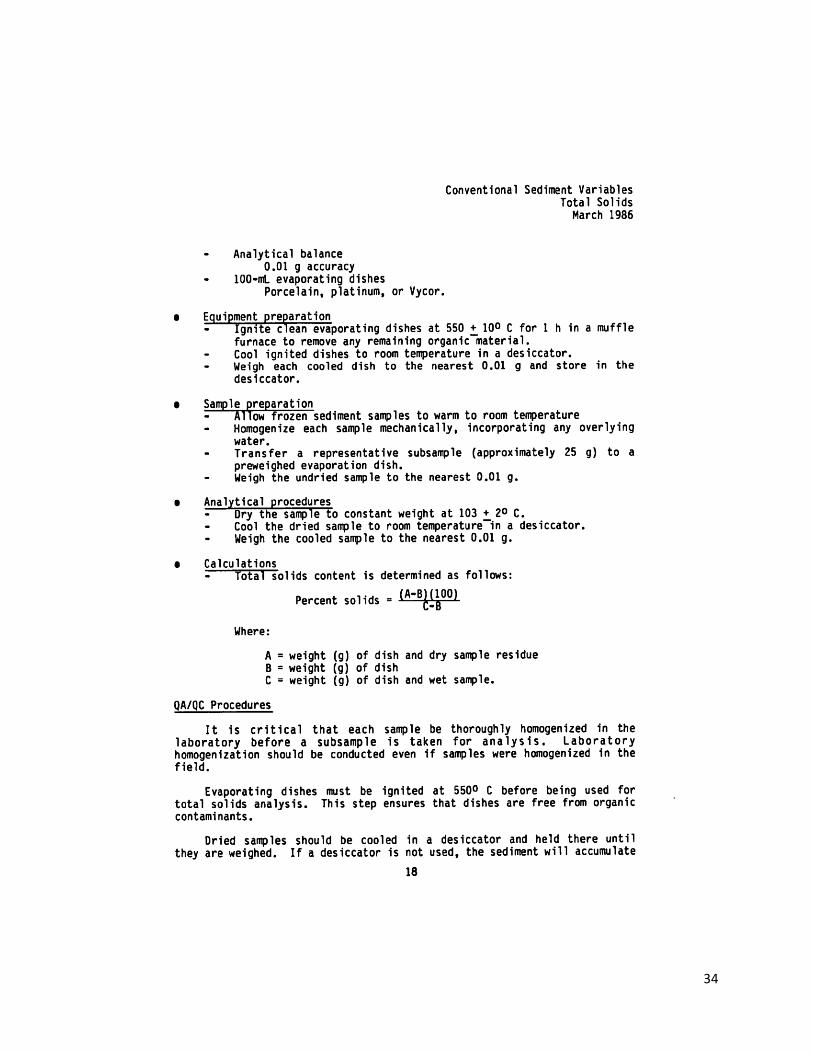
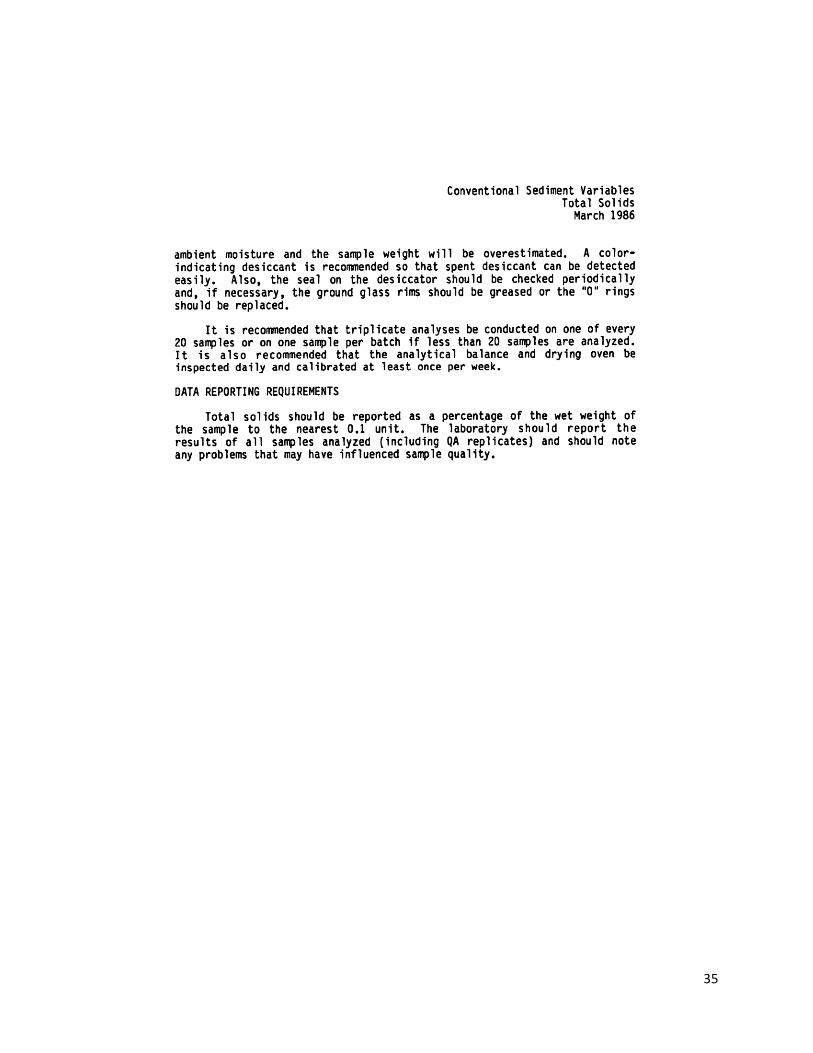
The percentage of total solids was obtained by homogenizing and then drying wet samples to
constant weights in an oven at 105° C. The percentage was obtained by dividing the dry weight
of a sample with the wet weight. Weights were measured to tenths of a gram.
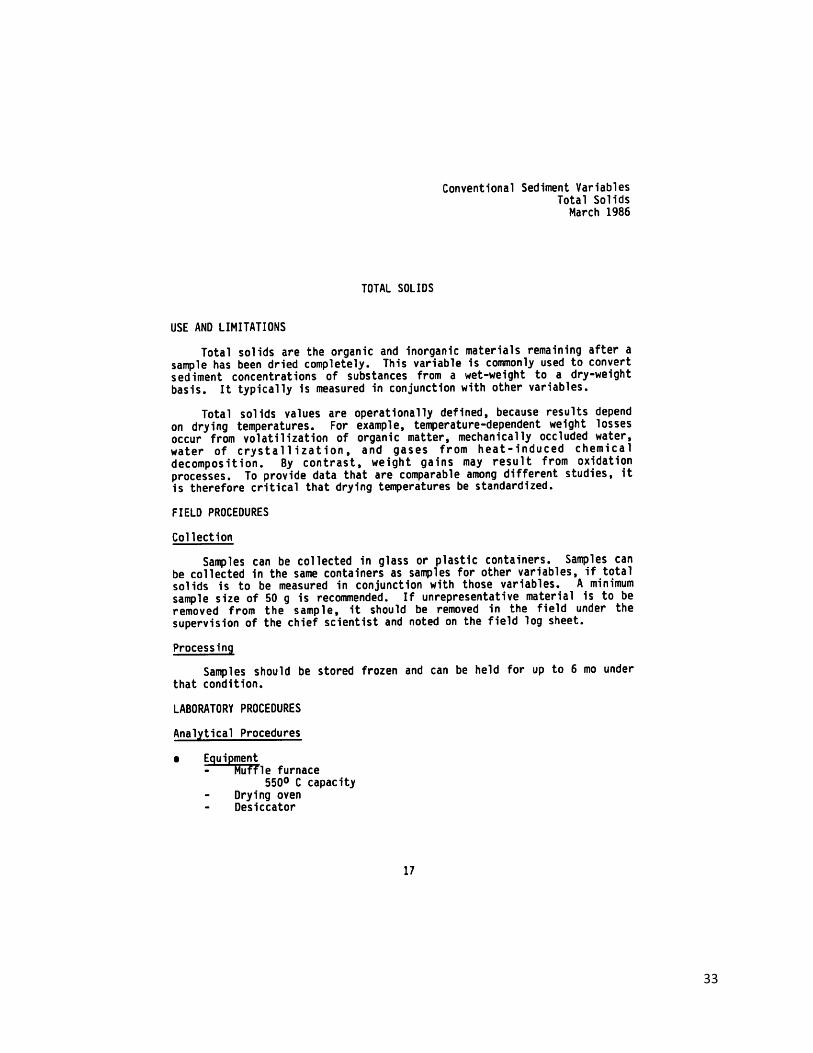
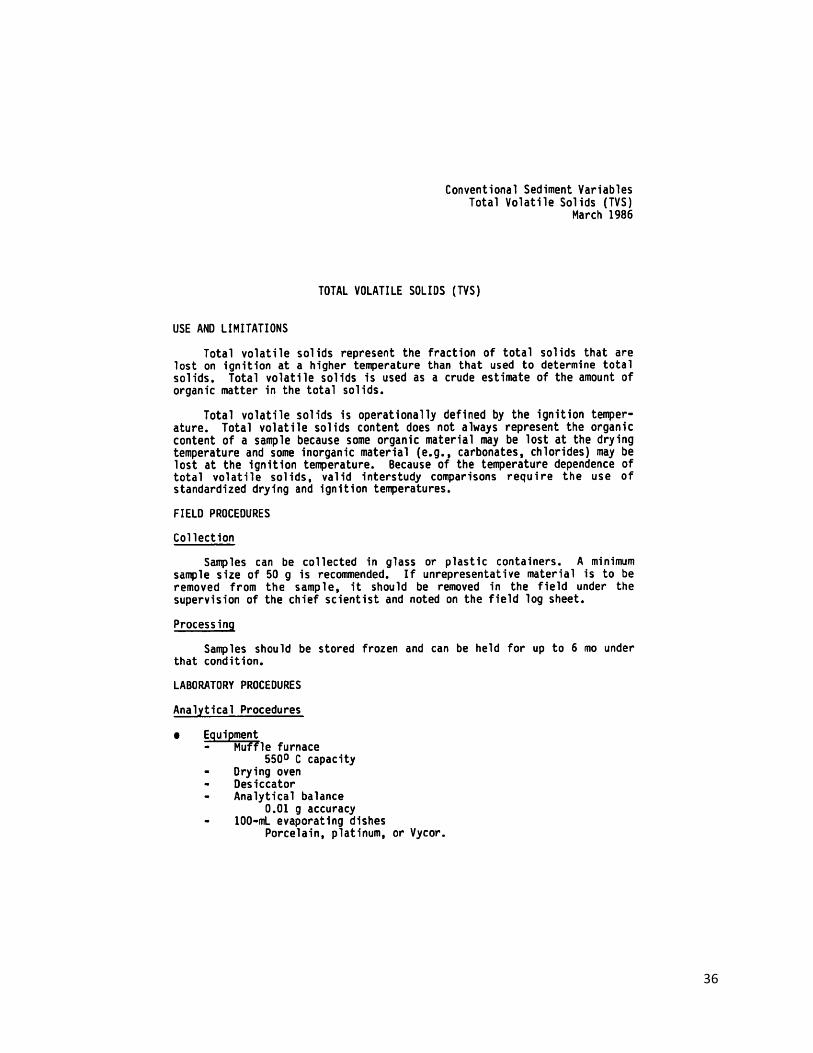
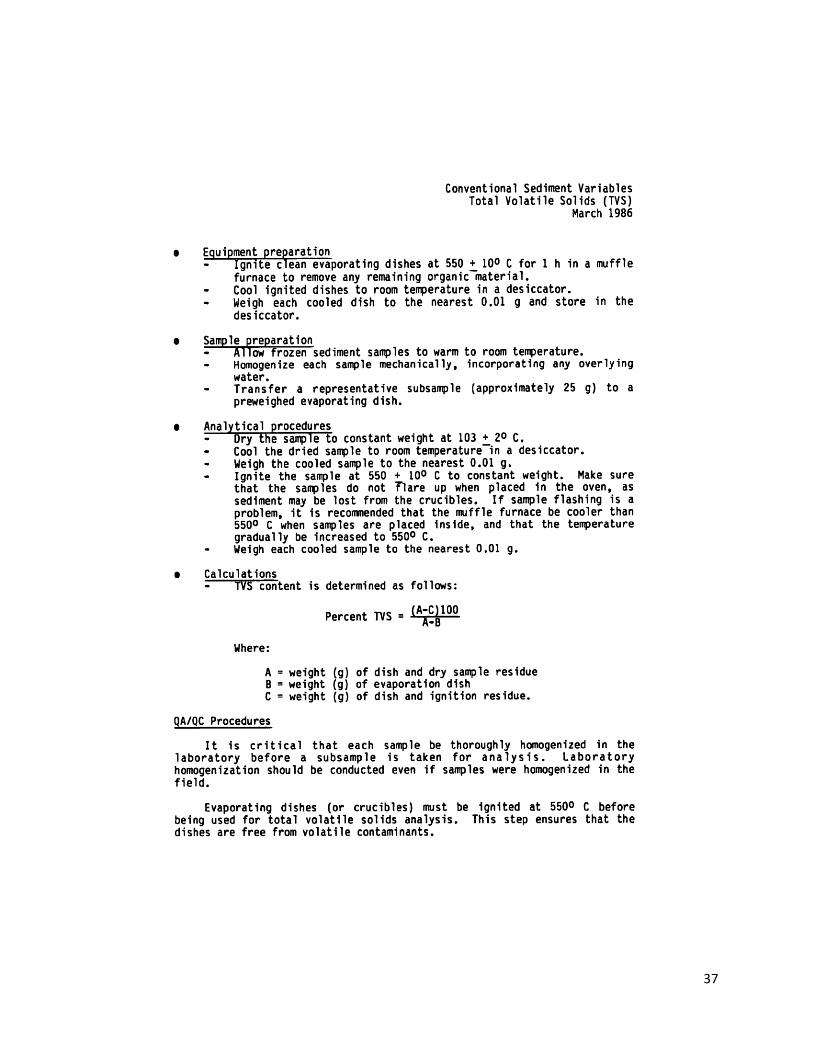
The percentage of total volatile solids was obtained by initially following the same procedure as
that of total solids. Once dried and then weighed, the samples were ignited in a muffle furnace to
a constant weight at 550° C. The percentage of volatile solids was obtained by dividing the
weight of the ignited residue by the dry weight. Weights were measured to tenths of a gram.
Grain size percentages were determined by wet sieving samples into size fractions greater than
62.5 µm (i.e., sand and gravel) and less than 62.5 µm (i.e., silt and clay). Sand and gravel
samples were then dried to a constant weight at 90° C, weighed, and sieved through screens of
different sizes. Each size fraction was weighed and divided into the total sample weight to obtain
8
a percentage for each size class. Due to the small amount of fine sediments, the total percentage
of fines was presented and the classifying of fine sediments less than 62.5 µm was ignored. A
total of 50 samples with .25g of sediment for each was analyzed for both total solids and total
volatile solids.
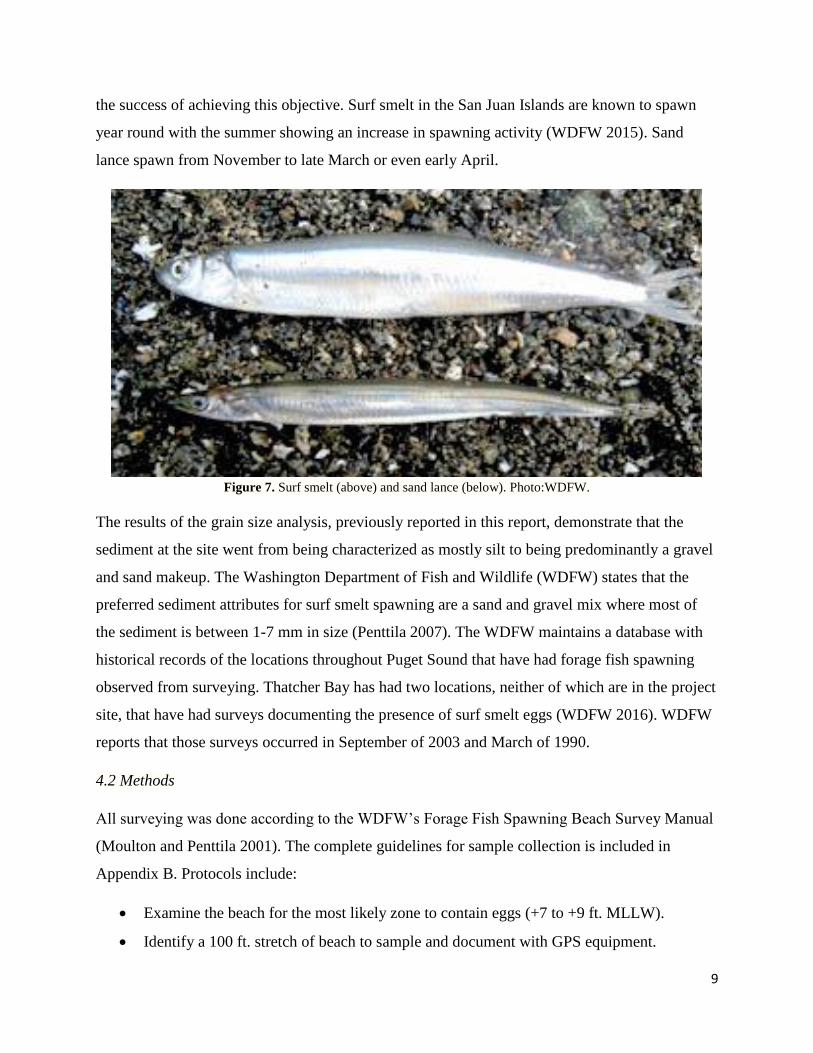
2.3 Results
Sediment Parameter Percentage (%)
Total Solids 90.3
Total Volatile Solids 5.4
Grain Size
Gravel (> 2.0 mm) 21.9
Very Coarse Sand (2.0-1.0 mm) 26.4
Coarse Sand (1.0-0.5 mm) 17.8
Medium Sand (0.5-0.25 mm) 19.2
Fine Sand (0.25-0.125 mm) 13.9
Very Fine Sand (0.125-0.0625 mm) 0.72
Total Sand and Gravel (>2.0-0.0625 mm) 99.2
Total Fines (Silt and Clay 0.0625-0.0039 mm) 0.08 Table 2. Results of sediment characterization analysis from 9/28/15 collection.
The grain size results show that sediment obtained from the project site, 10 months after
completion of the work, are predominantly sand at 99.2% (Table 2). Previous results from 2009
sampling data indicated that the sediment that was to be dredged was predominantly silt at 83.7%
overall (Table 1). Total volatile solids were also lowered from 12.9% in 2009 samples to 5.4%.
3. Forage Fish Spawning Surveys
3.1 Overview
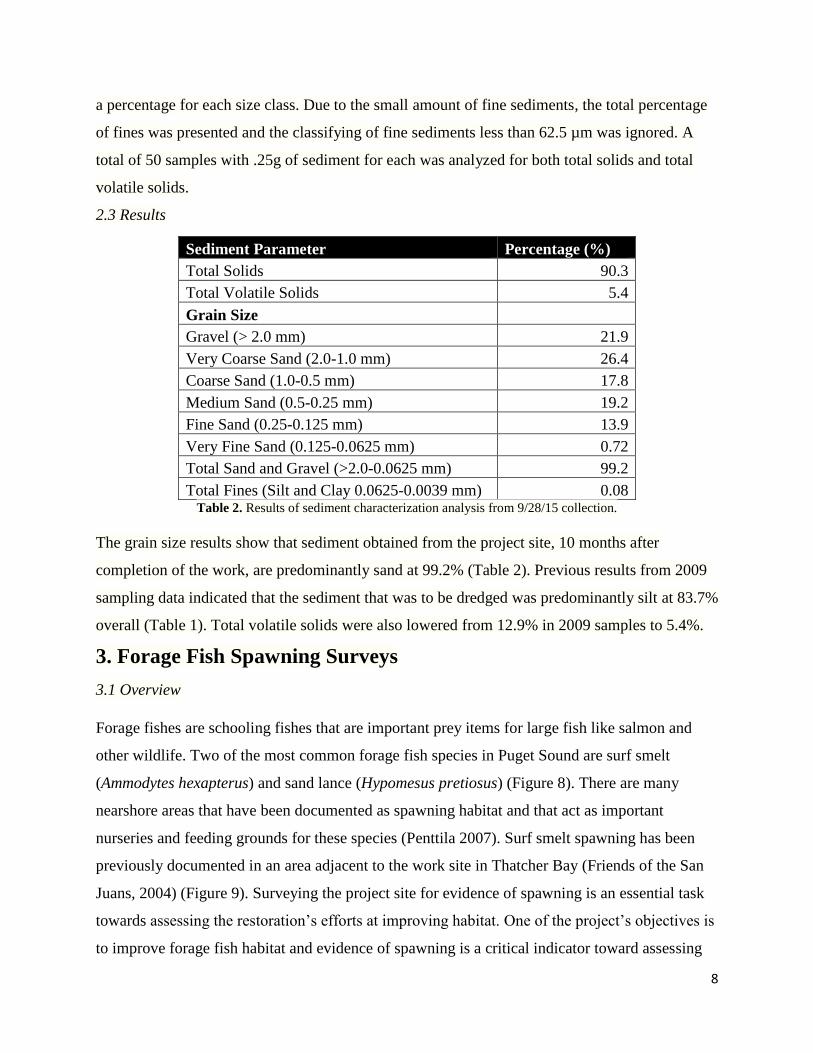
Forage fishes are schooling fishes that are important prey items for large fish like salmon and
other wildlife. Two of the most common forage fish species in Puget Sound are surf smelt
(Ammodytes hexapterus) and sand lance (Hypomesus pretiosus) (Figure 8). There are many
nearshore areas that have been documented as spawning habitat and that act as important
nurseries and feeding grounds for these species (Penttila 2007). Surf smelt spawning has been
previously documented in an area adjacent to the work site in Thatcher Bay (Friends of the San
Juans, 2004) (Figure 9). Surveying the project site for evidence of spawning is an essential task
towards assessing the restoration’s efforts at improving habitat. One of the project’s objectives is
to improve forage fish habitat and evidence of spawning is a critical indicator toward assessing
9
the success of achieving this objective. Surf smelt in the San Juan Islands are known to spawn
year round with the summer showing an increase in spawning activity (WDFW 2015). Sand
lance spawn from November to late March or even early April.
Figure 7. Surf smelt (above) and sand lance (below). Photo:WDFW.
The results of the grain size analysis, previously reported in this report, demonstrate that the
sediment at the site went from being characterized as mostly silt to being predominantly a gravel
and sand makeup. The Washington Department of Fish and Wildlife (WDFW) states that the
preferred sediment attributes for surf smelt spawning are a sand and gravel mix where most of
the sediment is between 1-7 mm in size (Penttila 2007). The WDFW maintains a database with
historical records of the locations throughout Puget Sound that have had forage fish spawning
observed from surveying. Thatcher Bay has had two locations, neither of which are in the project
site, that have had surveys documenting the presence of surf smelt eggs (WDFW 2016). WDFW
reports that those surveys occurred in September of 2003 and March of 1990.
4.2 Methods
All surveying was done according to the WDFW’s Forage Fish Spawning Beach Survey Manual
(Moulton and Penttila 2001). The complete guidelines for sample collection is included in
Appendix B. Protocols include:
Examine the beach for the most likely zone to contain eggs (+7 to +9 ft. MLLW).
Identify a 100 ft. stretch of beach to sample and document with GPS equipment.
10
Obtain and condense bulk beach sediment samples according to field manual guidelines.
In lab, condense beach samples and examine under dissecting microscope for eggs.
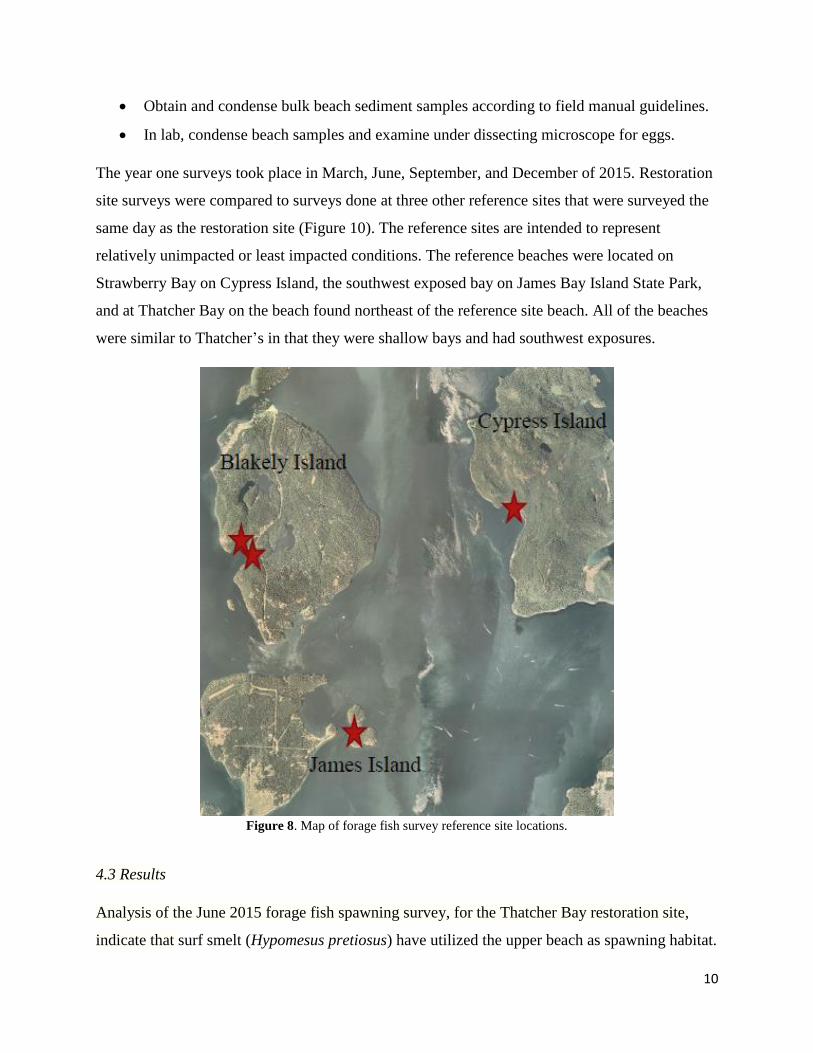
The year one surveys took place in March, June, September, and December of 2015. Restoration
site surveys were compared to surveys done at three other reference sites that were surveyed the
same day as the restoration site (Figure 10). The reference sites are intended to represent
relatively unimpacted or least impacted conditions. The reference beaches were located on
Strawberry Bay on Cypress Island, the southwest exposed bay on James Bay Island State Park,
and at Thatcher Bay on the beach found northeast of the reference site beach. All of the beaches
were similar to Thatcher’s in that they were shallow bays and had southwest exposures.
Figure 8. Map of forage fish survey reference site locations.
4.3 Results
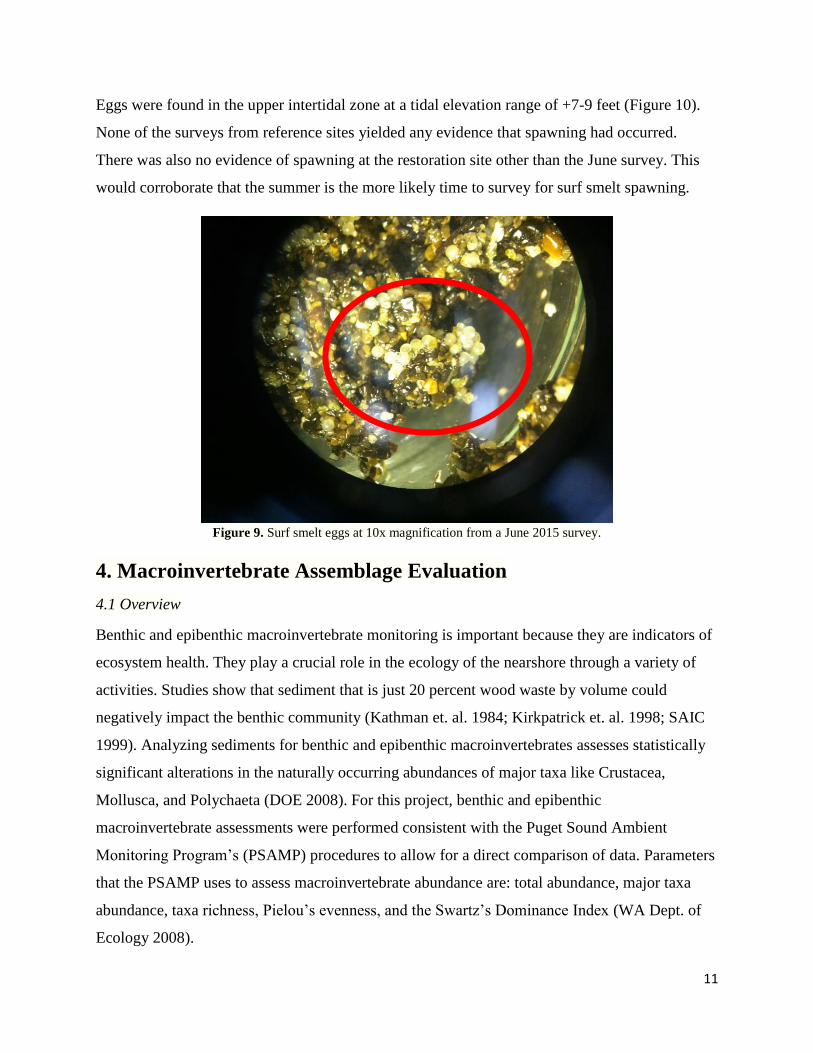
Analysis of the June 2015 forage fish spawning survey, for the Thatcher Bay restoration site,
indicate that surf smelt (Hypomesus pretiosus) have utilized the upper beach as spawning habitat.
11
Eggs were found in the upper intertidal zone at a tidal elevation range of +7-9 feet (Figure 10).
None of the surveys from reference sites yielded any evidence that spawning had occurred.
There was also no evidence of spawning at the restoration site other than the June survey. This
would corroborate that the summer is the more likely time to survey for surf smelt spawning.
Figure 9. Surf smelt eggs at 10x magnification from a June 2015 survey.
4. Macroinvertebrate Assemblage Evaluation
4.1 Overview
Benthic and epibenthic macroinvertebrate monitoring is important because they are indicators of
ecosystem health. They play a crucial role in the ecology of the nearshore through a variety of
activities. Studies show that sediment that is just 20 percent wood waste by volume could
negatively impact the benthic community (Kathman et. al. 1984; Kirkpatrick et. al. 1998; SAIC
1999). Analyzing sediments for benthic and epibenthic macroinvertebrates assesses statistically
significant alterations in the naturally occurring abundances of major taxa like Crustacea,
Mollusca, and Polychaeta (DOE 2008). For this project, benthic and epibenthic
macroinvertebrate assessments were performed consistent with the Puget Sound Ambient
Monitoring Program’s (PSAMP) procedures to allow for a direct comparison of data. Parameters
that the PSAMP uses to assess macroinvertebrate abundance are: total abundance, major taxa
abundance, taxa richness, Pielou’s evenness, and the Swartz’s Dominance Index (WA Dept. of
Ecology 2008).
12
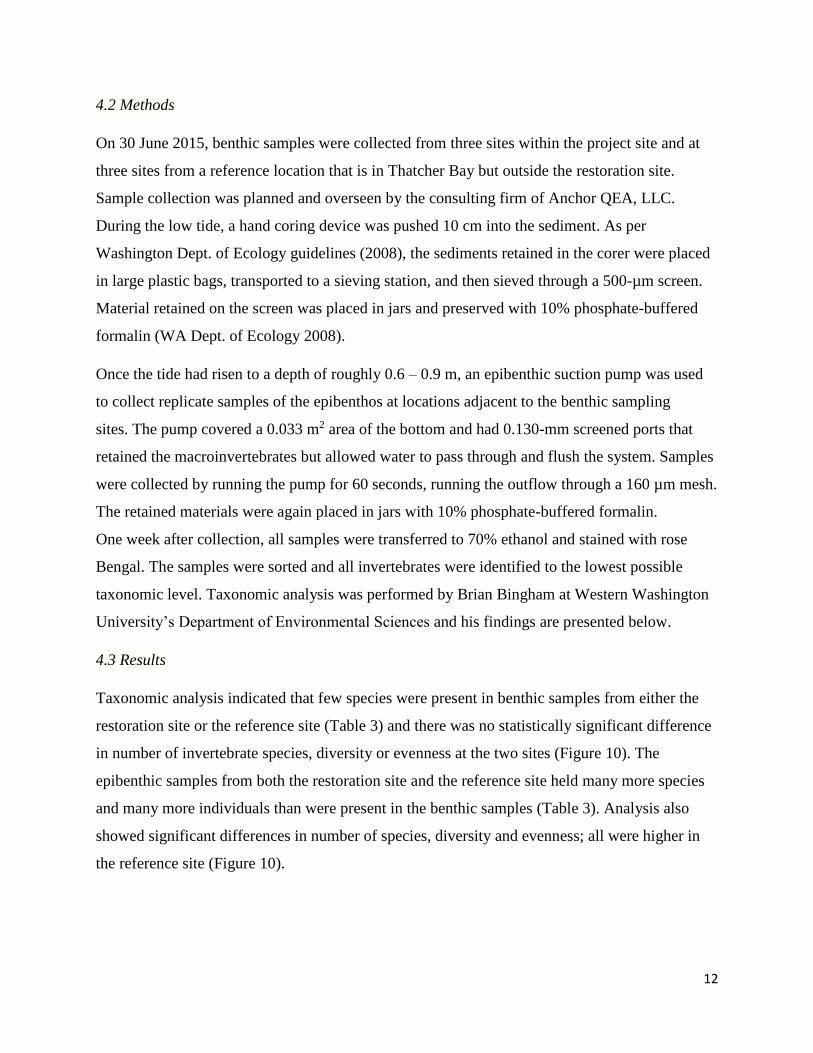
4.2 Methods
On 30 June 2015, benthic samples were collected from three sites within the project site and at
three sites from a reference location that is in Thatcher Bay but outside the restoration site.
Sample collection was planned and overseen by the consulting firm of Anchor QEA, LLC.
During the low tide, a hand coring device was pushed 10 cm into the sediment. As per
Washington Dept. of Ecology guidelines (2008), the sediments retained in the corer were placed
in large plastic bags, transported to a sieving station, and then sieved through a 500-µm screen.
Material retained on the screen was placed in jars and preserved with 10% phosphate-buffered
formalin (WA Dept. of Ecology 2008).
Once the tide had risen to a depth of roughly 0.6 – 0.9 m, an epibenthic suction pump was used
to collect replicate samples of the epibenthos at locations adjacent to the benthic sampling
sites. The pump covered a 0.033 m2 area of the bottom and had 0.130-mm screened ports that
retained the macroinvertebrates but allowed water to pass through and flush the system. Samples
were collected by running the pump for 60 seconds, running the outflow through a 160 µm mesh.
The retained materials were again placed in jars with 10% phosphate-buffered formalin.
One week after collection, all samples were transferred to 70% ethanol and stained with rose
Bengal. The samples were sorted and all invertebrates were identified to the lowest possible
taxonomic level. Taxonomic analysis was performed by Brian Bingham at Western Washington
University’s Department of Environmental Sciences and his findings are presented below.
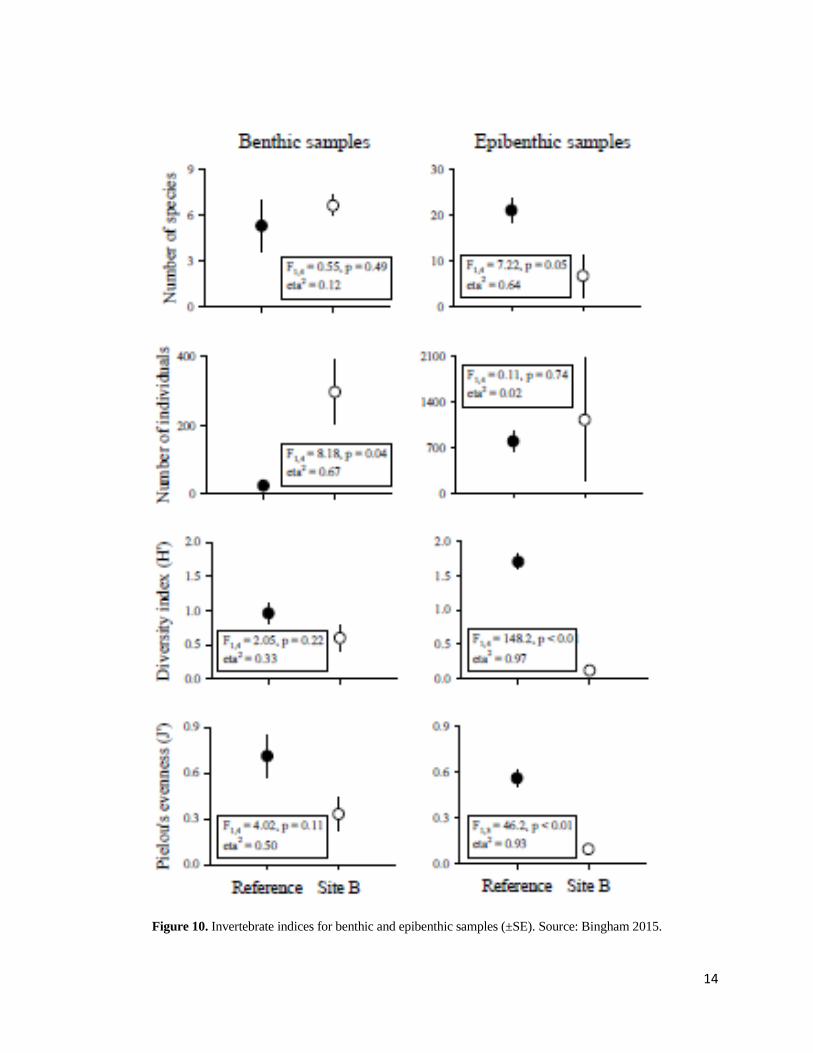
4.3 Results
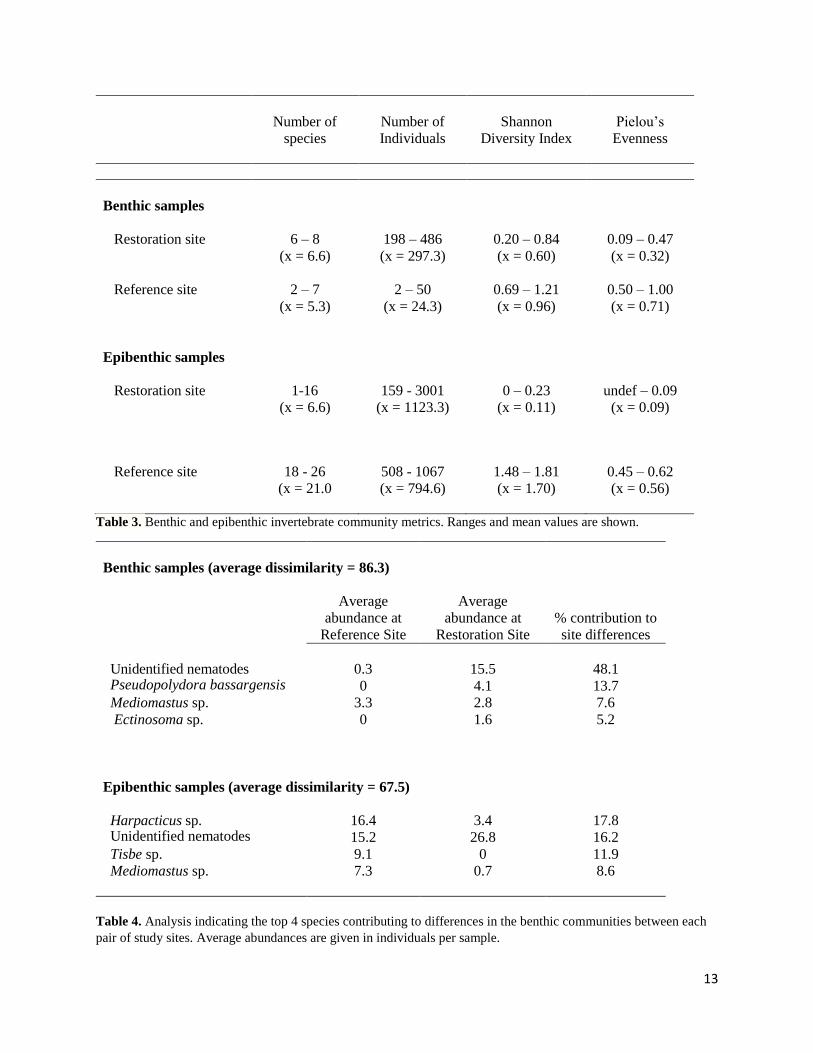
Taxonomic analysis indicated that few species were present in benthic samples from either the
restoration site or the reference site (Table 3) and there was no statistically significant difference
in number of invertebrate species, diversity or evenness at the two sites (Figure 10). The
epibenthic samples from both the restoration site and the reference site held many more species
and many more individuals than were present in the benthic samples (Table 3). Analysis also
showed significant differences in number of species, diversity and evenness; all were higher in
the reference site (Figure 10).
13
Number of
species
Number of
Individuals
Shannon
Diversity Index
Pielou’s
Evenness
Benthic samples
Restoration site 6 – 8
(x = 6.6)
198 – 486
(x = 297.3)
0.20 – 0.84
(x = 0.60)
0.09 – 0.47
(x = 0.32)
Reference site 2 – 7
(x = 5.3)
2 – 50
(x = 24.3)
0.69 – 1.21
(x = 0.96)
0.50 – 1.00
(x = 0.71)
Epibenthic samples
Restoration site 1-16
(x = 6.6)
159 - 3001
(x = 1123.3)
0 – 0.23
(x = 0.11)
undef – 0.09
(x = 0.09)
Reference site 18 - 26
(x = 21.0
508 - 1067
(x = 794.6)
1.48 – 1.81
(x = 1.70)
0.45 – 0.62
(x = 0.56)
Table 3. Benthic and epibenthic invertebrate community metrics. Ranges and mean values are shown.
Benthic samples (average dissimilarity = 86.3)
Average
abundance at
Reference Site
Average
abundance at
Restoration Site
% contribution to
site differences
Unidentified nematodes 0.3 15.5 48.1 Pseudopolydora bassargensis 0 4.1 13.7
Mediomastus sp. 3.3 2.8 7.6
Ectinosoma sp. 0 1.6 5.2
Epibenthic samples (average dissimilarity = 67.5)
Harpacticus sp. 16.4 3.4 17.8 Unidentified nematodes 15.2 26.8 16.2
Tisbe sp. 9.1 0 11.9
Mediomastus sp. 7.3 0.7 8.6
Table 4. Analysis indicating the top 4 species contributing to differences in the benthic communities between each
pair of study sites. Average abundances are given in individuals per sample.
14
Figure 10. Invertebrate indices for benthic and epibenthic samples (±SE). Source: Bingham 2015.
15
5. Eelgrass (Zostera marina) Observations
5.1 Overview
Zostera marina (eelgrass) is a marine flowering plant that is acknowledged as an indicator of
ecosystem health and stability in the Pacific Northwest (Phillips 1984; Wyllie-Echeverria and
Ackerman 2003). Eelgrass provides important habitat functions in the nearshore region
(Mumford 2007, Eissinger 2007), reduces current flow and stabilizes sediment (Gambi et al.
1990, Fonseca et al. 1982) and can act as an indicator to assess water quality (Dennison et al.
1993). Monitoring for the potential colonization of the emplaced sediment and other areas of the
bay will be integral towards understanding the ecology of the both restoration site and the bay as
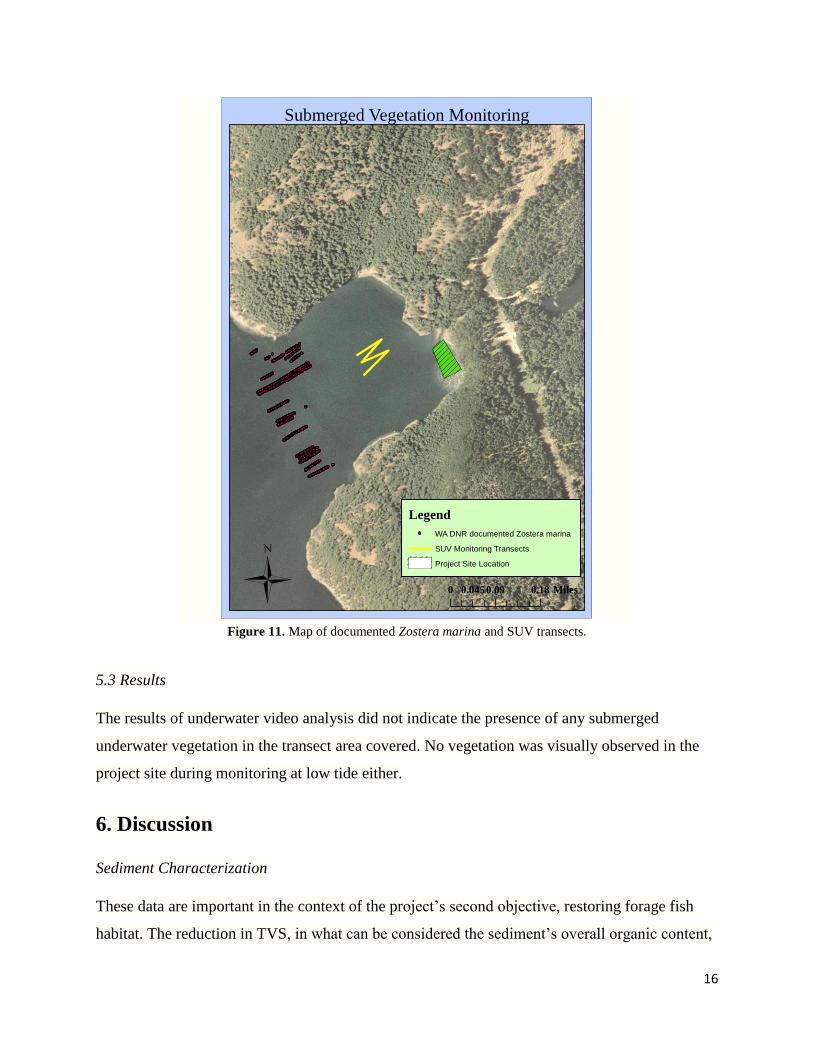
a whole. Previous sampling done by the Washington Department of Natural Resources in 2010
show that there is an existing bed of native eelgrass (Zostera marina) at the mouth of Thatcher
Bay (Figure 11). Eelgrass beds though can be ephemeral and move over time. The Puget Sound
Partnership uses eelgrass as one of its “vital signs” to assess the health of Puget Sound (PSP
2016). Both the restoration site and other areas of Thatcher Bay were visually assessed for the
presence of underwater vegetation and included as a criteria of this monitoring report.
5.2 Methods
In September, 2015 a GoPro™ camera was mounted to 10 feet of PVC pipping and submerged
beneath a boat to observe for the presence of vegetation. The setup was held by hand and
underwater video was taken on randomly chosen transect lines established beforehand. The boat
travelled at a speed of 1 knot and observations were taken midday in order to maximize the
amount of available light. A GPS device was used while taking underwater video to document
the position of the boat. The sampling design was intended to adhere to guidelines for estimating
the basal area for underwater vegetation established by Norris et. al (1997). The depth was
obtained using the boats’ sonar. During low tide the project site was monitored for vegetation by
visual observations.
16
Figure 11. Map of documented Zostera marina and SUV transects.
5.3 Results
The results of underwater video analysis did not indicate the presence of any submerged
underwater vegetation in the transect area covered. No vegetation was visually observed in the
project site during monitoring at low tide either.
6. Discussion
Sediment Characterization
These data are important in the context of the project’s second objective, restoring forage fish
habitat. The reduction in TVS, in what can be considered the sediment’s overall organic content,
Ü
Submerged Vegetation Monitoring
0 0.09 0.180.045 Miles
Legend
WA DNR documented Zostera marina
SUV Monitoring Transects
Project Site Location
17
is crucial to potentially restoring the site’s historical natural processes. By reducing the organic
content, anaerobic conditions are less likely to persist which should decrease the amount of toxic
sulfides. As the intertidal zone is a dynamic environment, it is important that the monitoring of
sediment characteristics continue in year two to assess whether changes to the site require any
further analysis or management actions.
Macroinvertebrate Assemblage Evaluation
Macroinvertebrate sampling and analysis are scheduled to be performed at roughly the same time
in year two of monitoring. A comparison of the results from years one and two will provide
further insight into the ecology invertebrate communities.
Forage Fish Spawning Surveys
Previous observations of surf smelt spawning in unimpacted sections of the bay meant that
improvements to the restoration site had the opportunity to establish more spawning habitat.
Changes in sediment grain size appear to have been an important alteration towards facilitating
surf smelt egg deposition at the site. Forage fish are known to reuse the spawning grounds that
they have utilized in the past (Penttila 2007). It is likely to assume then that the restoration site
may continue to provide suitable habitat for future spawning events. Forage fish spawning
surveys will be continued in year two of monitoring for both sand lance and surf smelt to
document any biological use of the project site.
Observe for Eelgrass
Observing for submerged underwater vegetation should be continued in future assessments to
determine whether native eelgrass (Zostera marina) or other species have colonized the project
site or other areas of Thatcher Bay. The Washington Department of Natural Resources’
Nearshore Habitat Program is the agency tasked with documenting underwater vegetation in the
Puget Sound (DNR 2016). Conversations with personnel at the WA DNR nearshore habitat
program however, indicate that the likelihood of Thatcher Bay entering the DNR site sampling
pool in the near future is minimal. It is not evident how likely it is that any existing eelgrass will
move inward from the mouth of the bay. On multiple visits to the project site it was noted that
water visibility was not much more than a few feet. As native eelgrass can be negatively
18
impacted by an insufficient amount of available light, it is recommended that measurements of
available light also be taken throughout different areas of Thatcher Bay.
References
Bingham, Brian L. 9/11/2013.Thatcher Bay Benthic Sampling Final Report. Department of
Environmental Science, Western Washington University.
Brandon, T., N. Gleason, C. Simenstad, and C. Tanner. 2013. Puget Sound Nearshore Ecosystem
Restoration Project Monitoring Framework. Prepared for the Puget Sound Nearshore Ecosystem
Restoration Project. Published by Washington Department of Fish and Wildlife, Olympia,
Washington, and U.S. Army Corps of Engineers, Seattle, Washington. 73 pp.
Breems, J., Wylie-Echeverria, S., Grossman, E.E., and Elliot, J., 2009, Thatcher Bay,
Washington Nearshore Restoration Assessment. U.S. Geological Survey Open-File Report 2008-
1369, 33 p. [http://pubs.usgs.gov/of/2008/1369/].
Conlan, K.E. and D.V. Ellis. (1979). Effects of wood waste on sand-bed benthos. Mar. Poll. Bull.
10:262-267.
Dennison WC, Orth RJ, Moore KA, Stevenson JC, Carter V, Kollar S, Bergstrom PW, Batiuk
RA. 1993. Assessing water quality with submersed aquatic vegetation. BioScience 43: 86–94.
Eissinger, A.M. 2007. Great Blue Herons in Puget Sound. Puget Sound Nearshore Partnership
Report No. 2007-06. Published by Seattle District, U.S. Army Corps of Engineers, Seattle,
Washington.
Fonseca, M. S., Fisher, J. S., Zieman, J. C. & Thayer, G. W. 1982 Influence of the seagrass,
Zostera marina L., on current flow. Estuarine, Coastal and Shelf Science 15, 351–364.
Friends of the San Juans. 2004. Documented Surf smelt and Pacific Sand lance Spawning
Beaches in San Juan County with a Summary of Protection and Restoration Priorities for Forage
Fish Habitat. Final. Friday Harbor, WA: Friends of the San Juans.
Gambi, M. C., Nowell, A. R. & Jumars, P. A. 1990 Flume observations on flow dynamics in
Zostera marina (eelgrass) beds. Marine Ecology Progress Series 61, 159–169.
Harmon, M.E., J.F. Franklin, F.J. Swanson, P. Sollins, S.V. Gregory, J.D. Lattin, N.H. Anderson,
S.P. Cline, N.G. Aumen, J.R. Sedell, G.W. Lienkaemper, K. Cromack, Jr., and K.W. Cummins.
(1986). Ecology of coarse woody debris in temperate ecosystems. Advances in Ecological
Research 15:133-302.
Hyland, J., L. Balthis, I. Karakassis, and others, 2005. Organic Carbon Content of Sediments as
an Indicator of Stress in the Marine Benthos. Marine Ecology Progress Series 295: 91-103.
19
Kathman, R.D, S.F. Cross, and M. Waldichuk. “Effects of Wood Waste on the Recruitment
Potential of Marine Benthic Communities.” Canadian Tech Report: Fisheries and Aquatic
Sciences, Vol. 1284, 1984, pp. 50.
Keddy, P.A. 2000. Wetland ecology: Principles and conservation. Cambridge University Press,
614 pp.
Kendall, D., and T. Michelsen. 1997. “Management of Wood Waste under Dredged Material
Management Programs (DMMP) and the Sediment Management Standards (SMS) Cleanup
Program.” Seattle District, ACOE, and Washington Department of Ecology.
Kirkpatrick, B., T.C. Shirley, and C.E. O’Clair. “Deep-water Bark Accumulation and Benthos
Richness at Log Transfer and Storage Facilities.” Alaska Fisheries Research Bulletin, Vol. 5, No.
2, 1998, pp. 103-115.
Moulton, L.L. and D. Penttila. 2001. Field manual for sampling forage fish spawn in intertidal
shore regions. San Juan County Forage Fish Assessment Project. 23 p.
Mumford, T.F. 2007. Kelp and Eelgrass in Puget Sound. Puget Sound Nearshore Partnership
Report No. 2007-05. Published by Seattle District, U.S. Army Corps of Engineers, Seattle,
Washington.
Norris, J. G., Wyllie-Echeverria, S., Mumford, T., Bailey, A., & Turner, T. 1997. Estimating
basal area coverage of subtidal seagrass beds using underwater videography. Aquatic Botany, 58,
269 – 286
Penttila, D. 2007. Marine Forage Fishes in Puget Sound. Puget Sound Nearshore Partnership
Report No. 2007-03, Seattle, WA.
Phillips, R. C. 1984. The Ecology of Eelgrass Meadows in the Pacific Northwest: A Community
Profile. U.S. Department of the Interior, Fish and Wildlife Service/U.S. Department of the Army,
Corps of Engineers. FWS/OBS-84/24. September 1984.
Plumb, R.H. Jr.1981. Procedure for handling and chemical analysis of sediment and water
samples. Report EPA/CE 81-1. Prepared by State University College at Buffalo, Great Lakes
Lab, Buffalo, NY, US.
PSEP. 1986. Recommended Protocols for Measuring Conventional Sediment Variables in Puget
Sound. Final Report. Prepared for USEPA, Seattle, WA.
Roe, JoAnn. 2005. Blakely: Island in Time. Montevista Press, Bellingham, Washington.
SAIC. 1999. Port Angeles Harbor Wood Waste Study, Port Angeles, Washington, Final.
Prepared for: Washington State Department of Ecology by SAIC, Bothell, WA, pp. 41.
Schultz, R.D. and R.J. Berg. 1976. Some effects of log dumping on estuaries. National Marine
Fisheries Service, Juneau, AK. 64 pp.
20
SFEG: George, Joe and Studley, Alison. May, 2015. Presentation: Thatcher Bay Restoration
Project. Salmon Recovery Conference. Washington State Salmon Recovery Funding Board.
Wang, F., and P. M. Chapman. 1999. Biological Implications of Sulfide in Sediment a Review
Focusing on Sediment Toxicity. Environmental Toxicology and Chemistry 18, no. 11: 2526-
2532.
Washington State Dept. of Ecology, Toxics Cleanup Program. 2008. Sediment Sampling and
Analysis Plan: Guidance on the Development of Sediment Sampling and Analysis Plans Meeting
the Requirements of the Sediment Management Standards. Publication # 03-09-043.
https://fortress.wa.gov/ecy/publications/summarypages/0309043.html
Washington State Dept. of Ecology, Toxics Cleanup Program. 2013. Wood Waste Cleanup:
Identifying, Assessing, and Remediating Wood Waste in Marine and Freshwater Environments.
Publication # 09-09-044. https://fortress.wa.gov/ecy/publications/SummaryPages/0909044.html
Wyllie-Echeverria, S., Ackerman, J.D., 2003. The seagrasses of the Pacific coast of North
America. In: Green, E.P., Short, F.T. (Eds.), World Atlas of Seagrasses. University of California
Press, Berkeley and Los Angeles, California, pp. 199e206.
21
Appendix A: Macroinvertebrate results
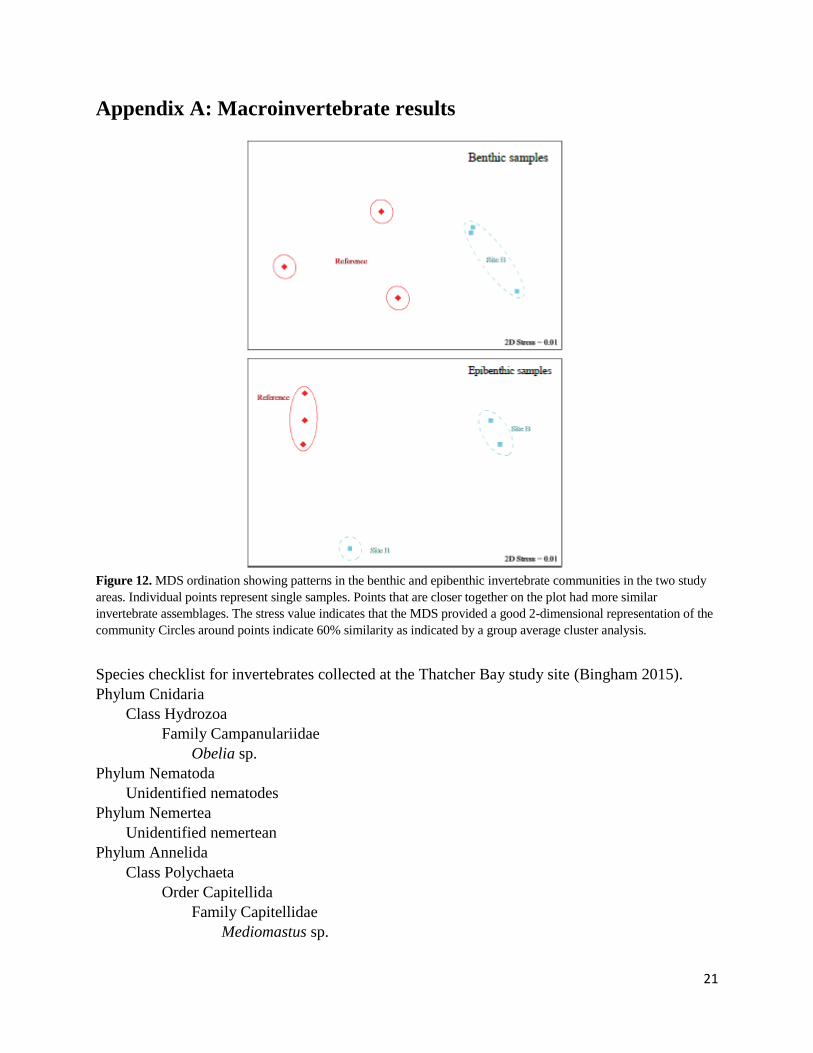
Figure 12. MDS ordination showing patterns in the benthic and epibenthic invertebrate communities in the two study
areas. Individual points represent single samples. Points that are closer together on the plot had more similar
invertebrate assemblages. The stress value indicates that the MDS provided a good 2-dimensional representation of the
community Circles around points indicate 60% similarity as indicated by a group average cluster analysis.
Species checklist for invertebrates collected at the Thatcher Bay study site (Bingham 2015).
Phylum Cnidaria
Class Hydrozoa
Family Campanulariidae
Obelia sp.
Phylum Nematoda
Unidentified nematodes
Phylum Nemertea
Unidentified nemertean
Phylum Annelida
Class Polychaeta
Order Capitellida
Family Capitellidae
Mediomastus sp.
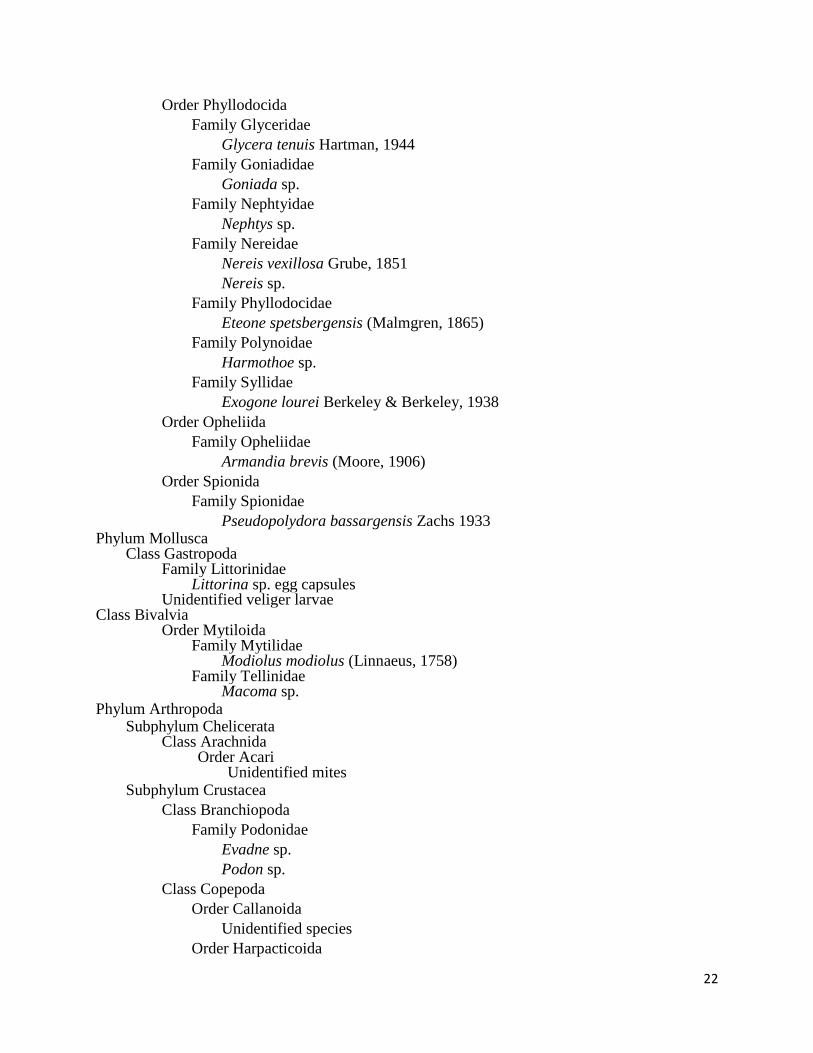
22
Order Phyllodocida
Family Glyceridae
Glycera tenuis Hartman, 1944
Family Goniadidae
Goniada sp.
Family Nephtyidae
Nephtys sp.
Family Nereidae
Nereis vexillosa Grube, 1851
Nereis sp.
Family Phyllodocidae
Eteone spetsbergensis (Malmgren, 1865)
Family Polynoidae
Harmothoe sp.
Family Syllidae
Exogone lourei Berkeley & Berkeley, 1938
Order Opheliida
Family Opheliidae
Armandia brevis (Moore, 1906)
Order Spionida
Family Spionidae
Pseudopolydora bassargensis Zachs 1933 Phylum Mollusca Class Gastropoda Family Littorinidae Littorina sp. egg capsules Unidentified veliger larvae Class Bivalvia Order Mytiloida Family Mytilidae Modiolus modiolus (Linnaeus, 1758) Family Tellinidae Macoma sp. Phylum Arthropoda
Subphylum Chelicerata Class Arachnida Order Acari Unidentified mites Subphylum Crustacea
Class Branchiopoda
Family Podonidae
Evadne sp.
Podon sp.
Class Copepoda
Order Callanoida
Unidentified species
Order Harpacticoida
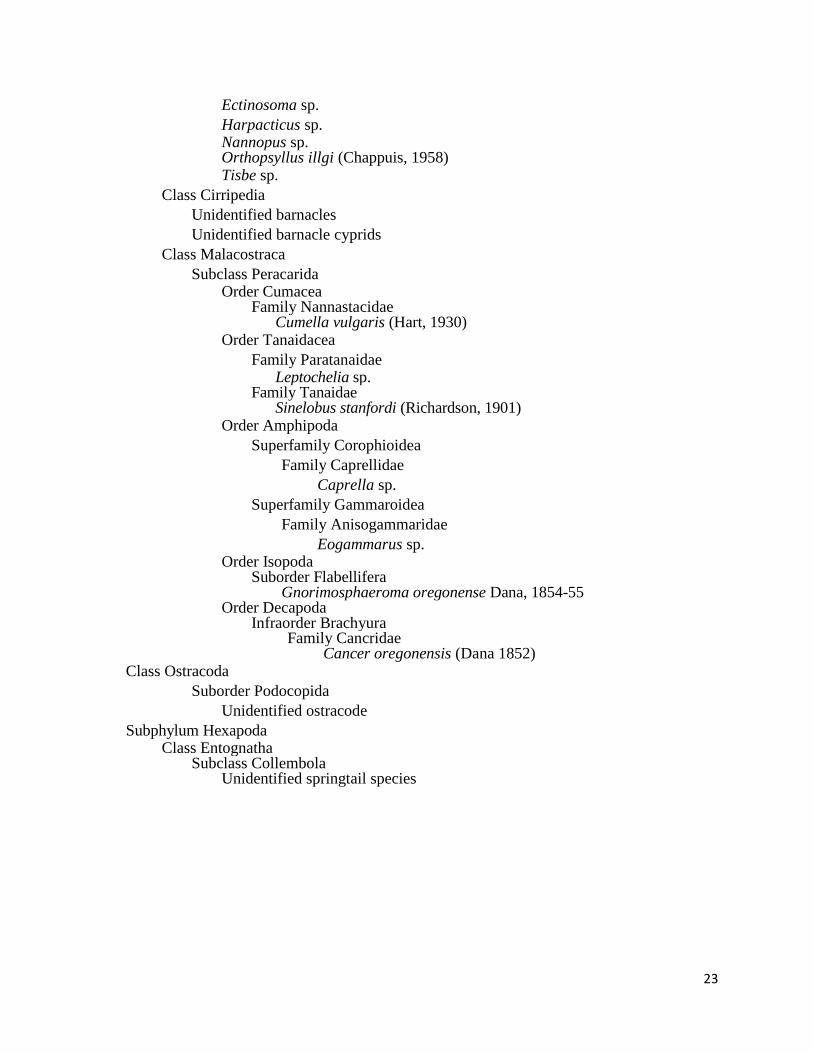
23
Ectinosoma sp.
Harpacticus sp. Nannopus sp. Orthopsyllus illgi (Chappuis, 1958) Tisbe sp.
Class Cirripedia
Unidentified barnacles
Unidentified barnacle cyprids
Class Malacostraca
Subclass Peracarida Order Cumacea Family Nannastacidae Cumella vulgaris (Hart, 1930) Order Tanaidacea
Family Paratanaidae Leptochelia sp. Family Tanaidae Sinelobus stanfordi (Richardson, 1901) Order Amphipoda
Superfamily Corophioidea
Family Caprellidae
Caprella sp.
Superfamily Gammaroidea
Family Anisogammaridae
Eogammarus sp. Order Isopoda Suborder Flabellifera Gnorimosphaeroma oregonense Dana, 1854-55 Order Decapoda Infraorder Brachyura Family Cancridae Cancer oregonensis (Dana 1852) Class Ostracoda
Suborder Podocopida
Unidentified ostracode
Subphylum Hexapoda Class Entognatha Subclass Collembola Unidentified springtail species
24
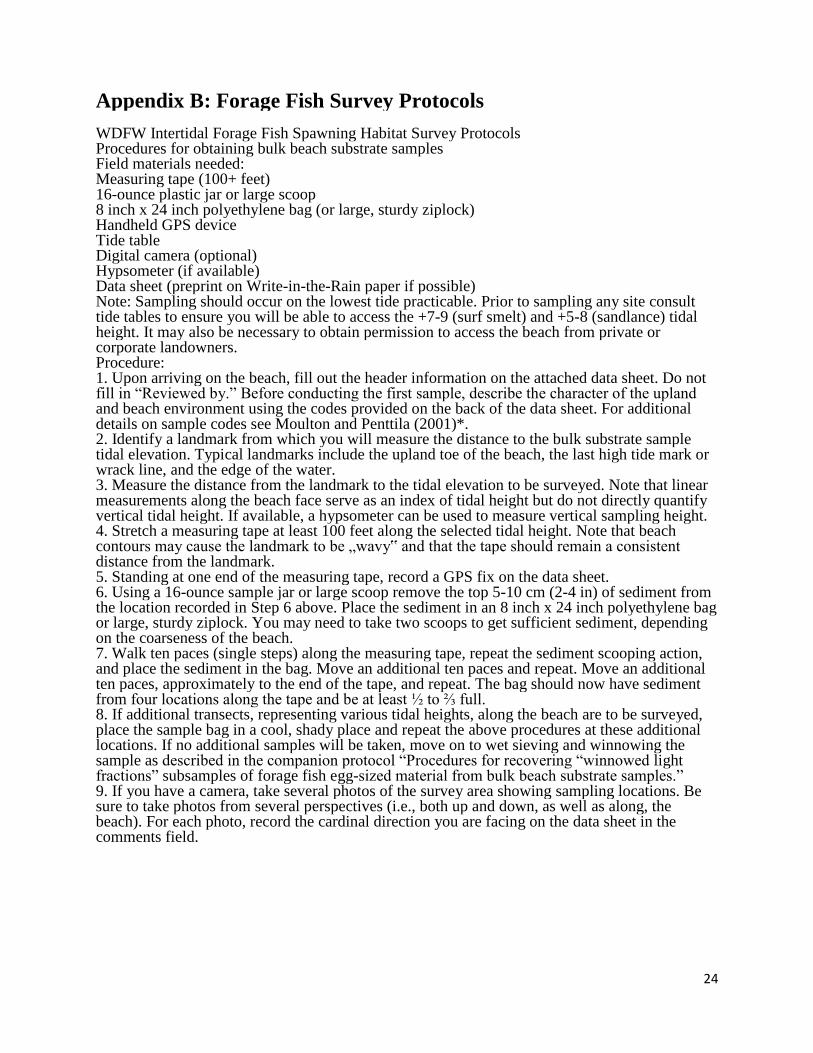
Appendix B: Forage Fish Survey Protocols WDFW Intertidal Forage Fish Spawning Habitat Survey Protocols Procedures for obtaining bulk beach substrate samples Field materials needed: Measuring tape (100+ feet) 16-ounce plastic jar or large scoop 8 inch x 24 inch polyethylene bag (or large, sturdy ziplock) Handheld GPS device Tide table Digital camera (optional) Hypsometer (if available) Data sheet (preprint on Write-in-the-Rain paper if possible) Note: Sampling should occur on the lowest tide practicable. Prior to sampling any site consult tide tables to ensure you will be able to access the +7-9 (surf smelt) and +5-8 (sandlance) tidal height. It may also be necessary to obtain permission to access the beach from private or corporate landowners. Procedure: 1. Upon arriving on the beach, fill out the header information on the attached data sheet. Do not fill in “Reviewed by.” Before conducting the first sample, describe the character of the upland and beach environment using the codes provided on the back of the data sheet. For additional details on sample codes see Moulton and Penttila (2001)*. 2. Identify a landmark from which you will measure the distance to the bulk substrate sample tidal elevation. Typical landmarks include the upland toe of the beach, the last high tide mark or wrack line, and the edge of the water. 3. Measure the distance from the landmark to the tidal elevation to be surveyed. Note that linear measurements along the beach face serve as an index of tidal height but do not directly quantify vertical tidal height. If available, a hypsometer can be used to measure vertical sampling height. 4. Stretch a measuring tape at least 100 feet along the selected tidal height. Note that beach contours may cause the landmark to be „wavy‟ and that the tape should remain a consistent distance from the landmark. 5. Standing at one end of the measuring tape, record a GPS fix on the data sheet. 6. Using a 16-ounce sample jar or large scoop remove the top 5-10 cm (2-4 in) of sediment from the location recorded in Step 6 above. Place the sediment in an 8 inch x 24 inch polyethylene bag or large, sturdy ziplock. You may need to take two scoops to get sufficient sediment, depending on the coarseness of the beach. 7. Walk ten paces (single steps) along the measuring tape, repeat the sediment scooping action, and place the sediment in the bag. Move an additional ten paces and repeat. Move an additional ten paces, approximately to the end of the tape, and repeat. The bag should now have sediment from four locations along the tape and be at least ½ to ⅔ full. 8. If additional transects, representing various tidal heights, along the beach are to be surveyed, place the sample bag in a cool, shady place and repeat the above procedures at these additional locations. If no additional samples will be taken, move on to wet sieving and winnowing the sample as described in the companion protocol “Procedures for recovering “winnowed light fractions” subsamples of forage fish egg-sized material from bulk beach substrate samples.” 9. If you have a camera, take several photos of the survey area showing sampling locations. Be sure to take photos from several perspectives (i.e., both up and down, as well as along, the beach). For each photo, record the cardinal direction you are facing on the data sheet in the comments field.
25
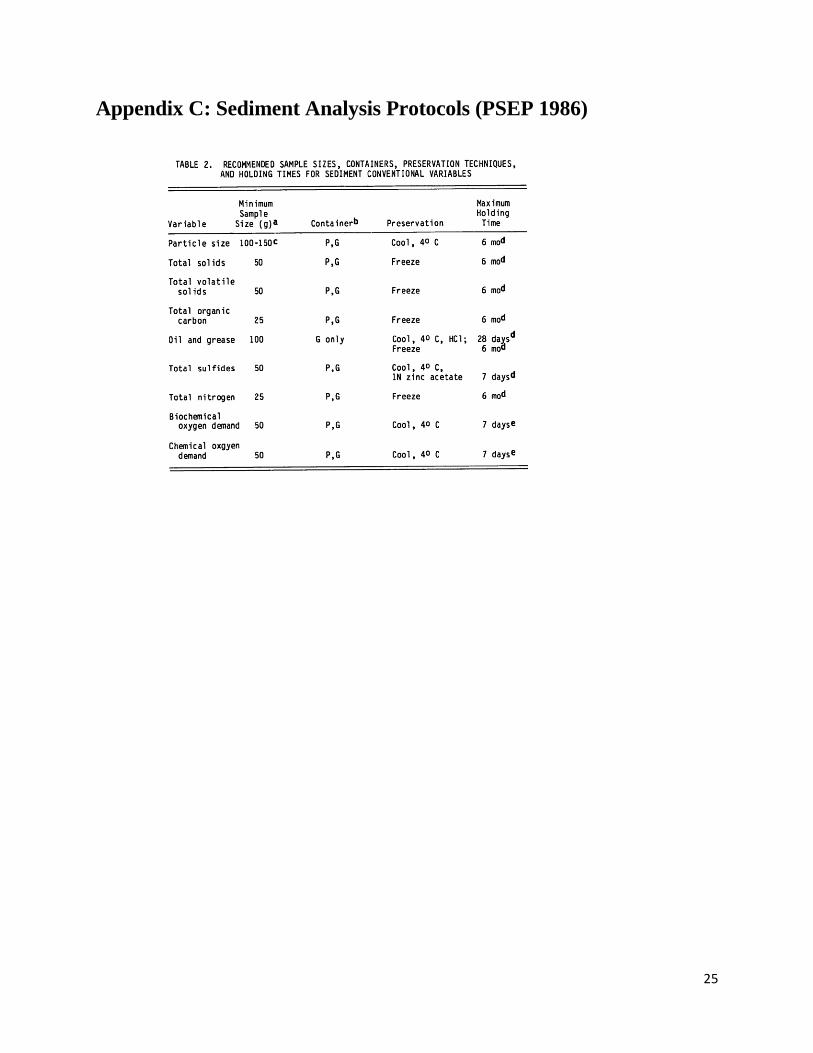
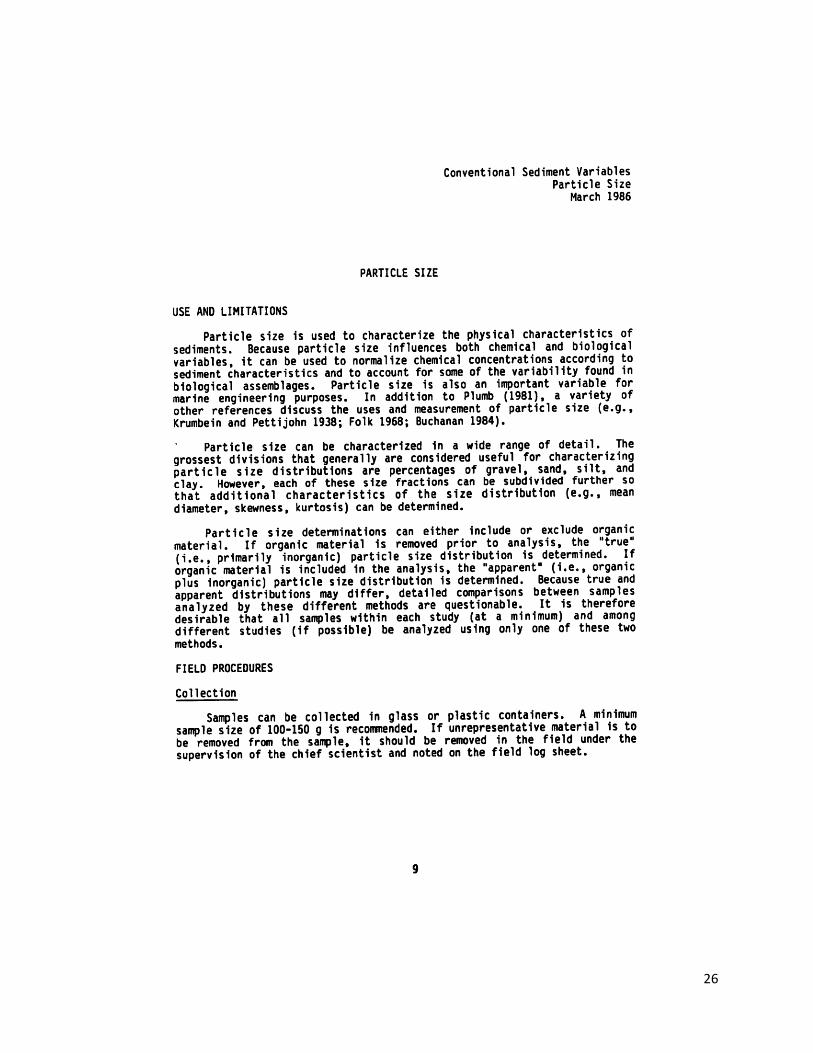
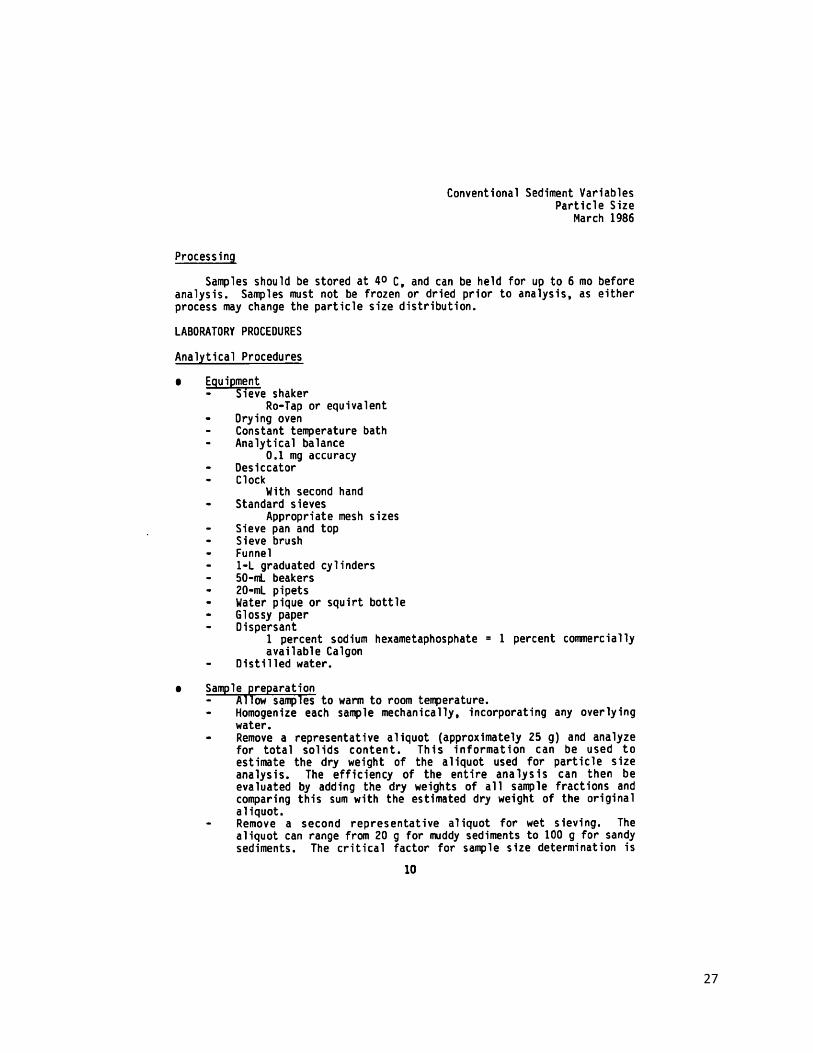
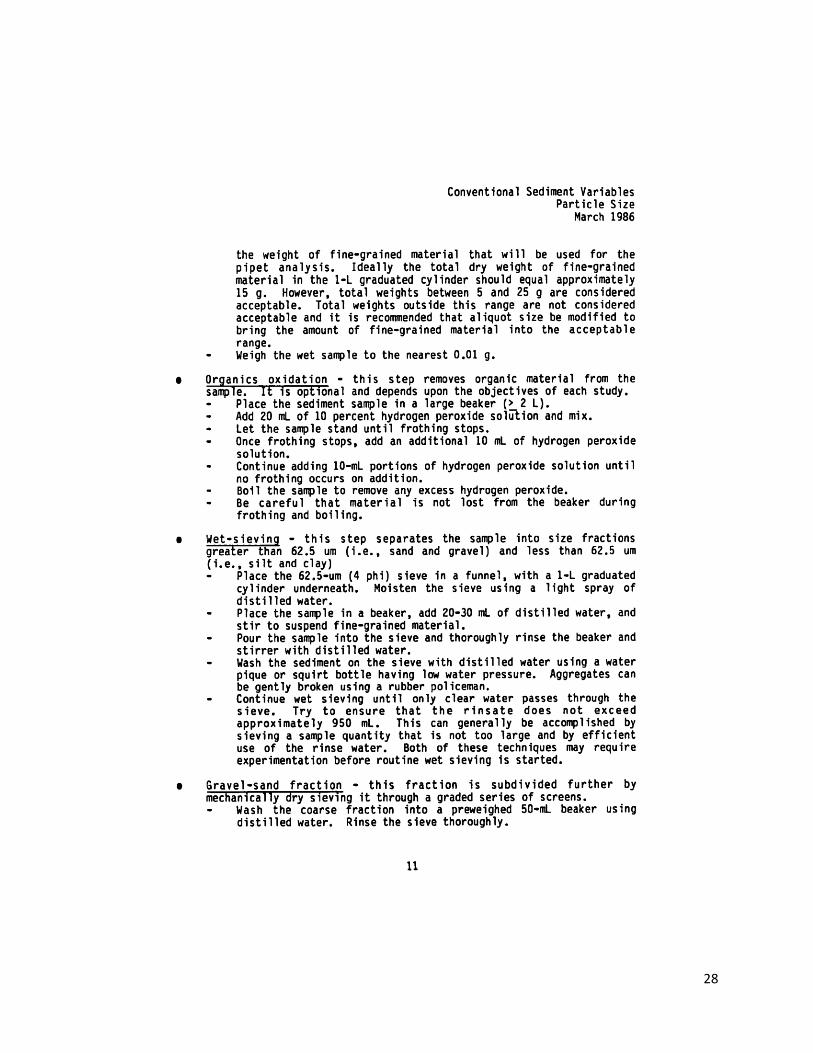
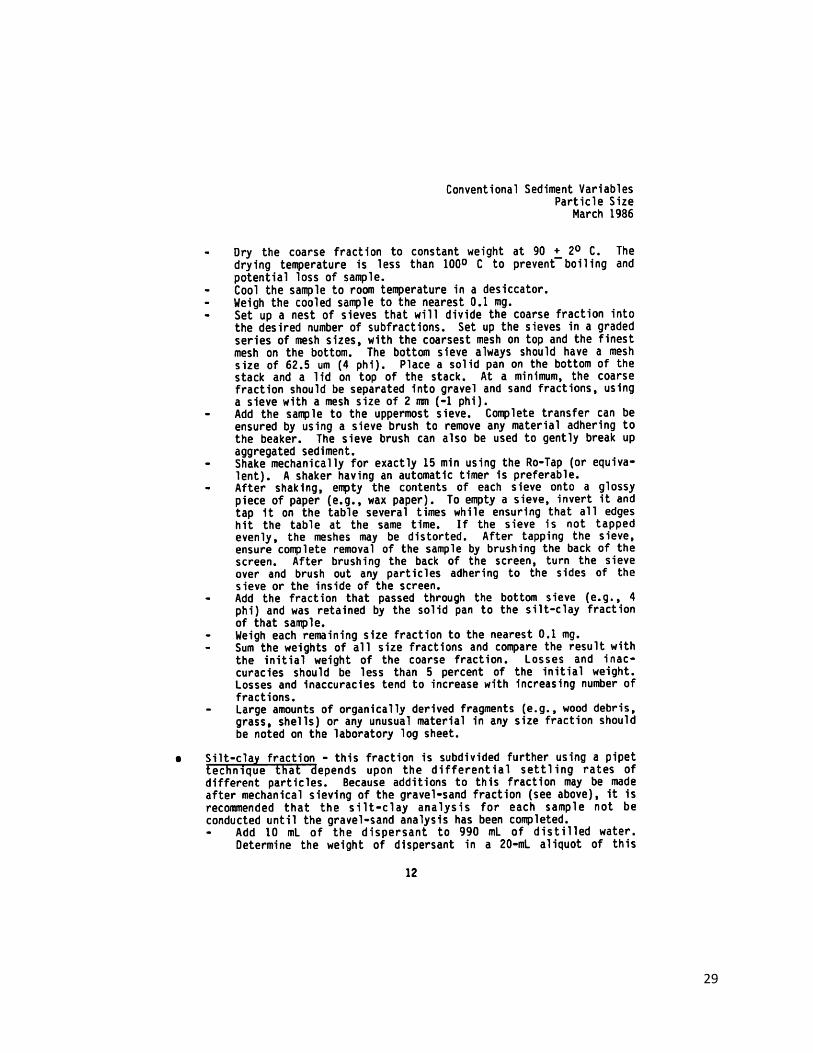
Appendix C: Sediment Analysis Protocols (PSEP 1986)
26
27
28
29
30
31
32
33
34
35
36
37
38