than in our established markets. Such great … · E-mail [email protected] Website Director Investor...
140
Annual Report 2013 14
Transcript of than in our established markets. Such great … · E-mail [email protected] Website Director Investor...

Annual Report 2013 14
An
nua
l Rep
ort 2
013
14
Investor information
Our Brands
Sonova Holding AGLaubisrütistrasse 288712 StäfaSwitzerlandPhone +41 58 928 33 33Fax +41 58 928 33 [email protected] www.sonova.com
DisclaimerThis report contains forward-looking statements which offer no guarantee with regard to future performance. These statements are made on the basis of management’s views and assumptions regarding future events and business performance at the time the statements are made. They are subject to risks and uncertainties including, but not confined to, future global economic conditions, exchange rates, legal provisions, market conditions, activities by competitors and other factors outside the company’s control.
Impr
int
Conc
ept &
Des
ign:
hild
a de
sign
mat
ters
, Zur
ich
Phot
ogra
phy:
Bra
zil —
Ehr
in M
acks
ey, V
ietn
am; G
roup
pho
tos
— Jo
s Sc
hmid
, Zur
ich
Publ
ishi
ng S
yste
m: M
ulti
med
ia S
olut
ions
AG
, Zur
ich
/ Pri
ntin
g: N
eidh
art +
Sch
ön A
G, Z
uric
h
This
Ann
ual R
epor
t is
also
ava
ilabl
e in
Ger
man
. Th
e En
glis
h ve
rsio
n is
the
gove
rnin
g te
xt.
028-
1303
-02
Prin
ted
in S
witz
erla
nd
©So
nova
Hol
ding
AG
201
4 Al
l rig
hts
rese
rved
Financial calendar
June 17, 2014General Shareholders’ Meeting of Sonova Holding AG at Zurich Hallenstadion, Zurich-Oerlikon
November 17, 2014Publication of Semi-Annual Report as of September 30, 2014Media and Analysts Conference
May 19, 2015Publication of Annual Report as of March 31, 2015Media and Analysts Conference
June 16, 2015General Shareholders’ Meeting of Sonova Holding AG at Zurich Hallenstadion, Zurich-Oerlikon
Financial informationCorporate & ad hoc news Annual Reports Semi-Annual Reports IR presentations www.sonova.com/en/investors
Information on the General Shareholders’ MeetingInvitation and agenda General Shareholders’ Meeting presentations General Shareholders’ Meeting minutes www.sonova.com/en/AGM
IR online news serviceIR News Service www.sonova.com/en/registration
Contact formwww.sonova.com/en/contact-us
Order form for financial reportswww.sonova.com/en/order-form
Sonova HeadquartersSonova Holding AGInvestor Relations Laubisrütistrasse 28CH-8712 StäfaSwitzerland Phone +41 58 928 33 33Fax +41 58 928 33 99E-mail [email protected] Website www.sonova.com
Director Investor Relations Thomas Bernhardsgrütter
Investor Relations AssociatesNicole JenniCorinne Hofmann
Share register ShareCommService AG Verena Deil Europastrasse 29 CH-8152 Glattbrugg Switzerland Phone +41 44 809 58 53Fax +41 44 809 58 59
Capital structure and shareholder rights
Share datawww.sonova.com/en/investors/share-data
Shareholder structure www.sonova.com/en/investors/ shareholder-structure
Restrictions on shareholder rights www.sonova.com/en/investors/ shareholder-participation-rights
Regulations and principlesArticles of AssociationOrganizational RegulationsRules on Board Operations and ProceduresCommittee ChartersCode of Conduct Supplier Principleswww.sonova.com/en/investors/ articles-association
Innovation – The key to emerging markets
For Sonova, growth potential in emerging countries is even greater than in our established markets. Such great opportunities present unique challenges: the aspirations of millions of new consumers can only be met through new approaches.
We unlock the potential of emerging markets with the key of con tinuous innovation – in what we make, how we make it, and how we sell it. We have validated that strategy through our business success in Brazil, illustrated in the stories throughout this report.
000_SO_MR_1314_Cover_EN.indd 1-5 19.05.2014 10:20:50

Highlights2013 14
Key figures2013 14
Key
figu
res
Hig
hli
ghts
Asia/Paci�c
Americas (excl. USA)
USA
EMEA
Cochlear Implants and Accessories
Miscellaneous
Wireless Communication Systems
Standard Hearing Instruments
Advanced Hearing Instruments
Premium Hearing Instruments
11
37
11 41
USA
Americas (excl. USA)
EMEA
Asia/Pacific 10
413 22
2229
PremiumHearing Instruments
StandardHearing
Instruments
WirelessCommunication
Systems
Miscellaneous
Cochlear Implants and Accessories
AdvancedHearingInstruments
SALES BY REGIONS 2013/14 IN % SALES BY PRODUCT GROUPS 2013/14 IN %
800
600
400
200
0
1,400
1,200
1,000
1,600
1,800
2,000
45
40
35
30
25
20
15
10
5
0
450
400
350
300
250
200
150
100
50
0
450
400
350
300
250
200
150
100
50
0
9.00
8.00
7.00
6.00
5.00
4.00
3.00
2.00
1.00
0.00
450
400
350
300
250
200
150
100
50
0
SALES IN CHF M
EBITA IN CHF M EBITA MARGIN IN %
OPERATING FREE CASH FLOW IN CHF M
INCOME AFTER TAXES IN CHF M EPS IN CHF
2013
/14
20
09
/10
2010
/11
2011
/12
2012
/13
1,951
2013
/14
200
9/1
0¹⁾
2010
/11
2011
/12
2012
/13²
⁾3 ⁾
430
2013
/14
200
9/1
0
2010
/11
2011
/12
2012
/13
318
2013
/14
200
9/1
0¹⁾
2010
/11
2011
/12
2012
/13²
⁾3 ⁾
347
1) Restated based on finalization of the acquisition accounting of Advanced Bionics.2) Restated following the implementation of IAS 19 (revised), refer Note 2.1. of the consolidated financial statements.3) Excluding one-off cost, mainly related to the increase of the product liability provision within the cochlear implants business
(see Note 7 of the consolidated financial statements).
+ 11.7 % sales growth in local currenciesConsolidated sales for the Group were CHF 1,951 million, up 8.7 % in Swiss f rancs and 11.7 % in local currencies. Both the hearing instruments and cochlear implants seg ment and all major regions cont r ibu- ted to the increase.
+ 8.8 % organic growth in hearing instrumentsDriven almost exclusively by organic growth, sales in the hear ing inst r uments segment reached CHF 1,756 million, an inc rea se of 6 . 5 % in Swiss f rancs and 9.5 % in local currencies. The bu siness out paced the estimated market growth rates and f ur ther expanded the Group’s leading market posit ion.
CHF 311.5 million net cash positionThe Group’s strong cash f lows resulted in a sound end-of-year balance sheet and solid net cash posit ion of CHF 311.5 million. The Board of Directors proposes to the 2014 AGM a dividend of CHF 1.90, up 19% f rom the distribution in the prior year.
ROCE of 27.7 % staying on track The return on capital em-ployed (ROCE) was 27.7 %, well on track towards our mid-ter m f inancial targets.
The Sonova Group has shown solid perfor mance in the f inancial year 2013/14. Thelaunch of new products and solutions across the business, drove sales and ear n ings g rowth. Our con stant pursuit of customer-driven innovation, paid off in strong results in both our business segments and all our brands.
6.6 % EBITA margin in cochlear implantsThe cochlear implants seg-ment achieved sales of CHF 195 million, an increase of 33.1% in Swiss f rancs and 36.0 % in local currencies.The prof itability improved st rongly, reaching CHF 12.8 million, representing an operating margin of 6.6 %.
CHF 430.1 million EBITA + 16.7 % in local currencies Group EBI TA reached CHF 430.1 million, up 11.6 % in Swiss f rancs and 16.7 % in local cur rencies versus the prior year (normalized for the ef fec t of one-of f costs). Operating margin improved by 50 basis points to 22.0 %, despite adverse cur rency impact.
SONOVA GROUP KEY FIGURES
in CHF m unless otherwise specified 2013 / 14Change in % (normalized)
Normalized performance 2012 / 131)/2)
Change in % (reported)
Reported performance
2012/131)
Sales 1,951.3 8.7% 1,795.3 8.7% 1,795.3
EBITA 430.1 11.6% 385.3 136.7% 181.7
EBITA margin 22.0% 21.5% 10.1%
EPS (CHF) 5.08 10.4% 4.60 207.9% 1.65
Operating free cash flow2) 318.4 (0.0%) 318.6 (0.0%) 318.6
ROCE3) 27.7% 10.4% 10.4%
ROE3) 20.3% 7.1% 7.1%
1) Restated following the implementation of IAS 19 (revised), see Note 2.1. of the consolidated financial statements.2) Excluding one-off cost, mainly related to the increase of the product liability provision within the cochlear implants business (see Note 7 of
the consolidated financial statements). Balance sheet related key figures (including respective ratios) as reported.3) For detailed definitions, please refer to “5 Year Key Figures”.
Hear the World
Sonova Annual Report 2013 / 14
ENGAGEMENT IN PANAMA
Hearing tests for children are manda-tory in Panama. “But many parents are overwhelmed when they suddenly receive a piece of paper that says: ‘Your child needs a hearing aid!’,” says Virginia de Alvarado, director of Funproi (Fundación Pro Integración); “Then they come to us.” Many of the families needing help are from remote regions and have come all the way to Panama City in search of support. Funproi has been active throughout Panama for over 30 years: “We place strong emphasis on sustainable concepts,” says de Alvarado, “because the people who approach us need long-term solutions.”
“The laughter of a child when it hears for the first time!” recalls Christiane Vana, a professional audiologist who works in Phonak’s Latin American hub
in São Paulo, Brazil; “The tears of the parents! This is an experience children will remember for the rest of their life. It’s a fantastic privilege to be part of that moment.” She still remembers everything very clearly: “Those are moments when you don’t just know, you also feel, deeply, that you’re doing the right thing.” Vana has a taxing job that involves a lot of traveling to Spanish-speaking countries in Latin America training hearing care profes-sionals. When the opportunity arose to join the Hear the World Foundation project in Panama for two days, Vana did not hesitate for a moment. “Yes, I know that those figures on my desk actually represent people who are being helped,” she says, “but I am always touched afresh when I see somebody rediscovering the world around them – because they can sud-denly hear!”
The 2013 cooperation between the Hear the World Foundation and the Funproi foundation is a pilot project. Thanks to it, Funproi supplied digital
hearing aids to 30 children with hearing loss in both ears. The audiologists at Funproi were also instructed in the use of wireless systems. “In Panama, people with hearing loss often live very isolated lives, especially out in the countryside,” says Funproi director de Alvarado. “Good hearing aids are especially vital for a child’s language development. We are happy about every child we can liberate from isolation.”
For more information about this project visit www.hear-the-world.com/children.
The Hear the World ambassadorsHear the World is now supported by more than 70 celebrity ambassadors, all of whom have had their photographs taken by musician and photographer Bryan Adams in the Hear the World pose: with one hand behind the ear to symbolize conscious hearing. Sting, Annie Lennox, Joss Stone, Tobey Maguire, and John Legend are just some of the many celebri-ties featured in these impressive photos. They all contribute toward raising public awareness of the importance of good hearing and the consequences of hearing loss.
Hear the World – Active dedication from the entire Sonova Group Along with our celebrity ambassadors, employees of the Sonova Group actively support the Hear the World Foundation. Through their involvement as volunteers, they play a key role in the training and education of our project partners all over the world, bringing them up to date with the latest technological developments and passing on their knowledge of – for example – how to fit hearing aids properly. They also provide
assistance for hearing screenings and support for awareness campaigns as part of their voluntary activities. Another important aspect of the Foundation’s work is fundraising, where employees have the opportunity to actively support the Foundation through their own initiatives, such as taking part in a sponsored run.
Further information can be found at www.hear-the-world.com.
Become a fan of Hear the World at www.facebook.com/CanYouHearTheWorld
1 WHO (2008)2 WHO (2006)3 Unicef (2004) 4, 5 WHO (2012)
Help for children in Panama: In a project launched by the Hear the World Foundation, the Funproi foundation received a donation of hearing aids. The fitting of the hearing aids on location was accom-panied by Sonova employee Christiane Vana from Brazil on an active assignment for the Hear the World Foundation.
000_SO_MR_1314_Cover_EN.indd 6-10 19.05.2014 10:20:53

Highlights2013 14
Key figures2013 14
Key
figu
res
Hig
hli
ghts
Asia/Paci�c
Americas (excl. USA)
USA
EMEA
Cochlear Implants and Accessories
Miscellaneous
Wireless Communication Systems
Standard Hearing Instruments
Advanced Hearing Instruments
Premium Hearing Instruments
11
37
11 41
USA
Americas (excl. USA)
EMEA
Asia/Pacific 10
413 22
2229
PremiumHearing Instruments
StandardHearing
Instruments
WirelessCommunication
Systems
Miscellaneous
Cochlear Implants and Accessories
AdvancedHearingInstruments
SALES BY REGIONS 2013/14 IN % SALES BY PRODUCT GROUPS 2013/14 IN %
Asia/Paci�c
Americas (excl. USA)
USA
EMEA
Cochlear Implants and Accessories
Miscellaneous
Wireless Communication Systems
Standard Hearing Instruments
Advanced Hearing Instruments
Premium Hearing Instruments
11
37
11 41
USA
Americas (excl. USA)
EMEA
Asia /Pacific 10
413 22
2229
PremiumHearing Instruments
StandardHearing
Instruments
WirelessCommunication
Systems
Miscellaneous
Cochlear Implants and Accessories
AdvancedHearingInstruments
SALES BY REGIONS 2013/14 IN % SALES BY PRODUCT GROUPS 2013/14 IN %
800
600
400
200
0
1,400
1,200
1,000
1,600
1,800
2,000
45
40
35
30
25
20
15
10
5
0
450
400
350
300
250
200
150
100
50
0
450
400
350
300
250
200
150
100
50
0
9.00
8.00
7.00
6.00
5.00
4.00
3.00
2.00
1.00
0.00
450
400
350
300
250
200
150
100
50
0
SALES IN CHF M
EBITA IN CHF M EBITA MARGIN IN %
OPERATING FREE CASH FLOW IN CHF M
INCOME AFTER TAXES IN CHF M EPS IN CHF
2013
/14
20
09
/10
2010
/11
2011
/12
2012
/13
1,951
2013
/14
200
9/1
0¹⁾
2010
/11
2011
/12
2012
/13²
⁾3 ⁾
430
2013
/14
200
9/1
0
2010
/11
2011
/12
2012
/13
318
2013
/14
200
9/1
0¹⁾
2010
/11
2011
/12
2012
/13²
⁾3 ⁾
347
800
600
400
200
0
1,400
1,200
1,000
1,600
1,800
2,000
45
40
35
30
25
20
15
10
5
0
450
400
350
300
250
200
150
100
50
0
450
400
350
300
250
200
150
100
50
0
9.00
8.00
7.00
6.00
5.00
4.00
3.00
2.00
1.00
0.00
450
400
350
300
250
200
150
100
50
0
SALES IN CHF M
EBITA IN CHF M EBITA MARGIN IN %
OPERATING FREE CASH FLOW IN CHF M
INCOME AFTER TAXES IN CHF M EPS IN CHF
2013
/14
20
09
/10
2010
/11
2011
/12
2012
/13
1,951
2013
/14
200
9/1
0¹⁾
2010
/11
2011
/12
2012
/13²
⁾3 ⁾
430
2013
/14
200
9/1
0
2010
/11
2011
/12
2012
/13
31820
13/1
4
200
9/1
0¹⁾
2010
/11
2011
/12
2012
/13²
⁾3 ⁾
347
1) Restated based on finalization of the acquisition accounting of Advanced Bionics.2) Restated following the implementation of IAS 19 (revised), refer Note 2.1. of the consolidated financial statements.3) Excluding one-off cost, mainly related to the increase of the product liability provision within the cochlear implants business
(see Note 7 of the consolidated financial statements).
+ 11.7 % sales growth in local currenciesConsolidated sales for the Group were CHF 1,951 million, up 8.7 % in Swiss f rancs and 11.7 % in local currencies. Both the hearing instruments and cochlear implants seg ment and all major regions cont r ibu- ted to the increase.
+ 8.8 % organic growth in hearing instrumentsDriven almost exclusively by organic growth, sales in the hear ing inst r uments segment reached CHF 1,756 million, an inc rea se of 6 . 5 % in Swiss f rancs and 9.5 % in local currencies. The bu siness out paced the estimated market growth rates and f ur ther expanded the Group’s leading market posit ion.
CHF 311.5 million net cash positionThe Group’s strong cash f lows resulted in a sound end-of-year balance sheet and solid net cash posit ion of CHF 311.5 million. The Board of Directors proposes to the 2014 AGM a dividend of CHF 1.90, up 19% f rom the distribution in the prior year.
ROCE of 27.7 % staying on track The return on capital em-ployed (ROCE) was 27.7 %, well on track towards our mid-ter m f inancial targets.
The Sonova Group has shown solid perfor mance in the f inancial year 2013/14. Thelaunch of new products and solutions across the business, drove sales and ear n ings g rowth. Our con stant pursuit of customer-driven innovation, paid off in strong results in both our business segments and all our brands.
6.6 % EBITA margin in cochlear implantsThe cochlear implants seg-ment achieved sales of CHF 195 million, an increase of 33.1% in Swiss f rancs and 36.0 % in local currencies.The prof itability improved st rongly, reaching CHF 12.8 million, representing an operating margin of 6.6 %.
CHF 430.1 million EBITA + 16.7 % in local currencies Group EBI TA reached CHF 430.1 million, up 11.6 % in Swiss f rancs and 16.7 % in local cur rencies versus the prior year (normalized for the ef fec t of one-of f costs). Operating margin improved by 50 basis points to 22.0 %, despite adverse cur rency impact.
SONOVA GROUP KEY FIGURES
in CHF m unless otherwise specified 2013 / 14Change in % (normalized)
Normalized performance 2012 / 131)/2)
Change in % (reported)
Reported performance
2012/131)
Sales 1,951.3 8.7% 1,795.3 8.7% 1,795.3
EBITA 430.1 11.6% 385.3 136.7% 181.7
EBITA margin 22.0% 21.5% 10.1%
EPS (CHF) 5.08 10.4% 4.60 207.9% 1.65
Operating free cash flow2) 318.4 (0.0%) 318.6 (0.0%) 318.6
ROCE3) 27.7% 10.4% 10.4%
ROE3) 20.3% 7.1% 7.1%
1) Restated following the implementation of IAS 19 (revised), see Note 2.1. of the consolidated financial statements.2) Excluding one-off cost, mainly related to the increase of the product liability provision within the cochlear implants business (see Note 7 of
the consolidated financial statements). Balance sheet related key figures (including respective ratios) as reported.3) For detailed definitions, please refer to “5 Year Key Figures”.
Hear the World
Sonova Annual Report 2013 / 14
ENGAGEMENT IN PANAMA
Hearing tests for children are manda-tory in Panama. “But many parents are overwhelmed when they suddenly receive a piece of paper that says: ‘Your child needs a hearing aid!’,” says Virginia de Alvarado, director of Funproi (Fundación Pro Integración); “Then they come to us.” Many of the families needing help are from remote regions and have come all the way to Panama City in search of support. Funproi has been active throughout Panama for over 30 years: “We place strong emphasis on sustainable concepts,” says de Alvarado, “because the people who approach us need long-term solutions.”
“The laughter of a child when it hears for the first time!” recalls Christiane Vana, a professional audiologist who works in Phonak’s Latin American hub
in São Paulo, Brazil; “The tears of the parents! This is an experience children will remember for the rest of their life. It’s a fantastic privilege to be part of that moment.” She still remembers everything very clearly: “Those are moments when you don’t just know, you also feel, deeply, that you’re doing the right thing.” Vana has a taxing job that involves a lot of traveling to Spanish-speaking countries in Latin America training hearing care profes-sionals. When the opportunity arose to join the Hear the World Foundation project in Panama for two days, Vana did not hesitate for a moment. “Yes, I know that those figures on my desk actually represent people who are being helped,” she says, “but I am always touched afresh when I see somebody rediscovering the world around them – because they can sud-denly hear!”
The 2013 cooperation between the Hear the World Foundation and the Funproi foundation is a pilot project. Thanks to it, Funproi supplied digital
hearing aids to 30 children with hearing loss in both ears. The audiologists at Funproi were also instructed in the use of wireless systems. “In Panama, people with hearing loss often live very isolated lives, especially out in the countryside,” says Funproi director de Alvarado. “Good hearing aids are especially vital for a child’s language development. We are happy about every child we can liberate from isolation.”
For more information about this project visit www.hear-the-world.com/children.
The Hear the World ambassadorsHear the World is now supported by more than 70 celebrity ambassadors, all of whom have had their photographs taken by musician and photographer Bryan Adams in the Hear the World pose: with one hand behind the ear to symbolize conscious hearing. Sting, Annie Lennox, Joss Stone, Tobey Maguire, and John Legend are just some of the many celebri-ties featured in these impressive photos. They all contribute toward raising public awareness of the importance of good hearing and the consequences of hearing loss.
Hear the World – Active dedication from the entire Sonova Group Along with our celebrity ambassadors, employees of the Sonova Group actively support the Hear the World Foundation. Through their involvement as volunteers, they play a key role in the training and education of our project partners all over the world, bringing them up to date with the latest technological developments and passing on their knowledge of – for example – how to fit hearing aids properly. They also provide
assistance for hearing screenings and support for awareness campaigns as part of their voluntary activities. Another important aspect of the Foundation’s work is fundraising, where employees have the opportunity to actively support the Foundation through their own initiatives, such as taking part in a sponsored run.
Further information can be found at www.hear-the-world.com.
Become a fan of Hear the World at www.facebook.com/CanYouHearTheWorld
1 WHO (2008)2 WHO (2006)3 Unicef (2004) 4, 5 WHO (2012)
Help for children in Panama: In a project launched by the Hear the World Foundation, the Funproi foundation received a donation of hearing aids. The fitting of the hearing aids on location was accom-panied by Sonova employee Christiane Vana from Brazil on an active assignment for the Hear the World Foundation.
000_SO_MR_1314_Cover_EN.indd 6-10 19.05.2014 10:20:53

Sonova Annual Report 2013 / 14
1
Table of content11
02 Letter to shareholders
06 Strategy and brands
31 Corporate social responsibility
32 Corporate governance
46 Compensation report
62 Financial review
68 5 year key figures
70 Consolidated financial statements
116 Financial statements of Sonova Holding AG
Investor information (back cover foldout)

2
Letter to shareholders
Sonova Annual Report 2013 / 14
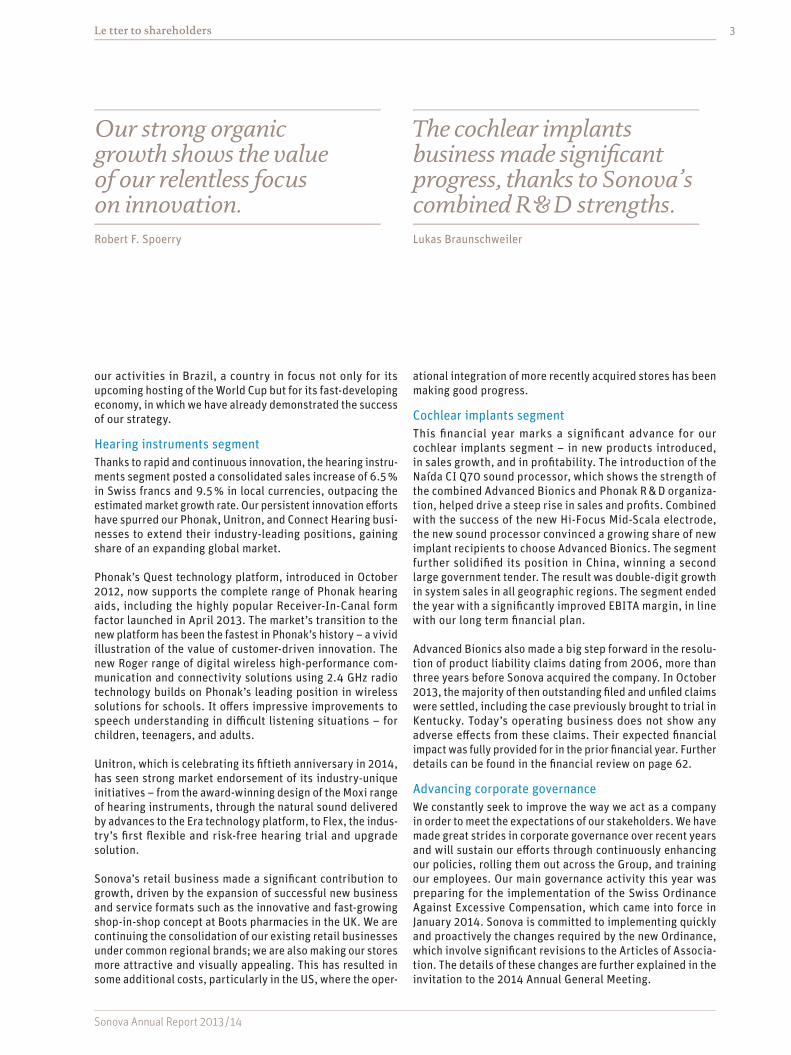
Dear shareholders,We are pleased to report that the Sonova Group has shown solid performance in the 2013 / 14 financial year. A continued high pace of innovation, demonstrated by the launch of new products and solutions across the business, drove sales and earnings growth. Our pursuit of customer-driven innovation, offering the industry’s broadest and most advanced range of hearing care solutions – supported by the skills and energy of our employees across the organization – paid off in strong results in both our business segments and all our brands.
Delivering on our strategyConsolidated sales for the Group were CHF 1,951.3 million, up 8.7 % from the previous year in Swiss francs and 11.7 % in local currencies; this sales growth was almost entirely organic. Sales in the Hearing Instruments segment rose by 9.5 % in local currencies and in the Cochlear Implants segment by 36.0 %. Gross profit was CHF 1,340.4 million, up 11.3 % on 2012 / 13 in local currencies. Operating profit before acquisi-tion-related amortization (EBITA) of CHF 430.1 million rep-resented a rise of 11.6 % in Swiss francs and 16.7 % in local currencies over the normalized result of CHF 385.3 million for the previous year.
Dividend increase proposedThe Group’s strong operating performance and free cash flow generated a sound end-of-year balance sheet and solid net cash position. This result confirms the value of continued investment in innovation and expanding markets. Mindful of this, the Board of Directors proposes to the 2014 AGM a dividend of CHF 1.90 per share. This represents a significant increase of 19 % from the distribution paid in the 2012 / 13 financial year.
Strong organic growth across all businesses and regionsSonova is synonymous with innovation; our determination to bring the delight of hearing to ever more people drives us to discover new solutions and open new markets. It is gratifying that our strong organic growth this year has been broadly spread across our businesses and regions, with an ever-increasing contribution from emerging markets. We are there-fore delighted to take the opportunity of this report to highlight
The Sonova Group’s constant pursuit of customer-driven innovation continued to bear fruit, delivering a sustained high pace of technical and marketing innovation across all brands, resulting in strong organic growth across all businesses and regions. A marked improvement in margins represents another step toward achieving our mid-term financial targets.
Lukas Braunschweiler / CEO Robert F. Spoerry / Chairman of the Board of Directors
3
Sonova Annual Report 2013 / 14
Le tter to shareholders
our activities in Brazil, a country in focus not only for its upcoming hosting of the World Cup but for its fast-developing economy, in which we have already demonstrated the success of our strategy.
Hearing instruments segmentThanks to rapid and continuous innovation, the hearing instru-ments segment posted a consolidated sales increase of 6.5 % in Swiss francs and 9.5 % in local currencies, outpacing the estimated market growth rate. Our persistent innovation efforts have spurred our Phonak, Unitron, and Connect Hearing busi-nesses to extend their industry-leading positions, gaining share of an expanding global market.
Phonak’s Quest technology platform, introduced in October 2012, now supports the complete range of Phonak hearing aids, including the highly popular Receiver-In-Canal form factor launched in April 2013. The market’s transition to the new platform has been the fastest in Phonak’s history – a vivid illustration of the value of customer-driven innovation. The new Roger range of digital wireless high-performance com-munication and connectivity solutions using 2.4 GHz radio technology builds on Phonak’s leading position in wireless solutions for schools. It offers impressive improvements to speech understanding in difficult listening situations – for children, teenagers, and adults.
Unitron, which is celebrating its fiftieth anniversary in 2014, has seen strong market endorsement of its industry-unique initiatives – from the award-winning design of the Moxi range of hearing instruments, through the natural sound delivered by advances to the Era technology platform, to Flex, the indus-try’s first flexible and risk-free hearing trial and upgrade solution.
Sonova’s retail business made a significant contribution to growth, driven by the expansion of successful new business and service formats such as the innovative and fast-growing shop-in-shop concept at Boots pharmacies in the UK. We are continuing the consolidation of our existing retail businesses under common regional brands; we are also making our stores more attractive and visually appealing. This has resulted in some additional costs, particularly in the US, where the oper-
ational integration of more recently acquired stores has been making good progress.
Cochlear implants segment This financial year marks a significant advance for our cochlear implants segment – in new products introduced, in sales growth, and in profitability. The introduction of the Naída CI Q70 sound processor, which shows the strength of the combined Advanced Bionics and Phonak R & D organiza-tion, helped drive a steep rise in sales and profits. Combined with the success of the new Hi-Focus Mid-Scala electrode, the new sound processor convinced a growing share of new implant recipients to choose Advanced Bionics. The segment further solidified its position in China, winning a second large government tender. The result was double-digit growth in system sales in all geographic regions. The segment ended the year with a significantly improved EBITA margin, in line with our long term financial plan.
Advanced Bionics also made a big step forward in the resolu-tion of product liability claims dating from 2006, more than three years before Sonova acquired the company. In October 2013, the majority of then outstanding filed and unfiled claims were settled, including the case previously brought to trial in Kentucky. Today’s operating business does not show any adverse effects from these claims. Their expected financial impact was fully provided for in the prior financial year. Further details can be found in the financial review on page 62.
Advancing corporate governanceWe constantly seek to improve the way we act as a company in order to meet the expectations of our stakeholders. We have made great strides in corporate governance over recent years and will sustain our efforts through continuously enhancing our policies, rolling them out across the Group, and training our employees. Our main governance activity this year was preparing for the implementation of the Swiss Ordinance Against Excessive Compensation, which came into force in January 2014. Sonova is committed to implementing quickly and proactively the changes required by the new Ordinance, which involve significant revisions to the Articles of Associa-tion. The details of these changes are further explained in the invitation to the 2014 Annual General Meeting.
Our strong organic growth shows the value of our relentless focus on innovation.Robert F. Spoerry
The cochlear implants business made significant progress, thanks to Sonova’s combined R & D strengths.Lukas Braunschweiler

Letter to shareholders4
Sonova Annual Report 2013 / 14
We further refined our compensation structure: as of this year, equity-based compensation for members of the Management Board will also be subject to reaching a performance criterion. This is detailed in the compensation report on page 46. Once again, there will be a consultative vote on the compensation report at the 2014 AGM; the Board of Directors intends that these votes will also be held in the future.
Changes to the Board of DirectorsUnder the new Ordinance, each member of a Board of Directors is elected annually. All current members of the Sonova Board of Directors will stand for re-election at the 2014 AGM. In addition, the Chairman of the Board of Directors and the members of the Nomination and Compensation Committee will be directly elected by the Annual General Meeting.
The Board proposes Stacy Enxing Seng to be elected as a new member at the 2014 AGM. Drawing on her impressive track record in growing start-ups and leading multinational com-panies in the medical technology sector, she will be a very important addition to the current Board of Directors.
Corporate social responsibilityContinuous innovation is as essential in Sonova’s environ-mental and social roles as it is in our business practices. In 2013 / 14 we are proud to be listed, for the first time, as a component of the STOXX® Global ESG Leaders Index, which tracks the top leading companies in terms of corporate sus-tainability. During this financial year we rolled out a global environmental management system and we are committed to continue improving our environmental performance in coming years. We report our corporate social responsibility perfor-mance in a separate CSR report, prepared to comply with the Global Reporting Initiative’s Application Level B.
The Hear the World Foundation, a Sonova Group initiative and an important pillar of our corporate social responsibility com-mitment, contributed significantly through its 21 projects world-wide, providing financial, technical, and professional support. In coming years, the integration of Advanced Bionics will extend the Foundation’s commitment to providing cochlear implants.
Our thanksFinally and most importantly, we cannot forget that our busi-ness is, above all, about people. Our strategic commitment to innovation asks our employees to achieve, and keep achieving, extraordinary things. We commend them for the imagination and dedication with which they extend the limits of the possible every day. We highly value our shareholders’ continued loyal support. And we thank our customers – all those who seek a life without limits – for inspiring and spur-ring on our innovation.
Outlook 2014 / 15The strong results in the 2013 / 14 financial year prove the effectiveness of our strategy and confirm our confidence that we can achieve our mid-term financial targets. The coming year will see Sonova continue to build on its market-leading positions, maintain a high pace of innovation, and expand in attractive markets through advanced products and solutions. We expect to sustain profitable growth in fiscal year 2014 / 15, with consolidated sales anticipated to rise by 7 % – 9 % in local currencies.
Robert SpoerryChairman of the Board of Directors
Lukas BraunschweilerCEO
5
Sonova Annual Report 2013 / 14
The SonovaGroup
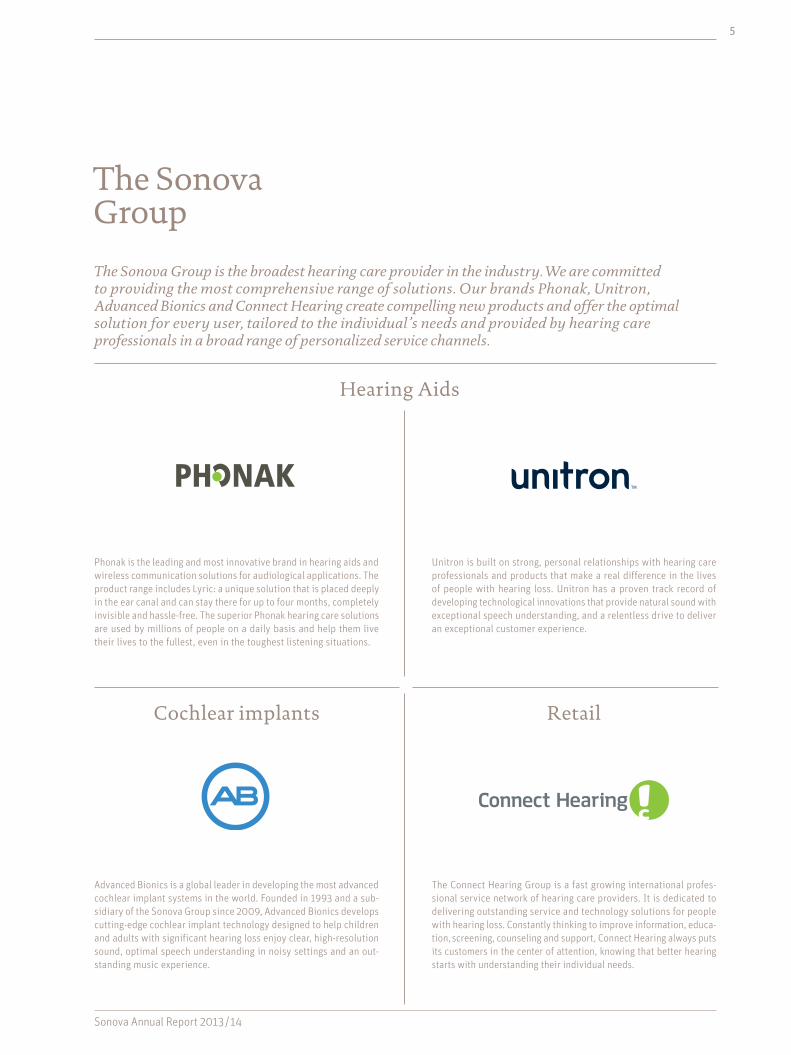
The Sonova Group is the broadest hearing care provider in the industry. We are committed to providing the most comprehensive range of solutions. Our brands Phonak, Unitron, Advanced Bionics and Connect Hearing create compelling new products and offer the optimal solution for every user, tailored to the individual’s needs and provided by hearing care professionals in a broad range of personalized service channels.
Cochlear implants Retail
Hearing Aids
Phonak is the leading and most innovative brand in hearing aids and wireless communication solutions for audiological applications. The product range includes Lyric: a unique solution that is placed deeply in the ear canal and can stay there for up to four months, completely invisible and hassle-free. The superior Phonak hearing care solutions are used by millions of people on a daily basis and help them live their lives to the fullest, even in the toughest listening situations.
Unitron is built on strong, personal relationships with hearing care professionals and products that make a real difference in the lives of people with hearing loss. Unitron has a proven track record of developing technological innovations that provide natural sound with exceptional speech understanding, and a relentless drive to deliver an exceptional customer experience.
Advanced Bionics is a global leader in developing the most advanced cochlear implant systems in the world. Founded in 1993 and a sub-sidiary of the Sonova Group since 2009, Advanced Bionics develops cutting-edge cochlear implant technology designed to help children and adults with significant hearing loss enjoy clear, high-resolution sound, optimal speech understanding in noisy settings and an out-standing music experience.
The Connect Hearing Group is a fast growing international profes-sional service network of hearing care providers. It is dedicated to delivering outstanding service and technology solutions for people with hearing loss. Constantly thinking to improve information, educa-tion, screening, counseling and support, Connect Hearing always puts its customers in the center of attention, knowing that better hearing starts with understanding their individual needs.

6
Strategy and brands
Sonova Annual Report 2013 / 14
Bringing the delight of hearing to everyone and helping them enjoy a life without limitations.
United under one roof. The flags of Sonova and its four brands wave at the Group’s headquarter in Stäfa.
At Sonova, we have a clear vision: we foster a world where every hearing loss has a solution and people can enjoy the delight of hearing. We aim to achieve this through our clear and focused strategy of customer-driven innovation. The core of this strategy is our full R & D pipeline: during the financial year 2013 /14, we introduced a high number of new products and complete solutions in both our hearing instruments and cochlear implants businesses.
Sonova’s mission is to be recognized as the innovation leader in the global hearing care market. We pursue innovation across all our activities: innovation in what we make; innova-tion in how we make it and how we sell it. We are dedicated to delivering continuous improvement: ever better hearing solutions that meet the needs of our customers ever more closely, providing tangible, valuable benefits in real-life listening situations. Our success comes down to the close and intense connection our employees have with the needs of our customers in the hearing healthcare community and with the people who benefit from our hearing solutions.
The broadest product and service offeringSonova is the most comprehensive hearing healthcare provider in the industry. We are committed to offering the broadest range of solutions – from hearing aids to cochlear implants to wireless communications solutions – to treat all major forms of hearing loss. These include the age-related hearing loss that nearly everyone experiences; childhood hearing loss, with its particular speech and language devel-opment needs; and profound hearing impairment in both adults and children, for whom cochlear implants are the ultimate way to restore the delight of hearing.
Getting the most from technologically advanced hearing solutions depends on excellent professional audiological services. Sonova values and supports hearing care profes-sionals in this vital role and also offers professional services directly in a number of key markets.
We reach our customers through our four brands – Phonak and Unitron for hearing instruments, Advanced Bionics for cochlear implants, and Connect Hearing for professional services. Keeping a balanced portfolio of profitable busi-

Strategy and brands 7
Sonova Annual Report 2013 / 14
nesses allows Sonova to generate sustainable growth by extending its existing franchise, promoting synergies between the different businesses, and investing in new business oppor-tunities.
Innovation remains the essence of what we do. Our rate of new product development remains high; more than two-thirds of our hearing aid sales, for example, are of products less than two years from launch. Maintaining this pace of innova-tion requires significant and continuing investment in R & D, with a target gross spending level of 7 – 8 % of sales.
Pillars of our competitive positionStrengthened leadership in hearing instrumentsThe estimated annual worldwide volume of hearing instruments sold stands at around 11 million. Global market growth is expected to continue through the medium term at a low- to mid-single digit rate. Sonova is the largest global manufacturer of hearing instruments through its Phonak and Unitron brands. Helped by an up-to-date product portfolio, the company further strengthened its leadership position last year.
Advancing strongly in cochlear implantsThe 2013 /14 financial year revealed, for the first time since Advanced Bionics joined the Sonova Group, the full combined R & D strength of Advanced Bionics and Phonak. The clear benefits of this partnership were proven by a strongly positive market response to the Naída CI Q70 processor, the first product jointly developed by Advanced Bionics and Phonak. It is the most advanced behind-the-ear sound processor in the world and has opened doors to clinics that had not previously been accessible to Advanced Bionics alone.
Strong position in selected retail marketsExpert, well-supported professional audiological services are a key factor in achieving the best results with hearing instruments. Our wholesale customers are also our service partners; they range from single independent audiologists to large key accounts with dozens of specialized clinics and even to whole government agencies. The vast majority of the hearing instruments produced by Phonak and Unitron con-tinue to be sold through these partner channels, but Sonova also offers professional audiological services directly through the Connect Hearing business. The current focus is on a few selected countries, including the US, Canada, Brazil, the UK, France, Belgium, Austria, Australia and New Zealand.
Exploiting avenues for growthSonova consistently pursues four avenues toward sustained growth: penetrating existing markets, expanding accessible markets, integrating service channels, and developing our consumer base.
Penetrating existing marketsWe believe that our innovation advantage gives us the ability to increase market share with our existing customers while
at the same time gaining new ones. This belief was strongly substantiated by the results of a recent survey of audiologists in 11 countries, which showed a very high customer satisfac-tion rate and a remarkable proportion of audiologists willing to recommend our products to their peers. Both our hearing instrument brands gained high ratings, but with different emphases, showing that the market understands how our two brands are differentiated. Our full pipeline of new products and solutions will help to drive growth in the future.
Expanding accessible marketsWe are expanding our accessible customer base by focusing on the great potential of emerging markets. In Brazil, we have clearly demonstrated that we can develop and run a success-ful wholesale and retail organization in such a market, and we expect growth there to continue at a brisk pace. We feature our Brazilian success in the following pages of this report, outlining our strategy and providing some examples of how Sonova has come to be a leader in this market. Our next focus is on China, where we see great potential. We continued implementing our focused China strategy this financial year and are encouraged by the results so far.
We will also continue to invest in entirely new product formats such as Lyric, the only completely invisible and extended-wear hearing instrument on the market – a product that has shown strong double-digit sales growth. Products like Lyric attract whole new customer groups who have not been interested in traditional hearing instruments. They therefore act strong as lead generators, bringing traffic to audiologists and creating new customer relationships.
Integrating service channelsWe are managing our retail business around three distinct goals: building brand equity; improving profitability; and driving growth. Combining visible and consistent branding with a disciplined rollout of best-practice operating proce-dures, we can continuously improve the efficiency of our distribution channel while at the same time running a suc-cessful, profitable business. We continue to expand our retail business, both organically and through selected acquisitions, aiming for critical size in each given market.
Develop consumer baseAs the computer-literate population ages, direct contact with healthcare consumers becomes increasingly important for a company like Sonova. Google data reveals that 80 % of internet users now look for their health information online. In developed markets, nearly half of people aged between 65 and 79 – the age range at which most people are first confronted with age-related hearing loss – use the internet. Our online portals, such as HearingPlanet in the US, give Sonova an opportunity to develop our consumer base by interacting with existing and potential customers when they first come looking for information and professional advice. In addition, we increas-ingly approach the market ourselves through direct-to- consumer advertising. This brings in new potential customers

Strategy and brands8
Sonova Annual Report 2013 / 14
whom we either direct to one of our audiologist professional partners or to one of our own retail clinics for a face-to-face consultation.
Benefiting from a global footprintWith R & D hubs in Switzerland and North America, Sonova has excellent access to the specialists whose know-how helps us to maintain our high pace of innovation. We have broadened the geographical distribution of our manufacturing sites over the past decade, not just for cost advantages, but also to maintain high product quality with low supply-chain risk. In October 2013 our plant in Suzhou, China celebrated its tenth anniversary; with a staff of around 700, it is the largest assembly plant in today’s hearing aid industry. During the 2013 /14 financial year, our US and UK regional customer service centers for repair and logistics moved into new purpose- fitted buildings with state-of-the-art work environ-ments. Both facilities have been set up to further consolidate Sonova’s activities in these markets, to the benefit of custom-ers, employees, and the company.
Refining our brand strategyA consumer looking for a hearing instrument or a hearing care professional recommending one will know the names Phonak or Unitron: both brands enjoy high awareness in their respective markets. The Advanced Bionics brand is increas-ingly synonymous with excellence in cochlear implants. Connect Hearing is our core brand in most English-speaking retail markets, supplemented by regional brands in other countries. Each of these brands is strong… but they are even stronger united within Sonova.
The Sonova Group is global and diversified, offering leading technologies worldwide through well-known business brands and close local customer relationships. But it is also a highly integrated company with strong horizontal and vertical links that make the Group much more than just the sum of its business brands. Every part of the business delivers customer-driven innovation, thanks to dedicated people who above all strive to make a real improvement in the lives of others. As a Group, we gain efficiencies and competitive advantage from the way our businesses fit closely together – and we want to carry that integration further.
Our strategy applies to all our brands. Our Group management team defines and guides the way our businesses relate to each other, both internally and externally. We promote a shared culture and a common vision across the Group. The values by which we work – innovation leadership, shared engagement, personal responsibility – are lived out every day in all our workplaces around the globe. And our outward-facing advocacy, education, and charitable engagements, like the Hear the World Foundation, are Sonova initiatives. Today, the Sonova brand clearly stands for much more than simply a listing on the Swiss stock exchange.
Step by step, we are bringing our brand architecture even more closely into line with this functional reality. A strong position for the Group brand enables us to gain the most from the collaborative initiative and expertise of all our businesses. A strong parent brand offers trust, security, stability, and permanence to our customers and our employees around the world. And a strong brand name linked with our attractive employment conditions helps us bring in and retain the best global talent in our field. The market will therefore be seeing more prominence given to the Sonova brand over coming years, providing a strong common platform from which our business brands gain market strength and collaborative efficiency, bringing the delight of hearing to ever more people.

9
Title
Sonova Annual Report 2013 / 14
9
Sonova Annual Report 2013 / 14
9
SãoPaulo
Sonova Annual Report 2013 / 14
Sonova in BrazilToday Brazil is among Sonova’s top ten markets by revenue contribution. In 2013 / 14, the country accounted for 3 – 4 % of group sales, with strong double-digit sales growth in local currencies.
Significant market potentialThe total market for hearing instruments in Brazil in 2013 /14 was approximately 330,000 units. The market still offers significant growth potential, with a penetration rate estimated at around 5 % – well below the average in developed markets.
Sonova business headquarters.
Brazil facts & figures:Area: 8.5 million km2
Population: 201 million (2013)Density: 23.8 people / km2 (2013)Growth: +10.7 % (2003 – 2013)
GDP: CHF 2,129 billionPer capita: CHF 10,650 (2013)
Growthmarket BrazilSouth America’s largest country is a growth market where Sonova has been able to establish an optimal position. A visit to the “Land of the Future”.
“Those who experience Brazil today are catching a glimpse of the future,” wrote Austrian author Stefan Zweig after a visit in 1936 – a view that remains true today. A country the size of a continent, Brazil has over 200 million inhabitants today. Its economy has expanded steadily over the past decade, and its rapidly growing middle class is highly recep-tive to new technologies: clearly a place with enormous potential for an innovative company like Sonova. In the past ten years, 30 million Brazil-ians have joined the middle class. A further 20 million people have managed to leave poverty behind. Brazil now boasts the sixth largest economy in the world.
As in many emerging countries, the Brazilian market is heterogeneous: there is certainly a demand for the latest hearing technology, but buyers separate between those willing to pay a reasonable price for it and those who wish to pay as little as possible, despite expecting a product that is custom-made to their requirements. Sonova’s multi-brand strategy ideally
positions its offering, securing access to different market segments and providing a wide range of innovative solutions to meet the varying require-ments of the Brazilian consumer.
In São Paulo, the economic hub of Brazil, the country’s fast pace of change is noticeable on every corner. New skyscrapers are shooting up, and new restaurants and cafés are opening for business all the time. Traffic is permanently gridlocked and those who have the necessary means travel instead by helicopter. The city has the world’s greatest concentra-tion of landing pads: choppers whir through the skies non-stop.
More than 20 million people live in the Greater São Paulo area. This is where everything comes together – including Sonova’s Brazilian subsid-iaries, whose headquarters are in the city. Brazil already ranks among the company’s ten highest-revenue coun-tries. Even those skeptical observers who currently forecast general stag-nation in Brazil’s economic growth agree that the hearing instruments

Growth market Brazil10
Sonova Annual Report 2013 / 14
10
market has great potential. This is because only an estimated 400,000 of Brazil’s more than 200 million people currently use a hearing aid. Coverage is especially low among the young: newborn hearing screening has only been mandatory since 2010.
“We occupy a leading position in Brazil, and there is still a lot of potential to realize,” says Marilisa Zavagli, an instantly likeable woman in her forties and Managing Director of Phonak do Brasil, Sonova’s largest Brazilian sub-sidiary. In the company conference room where she is sitting, a photo wall dis-plays Rio de Janeiro with its sugarloaf mountain, where the World Cup finals will take place this summer, followed by the Olympic Games in 2016.
Over the past few years, every aspect of Phonak’s Brazilian business has seen a very positive development, starting in 2005 when Sonova acquired a major-ity holding in CAS Produtos Médicos, the market leader in hearing aid whole-sale and retail. The takeover went smoothly and produced a resounding success. The then managing director, Pedro Stern, is still with the company today, and continues to contribute the benefits of his long experience by serving as President of Phonak do Brasil’s Advisory Board. “I’m a dinosaur in this business,” he says, laughing.
Stern has been active in hearing aids since the 1980s; he is so well-versed that his associates say he has three solutions for every problem that arises.
Phonak Brazil’s São Paulo headquarters are in a large light-filled open plan office. The Phonak hub for Latin America is located on the same floor and caters to the continent’s Spanish-speaking coun-tries. At the entrance, touchscreen ter-minals give visitors information about wireless systems, hearing aids, and Phonak’s children’s program for all of Brazil, which is also coordinated here. For Sonova, simply offering a child cutting edge technology is not enough; his or her whole environment needs to be well-informed and collaborative – including the supporting audiologist, the parents, and the teacher. Sonova also offers workshops, information material, and chat sessions on the inter-net where parents can ask questions.
Separated by a clear wall from the rest of the premises at the back of the office is the service department, where tech-nicians check and repair hearing aids. In the laboratory next door stands a 3D printer, long an indispensable tool in the manufacturing process. At the begin-ning of the new millennium, Sonova was one of the very first companies to start digitally producing shells for In-The-Ear hearing aids, followed by custom ear-
pieces for Behind-The-Ear and Receiver-In-Canal hearing aids. The elements are custom made for each individual ear canal, yet produced efficiently on a large scale. The pio-neering technology, a milestone in the modernization and digitalization of hearing-aid manufacturing, was devel-oped in close collaboration with engi-neers of ETH Zurich. The shells of an In-The-Ear hearing aid and the custom earpiece are unique components which must fit perfectly into the ear canal that is different in every wearer. The production process is fascinating: First a silicon mold of the client’s ear canal is laser scanned, and a unique indi-vidual shell is modeled on the com-puter. Finally, the finished product is printed with the 3D printer, layer by layer in light-cured acrylic resin, to the finest detail.
The long corridor next to the office space displays posters of the various Phonak products. Among these is Lyric, one of the best-selling products in Brazil. “Brazilians put great store by their appearance,” explains manag-ing director Zavagli. “They value aes-thetics highly and so prefer visually unobtrusive products.” Lyric is a hearing aid that sits very close to the eardrum and is therefore completely invisible. It is also the first hearing aid ever that can be worn without
Sonova Annual Report 2013 / 14
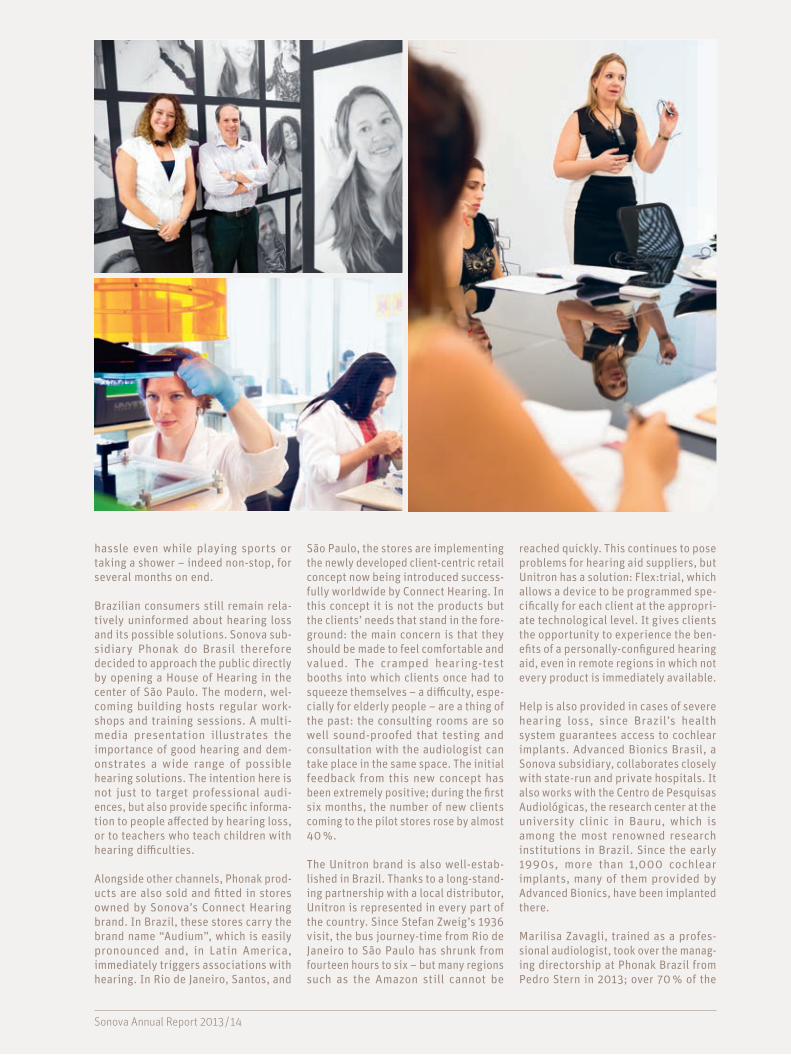
hassle even while playing sports or taking a shower – indeed non-stop, for several months on end.
Brazilian consumers still remain rela-tively uninformed about hearing loss and its possible solutions. Sonova sub-sidiary Phonak do Brasil therefore decided to approach the public directly by opening a House of Hearing in the center of São Paulo. The modern, wel-coming building hosts regular work-shops and training sessions. A multi-media presentation illustrates the importance of good hearing and dem-onstrates a wide range of possible hearing solutions. The intention here is not just to target professional audi-ences, but also provide specific informa-tion to people affected by hearing loss, or to teachers who teach children with hearing difficulties.
Alongside other channels, Phonak prod-ucts are also sold and fitted in stores owned by Sonova’s Connect Hearing brand. In Brazil, these stores carry the brand name “Audium”, which is easily pronounced and, in Latin America, immediately triggers associations with hearing. In Rio de Janeiro, Santos, and
São Paulo, the stores are implementing the newly developed client-centric retail concept now being introduced success-fully worldwide by Connect Hearing. In this concept it is not the products but the clients’ needs that stand in the fore-ground: the main concern is that they should be made to feel comfortable and valued. The cramped hearing-test booths into which clients once had to squeeze themselves – a difficulty, espe-cially for elderly people – are a thing of the past: the consulting rooms are so well sound-proofed that testing and consultation with the audiologist can take place in the same space. The initial feedback from this new concept has been extremely positive; during the first six months, the number of new clients coming to the pilot stores rose by almost 40 %.
The Unitron brand is also well-estab-lished in Brazil. Thanks to a long-stand-ing partnership with a local distributor, Unitron is represented in every part of the country. Since Stefan Zweig’s 1936 visit, the bus journey-time from Rio de Janeiro to São Paulo has shrunk from fourteen hours to six – but many regions such as the Amazon still cannot be
reached quickly. This continues to pose problems for hearing aid suppliers, but Unitron has a solution: Flex:trial, which allows a device to be programmed spe-cifically for each client at the appropri-ate technological level. It gives clients the opportunity to experience the ben-efits of a personally-configured hearing aid, even in remote regions in which not every product is immediately available.
Help is also provided in cases of severe hearing loss, since Brazil’s health system guarantees access to cochlear implants. Advanced Bionics Brasil, a Sonova subsidiary, collaborates closely with state-run and private hospitals. It also works with the Centro de Pesquisas Audiológicas, the research center at the university clinic in Bauru, which is among the most renowned research institutions in Brazil. Since the early 1990s, more than 1,000 cochlear implants, many of them provided by Advanced Bionics, have been implanted there.
Marilisa Zavagli, trained as a profes-sional audiologist, took over the manag-ing directorship at Phonak Brazil from Pedro Stern in 2013; over 70 % of the

Growth market Brazil12
Sonova Annual Report 2013 / 14
12
employees at the largest Sonova sub-sidiary in Brazil are women – many of them in executive positions. “Sonova is an innovative corporation,” explains Stern, President of the Advisory Board of Phonak do Brasil. “Many people assume that this means only techno-logical developments, but achieving our current position in the market was also due to innovations in other areas.” He is referring to his colleagues: many have been employed by the company for more than 15 or 20 years, a fact that may be due to the noticeably good working atmosphere. Small displays on each desk remind employees that all of them – including their partners – are invited for a weekend at the beach if the current business year’s targets are achieved.
“Our direct contacts are with audio-logists and physicians,” says Stern, “so we filled all our own key positions with audiologists.” This gives Sonova a lot of credibility in Brazil. Even in the mar-keting and technical departments, the employees are specialists in audiology who underwent additional training for their current positions. In Brazil, an audiology degree combines technical and medical aspects as well as speech therapy. This qualification has an excel-lent international reputation and, along with Argentina’s and Colombia’s, is considered the best of its kind in Latin America.
One major success achieved by Phonak do Brasil was introducing wireless systems in state-run schools. These systems are coupled with hearing aids or cochlear implants and help people with hearing loss to hear in a noisy envi-ronment – for example classrooms. “We first conducted a study and then showed the results to the relevant ministry,” says Pedro Stern. This initiative became the starting point for a nation-wide innovation: Sonova was assigned the pilot project in which 240 children with hearing loss participated. “The first 240 orders came as a direct contract,” Stern recalls. “No other company was in a position to carry out this project.” The study was a complete success. Today, the Brazilian state guarantees that children between the ages of five and
17 who have hearing difficulties will have the chance to follow their lessons – with the aid of a wireless system.
With selective approaches specifically adapted to the relevant brands and local market requirements, Sonova continues its success story in Brazil. Marilisa Zavagli is enthusiastic about the posi-tive role of Phonak Brazil, both in busi-ness and social terms. “Behind every figure, every hearing aid we sell, there’s a person whose quality of life has improved significantly,” she says. “That motivates me, and not just me: all our employees are proud to work for Sonova.”

At the entrance of Phonak Brazil’s São Paulo head-quarters, visitors can test wireless systems. These systems are coupled with hearing aids or cochlear implants and help people with hearing loss to hear in a noisy environment.

Strategy and brands14
Sonova Annual Report 2013 / 14
Phonak is determined to be the driving force in hearing care. We have a restless discontent with limitations and a passion to overcome them. We know that millions of people with hearing loss around the world live unnecessarily disconnected from everything and everyone that is important in life: from conversations, music, the sounds of nature, and the voices of loved ones. We fight for them every day. Through innovation leadership; through consumer insights; through consultation with our partners, the hearing care professionals all over the world; through advocacy and education – we overcome barriers and change lives, helping people with hearing loss both to hear again and to be heard. They are our motivation. They are our inspiration.
Quest – Innovation with immediate valuePhonak offers the broadest product range in the industry, supported by powerful technology platforms generated through an accelerated innovation cycle. The 2013 /14 financial year saw the fullest schedule of new product introductions ever, resulting in the most complete portfolio of solutions in Phonak’s history, all with our latest Quest technology platform at their core. The market responded to Quest’s advanced capability very positively: the speed of conversion from the previous platform was greater than for any prior platform introduction – within five months of launch more than 80 % of Phonak products sold were already based on the Quest platform.
Surveys of hearing care professionals showed a very high level of satisfaction with the Phonak range of solutions: more than nine out of ten would recommend to their peers fitting our Bolero Q Behind-The-Ear and Audéo Q Receiver-In-Canal (RIC) hearing aids. The RIC form factor has been a particularly powerful market segment: its discreet design appeals to people with mild to moderate hearing loss, traditionally the hardest to please segment of the market. The new Audéo Q range, with its uncompromised performance, builds on our established success in this area: soon after its launch we reached the milestone of two million Phonak RIC devices fitted worldwide.
By constantly challenging the limits of technology, Phonak provides ever better solutions for people with hearing loss to communicate freely and enjoy life’s rich soundscapes.
Phonak
Roger Pen – A cutting-edge wireless microphone enabling people with hearing loss to hear and understand more speech in loud noise and over distance.

Strategy and brands 15
Sonova Annual Report 2013 / 14
Roger – A bridge to better understandingThe 2013 /14 financial year saw Phonak take another major step toward overcoming limits to speech understanding in very noisy listening situations or when the speaker is at a distance from the listener – such as classrooms, meeting rooms, social clubs, or assisted living facilities – with the introduction of Roger, the new digital wireless standard. Phonak has long been the technology leader in miniaturized wireless communication systems that transmit a speaker’s voice directly to the listeners’ hearing aids. Roger significantly raises the bar for performance and ease of use. It operates on the global 2.4 GHz medical / scientific frequency band, requiring no licensing in any country. It configures itself with one click, straight out of the box. Its adaptive algorithms ensure a clear, strong signal without interference in the most challenging listening environments. It is proven to offer the industry’s best ever speech-in-noise performance, with improvements in speech understanding of up to 54 % over traditional FM, and 35 % over Dynamic FM technology1. Recent peer-reviewed research2 also shows that wireless communica-tion technologies help children with autistic spectrum disor-ders understand, communicate, and engage more in class. Roger does much more than just help people hear better: it builds a bridge to better understanding – for children, teenagers, and adults alike.
Binaural VoiceStream Technology – Mastering real-life challengesPhonak innovation stems from close analysis of real-life listening situations and the specific challenges they can pose to people using hearing aids. For example, one recently intro-duced feature that shows clear and documented benefits in daily life is “Speech in Wind.” People wearing hearing aids can experience speech being drowned out by wind noise amplified through their hearing aids’ microphones. The Speech In Wind feature is based on our unique Binaural VoiceStream Technology, which sends the full bandwidth of speech in real time between a user’s two hearing aids, bi-directionally; it allows the clearer speech signal to reach both ears. Studies3 showed that Speech in Wind significantly improves speech understanding, on average by 28 % when compared to no wind suppression. Every life has its windy moments; by apply-ing its innovation to such daily situations, Phonak helps build confidence and satisfaction with hearing aids in general.
Lyric – The “contact lens for the ear”Lyric, the only completely invisible, 24 / 7 wearable hearing instrument for active people with mild hearing loss, launched its third generation at the AudiologyNow! congress in March 2014. Thanks to its position deep in the ear canal, this “contact lens for the ear” makes it possible to enjoy better hearing with no compromises in lifestyle. Key improvements in the new generation include a new processor, low power consump-tion, and improved moisture protection. Lyric3 builds on the market success of the second generation of this unique extended-wear format, introduced two years ago. Its reduced size and improved anatomical fit rate, supported by an increased training and call center capacity, saw a strong increase in the number of customer trials and subscriptions in 2013 /14. Around 65 % of the consumers who responded to Lyric advertising had never previously had a hearing aid. This new interest has generated a steep rise in subscription revenues, contributing to market-beating growth in Phonak’s premium hearing instrument category. Lyric revenues continue to originate primarily from the US, but the number of trials in countries such as the UK, Canada, Germany and Switzerland has risen significantly in 2013.
Comprehensive solutions, not just featuresAn integral part of the Phonak brand is the “Phonak Engaging Voices” concept, launched in October 2012. It captures and makes visible the wide spectrum of daily real-life situations in which good hearing aid performance can make all the difference to someone with hearing loss: noisy urban environ-ments, busy restaurants, windy conditions. Phonak innovation gives people the ability to participate fully in all these situations and enjoy the richness and complexity of life’s soundscapes. And that is because our innovation focuses on holistic solutions, not just features; solutions that address each individual’s needs.
A Phonak hearing aid is a versatile system in itself, with a wide range of capabilities that can adapt to the needs and preferences of the user. Deep insight into real-life hearing situations is already built into each instrument’s hardware and software. Our aim throughout our portfolio of instruments, accessories, connectivity, fitting and counseling tools is to fit the best solution to the challenge at hand, through products that work together seamlessly.
One example was the launch of our comprehensive range of pediatric solutions, featuring Phonak Sky Q hearing aids, the Roger inspiro transmitter, and a special pediatric mode in the Phonak Target fitting software. The key is understanding that children are not simply small adults: their needs, both in terms of hearing amplification and of speech and language develop-ment, are specific to their age and demand equally specific solutions. Phonak’s approach is based on 40 years of experi-ence in pediatric audiology and was developed in close collabo ration with pediatric fitters worldwide.
1 Thibodeau, L. (2013)2 Rance G. et al (2013)3 Chung K. (2012)

Strategy and brands16
Sonova Annual Report 2013 / 14
HOUSE OF HEARING –UNIQUE AND INNOVATIVE
Phonak Brazil has long dealt with the basic questions: how do we promote good hearing, spread knowledge about hearing loss, and reach out to those who are affected or concerned with its treatment? How do we address cultural issues around wearing a hearing aid in Brazil? How should we demonstrate our innovative technologies to a pro-fessional audience? What’s the best way to introduce new Phonak products to support the sales network?
“Welcome to the House of Hearing!” A young woman greets us with a friendly smile: she is showing a party of female audiologists around the building on Avenida Rebouças, a busy street in the center of São Paulo. Since its inaugu-
ration in 2011, it has regularly hosted training and workshops. The House of Hearing is unique to Brazil and opens its doors to anyone with an interest in the topic: teachers seeking instruc-tion on using wireless systems, trade journalists seeking background informa-tion about new products and services. There is also a showroom on the ground floor.
Modern touchscreens provide infor-mation about hearing loss and available solutions. There are new technology demonstrations, such as the 3D printer that manufactures individually fitted shells and earpieces for hearing aids. A grand piano stands ready for concerts. In the middle of the room, Charlie presides on his stand. He is surrounded by the party of audiologists who all seem very interested in him and the hearing aid he is demonstrating on his silver-grey plastic head.
The audiologists are wearing head-phones so that they can experience what Charlie hears through his hearing aid in an everyday situation: when
the hearing aid is linked to the TV, or when Charlie receives a call on his cell phone, or when the wireless system is activated. The cinema on the first floor is called the Sound Experience Room. Sequences are simultaneously projected on three of the walls, resulting in a 3D-like effect. This is combined with sur round sound recordings: horses galloping over a field from the right to left, high-heeled shoes clattering by on the left, and ice skate blades cutting through ice. The imagery and sound effects make an impressive combina-tion: multimedia powerfully conveys the importance of good hearing.
“We are very proud of the House of Hearing,” says Marilisa Zavagli, Managing Director of Phonak Brazil, “and we are extremely pleased that the concept has been such a success. We have already hosted events here in association with international audio-logical conferences.”
Another example is the Naída Q product family, launched in April 2013, which offers powerful solutions for people with severe to profound hearing loss, especially when coupled with Phonak’s range of wireless communication systems. Our wireless accessories provide the extra boost and dedicated speech-to-ear connection that people with severe to profound hearing loss often need in challenging listening situations. The expanded portfolio includes microphones based on the new Roger technology: the Roger Pen and the Roger Clip-On Mic. In addition, the new Phonak DECT cordless telephone simultaneously transmits sound to both hearing aids, sig-nificantly increasing speech understanding.
A partner worldwide – Global service and distribution networkThe Phonak service and distribution network is strongly estab-lished. Present in over 95 countries through its direct sub-sidiaries, as well as its well-developed network of independent distributors, Phonak has an extremely broad geographic footprint.
One of our fastest growing markets, China continues to be a focus for Phonak in the coming years. Having conducted exten-sive market research to better understand China’s specific consumer and customer needs, we are now in the process of implementing our strategy for this promising market. Our primary business goal is to become a full portfolio provider for hearing care professionals who are already working with or considering Phonak as their primary supplier. We aim to offer a value proposition that differentiates us from the rest of the industry. As a first step in March 2014, we complemented our range of basic products with the introduction of the Baseo Q10 and Q5 Behind-The-Ear and Tao Q10 In-The-Ear hearing aids. Although specifically developed with China in mind, these products may also be launched in other emerging markets where conditions justify it.
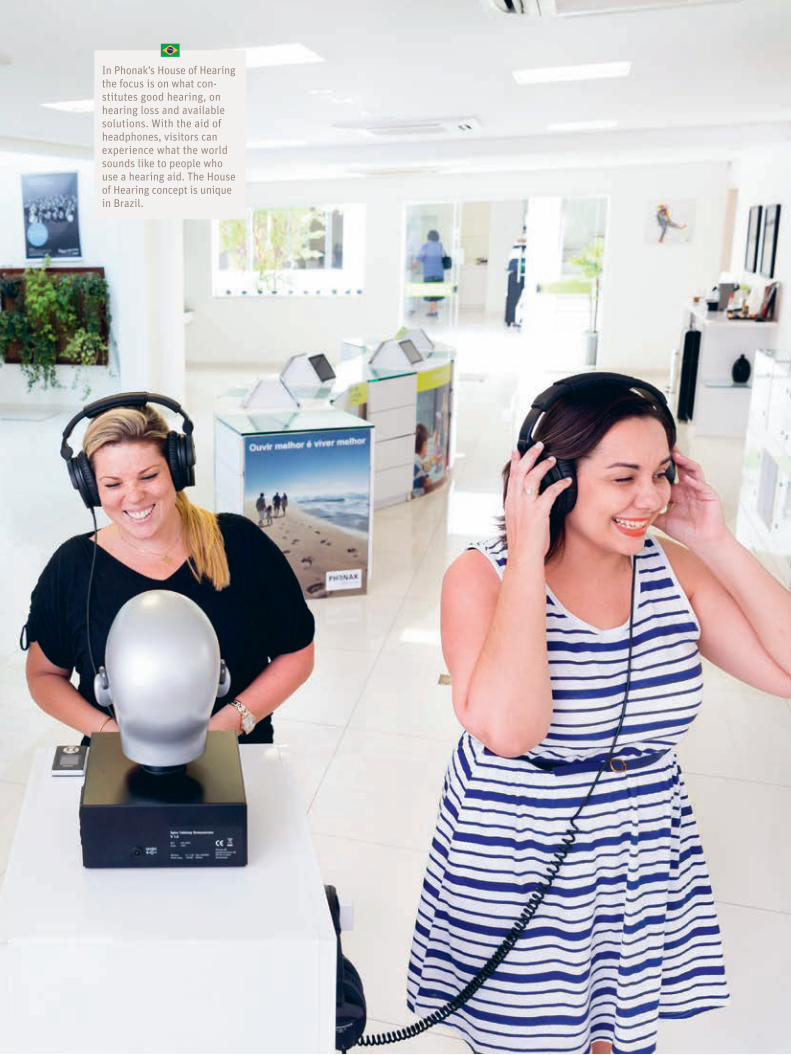
17
Sonova Annual Report 2013 / 14
In Phonak’s House of Hearing the focus is on what con-stitutes good hearing, on hearing loss and available solutions. With the aid of headphones, visitors can experience what the world sounds like to people who use a hearing aid. The House of Hearing concept is unique in Brazil.

Strategy and brands18
Sonova Annual Report 2013 / 14
Delivering an exceptional customer service is not something that is achieved once and forever; it is a journey, advancing toward a future of ever better service and ever more effective products. In 2013 /14, Unitron took several important steps on that journey.
In June 2014, Unitron will celebrate its fiftieth year in busi-ness. We have grown bigger and more sophisticated along with our global market, but the essence of our strategy has never wavered: we build strong personal relationships with our customers and we create solutions that make a real dif-ference in people’s lives.
Evolution of a designTechnology advances rapidly, societies evolve in their needs and expectations, government spending and regulations change – and the hearing healthcare industry must adapt to succeed. But true success ultimately depends on preparing thoroughly for that crucial moment when a person with hearing loss first tries on a hearing instrument. The initial questions are basic but all-important: “Does it look good?” “Does it feel good?” “Does it sound natural?” “Will it improve my life?” Only if the answer to all of these is “yes” can a hearing care professional go on to discuss advanced features.
Unitron’s product development takes these questions very seriously and we treat each individually. Our industrial design team has invested a great deal of time to create hearing instru-ments that are a pleasure to see and touch. We are therefore delighted that our Moxi Kiss hearing instrument – introduced in March 2013 as the first product of our major design evolu-tion – has received the prestigious iF product design award for 2014 and has earned a Red Dot Award: Product Design 2014. The time we spent investigating micron-level precision tooling and freeform surface modeling was recognized by leading designers as creating a tangible sense of quality, innovation, and comfort. And the market agrees: in October 2013, customers in the US, Canada, Australia, the UK, Germany, and France gave Moxi Kiss an 8.2 out of ten rating for overall satisfaction, especially in such aspects as comfort on the ear and high quality look and feel.
Unitron’s value proposition is to deliver an exceptional customer experience based on renowned personal service and products that make a real difference in people’s lives.
Unitron
Moxi Kiss – Unitron’s recently introduced hearing instrument earned two international product design awards in 2014.

Strategy and brands 19
Sonova Annual Report 2013 / 14
This year, we have extended the design language of the Moxi Kiss to our robust new Moxi² Dura Receiver-In-Canal instru-ment for active people and the Quantum² Behind-The-Ear instrument. Both have been awarded a high IP67 rating for dust and moisture resistance, allowing people to lead active lives without limitations.
Next generation products on the Era platform“Does it sound natural?” Understanding and accommodating the human response to hearing amplification is essential to gaining acceptance in those vital first minutes. Our research engineers, audiologists, and hearing care professionals will naturally concentrate on critical issues like speech intelligi-bility in noise, but the person who is trying out the instrument is seeking above all a natural, intuitive hearing experience.
So when we announce that we have launched an exciting new generation of products with features that make extended use of the powerful capabilities of our Era technology platform, our real excitement is about how this will help hearing care professionals offer a more natural hearing experience, right from the first fitting. The full range of new Moxi² and Quantum² instruments, completed in March 2014, offers SmartFocus 2 enhancements that make speech more intelligible in difficult listening situations and limit the distracting noises that can affect more than 90 % of a hearing aid wearer’s hearing expe-rience. It also offers Unitron’s unique Automatic Adaptation Manager, which has been proven1 to keep new wearers more satisfied by starting them at their preferred listening levels, then transitioning them to the amplification they need – gradually, comfortably, and automatically. We ourselves are fascinated by the technology, but we know that the people we serve are most interested in what it makes possible: an easy, comfortable listening experience.
In 2009, Unitron entered into a five-year research partnership with Canada’s National Center for Audiology at the University of Western Ontario, a preeminent center of excellence for hearing healthcare. Since then, we have conducted many important joint studies on new hearing technologies and procedures. A recent study2 focused specifically on the criti-cal question of “natural sound:” the subjective experience of using a hearing instrument. In a blind test comparing Unitron instruments with those produced by other leading brands, we were gratified to find that people responded just as we hoped they would: they marked Unitron significantly higher for a natural hearing experience and general satisfaction. Our features, taken together, provide the comfort and sound that people want.
Flex – Winning new customers“Will it improve my life?” That isn’t an easy question for people to answer immediately, sitting in the office of a hearing care professional. To find out how a hearing instrument can help make life’s familiar, beautiful, and interesting sounds accessible again takes time and the experience of wearing the instrument in a wide range of situations.
Introduced in October 2012, Unitron’s Flex solution is an industry first, allowing hearing care professionals to program a given performance profile directly into any of its hearing instruments and let potential customers take it out on trial to see how it performs in real life.
It’s such a simple idea – and so effective. Customers feel no sales pressure, so they are willing to try out the most suitable technology level. The hearing instrument has the chance to prove its worth over time. And the hearing care professional is providing a valuable service free of charge, creating a bond of trust with the customer. No surprise, then, that the market’s reaction to Flex – in Europe, North America, and Asia – has been overwhelmingly positive. Hearing care professionals report that it is much easier to make a sale and to demonstrate the suitability of more advanced features when people have had the chance to “test drive” the instrument. Flex helps not only individual practices to build their businesses, but also the mid-size and larger retail chains. And it is unique to Unitron.
To help keep it that way, we have introduced a further improve-ment to Flex, called Flex:upgrade. When someone who already uses a Unitron hearing instrument notices an increase in hearing loss, or changes lifestyle, Flex:upgrade lets the hearing care professional simply upgrade the existing hearing instru-ment to a higher technology level in the clinic, using our Truefit fitting software and charging an upgrade fee. Flex:trial helps Unitron make a real difference in the lives of first-time custom-ers; Flex:upgrade lets us keep making a difference, return visit after return visit.
Unitron has been rolling out the Flex concept in major markets during the past year and plans to introduce it soon in fast-growing new markets such as Brazil. Please see below to learn more about Unitron’s Brazilian experience.
1 Hayes D. et al (2013)2 Hayes D. et al (2014)
Strategy and brands20
Sonova Annual Report 2013 / 14
Exceptional customer experience – The Unitron Way At Unitron we say, “this business is personal.” Our employees fully commit to supporting our customers in the hearing care profession, not just through the products and solutions we offer, but through dedicated services that help them build their business and deepen their relationships with the people they serve. Customer service is not an add-on with us, it is an integral part of our identity: a structured, tested, proprietary offering that we call “The Unitron Way.”
Customers in our North American and European markets have already learned that they can rely on the extra support that the Unitron Way offers: the live voice that answers our customer service line; our extended business hours; our Saturday opening; our global in-transit warranty. In the past year, we have been rolling out these services for customers in all our markets in more than 60 countries around the world.
How do we know that our customers value these services? Because we take great care to ask them: to gain their insight and assess the effectiveness of what we do. We conduct monthly surveys, compiling global indices of performance and of customer experience that capture and track each mar-ket’s responses to the tangible and intangible elements of
the service we offer. We pay close attention to our Net Promoter Scores, which show the proportion of customers who are not only satisfied but who would recommend Unitron to fellow hearing care professionals. We have seen a significant rise in our average scores in our markets in 2013 /14 – proof that an exceptional customer experience really matters.
The rising global scores confirm country-by-country results, such as Unitron Germany’s top ranking for “overall satisfac-tion” in the annual survey of the German Association for the Hearing Instruments Industry. Unitron Germany also received high rankings for its products, sales organization, and customer care. In Ireland, Unitron was delighted to receive, for the second time, the Irish Society of Hearing Aid Audio-logists’ “Best Customer Service” award. That’s how Unitron builds sustainable growth: one close, rewarding customer relationship at a time.
FLEXIBILITY AND LONG PARNTERSHIP
Back as far as 1500, the very year Por tuguese seafarers first reached Brazil, Pero Vaz de Caminha wrote to the Portuguese king: “No matter what you plant here, it grows!” Though possibly he should have added: if you are clever about it and familiar with the region.
Distribution to point-of-sale throughout Brazil is an enormous challenge. The country is as big as a continent and its infrastructure varies widely in devel-opment from region to region. Despite this, Unitron has successfully gained a foothold in the Brazilian market, even in remoter districts. One crucial factor has been Unitron’s close collaboration with a local distributor that has been expanding its reach for over 20 years, offering a ready-made channel for the
successful introduction and develop-ment of the Unitron brand. From the outset, the objective has been to estab-lish strong relationships with opinion leaders in audiology, which has helped Unitron build an excellent reputation in the market.
As in many emerging markets, no estab-lished network of hearing aid providers exists. This offers Unitron a number of opportunities to impress the customers with its new and unique business solution called Flex:trial. As the name implies, Flex:trial allows for a device to be programmed individually and handed to clients for a trial period at home – right away and free-of-charge. This way, clients can be introduced at any time to the entire range of features and the most suitable hearing aid for their needs, even if every single product is not actually on hand. In Brazil, this is a great advantage for suppliers located in distant regions.
Flex:trial meets the requirements of many Brazilian clients: deciding on a purchase is always difficult and nobody
likes having to make a choice right away, particularly about using a hearing aid. But a free trial… why not? New clients who come in looking for information are less likely to leave the shop without a product – and without experiencing the benefits a hearing aid provides. And because Flex:trial lets a device be programmed at different technological levels, Unitron can always offer clients the solution that best suits their individual requirements.
With Flex:trial, hearing care profes-sionals and audiologists can activate the hearing aid for a test phase of up to six weeks. After that a beeping sound alerts the client that the test phase is over. The solution is also handy for those who are already Unitron clients: when their own hearing aid is being serviced, they can receive, thanks to Flex:trial, a temporary replacement programmed identically to their own hearing aid. Flex:trial is being introduced in Brazil during 2014.

21
Sonova Annual Report 2013 / 14
Unitron’s Flex:trial solution is also very attractive to Brazilian customers. A dem-onstration device can be programmed at all techno-logical levels. New clients can test the hearing aid – without having to make a purchase decision straight away.

Strategy and brands 22
Sonova Annual Report 2013 / 14
Hearing technology has advanced by great leaps in the last twenty years. With each advance comes the possibility of bringing the delight of hearing to a new group of people with hearing loss, whether through more sophisticated hardware, smarter software, or new wireless accessories and solutions. But ensuring that this advanced technology truly addresses the unique needs of each person who uses it, thereby making a real difference in their life, requires expert advice and service. This is what professional audiologists provide; this is Connect Hearing’s business.
At Connect Hearing, we offer a full spectrum of hearing tests and solutions tailored to our customers’ lifestyles and budgets. Our approach with our customers is welcoming, professional, and straightforward: we listen to our customers to identify the nature of their communication loss; we hear which envi-ronments are most important to them for communication; and we connect our customer with the best hearing aid solution for their individual lifestyle. An introductory conversation sets the stage for a comprehensive hearing test followed by a customized hearing solution, incorporating the latest in digital hearing aid technology, features, and accessories.
We know that this thorough process is vital to achieving an optimal hearing result – that is why it is central to all Connect Hearing’s retail activities. Going the extra distance to exceed customers’ expectations makes good business sense – because ours is a people business: each positive fitting experience builds further momentum through word-of-mouth.
The Connect Hearing Group’s business strategy rests on three pillars: increased market recognition through strong and consistent branding; improved profitability through systematic introduction of standard operating procedures, systems, and skills; and focused, sustainable growth in selected markets.
Through professional consulting and personalized solutions, Connect Hearing aims to offer exceptional hearing care services for people who would like to understand, hear, and connect to life again.
Connect Hearing
Our brand values are clearly reflected in a modern store design, which is currently rolled out in the US and in other countries, including Brazil.

Strategy and brands 23
Sonova Annual Report 2013 / 14
Fostering our brandThe retail hearing care business is very local: being close to the consumers is a vital factor for success. Connect Hearing has therefore taken a stepwise approach to rebranding local businesses, giving consideration to existing strong brand names in some countries (such as Laperre in Belgium) or particular language and cultural factors (as with Audium in Brazil). Throughout the Group, however, we are establishing a common look and feel, a shared store experience, and a global communication style based on our award-winning and highly successful approach: “Better Hearing Starts with a Story,” in which real customers tell their own experiences. We are also communicating across all our stores the essential values that define our brand: passion about understanding our customers’ needs, commitment to personalized service, and professional dedication to providing a comprehensive solution, not just a product.
This global approach extends to standardized in-store pro-cesses and workflows as well as digital marketing. A strong global brand makes advertising more cost-effective and allows for partnerships with wider-area government or private managed care agencies. It also makes Connect Hearing an attractive employer, drawing the best talent from a broader pool.
A typical audiologist’s practice in, for example, the US does not put much emphasis on attractive location or visual appeal. Most have the look and feel of a walk-in clinic and are situated a distance away from a town’s commercial center. At Connect Hearing, we feel that store design and location is highly impor-tant to overcoming the perceived stigma of hearing loss and creating a wholly positive customer experience. As part of the rebranding of our US retail activities, we have also started to adapt the appearance of some of our stores – since they are an essential expression of our brand’s message.
This Connect Hearing experience starts in the lobby. Fitting and counseling take place in a comfortable and spacious soundproof room. Our first pilot stores opened in California in June 2013; existing stores across the US are being progres-sively updated to the new format.
Full brand integration in the US started in 2013 and will be completed in July 2014, replacing 47 previous brands with just one. The process will also be completed this year in several European countries. Our established names in Belgium (Laperre) and Austria (Hansaton) are regional brands under the Connect Hearing umbrella, using our global communica-tion approach, brand values, and store design.
Operational excellence drives profitabilitySuccessful integration of all Connect Hearing’s businesses under one brand with uniform procedures, standards, and skills gives us many opportunities for continuous improve-ment of processes and margins. It assures a consistent, state-of-the-art fitting and counseling experience for every customer who walks into a Connect Hearing store. It extends best prac-tice efficiently across the organization by defining global standard operating procedures and performance reporting. It supports these operating procedures with a new single optimized point-of-sale system being rolled out in several key markets in 2014 /15. And it establishes the data and control tools that foster continuous improvement in efficiency.
We are also harmonizing the range of audiological equipment used in our stores worldwide. Having one global agreement specifying state-of-the-art technology and software is not only a benefit in cost-efficiency terms, reducing per-unit price for equipment and calibration services. It also ensures an optimal customer experience and helps establish Connect Hearing as the employer of choice for talented hearing care professionals, simplifying their training and letting them move easily between our stores.
Connect Hearing’s global online presence helps to give cus-tomers, who increasingly research their health issues on the internet, a good idea of the passionate, personal, and profes-sional service they can expect when they visit one of our stores. It also allows us to continuously enhance customer satisfaction through the results of online surveys – a practice already implemented by our Laperre business in Belgium.
Growing the businessHearing care is a globally underserved market; at Connect Hearing, we are committed to taking full advantage of this potential for growth in our business. Growth should be focused, sustainable, and profitable. We put our principal emphasis on organic growth, continuously improving the performance of our existing sales capacity by increasing traffic, improving sales conversion, and raising average sales profitability. This fits well with our continuous focus on oper-ational excellence. We also support new openings, starting up stores in new locations, taking advantage of shifts in the market, and benefiting from the efficiencies and stable oper-ational base provided by the Group. We pursue selected acquisitions, taking on businesses currently owned by smaller chains or independent hearing care professionals. Sonova usually already has a close partnership with these owners through its hearing instruments business. The key to a success-ful acquisition is a professional integration, so that custom-ers continue to receive optimum service.

Strategy and brands24
Sonova Annual Report 2013 / 14
Most importantly, we support sustainable growth through continued innovation: developing new concepts for counsel-ing and fitting, exploring new distribution methods (such as the shop-in-shop model), and extending successful ideas into other markets. By staying ahead of trends, Connect Hearing is best placed to capture their growth potential.
Boots Hearingcare, Sonova’s partnership with Boots, the UK’s leading pharmacy-led health and beauty retailer, has gener-ated a highly successful shop-in-shop retail concept that strongly contributed to the Connect Hearing Group’s results. The success of the business has prompted a further expansion in the number of Boots Hearingcare locations, from 391 at the end of the 2012 /13 financial year to 428 twelve months later. In the last year Boots Hearingcare has become a leading hearing care provider in the UK, with a 27 % share of the private market. Working closely with Boots, our teams are helping more customers than ever to hear better.
Another example of process and service innovation is self-screening. Connect Hearing has developed and rolled out easy-to-use self-screening stations for major markets such as the US, France, New Zealand and Italy. Designed to be easily set up in different locations – at our own point-of-sale, or in pharmacies and malls, or for local promotions – these stations serve as excellent lead generators for Connect Hearing’s business. Self-screening apps and other digital marketing tools enhance our customers’ experience and enable potential customers to access reliable information about hearing loss.
Miguel Lotito liked the store straight away: “This doesn’t look like a medical practice, this is more like a spa.” The 76-year-old has been wearing his first hearing aid on his left ear for six months now. “Good hearing is extremely important to me. I play the violin in a chamber orchestra.” The retired industrial engineer has a passion for Vivaldi, Mozart and Schubert. “Besides that,” Lotito adds with a twinkle in his eye, “I also have to be able to listen to my wife – otherwise I’m in trouble at home!”
The entrance of the store is already a surprise: a friendly receptionist, a seating area with a coffee machine and magazines, the air refreshingly cool. Then there is the consulting room: size-able, decorated in light colors with
lots of white and splashes of green. The consulting audiologist sits at a rounded desk directly next to clients instead of opposite them, conversing on equal footing. The rooms are highly soundproofed, eliminating the need for clients to squeeze into narrow hear-ing-test booths. Every step of the fitting can be carried out in the same room. In Brazil, Connect Hearing is the only vendor to offer this concept.
The customer is king here, and audio-logists receive special training in this new concept. Initially, they listen, listen, and then listen some more – when did the hearing problems start? In which situations does the client need support? Only then do they begin to specify the product that suits the client’s individual requirements. An important third step is ongoing after-sale support for the client, such as hearing workshops.
The figures prove Connect Hearing right. In the first six months, during which the new store concept was implemented in Santos and São Paulo, the number
of new clients in both stores rose by almost 40 %. And this is despite passers-by not being able to see through the windows – or perhaps that is the reason: Brazilians want to be able to hear well – but don’t feel that others should see that they need help doing so.
Miguel Lotito came to Connect Hearing based on a recommendation: an audio-logist who sings in his choir advised him to come. The musician in him is very satisfied: “I was looking for good sound quality, intensity, and pitch – and I found them.” His hearing aid has also helped restore peace at home. “I don’t like arguing, especially not with my wife,” Lotito says with a further wink of the eye.
FOCUSING ON THE CUSTOMER EXPERIENCE

Miguel Lotito chose a Connect Hearing store. He plays the violin in a chamber orchestra, and sings in a choir – being able to hear well with both ears is extremely important to him. “I felt I was in good hands straight away,” he says.

Strategy and brands26
Sonova Annual Report 2013 / 14
A cochlear implant is the only medical technology that can functionally restore one of the five senses: it allows people with significant hearing loss to hear the world around them – many for the very first time. Unlike hearing aids, which amplify sound, cochlear implants are neurostimulators: they bypass the damaged part of an ear and send electrical signals directly to the brain via the hearing nerve.
It was only three decades ago that the first cochlear implant was approved; since then, the solution has evolved from bulky body-worn processors to discreet behind-the-ear devices with vastly improved performance. The rate of adop-tion of the technology continues to rise: the number of implants worldwide last year was estimated to be around 50,000.
For more than twenty years, Advanced Bionics has played a vital role in refining this leading-edge solution that enables people with significant hearing loss to communicate freely. The company delivers on its commitment to putting patients first through continuous technology innovations and excep-tional services that together provide the best possible hearing experience, now and in the future. Choosing to have a cochlear implant is a life-changing decision; choosing an implant from Advanced Bionics lets recipients use wireless solutions in the home and classroom, talk on the phone in the most challenging situations, communicate in noisy sur-roundings, enjoy the intricacies of music, and hear in the water. No other manufacturer can offer recipients such a wide range of benefits.
Most versatile technology platformA cochlear implant system takes sound waves picked up by its microphones and intelligently converts them into detailed digital information, which is then transmitted to the implant’s electrode array in the inner ear. The electrode sends this information as electrical signals to different locations on the hearing nerve that correspond to the different frequen-cies or pitches. The hearing nerve then sends impulses to the brain, where they are interpreted as sound. How natural and intelligible the sound appears depends critically on the exact timing and location of the electrical signals sent from the electrode array to the hearing nerve.
By leading the industry in performance and innovation, Advanced Bionics demonstrates every day its commitment to putting patients first.
Advanced Bionics
The Naída CI Q70 sound processor delivers the combined R & D strengths of Advanced Bionics and Phonak.

Strategy and brands 27
Sonova Annual Report 2013 / 14
The Advanced Bionics HiRes 90K implant offers the most versatile technology platform in the industry. Its HiRes Fidelity 120 sound processing goes beyond stimulating the auditory nerve only at the particular location of each elec-trode: it steers the signal to intermediate locations between each pair of electrodes, thus creating the perception of many more frequencies, such as would be required to perceive harmonic pitch or to identify musical instruments and melodies. Such high-resolution sound more accurately mimics normal hearing, and Advanced Bionics offers five times more resolution than the competition.
The Advanced Bionics implant can also handle a broader range of sound volume, from very soft to very loud. This wide input dynamic range, coupled with more stimulation pulses per second than in competing products, results in less distortion and higher sound quality, particularly when listening to music. Studies have shown that users clearly prefer a wide input dynamic range when listening to music, irrespective of the style.1
Combining R & D strength with PhonakCochlear implant systems have come a long way in accurately representing sound and enabling people to follow conversa-tions in quiet settings – but understanding speech against a noisy background has remained a challenge because the original sound information needs to be “cleaned” of noise to emphasize the desired signal. This same challenge has long been a focus of Sonova’s hearing instrument R & D, producing a string of innovations from advanced noise-reduction algorithms to directional microphone systems and wireless technology solutions. The acquisition of Advanced Bionics by the Sonova Group in 2009 brought the R & D teams of Advanced Bionics and Phonak together; the launch of the Naída CI Q70 sound processor in 2013 introduced the market to the combined innovation power of both organizations.
The Naída CI Q70 marks the marriage of proven Advanced Bionics and Phonak technologies. The Advanced Bionics proprietary T-Mic, which places the microphone at the opening of the ear canal, along with our ClearVoice speech enhancement technology – the industry’s first and only sound processing algorithm to be given a superiority claim – now work in concert with such Phonak front-end processing fea-tures as the UltraZoom directional microphone system. When these are used together in loud real-world settings, recipi-ents experience a 70 % improvement in speech perception2.
Wireless technology benefits have long been widely acknowl-edged in the hearing instrument industry; the Naída CI Q70 sound processor marks the first time that wireless has been extensively used in the cochlear implant arena. The device allows for real-time streaming of a speech signal from one ear to the other for bilateral recipients, sending the better signal to both ears – highly useful in asymmetric settings, such as sitting in a car or talking on the phone. Also impres-sive are the benefits of Roger, the new digital standard developed by Phonak and launched for cochlear implant systems in the 2013 /14 financial year. Transmitting on the 2.4 GHz frequency and compatible with older Phonak FM systems, Roger wirelessly sends the voice of a speaker, picked up by the Roger Clip-On Mic or Roger Pen, directly to the sound processor. Studies have shown that, when using Roger, cochlear implant recipients have a significantly better speech understanding in noisy environments than even normal-hearing adults3. Moreover, wireless technology provides instant and easy connectivity to a wide range of consumer electronics: TV, phones, music players, computers, and more.
Critically, all the features of the new Naída CI Q70 sound processor can be accessed using the existing HiRes 90K implant. This allows recipients to benefit, not just from today’s technology, but from future innovations – a source of real peace of mind when choosing an implant. The extremely strong growth in sound processor upgrades seen following the launch of Naída CI Q70 is evidence of the importance of bringing such industry-leading performance innovations to existing recipients.
New products and expanded local presence open doorsFounded in 1993 in California, Advanced Bionics has a solid market position in North America and in most of Europe. Our focus on markets outside of the United States has increased substantially, particularly now that we are part of a global hearing care group. Advanced Bionics aims to get closer to its customers around the world by expanding its local presence and sales forces in key markets. During the past year, we have opened subsidiaries in New Zealand and Vietnam, strengthening our position in the Asia / Pacifc region where we have been relatively underrepresented; this effort continues. We were pleased to win a second central government tender in China and are now increasingly focus-ing on the private market in that country. This effort involves an expansion of our local clinical research activity, which includes opening a research hub in Hong Kong.
1 Wolfe J. et al (2008)2 Buechner A. (2013)3 Wolfe J. et al (2013)
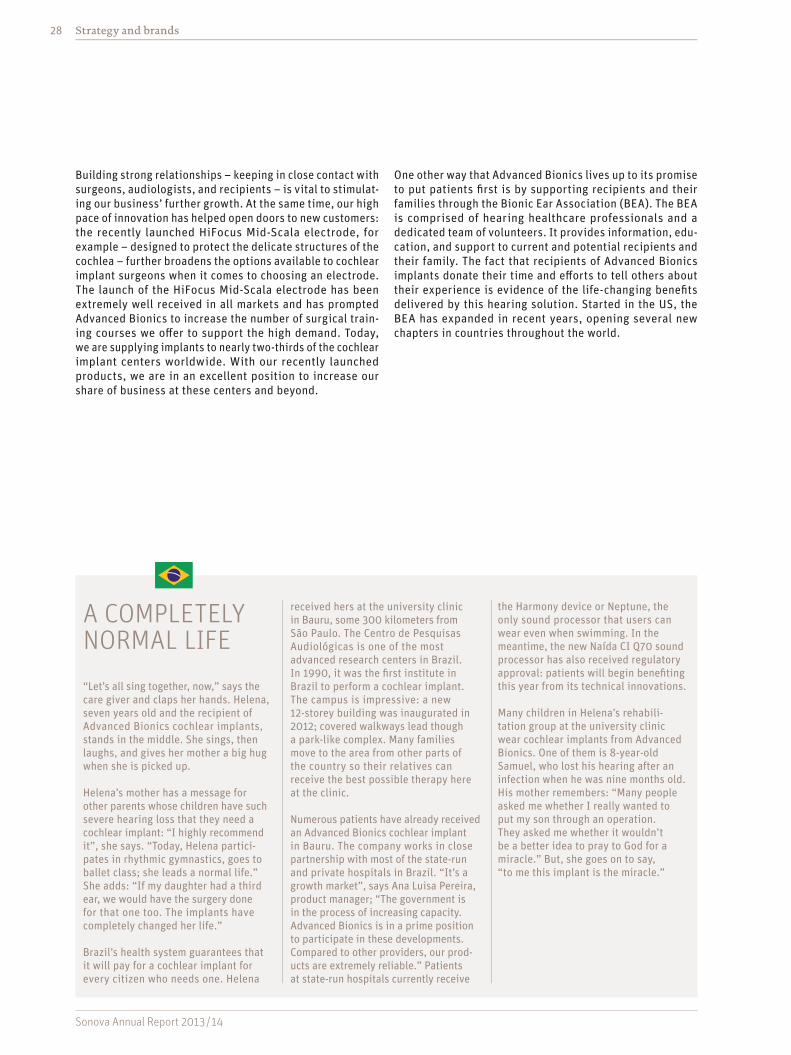
Strategy and brands28
Sonova Annual Report 2013 / 14
Building strong relationships – keeping in close contact with surgeons, audiologists, and recipients – is vital to stimulat-ing our business’ further growth. At the same time, our high pace of innovation has helped open doors to new customers: the recently launched HiFocus Mid-Scala electrode, for example – designed to protect the delicate structures of the cochlea – further broadens the options available to cochlear implant surgeons when it comes to choosing an electrode. The launch of the HiFocus Mid-Scala electrode has been extremely well received in all markets and has prompted Advanced Bionics to increase the number of surgical train-ing courses we offer to support the high demand. Today, we are supplying implants to nearly two-thirds of the cochlear implant centers worldwide. With our recently launched products, we are in an excellent position to increase our share of business at these centers and beyond.
One other way that Advanced Bionics lives up to its promise to put patients first is by supporting recipients and their families through the Bionic Ear Association (BEA). The BEA is comprised of hearing healthcare professionals and a dedicated team of volunteers. It provides information, edu-cation, and support to current and potential recipients and their family. The fact that recipients of Advanced Bionics implants donate their time and efforts to tell others about their experience is evidence of the life-changing benefits delivered by this hearing solution. Started in the US, the BEA has expanded in recent years, opening several new chapters in countries throughout the world.
A COMPLETELY NORMAL LIFE
“Let’s all sing together, now,” says the care giver and claps her hands. Helena, seven years old and the recipient of Advanced Bionics cochlear implants, stands in the middle. She sings, then laughs, and gives her mother a big hug when she is picked up.
Helena’s mother has a message for other parents whose children have such severe hearing loss that they need a cochlear implant: “I highly recommend it”, she says. “Today, Helena partici-pates in rhythmic gymnastics, goes to ballet class; she leads a normal life.” She adds: “If my daughter had a third ear, we would have the surgery done for that one too. The implants have completely changed her life.”
Brazil’s health system guarantees that it will pay for a cochlear implant for every citizen who needs one. Helena
received hers at the university clinic in Bauru, some 300 kilometers from São Paulo. The Centro de Pesquisas Audiológicas is one of the most advanced research centers in Brazil. In 1990, it was the first institute in Brazil to perform a cochlear implant. The campus is impressive: a new 12-storey building was inaugurated in 2012; covered walkways lead though a park-like complex. Many families move to the area from other parts of the country so their relatives can receive the best possible therapy here at the clinic.
Numerous patients have already re ceived an Advanced Bionics cochlear implant in Bauru. The company works in close partnership with most of the state-run and private hospitals in Brazil. “It’s a growth market”, says Ana Luisa Pereira, product manager; “The government is in the process of increasing capacity. Advanced Bionics is in a prime position to participate in these developments. Compared to other providers, our prod-ucts are extremely reliable.” Patients at state-run hospitals currently receive
the Harmony device or Neptune, the only sound processor that users can wear even when swimming. In the meantime, the new Naída CI Q70 sound processor has also received regulatory approval: patients will begin benefiting this year from its technical innovations.
Many children in Helena’s rehabili -tation group at the university clinic wear cochlear implants from Advanced Bionics. One of them is 8-year-old Samuel, who lost his hearing after an infection when he was nine months old. His mother remembers: “Many people asked me whether I really wanted to put my son through an operation. They asked me whether it wouldn’t be a better idea to pray to God for a miracle.” But, she goes on to say, “to me this implant is the miracle.”

29
Sonova Annual Report 2013 / 14
Helena, 7, has cochlear implants from Advanced Bionics. She dances ballet and goes to school – she leads an entirely normal life. Helena was treated in the university clinic in Bauru. The clinic also puts great emphasis on rehabilitation, including speech therapy and reading skills.

Little Deborah is happy because she is allowed to choose the stickers for her hearing aid. Her parents receive information both from the audiologist as well as the “Programa Infantil Phonak”. This program enables optimal care for the children and offers work-shops for parents, teachers, and audiologists.

31
Sonova Annual Report 2013 / 14
31
Corporate social responsibility
At Sonova, we turn our customers’ challenges into our own, bringing everyone the delight of hearing. We take responsibility for our actions towards our employees, the environment, and future generations.
Taking social responsibility seriouslySonova is committed to being a great place to work, where all our employees have the chance to develop to the best of their potential and be recognized for their individual perfor-mance. This is reflected in a global employee satisfaction rate above 80 % and the employee turnover rate has seen a steady and encouraging improvement.
We have further strengthened our global environmental man-agement system. Our focus this year was principally on our key manufacturing and distribution centers, and we are pleased to report that their energy consumption relative to the production volume, fell by a further 11.4 %.
Sonova’s commitment to social responsibility extends beyond its own business activities. In the 2013 / 14 financial year, the Sonova Group provided a total value in cash and in-kind benefits of CHF 1.5 million to the Hear the World Foundation.
CSR Report and inclusion in related indicesSonova has been recognized for extending the breadth and depth of its corporate social responsibility activities over the past year by being named as a component of the STOXX® Global ESG Leader Index and the ECPI® Indices. These indices represent the leading global companies in terms of environ-mental, social and governance criteria.
In the 2014 / 15 fiscal year, Sonova will start reporting in accordance with the newly-released Global Reporting Initia-tive (GRI) G4 Guidelines. We aim to continue raising our sustainability performance by maintaining ongoing dialog with our key stakeholders, by launching and implementing relevant programs, and by ensuring that our reporting activ-ities focus on material and quantifiable criteria.
Sonova reports according to the requirements of the Global Reporting Initiative (GRI) Application Level B. The full CSR Report can be downloaded at: www.sonova.com/en/csrreport.
INITIATIVE FOR CHILDREN
Igor comes into the consultation room with his mother, makes a beeline for the alphabet bingo and starts spelling words: S-A-I-A – skirt, D-E-D-O – finger. The 6-year-old hardly looks up as the audiologist starts explain to his mother: “Here, this is the battery tester; and this hearing tube lets you check whether the hearing aid is working right.” The mother nods her head, but this is still a lot of information to take in all at once. A comic-strip artist would fill the space above her head with a lot of colorful question marks.
“It's not enough simply to fit a child with a hearing aid,” says Talita Donini, a trained audiologist herself, and in charge of “Programa Infantil Phonak,” the children’s program at Phonak Brazil. “Both the child and the parents need on-going support. Teachers also need to
be provided with the necessary infor-mation and training. And of course audiologists themselves need to be informed continuously about the latest technologies and products.”
For professionals, the children’s program provides workshops and a website with downloadable resources along with a newsletter about the most recent research developments and product innovations that Phonak has developed specifically for children. The second target group consists of parents and care givers: the Phonak children’s program website with its downloadable resources is also an important resource for them, including information about hearing ability at the various developmental stages. There are also instructions for hearing aid care and maintenance with a number of descriptive drawings and a flyer about the various uses of wireless systems. “Here at headquarters we are in a constant exchange with the audio-logists,” says Donini, “so we know what kind of information is required.”
The Phonak children’s program also promotes personal dialog. Twice a month, Donini moderates internet chat sessions in which parents can ask questions and share their experiences with each other. “And the audiologists log in too,” she adds. The range of topics stretches from diagnostics through to technological innovations and tips for everyday school life.
Workshops for teachers complete the program. Since June 2013, the Brazilian state has guaranteed that all children between the ages of five and 17 can participate in lessons with the help of wireless systems. “Many teachers now want to know more about this tech-nology;” Donini says. “Naturally, we are very happy about this development: children are looked after best when both parents and care givers work as a team.”
Corporate governance32
Sonova Annual Report 2013 / 14
Good corporate governance ensures trust between the company and its stakeholders; Sonova continues to enhance its performance in this area.
During the 2013 / 14 financial year, efforts under the Sonova Group compliance program focused on further developing the compliance organization and refining the Anti-Bribery Policy and related measures. Communication, training, and monitor-ing are essential components of effective compliance: Sonova further strengthened its compliance program by establishing dedicated compliance training sessions, creating targeted information tools, and instituting quarterly compliance report-ing to the Audit Committee.
On March 3, 2013, the Swiss electorate approved the initiative against excessive compensation. The corresponding Ordinance Against Excessive Compensation at Public Corporations (OaEC) came into force on January 1, 2014 (subject to certain tran-sitional periods). All provisions of the ordinance must be fully adopted by the end of 2015. Sonova already fulfills many of the requirements of the ordinance and is striving to implement any necessary changes as early as possible. The current com-pensation report is already – on a voluntary basis – audited and fully in line with all provisions of the ordinance. Sonova has also implemented clawback provisions at the Management Board level.
At Sonova, corporate governance is based upon and structured to conform with relevant standards and practices. The company fulfills its legal duties under the Swiss Code of Obligations, the SIX Swiss Exchange Directive on Information relating to corporate governance, and the standards defined in the Swiss Code of Best Practice for Corporate Governance. The present report describes the principles of corporate governance for the Sonova Group and provides background information on the Group’s executive officers and bodies as of March 31, 2014. All the relevant documents can be accessed at the corporate governance section of the Sonova website: www.sonova.com/en/commitments/corporategovernance. For clarity and transparency, the compensation report is presented as a separate chapter of this annual report.
Group structureOperational group structure The Sonova Group is headquartered in Stäfa, Switzerland, and is active in over 90 countries. Sonova has subsidiaries in over 30 countries and a network of independent distributors serving other markets. Details of its business segments can be found in Note 6 of the consolidated financial statements.
Listed companiesSonova Holding AG is listed on the SIX Swiss Exchange. Apart from Sonova Holding AG, no other company belonging to the consolidated Sonova Group is listed on any stock exchange. Key data for the share of Sonova Holding AG as of March 31:
2014 2013 2012
Market capitalization In CHF million 8,679 7,649 6,677In % of equity 489 % 466 % 452 %Share price in CHF 129.20 113.90 100.30
Registered office 8712 Stäfa, SwitzerlandListed on SIX Swiss Exchange Security number 1254978 ISIN CH0012549785 Ticker symbol SOONPar value CHF 0.05
Non-listed companies A list of the significant companies of the Sonova Group as of March 31, 2014 can be found in the consolidated finan-cial statements in Note 35.

Corporate governance 33
Sonova Annual Report 2013 / 14
ShareholdersRegistered shareholdersAs of March 31, the shareholdings of registered shareholders were distributed as follows:
Number of sharesRegistered shareholders
31.3.2014Registered shareholders
31.3.2013
1 – 100 5,418 5,793101 – 1,000 8,305 8,6081,001 – 10,000 1,121 1,17710,001 – 100,000 157 163100,001 – 1,000,000 37 29> 1,000,000 7 7Total registered shareholders 15,045 15,777
Significant shareholders The following overview shows the registered shareholdings of significant shareholders as of March 31. Nominees are registered without voting rights. Significant shareholders may also hold non-registered shares which are reported under “Not registered”:
2014 2014 2013 2013No. of shares In % No. of shares In %
Chase Nominees Ltd. 1) 9,017,727 13.42 11,769,397 17.53Beda Diethelm 2) 6,647,259 9.90 6,647,719 9.90Hans-Ueli Rihs 2) 4,125,000 6.14 4,166,000 6.20Andy Rihs 2) 3,394,626 5.05 4,203,765 6.26Nortrust Nominees Ltd. 1) 2,314,385 3.45 2,546,454 3.79Mellon Bank Nominee 1) <3.00 2,448,306 3.65Registered share- holders with less than 3 % of shares 23,427,377 34.88 19,239,912 28.65Not registered 18,246,913 27.16 16,130,262 24.02Total shares 67,173,287 100.00 67,151,815 100.00
1) Registered without voting rights.2) The founding shareholders Andy Rihs, Beda Diethelm and Hans-Ueli Rihs were
already shareholders before the Initial Public Offering in November 1994. There are no shareholders’ agreements between these individuals.
In addition, the following shareholders of Sonova Holding AG have reported shareholdings of over 3 % or a reduction of the shareholding below 3 % in the financial year 2013 / 14:
Credit Suisse Funds AG, Kalandergasse 4, 8045 Zurich, Switzer land, controls less than 3 % of total capital and voting rights as of April 12, 2013 due to a sale of shares.
MFS Investment Management and its subsidiaries, 111 Huntington Ave, Boston, MA 02199, USA, control 10.49 % of total Sonova share capital as of April 25, 2013 due to an acquisition of shares.
The Capital Group Companies, Inc. and its subsidiaries, 333 South Hope Street, 55th Floor, Los Angeles, CA 90071-1406, USA, control less than 3 % of total capital and voting rights as of May 27, 2013 due to a sale of shares.
BlackRock, Inc., 55 East 52nd Street, New York, 10055, USA (mother company), controls less than 3 % of total capital and voting rights as of February 12, 2014 due to a sale of shares.
Cross-shareholdings Sonova Holding AG has no cross-shareholdings with other companies.

Corporate governance34
Sonova Annual Report 2013 / 14
Capital structure Share capital As of March 31, 2014, the ordinary share capital of Sonova Holding AG is CHF 3,358,664 fully paid up and divided into 67,173,287 registered shares with a par value of CHF 0.05 each.
Sonova Holding AG has neither issued any participation certificates nor profit-sharing certificates.
With the exception of the treasury shares held by the company itself, each share represents one vote at the General Share-holders’ Meeting and is entitled to dividend payments. As of March 31, 2014, the company held 10,185 treasury shares (previous year 26,714).
Authorized and conditional capital Authorized capitalSonova Holding AG has no authorized capital.
Conditional capitalThe General Shareholders’ Meeting held on July 7, 2005 approved the creation of conditional share capital of 3,301,120 registered shares with a par value of CHF 0.05 per share. The purpose of this additional conditional share capital is to improve the company’s financial flexibility. This capital may be used for exercising option and conversion rights granted in connection with bonds or similar debt instruments issued by the company for the purpose of financing the acquisition of companies, parts of companies or shareholdings.
At the General Shareholders’ Meetings in 1994 and 2000, conditional share capital of 8,000,000 registered shares with a par value of CHF 0.05 per share was created for the purpose of offering Sonova shares to key employees of the Sonova Group through an equity participation program.
Convertible bonds and optionsSonova Holding AG has not issued any convertible bonds.
The executive and employee share ownership programs of Sonova Holding AG (Executive Equity Award Plan) are described in greater detail in the compensation report (begin-ning on page 46) and in Note 31 to the consolidated financial statements (beginning on page 109).
Changes in capital As of March 31, the capital of Sonova Holding AG comprised the following:
2014 2013 2012
Ordinary capital (in CHF) 3,358,664 3,357,591 3,328,717Total shares 67,173,287 67,151,815 66,574,333Authorized capital (in CHF) n.a. n.a. n.a.Authorized shares n.a. n.a. n.a.Conditional capital (in CHF) 266,107 267,180 296,054Conditional shares 5,322,133 5,343,605 5,921,087
The authorized share capital of 3,311,520 registered shares created on June 10, 2009, has not been used and the autho-rization expired on June 9, 2011.
A total of 5,978,987 of a maximum of 8,000,000 approved conditional shares with a par value of CHF 0.05 each have been issued, so that the maximum conditional share capital reserved for long-term incentive plans was reduced by March 31, 2014, to 2,021,013 (previous year 2,042,485) shares. In the financial year 2013 / 2014, a total of 215,221 options were granted as part of the Sonova Executive Equity Award Plan (EEAP). In 2012 / 13 and 2011 / 12, the number of options granted totaled 200,967 and 305,230 respectively. As of March 31, 2014, there were still 1,277,473 options outstand-ing (compared with 1,322,808 in the previous year). Each of these options entitles the holder to purchase one regis-tered share in Sonova Holding AG with a par value of CHF 0.05.
The conditional share capital of 3,301,120 registered shares, which was created on July 7, 2005, in order to increase the company’s financial flexibility, has not yet been used.
Limitations on transferability and nominee registrationsLimitations on transferability for each share categoryTo be recognized as a shareholder with full voting rights, the acquirer of shares must submit a written application for reg-istration in the share register. The company may refuse reg-istration in the share register if applicants do not explicitly declare that they have acquired and will hold the shares in their own name and for their own account. The company may further refuse entry of the purchaser as a shareholder or usufructuary with a voting right to the extent that the shares held by him would exceed 5 % of the overall number of shares shown in the Commercial Register (Art. 8 para. 6 of the Arti-cles of Association). Linked parties are considered as one person. This registration restriction does not apply to the

Corporate governance 35
Sonova Annual Report 2013 / 14
founding shareholders. The Board of Directors may grant exceptions where there is justified cause, in which case no special quorum is required.
Exceptions granted in the year under reviewNo exceptions were granted by the Board of Directors during the reporting period.
Admissibility of nominee registrationsThe Board of Directors can issue regulations specifying the conditions under which fiduciaries / nominees are recognized as shareholders with voting rights (Art. 8 para. 5 of the Articles of Association).
Procedure and conditions for cancelling statutory privileges and limitations on transferabilityA resolution of the General Shareholders’ Meeting approved by an absolute majority of the votes represented is sufficient for cancellation.
Board of DirectorsIntroductionThe Board of Directors of Sonova Holding AG sets the overall direction and supervision of the management (see Art. 716a para. 1 of the Swiss Code of Obligations).
Having served on the Board since 1999, Heliane Canepa stepped down from her role at the 2013 Annual General Share-holders’ Meeting. During her time on the Board, she helped to build Sonova’s global leadership position.
The 2013 Annual General Shareholders’ Meeting elected Jinlong Wang as a new member of the Board of Directors. His business background is of particular importance for the Group’s ambitions in developing the potential of emerging markets like China.
The Board of Directors nominated Stacy Enxing Seng for elec-tion at the 2014 Annual General Shareholders’ Meeting. With her impressive track record in growing start-ups and leading multinational companies, particularly in the medical technology sector, she will be a valuable addition to the current Board of Directors.
Due to the introduction of a yearly re-election of the members of the Board of Directors under the revised Swiss company law, all current members of the Sonova Board of Directors will stand for re-election at the Annual General Shareholders’ Meeting of this year.
Executive management positionsNo member of the Board of Directors holds an executive management position with Sonova Holding AG or any of its subsidiaries, or has held such a position in the past three years.
Business connections of Board members with Sonova Holding AG or its subsidiariesExcept for the transactions disclosed in Note 29 to the con-solidated financial statements, there are no business connec-tions between individual Board members, including companies or organizations represented by them, and Sonova Holding AG.
Other activities and vested interestsExcept as disclosed in the biographies of the members of the Board of Directors, no member of the Board of Directors holds any position in a governing or supervisory body of any impor-tant private or public sector organization, institution, or foundation; none holds any permanent management or con-sultancy position with an important interest group, or any public or political office.
Elections and terms of officeElection procedure and limits on the terms of officeThe Articles of Association of Sonova Holding AG state that the Board of Directors must consist of a minimum of three and a maximum of nine members. So far, the members of the Board of Directors of Sonova Holding AG are elected by the General Shareholders’ Meeting for a maximum term of three years with staggered elections. A member’s term ends on the day of the General Shareholders’ Meeting for the last business year of the term. If a replacement is elected to the Board of Directors during a member’s term, the newly elected member finishes the predecessor’s term. As from 2014, the members of the Board of Directors, the Chairman, and the members of the Compensation Committee will be elected by the General Shareholders’ Meeting on an annual basis.
According to the Organizational Regulations, re-elections for successive terms are possible. Members of the Board of Direc-tors shall retire automatically at the first General Sharehold-ers’ Meeting following their seventieth birthday. In exceptional cases the Board of Directors can make an exemption. Such an exemption was made in the case of Andy Rihs, who although having reached the age of 70 will remain a member of the Board of Directors until the 2015 General Shareholders’ Meeting, subject to shareholders’ approval. He has helped to build the company from a family-owned hearing-aid business to a publicly held global leader in hearing solutions.

Corporate governance36
Sonova Annual Report 2013 / 14
First election and remaining term of officeThe following overview shows the date of first election and the term expiry date for each member of the Board of Directors.
Name Position First elected Term expires 1)
Robert F. Spoerry Chairman 2003 AGM 2014
Beat HessVice-
Chairman 2012 AGM 2014Michael Jacobi Member 2003 AGM 2014Andy Rihs Member 1985 AGM 2014Ronald van der Vis Member 2009 AGM 2014Anssi Vanjoki Member 2009 AGM 2014Jinlong Wang Member 2013 AGM 2014John J. Zei Member 2010 AGM 2014
1) Mandatory re-election due to introduction of yearly re-election of Board members under revised Swiss company law.
Robert F. Spoerry (born 1955, Swiss citizen) has been Chairman of the Board of Sonova Holding AG since March 30, 2011 and a non-executive member of the Board since 2003.
Robert F. Spoerry is also Chairman of the Board of Mettler-Toledo International Inc., a leading global manufacturer and marketer of precision instruments and related services for use in laboratory, manufacturing, and food retailing applica-tions. He joined Mettler-Toledo in 1983 and was Chief Execu-tive Officer from 1993 to 2007. He led the buyout of Mettler-Toledo from Ciba-Geigy in 1996, and the company’s subsequent Initial Public Offering on the New York Stock Exchange (NYSE) in 1997. In 1998, he was nominated Chairman of the Board.
Robert F. Spoerry graduated in mechanical engineering from the Swiss Federal Institute of Technology (ETH) in Zurich, Switzerland, and holds an MBA from the University of Chicago.
Other activities:– Vice Chairman of the Board of Geberit AG– Member of the Board of Conzzeta Holding AG
Beat Hess(born 1949, Swiss citizen) has been Vice Chairman of the Board of Sonova Holding AG since June 19, 2012.
From 1988 to 2003, he served as General Counsel of ABB Group and, from 2003 to 2011, as Group Legal Director and member of the Group Executive Committee of Royal Dutch Shell plc.
Beat Hess studied at the Universities of Geneva, Freiburg, and Miami, is an attorney-at-law and holds a Ph.D. in Law.
Other activities:– Member of the Board of Directors of Nestlé S.A.– Vice Chairman of the Board of Directors of Holcim Ltd.
Michael Jacobi(born 1953, Swiss and German citizen) has worked as an inde-pendent consultant since 2007.
From 1996 to 2007, he was CFO and member of the Executive Committee of Ciba Specialty Chemicals Inc. Prior to this, since 1978, Michael Jacobi held various management positions in the area of finance at Ciba-Geigy Group in Brazil, the US, and in Switzerland.
Michael Jacobi studied economics and business administration at the University of St. Gallen, Switzerland, at the University of Washington in Seattle, and at the Harvard Business School in Boston. He was awarded a Ph.D. from the University of St. Gallen in 1979.
Other activities: – Member of the Board of Hilti AG– Member of the Board of Actelion Pharmaceuticals Ltd.– Member of the Board of Trustees of Martin Hilti Family
Trust
Andy Rihs(born 1942, Swiss citizen) has been member of the Board of Directors of Sonova Holding AG since its foundation in 1985. He is one of the company’s founders, together with his former business partner Beda Diethelm and his brother Hans-Ueli Rihs.
In 1966 Andy Rihs joined Beda Diethelm, who had come to Phonak a year earlier as technical manager, and concentrated on the company’s marketing and commercial operations. He first established a sales organization for Switzerland and later gradually built up a global distribution network. Andy Rihs managed the Sonova Group as CEO until April 2000 and again as interim CEO from April to September 2002. Under his leader-ship, the company grew continuously and established an out-standing reputation as a provider of technologically advanced products.
He also owns several companies that are mainly active in the real estate and cycling business, and he holds interests in various high-tech start-ups.
Andy Rihs completed his education and business training primarily in Switzerland and France.
Other activities:– Vice Chairman of the Board of BMC Group Holding AG

Corporate governance 37
Sonova Annual Report 2013 / 14
From left to right: Michael Jacobi, Anssi Vanjoki, John J. Zei, Andy Rihs, Robert F. Spoerry, Beat Hess, Ronald van der Vis, Jinlong Wang
Ronald van der Vis(born 1967, Dutch citizen) was Executive Director of the Board and Group CEO of Esprit Holdings Limited, a global fashion and lifestyle company listed on the Hong Kong Stock Exchange, from 2009 until November 2012.
Prior to this, since 1998, he held various general management positions at Pearle Europe, the world’s leading optical retailer. He was CEO of the Pearle Europe group from 2004 to 2009.
Ronald van der Vis graduated from the Nyenrode Business Uni-versity in the Netherlands and received his Master’s Degree in Business Administration (with honors) from the Manchester Business School in the UK.
Other activities:– Advisor to private equity portfolio companies– Chairman of the Board of Miktom Topco
(Basic Fit International) B.V.– Chairman of the Investor Board Pharmacies
of Mediq N.V.– Member of the Board of Directors
of Douglas Holding AG– Member of the Board of Directors
of Beter Bed Holding N.V.– Member of the Board of Directors of
Macintosh Retail Group N.V.
Anssi Vanjoki(born 1956, Finnish citizen) is Professor at Lappeenranta Uni-versity of Technology and Individual Multicontributor of RKBS Oy, a technology start-up investment company. He was Executive Vice President and General Manager of Nokia until March 2011 and member of the Nokia Group Executive Board from 1998 to 2011. He is also Chairman of the Board of Amer Sports Corpo-ration, one of the world’s leading suppliers of sports equipment and owner of Salomon, Atomic, Wilson, Precor, and Suunto brands.
Anssi Vanjoki has a Master’s Degree in Business Administration from the Helsinki School of Economics and Business Adminis-tration.
Other activities:– Chairman of the Board of Amer Sports Corporation– Chairman of the Board of Vertu Holdings Ltd.– Member of the Board of Koskisen Oy– Member of the Board of Basware Corporation Oy– Angel Investor, Chairman and member of the Board of
several technology start-up companies

Corporate governance38
Sonova Annual Report 2013 / 14
Jinlong Wang(born 1957, US citizen) is currently serving as Senior Vice President of Starbucks Corporation and Chairman of Starbucks China. He previously held a number of positions at Starbucks including President of Starbucks Asia Pacific Region, Chair-man and President of Starbucks Greater China Region, Head of the Law & Corporate Affairs department and Vice President International Business Development. He started his career as a government official in the Ministry of Foreign Economic Relations and Trade in China.
Jinlong Wang graduated with a Bachelor of Arts degree in International Economics and Trade from the University of International Economics and Trade in Beijing in 1982 and received his Juris Doctor Degree at Columbia School of Law, Columbia University in 1988.
John J. Zei(born 1944, US citizen) was CEO of Knowles Electronics, the primary supplier of acoustic components for the hearing instruments industry, through the end of 2009. He retired as “Senior Advisor” from Knowles in 2010.
John J. Zei was previously President of Rexton, a hearing instrument manufacturer in the US, and later President and CEO of Siemens Hearing Instruments, Inc. He served three times as Chairman of the Hearing Industries Association (HIA). He also served as President of the HIA, Chairman of the hearing industry’s Market Development Committee, and on the Board of the Better Hearing Institute.
John J. Zei has a law degree from Loyola University, Chicago, and a Master’s Degree in Business Administration from the University of Chicago.
Other activities:– Member of the Board of Koolspan, Inc.
Internal organizational structureAllocation of tasks within the Board of DirectorsThe Board of Directors constitutes itself. Currently, it appoints the Chairman, the Vice Chairman, and the Secretary. The Secretary does not need to be a member of the Board.
In accordance with the Organizational Regulations, the Board has appointed an Audit Committee and a Nomination and Compensation Committee (see Organizational Regulations available at www.sonova.com/en/investors/organizational-regulations).
Under the new Ordinance Against Excessive Compensation at Public Corporations, the General Shareholders’ Meeting will elect the Chairman of the Board of Directors and the members of the Compensation Committee.
Tasks, and area of responsibility for Board of Directors’ committeesThe duties and authorities of the committees are defined in the Committee Charters of the Board of Directors of Sonova Holding AG. The committees usually meet before the Board of Directors meetings and report regularly to the Board on their activities and findings. The overall responsibility for duties delegated to the committees remains with the Board.
Audit CommitteeThe members of the Audit Committee are Michael Jacobi (Chair-man), Ronald van der Vis, and Anssi Vanjoki.
The duties of the Audit Committee include reviewing the performance and effectiveness of external and internal audit on behalf of the entire Board of Directors; evaluating the company’s financial control systems, financial structure, and risk management control mechanisms; and reviewing the interim and annual accounts and financial statements of the Sonova Group. The Audit Committee is also kept regularly informed on the company’s compliance program. The Audit Committee Charter is available at: www.sonova.com/en/inves-tors/committee-charters.
The Audit Committee meets as often as required and no fewer than four times per year. During the reporting period, the committee met four times.
Nomination and Compensation Committee The members of the Nomination and Compensation Committee are Robert F. Spoerry (Chairman), John. J. Zei, and Beat Hess.
The primary task of the Nomination and Compensation Com-mittee is to select suitable candidates for election to the Board of Directors, to the position of CEO, and, upon the recommen-dation of the CEO, to nominate candidates for appointment to the Management Board. The Nomination and Compensation Committee also reviews and proposes to the Board of Directors the structure and amount of compensation for the Management Board and for the Board of Directors. The Nomination and

Corporate governance 39
Sonova Annual Report 2013 / 14
Compensation Committee submits the relevant proposals and nominations for decision by the Board of Directors. The Nom-ination and Compensation Committee Charter is available at: www.sonova.com/en/investors/committee-charters.
In accordance with the new Ordinance Against Excessive Compensation at Public Corporations, the responsibilities of the Compensation Committee will be defined in the Articles of Association.
The Nomination and Compensation Committee meets as often as required and no fewer than three times per year. During the reporting period, the committee met five times.
Work methods of the Board of Directors and its committees During the reporting period, the Board of Directors held eight meetings. The table below shows the individual Board members’ attendance at Board of Directors and committee meetings as well as the average length of the meetings:
BoD 1) AC 2) NCC 3)
No. of meetings in 2013 / 14 84) 4 5Robert F. Spoerry 8 45) 5Beat Hess 8 – 5Heliane Canepa6) 4 1 –Michael Jacobi 8 4 –Andy Rihs 8 – –Anssi Vanjoki 8 4 –Ronald van der Vis 7 3 –Jinlong Wang7) 2 – –John J. Zei 8 – 5Average meeting length 8 – 10h8) 3h 3h
1) Board of Directors 5) As guest2) Audit Committee 6) Resigned at the AGM 20133) Nomination and Compensation Committee 7) First elected at the AGM 20134) Including telephone conferences 8) Excluding telephone conferences
Urgent business matters were discussed in various telephone conferences. In addition to formal meetings at which minutes were taken, the members of the Board of Directors or of the committees also met informally for other activities that required additional time. These included, for example, prep-arations for formal meetings.
The agenda for meetings of the Board of Directors and the committees is set by the respective Chairman. Any member of the Board of Directors or a committee may request a meeting or ask that an item be put on the agenda. Members of the Board of Directors and the committees are provided in advance of meetings with all relevant documents that enable them to prepare for the discussion of the items on the agenda during the meeting. The Board of Directors and its committees con-stitute a quorum if a majority of the members are present. The
Board of Directors and its committees approve resolutions by a majority of members present at the meeting. In the event of an equal number of votes, the Chairman has the casting vote.
The Board of Directors works closely with the Management Board. In general, the meetings of the Board of Directors and its committees are also attended by the CEO and the CFO and, depending on the agenda, other members of the Management Board. The Board of Directors and the committees meet in executive session after every Board / committee meeting. The Board of Directors consults external experts when necessary in connection with specific topics.
Definition of areas of responsibility The Board of Directors of Sonova Holding AG is responsible for the overall direction of the company, except in matters reserved by law to the General Shareholders’ Meeting. The Board of Directors decides on all matters that have not been reserved for or conferred upon another governing body of the company by law, by the Articles of Association, or by the company’s Organizational Regulations. The division of respon-sibility between the Board of Directors and the Management Board is set out in detail in the company’s Organizational Regulations (see: www.sonova.com/en/investors/organiza-tional-regulations).
Information and control instruments vis-à-vis the Management BoardThe Management Board reports regularly to the Board of Directors and its committees. At each Board meeting, the Management Board informs the Board of Directors of the status of current business matters and financial results as well as major business transactions; it also presents relevant strategic initiatives and updates. Each year a Board of Direc-tors meeting is reserved for presentation and discussion of the company’s strategy and long term financial plan. The Board of Directors is provided with monthly consolidated sales reports providing data on revenue, average selling prices, and units for each major product, subsidiary, and market. The Board of Directors also receives on a monthly basis the finan-cial report with the full profit and loss statement, the balance sheet, and the cash flow statement, as well as the CEO’s report on business performance, the competitive situation, updates on various initiatives, and an outlook. Telephone conferences are held as required between Board members and the CEO or CFO. Furthermore, each member of the Board of Directors may request information on all matters concerning the company.
The head of Internal Audit, Risk and Compliance reports to the Chairman of the Audit Committee. The mandates of the Internal Audit, Risk Management and Compliance functions, along with their reporting lines and scope of activities are defined in the Internal Audit, Risk & Compliance Charter approved by the Audit Committee and the Board of Directors. Internal Audit carries out compliance and operational audits and assists the business units in attaining their goals by

Corporate governance40
Sonova Annual Report 2013 / 14
providing assurance from independent evaluation of the effec-tiveness of internal control processes. Management is respon-sible for the control of business risks and for compliance with laws and regulations. The Audit Committee approves the annual work plans of Internal Audit, Risk Management, and Compliance and ensures that the relevant Group companies are adequately reviewed according to their risk scoring. The Audit Committee also reviews and discusses the reports on completed audits submitted by Internal Audit. Internal Audit together with business controlling monitor the implementa-tion by Group companies of any measures necessary to address findings from previous audits and regularly reports progress to the Audit Committee.
The Group has implemented an efficient system to identify and assess strategic, operational, financial, legal, and compli-ance risks related to the Group’s business activities. The risk management function categorizes risks by severity and prob-ability and supports the Management Board in determining the measures necessary to address or mitigate them. In accor-dance with the Audit Committee Charter, the Audit Committee reviews the company’s risk assessment prepared by risk management before it is presented to the Board of Directors. The Board of Directors approves the annual risk assessment and provides input from a strategic point of view. To con-tinuously monitor the key risks in terms of risk mitigation, risk management prepares risk status reports which are pre-sented to the Audit Committee on a quarterly basis.
Risk management also assumes responsibility for the internal control system (ICS) for financial reporting risks. The Board of Directors receives annual updates on Group companies’ compliance with the ICS guidelines.
Management BoardThe Management Board is responsible for the preparation, implementation, and monitoring of the strategic roadmap, the management of the members’ respective Group functions, and the preparation, implementation, and delivery of the annual plan and budget. The Management Board also prepares for and executes decisions made by the Board of Directors. According to the Organizational Regulations of Sonova Holding AG, which were revised in June 2011, the Management Board is chaired by the CEO and comprises at least the CFO, plus such additional members as appropriately reflect the com-pany’s structure and activities. The members of the Manage-ment Board are proposed by the CEO and are appointed by the Board of Directors on the request of the Nomination and Compen sation Committee.
Lukas Braunschweiler(born 1956, Swiss citizen) joined the Sonova Group as CEO in November 2011. Before joining the company, he was CEO of the Swiss technology group RUAG. From 2002 to 2009, as President & CEO, he headed the Dionex Corporation. The California-based company, active in the life sciences industry, was listed on the Nasdaq stock exchange. Prior to this, he worked from 1995 to 2002 in various group executive posi-tions in Switzerland and the US for the precision instruments manufacturer Mettler Toledo.
Lukas Braunschweiler received a Master of Science in analytical chemistry (1982) and was awarded a Ph.D. in physical chem-istry (1985) from the Swiss Federal Institute of Technology (ETH) in Zurich, Switzerland.
Lukas Braunschweiler is a member of the Board of Directors of the Schweiter Technology Group.
Hartwig Grevener (born 1966, German citizen) joined the Sonova Group as CFO in August 2012. Before joining the company, he was Group CFO of Jet Aviation, a business group of General Dynamics (NYSE: GD). From 2001 to 2006 Hartwig Grevener was CFO for the European operations of Gate Gourmet, one of the leading global airline catering firms. Previous professional experiences include positions at the German logistics group Hapag-Lloyd, A.T. Kearney management consultants, and BMW.
Hartwig Grevener holds a diploma in Business Administration and Mechanical Engineering from the TU University of Berlin (1991) as well as a Ph.D. in Business Administration from the University of St. Gallen (1994).
Maarten Barmentlo(born 1967, Dutch citizen) joined the Sonova Group as Group Vice President, Marketing in January 2011. Before joining the company, he served as Senior Vice President and General Manager for MRI (Magnetic Resonance Imaging) Systems at Philips Healthcare in the Netherlands. Maarten Barmentlo gained over 20 years of working experience within Philips covering a variety of functional areas and Business Units in the Netherlands and in the US. He was responsible in various global management positions for areas such as domestic appliances, personal care, oral health care, as well as for other consumer and professional healthcare categories. He started his career in Corporate Research at Philips.
Maarten Barmentlo received a Master’s Degree in physics from Utrecht University in the Netherlands and was awarded a Ph.D. in physics from Leiden University in the Netherlands.
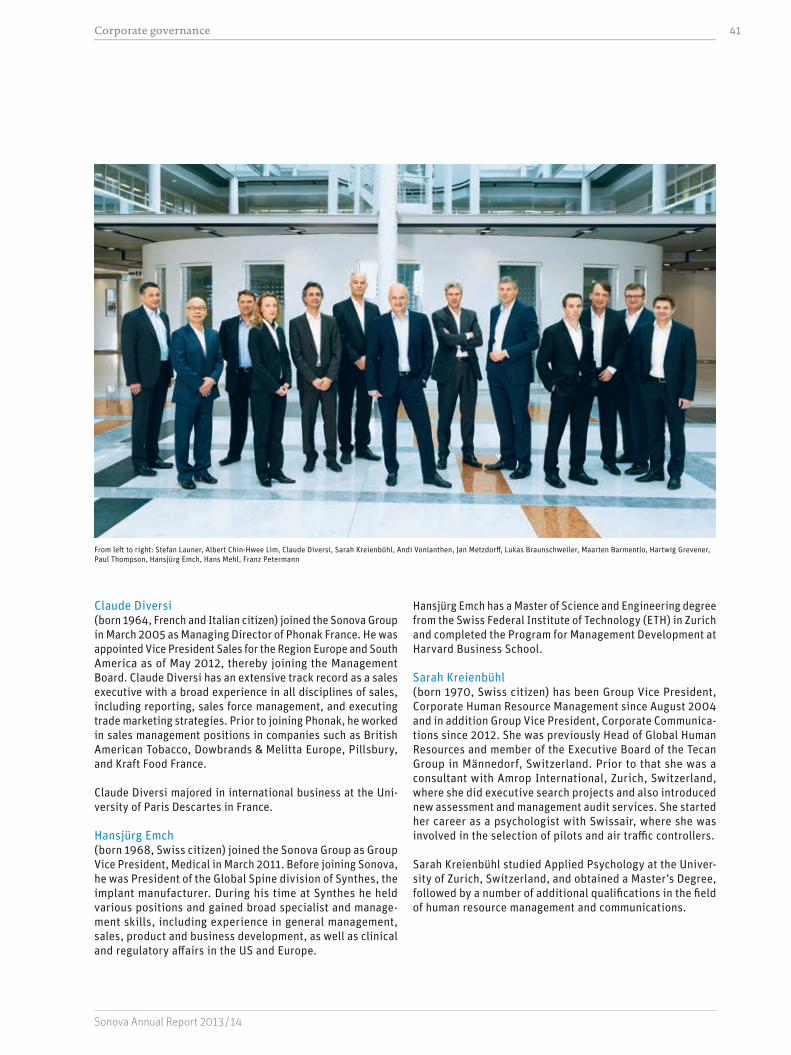
Corporate governance 41
Sonova Annual Report 2013 / 14
From left to right: Stefan Launer, Albert Chin-Hwee Lim, Claude Diversi, Sarah Kreienbühl, Andi Vonlanthen, Jan Metzdorff, Lukas Braunschweiler, Maarten Barmentlo, Hartwig Grevener, Paul Thompson, Hansjürg Emch, Hans Mehl, Franz Petermann
Claude Diversi (born 1964, French and Italian citizen) joined the Sonova Group in March 2005 as Managing Director of Phonak France. He was appointed Vice President Sales for the Region Europe and South America as of May 2012, thereby joining the Management Board. Claude Diversi has an extensive track record as a sales executive with a broad experience in all disciplines of sales, including reporting, sales force management, and executing trade marketing strategies. Prior to joining Phonak, he worked in sales management positions in companies such as British American Tobacco, Dowbrands & Melitta Europe, Pillsbury, and Kraft Food France.
Claude Diversi majored in international business at the Uni-versity of Paris Descartes in France.
Hansjürg Emch (born 1968, Swiss citizen) joined the Sonova Group as Group Vice President, Medical in March 2011. Before joining Sonova, he was President of the Global Spine division of Synthes, the implant manufacturer. During his time at Synthes he held various positions and gained broad specialist and manage-ment skills, including experience in general management, sales, product and business development, as well as clinical and regulatory affairs in the US and Europe.
Hansjürg Emch has a Master of Science and Engineering degree from the Swiss Federal Institute of Technology (ETH) in Zurich and completed the Program for Management Development at Harvard Business School.
Sarah Kreienbühl (born 1970, Swiss citizen) has been Group Vice President, Corporate Human Resource Management since August 2004 and in addition Group Vice President, Corporate Communica-tions since 2012. She was previously Head of Global Human Resources and member of the Executive Board of the Tecan Group in Männedorf, Switzerland. Prior to that she was a consultant with Amrop International, Zurich, Switzerland, where she did executive search projects and also introduced new assessment and management audit services. She started her career as a psychologist with Swissair, where she was involved in the selection of pilots and air traffic controllers.
Sarah Kreienbühl studied Applied Psychology at the Univer-sity of Zurich, Switzerland, and obtained a Master’s Degree, followed by a number of additional qualifications in the field of human resource management and communications.

Corporate governance42
Sonova Annual Report 2013 / 14
Stefan Launer (born 1966, German citizen) has been Vice President Science & Technology since April 2008 and joined the Man-agement Board in April 2013. He started his professional career at Phonak in 1995 in the Research & Development department where he held various functions, such as leading various R & D teams in the areas of clinical audiology, digital signal processing, microelectronics and acoustics. Today he is in charge of managing the basic science and technology programs in various fields of hearing health care, the develop-ment of core technologies and intellectual property rights.
Stefan Launer studied Physics at the University of Würzburg, Germany, and in 1995 was awarded a Ph.D. from the Univer-sity of Oldenburg, Germany, on modeling auditory perception in hearing impaired subjects.
Albert Chin-Hwee Lim (born 1961, Singapore citizen) joined the Sonova Group as Vice President International Sales for the Asia / Pacific region in April 2013. He joined Sonova from Medtronic where he was Vice President Business Operations, Greater China, respon-sible for six different business and operational functions. Previously, he was Managing Director at Medtronic in Taiwan. Albert Chin-Hwee Lim has a wealth of experience in driving growth in emerging markets. Previous professional experi-ences include management positions at Novartis, Merck Sharp & Dohme, and Abbott.
Albert Chin-Hwee Lim holds a Bachelor of Engineering in Chem-ical Engineering from the National University of Singapore.
Hans Mehl (born 1959, German citizen) was appointed Group Vice President, Operations in April 2007. Before joining Sonova, he held various international leadership positions within the Siemens Group in the Netherlands, Singapore, USA, and Switzerland. In his last position, Hans Mehl acted as Co-Division Head of the Fire and Security business at Siemens Building Technologies in Zug, Switzerland. Between 2000 and 2003, he was CFO of Global Health Services at Siemens Medical Group in Philadelphia, USA. Before that he was a member of the executive management of Siemens Audiology Group.
Hans Mehl completed his education in business administration in Germany.
Jan Metzdorff (born 1963, Danish citizen) joined the Sonova Group in 2004 and was Managing Director for Phonak UK from 2005 to 2010. He was appointed Vice President Unitron in October 2011 and joined the Management Board effective April 2013. Prior to that, he was Vice President of International Sales for Unitron overseeing all international sales territories outside of North America. Previously holding leadership positions as General
Manager for GN ReSound Canada and Regional Manager Asia for the Hearing Instruments Division of Philips Electronics, he has more than 15 years of experience in the hearing aid industry.
Jan Metzdorff graduated with a Bachelor of Commerce (Eco-nomics) degree from Copenhagen Business School in 1987.
Franz Petermann (born 1964, Swiss citizen) joined the Sonova Group in 2002 as Director Finance & Controlling. He was appointed Vice President Connect Hearing Group, effective April 2013. During his career at Sonova he held various positions within finance & controlling and for eight months in 2011 was interim head of the global organization for Connect Hearing Group. Before joining Sonova, he was CFO of Qualiflyer Loyalty Ltd. from 1999 to 2002, before which he held management posi-tions in different industries. In the course of his career he gained international experience working in Germany, Canada, and Hong Kong.
Franz Petermann is a graduate of University of Applied Sciences & Arts, Lucerne and received a Master’s Degree in business administration in the UK in 2002.
Paul Thompson (born 1967, Canadian citizen) has been Group Vice President, Sales for the Region North America since March 2002. He has also been Group Vice President, Corporate Development since 2005. In this position he is responsible for business develop-ment and M & A transactions. From March 2011 until July 2012, he served as interim CFO of Sonova Holding AG, having already been CFO of the Sonova Group from 2002 to 2004. From 1998 to 2001, Paul Thompson was CFO and later COO of Unitron Hearing Group. Before that he worked for Ernst & Young in Canada from 1987 to 1998 – first in auditing, and then in management consultancy.
Paul Thompson studied finance and business studies at the University of Waterloo, Canada. In 1992 he became a Chartered Accountant.
Andi Vonlanthen (born 1961, Swiss citizen) has been Group Vice President Research & Development since April 2012. He started his professional career at Phonak in 1984 in the area of product development, where he contributed significantly to a large number of technological innovations and product launches. As one of many innovations, he developed the first ever multi-microphone system for hearing instruments, which revolution-ized the entire industry. From 2002 to 2004, he was Vice President R & D at Unitron. As of 2004 he was responsible for the Group System Integration function.
Andi Vonlanthen received a degree in Electronic Engineering at the HTL Brugg Windisch, Switzerland in 1984.

Corporate governance 43
Sonova Annual Report 2013 / 14
Changes in the Management BoardEffective April 1, 2013, Albert Chin-Hwee Lim became Vice President for the Region Asia / Pacific.
Also effective April 1, 2013, Stefan Launer (Vice President Science & Technology), Jan Metzdorff (Vice President Unitron) and Franz Petermann (Vice President Connect Hearing Group) joined the Management Board. All three new members were previously working in their current role at Sonova.
Other activities and vested interestsExcept as disclosed in the biographies of the members of the Management Board, no member of the Management Board holds any position in a governing or supervisory body of any important private or public sector organization, institution, or foundation; none holds any permanent management or consulting position with an important interest group, or any public or political office.
Management contractsThe Board of Directors and the Management Board conduct business directly and have not delegated any management tasks to companies outside the Group.
Compensation and shareholdingsDetails of Board and Management compensation are contained in the compensation report (beginning on page 46) and in Note 3.6 to the financial statements of Sonova Holding AG (beginning on page 121).
Shareholders’ participation rights
Voting rights and representation restrictions Voting rights restrictionsWhen exercising voting rights, no shareholder can combine, with their own and represented shares, more than 10 % of the total number of shares as shown in the Commercial Register (Art. 14 para. 2 of the Articles of Association). Linked parties are considered as one person. This voting right restriction does not apply to founding shareholders. The Board of Direc-tors may approve other exceptions if it has good reason to do so, in which case no special quorum is required.
Statutory rules on participation in the General Shareholders’ MeetingAccording to Art. 14 para. 4 of the Articles of Association, every shareholder entered in the share register with voting rights may have his shares represented by a person with written authorization from him who does not need to be a shareholder, or by the independent proxy holder. All the shares owned by a shareholder can only be represented by one person.
Procedure and conditions for abolishing the regulation regarding voting right restrictionsA resolution of the General Shareholders’ Meeting that is approved by the absolute majority of votes represented is sufficient to abolish this regulation.
Exceptions granted in the year under reviewDuring the reporting period, no exceptions to the above-listed rules were granted.
Statutory quorumsResolutions and elections by the General Shareholders’ Meeting require the approval of an absolute majority of the share votes represented, taking voting right restrictions into account, except as otherwise provided by law or the Articles of Association.
Convocation of the General Shareholders’ MeetingThe General Shareholders’ Meeting is held within six months following the close of the financial year.
Extraordinary General Shareholders’ Meetings may be called as often as necessary, especially if required by law.
General Shareholders’ Meetings are convened by the Board of Directors and, if necessary, by the auditors. Shareholders with voting rights, who together represent at least 10 % of the share capital, may request that the Board of Directors convene an Extraordinary General Shareholders’ Meeting, provided that they do so in writing and set forth the reason for the meeting.
Inclusion of items on the agendaShareholders with voting rights who represent at least 1 % of the share capital may request that an item be put on the agenda for discussion by indicating the proposal or motion. Such requests must be addressed in writing to the Chairman of the Board of Directors no later than 60 days before the meeting.
Registration in the share registerFor administrative reasons, the share register is closed approximately one week prior to the date of the General Share-holders’ Meeting (the exact date is communicated in the invi-tation to the General Shareholders’ Meeting). Admission cards and voting forms are sent to shareholders during this period. The shares can be traded at any time and are not blocked.

Corporate governance44
Sonova Annual Report 2013 / 14
Changes of control and defense measures
Duty to make an offer The Articles of Association of Sonova Holding AG do not contain provisions for opting out or opting up. The result is that an investor who directly, indirectly, or in concert with third parties acquires shares in the company and, together with the shares he already possesses, thereby exceeds the 33 1 / 3 percent threshold of voting rights in the company is required to submit an offer for all shares outstanding, accord-ing to Swiss stock exchange law.
Clauses on changes of control In case of a change of control and a related termination of employment, unvested equity instruments granted under the EEAP would vest on a pro-rata basis only. There are no other agreements in place that would lead to additional severance payments (e.g. “golden parachutes”) or other compensation to members of the Board of Directors or the Management Board in the event of a change of control (details of Board and Man-agement compensation are contained in the compensation report beginning on page 46 and in Note 3.6 of the financial statements of Sonova Holding AG beginning on page 121).
Securities trading policyThe Board of Directors has issued a policy on deterring cor-porate insiders from making use of confidential information. The Securities Trading Policy was implemented in 2011 / 12, including a training program for employees, and revised in 2013. The policy provides for blocking periods to prevent insiders from trading in securities of Sonova Holding AG during sensitive time periods. The general blocking periods start one month prior to the end of any half-year or full year reporting period and end two full trading days following the respective release of the results. Special blocking periods are implemented when necessary or appropriate. The imple-mentation of blocking periods is within the responsibility of the CFO, who coordinates with the CEO. In addition to block-ing periods, the guidelines also provide for pre-trading clear-ance for members of the Board of Directors, the Management Board, and for selected employees.
AuditorsDuration of the mandate and term of office of the lead auditor At the General Shareholders’ Meeting on July 5, 2001, Price-waterhouseCoopers AG was elected auditor for Sonova Holding AG and the Sonova Group. At the General Shareholders’ Meeting on June 18, 2013, PricewaterhouseCoopers AG was re-elected for another one-year term. Patrick Balkanyi served as lead auditor from November 6, 2006 until June 18, 2013, when Sandra Boehm took over his position.
FeesPricewaterhouseCoopers charged the following fees during the reporting years 2013 / 14 and 2012 / 13:
1,000 CHF 2013 / 14 2012 / 13
Audit services 1,254 1,273Audit-related services 33 54Tax services 244 187Non-audit services 195 436Total 1,726 1,950
Audit services are defined as the standard audit work per-formed each year in order to issue an audit opinion on the parent company and consolidated financial statements of the Sonova Group as well as opinions on the local statutory finan-cial accounts or statements. Also included is extra work within the audit that can only be provided by the Sonova Group auditor, such as auditing of non-recurring transactions or the implementation of new accounting policies as well as consents and comfort letters in relation to regulatory filings.
Audit-related services consist of support to the audit such as providing advice on new accounting rules; this could be pro-vided by sources other than the auditor who signs the audit report.
Tax services consist of services in connection with compliance with tax laws.
Non-audit related services in the financial year 2013 / 14 mainly consisted of consulting fees in connection with IT projects, the employee shareholding program and acquisition due diligence.
The values of audit, audit-related, tax, and non-audit services are in line with ratios suggested by commonly applied good practice standards that relate to the independence of auditors. A formal policy issued by the Audit Committee is in place that regulates all non-audit assignments of the auditors.

Corporate governance 45
Sonova Annual Report 2013 / 14
Informational instruments pertaining to the external auditThe external auditors report their findings semi-annually directly to the Audit Committee of the Board of Directors. In 2013 / 14, the external auditors attended 2 out of 4 Audit Committee meetings. The Audit Committee of the Board of Directors reviews the performance, compensation, and inde-pendence of the external auditors on a regular basis. The Audit Committee reports its findings to the Board of Directors quarterly.
Information policy The Sonova Group pursues an open and active information policy. A governing principle of this policy is to treat all stake-holders alike and to inform them at the same time. It is our aim to inform our shareholders, employees, and business partners in the most direct, open, and transparent way pos-sible about our strategy, our global activities, and the current state of the company.
All publications are made available to all shareholders, the media, and the stock exchange at the same time. All share-holders entered in the share register automatically receive the shareholders’ letter, an invitation to the General Share-holders’ Meeting and, on request, a copy of the Annual Report of Sonova Holding AG. Sonova uses a news service that deliv-ers press releases to interested stakeholders.
The website of the Sonova Group www.sonova.com contains information on the company results and the financial calendar as well as current investor presentations. The Investor Rela-tions function includes presentations of annual and interim results, roadshow presentations, and presentations on the latest product launches held at industry conventions.
More information tools, permanent sources of information, and contact addresses are shown on the back cover foldout of this Annual Report.
46
Compensation report
Sonova Annual Report 2013 / 14
Sonova is all about people. The value and success of our company strongly depend on our employees. We therefore aim to attract the best talent available in a highly competitive global employment market. As custodians of shareholders’ equity, we uphold our responsibility to keep a transparent and sustainable approach to compensation.
IntroductionThis compensation report describes the compensation system in place at Sonova, including its key elements and general principles, the bodies responsible for the design, the approval framework, and the implementation. The report provides detailed information on the compensation paid to the Board of Directors (BoD) and the Management Board (MB) in the financial year 2013 / 14 and 2012 / 13. This report complies with the requirements of item 5 of the Annex to the Directive on Information relating to Corporate Governance (Directive Corporate Gover nance, DCG) published by the SIX Swiss Exchange on October 29, 2008. It also includes all information required by Articles 663bbis and 663c paragraph 3 of the Swiss Code of Obligations. Information is also provided in Note 3.6 of the financial statements of Sonova Holding AG, beginning on page 121.
Over the past three years, we have put significant revisions in place to help assure an attractive, effective, and sustainable compensation system. In the 2013 / 14 fiscal year we focused our efforts on the following areas:
– Compliance with the new Swiss Ordinance Against Excessive Compensation at Public Corporations, and alignment of all compensation-related rules and regulations for the coming year;
– Implementing clawback provisions in the contracts for the CEO and other members of the Management Board;
– Introducing a performance criterion in the 2014 Executive Equity Award Plan (EEAP) for members of the Management Board.
We will continue to review and update our compensation system to align it with evolving regulations, standards, and best practices, while at the same time striving for a system that creates value for all our stakeholders – our customers, employees, and shareholders.

Compensation report 47
Sonova Annual Report 2013 / 14
REQUIREMENT BY ORDINANCE DOCUMENT STATUS
Approval of compensation– Say-on-pay mechanisms
AoA Subject to 2014 AGM approval, applicable as of 2015 AGM:– BoD: Approval of budget for period until subsequent AGM– MB: Approval of budget for the following financial year– In case of MB member changes: additional reserve of 30 % of
MB compensation budget
Continue with consultative vote on previous financial year
Clawback – In case compensation was
paid prior to / without AGM approval
Employment contracts
Clawback provision in process of being implemented
Notice periods – The Management Board
members must not have notice periods in excess of 12 months
AoA Employment contracts
Compliant – CEO: 12 month notice period – Other MB members: 6 month notice period
Prohibited compensation – BoD and MB members must
not receive advance payments, severance payments or incentive payments in connec-tion with sale and purchase of businesses
AoA Compliant– No advance payments – No severance payments – No incentive payments for sales and purchase of businesses – Change of control: No increase in fair value of equity instruments,
pro-rata vesting and forfeiture of instruments, if applicable
No loans – The AoA must contain a
specific provision for loans provided to the BoD and MB
AoA Compliant – Loans to BoD and MB members explicitly prohibited
Separate compensation report examined by statutory auditor
Annual Report
Compliant
The new Swiss Ordinance Against Excessive Compensation at Public Corporations (the “ordinance”)At the 2014 Annual General Shareholders’ Meeting, the Board of Directors will propose a number of changes to the Articles of Association (AoA) to comply with the compensation related say-on-pay provisions of the ordinance. Various company regulations and the employment agreements for the Management Board are also being amended. In summary, the proposed changes are:
Clawback provisionsIn addition to the clawback provisions required under the ordinance, Sonova is introducing a clawback provision into the employment contracts of the Management Board members; it provides for a repayment of variable cash compensation in case of accounting restate-ments. This clawback applies to accounting restatements of the previous three financial years.
Performance criterion for the EEAP of the Management BoardTo further increase alignment between company performance and pay, we have added a performance criterion to the 2014 Executive Equity Award Plan for the members of the Management Board. Henceforward, the vesting of options and restricted share units (RSUs) in a given year is subject to reaching a pre-defined minimum return on capital employed (ROCE) target. If the ROCE target is not met in a given fiscal year, the corresponding vested EEAP amount will be reduced accordingly. The ROCE target is aligned with the company’s financial planning and is significantly higher than its cost of capital.

Compensation report48
Sonova Annual Report 2013 / 14
LEVEL OF AUTHORITY AS PER MARCH 2014 CEO NCC BOARD
BoD’s remuneration and form / amount of longterm incentive scheme Proposes Approves
CEO’s remuneration (including variable cash payment and long-term incentive) and employment terms
Proposes Approves
MB’s general remuneration scheme Proposes Approves
Remuneration of Management Board members reporting directly to the CEO (including incentives such as the form and amount of long-term incentives and variable cash payments)
Proposes Approves
Annual total amount of long-term incentives Proposes Approves
Compensation governance and approval frameworkThe following descriptions refer to the conditions present in the 2013 / 14 financial year, which will partly change as a consequence of the requirements under the ordinance described previously.
The members of the Nomination and Compensation Committee (NCC) are appointed by the Board of Directors. In the year under review, the members were Robert F. Spoerry ( Chairman), John J. Zei, and Beat Hess. The Board of Directors approves the general remuneration scheme for the Board of Directors and Management Board, based on proposals presented by the NCC, which are generally prepared in close cooperation with the Group Vice President Corporate Human Resource Management and Corporate Communications. The Board of Directors approves the remuneration and the form and amount of equity to be granted to the Board of Directors. It is also the responsibility of the Board of Directors to approve the remuneration and employment terms of the CEO – including the variable cash payment and the long-term incentive – as proposed by the NCC. The Board of Directors also approves the variable cash payment to the CEO according to the employment terms, also based on the NCC’s proposal. It is the responsibility of the NCC to approve, upon recommendation of the CEO, the remuneration, including incentives (such as the form and amount of long-term incentives and variable cash payments) of the Management Board members. Further-more, the Board of Directors approves the annual total amount of long-term incentives granted under the EEAP, based on the NCC’s proposal.
Depending on the agenda, the NCC meetings may also be attended by the CEO and Group Vice President Corporate Human Resource Management and Corporate Communications. Every NCC meeting includes an in camera session. After each NCC meeting, the Board of Directors receives a summary of the topics discussed, decisions taken, and recommendations made. The NCC meets at least three times a year. It met five times in the year under review.
All employees, including Management Board members, are subject to an annual formal performance review process. This process is based on various guiding principles designed to align individual, team, and corporate strategic goals and financial targets; to provide performance-driven incentives; and to promote personal development.
The compensation structures at Sonova link individual performance to the financial success of the company. The annual employee performance review affects both the fixed base salary and the variable cash compensation. The fixed base salary is determined by the individual’s function and performance as well as industry benchmarks.
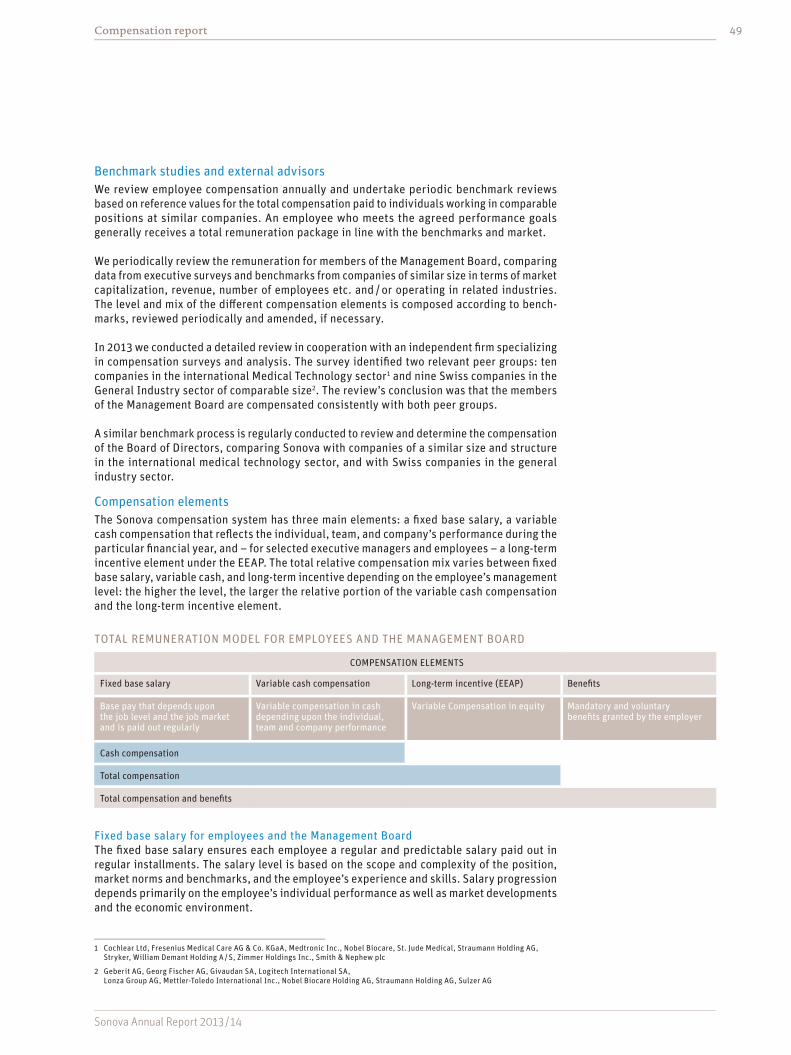
Compensation report 49
Sonova Annual Report 2013 / 14
TOTAL REMUNERATION MODEL FOR EMPLOYEES AND THE MANAGEMENT BOARD
COMPENSATION ELEMENTS
Fixed base salary Variable cash compensation Long-term incentive (EEAP) Benefits
Base pay that depends upon the job level and the job market and is paid out regularly
Variable compensation in cash depending upon the individual, team and company performance
Variable Compensation in equity Mandatory and voluntary benefits granted by the employer
Cash compensation
Total compensation
Total compensation and benefits
1 Cochlear Ltd, Fresenius Medical Care AG & Co. KGaA, Medtronic Inc., Nobel Biocare, St. Jude Medical, Straumann Holding AG, Stryker, William Demant Holding A / S, Zimmer Holdings Inc., Smith & Nephew plc
2 Geberit AG, Georg Fischer AG, Givaudan SA, Logitech International SA, Lonza Group AG, Mettler-Toledo International Inc., Nobel Biocare Holding AG, Straumann Holding AG, Sulzer AG
Benchmark studies and external advisorsWe review employee compensation annually and undertake periodic benchmark reviews based on reference values for the total compensation paid to individuals working in comparable positions at similar companies. An employee who meets the agreed performance goals generally receives a total remuneration package in line with the benchmarks and market.
We periodically review the remuneration for members of the Management Board, comparing data from executive surveys and benchmarks from companies of similar size in terms of market capitalization, revenue, number of employees etc. and / or operating in related industries. The level and mix of the different compensation elements is composed according to bench-marks, reviewed periodically and amended, if necessary.
In 2013 we conducted a detailed review in cooperation with an independent firm specializing in compensation surveys and analysis. The survey identified two relevant peer groups: ten companies in the international Medical Technology sector1 and nine Swiss companies in the General Industry sector of comparable size2. The review’s conclusion was that the members of the Management Board are compensated consistently with both peer groups.
A similar benchmark process is regularly conducted to review and determine the compensation of the Board of Directors, comparing Sonova with companies of a similar size and structure in the international medical technology sector, and with Swiss companies in the general industry sector.
Compensation elementsThe Sonova compensation system has three main elements: a fixed base salary, a variable cash compensation that reflects the individual, team, and company’s performance during the particular financial year, and – for selected executive managers and employees – a long-term incentive element under the EEAP. The total relative compensation mix varies between fixed base salary, variable cash, and long-term incentive depending on the employee’s management level: the higher the level, the larger the relative portion of the variable cash compensation and the long-term incentive element.
Fixed base salary for employees and the Management BoardThe fixed base salary ensures each employee a regular and predictable salary paid out in regular installments. The salary level is based on the scope and complexity of the position, market norms and benchmarks, and the employee’s experience and skills. Salary progression depends primarily on the employee’s individual performance as well as market developments and the economic environment.

Compensation report50
Sonova Annual Report 2013 / 14
VARIABLE CASH COMPENSATION CEO OTHER MEMBERS OF THE MANAGEMENT BOARD
Variable cash compensationfinancial year 2013 / 14 in % of fixed base salary
Target 62.5 % 50 %
Range 0 – 125 % 0 – 100 %
Variable cash compensation for employees and the Management BoardThe variable salary is an integral element of an employee’s cash compensation, paid as a lump sum after the end of a given fiscal year. The performance goals that must be met to achieve the variable cash compensation are mutually defined and agreed with the employee at the beginning of the financial year. The weight allocated between the fixed base and variable cash compensation varies by job profile and management level. The target variable cash compensation is typically around 10 % of the fixed base salary for employees, and ranges from 10 % to 43 % for higher and middle management.
For the year under review, members of the Management Board had a target variable cash compensation averaging at 50 % of the fixed base salary; for the CEO it was 62.5 %. The variable cash compensation for the Management Board is based on three performance target categories: Group, business unit, and individual level. As with all other employees, if less than a certain threshold of a given performance target is achieved, no variable cash compensation is paid out on that specific target. If the performance meets the given target, 100 % of the related variable cash compensation is paid out. If performance exceeds a given target, the related variable cash compensation may go above 100 % but is capped at a maximum of 200 % of the targeted amount.
Group performance targets are linked to its budget; the specific metrics are sales, EBITA, free cash flow, and earnings per share (EPS). Business unit performance targets are sales, EBITA, average sales price (ASP), and operating expenses of the respective business unit. Group and business unit performance targets together are weighted at between 60 % and 80 % of the total. The three to five individual performance targets for each member of the Management Board are weighted between 20 % and 40 % of the total.
Long-term incentive (Executive Equity Award Plan – EEAP)The EEAP is a long-term equity-based incentive plan offered annually to members of the Board of Directors and the Management Board, as well as to other management levels of the Sonova Group. Generally the grant date is on February 1st each year. The grants are made in the form of options, restricted share units (RSUs), and restricted shares. Around 5 % of employees are participating in the 2014 EEAP. In 2014, management EEAP participants received either 50 % of the grant value in options and 50 % in RSUs (for higher levels of management other than the CEO), or 100 % of the grant value in RSUs (middle management). The options and RSUs granted to management EEAP participants under the plan are split into four equal installments that vest annually, starting on June 1st of the year following the grant year. The exercise price of the options is the closing price for the Sonova share on the Swiss stock exchange (SIX Swiss Exchange) on the grant date. As of 2012, the term of the options granted was extended from five to seven years to promote extended option holding periods. The fair value of the options is calculated on the grant date using an option pricing model. Additional information is available in Note 31 to the consolidated financial statements. The re-pricing of any out-of-the-money options granted under the EEAP is not permitted.
The EEAP granted to the Board of Directors in 2014 is entirely in restricted shares. The restricted shares granted to the Chairman are subject to a restriction period until June 1, 2019 and the restricted shares granted to the other members of the Board of Directors are subject to a restriction period until June 1, 2018.

Compensation report 51
Sonova Annual Report 2013 / 14
EEAP FAIR VALUE CEO OTHER MEMBERS OF THE MANAGEMENT BOARD
EEAP 2014 fair value at grant in % of fixed base salary
106.2 % 105.7 %
EEAP 2014 MANAGEMENT BOARD BOARD OF DIRECTORS
Equity Options RSUs Restricted shares
Grant date February 1, 2014 February 1, 2014 February 1, 2014
Exercise / Strike price CHF 124.60 Sonova share closing price at SIX on February 1, 2014
n. a. n.a.
Vesting date 25 % vest on June 1, 2015 25 % vest on June 1, 2016 25 % vest on June 1, 2017 25 % vest on June 1, 2018
25 % vest on June 1, 2015 25 % vest on June 1, 2016 25 % vest on June 1, 2017 25 % vest on June 1, 2018
n.a.
Restriction period n.a n.a 100 % until June 1, 2019 (Chairman)100 % until June 1, 2018 (other BoDs)
Performance criterion Number of units which vest may be reduced based on the achievement of the ROCE target
Number of units which vest may be reduced based on the achievement of the ROCE target
n.a.
Exercise period After vesting until expiry of the options
n. a. n.a.
Maturity Total 7 years Not limited Not limited
Expiry January 31, 2021 n. a. n.a.
The CEO received an equity compensation mix of 62.5 % in options and 37.5 % in RSUs and the other members of the Management Board members received 50 % in options and 50 % in RSUs. Under the 2014 EEAP (as mentioned above), the future vesting of options and RSUs granted to the CEO and other members of the Management Board in a given year is subject to reaching a pre-defined minimum ROCE target. If the ROCE target is not met in a given fiscal year, the corresponding vested EEAP amount will be reduced accordingly; the number of units that vest ranges from 0 to 100 %.
The fair value of the 2014 EEAP grant to the CEO was 106.2 % of his fixed base salary and the fair value of the 2014 EEAP grant to the other members of the Management Board averaged 105.7 % of their fixed based salary.
EEAP for US participants In compliance with relevant United States federal and state laws, the Sonova EEAP grants share appreciation rights (SARs) rather than options to eligible employees in the United States. SARs grant the right to participate in appreciation in the value of Sonova shares without issuance of shares. Any SARs granted are subject to the same grant dates, vesting conditions and maturity as the options granted to non-US participants.
Sonova share ownership guidelinesTo further align the interests of the Board of Directors and Management Board with those of our shareholders, the Sonova share ownership guidelines require members of both boards to hold a specified number of Sonova shares in order to be eligible to participate in the EEAP. Members of the Board of Directors must hold at least 2,000 Sonova shares. The CEO must

Compensation report52
Sonova Annual Report 2013 / 14
hold 8,000; the Group Vice Presidents (GVPs) 3,000; and the Vice Presidents (VPs) of the Management Board 1,500 Sonova shares each. These holdings must be achieved within three years; the NCC monitors progress toward the totals on an annual basis.
Board of Directors compensationThe members of the Board of Directors receive a cash retainer, a committee fee (if applicable), and a meeting attendance fee. There is no variable salary compensation. Members of the Board of Directors receive a long-term compensation through their participation in the EEAP. As in the previous year, the EEAP grants comprise 100 % restricted shares. These shares are subject to a restriction period from February 1, 2014 to June 1, 2019 (Chairman) or from February 1, 2014 to June 1, 2018 (all other members of the Board of Directors).
The following table shows the compensation for the individual members of the Board of Directors for the 2013 / 14 financial year and for 2012 / 13.
The total compensation in the year under review was CHF 3.1 million and CHF 2.8 million in the previous year. Fixed fees as well as the value of restricted shares granted to each member of the Board of Directors remained the same as last year. The increase is caused by the grant of restricted shares to one member less in the previous year and additional employer’s social insurance contributions on EEAP transactions.
Aside from these payments, no other payments were made to current and former members of the Board of Directors or persons closely linked to them in this reporting period.
in CHF 2013 / 14
Fixed fee Attendance fee / expenses1)
Employer’s social insurance
contribution2)
Total cash compensation
Value of restricted
shares3)
Total compensation
Robert F. Spoerry, Chairman 500,000 2,500 126,725 629,225 291,192 920,417
Beat Hess, Vice-Chairman 122,500 9,500 19,199 151,199 154,332 305,531
Michael Jacobi, Member 125,000 9,000 98,977 232,977 154,332 387,309
Andy Rihs, Member 100,000 7,000 93,713 200,713 154,332 355,045
Anssi Vanjoki, Member 107,500 9,000 19,934 136,434 154,332 290,766
Ronald van der Vis, Member 107,500 7,000 19,840 134,340 154,332 288,672
Jinlong Wang, Member4) 78,630 3,500 15,092 97,222 154,332 251,554
John J. Zei, Member 107,500 9,500 17,525 134,525 154,332 288,857
Total (active members) 1,248,630 57,000 411,005 1,716,635 1,371,516 3,088,151
Heliane Canepa, Member5) 23,267 4,000 8,341 35,608 35,608
Total (including former members) 1,271,897 61,000 419,346 1,752,243 1,371,516 3,123,759
The compensation shown in the table above is gross and based on the accrual principle.1) Attendance fees and expenses are based on the number of attended meetings of each member of the Board of Directors (no attendance fees for the Chairman).2) Including social security contributions on the tax value of RSUs vested, options / WARs / SARs exercised
and restricted shares granted during the reporting period.3) Tax value per restricted share at grant date: for the Chairman of the Board of Directors CHF 90.71, for the other members of the Board of Directors CHF 96.16.4) New member of the Board of Directors since June 2013.5) Heliane Canepa resigned from the Board of Directors at the annual shareholders meeting from June 18, 2013.

Compensation report 53
Sonova Annual Report 2013 / 14
in CHF 2012 / 13
Fixed fee Attendance fee / expenses1)
Employer’s social insurance
contribution2)
Total cash compensation
Value of restricted
shares3)
Total compensation
Robert F. Spoerry, Chairman 500,000 2,500 56,129 558,629 291,300 849,929
Beat Hess, Vice-Chairman4) 105,986 7,000 17,215 130,201 154,375 284,576
Heliane Canepa, Member5) 107,500 10,000 42,201 159,701 159,701
Michael Jacobi, Member 125,000 10,000 25,917 160,917 154,375 315,292
Andy Rihs, Member 100,000 8,500 27,336 135,836 154,375 290,211
Anssi Vanjoki, Member 107,500 10,500 18,197 136,197 154,375 290,572
Ronald van der Vis, Member 100,000 8,500 17,454 125,954 154,375 280,329
John J. Zei, Member 107,500 11,000 15,914 134,414 154,375 288,789
Total (active members) 1,253,486 68,000 220,363 1,541,849 1,217,550 2,759,399
William D. Dearstyne, former member6) 28,493 3,000 43,531 75,024 75,024
Total (including former members) 1,281,979 71,000 263,894 1,616,873 1,217,550 2,834,423
The compensation shown in the table above is gross and based on the accrual principle.1) Attendance fees and expenses are based on the number of attended meetings of each member of the Board of Directors (no attendance fees for the Chairman).2) Including social security contributions on the tax value of options / WARs / SARs exercised and restricted shares granted during the reporting period.3) Tax value per restricted share at grant date: for the Chairman of the Board of Directors CHF 79.46, for the other members of the Board of Directors CHF 84.22.4) New member of the Board of Directors since June 2012.5) Heliane Canepa will resign from the Board of Directors at the annual shareholders meeting from June 18, 2013 and therefore did not participate in the EEAP 2013.6) William D. Dearstyne resigned from the Board of Directors at the annual shareholders meeting from June 19, 2012.
Management Board compensationThe members of the Management Board receive a fixed and variable salary, fringe benefits, employer’s pension and social insurance contributions, and a long term incentive in options and RSUs. Starting with the 2014 EEAP, the future vesting in a given year is subject to reaching a pre-defined minimum ROCE target.
The highest total remuneration for a Management Board member in the year under review was paid to the CEO, Lukas Braunschweiler. His fixed base salary was CHF 800,000 and the target variable cash compensation was CHF 500,000 (62.5 % of the fixed base salary). His effective variable cash payout for performance in the year under review was CHF 672,040 (84.0 % of the fixed base salary), whereas the maximum potential variable cash payout would have been CHF 1,000,000 (125 % of the fixed base salary). In addition, an equity grant (EEAP) with a 2014 fair value of CHF 849,975, fringe benefits of CHF 24,496, employer’s pension contributions of CHF 126,764 and employer’s social insurance contribution of CHF 101,722 are all reflected in Lukas Braunschweiler’s total remuneration of CHF 2,574,997 (CHF2,464,512 in 2012 / 13 financial year). The increase compared to the previous year is caused by the slight increase in EEAP grant value and a slightly higher variable cash compensation due to performance achievement. The fixed base salary remained the same as last year.
The following table shows the compensation for the CEO (highest compensation) and the other members of the Management Board for the 2013 / 14 financial year and for 2012 / 13. Payments to twelve other members of the Management Board are covered in the table for the 2013 / 14 financial year. The cumulated effective variable cash payout in % of the cumulated fixed base salary of the other members of the Management Board was 71.1 %. Payments to ten other members of the Management Board are covered in the table for the 2012 / 13 financial year, of whom two left the Management Board during that year.

Compensation report54
Sonova Annual Report 2013 / 14
The 26 % increase in total compensation from CHF 12.0 million for the 2012 / 13 financial year to CHF 15.1 million for 2013 / 14 is mostly caused by the higher average number of members of the Management Board (9.7 members in the 2012 / 13 financial year and 13 members in 2013 / 14) and a slightly higher variable cash compensation due to performance achievement.
in CHF 2013 / 14
Fixed salary
Variable salary1)
Fringe benefits
Employer’s pension
contribu-tion
Employer’s social
insurance contribu-
tion2)
Total cash compen-
sation
Value of RSUs3)
Value of options4)
Total compensation
Lukas Braunschweiler, CEO 800,000 672,040 24,496 126,764 101,722 1,725,022 318,728 531,247 2,574,997
Other members of the MB5) 3,971,335 2,821,704 247,650 672,182 642,898 8,355,769 2,099,216 2,099,842 12,554,827
Total 4,771,335 3,493,744 272,146 798,946 744,620 10,080,791 2,417,944 2,631,089 15,129,824
The compensation shown in the table above is gross and based on the accrual principle.1) The variable salary will be paid out after the end of the reporting year.2) Including social security contributions on the tax value of RSUs vested and options / warrants exercised during the reporting period.3) Fair value per RSU at grant date CHF 117.96.4) Fair value per option at grant date CHF 24.46.5) Albert Chin-Hwee Lim, VP Region Asia Pacific, Stefan Launer, VP Science & Technology, Jan Metzdorff, VP Unitron,
and Franz Petermann, VP Channel Solutions joined the Management Board as of April 2013.
in CHF 2012 / 13
Fixed salary
Variable salary1)
Fringe benefits
Employer’s pension
contribu-tion
Employer’s social
insurance contribu-
tion2)
Total cash compen-
sation
Value of RSUs3)
Value of options4)
Total compensation
Lukas Braunschweiler, CEO 800,000 645,918 20,147 125,951 72,663 1,664,679 299,953 499,880 2,464,512
Other members of the MB5) 2,839,851 1,923,318 153,968 491,625 427,931 5,836,693 1,506,941 1,507,016 8,850,650
Total (active members) 3,639,851 2,569,236 174,115 617,576 500,594 7,501,372 1,806,894 2,006,896 11,315,162
Former members of the MB6) 362,077 159,008 21,796 74,533 102,114 719,528 719,528
Total (including former members) 4,001,928 2,728,244 195,911 692,109 602,708 8,220,900 1,806,894 2,006,896 12,034,690
The compensation shown in the table above is gross and based on the accrual principle.1) The variable salary will be paid out after the end of the reporting year.2) Including social security contributions on the tax value of options / warrants exercised during the reporting period.3) Fair value per RSU at grant date CHF 103.97.4) Fair value per option at grant date CHF 24.19.5) Andi Vonlanthen, GVP Research & Development, joined the Management Board as of April 2012; Claude Diversi, VP International Sales,
joined the Management Board as of May 2012; Hartwig Grevener, CFO, joined the Management Board as of August 2012.6) Alexander Zschokke, former GVP Channel Solutions, was member of the Management Board until September 2012 and Ignacio Martinez,
former GVP International Sales, until October 2012.
Aside from these payments, no other payments were made to current or former members of the Management Board or persons closely linked to them in this reporting period.

Compensation report 55
Sonova Annual Report 2013 / 14
Additional information regarding payments to members of the Board of Directors and the Management BoardNo fees were paid for additional services beyond the stated compensation, nor were any loans awarded or guarantees given to members of the Board of Directors or the Management Board or persons closely linked to them in this reporting period.
Shareholdings of members of the Board of DirectorsThe following tables show the shareholdings of the individual members of the Board of Directors and persons closely linked to them.
31.3.2014 31.3.2013
Shares Restricted Shares1) 2)
RSUs2) Options2) Warrants2) 3) Shares Restricted Shares1) 2)
RSUs2) Options2) Warrants2) 3)
Robert F. Spoerry 15,000 11,049 500,000 12,000 7,839 950,000
Beat Hess 3,438 1,833
Michael Jacobi 2,260 3,438 783 5,115 500,000 2,000 1,833 1,043 5,115 950,000
Andy Rihs 3,713,258 3,438 783 5,115 500,000 4,560,498 1,833 1,043 5,115 950,000
Anssi Vanjoki 1,260 3,438 783 5,115 500,000 1,000 1,833 1,043 5,115 500,000
Ronald van der Vis 2,292 3,438 783 5,115 500,000 2,000 1,833 1,043 5,115 500,000
Jinlong Wang 1,605
John J. Zei 1,760 3,438 783 5,1154) 250,0005) 1,500 1,833 1,043 5,1154) 250,0005)
Total (active members) 3,735,830 33,282 3,915 25,575 2,750,000 4,578,998 18,837 5,215 25,575 4,100,000
Heliane Canepa 47,000 1,043 5,115 612,500
Total (including former member) 3,735,830 33,282 3,915 25,575 2,750,000 4,625,998 18,837 6,258 30,690 4,712,500
1) These shares are subject to a restriction period which varies from June 1, 2017 to June 1, 2019 depending on the grant date.2) For further details see also Note 31 in the consolidated financial statements.3) Exercise ratio between warrants and options: 25:1.4) SARs (SARs grant the right to participate in the appreciation of Sonova shares without issuance of shares).5) WARs (WARs grant the right to participate in the appreciation of the Sonova shares without issuance of shares).

Compensation report56
Sonova Annual Report 2013 / 14
The following table shows the detailed breakdown of the outstanding warrants / options of the members of the Board of Directors.
31.3.2014
Options EEAP 122)
Warrants EEAP 113)
Warrants EEAP 104)
Total options
Total warrants1)
Robert F. Spoerry 250,000 250,000 500,000
Michael Jacobi 5,115 250,000 250,000 5,115 500,000
Andy Rihs 5,115 250,000 250,000 5,115 500,000
Anssi Vanjoki 5,115 250,000 250,000 5,115 500,000
Ronald van der Vis 5,115 250,000 250,000 5,115 500,000
John J. Zei 5,1155) 250,0006) 5,1155) 250,0006)
Total 25,575 1,500,000 1,250,000 25,575 2,750,000
EEAP 2014, no options or warrants have been granted – 100 % restricted shares.1) Exercise ratio between warrants and options: 25:1 (see also Note 31 in the consolidated financial statements).2) Exercise price CHF 95.85, vesting period 01.02.2012 – 01.06.2016 whereas one tranche being vested each year, exercise period 01.06.2013 – 31.01.2019.3) Exercise price CHF 118.40, vesting period 01.03.2011 – 28.02.2015 whereas one tranche being vested each year, exercise period 01.03.2012 – 29.02.2016.4) Exercise price CHF 131.00, vesting period 01.03.2010 – 28.02.2014 whereas one tranche being vested each year, exercise period 01.03.2011 – 28.02.2015.5) SARs (SARs grant the right to participate in the appreciation of Sonova shares without issuance of shares).6) WARs (WARs grant the right to participate in the appreciation of the Sonova shares without issuance of shares).
31.3.2013
Options EEAP 122)
Warrants EEAP 113)
Warrants EEAP 104)
Warrants EEAP 095)
Total options
Total warrants1)
Robert F. Spoerry 250,000 250,000 450,000 950,000
Heliane Canepa 5,115 250,000 250,000 112,500 5,115 612,500
Michael Jacobi 5,115 250,000 250,000 450,000 5,115 950,000
Andy Rihs 5,115 250,000 250,000 450,000 5,115 950,000
Anssi Vanjoki 5,115 250,000 250,000 5,115 500,000
Ronald van der Vis 5,115 250,000 250,000 5,115 500,000
John J. Zei 5,1156) 250,0007) 5,1156) 250,0007)
Total 30,690 1,750,000 1,500,000 1,462,500 30,690 4,712,500
In 2013, the grants have been changed to 100 % in restricted shares.1) Exercise ratio between warrants and options: 25:1 (see also Note 31 in the consolidated financial statements).2) Exercise price CHF 95.85, vesting period 01.02.2012 – 01.06.2016 whereas one tranche being vested each year, exercise period 01.06.2013 – 31.01.2019.3) Exercise price CHF 118.40, vesting period 01.03.2011 – 28.02.2015 whereas one tranche being vested each year, exercise period 01.03.2012 – 29.02.2016.4) Exercise price CHF 131.00, vesting period 01.03.2010 – 28.02.2014 whereas one tranche being vested each year, exercise period 01.03.2011 – 28.02.2015.5) Exercise price CHF 56.00, vesting period 01.03.2009 – 28.02.2013 whereas one tranche being vested each year, exercise period 01.03.2010 – 28.02.2014.6) SARs (SARs grant the right to participate in the appreciation of Sonova shares without issuance of shares).7) WARs (WARs grant the right to participate in the appreciation of the Sonova shares without issuance of shares).

Compensation report 57
Sonova Annual Report 2013 / 14
Shareholdings of members of the Management Board The following tables show the shareholdings of individual members of the Management Board and persons closely linked to them.
31.3.2014 31.3.2013
Shares RSUs1) Options1) Warrants1) 2) Shares RSUs1) Options1) Warrants1) 2)
Lukas Braunschweiler 7,782 7,934 67,963 7,000 6,014 46,244
Maarten Barmentlo 1,000 5,183 26,673 869,000 4,009 18,497 869,000
Claude Diversi 280 3,145 16,073 450,000 2,154 9,941 512,500
Hansjürg Emch 2,759 5,289 27,184 661,000 2,238 4,009 18,497 661,000
Hartwig Grevener 3,724 16,954 1,923 8,267
Sarah Kreienbühl 1,000 5,289 27,184 843,750 479 4,009 18,497 1,281,250
Stefan Launer3) 1,802 2,495 12,923 474,000
Albert Chin-Hwee Lim3) 2,020 9,243
Hans Mehl 1,851 5,289 27,184 1,012,500 1,330 4,009 18,497 1,137,500
Jan Metzdorff3) 766 3,202 14,500 93,750
Franz Petermann3) 853 2,012 8,968 111,250
Paul Thompson 2,621 5,289 37,184 843,750 2,100 4,009 38,497 1,281,250
Andi Vonlanthen 9,172 5,093 25,905 448,000 8,932 3,748 17,218 728,000
Total 29,886 55,964 317,938 5,807,000 22,079 33,884 194,155 6,470,500
1) For further details see also Note 31 in the consolidated financial statements.2) Exercise ratio between warrants and options: 25:1 (see also Note 31 in the consolidated financial statements).3) Member of the Management Board since April 2013

Compensation report58
Sonova Annual Report 2013 / 14
The following table shows the detailed breakdown of the outstanding warrants / options of the members of the Management Board.
31.3.2014
Options EEAP 142)
Options EEAP 133)
Options EEAP 124)
Options (interim
CEO / CFO) 11 / 125)
Warrants EEAP 116)
Warrants EEAP 107)
Total options
Total warrants1)
Lukas Braunschweiler 21,719 20,669 25,575 67,963
Maarten Barmentlo 8,176 8,267 10,230 475,000 394,000 26,673 869,000
Claude Diversi 6,132 4,443 5,498 225,000 225,000 16,073 450,000
Hansjürg Emch 8,687 8,267 10,230 475,000 186,000 27,184 661,000
Hartwig Grevener 8,687 8,267 16,954
Sarah Kreienbühl 8,687 8,267 10,230 281,250 562,500 27,184 843,750
Stefan Launer 4,088 3,720 5,115 250,000 224,000 12,923 474,000
Albert Chin-Hwee Lim 5,110 4,133 9,243
Hans Mehl 8,687 8,267 10,230 562,500 450,000 27,184 1,012,500
Jan Metzdorff 6,132 4,340 4,028 31,250 62,500 14,500 93,750
Franz Petermann 4,088 3,307 1,573 48,750 62,500 8,968 111,250
Paul Thompson 8,687 8,267 10,230 10,000 281,250 562,500 37,184 843,750
Andi Vonlanthen 8,687 8,267 8,951 224,000 224,000 25,905 448,000
Total 107,567 98,481 101,890 10,000 2,854,000 2,953,000 317,938 5,807,000
1) Exercise ratio between warrants and options: 25:1 (see also Note 31 in the consolidated financial statements).2) Exercise price CHF 124.60, vesting period 01.02.2014 – 01.06.2018 whereas one tranche being vested each year, exercise period 01.06.2015 – 31.01.2021.3) Exercise price CHF 109.10, vesting period 01.02.2013 – 01.06.2017 whereas one tranche being vested each year, exercise period 01.06.2014 – 31.01.2020.4) Exercise price CHF 95.85, vesting period 01.02.2012 – 01.06.2016 whereas one tranche being vested each year, exercise period 01.06.2013 – 31.01.2019.5) Exercise price CHF 88.30, vesting period 28.05.2011 – 27.05.2015 whereas one tranche being vested each year, exercise period 28.05.2012 – 27.05.2016.6) Exercise price CHF 118.40, vesting period 01.03.2011 – 28.02.2015 whereas one tranche being vested each year, exercise period 01.03.2012 – 29.02.2016.7) Exercise price CHF 131.00, vesting period 01.03.2010 – 28.02.2014 whereas one tranche being vested each year, exercise period 01.03.2011 – 28.02.2015.
31.3.2013
Options EEAP 132)
Options EEAP 123)
Options (interim
CEO / CFO) 11 / 125)
Warrants EEAP 115)
Warrants EEAP 106)
Warrants EEAP 097)
Total options
Total warrants1)
Lukas Braunschweiler 20,669 25,575 46,244
Maarten Barmentlo 8,267 10,230 475,000 394,000 18,497 869,000
Claude Diversi 4,443 5,498 225,000 225,000 62,500 9,941 512,500
Hansjürg Emch 8,267 10,230 475,000 186,000 18,497 661,000
Hartwig Grevener 8,267 8,267
Sarah Kreienbühl 8,267 10,230 562,500 562,500 156,250 18,497 1,281,250
Hans Mehl 8,267 10,230 562,500 450,000 125,000 18,497 1,137,500
Paul Thompson 8,267 10,230 20,000 562,500 562,500 156,250 38,497 1,281,250
Andi Vonlanthen 8,267 8,951 224,000 224,000 280,000 17,218 728,000
Total 82,981 91,174 20,000 3,086,500 2,604,000 780,000 194,155 6,470,500
1) Exercise ratio between warrants and options: 25:1 (see also Note 31 in the consolidated financial statements).2) Exercise price CHF 109.10, vesting period 01.02.2013 – 01.06.2017 whereas one tranche being vested each year, exercise period 01.06.2014 – 31.01.2020.3) Exercise price CHF 95.85, vesting period 01.02.2012 – 01.06.2016 whereas one tranche being vested each year, exercise period 01.06.2013 – 31.01.2019.4) Exercise price CHF 88.30, vesting period 28.05.2011 – 27.05.2015 whereas one tranche being vested each year, exercise period 28.05.2012 – 27.05.2016.5) Exercise price CHF 118.40, vesting period 01.03.2011 – 28.02.2015 whereas one tranche being vested each year, exercise period 01.03.2012 – 29.02.2016.6) Exercise price CHF 131.00, vesting period 01.03.2010 – 28.02.2014 whereas one tranche being vested each year, exercise period 01.03.2011 – 28.02.2015.7) Exercise price CHF 56.00, vesting period 01.03.2009 – 28.02.2013 whereas one tranche being vested each year, exercise period 01.03.2010 – 28.02.2014.

Compensation report 59
Sonova Annual Report 2013 / 14
Report of the statutory auditor on the compensation report
Report of the statutory auditor on the compensation report to the Annual General Shareholders’ Meeting of Sonova Holding AG Stäfa Report of the statutory auditor on the audit of the compensation report We have audited the accompanying compensation report of Sonova Holding AG for the year ended 31.03.2014. The audit was limited to the information according to articles 14 – 16 of the Swiss Ordinance Against Excessive Compensation at Public Corporations (Ordinance) contained in the tables on pages 52 to 58.
Responsibility of the Board of DirectorsThe Board of Directors is responsible for the preparation and overall fair presentation of the compensation report in accordance with Swiss law and the Ordinance. The Board of Directors is also responsible for designing the compensation system and defining individual compensation packages.
Auditor’s responsibilityOur responsibility is to express an opinion on the accompanying compensation report. We conducted our audit in accordance with Swiss Auditing Standards. Those standards require that we comply with ethical requirements and plan and perform the audit to obtain reasonable assurance about whether the compensation report complies with Swiss law and articles 14 – 16 of the Ordinance.
An audit involves performing procedures to obtain audit evidence on the disclosures made in the compensation report with regard to compensation, loans and credits in accordance with articles 14 – 16 of the Ordinance. The procedures selected depend on the auditor’s judgment, including the assessment of the risks of material misstatements in the compensation report, whether due to fraud or error. This audit also includes evaluating the reasonableness of the methods applied to value components of compensation, as well as assessing the overall presentation of the compensation report.
We believe that the audit evidence we have obtained is sufficient and appropriate to provide a basis for our opinion.
OpinionIn our opinion, the compensation report of Sonova Holding AG for the year ended 31.03.2014 complies with Swiss law and articles 14 – 16 of the Ordinance.
PricewaterhouseCoopers AG
Sandra Boehm Gian Franco BielerAudit expert Audit expertAuditor in charge
Zurich, May 14, 2014

This page has intentionally been left blank

61
Sonova Annual Report 2013 / 14
62 Financial review
68 5 year key figures
70 Consolidated financial statementsConsolidated income statementsConsolidated statements of comprehensive incomeConsolidated balance sheets Consolidated cash flow statementsConsolidated changes in equityNotes to the consolidated financial statementsReport of the statutory auditor on the consolidated financial statements
116 Financial statements of Sonova Holding AGIncome statementsBalance sheetsNotes to the financial statementsAppropriation of available earningsReport of the statutory auditor on the financial statements
Investor information (back cover foldout)
Financial reporting

62
Sonova Annual Report 2013 / 14
Financial review
Double-digit organic sales growth in local currenciesIn the financial year under review, Group sales increased by 8.7 % in reported Swiss francs or 11.7 % in local currencies to CHF 1,951.3 million (2012 / 13: CHF 1,795.3 million). The main driver of the increase was double-digit organic growth, which reached 11.0 % in local currencies. The Swiss franc strengthened against all of the most relevant currencies except the euro during the financial year, reducing reported sales growth by CHF 54.2 million or 3.0 %.
In line with its strategy, Sonova made selected acquisitions of retail distribution businesses within its hearing instruments segment, albeit to a smaller extent than in previous years. External growth in sales for 2013 / 14 stemming from these acquisitions and the full-year effect of acquisitions from the previous year represented CHF 12.5 million or 0.7 %.
Broad-based growth across all regionsAll major regions posted a solid sales increase in local currencies. Sales in the EMEA region (Europe, Middle East, and Africa), which accounted for 41 % of Group sales, rose by 12.4 % in local currencies. In the hearing instruments segment, key markets such as Germany, the United Kingdom, and France posted a strong increase, while the Netherlands and Denmark showed the continuing adverse impact of reimbursement changes. In all major regions, the cochlear implants segment grew even more strongly than the hearing instruments segment.
Sales in the United States, which accounted for 37 % of Group sales in fiscal year 2013 / 14, increased by 11.0 % in local currency. In the hearing instruments segment, growth was driven by solid development of both the commercial market and business with the US Department of Veterans Affairs (VA). Strong acceleration of cochlear implant sales in the second half of the financial year also added to growth. Cochlear implant processor sales rose sharply following US regulatory approval of the new Naída CI Q70 sound processor in late August 2013.
Sales in the rest of the Americas (excluding the US) grew by 9.6 % in local currencies and accounted for 11 % of Group sales. Strong growth in Brazil and other Latin American countries was in part offset by a significant currency headwind, which reduced reported sales by around CHF 20 million or nine percentage points. The main driver of the 14.0 % sales increase in local currencies in the Asia / Pacific region was strong performance from the hearing instruments business in China, Australia, New Zealand, and Japan. The region contributed 11 % to Group sales.
SONOVA GROUP KEY FIGURES
in CHF m unless otherwise specified 2013 / 14Change in % (normalized)
Normalized performance 2012 / 131)/2)
Change in % (reported)
Reported performance
2012 / 131)
Sales 1,951.3 8.7 % 1,795.3 8.7 % 1,795.3
EBITA 430.1 11.6 % 385.3 136.7 % 181.7
EBITA margin 22.0 % 21.5 % 10.1 %
EPS (CHF) 5.08 10.4 % 4.60 207.9 % 1.65
Operating free cash flow2) 318.4 (0.0 %) 318.6 (0.0 %) 318.6
ROCE3) 27.7 % 10.4 % 10.4 %
ROE3) 20.3 % 7.1 % 7.1 %
1) Restated following the implementation of IAS 19 (revised), see Note 2.1. of the consolidated financial statements.2) Excluding one-off cost, mainly related to the increase of the product liability provision within the cochlear implants business
(see Note 7 of the consolidated financial statements). Balance sheet related key figures (including respective ratios) as reported.3) For detailed definitions, please refer to “5 Year Key Figures”.
In the 2013 / 14 financial year Sonova generated sales of CHF 1,951.3 million, an increase of 8.7 % in reported Swiss francs or 11.7 % in local currencies. Comparedto the normalized FY 2012 / 13 result, Group EBITA rose by 16.7 % in local currencies to CHF 430.1 million, corresponding to a margin of 22.0 %.

Financial review 63
Sonova Annual Report 2013 / 14
63
Sonova Annual Report 2013 / 14
INCOME AFTER TAXES IN CHF M EPS IN CHF
347 6.00
5.00
4.00
3.00
2.00
1.00
0
300
7.00350
250
200
150
100
50
0
347
2013
/14
200
9/1
0¹⁾
2010
/11
2011
/12
2012
/13²
⁾3 ⁾
SALES IN CHF MEBITA IN CHF M EBITA MARGIN IN %
1,951
430
35
30
25
20
15
10
5
0
1,350
1,500
1,650
1,800
1,950
1,200
1,050
900
750
600
450
300
150
0 200
9/1
0
2010
/11
2011
/12
2012
/13
2013
/14
200
9/1
01)
2010
/11
2011
/12
2012
/13
2)3)
2013
/14
Sustained margin improvementGross profit reached CHF 1,340.4 million (2012 / 13: CHF 1,239.8 million), an increase over the prior year of 8.1 % in reported Swiss francs or 11.3 % in local currencies. This corresponds to a gross margin of 68.7 %, down from 69.1 % the prior year. This decrease is caused by the higher share of cochlear implants business, which has a modestly lower gross profit margin than the hearing instruments segment.
Maintaining the group’s high pace of innovation requires sig-nificant and continuing investment in research and development (R & D). R & D expenses grew by 11.3 % in local currencies to CHF 125.7 million or 6.4 % of sales in 2013 / 14. Gross R & D spending (including the net increase in capitalized develop-ment costs) amounted to CHF 142.9 million, corresponding to 7.3 % of sales.
Sales and marketing costs increased by 5.5 % in Swiss francs or 8.3 % in local currencies to reach CHF 589.6 million. As a percentage of sales, reported costs stood at 30.2 %, down from 31.1 % in the prior year. This favorable trend is due to continuous cost discipline and was achieved despite significant product launch activity (particularly in the cochlear implants segment), extra costs for re-branding and process harmoniza-tion in our US retail business, and accelerated engagement in web-based B2C marketing.
General and administrative expenses rose by 7.6 % in Swiss francs or 9.4 % in local currencies, below reported sales growth. As a percentage of sales, general and administrative expenses stood at 10.0 %. A favorable cost ratio development
from strict cost control, was offset by extra costs for deeper integration of our US retail business.
Other income amounted to CHF 0.2 million. The CHF 203.6 million reported in the prior year under “other expenses” represented one-off costs, principally the increased product liability provision related to Advanced Bionics’ Vendor B product recall in 2006.
In summary, total operating expenses rose by 6.5 % in Swiss francs or 8.9 % in local currencies, both normalized for prior year one-off costs in the “other expenses” category. This is well below the reported sales growth. Operating profit before acquisition-related amortization (EBITA) was therefore CHF 430.1 million, which represents an increase of 11.6 % in Swiss francs or 16.7 % in local currencies compared to the normalized EBITA for the prior year. EBITA margin rose to a solid 22.0 %, up from a normalized EBITA margin of 21.5 % last year. Strong operating margin improvements were partly offset by the unfa-vorable currency development that reduced the reported EBITA by CHF 19.6 million and the EBITA margin by 40 basis points.
Operating profit (EBIT) reached CHF 404.0 million, an increase of 12.5 % in Swiss francs or 17.7 % in local currencies compared to the normalized prior year value. This reflects the strong EBITA growth and the fact that acquisition-related amortiza-tion were unchanged from prior year, as the modest increases from acquisitions were offset by currency effects. Net financial expenses rose from CHF 7.1 million to CHF 9.5 million, mainly due to the unwinding of the discount on the product liability provision and a lower profit from associates.
1) Restated based on finalization of the acquisition accounting of Advanced Bionics.2) Restated following the implementation of IAS 19 (revised), refer Note 2.1. of the consolidated financial statements.3) Excluding one-off cost, mainly related to the increase of the product liability provision within the cochlear implants business
(see Note 7 of the consolidated financial statements).

Financial review64
Sonova Annual Report 2013 / 14
Solid growth in EPSIncome taxes for the financial year totaled CHF 47.2 million, up from CHF 37.6 million in 2012 / 13, representing an effective tax rate of 12.0 %. Reported income after taxes was CHF 347.4 million, up 12.9 % from the normalized result in the previous year. Basic earnings per share (EPS) therefore reached CHF 5.08 (normalized EPS 2012 / 13: CHF 4.60), a solid rise of 10.4 % over the previous year.
Workforce increases to 9,529 At the end of the 2013 / 14 financial year, the Group’s total workforce stood at 9,529 full time equivalents – an increase of 577 over the previous year. This growth is broadly based across our sales and distribution organization and also includes modest additions from retail acquisitions. Our manu-facturing work force also increased, particularly at the Vietnam operations center, which has taken over assembly of our Lyric product from our US operations.
Hearing instruments segment – New products driving organic growthDriven almost exclusively by organic growth, sales in the hearing instruments segment reached CHF 1,756.0 million, representing an increase of 6.5 % in reported Swiss francs and 9.5 % in local currencies. With an organic growth rate of 8.8 % in local currencies, the business outpaced estimated market growth rates and further extended the Group’s leading market position. Acquisitions added CHF 12.5 million or 0.7 % to sales growth, including the full-year effect of acquisitions completed during the previous financial year.
Once again, both the Group’s wholesale and retail businesses contributed to growth in the hearing instruments segment. A key driver of this strong development was the success of the Phonak Quest platform, particularly the highly popular Receiver-In-Canal (RIC) form factor introduced at the AudiologyNOW! congress in April 2013. Lyric, the first and only invisible extended wear solution in the industry, also supported the sound organic sales increase with a growth
rate of approximately 50 % in 2013 / 14. Unitron posted par-ticularly strong growth in Germany, France, the UK, and China. Growth in the retail business continued to be driven by strong performance from the partnership with Boots, the UK’s leading pharmacy-led health and beauty retailer, but it was also sup-ported by solid sales growth in several Asia-Pacific markets.
Looking at the different product categories, Premium hearing instruments posted an above average growth rate, achieving a sales increase of 12.8 % in local currencies. The Premium category also includes Lyric. The Standard category showed the strongest growth, up 15.3 % in local currencies. This was helped in part by strong growth in the German market follow-ing a change in the reimbursement system in November 2013. The Advanced category also contributed to growth, albeit to a lesser extent, with a sales increase of 3.6 % local currencies. Premium and advanced hearing instruments each accounted for 22 % of Group sales, while Standard accounted for 29 %. Supported by the introduction of Roger, the all-new 2.4 GHz based system, sales of wireless communication systems grew by 9.9 % in local currencies. Sales of miscellaneous products and services grew by 3.1 % in local currencies in 2013 / 14, accounting for 13 % of Group sales. This category mainly consists of revenues from services and from the distribution of accessories and batteries.
The strong sales increase and stringent cost discipline lifted EBITA for the hearing instruments segment by 8.8 % in Swiss francs and 13.9 % in local currencies, reaching CHF 417.3 million. Excluding the unfavorable currency impact, operating margin rose by 90 basis points. As reported, EBITA margin rose by 50 basis points to 23.8 %. These margin increases demonstrate operating leverage and were achieved despite extra costs for deeper integration of our US retail business, such as establishing common branding and central-izing back office systems and support processes.
SALES BY REGIONS
in CHF m 2013 / 14 2012 / 13
Sales Share Growth in local
currencies
Sales Share
EMEA 795 41 % 12.4 % 706 40 %
USA 727 37 % 11.0 % 671 37 %
Americas (excl. USA) 224 11 % 9.6 % 222 12 %
Asia / Pacific 205 11 % 14.0 % 196 11 %
Total sales 1,951 100 % 11.7 % 1,795 100 %

Financial review 65
Sonova Annual Report 2013 / 14
Cochlear implants segment – Drawing from a complete portfolioThe performance of the cochlear implants segment was another highlight in the year under review. The segment achieved sales of CHF 195.3 million, an increase of 33.1 % in Swiss francs and 36.0 % in local currencies. Supported in particular by the launch of the Naída CI Q70 sound processor in summer 2013, sales accelerated over the course of the year, exceeding a year-on-year growth of 50 % in the second half of 2013 / 14. Europe and North America in particular responded very well to the new sound processor that incorporates many industry-first innovations shared with Phonak hearing aids. The balanced portfolio of electrodes and Advanced Bionics’ swimmable processor also supported growth, which reflected both the addition of new customer clinics and increased penetration at existing accounts. As in the previous year, cochlear implants sales included the fulfillment of a central government tender in China.
Profit from the cochlear implants segment improved strongly during financial year 2013 / 14, in line with our business plan, despite significant expenses from the launch of new products, particularly the new Naída CI Q70 sound processor. EBITA for the segment reached 12.8 million, representing an operat-ing margin of 6.6 %. This is an important step towards our goal of bringing the EBITA margin of the cochlear implants business closer to the corporate average. Normalized for one-off costs, principally the increased product liability provision related to Advanced Bionics’ Vendor B product recall in 2006, the cochlear implants segment had achieved an EBITA of CHF 1.8 million in the previous financial year. In 2013 / 14 the relevant parameters for the said product liability provision developed fully in line with the assumptions considered in the accounts of the previous financial year. Thus no releases or additions with P & L effect were booked to the provision in the year under review.
Significant free cash flowCash flow from operating activities rose by 6.2 % to CHF 411.0 million in the period under review. The increase reflects the rise in EBITA of 11.6 % versus the prior year (normalized for the effect of one-off costs) and CHF 43.4 million of cash spent for the settlement and defense of product liability claims in connection with the Advanced Bionics’ Vendor B product recall (2012 / 13: CHF 2.9 million). This includes the settlements announced in October 2013, which covered the majority of claims pending at that time. Investments in tangible and intangible assets increased by 15.0 % to CHF 94.7 million, resulting in an operating free cash flow of CHF 318.4 million, unchanged from prior year. The cash consideration for acquisi-tions, including earn-out payments for prior period acquisitions, dropped from CHF 56.2 million last year to CHF 29.8 million during the reporting period. In summary, this resulted in a free cash flow of CHF 288.6 million, up 10.0 % from last year.
The cash outflow from financing rose to CHF 309.1 million in the period under review, from CHF 21.8 million last year. This in part reflects the higher distribution to shareholders as well as the purchase of shares to serve the equity-based incentive plans; in previous years, the shares for these plans were created out of conditional capital. Sonova also decided on an early repayment of CHF 150 million of its CHF 230 million bank debt assumed in connection with the acquisition of Advanced Bionics in 2009. The remainder of this bank debt will mature in December 2014, rendering the Group essentially debt-free.
SALES BY PRODUCT GROUPS
in CHF m 2013 / 14 2012 / 13
Product groups
Sales Share Growth in local
currencies
Sales Share
Premiums hearing instruments 433 22 % 12.8 % 393 22 %
Advanced hearing instruments 438 22 % 3.6 % 435 24 %
Standard hearing instruments 556 29 % 15.3 % 496 28 %
Wireless communication systems 68 4 % 9.9 % 64 4 %
Miscellaneous 261 13 % 3.1 % 260 14 %
Total hearing instruments 1,756 90 % 9.5 % 1,648 92 %
Cochlear implants and accessories 195 10 % 36.0 % 147 8 %
Total sales 1,951 100 % 11.7 % 1,795 100 %

Financial review66
Sonova Annual Report 2013 / 14
Maintaining a solid balance sheetThe reported net working capital was at CHF 190.6 million compared to CHF 187.1 million at the end of the 2012 / 13 financial year. Capital employed was largely unchanged at CHF 1,463 million. Helped by its strong free cash flow, the Group ended the period with a net cash position of CHF 311.5 million, up CHF 125.7 million from CHF 185.8 million at the end of the prior year. The return on capital employed (ROCE) was 27.7 % compared to 22.6 % in the prior year (normalized for the effect of one-off costs), showing that we are on track to reach our mid-term financial targets.
In light of its strong performance during the 2013 / 14 finan-cial year, as well as the solid financial position of the Sonova Group, the Board of Directors will propose to the Annual General Shareholders’ Meeting on June 17, 2014 a dividend of CHF 1.90. Compared to the prior year, the proposed distri-bution is up 19 % and represents a slightly higher payout ratio of 37 %.
Outlook 2014 / 15Sonova remains committed to achieve profitable growth through continuous innovation and to further expand our strong market positions. We expect continued solid growth in sales and earnings in 2014 / 15, both in the hearing in struments and cochlear implants segment. Group sales are expected to grow by 7 % – 9 % in local currencies.

Financial review 67
Sonova Annual Report 2013 / 14
140120100806040200
2004 2005 2006 2007 2008 2009 2010 2011 2012 2013 2014
SONOVA SHARE PRICESWISS PERFORMANCE INDEX (Rebased)
Share price performance1)
10 years 5 years 3 years 2 years 1 year
Sonova shares 323.6 % 87.8 % 57.8 % 28.8 % 13.4 %
Swiss Performance Index (SPI)2) 100.1 % 98.2 % 41.6 % 43.5 % 13.2 %
Sonova shares relative to the SPI 223.5 % (10.5 %) 16.2 % (14.7 %) 0.2 %
1) Performance of the Sonova shares and SPI refers to the respective period prior to the last trading day of financial year 2013 / 142) The Swiss Performance Index (SPI) is considered Switzerland’s overall stock market index. It comprises practically all
of the SIX Swiss Exchange-traded equity securities of companies that are domiciled in Switzerland or the Principality of Liechtenstein.
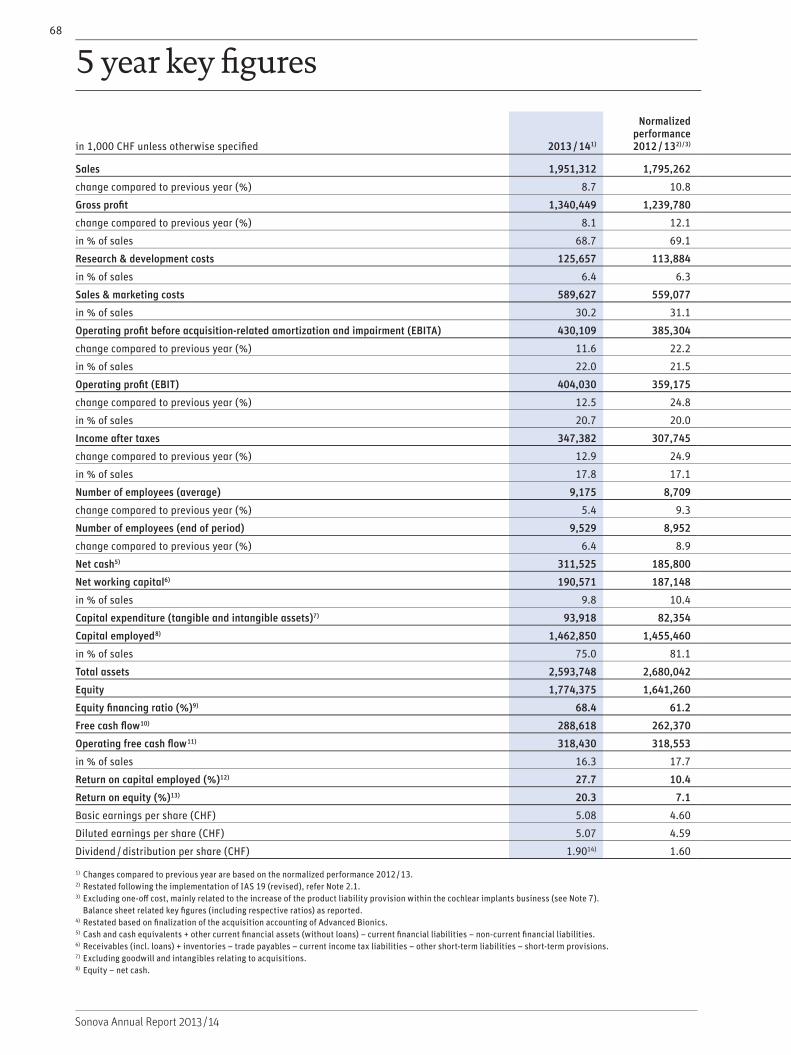
68
Sonova Annual Report 2013 / 14
in 1,000 CHF unless otherwise specified 2013 / 141)
Normalized performance 2012 / 132)/3)
Reported performance
2012 / 132) 2011 / 12 2010 / 11Restated
2009 / 104)Reported
2009 / 10
Sales 1,951,312 1,795,262 1,795,262 1,619,848 1,616,700 1,500,306 1,500,306
change compared to previous year (%) 8.7 10.8 10.8 0.2 7.8 20.1 20.1
Gross profit 1,340,449 1,239,780 1,239,780 1,105,924 1,118,681 1,058,597 1,058,427
change compared to previous year (%) 8.1 12.1 12.1 (1.1) 5.7 22.1 22.0
in % of sales 68.7 69.1 69.1 68.3 69.2 70.6 70.5
Research & development costs 125,657 113,884 113,884 116,178 107,760 87,034 87,034
in % of sales 6.4 6.3 6.3 7.2 6.7 5.8 5.8
Sales & marketing costs 589,627 559,077 559,077 503,354 498,589 402,626 402,626
in % of sales 30.2 31.1 31.1 31.1 30.8 26.8 26.8
Operating profit before acquisition-related amortization and impairment (EBITA) 430,109 385,304 181,688 315,199 326,622 420,276 420,106
change compared to previous year (%) 11.6 22.2 (42.4) (3.5) (22.3) 26.7 26.6
in % of sales 22.0 21.5 10.1 19.5 20.2 28.0 28.0
Operating profit (EBIT) 404,030 359,175 155,559 287,699 270,810 251,419 406,753
change compared to previous year (%) 12.5 24.8 (45.9) 6.2 7.7 (22.6) 25.1
in % of sales 20.7 20.0 8.7 17.8 16.8 16.8 27.1
Income after taxes 347,382 307,745 110,869 246,410 231,080 216,632 354,813
change compared to previous year (%) 12.9 24.9 (55.0) 6.6 6.7 (23.8) 24.9
in % of sales 17.8 17.1 6.2 15.2 14.3 14.4 23.6
Number of employees (average) 9,175 8,709 8,709 7,970 7,291 5,933 5,933
change compared to previous year (%) 5.4 9.3 9.3 9.3 22.9 16.1 16.1
Number of employees (end of period) 9,529 8,952 8,952 8,223 7,840 6,843 6,843
change compared to previous year (%) 6.4 8.9 8.9 4.9 14.6 28.2 28.2
Net cash5) 311,525 185,800 185,800 (64,448) (111,287) (126,029) (126,029)
Net working capital6) 190,571 187,148 187,148 163,434 158,190 144,363 177,011
in % of sales 9.8 10.4 10.4 10.1 9.8 9.6 11.8
Capital expenditure (tangible and intangible assets)7) 93,918 82,354 82,354 80,073 111,457 89,272 89,272
Capital employed8) 1,462,850 1,455,460 1,455,460 1,540,326 1,455,999 1,388,537 1,534,387
in % of sales 75.0 81.1 81.1 95.1 90.1 92.6 102.3
Total assets 2,593,748 2,680,042 2,680,042 2,287,202 2,171,644 2,324,026 2,409,257
Equity 1,774,375 1,641,260 1,641,260 1,475,878 1,344,712 1,262,508 1,408,358
Equity financing ratio (%)9) 68.4 61.2 61.2 64.5 61.9 54.3 58.5
Free cash flow10) 288,618 262,370 262,370 156,406 71,593 (301,388) (301,388)
Operating free cash flow11) 318,430 318,553 318,553 239,535 221,541 324,754 324,754
in % of sales 16.3 17.7 17.7 14.8 13.7 21.6 21.6
Return on capital employed (%)12) 27.7 10.4 10.4 19.2 19.0 23.0 34.9
Return on equity (%)13) 20.3 7.1 7.1 17.5 17.7 18.9 29.1
Basic earnings per share (CHF) 5.08 4.60 1.65 3.71 3.50 3.32 5.41
Diluted earnings per share (CHF) 5.07 4.59 1.64 3.71 3.47 3.28 5.36
Dividend / distribution per share (CHF) 1.9014) 1.60 1.60 1.20 1.20 1.20 1.20
1) Changes compared to previous year are based on the normalized performance 2012 / 13.2) Restated following the implementation of IAS 19 (revised), refer Note 2.1.3) Excluding one-off cost, mainly related to the increase of the product liability provision within the cochlear implants business (see Note 7).
Balance sheet related key figures (including respective ratios) as reported.4) Restated based on finalization of the acquisition accounting of Advanced Bionics.5) Cash and cash equivalents + other current financial assets (without loans) – current financial liabilities – non-current financial liabilities.6) Receivables (incl. loans) + inventories – trade payables – current income tax liabilities – other short-term liabilities – short-term provisions.7) Excluding goodwill and intangibles relating to acquisitions.8) Equity – net cash.
5 year key figures

695 year key figures
Sonova Annual Report 2013 / 14
in 1,000 CHF unless otherwise specified 2013 / 141)
Normalized performance 2012 / 132)/3)
Reported performance
2012 / 132) 2011 / 12 2010 / 11Restated
2009 / 104)Reported
2009 / 10
Sales 1,951,312 1,795,262 1,795,262 1,619,848 1,616,700 1,500,306 1,500,306
change compared to previous year (%) 8.7 10.8 10.8 0.2 7.8 20.1 20.1
Gross profit 1,340,449 1,239,780 1,239,780 1,105,924 1,118,681 1,058,597 1,058,427
change compared to previous year (%) 8.1 12.1 12.1 (1.1) 5.7 22.1 22.0
in % of sales 68.7 69.1 69.1 68.3 69.2 70.6 70.5
Research & development costs 125,657 113,884 113,884 116,178 107,760 87,034 87,034
in % of sales 6.4 6.3 6.3 7.2 6.7 5.8 5.8
Sales & marketing costs 589,627 559,077 559,077 503,354 498,589 402,626 402,626
in % of sales 30.2 31.1 31.1 31.1 30.8 26.8 26.8
Operating profit before acquisition-related amortization and impairment (EBITA) 430,109 385,304 181,688 315,199 326,622 420,276 420,106
change compared to previous year (%) 11.6 22.2 (42.4) (3.5) (22.3) 26.7 26.6
in % of sales 22.0 21.5 10.1 19.5 20.2 28.0 28.0
Operating profit (EBIT) 404,030 359,175 155,559 287,699 270,810 251,419 406,753
change compared to previous year (%) 12.5 24.8 (45.9) 6.2 7.7 (22.6) 25.1
in % of sales 20.7 20.0 8.7 17.8 16.8 16.8 27.1
Income after taxes 347,382 307,745 110,869 246,410 231,080 216,632 354,813
change compared to previous year (%) 12.9 24.9 (55.0) 6.6 6.7 (23.8) 24.9
in % of sales 17.8 17.1 6.2 15.2 14.3 14.4 23.6
Number of employees (average) 9,175 8,709 8,709 7,970 7,291 5,933 5,933
change compared to previous year (%) 5.4 9.3 9.3 9.3 22.9 16.1 16.1
Number of employees (end of period) 9,529 8,952 8,952 8,223 7,840 6,843 6,843
change compared to previous year (%) 6.4 8.9 8.9 4.9 14.6 28.2 28.2
Net cash5) 311,525 185,800 185,800 (64,448) (111,287) (126,029) (126,029)
Net working capital6) 190,571 187,148 187,148 163,434 158,190 144,363 177,011
in % of sales 9.8 10.4 10.4 10.1 9.8 9.6 11.8
Capital expenditure (tangible and intangible assets)7) 93,918 82,354 82,354 80,073 111,457 89,272 89,272
Capital employed8) 1,462,850 1,455,460 1,455,460 1,540,326 1,455,999 1,388,537 1,534,387
in % of sales 75.0 81.1 81.1 95.1 90.1 92.6 102.3
Total assets 2,593,748 2,680,042 2,680,042 2,287,202 2,171,644 2,324,026 2,409,257
Equity 1,774,375 1,641,260 1,641,260 1,475,878 1,344,712 1,262,508 1,408,358
Equity financing ratio (%)9) 68.4 61.2 61.2 64.5 61.9 54.3 58.5
Free cash flow10) 288,618 262,370 262,370 156,406 71,593 (301,388) (301,388)
Operating free cash flow11) 318,430 318,553 318,553 239,535 221,541 324,754 324,754
in % of sales 16.3 17.7 17.7 14.8 13.7 21.6 21.6
Return on capital employed (%)12) 27.7 10.4 10.4 19.2 19.0 23.0 34.9
Return on equity (%)13) 20.3 7.1 7.1 17.5 17.7 18.9 29.1
Basic earnings per share (CHF) 5.08 4.60 1.65 3.71 3.50 3.32 5.41
Diluted earnings per share (CHF) 5.07 4.59 1.64 3.71 3.47 3.28 5.36
Dividend / distribution per share (CHF) 1.9014) 1.60 1.60 1.20 1.20 1.20 1.20
1) Changes compared to previous year are based on the normalized performance 2012 / 13.2) Restated following the implementation of IAS 19 (revised), refer Note 2.1.3) Excluding one-off cost, mainly related to the increase of the product liability provision within the cochlear implants business (see Note 7).
Balance sheet related key figures (including respective ratios) as reported.4) Restated based on finalization of the acquisition accounting of Advanced Bionics.5) Cash and cash equivalents + other current financial assets (without loans) – current financial liabilities – non-current financial liabilities.6) Receivables (incl. loans) + inventories – trade payables – current income tax liabilities – other short-term liabilities – short-term provisions.7) Excluding goodwill and intangibles relating to acquisitions.8) Equity – net cash.
9) Equity in % of total assets.10) Cash flow from operating activities + cash flow from investing activities.11) Free cash flow – cash consideration for acquisitions, net of cash acquired.12) EBIT in % of capital employed (average).13) Income after taxes in % of equity (average).14) Proposal to the Annual General Shareholders’ Meeting of June 17, 2014.
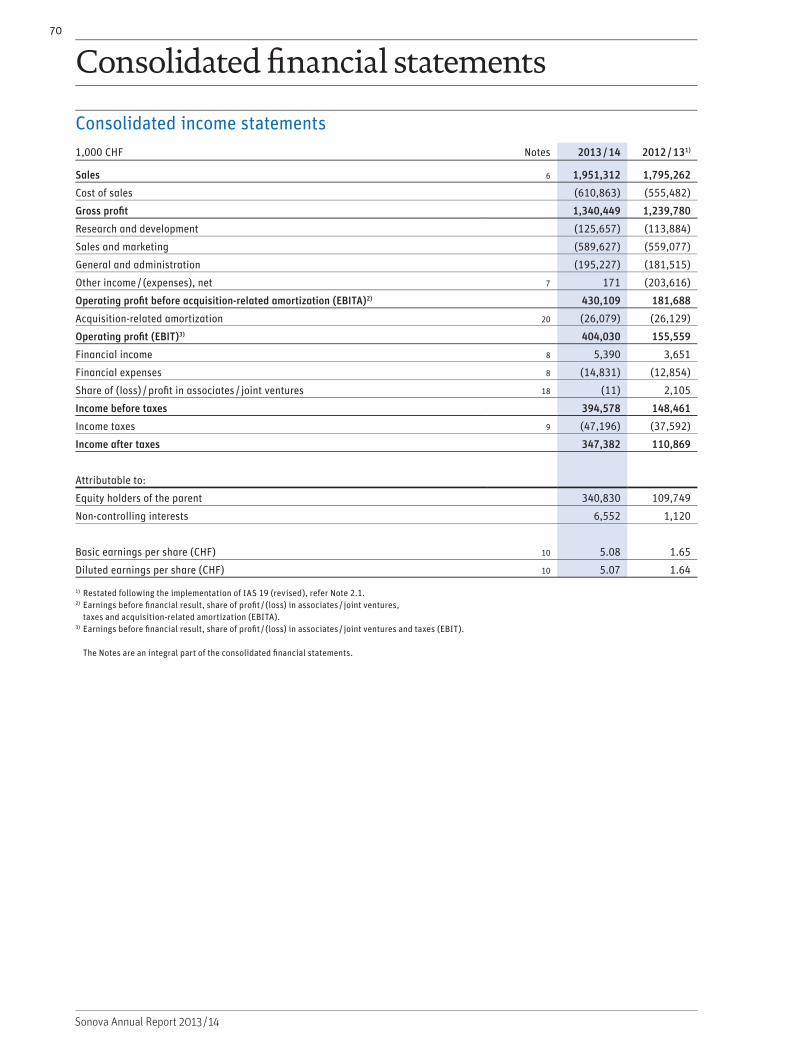
70
Sonova Annual Report 2013 / 14
Consolidated income statements 1,000 CHF Notes 2013 / 14 2012 / 131)
Sales 6 1,951,312 1,795,262
Cost of sales (610,863) (555,482)
Gross profit 1,340,449 1,239,780
Research and development (125,657) (113,884)
Sales and marketing (589,627) (559,077)
General and administration (195,227) (181,515)
Other income / (expenses), net 7 171 (203,616)
Operating profit before acquisition-related amortization (EBITA)2) 430,109 181,688
Acquisition-related amortization 20 (26,079) (26,129)
Operating profit (EBIT)3) 404,030 155,559
Financial income 8 5,390 3,651
Financial expenses 8 (14,831) (12,854)
Share of (loss) / profit in associates / joint ventures 18 (11) 2,105
Income before taxes 394,578 148,461
Income taxes 9 (47,196) (37,592)
Income after taxes 347,382 110,869
Attributable to:
Equity holders of the parent 340,830 109,749
Non-controlling interests 6,552 1,120
Basic earnings per share (CHF) 10 5.08 1.65
Diluted earnings per share (CHF) 10 5.07 1.64
1) Restated following the implementation of IAS 19 (revised), refer Note 2.1.2) Earnings before financial result, share of profit / (loss) in associates / joint ventures,
taxes and acquisition-related amortization (EBITA).3) Earnings before financial result, share of profit / (loss) in associates / joint ventures and taxes (EBIT).
The Notes are an integral part of the consolidated financial statements.
Consolidated financial statements

Consolidated financial statements 71
Sonova Annual Report 2013 / 14
Consolidated statements of comprehensive income 1,000 CHF Notes 2013 / 14 2012 / 131)
Income after taxes 347,382 110,869
Other comprehensive income
Actuarial gain / (loss) from defined benefit plans, net 30 1,405 (14,176)
Tax effect on actuarial gain / (loss) from defined benefit plans (188) 1,940
Put options granted to non-controlling interests (7,879)
Total items not to be reclassified to income statement in subsequent periods (6,662) (12,236)
Fair value adjustment on cash flow hedges 5,300 2,265
Currency translation differences (83,798) 52,167
Tax effect on currency translation items 3,140 (1,868)
Total items to be reclassified to income statement in subsequent periods (75,358) 52,564
Other comprehensive income, net of tax (82,020) 40,328
Total comprehensive income 265,362 151,197
Attributable to:
Equity holders of the parent 258,350 150,809
Non-controlling interests 7,012 388
1) Restated following the implementation of IAS 19 (revised), refer Note 2.1. The Notes are an integral part of the consolidated financial statements.

Consolidated financial statements72
Sonova Annual Report 2013 / 14
Consolidated balance sheets
Assets 1,000 CHF Notes 31.3.2014 31.3.20131) 31.3.20121)
Cash and cash equivalents 12 410,004 434,766 191,938
Other current financial assets 13 3,970 4,640 6,801
Trade receivables 14 350,807 339,689 339,419
Current income tax receivables 6,931 10,968 13,658
Other receivables and prepaid expenses 15 65,519 71,505 52,003
Inventories 16 206,042 204,258 164,303
Total current assets 1,043,273 1,065,826 768,122
Property, plant and equipment 17 263,080 248,571 242,490
Intangible assets 20 1,161,070 1,199,769 1,120,590
Investments in associates / joint ventures 18 11,620 19,339 15,668
Other non-current financial assets 19 20,603 30,032 42,312
Deferred tax assets 9 94,102 116,505 97,260
Total non-current assets 1,550,475 1,614,216 1,518,320
Total assets 2,593,748 2,680,042 2,286,442
Liabilities and equity 1,000 CHF Notes 31.3.2014 31.3.20131) 31.3.20121)
Current financial liabilities 22 93,828 7,196 16,246
Trade payables 75,283 74,684 69,533
Current income tax liabilities 61,870 57,209 72,934
Other short-term liabilities 23 204,036 205,748 177,303
Short-term provisions 21 101,509 106,271 91,561
Total current liabilities 536,526 451,108 427,577
Non-current financial liabilities 24 4,651 241,770 241,559
Long-term provisions 21 197,574 256,083 78,359
Other long-term liabilities 26 48,221 44,272 28,665
Deferred tax liabilities 9 32,401 45,549 29,443
Total non-current liabilities 282,847 587,674 378,026
Total liabilities 819,373 1,038,782 805,603
Share capital 27 3,359 3,358 3,329
Treasury shares 4,285 9,401 2,733
Retained earnings and reserves 1,737,186 1,600,058 1,473,024
Equity attributable to equity holders of the parent 1,744,830 1,612,817 1,479,086
Non-controlling interests 29,545 28,443 1,753
Equity 1,774,375 1,641,260 1,480,839
Total liabilities and equity 2,593,748 2,680,042 2,286,442
1) Restated following the implementation of IAS 19 (revised), refer Note 2.1. The Notes are an integral part of the consolidated financial statements.

Consolidated financial statements 73
Sonova Annual Report 2013 / 14
Consolidated cash flow statements 1,000 CHF Notes 2013 / 14 2012 / 131)
Income before taxes 394,578 148,461
Depreciation and amortization of tangible and intangible assets 17,20 83,100 81,657
Loss on sale of tangible and intangible assets, net 1,128 457
Share of loss / (gain) in associates / joint ventures 18 11 (2,105)
(Decrease) / increase in long-term provisions (20,903) 196,686
Financial expenses, net 8 9,441 9,203
Share based payments 31 19,133 16,248
Other non-cash items 2,963 1,023
Income taxes paid (37,303) 57,570 (50,137) 253,032
Cash flow before changes in net working capital 452,148 401,493
(Increase) / decrease in trade receivables (31,958) 8,292
Decrease / (increase) in other receivables and prepaid expenses 4,238 (17,448)
Increase in inventories (17,064) (31,140)
Increase in trade payables 2,170 2,296
Increase in other payables, accruals and short-term provisions 1,494 (41,120) 23,560 (14,440)
Cash flow from operating activities 411,028 387,053
Purchase of tangible and intangible assets (94,653) (82,297)
Proceeds from sale of tangible and intangible assets 1,951 735
Cash consideration for acquisitions, net of cash acquired 28 (29,812) (56,183)
Changes in other financial assets (1,553) 11,032
Interest received and realized gain from financial assets 1,657 2,030
Cash flow from investing activities (122,410) (124,683)
Repayment of borrowings (150,956) (1,322)
Proceeds from capital increases 1,647 54,389
(Purchase) / sale of treasury shares, net (39,124) (4,539)
Dividends paid by Sonova Holding AG (107,441) (79,887)
Transactions with non-controlling interests (5,987) 15,045
Interest paid and other financial expenses (7,240) (5,477)
Cash flow from financing activities (309,101) (21,791)
Exchange (losses) / gains on cash and cash equivalents (4,279) 2,249
(Decrease) / increase in cash and cash equivalents (24,762) 242,828
Cash and cash equivalents at the beginning of the financial year 434,766 191,938
Cash and cash equivalents at the end of the financial year 410,004 434,766
1) Restated following the implementation of IAS 19 (revised), refer Note 2.1. The Notes are an integral part of the consolidated financial statements.

Consolidated financial statements74
Sonova Annual Report 2013 / 14
Consolidated changes in equity1,000 CHF
Attributable to equity holders of Sonova Holding AG
Share capital Retained earnings and
other reserves1)
Translation adjustment
Treasury shares
Hedge reserve
Non- controlling
interests
Total equity1)
Balance March 31, 2012 (as published) 3,329 1,710,080 (233,551) 2,7332) (8,466) 1,753 1,475,878
Effect of adopting IAS 19 (revised) 4,961 4,961
Balance April 1, 2012 3,329 1,715,041 (233,551) 2,7332) (8,466) 1,753 1,480,839
Income for the period 109,749 1,120 110,869
Actuarial loss from defined benefit plans, net (14,176) (14,176)
Tax effect on actuarial loss 1,940 1,940
Fair value adjustment on hedges 2,265 2,265
Currency translation differences 52,899 (732) 52,167
Tax effect on currency translation (1,868) (1,868)
Total comprehensive income 97,513 51,031 2,265 388 151,197
Changes in non-controlling interests (3,412) 26,302 22,890
Capital increase from conditional capital 29 54,360 54,389
Share-based payments 4,548 4,548
Sale of treasury shares 616 16,835 17,451
Purchase of treasury shares (10,167) (10,167)
Dividend paid (79,887) (79,887)
Balance March 31, 2013 3,358 1,788,779 (182,520) 9,4012) (6,201) 28,443 1,641,260
Balance April 1, 2013 3,358 1,788,779 (182,520) 9,4012) (6,201) 28,443 1,641,260
Income for the period 340,830 6,552 347,382
Actuarial gain from defined benefit plans, net 1,405 1,405
Tax effect on actuarial gain (188) (188)
Put options granted to non-controlling interests (7,879) (7,879)
Fair value adjustment on hedges 5,300 5,300
Currency translation differences (84,258) 460 (83,798)
Tax effect on currency translation 3,140 3,140
Total comprehensive income 334,168 (81,118) 5,300 7,012 265,362
Changes in non-controlling interests (101) (4,147) (4,248)
Capital increase from conditional capital 1 1,646 1,647
Share-based payments 6,474 6,474
Sale of treasury shares (21,800) 58,004 36,204
Purchase of treasury shares (63,120) (63,120)
Dividend paid (107,441) (1,763) (109,204)
Balance March 31, 2014 3,359 2,001,725 (263,638) 4,2852) (901) 29,545 1,774,375
1) Restated following the implementation of IAS 19 (revised), refer Note 2.1.2) Includes derivative financial instruments on treasury shares.
The Notes are an integral part of the consolidated financial statements.

75
Sonova Annual Report 2013 / 14
Notes to the consolidated financial statements as of March 31, 2014 1. Corporate information
The Sonova Group (the “Group”) specializes in the design, development, manufacture, worldwide distribution and service of technologically advanced hearing systems for adults and children with hearing impairment. The Group operates worldwide and distributes its products in over 90 countries through its own distribution network and through independent distributors. The ultimate parent company is Sonova Holding AG, a limited liability company incorporated in Switzerland. Sonova Holding AG’s regis-tered office is located at Laubis rütistrasse 28, 8712 Stäfa, Switzerland.
2. Basis of consolidated financial statements
The consolidated financial statements of the Group are based on the financial statements of the individual Group companies at March 31 prepared in accordance with uniform accounting policies. The consolidated financial statements have been prepared under the historical cost convention except for the revaluation of certain financial assets at market value, in accordance with International Financial Reporting Standards (IFRS), including International Accounting Standards (IAS) and Interpretations issued by the International Accounting Standards Board (IASB). The consolidated financial statements were approved by the Board of Directors of Sonova Holding AG on May 14, 2014 and are subject to approval by the Annual General Share-holders’ Meeting on June 17, 2014.
The consolidated financial statements include Sonova Holding AG as well as the domestic and foreign subsidiaries over which Sonova Holding AG exercises control. A list of the significant companies which are consolidated is given in Note 35.
The preparation of financial statements requires manage-ment to make estimates and assumptions that affect the amounts reported for assets and liabilities and contingent assets and liabilities at the date of the financial statements as well as revenue and expenses reported for the financial year (refer also to Note 2.7, “Significant accounting judge-ments and estimates”). Actual results could differ from these estimates.
2. 1 Changes in accounting policies
The following new standards and amendments have been adopted as of April 1, 2013 without having a significant impact on the Group’s result and financial position:
– IFRS 10 “Consolidated financial statements” The new standard which replaced IAS 27, introduced a new single definition of control.
– IFRS 11 “Joint arrangements” The new standard which replaced IAS 31, eliminated the policy choice of proportionate consolidation for jointly controlled entities.
– IFRS 12 “Disclosures of interest in other entities” The new standard combined and enhanced disclosure requirements for subsidiaries, joint arrangements and unconsolidated entities.
– IFRS 13 “Fair value measurement” The new standard provides guidance on how to measure and to disclose assets and liabilities at fair value. The new standard does not specify rules in which cases the fair value has to be used.
– IAS 1 “Presentation of items of other comprehensive income” The amendment to IAS 1 requires that items that are presented in other comprehensive income have to be separated based on whether they may be recycled to profit or loss in the future or not.
– Annual improvements of IFRS and interpretations (IFRIC) as well as amendments to IFRS 7, IAS 27 and IAS 28
In addition the Group has adopted IAS 19 (revised) “Employee benefits” as of April 1, 2013. The effects arising from the application of IAS 19 (revised) are explained below.
Application of IAS 19 (revised) “Employee benefits” Among other items the revised standard requires that the previously separately calculated interest costs and the expected return on plan assets was replaced by a single net interest component calculated by applying the discount rate to the net defined benefit asset or liability. The net interest component is recognized in the income statement in the financial result.
The revised standard IAS 19 requires a retrospective appli-cation, resulting in a restatement of previously published figures. The impact on the equity as of April 1, 2012 amounted to CHF 5.0 million, increasing total equity to CHF 1,480.8 million. The main impact from the restatement on the income statement for the financial year 2012 / 13 was an effect on the EBITA of CHF − 1.1 million and an increase in financial expenses of CHF 0.2 million. The following tables present a reconciliation between the previously published results and the restated amounts as per the respective dates.

Consolidated financial statements76
Sonova Annual Report 2013 / 14
Effects on the consolidated income statement
Consolidated income statement
1,000 CHF 2012 / 13 2012 / 13
Published Application of IAS 19 (revised)
Restated
Cost of sales (555,156) (326) (555,482)
Gross profit 1,240,106 (326) 1,239,780
Research and development (113,529) (355) (113,884)
Sales and marketing (558,865) (212) (559,077)
General and administration (181,291) (224) (181,515)
Operating profit before acquisition-related amortization (EBITA) 182,805 (1,117) 181,688
Operating profit (EBIT) 156,676 (1,117) 155,559
Financial expenses (12,613) (241) (12,854)
Income before taxes 149,819 (1,358) 148,461
Income taxes (37,782) 190 (37,592)
Income after taxes 112,037 (1,168) 110,869
Attributable to:
Equity holders of the parent 110,917 (1,168) 109,749
Non-controlling interests 1,120 1,120
Basic earnings per share (CHF) 1.66 (0.01) 1.65
Diluted earnings per share (CHF) 1.66 (0.02) 1.64
Effects on the consolidated statement of comprehensive income
Consolidated statement of comprehensive income
1,000 CHF 2012 / 13 2012 / 13
Published Application of IAS 19 (revised)
Restated
Income after taxes 112,037 (1,168) 110,869
Actuarial loss from defined benefit plans, net (16,632) 2,456 (14,176)
Tax effect on actuarial loss from defined benefit plans 2,264 (324) 1,940
Other comprehensive income, net of tax 38,196 2,132 40,328
Total comprehensive income 150,233 964 151,197
Attributable to:
Equity holders of the parent 149,845 964 150,809
Non-controlling interests 388 388
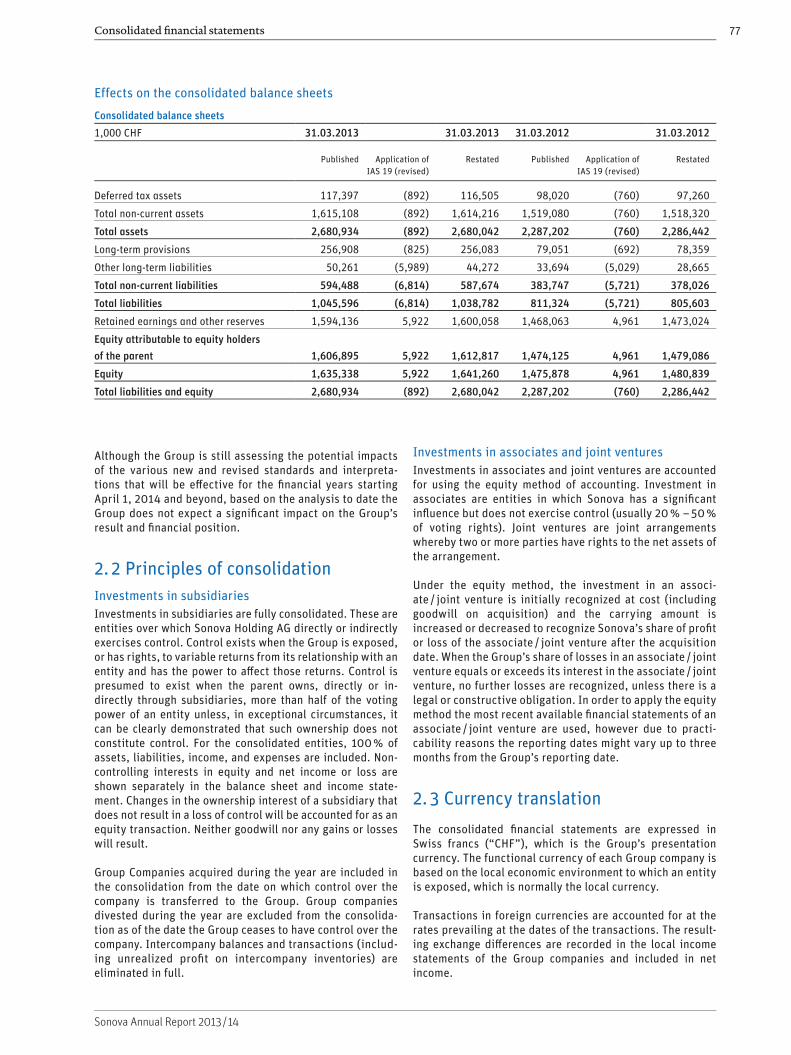
Consolidated financial statements 77
Sonova Annual Report 2013 / 14
Although the Group is still assessing the potential impacts of the various new and revised standards and interpreta-tions that will be effective for the financial years starting April 1, 2014 and beyond, based on the analysis to date the Group does not expect a significant impact on the Group’s result and financial position.
2. 2 Principles of consolidationInvestments in subsidiariesInvestments in subsidiaries are fully consolidated. These are entities over which Sonova Holding AG directly or indirectly exercises control. Control exists when the Group is exposed, or has rights, to variable returns from its relationship with an entity and has the power to affect those returns. Control is presumed to exist when the parent owns, directly or in - directly through subsidiaries, more than half of the voting power of an entity unless, in exceptional circumstances, it can be clearly demonstrated that such ownership does not constitute control. For the consolidated entities, 100 % of assets, liabilities, income, and expenses are included. Non-controlling interests in equity and net income or loss are shown separately in the balance sheet and income state-ment. Changes in the ownership interest of a subsidiary that does not result in a loss of control will be accounted for as an equity transaction. Neither goodwill nor any gains or losses will result.
Group Companies acquired during the year are included in the consolidation from the date on which control over the company is transferred to the Group. Group companies divested during the year are excluded from the consolida-tion as of the date the Group ceases to have control over the company. Intercompany balances and transactions (includ-ing unrealized profit on intercompany inventories) are eliminated in full.
Investments in associates and joint venturesInvestments in associates and joint ventures are accounted for using the equity method of accounting. Investment in associates are entities in which Sonova has a significant influence but does not exercise control (usually 20 % – 50 % of voting rights). Joint ventures are joint arrangements whereby two or more parties have rights to the net assets of the arrangement.
Under the equity method, the investment in an associ-ate / joint venture is initially recognized at cost (including goodwill on acquisition) and the carrying amount is increased or decreased to recognize Sonova’s share of profit or loss of the associate / joint venture after the acquisition date. When the Group’s share of losses in an associate / joint venture equals or exceeds its interest in the associate / joint venture, no further losses are recognized, unless there is a legal or constructive obligation. In order to apply the equity method the most recent available financial statements of an associate / joint venture are used, however due to practi-cability reasons the reporting dates might vary up to three months from the Group’s reporting date.
2. 3 Currency translation
The consolidated financial statements are expressed in Swiss francs (“CHF”), which is the Group’s presentation currency. The functional currency of each Group company is based on the local economic environment to which an entity is exposed, which is normally the local currency.
Transactions in foreign currencies are accounted for at the rates prevailing at the dates of the transactions. The result-ing exchange differences are recorded in the local income statements of the Group companies and included in net income.
Effects on the consolidated balance sheets
Consolidated balance sheets
1,000 CHF 31.03.2013 31.03.2013 31.03.2012 31.03.2012
Published Application of IAS 19 (revised)
Restated Published Application of IAS 19 (revised)
Restated
Deferred tax assets 117,397 (892) 116,505 98,020 (760) 97,260
Total non-current assets 1,615,108 (892) 1,614,216 1,519,080 (760) 1,518,320
Total assets 2,680,934 (892) 2,680,042 2,287,202 (760) 2,286,442
Long-term provisions 256,908 (825) 256,083 79,051 (692) 78,359
Other long-term liabilities 50,261 (5,989) 44,272 33,694 (5,029) 28,665
Total non-current liabilities 594,488 (6,814) 587,674 383,747 (5,721) 378,026
Total liabilities 1,045,596 (6,814) 1,038,782 811,324 (5,721) 805,603
Retained earnings and other reserves 1,594,136 5,922 1,600,058 1,468,063 4,961 1,473,024
Equity attributable to equity holders of the parent 1,606,895 5,922 1,612,817 1,474,125 4,961 1,479,086
Equity 1,635,338 5,922 1,641,260 1,475,878 4,961 1,480,839
Total liabilities and equity 2,680,934 (892) 2,680,042 2,287,202 (760) 2,286,442
Consolidated financial statements78
Sonova Annual Report 2013 / 14
Monetary assets and liabilities of Group companies which are denominated in foreign currencies are translated using year-end exchange rates. Exchange differences are recorded as an income or expense. Non-monetary assets and liabili-ties are translated at historical exchange rates. Exchange differences arising on intercompany loans that are consid-ered part of the net investment in a foreign entity are recorded in other comprehensive income in equity.
When translating foreign currency financial statements into Swiss francs, year-end exchange rates are applied to assets and liabilities, while average annual rates are applied to income statement accounts (see Note 5). Translation differ-ences arising from this process are recorded in other com-prehensive income in equity. On disposal of a Group company, the related cumulative translation adjustment is transferred from equity and included in the profit or loss from the disposal in the income statements.
2. 4 Accounting and valuation principles
Cash and cash equivalentsThis item includes cash on hand and cash at banks, bank overdrafts, term deposits and other short-term highly liquid investments with original maturities of three months or less. The consolidated cash flow statement summarizes the movements in cash and cash equivalents.
Other current financial assets Other current financial assets consist of financial assets held for trading as well as short-term loans to third parties. Market able securities within this category are classified as financial assets at fair value through profit or loss (see Note 2.5). Derivatives are classified as held for trading unless they are designated as hedges (see Note 2.6).
Assets in this category are classified as current assets if they are either held for trading or are expected to be realized within 12 months.
Trade receivablesTrade receivables are recorded at original invoice amount less provision made for doubtful accounts. A provision for doubtful accounts is recorded when there is objective evidence that the Group will not be able to collect all amounts due according to the original terms of the invoice. The amount of the provision is the difference between the carrying amount and the recoverable amount, being the present value of expected cash flows.
InventoriesPurchased raw materials, components and finished goods are valued at the lower of cost or net realizable value. To evaluate cost, the standard cost method is applied, which approxi-mates historical cost determined on a first-in first-out basis. Standard costs take into account normal levels of materials, supplies, labor, efficiency, and capacity utilization. Standard costs are regularly reviewed and, if necessary, revised in the light of current conditions. Net realizable value is the esti-mated selling price in the ordinary course of business less
the estimated costs of completion (where applicable) and selling expenses. Manufactured finished goods and work- in-process are valued at the lower of production cost or net realiz able value. Provisions are established for slow-moving, obsolete and phase-out inventory.
Property, plant and equipmentProperty, plant and equipment is valued at purchase or manu facturing cost less accumulated depreciation and any impairment in value. Depreciation is calculated on a straight-line basis over the expected useful lives of the individual assets or asset categories. Where an asset comprises several parts with different useful lives, each part of the asset is depreciated separately over its applicable useful life. The applicable useful lives are 25 – 40 years for buildings and 3 – 10 years for production facilities, machinery, equipment, and vehicles. Land is not depreciated. Leasehold improve-ments are depreciated over the shorter of useful life or lease term.
Subsequent expenditure on an item of tangible assets is capitalized at cost only when it is probable that future eco-nomic benefits associated with the item will flow to the Group and the cost of the item can be measured reliably. Expenditure for repair and maintenance which do not increase the estimated useful lives of the related assets are recognized as an expense in the period in which they are incurred.
LeasingThere are no assets that are held under leases which effec-tively transfer to the Group the risks and rewards of owner-ship (finance leases). Therefore all leases are classified as operating leases, and payments are recognized as an expense on a straight-line basis over the lease term unless another systematic basis is more representative of the time pattern of the Group’s benefit.
Intangible assetsPurchased intangible assets such as software, licences and patents, are measured at cost less accumulated amorti-zation (applying the straight-line method) and any impair-ment in value. Software is amortized over a useful life of 3 – 5 years. Intangibles relating to acquisitions of subsidi-aries (excluding goodwill) consist generally of technology, client relationships, customer lists, and brand names, and are amortized over a period of 3 – 15 years. Other intangible assets are generally amortized over a period of 3 – 10 years. For capitalized development costs amortization starts when the capitalized asset is ready for use, which is generally after receipt of approval from regulatory bodies. These assets are amortized over the estimated useful life of 2 – 7 years applying the straight-line method. For in-process capitalized development costs these capitalized costs are tested annually for impairment. Except for goodwill, the Sonova Group has no intangible assets with an indefinite useful life.
Research and developmentResearch costs are expensed as incurred. Development costs are capitalized only if the identifiable asset is com-mercially and technically feasible, can be completed, its
Consolidated financial statements 79
Sonova Annual Report 2013 / 14
costs can be measured reliably and will generate probable future economic benefits. Group expenditures which fulfill these criteria are limited to the development of tooling and equipment as well as costs relating to the development of cochlear implants. All other development costs are expensed as incurred. In addition to the internal costs (direct personnel and other operating costs, depreciation on research and development equipment and allocated occupancy costs), total costs also include externally con-tracted development work. Such capitalized intangibles are recognized at cost less accumulated amortization and impairment losses.
Business combinations and goodwillBusiness combinations are accounted for using the acqui-sition method of accounting. The cost of a business combi-nation is equal to the fair values, at the date of exchange, of assets given, liabilities incurred or assumed, and equity instruments issued by the Sonova Group, in exchange for control over the acquired company. Any difference between the cost of the business combination and the net fair value of the identifiable assets, liabilities, and contingent liabili-ties so recognized is treated as goodwill. Goodwill is not amortized, but is assessed for impairment annually, or more frequently if events or changes in circumstances indicate that its value might be impaired. Acquisition-related costs are expensed. For each business combination, the Group recognizes the non-controlling interests in the acquiree at fair value or at the non-controlling interests proportionate share in the recognized amounts of the acquiree’s identifiable net assets.
If a business combination is achieved in stages (control obtained over an associate), the previously held equity interest in an associate is remeasured to its acquisition-date fair value and any resulting gain or loss is recognized in “financial income / expenses” in profit or loss.
Other non-current financial assets Other non-current financial assets consist of investments in third parties and long-term receivables from associates and third parties. Investments in third parties are classified as financial assets at fair value through profit or loss and long-term receivables from associates and third parties are classified as loans and receivables (see Note 2.5).
Current financial liabilitiesCurrent financial liabilities consist of short-term bank debt and all other interest bearing debt with a maturity of 12 months or less. Given the short-term nature of these debts they are carried at nominal value. In addition, current financial liabilities also consist of financial liabilities result-ing from earn-out agreements as well as deferred payments from acquisitions with a maturity of 12 months or less. In the case of earn-outs, they are classified as financial liabilities at fair value through profit or loss.
ProvisionsProvisions are recognized when the Group has a present obligation (legal or constructive) as a result of a past event, where it is probable that an outflow of resources will be required to settle the obligation, and where a reliable
estimate can be made of the amount of the obligation. If the effect of the time value of money is material, provisions are determined by discounting the expected future cash flows.
The Group recognizes provisions for warranty costs to cover any costs arising from the warranty given on its products sold (including costs for legal proceedings and related costs). The provision is calculated using historical and pro-jected data on warranty rates, claim rates and amounts, service costs, remaining warranty period and number of hearing aids and implants on which the warranty is still active. Short-term portions of warranty provisions are reclassified to short-term provisions at each reporting date.
Non-current financial liabilitiesNon-current financial liabilities primarily consist of long-term bank debt with a maturity of over 12 months. Such financial liabilities are recognized initially at fair value, including any directly attributable transaction costs. Subse-quent to initial recognition these financial liabilities are measured at amortized cost using the effective interest method.
Share capitalOrdinary shares are classified as equity. Dividends on ordi-nary shares are recorded in equity in the period in which they are approved by the parent companies’ shareholders.
In the case any of the Group Companies purchases shares of the parent company, the consideration paid is recognized as treasury shares and presented as a deduction from equity. Any consideration received from the sale of own shares is recognized in equity.
Income taxesIncome taxes include current and deferred income taxes. The Sonova Group is subject to income taxes in numerous jurisdictions and significant judgement is required in deter-mining the worldwide provision for income taxes. The multi-tude of transactions and calculations implies estimates and assumptions. The Group recognizes liabilities based on estimates of whether additional taxes will be due.
Where the final tax outcome is different from the amounts that were initially recorded, such differences will impact the income tax and deferred tax provisions in the period in which such determination is made. Deferred tax is recorded on the valuation differences (temporary differences) be-tween the tax bases of assets and liabilities and their carry-ing values in the consolidated balance sheet. Deferred tax assets are recognized to the extent that it is probable that future taxable income will be available against which the temporary differences and tax losses can be offset.
A provision for non-recoverable withholding taxes is made only on anticipated dividend distributions from subsidi-aries. No provision is made in respect of possible future dividend distributions from undistributed earnings, as the parent is able to control the timing of the reversal of the temporary difference and such amounts are considered to be permanently reinvested.

Consolidated financial statements80
Sonova Annual Report 2013 / 14
Revenue recognitionSales are recognized net of sales taxes and discounts upon delivery of products and services and reasonably assured collectibility of the related receivables.
For hearing instruments sold, as standard industry practice, a trial period is granted to the end consumer. Probable returns of products are estimated and a corresponding pro-vision is recognized. The portion of goods sold that are expected to be returned are estimated based on historical product return rates. For cochlear implants, sales are gener-ally recognized upon delivery to the hospital.
Sales of service contracts, such as long-term service con-tracts and extended warranties are separated from the sale of goods and recognized on a straight-line basis over the term of the contract.
Interest income is recognized on a time proportion basis using the effective interest method. Dividend income is rec-ognized when the right to receive payment is established.
Acquisition-related amortizationThe Group is continuously amending its business portfolio with small acquisitions resulting in acquisition-related intangibles (see section “Intangible Assets”) and related amortization charges. The Group discloses acquisition-related amortization as a separate line item in the income statement, and identifies EBITA, in line with the Group inter-nal reporting to the CEO, as its key profit metric (refer to Note 6). The functional allocation of these acquisition-related amortization costs are further disclosed in Note 20 “Intangible Assets” in the notes to the financial statements.
Segment reportingOperating segments are defined on the same basis as infor-mation is provided to the chief operating decision maker. For the Sonova Group, the Chief Executive Officer (CEO) is the chief operating decision maker, who is responsible for allocating resources and assessing the performance of oper-ating segments. Additional general information regarding the factors used to identify the entity’s reportable segments are disclosed in Note 6.
Impairment of non-financial assetsThe Group assesses at each reporting date whether there is any indication that an asset may be impaired. If any such indication exists, the recoverable amount of the asset is estimated. The recoverable amount of an asset or, where it is not possible to estimate the recoverable amount of an individual asset, a cash-generating unit is the higher of its fair value less cost of disposal and its value in use. Value in use is the present value of the future cash flows expected to be derived from an asset or cash-generating unit. If the recoverable amount is lower than the carrying amount, an impairment loss is recognized. Impairment of financial assets is described in Note 2.5, Financial assets. For the purpose of impairment testing, goodwill as well as corpo-rate assets are allocated to cash generating units. A good-will impairment test is performed annually, even if there is no indication of impairment (see section “Business combi-nations and goodwill”).
Related partiesA party is related to an entity if the party directly or indi-rectly controls, is controlled by, or is under common control with the entity, has an interest in the entity that gives it significant influence over the entity, has joint control over the entity or is an associate or a joint venture of the entity. In addition, members of the Board of Directors and the Management Board or close members of their families are also considered related parties as well as post-employ-ment plan organizations (pension funds) for the benefit of Sonova employees. No related party exercises control over the Group.
Employee benefitsPension obligations Most employees are covered by post-employment plans sponsored by corresponding Group companies in the Sonova Group. Such plans are mainly defined contribution plans (future benefits are determined by reference to the amount of contributions paid) and are generally administered by autonomous pension funds or independent insurance com-panies. These pension plans are financed through employer and employee contributions. The Group’s contributions to defined contribution plans are charged to the income state-ment in the year to which they relate.
Sonova Group also has several defined benefit pension plans, both funded and unfunded. Accounting and reporting of these plans are based on annual actuarial valuations. Defined benefit obligations and service costs are assessed using the projected unit credit method: the cost of providing pensions is charged to the income statement so as to spread the regular cost over the service lives of employees partici-pating in these plans. The pension obligation is measured as the present value of the estimated future outflows using interest rates of government securities which have terms to maturity approximating the terms of the related liability. Service costs from defined benefit plans are charged to the appropriate income statement heading within the operating results.
A single net interest component is calculated by applying the discount rate to the net defined benefit asset or liability. The net interest component is recognized in the income statement in the financial result.
Actuarial gains and losses, resulting from changes in actua-r ial assumptions and differences between assumptions and actual experiences, are recognized in the period in which they occur in other comprehensive income in equity.
Other long-term benefitsOther long-term benefits mainly comprise length of service compensation benefits in certain Group companies. These benefits are accrued and the corresponding liabilities are included under “Other provisions”.
Equity compensation benefitsThe Board of Directors of Sonova Holding AG, the Manage-ment Board, and certain management and senior employees of other Group companies participate in equity compensa-tion plans. The fair value of all equity compensation awards

Consolidated financial statements 81
Sonova Annual Report 2013 / 14
granted to employees is determined at the grant date and recorded as an expense over the vesting period (for details refer to Note 31). The expense for equity compen-sation awards is charged to the appropriate income state-ment heading within the operating result and an equiva- lent increase in equity (for equity-settled compensation) or financial liability (for cash-settled compensation) is recorded.
2. 5 Financial assets
Sonova classifies its financial assets in the categories finan-cial assets at fair value through profit or loss, loans and receivables. Management determines the classification of its investments at initial recognition. All purchases and sales are recognized on the settlement date.
Financial assets at fair value through profit or lossFinancial assets at fair value through profit or loss consist of cash-settled calls on Sonova shares as a hedge against obli-gations from warrant appreciation rights (WARs) and share appreciation rights (SARs) allocated to US employees participating in the Executive Equity Award Plan (EEAP) and certain minority investments in hearing aid related busi-nesses. These financial assets are measured at their fair value. Those fair value changes are included in the profit or loss for the period in which they arise.
Loans and receivables Loans and receivables are non-derivative financial assets with fixed or determinable payments that are not quoted in an active market. They arise when the Group provides money, goods or services, directly to a debtor with no intention of trading the receivable. They are included in current assets, except for maturities of more than 12 months, these are classified as non-current assets. Loans are measured at amortized cost. Amortized cost is the amount at which the financial asset is measured at initial recognition minus prin-cipal repayments, plus or minus the cumulative amortization using the effective interest method of any difference between the initial amount and the maturity amount, minus any reduc-tion for impairment or uncollectibility. The effective interest method is a method calculating the amortized cost of a financial asset and allocating the interest income over the relevant period. The effective interest rate is the rate that exactly discounts estimated future cash payments or receipts through the expected life of the financial instrument or, when appropriate, a shorter period to the net carrying amount of the financial asset.
Impairment of financial assetsA financial asset is impaired if its carrying amount is greater than its estimated recoverable amount. The Group assesses, at each balance sheet date, whether there is any objective evidence that a financial asset may be impaired. If any such evidence exists, the Group estimates the recoverable amount of that asset and recognizes any impairment loss in the income statement. If, in a subsequent period, the amount of the impairment loss decreases and the decrease can be objectively related to an event occurring after the
write-down, the write-down of the financial asset is reversed. The reversal will not result in a carrying amount of the financial asset that exceeds what the amortized cost would have been, had the impairment not been recognized, at the date the write-down of the financial asset is reversed. The amount of the reversal is included in profit or loss for the financial year.
2. 6 Derivative financial instruments and hedging
The Group regularly hedges its net exposure from foreign currency balance sheet positions with forward contracts and options. Such contracts are not qualified as cash flow hedges and are therefore not accounted for using hedge accounting. Gains and losses on these transactions are recognized directly in the income statement. The forward and option contracts are entered into and closed within the half-year reporting periods.
In connection with the acquisition of Advanced Bionics, the Group entered into an interest swap agreement to protect the company against rising interest rates. The agreement qualified for hedge accounting for most of the financial year 2013 / 14, and the gain or loss on the hedging instrument was recognized in other comprehensive income in equity. In March 2014 most of the underlying debt relating to this transaction has been paid back and the swap agreement has been adapted accordingly (for further information refer Note 22).
2. 7 Significant accounting judgements and estimates
Key management judgements made in applying accounting policiesIn the process of applying the Group’s accounting policies, management may be required to make judgements, apart from those involving estimates, which have an effect on the amounts recognized in the financial statements.
These include, but are not limited to, the following areas:
Capitalization of development costsAs outlined under 2.4 “Accounting and valuation principles” the Group capitalizes costs relating to the development of cochlear implants. In determining the commercial as well as the technical feasibility, management judgement may be required.
Business combinations and transactions with minoritiesIn the course of recognizing assets and liabilities from busi-ness combinations or transactions with minorities, manage-ment judgements might be required for the following areas:– Acquisition-related intangibles resulting from technology,
customer relationships, client lists or brand names.– Contingent consideration arrangements.
Key accounting estimates and assumptionsPreparation of financial statements in conformity with IFRS requires management to make estimates and assumptions

Consolidated financial statements82
Sonova Annual Report 2013 / 14
that affect the reported amounts of assets, liabilities, revenue, expenses, and related disclosures. This includes estimates and assumptions in the ordinary course of busi-ness as well as non-operating events such as the outcome of pending legal disputes. The estimates and assumptions are continuously evaluated and are based on experience and other factors, including expectations of future events that are believed to be reasonable. Actual results may differ from these estimates and assumptions. The main estimates and assumptions with the potential of causing an adjustment, are discussed below.
Cost of business combinationsA business combination agreement may provide for an adjustment to the cost of the combination contingent on future events. If the future events do not occur or the estimate needs to be revised, the cost of a business combination is revised accordingly, with a resultant change in the carrying value of goodwill (for business combinations entered into before April 1, 2010) or in the income statement (for business combinations entered into after April 1, 2010). At the end of the financial year 2013 / 14 such liabilities contingent on future events amount to CHF 8.5 million (pre-vious year CHF 12.6 million) and are disclosed under other provisions (for business combinations entered into before April 1, 2010) or other financial liabilities (for business combinations entered into after April 1, 2010).
Intangible assets, including goodwill The Group has intangible assets with a carrying value of CHF 1,161.1 million (previous year CHF 1,199.8 million) as disclosed in Note 20.
Included in the intangible assets is goodwill in the amount of CHF 920.6 million (previous year CHF 953.6 million).
Furthermore intangible assets also include capitalized development costs in the amount of CHF 76.8 million (pre-vious year CHF 59.6 million). The Group determines annually, in accordance with the accounting policy stated in Note 2.4, whether any of the assets are impaired. For the impairment tests, estimates are made of the expected future cash flows from the use of the asset or cash-generating unit. The actual cash flows could vary significantly from these estimates.
Deferred tax assetsThe consolidated balance sheet includes deferred tax assets of CHF 94.1 million (previous year CHF 116.5 million) related to deductible differences and, in certain cases, tax loss carry forwards, provided that their utilization appears prob-able. The recoverable value is based on forecasts of the cor-responding taxable Group company over a period of several years. As actual results may differ from these forecasts, the deferred tax assets may need to be adjusted accordingly.
Employee benefit plansThe Sonova Group has various employee benefit plans. Most of its salaried employees are covered by these plans, of which some are defined benefit plans. The present value of the defined benefit obligations at the end of the financial
period 2013 / 14 amounts to CHF 269.1 million (previous year CHF 242.9 million) as disclosed in Note 30. This includes CHF 265.6 million (previous year CHF 239.5 million) from the Swiss pension plan. With such plans, actuarial assumptions are made for the purpose of estimating future developments, including estimates and assumptions relat-ing to discount rates, and future wage as well as pension trends. Actuaries also use statistical data such as mortality tables and staff turnover rates with a view to determining employee benefit obligations. If these factors change due to a change in economic or market conditions, the subsequent results could deviate considerably from the actuarial reports and calculations. Over the medium term such deviations could have an impact on the equity. The carrying amounts of the plan assets and liabilities in the balance sheet together with a sensitivity analysis considering changes for the main input parameters in the actuarial valuation are set out in Note 30.
Provisions for warranty and returnsOn March 31, 2014 the Group recorded provisions for warranty and returns of CHF 72.2 million (previous year CHF 72.2 million) as disclosed in Note 21.
The calculation of these provisions is based on turnover, past experience and projected number and cost of warranty claims and returns. The actual costs for warranty, claims, and returns may differ from these estimates.
Provision for product liabilitiesOn April 16, 2013 Advanced Bionics was confronted with a verdict of the Kentucky Western District Court. A case was brought by a patient whose cochlear implant malfunctioned as a result of moisture ingress. The device in question was part of a voluntary recall issued by Advanced Bionics in March 2006. A jury awarded the plaintiff, Sadler, unexpect-edly high damages, including punitive damages, totaling USD 7.25 million. On April 26, 2013 the Group informed that its US subsidiary Advanced Bionics LLC decided to appeal the verdict of the Kentucky Western District Court. In the light of the verdict, Sonova reassessed its provision for such claims and decided to increase the provision by CHF 197.8 million to CHF 249.5 million as per the end of the financial year 2012 / 13. The respective cost have been considered and were included in the annual income statement 2012 / 13 in the line “Other expenses, net”.
On October 21, 2013 Sonova Holding AG announced that its US subsidiary Advanced Bionics LLC had signed settlement agreements regarding the majority of then-current filed and unfiled product liability claims related to cochlear implant malfunctions, including the case of Sadler v. Advanced Bionics. The parties agreed to keep the settlement terms confidential. As the terms of the settlements were in line with the underlying assumptions of the provision for such product liability claims, this settlement did not have an impact on the profit or loss for the financial year 2013 / 14.
On March 31, 2014 the provision for product liabilities was CHF 192.0 million (previous year CHF 249.5 million).

Consolidated financial statements 83
Sonova Annual Report 2013 / 14
As of the end of the financial year 2013 / 14 the develop-ment of liabilities is fully in line with the assumptions of the provision and thus no further cost for liabilities were recognized in the profit and loss in the period ending March 31, 2014.
The calculation of this provision is based on past experience and the expected number and cost of existing and future claims. As actual results may differ from these forecasts, the respective provision may need to be adjusted accordingly.
3. Changes in Group structure
In the financial years 2013 / 14 and 2012 / 13 the Group entered into several business combinations which were individually not significant. The companies acquired are in the business of distributing hearing instruments.
The effect of the acquisitions for the financial year 2013 / 14 and 2012 / 13 is disclosed in Note 28.
On February 22, 2013 Sonova Holding AG announced that Boots UK Limited, the UK’s leading pharmacy-led health and beauty retailer and member of Alliance Boots, acquired a 49 % minority stake in David Ormerod Hearing Centres, a company owned 100 % by the Sonova Group. As the change in ownership interest did not result in a loss of control, the sale was accounted as an equity transaction.
On October 10, 2012 Sonova Holding AG announced the potential reorganization of AB Sarl in Rixheim France, which then employed 47 people. Since October 2012 the plans have further developed and substantiated. Restructuring costs have been considered and were included in the annual income statement 2012 / 13 in the line “Other expenses, net”. As of the end of the financial year 2013 / 14, the reor-ganization was still ongoing, but no further reorganization costs were recognized in profit or loss in the period ending March 31, 2014.

Consolidated financial statements84
Sonova Annual Report 2013 / 14
4. Number of employees
At March 31, 2014, the Sonova Group employed the full time equivalent of 9’529 people (previous year 8,952). They were engaged in the following regions and activities:
By region 31.3.2014 31.3.2013
Switzerland 1,189 1,127
EMEA (excl. Switzerland) 2,531 2,377
Americas 3,451 3,304
Asia / Pacific 2,358 2,144
Total 9,529 8,952
By activity
Research and development 617 567
Operations 3,675 3,447
Sales and marketing, general and administration 5,237 4,938
Total 9,529 8,952
The average number of employees (full time equivalents) of the Sonova Group for the year was 9,175 (previous year 8,709). Total personnel expenses for the financial year 2013/ 14 amounted to CHF 675.2 million (previous year CHF 635.3 million – restated following the implementation of IAS 19 (revised), refer Note 2.1).
5. Exchange rates
The following main exchange rates were used for currency translation:
31.3.2014 31.3.2013 2013 / 14 2012 / 13
Year-end rates Average rates for the year
AUD 1 0.82 0.99 0.86 0.97
BRL 1 0.39 0.47 0.41 0.47
CAD 1 0.80 0.94 0.87 0.94
CNY 1 0.14 0.15 0.15 0.15
EUR 1 1.22 1.22 1.23 1.21
GBP 1 1.48 1.44 1.46 1.48
JPY 100 0.86 1.01 0.92 1.14
USD 1 0.89 0.95 0.92 0.94

Consolidated financial statements 85
Sonova Annual Report 2013 / 14
6. Segment information
Segment information by business segmentsSince the acquisition of Advanced Bionics as of December 30, 2009, the Group is active in the two business segments cochlear implants and hearing instruments, which are reported separately to the Group’s chief operating decision maker (i.e. Chief Executive Officer). The financial information that is provided to the Group’s chief operating decision maker, which is used to allocate resources and to assess the performance, is primarily based on the sales analysis (by product groups and regions) as well as the consolidated income statements, balance sheets and cash flow statements for the individual segments.
Hearing instruments: This operating segment includes the companies that are active in the design, development, manufacture, distribution and service of hearing instruments and related products. Research and development is centralized in Switzerland while some ac-tivities are also performed in Canada. Production of hearing instruments is concentrated in three production centers in Switzerland, China, and Vietnam. Technologically advanced production processes are performed in Switzerland, whereas standard assembly of products is conducted in Asia. Most of the marketing activities are steered by the brand marketing departments in Switzerland, Canada, and the United States. The execution of marketing campaigns lies with the sales organizations in each market. The distribution of products is effected through sales organizations in the individual markets. The distribution channels of the Group in the individual markets vary depending on the sales strategy and the char-acteristics of the countries.
Cochlear implants: This operating segment includes the companies that are active in the design, development, manufacture, distribution and service of hearing implants and re-lated products. The segment consists of Advanced Bionics and the related sales organiza-tions, which were acquired as of December 30, 2009 and which provide cochlear implant systems. Research and development as well as marketing activities of Advanced Bionics are predominantly centralized in the United States and Switzerland while production resides in the United States. The distribution of products is effected through sales organizations in the individual markets.
1,000 CHF 2013 / 14 2012 / 131) 2013 / 14 2012 / 131) 2013 / 14 2012 / 13 2013 / 14 2012 / 131)
Hearing instruments
Cochlear implants
Corporate / Eliminations
Total
Segment sales 1,759,039 1,648,827 195,551 146,818 1,954,590 1,795,645
Intersegment sales (3,039) (298) (239) (85) (3,278) (383)
Sales 1,756,000 1,648,529 195,312 146,733 1,951,312 1,795,262
Operating profit before acquisition-related amortization (EBITA) 417,267 383,575 12,842 (199,287) (2,600) 430,109 181,688
Segment assets 2,153,213 2,100,373 522,506 529,238 (597,697) (520,179) 2,078,022 2,109,432
Unallocated assets2) 515,726 570,610
Total assets 2,593,748 2,680,042
1) Restated following the implementation of IAS 19 (revised), refer Note 2.1.2) Unallocated assets include cash and cash equivalents, other current financial assets (excluding loans),
investments in associates / joint ventures, employee benefit assets and deferred tax assets.

Consolidated financial statements86
Sonova Annual Report 2013 / 14
Reconciliation of reportable segment profit 1,000 CHF 2013 / 14 2012 / 131)
EBITA (as per segment reporting) 430,109 181,688
Acquisition-related amortization (26,079) (26,129)
Financial costs, net (9,441) (9,203)
Share of (loss) / gain in associates / joint ventures (11) 2,105
Income before taxes 394,578 148,461
1) Restated following the implementation of IAS 19 (revised), refer Note 2.1.
Entity-wide disclosures
Sales by product groups 1,000 CHF 2013 / 14 2012 / 13
Premium hearing instruments 433,174 393,336
Advanced hearing instruments 437,552 434,530
Standard hearing instruments 556,013 495,904
Wireless communication systems 68,278 64,159
Miscellaneous 260,983 260,600
Total hearing instruments 1,756,000 1,648,529
Cochlear implants and accessories 195,312 146,733
Total sales 1,951,312 1,795,262
Sales and selected non-current assets by regions 1,000 CHF 2013 / 14 2012 / 13 2013 / 14 2012 / 13
Country
Sales 1) Selected non-current
assets2)
Switzerland 26,425 27,454 245,986 236,676
EMEA (excl. Switzerland) 768,615 678,041 360,593 331,409
USA 726,722 671,385 609,836 653,229
Americas (excl. USA) 224,094 222,346 130,548 152,940
Asia / Pacific 205,456 196,036 88,807 93,425
Total Group 1,951,312 1,795,262 1,435,770 1,467,679
1) Sales based on location of customers.2) Total of property, plant & equipment, intangible assets and investments in associates / joint ventures.
As common in this industry, the Sonova Group has a large number of customers. There is no single customer who accounts for more than 10 % of total sales.
7. Other income / expenses, net
Other expenses in the financial year 2012 / 13 of CHF 203.6 million consist of an increase in provision for product liabilities, cost for the out-of-court settlement with a group of investors and for the announced restructuring of the Rixheim (France) establishment of Advanced Bionics.
The provision for product liabilities was reassessed and increased (CHF 197.8 million) in the light of the verdict of the Kentucky Western District Court in the 2012 / 13 results. For further information refer to Note 2.7 “Provision for product liabilities” and Note 21 “Provisions”.
The settlement with a group of investors was announced in October 2012 and charges of CHF 2.6 million were debited to the result of 2012 / 13.

Consolidated financial statements 87
Sonova Annual Report 2013 / 14
8. Financial expenses, net1,000 CHF 2013 / 14 2012 / 131)
Interest income 2,130 2,607
Other financial income 3,260 1,044
Total financial income 5,390 3,651
Interest expenses (7,641) (5,917)
Other financial expenses (7,190) (6,937)
Total financial expenses (14,831) (12,854)
Total (9,441) (9,203)
1) Restated following the implementation of IAS 19 (revised), refer Note 2.1.
Other financial income in 2013 / 14 primarily includes the gain from remeasuring previ-ously held equity investments to fair value at date of acquisition of these companies.
Other financial expenses include, amongst other items, the unwinding of the discount on provisions and earn-out payments, fair value adjustments of financial instruments as well as the costs for entering into forward foreign currency contracts.
9. Taxes1,000 CHF 2013 / 14 2012 / 131)
Income taxes 28,217 45,215
Change in deferred taxes 18,979 (7,623)
Total tax expense 47,196 37,592
Reconciliation of tax expense
Income before taxes 394,578 148,461
Weighted average expected tax rate 13.5% 13.6%
Tax at weighted average rate 53,313 20,206
+/− Effects of
Expenses not subject to tax, net 3,256 1,463
Changes of unrecognized loss carryforwards / deferred tax assets 25,853 82,878
Local actual tax rate different to Group's expected average tax rate (39,502) (62,866)
Change in tax rates on deferred tax balances 80 (6,644)
Prior year adjustments and other items, net 4,196 2,555
Total tax expense 47,196 37,592
Weighted average effective tax rate 12.0% 25.3%
1) Restated following the implementation of IAS 19 (revised), refer Note 2.1.
The weighted-average expected tax rate is the aggregate obtained by applying the ex-pected tax rate for each individual jurisdiction to its respective result before taxes.

Consolidated financial statements88
Sonova Annual Report 2013 / 14
Deferred tax assets and (liabilities) 1,000 CHF 31.3.2014
Property, plant & equipment
Intangible assets
Inventories, receivables,
provisions and other liabilities
Tax loss carryforwards
Total
Balance April 1 (5,182) (20,232) 44,278 52,092 70,956
Changes through business combinations (2,699) 6 (2,693)
Deferred taxes recognized in the income statement (860) 8,947 (19,555) (7,511) (18,979)
Deferred taxes recognized in OCI1) (188) (188)
Exchange differences (88) 1,181 3,701 7,811 12,605
Balance March 31 (6,130) (12,803) 28,236 52,398 61,701
Amounts in the balance sheet
Deferred tax assets 94,102
Deferred tax liabilities (32,401)
Total deferred taxes, net 61,701
1) Other comprehensive income.
Deferred tax assets and (liabilities) 1,000 CHF 31.3.2013
Property, plant& equipment
Intangible assets
Inventories, receivables,
provisions and other liabilities1)
Tax loss carryforwards
Total1)
Balance April 1 (6,842) (23,404) 32,219 65,844 67,817
Changes through business combinations (1,115) (1,115)
Deferred taxes recognized in the income statement 1,723 1,119 15,581 (10,800) 7,623
Deferred taxes recognized in OCI2) 1,940 1,940
Exchange differences (63) 3,168 (5,462) (2,952) (5,309)
Balance March 31 (5,182) (20,232) 44,278 52,092 70,956
Amounts in the balance sheet
Deferred tax assets 116,505
Deferred tax liabilities (45,549)
Total deferred taxes, net 70,956
1) Restated following the implementation of IAS 19 (revised), refer Note 2.1.2) Other comprehensive income.
Deferred tax assets have been capitalized based on the projected future performance of the Group companies.
The gross values of unused tax loss carryforwards, which have not been capitalized as deferred tax assets, with their expiry dates are as follows:
1,000 CHF 31.3.2014 31.3.2013
Within 1 – 3 years 12,244 22,979
Within 4 years 11,097 16,763
Within 5 years 24,515 31,066
More than 5 years 347,671 206,068
Total 395,527 276,876

Consolidated financial statements 89
Sonova Annual Report 2013 / 14
Tax loss carryforwards which have not been capitalized also include pre-acquisition tax losses with limitation of use and losses which do not qualify for capitalization. The inherent uncertainty regarding the level and use of such tax losses, and changes in tax regulations and laws can impact the annual assessment of these unused tax loss carryforwards. The legal re-organization of certain US entities together with the clarification of future use of tax loss carryforwards, resulted in an increase in not capitalized tax loss carryforwards.
10. Earnings per share
Basic earnings per share are calculated by dividing the income after taxes attributable to the ordinary equity holders of the parent company by the weighted average number of shares outstanding during the year.
Basic earnings per share 2013 / 14 2012 / 131)
Income after taxes (1,000 CHF) 340,830 109,749
Weighted average number of outstanding shares 67,128,869 66,661,813
Basic earnings per share (CHF) 5.08 1.65
1) Restated following the implementation of IAS 19 (revised), refer Note 2.1.
In the case of diluted earnings per share, the weighted average number of shares out standing is adjusted assuming all outstanding dilutive options will be exercised. The weighted aver-age number of shares is adjusted for all dilutive options issued under the stock option plans which have been granted in 2009 through to 2014 and which have not yet been exercised. Anti-dilutive options have not been considered. The calculation of diluted earnings per share is based on the same income after taxes for the period as is used in calculating basic earnings per share.
Diluted earnings per share 2013 / 14 2012 / 131)
Income after taxes (1,000 CHF) 340,830 109,749
Weighted average number of outstanding shares 67,128,869 66,661,813
Adjustment for dilutive share options 98,682 126,775
Adjusted weighted average number of outstanding shares 67,227,551 66,788,588
Diluted earnings per share (CHF) 5.07 1.64
1) Restated following the implementation of IAS 19 (revised), refer Note 2.1.
11. Dividend per share
The Board of Directors of Sonova Holding AG proposes to the Annual General Shareholders’ Meeting, to be held on June 17, 2014, that a dividend of CHF 1.90 shall be distributed. In the previous year a distribution from reserve from capital contributions of CHF 1.60 (free of Swiss withholding tax) per share was distributed (for further details refer to 2.4 “Summary of changes in shareholders’ equity” in the financial statements 2013 / 14 of Sonova Holding AG).
12. Cash and cash equivalents1,000 CHF 31.3.2014 31.3.2013
Cash on hand 711 779
Current bank accounts 382,423 392,852
Term deposits 26,870 41,135
Total 410,004 434,766

Consolidated financial statements90
Sonova Annual Report 2013 / 14
Bank accounts and term deposits are mainly denominated in CHF, EUR and USD.
For details of the movements in cash and cash equivalents refer to the consolidated cash flow statements.
13. Other current financial asset
Other current financial assets of CHF 4.0 million (previous year 4.6 million) primarily consist of short-term customer loans.
14. Trade receivables 1,000 CHF 31.3.2014 31.3.2013
Trade receivables 372,654 367,220
Provision for doubtful receivables (21,847) (27,531)
Total 350,807 339,689
As is common in this industry, the Sonova Group has a large number of customers. There is no significant concentration of credit risk. The aging of trade receivables and related provisions is as follows:
1,000 CHF 31.3.2014 31.3.2013
Total trade receivables, net 350,807 339,689
of which:
Not overdue 249,751 241,207
Overdue 1 – 30 days 50,868 47,498
Overdue more than 30 days 50,188 50,984
Total 350,807 339,689
Provision for doubtful receivables is established based on individual adjustments and past experience. The charges to the income statement are included in general and admini-stration costs. The following table summarizes the movements in the provision for doubt-ful receivables:
1,000 CHF 2013 / 14 2012 / 13
Provision for doubtful receivables, April 1 (27,531) (17,725)
Utilization or reversal 11,660 2,792
Additions (7,250) (11,693)
Changes through business combinations (344) (267)
Exchange differences 1,618 (638)
Provision for doubtful receivables, March 31 (21,847) (27,531)
During 2013 /14 the Group has utilized CHF 8.2 million (previous year CHF 2.0 million) of this provision to write-off receivables.
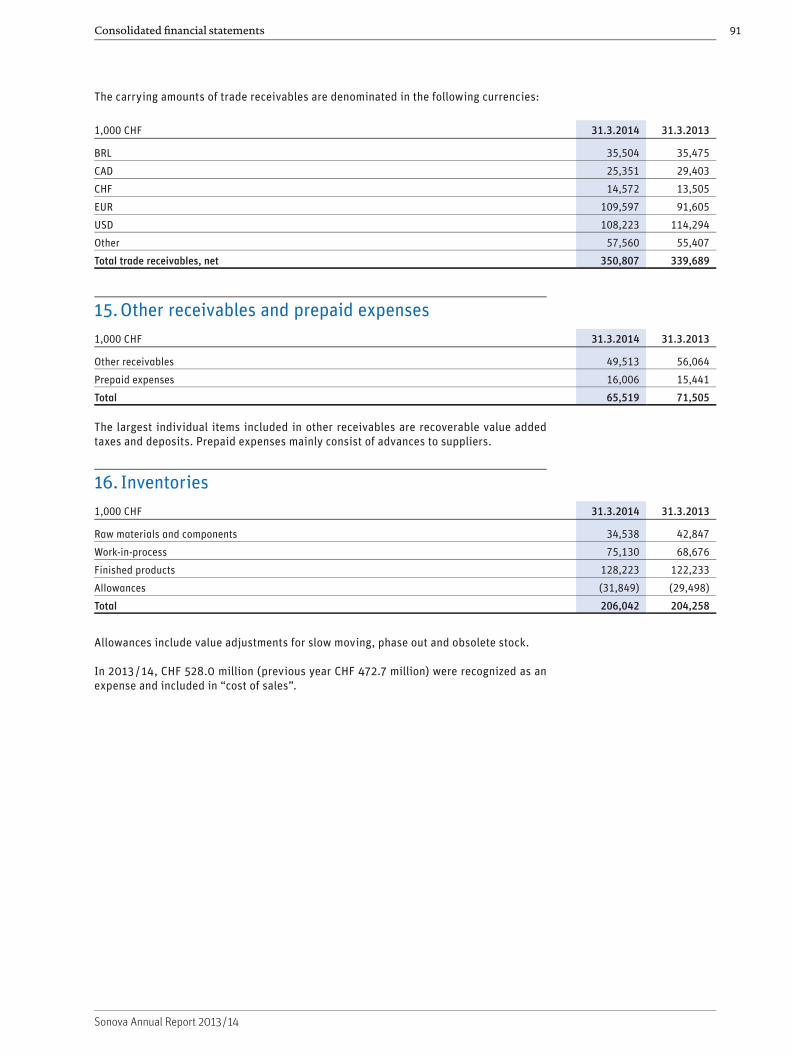
Consolidated financial statements 91
Sonova Annual Report 2013 / 14
The carrying amounts of trade receivables are denominated in the following currencies:
1,000 CHF 31.3.2014 31.3.2013
BRL 35,504 35,475
CAD 25,351 29,403
CHF 14,572 13,505
EUR 109,597 91,605
USD 108,223 114,294
Other 57,560 55,407
Total trade receivables, net 350,807 339,689
15. Other receivables and prepaid expenses 1,000 CHF 31.3.2014 31.3.2013
Other receivables 49,513 56,064
Prepaid expenses 16,006 15,441
Total 65,519 71,505
The largest individual items included in other receivables are recoverable value added taxes and deposits. Prepaid expenses mainly consist of advances to suppliers.
16. Inventories1,000 CHF 31.3.2014 31.3.2013
Raw materials and components 34,538 42,847
Work-in-process 75,130 68,676
Finished products 128,223 122,233
Allowances (31,849) (29,498)
Total 206,042 204,258
Allowances include value adjustments for slow moving, phase out and obsolete stock.
In 2013 / 14, CHF 528.0 million (previous year CHF 472.7 million) were recognized as an expense and included in “cost of sales”.

Consolidated financial statements92
Sonova Annual Report 2013 / 14
17. Property, plant and equipment1,000 CHF 31.3.2014
Land & buildings
Machinery & technical
equipment
Room installations &
other equipment
Advance payments &
assets under construction
Total
Cost
Balance April 1 169,723 196,857 135,137 4,840 506,557
Changes through business combinations 198 1,803 2,001
Additions 3,188 22,016 29,339 10,368 64,911
Disposals (572) (12,863) (8,425) (240) (22,100)
Transfers 1,388 903 (2,291)
Exchange differences (2,705) (6,036) (5,668) (172) (14,581)
Balance March 31 169,634 201,560 153,089 12,505 536,788
Accumulated depreciation
Balance April 1 (47,552) (136,550) (73,884) (257,986)
Additions (5,050) (21,326) (17,016) (43,392)
Disposals 136 12,077 7,369 19,582
Exchange differences 1,240 3,776 3,072 8,088
Balance March 31 (51,226) (142,023) (80,459) (273,708)
Net book value
Balance April 1 122,171 60,307 61,253 4,840 248,571
Balance March 31 118,408 59,537 72,630 12,505 263,080
1,000 CHF 31.3.2013
Land & buildings
Machinery & technical
equipment
Room installations &
other equipment
Advance payments &
assets under construction
Total
Cost
Balance April 1 161,603 178,723 114,941 4,276 459,543
Changes through business combinations 34 776 656 1,466
Additions 7,434 20,106 16,677 2,993 47,210
Disposals (4,248) (3,507) (265) (8,020)
Transfers (1,430) 3,627 (2,197)
Exchange differences 652 2,930 2,743 33 6,358
Balance March 31 169,723 196,857 135,137 4,840 506,557
Accumulated depreciation
Balance April 1 (42,336) (116,656) (58,061) (217,053)
Additions (5,015) (22,443) (17,069) (44,527)
Disposals 3,860 3,055 6,915
Exchange differences (201) (1,311) (1,809) (3,321)
Balance March 31 (47,552) (136,550) (73,884) (257,986)
Net book value
Balance April 1 119,267 62,067 56,880 4,276 242,490
Balance March 31 122,171 60,307 61,253 4,840 248,571

Consolidated financial statements 93
Sonova Annual Report 2013 / 14
Property, plant and equipment as of March 31, 2014 were insured against fire for a value of CHF 492.0 million (previous year CHF 469.6 million).
Pledged fixed assets amounted to CHF 0.03 million (previous year CHF 0.03 million).
There are no assets held under finance leases.
18. Investments in associates / joint ventures
The Group’s share in the results as well as in assets and liabilities of associates / joint ventures, all unlisted enterprises, is as follows:
1,000 CHF 2013 / 14 2012 / 13
Current assets 642 6,218
Non-current assets 418 850
Total assets 1,060 7,068
Current liabilities (228) (2,134)
Non-current liabilities (310) (878)
Total liabilities (538) (3,012)
Net assets 522 4,056
Income for the year 4,785 12,863
Expenses for the year (3,721) (10,276)
Profit for the year 1,064 2,587
Net book value at year-end 11,620 19,339
Share of gain recognized by the Group (11) 2,105
In the financial year 2013 / 14, the Group acquired additional shares in three previously held equity investments, resulting in a change of control (step up acquisitions). Since the change of control, these companies are fully consolidated. The total net book value at the time of gaining control over these three entities amounted to CHF 6.2 million.
In the financial year 2013 / 14, the Group acquired two (previous year three) associates for a total purchase consideration of CHF 1.6 million (previous year CHF 2.7 million). The associ ates acquired are in the business of selling hearing instruments.
Sales to associates / joint ventures in the financial year 2013 / 14 amounted to CHF 10.2 million (previous year CHF 11.7 million). At March 31, 2014 trade receivables towards as-sociates / joint ventures amounted to CHF 4.8 million (previous year CHF 2.8 million).
At the end of the financial years 2013 / 14 and 2012 / 13, no material unrecognized losses existed.
Investments with a net book value of CHF 11.6 million (previous year CHF 19.3 million) have a business year different than the Sonova Group. The latest available information for the respective companies varies between December 2013 and February 2014.

Consolidated financial statements94
Sonova Annual Report 2013 / 14
19. Other non-current financial assets1,000 CHF 31.3.2014 31.3.2013
Financial assets at fair value through profit or loss 7,911 8,900
Loans to associates 4,943 9,944
Loans to third parties 7,749 11,188
Total 20,603 30,032
Financial assets at fair value through profit or loss mainly consist of minority interests in patent and software development companies specific to the hearing aid industry. Besides these non-controlling investments, financial assets at fair value through profit or loss also consists of warrants to hedge the financial exposure in connection with the employee share option program (refer to Note 31).
The loans are primarily denominated in CAD, EUR and USD. Loans to third parties consist mainly of loans to customers. As of March 31, 2014, the respective repayment periods vary between one and five years and the interest rates vary between 1 % and 5 %. Gener-ally, the valuation of the loans approximates to fair value.
20. Intangible assets1,000 CHF 31.3.2014
Goodwill Intangibles relating to
acquisitions
Capitalized development
costs
Software and other
intangibles
Total
Cost
Balance April 1 1,100,413 259,769 61,649 64,813 1,486,644
Changes through business combinations 28,417 12,683 3 41,103
Additions 7601) 917 23,889 5,118 30,684
Disposals (43)1) (655) (8,474) (9,172)
Exchange differences (72,374) (14,097) (53) (1,657) (88,181)
Balance March 31 1,057,173 258,617 85,485 59,803 1,461,078
Accumulated amortization and impairments
Balance April 1 (146,793) (93,575) (2,087) (44,420) (286,875)
Additions (26,079)2) (6,627) (7,002) (39,708)
Disposals 340 8,272 8,612
Exchange differences 10,179 6,607 1,177 17,963
Balance March 31 (136,614) (112,707) (8,714) (41,973) (300,008)
Net book value
Balance April 1 953,620 166,194 59,562 20,393 1,199,769
Balance March 31 920,559 145,910 76,771 17,830 1,161,070
1) Additions and disposals of goodwill include primarily earn-out adjustments.2) Relates to research and development (CHF 3.7 million) and sales and marketing (CHF 22.4 million).

Consolidated financial statements 95
Sonova Annual Report 2013 / 14
1,000 CHF 31.3.2013
Goodwill Intangibles relating to
acquisitions
Capitalized development
costs
Software and other
intangibles
Total
Cost
Balance April 1 1,035,445 234,442 33,336 57,549 1,360,772
Changes through business combinations 26,856 11,879 24 38,759
Additions 6,679 28,299 6,845 41,823
Disposals (5,786)1) (51) (501) (6,338)
Exchange differences 43,898 6,820 14 896 51,628
Balance March 31 1,100,413 259,769 61,649 64,813 1,486,644
Accumulated amortization and impairments
Balance April 1 (139,309) (65,523) (300) (35,050) (240,182)
Additions (26,129)2) (1,787) (9,214) (37,130)
Disposals 16 449 465
Exchange differences (7,484) (1,939) (605) (10,028)
Balance March 31 (146,793) (93,575) (2,087) (44,420) (286,875)
Net book value
Balance April 1 896,136 168,919 33,036 22,499 1,120,590
Balance March 31 953,620 166,194 59,562 20,393 1,199,769
1) Disposals of goodwill include primarily earn-out adjustments.2) Relates to research and development (CHF 3.7 million) and sales and marketing (CHF 22.4 million).
Intangibles relating to acquisitions consist primarily of technology, customer relation-ships, client lists, and brand names.
For the purpose of impairment testing, goodwill is allocated to the cash-generating unit, which is expected to benefit from the synergies of the corresponding business combination.
For the Group, a meaningful goodwill allocation can only be done at the level of the seg-ments, hearing instruments and cochlear implants. This also reflects the level that the goodwill is monitored by management.
For both of the two cash-generating units, the recoverable amount (higher of the cash-generating unit’s fair value less cost of disposal and the cash-generating units value in use) is compared to the carrying amount. Future cash flows are discounted with the Weighted Average Cost of Capital (WACC) including the application of the Capital Asset Pricing Model (CAPM). Value in use is normally assumed to be higher than the fair value less cost of disposal. Therefore, fair value less cost of disposal is only investigated when value in use is lower than the carrying amount of the cash-generating unit.
Based on the impairment tests performed, there was no need for the recognition of any impairment of goodwill for the financial years 2013 / 14 and 2012 / 13.
Hearing instrumentsAs of March 31, 2014, the carrying amount of the goodwill, expressed in various curren-cies, amounted to an equivalent of CHF 634.6 million (prior year CHF 646.4 million).
The cash flow projections were based on the most recent business plan approved by man-agement. The business plan for the hearing instruments business was projected over a five year period. Cash flows beyond the projection period were extrapolated with a long-term growth rate of 2.1 % (prior year 2.0 %) representing the projected inflation rate. For the calculation, a pre-tax weighted average discount rate of 9.9 % (prior year 9.3 %) was used.
An increase in the discount rate of 1 % would not result in an impairment of goodwill.

Consolidated financial statements96
Sonova Annual Report 2013 / 14
Cochlear implantsAs of March 31, 2014, the carrying amount of the goodwill, expressed in various currencies, amounted to an equivalent of CHF 286.0 million (prior year CHF 307.2 million).
The cash flow projections were based on the most recent business plan approved by man-agement. The business plan for the Cochlear implants business was projected over a seven year period which reflects the long-term development cycle of the implant business. Cash flows beyond the projection period were extrapolated with a long-term growth rate of 2.1 % (prior year 2.0 %) representing the projected inflation rate. For the calculation, a pre-tax weighted average discount rate of 10.2 % (prior year 9.7 %) was used.
An increase in the discount rate of 1 % would not result in an impairment of goodwill.
21. Provisions 1,000 CHF 31.3.2014
Warranty and returns
Reimbursement to customers
Product liabilities
Other Provisions
Total
Balance April 1 72,150 11,712 249,545 28,947 362,354
Changes through business combinations 20 595 615
Amounts used (48,463) (6,994) (43,382) (7,911) (106,750)
Reversals (337) (85) (1,169) (1,591)
Increases 53,152 6,820 5,397 65,369
Present value adjustments 1,794 1,794
Exchange differences (4,349) (748) (15,941) (1,670) (22,708)
Balance March 31 72,173 10,705 192,016 24,189 299,083
thereof short-term 55,225 10,705 26,613 8,966 101,509
thereof long-term 16,948 165,403 15,223 197,574
1,000 CHF 31.3.2013
Warranty and returns
Reimbursement to customers
Product liabilities
Other Provisions1)
Total1)
Balance April 1 65,899 9,317 48,847 45,857 169,920
Changes through business combinations 93 93
Amounts used (35,074) (5,061) (2,902) (17,558) (60,595)
Reversals (1,973) (7,459) (9,432)
Increases 41,073 7,144 197,766 7,914 253,897
Present value adjustments 508 508
Exchange differences 2,225 312 5,326 100 7,963
Balance March 31 72,150 11,712 249,545 28,947 362,354
thereof short-term 55,307 11,685 25,260 14,019 106,271
thereof long-term 16,843 27 224,285 14,928 256,083
1) Restated following the implementation of IAS 19 (revised), refer Note 2.1.
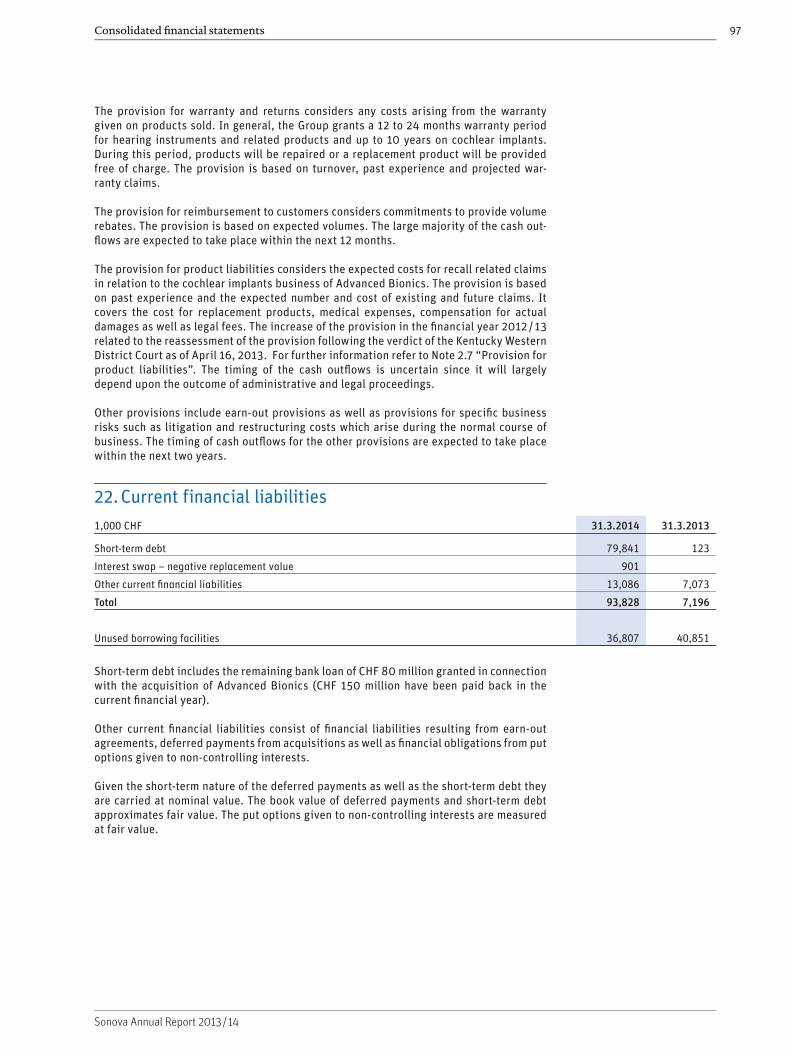
Consolidated financial statements 97
Sonova Annual Report 2013 / 14
The provision for warranty and returns considers any costs arising from the warranty given on products sold. In general, the Group grants a 12 to 24 months warranty period for hearing instruments and related products and up to 10 years on cochlear implants.During this period, products will be repaired or a replacement product will be provided free of charge. The provision is based on turnover, past experience and projected war-ranty claims.
The provision for reimbursement to customers considers commitments to provide volume rebates. The provision is based on expected volumes. The large majority of the cash out-flows are expected to take place within the next 12 months.
The provision for product liabilities considers the expected costs for recall related claims in relation to the cochlear implants business of Advanced Bionics. The provision is based on past experience and the expected number and cost of existing and future claims. It covers the cost for replacement products, medical expenses, compensation for actual damages as well as legal fees. The increase of the provision in the financial year 2012 / 13 related to the reassessment of the provision following the verdict of the Kentucky Western District Court as of April 16, 2013. For further information refer to Note 2.7 “Provision for product liabilities”. The timing of the cash outflows is uncertain since it will largely depend upon the outcome of administrative and legal proceedings.
Other provisions include earn-out provisions as well as provisions for specific business risks such as litigation and restructuring costs which arise during the normal course of business. The timing of cash outflows for the other provisions are expected to take place within the next two years.
22. Current financial liabilities1,000 CHF 31.3.2014 31.3.2013
Short-term debt 79,841 123
Interest swap – negative replacement value 901
Other current financial liabilities 13,086 7,073
Total 93,828 7,196
Unused borrowing facilities 36,807 40,851
Short-term debt includes the remaining bank loan of CHF 80 million granted in connection with the acquisition of Advanced Bionics (CHF 150 million have been paid back in the current financial year).
Other current financial liabilities consist of financial liabilities resulting from earn-out agreements, deferred payments from acquisitions as well as financial obligations from put options given to non-controlling interests.
Given the short-term nature of the deferred payments as well as the short-term debt they are carried at nominal value. The book value of deferred payments and short-term debt approximates fair value. The put options given to non-controlling interests are measured at fair value.

Consolidated financial statements98
Sonova Annual Report 2013 / 14
23. Other short-term liabilities1,000 CHF 31.3.2014 31.3.2013
Other payables 35,825 39,823
Accrued expenses 144,626 140,247
Deferred income 23,585 25,678
Total 204,036 205,748
Other payables include amounts to be remitted in respect of withholding taxes, value added taxes, social security payments, employees’ income taxes deducted at source, and customer prepayments. Accrued expenses include salaries, social expenses, vacation pay, bonus and incentive compensation as well as accruals for outstanding invoices from suppliers.
24. Non-current financial liabilities1,000 CHF 31.3.2014 31.3.2013
Bank debt 157 228,874
Interest swap – negative replacement value 6,201
Other non-current financial liabilities 4,494 6,695
Total 4,651 241,770
Bank debts as of March 31, 2013 related to the remaining bank loan of CHF 230 million granted in connection with the acquisition of Advanced Bionics (refer Note 25). The fair value of the bank debt amounted to CHF 235.1 million.
Other non-current financial liabilities consist of amounts due in relation to the share appreciation rights (SARs) and warrant appreciation rights (WARs) (refer to Note 31) as well as obligations in relation to earn-out agreements from acquisitions.
Analysis by currency 1,000 CHF 31.3.2014 31.3.2013
Bank debt Interest swap – negative
replacement value
Other non-current
financial liabilities
Total Bank debt Interest swap – negative
replacement value
Other non-current
financial liabilities
Total
CHF 1,812 1,812 228,706 6,201 965 235,872
USD 1,720 1,720 4,463 4,463
EUR 787 787 912 912
Other 157 175 332 168 355 523
Total 157 4,494 4,651 228,874 6,201 6,695 241,770
25. Risk management and financial instruments
Group risk managementRisk management at Group level is an integral part of business practice and supports the strategic decision-making process. The assessment of risk is derived from both “top-down” and “bottom-up” and covers corporate, all business segments, and all consolidated Group companies. This approach allows for the Group to examine all types of risk expo-sures caused by internal and by external impacts and events, from financial, operational processes, customer and products, management and staff. The risk exposures are managed

Consolidated financial statements 99
Sonova Annual Report 2013 / 14
by specific risk mitigating initiatives, frequent re-evaluations, communication, risk con-solidation and prioritization.
The responsibility for the process of risk assessment and monitoring is allocated to the corporate risk function. The Management Board, in addition to Group companies and func-tional managers, support the annual risk assessment and are responsible for the manage-ment of the risk mitigating initiatives. The Board of Directors discusses and analyzes the Group’s risks at least once a year in the context of a strategy meeting.
Financial risk managementDue to Sonova Group’s worldwide activities, the Group is exposed to a variety of financial risks such as market risks, credit risks and liquidity risks. Financial risk management aims to limit these risks and seeks to minimize potential adverse effects on the Group’s financial performance. The Group uses selected financial instruments for this purpose. They are exclusively used as hedging instruments for cash in- and outflows and not for speculative positions.
The fundamentals of Sonova Group’s financial risk policy are periodically reviewed by the Audit Committee and carried out by the Group finance department. Group finance is responsible for implementing the policy and for ongoing financial risk management.
Market riskExchange rate riskThe Group operates globally and is therefore exposed to foreign currency fluctuations, mainly with respect to the US dollar and the Euro. As the Group uses Swiss francs as pre-sentation currency and holds investments in different functional currencies, net assets are exposed to foreign currency translation risk. Additionally, a foreign currency transac-tion risk exists in relation to future commercial transactions which are denominated in a currency other than the functional currency.
To minimize foreign currency exchange risks, forward currency contracts and options are entered into. The Group hedges its net foreign currency exposure based on future expected cash in- and outflows. The hedges have a duration of between 1 and 6 months. No hedge accounting has been applied to these hedges, since they do not qualify for such treatment under IAS 39.
Positive replacement values from hedges which do not qualify for hedge accounting are recorded as financial assets at fair value through profit or loss whereas negative replace-ment values are recorded as financial liabilities at fair value through profit or loss.
As of March 31, 2014 and 2013, no forward currency contracts were open.
Foreign currency sensitivity analysisA 5 % strengthening / weakening of the following currencies against the Swiss franc as of March 31, 2014 and 2013 (for foreign currency rates refer to Note 5) would create an impact on income after taxes and equity as shown in the following table. The analysis assumes all other variables to remain constant.
1,000 CHF 2013 / 14 2012 / 13 2013 / 14 2012 / 13
Impact on income after
taxes
Impact on equity
Change in USD / CHF + 5 % 3,001 3,732 19,376 20,289
Change in USD / CHF – 5 % (3,001) (3,732) (19,376) (20,289)
Change in EUR / CHF + 5 % 3,841 4,247 8,383 11,541
Change in EUR / CHF – 5 % (3,841) (4,247) (8,383) (11,541)

Consolidated financial statements100
Sonova Annual Report 2013 / 14
Interest rate riskThe Group has only limited exposure to interest rate changes. CHF 390 million of the CHF 470 million loan, entered into in connection with the acquisition of Advanced Bionics, has already been repaid. For the remaining bank loan of CHF 80 million, the Group entered into a swap agreement that protects the Group against an increase in interest rates, as the floating interest rates are swapped against fixed rates. As of March 31, 2014, the negative fair value of the interest rate swap amounts to CHF 0.9 million and re presents the theo-retical replacement value. If interest rates had been 0.5 % lower /higher, the valuation of the swap would have changed by approximately CHF 0.3 million and the equity would have been CHF 0.3 million lower / higher.
The most substantial interest exposure on assets relates to cash and cash equivalents with an average interest-bearing amount for the financial year 2013 / 14 of CHF 424 million (previous year CHF 250 million). If interest rates during the financial year 2013 / 14 had been 1 % higher / lower on these accounts, income after taxes would have been CHF 4.2 million higher / lower (previous year CHF 2.5 million).
Other market risksRisk of price changes of raw materials or components used for production is limited. A change in those prices would not result in financial effects being above the Group’s risk management tolerance level. Therefore, no sensitivity analysis has been conducted.
Credit riskFinancial assets which could expose the Group to a potential concentration in credit risk are principally cash and bank balances, receivables from customers and loans.
Core banking relations are maintained with at least single “A-” rated (S & P) financial insti-tutions (as of March 31, 2014, the largest balance with a single counterparty amounted to 28 % of total cash and cash equivalents). The Group performs continuous credit checks on its receivables. Due to the customer diversity there is no single credit limit for all customers, however the Group assesses its customers taking into account their financial position, past experience, and other factors. Due to the fragmented customer base (no single customer balance is greater than 10 % of total trade accounts receivable), the Group is not exposed to any significant concentration risk. The same applies to loans to third and related parties.
The Group does not expect any significant losses either from receivables or from other financial assets.
Liquidity riskGroup finance is responsible for centrally managing the net cash / debt position and to ensure that the Group’s obligations can be settled on time. The Group aims to grow further and wants to remain flexible in making time-sensitive investment decisions. This overall objective is included in the asset allocation strategy. A rolling forecast based on the expected cash flows is conducted and updated regularly to monitor and control liquidity, to ensure that the financial covenants are met and to ensure the contractual repayment of the bank debt. As of March 31, 2014, the covenants are met.

Consolidated financial statements 101
Sonova Annual Report 2013 / 14
The following table summarizes the contractual maturities of financial liabilities as of March 31, 2014 and 2013:
1,000 CHF 31.3.2014
Due less than 3 months
Due 3 months to
1 year
Due 1 year to 5 years
Due more than 5 years
Total
Short-term debt 54 79,787 79,841
Interest swap – negative replacement value 901 901
Other current financial liabilities 13,086 13,086
Trade payables and other short-term liabilities 162,276 46,182 208,458
Total current financial liabilities 162,330 139,956 302,286
Long-term bank debt 116 41 157
Other non-current financial liabilities 4,494 4,494
Total non-current financial liabilities 4,610 41 4,651
Total financial liabilities 162,330 139,956 4,610 41 306,937
1,000 CHF 31.3.2013
Due less than 3 months
Due 3 months to
1 year
Due 1 year to 5 years
Due more than 5 years
Total
Short-term debt 123 123
Other current financial liabilities 209 6,864 7,073
Trade and other short-term liabilities 172,976 42,505 215,481
Total current financial liabilities 173,308 49,369 222,677
Long-term bank debt 5,048 232,600 64 237,712
Other non-current financial liabilities 6,695 6,695
Total non-current financial liabilities 5,048 239,295 64 244,407
Total financial liabilities 173,308 54,417 239,295 64 467,084
Fair value hierarchyThe following table summarizes the financial instruments carried at fair value, by valua-tion method as of March 31, 2014 and 2013. The different levels have been defined as follows:
Level 1: The fair value of financial instruments traded in active markets is based on quoted market prices at the balance sheet date.
Level 2: The fair value of financial instruments that are not traded in an active market is determined by using valuation techniques. These valuation techniques are based on observable market data, where applicable. If all significant inputs required to fair value an instrument are observable, the instrument is included in level 2.
Level 3: If a significant amount of inputs is not based on observable market data the instrument is included in level 3. For this level other techniques, such as discounted cash flow analysis, are used to determine fair value.
During the reporting period there were no reclassifications between the individual levels.

Consolidated financial statements102
Sonova Annual Report 2013 / 14
1,000 CHF 31.3.2014
Level 1 Level 2 Level 3 Total
Financial assets
At fair value through profit or loss 2,510 5,401 7,911
Total 2,510 5,401 7,911
Financial liabilities
At fair value through profit or loss (17,549) (17,549)
Derivatives used for hedging (901) (901)
Total (901) (17,549) (18,450)
1,000 CHF 31.3.2013
Level 1 Level 2 Level 3 Total
Financial assets
At fair value through profit or loss 3,313 5,587 8,900
Total 3,313 5,587 8,900
Financial liabilities
At fair value through profit or loss (13,734) (13,734)
Derivatives used for hedging (6,201) (6,201)
Total (6,201) (13,734) (19,935)
The following table presents the changes in level 3 financial instruments for the year ended March 31, 2014 and 2013:
Financial assets at fair value through profit or loss 1,000 CHF 2013 / 14 2012 / 13
Balance April 1 5,587 5,422
(Losses) / gains recognized in profit or loss (186) 165
Balance March 31 5,401 5,587
Financial liabilities at fair value through profit or loss 1,000 CHF 2013 / 14 2012 / 13
Balance April 1 (13,734) (9,120)
Additions, net (4,525) (4,976)
Gains recognized in profit or loss 710 362
Balance March 31 (17,549) (13,734)
Capital risk managementIt is the Group’s policy to maintain a strong equity base and to secure a continuous “investment grade” rating. Remaining financial debt shall be repaid with priority while the Group’s strong balance sheet and earnings tracking provides for significant debt capacity.
The company aims to return excess cash to shareholders as far as not required for organic and acquisition related growth.

Consolidated financial statements 103
Sonova Annual Report 2013 / 14
26. Other long-term liabilities1,000 CHF 31.3.2014 31.03.20131)
Long-term deferred income 23,520 21,146
Retirement benefit obligations 24,701 23,126
Total 48,221 44,272
1) Restated following the implementation of IAS 19 (revised), refer Note 2.1.
Long-term deferred income relates to long-term service contracts with customers. De ferred income is recognized as a sale over the period of the service contract.
The retirement benefit obligation relates to defined benefit plans. For details refer to Note 30.
27. Movements in share capital
Issued registered shares
Issued registered
shares
Treasury shares1)
Outstanding shares
Balance April 1, 2012 66,574,333 (39,782) 66,534,551
Issue of new shares from conditional capital2) 577,482 577,482
Purchase of treasury shares (94,044) (94,044)
Sale / transfer of treasury shares 107,112 107,112
Balance March 31, 2013 67,151,815 (26,714) 67,125,101
Issue of new shares from conditional capital2) 21,472 21,472
Purchase of treasury shares (564,636) (564,636)
Sale / transfer of treasury shares 581,165 581,165
Balance March 31, 2014 67,173,287 (10,185) 67,163,102
Nominal value of share capital 1,000 CHF
Share Capital Treasury shares1)
Outstanding share capital
Balance April 1, 2012 3,329 (2) 3,327
Issue of new shares from conditional capital2) 29 29
Purchase of treasury shares (5) (5)
Sale / transfer of treasury shares 5 5
Balance March 31, 2013 3,358 (2) 3,356
Issue of new shares from conditional capital2) 1 1
Purchase of treasury shares (28) (28)
Sale / transfer of treasury shares 29 29
Balance March 31, 2014 3,359 (1) 3,358
Each share has a nominal value of CHF 0.05.1) Treasury shares are purchased on the open market and are not entitled to dividends.2) Created for the purpose of the employee share option plan.
At the Annual General Shareholder’s Meeting on July 7, 2005 the conditional share capital of CHF 264,270 (5,285,400 shares) has been increased by CHF 165,056 (3,301,120 shares) to CHF 429,326 (8,586,520 shares). As of March 31, 2014, 5,322,133 shares (pre-vious year 5,343,605 shares) thereof have not yet been issued. These shares are reserved for long-term incentive plans (2,021,013 shares) as well as for initiatives to increase the company’s financial flexibility (3,301,120 shares).

Consolidated financial statements104
Sonova Annual Report 2013 / 14
28. Acquisitions of subsidiaries
Assets and liabilities arising from acquisitions:
1,000 CHF 2013 / 14 2012 / 13
Trade receivables 2,230 948
Other current assets 3,098 1,657
Property, plant & equipment 2,001 1,466
Intangible assets 12,686 11,903
Other non-current assets 430 1,805
Current liabilities (4,798) (1,127)
Non-current liabilities (6,439) (3,443)
Net assets 9,208 13,209
Goodwill 28,417 26,856
Purchase consideration 37,625 40,065
Fair value of previously held stake before the business combination1) (9,626)
Liabilities for earn-outs or holdbacks2) (2,275) (5,318)
Cash consideration 25,724 34,747
Cash and cash equivalents acquired (1,080) (908)
Cash consideration, net of cash acquired 24,644 33,839
Cash outflow for investments in associates, non-controlling interests and earn-out payments 5,168 22,344
Total cash outflow from acquisitions 29,812 56,183
1) The gain of CHF 3.1 million from remeasuring the previously held stakes to fair value is included in the financial result.
2) Earn-out payments are dependent on the future performance of the acquired companies and the liability or earn-outs is based on the latest estimate of the future performance.
Several small companies were acquired during the financial year 2013 / 14 and 2012 / 13 in Asia / Pacific, Europe, and North America. The business of these companies is the distribu-tion of hearing instruments. All acquisitions have been accounted for applying the acquisi-tion method of accounting. For business combinations entered into in the financial year 2013 / 14, acquisition-related costs in the amount of CHF 0.6 million (2012 / 13 CHF 0.5 million) have been expensed and are included in the line “General and administration” in the income statements.
The initial accounting for the acquisitions in the current financial year is provisional and the fair values assigned to the identifiable assets acquired and liabilities assumed are still subject to change. The goodwill is attributed mainly to expected synergies, the labor force and the favorable sales growth potential.
1,000 CHF 2013 / 14 2012 / 13
Contribution of acquired companies from date of acquisition
Sales 8,371 16,301
Net income 815 809
Contribution, if the acquisitions occurred on April 1
Sales 18,509 20,446
Net income (2,425) 1,024

Consolidated financial statements 105
Sonova Annual Report 2013 / 14
29. Related party transactions 1,000 CHF 2013 / 14 2012 / 13 2013 / 14 2012 / 13 2013 / 14 2012 / 13
Management Board
Board of Directors
Total
Short-term employee benefits 9,282 7,529 1,752 1,617 11,034 9,146
Post-employment benefits 799 692 799 692
Share based payments 5,049 3,814 1,372 1,217 6,421 5,031
Total 15,130 12,035 3,124 2,834 18,254 14,869
The total compensation to the Management Board for the reporting period 2013 / 14, as shown above, relates to the 13 current members of the Management Board. The total com-pensation to the Management Board for the reporting period 2012 / 13, as shown above, related to nine members as well as to two members which have left the Management Board during the financial period 2012 / 13.
The total compensation to the Board of Directors for the reporting period 2013 / 14, as shown above, relates to eight current members (previous year eight members).
During the financial year 2013 / 14 several lease agreements existed between the Group and ARim AG or R-Estate AG. Both companies are owned by Andy Rihs, member of the Board of Directors of Sonova Holding AG. The lease agreements relate to warehouse, housing, parking, and child care space. All related party transactions with Andy Rihs, including leases and purchase of marketing material, amounted to CHF 0.35 million (pre-vious year CHF 0.25 million).
For additional information regarding transactions with associates refer to Note 18.
Transactions between the Group and the various post-employment benefit plans for the employees of the Group are described in Note 30.
Further information in accordance with Swiss law relating to remuneration and ownership of shares and options of the Board of Directors and the Management Board can be found in Note 3.6 of the financial statements of Sonova Holding AG.

Consolidated financial statements106
Sonova Annual Report 2013 / 14
30. Employee benefits
Defined Benefit plansSonova Group’s retirement plans include defined benefit pension plans in Switzerland, Austria, Belgium, Canada and Germany. These plans are both funded and unfunded and determined by local regulations using independent actuarial valuations according to IAS 19. Sonova Group’s major defined benefit plan is located in Switzerland which in total ac-counts for CHF 265.6 million or 98.7 % (previous year 239.5 million or 98.6 %) of Sonova’s defined benefit obligation.
Pension plans in SwitzerlandThe current pension arrangement for employees in Switzerland is made through a plan governed by the Swiss Federal Occupational Old Age, Survivors and Disability Pension Act (BVG). The plan of Sonova’s Swiss companies is administered by a separate legal founda-tion, which is funded by regular employer and employee contributions defined in the pen-sion fund rules. The Swiss pension plan contains a cash balance benefit which is in essence contribution-based with certain minimum guarantees. Due to these minimum guarantees, the Swiss plan is treated as defined benefit plan for the purposes of these IFRS financial statements, although it has many of the characteristics of a defined contribution plan. The plan is invested in a diversified range of assets in accordance with the investment strategy and the common criteria of an asset and liability management. A potential under-funding may be remedied by various measures such as increasing employer and employee contribu-tions or reducing prospective benefits.
As of March 31, 2014, 1,217 employees (previous year 1,185 employees) and 79 beneficiaries (previous year 77 beneficiaries) are insured under the Swiss plan. The plan has a duration of 11.2 years (previous year 11.4 years).
The results of all defined benefit plans are summarized below:
Amounts recognized in the balance sheet CHF 1,000 31.3.2014 31.03.20131)
Present value of funded obligations (266,975) (240,637)
Fair value of plan assets 244,429 219,802
Net present value of funded plans (22,546) (20,835)
Present value of unfunded obligations (2,155) (2,291)
Total liabilities, net (24,701) (23,126)
Amounts in the balance sheet:
Retirement benefit obligation (24,701) (23,126)
1) Restated following the implementation of IAS 19 (revised), refer Note 2.1.
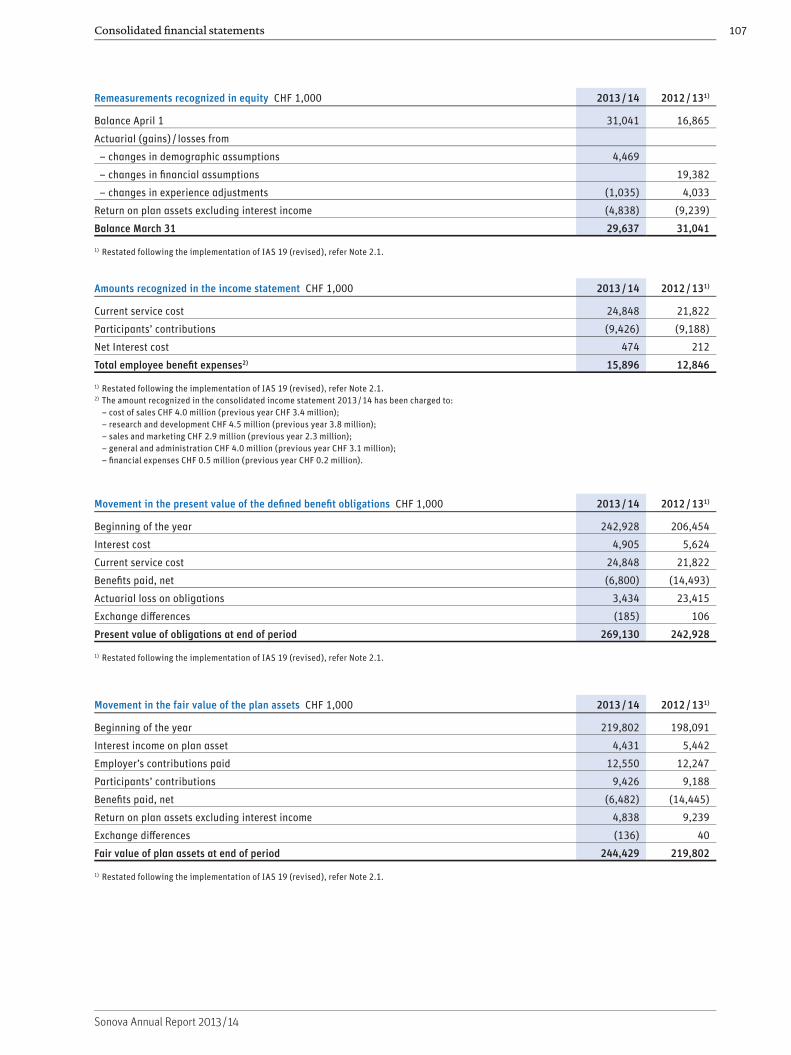
Consolidated financial statements 107
Sonova Annual Report 2013 / 14
Remeasurements recognized in equity CHF 1,000 2013 / 14 2012 / 131)
Balance April 1 31,041 16,865
Actuarial (gains) / losses from
– changes in demographic assumptions 4,469
– changes in financial assumptions 19,382
– changes in experience adjustments (1,035) 4,033
Return on plan assets excluding interest income (4,838) (9,239)
Balance March 31 29,637 31,041
1) Restated following the implementation of IAS 19 (revised), refer Note 2.1.
Amounts recognized in the income statement CHF 1,000 2013 / 14 2012 / 131)
Current service cost 24,848 21,822
Participants’ contributions (9,426) (9,188)
Net Interest cost 474 212
Total employee benefit expenses2) 15,896 12,846
1) Restated following the implementation of IAS 19 (revised), refer Note 2.1.2) The amount recognized in the consolidated income statement 2013 / 14 has been charged to:
– cost of sales CHF 4.0 million (previous year CHF 3.4 million); – research and development CHF 4.5 million (previous year 3.8 million); – sales and marketing CHF 2.9 million (previous year 2.3 million); – general and administration CHF 4.0 million (previous year CHF 3.1 million); – financial expenses CHF 0.5 million (previous year CHF 0.2 million).
Movement in the present value of the defined benefit obligations CHF 1,000 2013 / 14 2012 / 131)
Beginning of the year 242,928 206,454
Interest cost 4,905 5,624
Current service cost 24,848 21,822
Benefits paid, net (6,800) (14,493)
Actuarial loss on obligations 3,434 23,415
Exchange differences (185) 106
Present value of obligations at end of period 269,130 242,928
1) Restated following the implementation of IAS 19 (revised), refer Note 2.1.
Movement in the fair value of the plan assets CHF 1,000 2013 / 14 2012 / 131)
Beginning of the year 219,802 198,091
Interest income on plan asset 4,431 5,442
Employer’s contributions paid 12,550 12,247
Participants’ contributions 9,426 9,188
Benefits paid, net (6,482) (14,445)
Return on plan assets excluding interest income 4,838 9,239
Exchange differences (136) 40
Fair value of plan assets at end of period 244,429 219,802
1) Restated following the implementation of IAS 19 (revised), refer Note 2.1.

Consolidated financial statements108
Sonova Annual Report 2013 / 14
The plan assets consist of: 31.3.2014 31.3.2013
Cash 4.4 % 4.2 %
Domestic bonds 30.4 % 30.0 %
Foreign bonds 7.7 % 8.2 %
Domestic equities 11.6 % 13.7 %
Foreign equities 29.1 % 22.3 %
Real estates 11.1 % 11.7 %
Alternative investments 5.7 % 9.9 %
The actual return on plan assets amounted to CHF 9.3 million (previous year CHF 14.7 million). The expected employer’s contributions to be paid in the financial year 2014 / 15 amount to CHF 13.0 million.
Principal actuarial assumptions (weighted average) 2013 / 14 2012 / 13
Discount rate 2.00 % 2.00 %
Future salary increases 1.75 % 1.75 %
Future pension increases 0 % 0 %
Fluctuation rate 10 % 10 %
Demography BVG 2010GT BVG 2010PT
The following sensitivity analysis shows how the present value of the benefit obligation for the Swiss retirement benefit plan would change if one of the principal actuarial assump-tions was changed. For the analysis, changes in the assumptions were considered sepa-rately and no interdependencies were taken into account.
Sensitivity analysis - Impact on defined benefit obligation CHF 1,000 31.3.2014 31.3.2013
Discount rate
Discount rate + 0.25 % 258,378 232,801
Discount rate − 0.25 % 273,269 246,494
Salary growth
Salary growth + 0.25 % 267,914 241,818
Salary growth − 0.25 % 263,382 237,164
Pension growth
Pension growth + 0.5 % 271,765 244,237
Pension growth − 0.5 % 259,492 234,701
Fluctuation rate
Fluctuation rate + 5 % 257,899 231,613
Fluctuation rate − 5 % 280,610 254,695
Defined contribution plansSeveral of the Group’s entities have a defined contribution plan. The employer’s contribu-tions amounting to CHF 11.9 million in the year ended March 31, 2014 (previous year CHF 11.0 million) are recognized directly in the income statement.

Consolidated financial statements 109
Sonova Annual Report 2013 / 14
31. Executive Equity Award Plan
The Executive Equity Award Plan (EEAP) is offered annually to the Board of Directors (BoD), to the Management Board (MB) as well as to other management and senior employees of the Group, entitling them to receive long-term incentives in the form of equity award plans free of charge. Equity award plans are settled either with Sonova Holding AG shares (equity-settled share-based payment) or for certain US participants with an equivalent amount in cash (cash-settled share-based payment). The amount granted varies depending on the degree of management responsibility held.
Under the EEAP 2014, options / share appreciation rights (SARs) for US participants/ re-stricted shares and restricted share units (RSUs) have been granted. For the CEO and the MB members, with the grant 2014 a performance criterion has been introduced for options as well as for RSUs. The vesting of these performance based options and RSUs in a given year is subject to reaching a pre-defined ‘Return On Capital Employed’ (ROCE) target. The failure to reach the target results in a corresponding reduction of the number of options / RSUs that will vest.
The following share-based payment costs have been recognized in the financial years:
1,000 CHF 2013 / 14 2012 / 13
Equity-settled share-based payment costs 18,682 15,771
Cash-settled share-based payment costs 451 477
Total share-based payment costs 19,133 16,248

Consolidated financial statements110
Sonova Annual Report 2013 / 14
The following table shows an overview of the outstanding options / warrants / WARs / SARs, granted as part of the EEAP programs 2009 to 2014. All of the instruments granted as per below vest in 4 equal tranches, annually over 4 years.
Summary of outstanding options / warrants / WARs / SARs granted until March 31, 2014:
Financial year granted
Instruments granted
First vesting date /
Expiry date
Granted Exercise price (CHF)
Outstanding Average remaining life
(years)
Exercisable
2008 / 09 Options01.03.2012 28.02.2017 160,000 56.00 27,000 2.9 27,000
2009 / 10Warrants /WARs1)
01.03.2011 28.02.2015 452,140 131.00 311,910 0.9 311,910
2010 / 11 Warrants /WARs1)
01.03.2012 29.02.2016 612,065 118.40 306,567 1.9 233,286
2011 / 12 Options27.05.2012 27.05.2016 40,000 88.30 10,000 2.2
2011 / 12 Options / SARs01.06.2013 31.01.2019 298,474 95.85 255,737 4.8 56,096
2012 / 13 Options / SARs01.06.2014 31.01.2020 227,188 109.10 221,423 5.8
2013 / 14Options /SARs2)
01.06.2015 31.01.2021 242,673 124.60 242,673 6.8
Total 2,032,540 112.09 1,375,3103) 3.7 628,2924)
Thereof:
Equity-settled 1,855,588 1,277,473 597,551
Cash-settled 176,952 97,837 30,741
1) For better comparison with options issued, the number of warrants has been adjusted by factor 25, as 25 warrants qualify for one share. The warrants are tradable at the SIX Swiss Exchange. The ticker symbols are as follows: plan 2009 / 10: SONAB, plan 2010 / 11: SONCA.
2) Including 107,567 performance options, granted to the CEO and MB members.3) Weighted average exercise price of outstanding options / warrants / SARs / WARs amounts to CHF 115.22.4) Weighted average exercise price for exercisable options / warrants / SARs / WARs amounts to CHF 119.96.

Consolidated financial statements 111
Sonova Annual Report 2013 / 14
The fair value of options / SARs at grant date was determined by using an “Enhanced American Pricing Model”. The expected volatility is based on historical volatility. The as-sumptions for valuation used for the programs of the financial year 2013 / 2014 and 2012 / 2013 are as follows:
Assumptions for valuation at grant dateExecutive Equity Award Plan 2014
Executive Equity Award Plan 2013
Valuation date 01.02.2014 01.02.2013
Expiration date 31.01.2021 31.01.2020
Share price on grant date CHF 124.60 CHF 109.10
Exercise price CHF 124.60 CHF 109.10
Volatility 27.2 % 32.3 %
Expected dividend yield 2.21 % 1.33 %
Weighted risk free interest rate 0.6 % 0.5 %
Weighted average fair value of options / SARs issued CHF 24.46 CHF 24.19
Options / warrants The exercise price of the options / warrants is equal to the market price of the Sonova share at the SIX Swiss Exchange at grant date. The fair value of the options / warrants granted is estimated at grant date and recorded as an expense over the corresponding vesting period. Assumptions are made regarding the forfeiture rate which is adjusted during the vesting period (including adjustments due to re-assessments of the likely achievements of the ROCE targets for performance options granted to CEO and MB members) to ensure that in the end only a charge for vested amounts occurred. While the options may be exercised between the end of the vesting period and the expiration date of the options, the warrants are tradable and may be sold by the plan participants between the end of the vesting pe-riod and the expiration date of the warrants. The tradable warrants will be exercised at the end of the expiration date and shares are issued either from the conditional share capital or treasury shares will be used for fulfillment. 25 warrants qualify for one share. If options are exercised, one share per option is issued from the conditional share capital or treasury shares are used for fulfillment.
Changes in outstanding options / warrants: 2013 / 14 2012 / 13
Number of options /
warrants1)
Weighted average
exercise price (CHF)
Number of options /
warrants1)
Weighted average
exercise price (CHF)
Outstanding options / warrants at April 1 1,322,808 106.64 1,800,548 100.54
Granted2) 215,221 124.60 200,967 109.10
Exercised / sold3) (210,872) 70.53 (503,908) 86.89
Forfeited (49,684) 116.91 (174,799) 103.64
Outstanding options/warrants at March 31 1,277,473 115.22 1,322,808 106.64
Exercisable at March 31 597,551 119.94 612,790 104.52
1) For better comparison, the number of warrants have been adjusted according to exercise ratio 25:1.2) 2013 / 14 Includes 107,567 performance options, granted to the CEO and MB members.3) Out of the movement for the financial year 2013 / 14, 26,827 (previous year 227,758) relates to options exercised
and 184,045 (previous year 276,150) to warrants sold. Total consideration from exercise of options amounted to CHF 2.2 million (previous year CHF 21.4 million). The weighted average share price of the options exercised during the year 2013 / 14 was CHF 80.54 (previous year CHF 94.90).

Consolidated financial statements112
Sonova Annual Report 2013 / 14
Share appreciation rights (SARs) / Warrant appreciation rights (WARs) The exercise price of the SARs / WARs is generally equal to the market price of the Sonova share at the SIX Swiss Exchange at grant date. Upon exercise of a SAR / WAR, a participant shall be paid, in cash, an amount equal to the product of the number of shares for which the participant exercised SARs / WARs , multiplied by the excess, if any, of the per share market price at the date of exercise over the per share exercise price (determined at the date of grant of SARs / WARs ). The initial fair value of the SARs / WARs is in line with the valuation of the warrants / options of the respective period and recorded as an expense over the vesting period. Until the liability is settled, it is revalued at each reporting date recognizing changes in fair value in the income statement. The SARs / WARs may be sold between the end of the vesting period and the expiration date of the SARs / WARs .
Changes in outstanding SARs / WARs: 2013 / 14 2012 / 13
Number of SARs
Weighted average exercise
price (CHF)
Number of WARs
Weighted average exercise
price (CHF)
Number of SARs
Weighted average exercise
price (CHF)
Number of WARs
Weighted average exercise
price (CHF)
Outstanding SARs / WARs at April 1 50,145 102.78 100,219 122.59 33,244 95.05 179,887 110.95
Granted 27,452 124.60 26,221 109.10
Exercised / sold (1,624) 95.85 (9,270) 103.32 (32,470) 73.80
Forfeited (7,613) 102.14 (61,472) 125.29 (9,320) 95.85 (47,198) 111.81
Outstanding SARs / WARs at March 311) 68,360 111.78 29,477 123.02 50,145 102.78 100,219 122.59
Exercisable at March 312) 3,358 95.85 27,383 123.37 84,301 122.91
1) The carrying amount of the liability relating to the SARs at March 31, 2014 is CHF 1.0 million (previous year CHF 0.5 million) and the one for the WARs amounts to CHF 0.5 million (previous year CHF 0.7 million).
2) The intrinsic value of the SARs and WARs exercisable at March 31, 2014 amounts to CHF 0.1 million (previous year CHF 0) and CHF 0.2 million (previous year CHF 0) respectively.
Restricted shares / Restricted share units (RSUs) For the EEAPs 2010 to 2014, restricted share units (RSUs) have been granted to legiti-mated persons. The value of an RSU is equal to the market price on the SIX Swiss Exchange on the grant date, adjusted for the fair value of expected dividends, as RSUs are not entitled to dividends. RSUs entitle the holder to receive one share per RSU after the vesting period. In the case of performance RSUs, given to the CEO and MB members under the EEAP 2014, the vesting of these shares is also dependent on the fulfillment of the performance criteria. In addition to the RSUs granted in respect to the EEAP 2014, restricted shares have been granted to the Chairman of the Board of Directors as well as to the other members of the Board of Directors. These restricted shares are entitled to dividends and are blocked for a period of 64 months (in case of the Chairman of the Board of Directors), respectively 52 months (in case of the other members of the Board of Directors).
Upon vesting of the RSUs, the respective shares are either purchased by the Group on the open stock market or created out of the conditional share capital. The cost of the RSUs granted as part of the EEAP program is expensed over the expected vesting period. Assumptions are made regarding the forfeiture rate which is adjusted during the vesting period (including adjustments due to re-assessments of the likely achievements of the ROCE targets for performance RSUs granted to CEO and MB members) to ensure that in the end only a charge for vested amounts occurred. The costs for the shares granted to the members of the Board of Directors have been expensed in the financial year 2013 / 14 as there is no vesting period related to these shares.

Consolidated financial statements 113
Sonova Annual Report 2013 / 14
Changes in outstanding RSUs: 2013 / 14 2012 / 13
Number of RSUs
Number of RSUs
RSUs at April 1 352,794 294,305
Granted1) 137,939 145,452
Released (74,629) (65,224)
Forfeited (17,652) (21,739)
RSUs at March 31 398,452 352,794
1) 2013 / 14 includes 20,498 performance RSUs, granted to the CEO and MB members.
32. Contingent liabilities
At March 31, 2014 and 2013, there were no pledges given to third parties other than in relation to bank loans and mortgages. As security for the initial bank loan of CHF 470 mil-lion, out of which CHF 80 million were still outstanding, granted in connection with the acquisition of Advanced Bionics, the shares of Advanced Bionics have been pledged. In addition a deposit in the amount of CHF 1.0 million has been pledged in relation to a bank guarantee. Mortgages are secured by properties in the amount of CHF 0.2 million (previous year CHF 0.2 million). The net book value of these properties amounts to CHF 1.1 million at March 31, 2014 (previous year CHF 1.2 million). Open purchase orders as of March 31, 2014 and 2013, were related to recurring business activities.
33. Leasing liabilities
At March 31, 2014 the following non-cancellable minimum operating lease obligations existed:
Financial year 1,000 CHF 31.3.2014 31.3.2013
2013 / 14 35,330
2014 / 15 35,810 27,132
2015 / 16 26,378 23,744
2016 / 17 21,704 20,950
2017 / 18 17,658 19,321
2018 / 19 15,685 14,232
thereafter 32,982 11,645
Total 150,217 152,354
The operating lease commitments relate primarily to long-term property lease agreements which are, in general, renewable.
In financial year 2013 / 14, CHF 48.2 million have been recognized as expenses for leases in the consolidated income statement (previous year CHF 43.6 million).
As of March 31, 2014 and 2013, the Group had no financial lease obligations.
34. Events after balance sheet date
There have been no material events after the balance sheet date.

Consolidated financial statements114
Sonova Annual Report 2013 / 14
1) Share / paid-in capital may not reflect the taxable share / paid-in capital amount and does not include any paid-in surplus.
2) GBP 1333) Without par value4) USD 15) USD 106) AUD 100
35. List of significant companies
Company name Activity Domicile Share/paid-in capital1) Local currency 1,000
Shares held
Switzerland
Sonova Holding AG A Stäfa CHF 3,359
Phonak AG A, B, C, D Stäfa CHF 2,500 100 %
Advanced Bionics AG A, B Stäfa CHF 4,350 100 %
Indomed AG A Zug CHF 1,000 100 %
EMEA (excluding Switzerland)
Hansaton Akustische Geräte GmbH B Wals-Himmelreich (AT) EUR 450 100 %
Ets. Lapperre BHAC NV B Groot-Bijgaarden (BE) EUR 124 100 %
Phonak GmbH B Fellbach-Oeffingen (DE) EUR 25 100 %
Unitron Hearing GmbH B Fellbach-Oeffingen (DE) EUR 41 100 %
Phonak Ibérica S.A.U. B Alicante (ES) EUR 7,000 100 %
Audition Santé SAS B Cahors (FR) EUR 3,800 100 %
Phonak France SA B Bron-Lyon (FR) EUR 1,000 100 %
Phonak Italia Srl B Milan (IT) EUR 1,040 100 %
Phonak AB B Stockholm (SE) SEK 200 100 %
Boots Hearing Care Ltd. B Conwy (UK) GBP 02) 51 %
Phonak Group Ltd. B Warrington (UK) GBP 2,500 100 %
Americas
Phonak do Brasil – Sistemas Audiológicos Ltda. B Sao Paulo (BR) BRL 36,179 100 %
National Hearing Services Inc. B Victoria BC (CA) CAD 03) 100 %
1879763 Ontario Inc. B Mississauga (CA) CAD 03) 100 %
Connect Hearing Inc. B Naperville (US) USD 04) 100 %
Ear Professionals International Corporation B Pomona (US) USD 6 79 %
Unitron Hearing, Inc. B Plymouth (US) USD 46,608 100 %
Advanced Bionics Corp. A Valencia (US) USD 1 100 %
Advanced Bionics LLC B, C, D Valencia (US) USD 03) 100 %
Phonak LLC B Warrenville (US) USD 03) 100 %
Sonova United States Hearing Instruments, LLC A Warrenville (US) USD 03) 100 %
Development Finance Inc. A Wilmington (US) USD 05) 100 %
Asia / Pacific
Hearing Retail Group Pty. Ltd. B Sydney (AU) AUD 06) 100 %
Phonak Pty. Ltd. B Baulkham Hills (AU) AUD 750 100 %
Phonak (Shanghai) Co., Ltd. B Shanghai (CN) CNY 20,041 100 %
Unitron Hearing (Suzhou) Co., Ltd. C Suzhou (CN) CNY 46,249 100 %
Phonak Japan Co., Ltd. B Tokyo (JP) JPY 10,000 100 %
Phonak Operation Center Vietnam Co., Ltd. C Binh Duong (VN) VND 36,156,000 100 %
Activities: A Holding / Finance: The entity is a holding or finance company.B Sales: The entity performs sales and marketing activities.C Production: This entity performs manufacturing for the Group.D Research: This entity perfoms research and development activities
for the Group.

Consolidated financial statements 115
Sonova Annual Report 2013 / 14
Report of the statutory auditor on the consolidated financial statements 2013 / 14 to the Annual General Shareholders’ Meeting of Sonova Holding AG Stäfa.
Report of the statutory auditor on the consolidated financial statementsAs statutory auditor, we have audited the consolidated financial statements of Sonova Holding AG, which comprise the consolidated income statement, consolidated statement of comprehensive income, consolidated balance sheet, consolidated cash flow statement, consolidated changes in equity and notes (pages 70 to 114) for the year ended 31 March, 2014.
Board of directors’ responsibilityThe Board of Directors is responsible for the preparation and fair presentation of the consolidated financial statements in accor dance with the International Financial Reporting Standards (IFRS) and the requirements of Swiss law. This responsibility includes designing, implementing and maintaining an internal control system relevant to the preparation and fair presentation of consolidated financial statements that are free from material misstatement, whether due to fraud or error. The Board of Directors is further responsible for selecting and applying appropriate accounting policies and making accounting estimates that are reasonable in the circumstances.
Auditor’s responsibilityOur responsibility is to express an opinion on these consolidated financial statements based on our audit. We conducted our audit in accordance with Swiss law and Swiss Auditing Standards as well as the International Standards on Auditing. Those standards require that we plan and perform the audit to obtain reasonable assurance whether the consolidated financial statements are free from material misstatement.
An audit involves performing procedures to obtain audit evidence about the amounts and disclosures in the consolidated financial statements. The procedures selected depend on the auditor’s judgment, including the assessment of the risks of material misstatement of the consolidated financial statements, whether due to fraud or error. In making those risk assessments, the auditor considers the internal control system relevant to the entity’s preparation and fair presentation of the consolidated financial statements in order to design audit procedures that are appropriate in the circumstances, but not for the purpose of expressing an opinion on the effectiveness of the entity’s internal control system. An audit also includes evaluating the appropriateness of the accounting policies used and the reasonableness of accounting estimates made, as well as evaluating the overall presentation of the consolidated financial statements. We believe that the audit evidence we have obtained is sufficient and appropriate to provide a basis for our audit opinion.
OpinionIn our opinion, the consolidated financial statements for the year ended March 31, 2014, give a true and fair view of the financial position, the results of operations and the cash flows in accordance with the International Financial Reporting Standards (IFRS) and comply with Swiss law.
Report on other legal requirementsWe confirm that we meet the legal requirements on licensing according to the Auditor Oversight Act (AOA) and independence (article 728 CO and article 11 AOA) and that there are no circumstances incompatible with our independence.
In accordance with article 728a paragraph 1 item 3 CO and Swiss Auditing Standard 890, we confirm that an internal control system exists which has been designed for the preparation of consolidated financial statements according to the instructions of the Board of Directors.
We recommend that the consolidated financial statements submitted to you be approved.
PricewaterhouseCoopers AG
Sandra Boehm Gian Franco BielerAudit expert Audit expertAuditor in charge
Zurich, May 14, 2014
Report of the statutory auditor on the consolidated financial statement

116
Sonova Annual Report 2013 / 14
Income statements 1,000 CHF 2013 / 14 2012 / 13
Income
Investment income 304,728 432,365
Financial income 23,247 45,426
Other income 21,125 18,370
Total income 349,100 496,161
Expenses
Financial expenses (81,174) (7,344)
Administration expenses (7,626) (7,502)
Depreciation and amortization (4,184)
Other expenses 2.1 (2,069) (15,984)
Total expenses (90,869) (35,014)
Net profit for the year 258,231 461,147
Financial statements of Sonova Holding AG
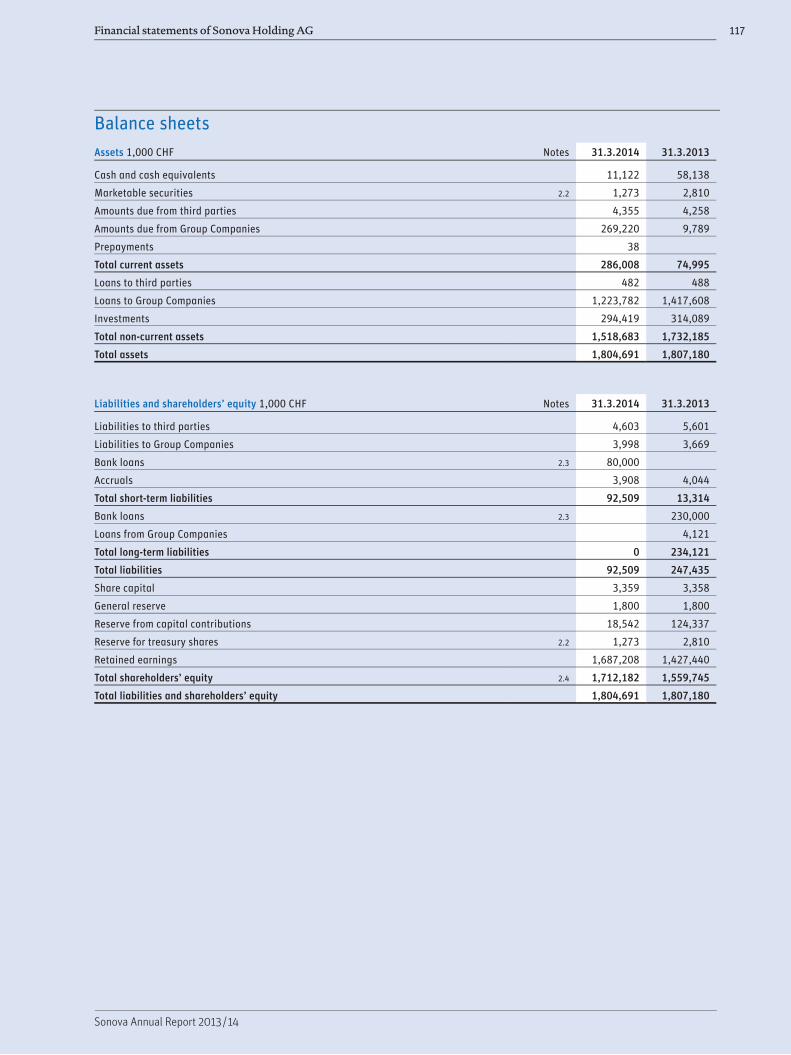
117Financial statements of Sonova Holding AG
Sonova Annual Report 2013 / 14
Assets 1,000 CHF Notes 31.3.2014 31.3.2013
Cash and cash equivalents 11,122 58,138
Marketable securities 2.2 1,273 2,810
Amounts due from third parties 4,355 4,258
Amounts due from Group Companies 269,220 9,789
Prepayments 38
Total current assets 286,008 74,995
Loans to third parties 482 488
Loans to Group Companies 1,223,782 1,417,608
Investments 294,419 314,089
Total non-current assets 1,518,683 1,732,185
Total assets 1,804,691 1,807,180
Liabilities and shareholders’ equity 1,000 CHF Notes 31.3.2014 31.3.2013
Liabilities to third parties 4,603 5,601
Liabilities to Group Companies 3,998 3,669
Bank loans 2.3 80,000
Accruals 3,908 4,044
Total short-term liabilities 92,509 13,314
Bank loans 2.3 230,000
Loans from Group Companies 4,121
Total long-term liabilities 0 234,121
Total liabilities 92,509 247,435
Share capital 3,359 3,358
General reserve 1,800 1,800
Reserve from capital contributions 18,542 124,337
Reserve for treasury shares 2.2 1,273 2,810
Retained earnings 1,687,208 1,427,440
Total shareholders’ equity 2.4 1,712,182 1,559,745
Total liabilities and shareholders’ equity 1,804,691 1,807,180
Balance sheets

118
Sonova Annual Report 2013 / 14
1. General
The financial statements of Sonova Holding AG are prepared in accordance with the principles of Swiss corporate law.
2. Notes to the income statement and balance sheet
2. 1 Other expenses
Other expenses mainly include tax expenses and bank charges. In 2012 / 13 it included, among other items, payments for an out-of-court settlement of all alleged claims without acknowledging any legal obligations with a group of investors.
2. 2 Marketable securities and reserve for treasury shares
Marketable securities include 10,185 treasury shares (previous year 26,714) purchased for a total consideration of CHF 1,273,326 (previous year CHF 2,810,104). At March 31, 2014, these shares had a market value of CHF 1,315,902 (previous year CHF 3,042,725). Due to the lower of cost or market principle, CHF 1,273,326 are considered in the balance sheet.
A reserve for treasury shares in the amount of CHF 1,273,326 (previous year CHF 2,810,104) was established which is equal to the cost price. No treasury shares are held by other Group companies.
The following table shows the movement of the reserve for treasury shares and the treasury shares at market value.
Number / 1,000 CHF
Number Reserve for treasury shares
Treasury shares at market value
Balance March 31, 2013 26,714 2,810 3,042
Purchase of treasury shares 564,636 63,123 63,123
Sale of treasury shares (581,165) (64,660) (41,486)
Loss from sale of own shares and revaluation (23,363)
Balance March 31, 2014 10,185 1,273 1,316
2. 3 Bank loans
The acquisition of the Advanced Bionics Corporation was financed by Sonova Holding AG with a combination of existing cash and an underwritten senior credit facility in the amount of CHF 470 million. The senior credit facility was made in two tranches, a CHF 240 million amortizing loan, whereof the total amount has been re-paid by July 2011, and a CHF 230 million facility with a maximum term of five years, whereof CHF 150 million have been re-paid by March 2014. The remaining outstanding amount of CHF 80 million is due in December 2014.
Notes to the financial statements as of March 31, 2014

119Financial statements of Sonova Holding AG
Sonova Annual Report 2013 / 14
2. 4 Summary of changes in shareholders’ equity1,000 CHF
Share capital
General reserve
Reserve from capital
contributions
Reserve for treasury
shares
Retained earnings
Total share- holders’
equity
Balance April 1, 2013 3,358 1,800 124,337 2,810 1,427,440 1,559,745
Distribution (107,441) (107,441)
Capital increases (incl. share premium) from conditional capital 1 1,646 1,647
Decrease in reserve for treasury shares (1,537) 1,537
Net profit for the year 258,231 258,231
Balance March 31, 2014 3,359 1,800 18,542 1,273 1,687,208 1,712,182
During the financial year 2013 / 14, an additional 21,472 registered shares with a par value of CHF 0.05 each, or a total par value of CHF 1,074 were issued from the conditional capital (which was created for the purpose of an equity participation for key employees of the Sonova Group) for a total net consideration of CHF 1,646,244. In the financial year 2013 / 14, the conditional share capital with a par value of CHF 267,180 (5,343,605 shares) decreased by CHF 1,074 or 21,472 shares (previous year CHF 28,874 or 577,482 shares), thereby leaving CHF 266,107 (5,322,133 shares) for distribution. Out of the remaining conditional capital, a total of 1,277,473 (previous year 1,322,808) employee stock options were out-standing as of March 31, 2014, which can be exercised until January 2021.
The treasury share reserve differs from the treasury shares in the consolidated financial statements due to Warrant Appreciation Rights (WARs) and Share Appreciation Rights (SARs). Derivative instruments such as WARs and SARs are not recorded in the financial statements of Sonova Holding AG (off balance sheet transaction).
3. Disclosures required by Swiss corporate law
3. 1 Sureties, guarantees and pledges given on behalf of third parties
1,000 CHF 31.3.2014 31.3.2013
Guarantees given in respect of rental obligations of Group Companies 4,485 5,868
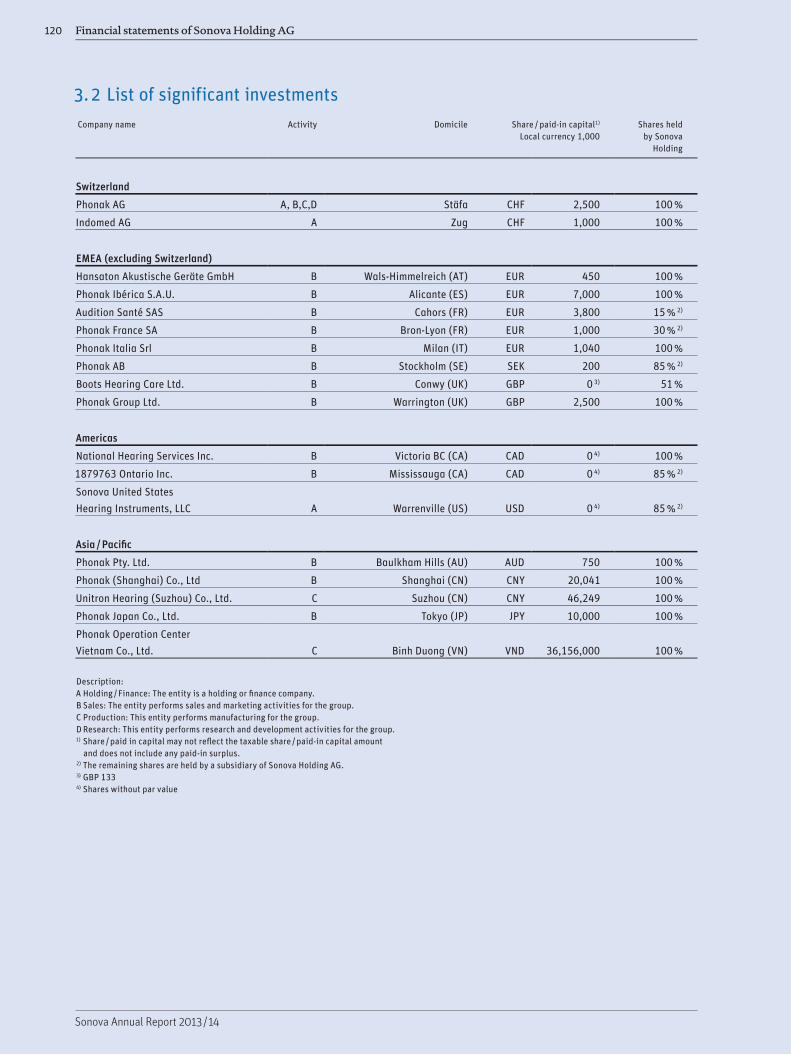
120 Financial statements of Sonova Holding AG
Sonova Annual Report 2013 / 14
3. 2 List of significant investments Company name
Activity
Domicile
Share / paid-in capital1) Local currency 1,000
Shares held by Sonova
Holding
Switzerland
Phonak AG A, B,C,D Stäfa CHF 2,500 100 %
Indomed AG A Zug CHF 1,000 100 %
EMEA (excluding Switzerland)
Hansaton Akustische Geräte GmbH B Wals-Himmelreich (AT) EUR 450 100 %
Phonak Ibérica S.A.U. B Alicante (ES) EUR 7,000 100 %
Audition Santé SAS B Cahors (FR) EUR 3,800 15 % 2)
Phonak France SA B Bron-Lyon (FR) EUR 1,000 30 % 2)
Phonak Italia Srl B Milan (IT) EUR 1,040 100 %
Phonak AB B Stockholm (SE) SEK 200 85 % 2)
Boots Hearing Care Ltd. B Conwy (UK) GBP 0 3) 51 %
Phonak Group Ltd. B Warrington (UK) GBP 2,500 100 %
Americas
National Hearing Services Inc. B Victoria BC (CA) CAD 0 4) 100 %
1879763 Ontario Inc. B Mississauga (CA) CAD 0 4) 85 % 2)
Sonova United States Hearing Instruments, LLC A Warrenville (US) USD 0 4) 85 % 2)
Asia / Pacific
Phonak Pty. Ltd. B Baulkham Hills (AU) AUD 750 100 %
Phonak (Shanghai) Co., Ltd B Shanghai (CN) CNY 20,041 100 %
Unitron Hearing (Suzhou) Co., Ltd. C Suzhou (CN) CNY 46,249 100 %
Phonak Japan Co., Ltd. B Tokyo (JP) JPY 10,000 100 %
Phonak Operation Center Vietnam Co., Ltd. C Binh Duong (VN) VND 36,156,000 100 %
Description:A Holding / Finance: The entity is a holding or finance company.B Sales: The entity performs sales and marketing activities for the group.C Production: This entity performs manufacturing for the group.D Research: This entity performs research and development activities for the group.1) Share / paid in capital may not reflect the taxable share / paid-in capital amount
and does not include any paid-in surplus.2) The remaining shares are held by a subsidiary of Sonova Holding AG.3) GBP 1334) Shares without par value

121Financial statements of Sonova Holding AG
Sonova Annual Report 2013 / 14
3. 3 Conditional capital
At the Annual General Shareholder’s Meeting on July 7, 2005, the conditional share capital of CHF 264,270 (5,285,400 shares) has been increased by CHF 165,056 (3,301,120 shares) to CHF 429,326 (8,586,520 shares). As of March 31, 2014, 5,322,133 shares with a nominal value of CHF 266,107 (previous year 5,343,605 shares with a nominal value of CHF 267,180) thereof have not yet been issued. These shares are reserved for long-term incentive plans (2,021,013 shares) as well as for initiatives to increase the company’s financial flexibility (3,301,120 shares).
3. 4 Significant shareholders
At year-end, the following significant shareholders were listed in the share register (with shareholdings in excess of 3 % of the issued share capital). Significant shareholders may also hold non-registered shares which are reported under “Not registered”.
31.3.2014 31.3.2013
Chase Nominees Ltd.1) 13.42 % 17.53 %
Beda Diethelm 9.90 % 9.90 %
Hans-Ueli Rihs 6.14 % 6.20 %
Andy Rihs 5.05 % 6.26 %
Nortrust Nominees Ltd.1) 3.45 % 3.79 %
Mellon Bank Nominee1) <3.00 % 3.65 %
Registered shareholders with less than 3 % 34.88 % 28.65 %
Not registered 27.16 % 24.02 %
1) Registered without voting rights.
3. 5 Risk assessment
Sonova Holding AG, as the ultimate parent company of the Sonova Group, faces the same risks as the ones identified at Group level. Therefore, please refer to the disclosure of the Group-wide risk management procedures as described in Note 25 of the Group’s consolidated financial statements.
3. 6 Compensation and shareholdingsBoard of Directors compensationThe members of the Board of Directors receive a cash retainer, a committee fee (if applic-able), and a meeting attendance fee. There is no variable salary compensation. Members of the Board of Directors receive a long-term compensation through their participation in the Executive Equity Award Plan (EEAP). As in the previous year, the EEAP grant 2014 comprise of 100 % restricted shares. These shares are subject to a restriction period from February 1, 2014 to June 1, 2019 (Chairman) or from February 1, 2014 to June 1, 2018 (all other members of the Board of Directors).

122 Financial statements of Sonova Holding AG
Sonova Annual Report 2013 / 14
The following table shows the compensation for the individual members of the Board of Directors in the year under review and in the previous year:
in CHF 2013 / 14
Fixed fee Attendance fee / expenses1)
Employer’s social insurance
contribution2)
Total cash compensation
Value of restricted
shares3)
Total compensation
Robert F. Spoerry, Chairman 500,000 2,500 126,725 629,225 291,192 920,417
Beat Hess, Vice-Chairman 122,500 9,500 19,199 151,199 154,332 305,531
Michael Jacobi, Member 125,000 9,000 98,977 232,977 154,332 387,309
Andy Rihs, Member 100,000 7,000 93,713 200,713 154,332 355,045
Anssi Vanjoki, Member 107,500 9,000 19,934 136,434 154,332 290,766
Ronald van der Vis, Member 107,500 7,000 19,840 134,340 154,332 288,672
Jinlong Wang, Member4) 78,630 3,500 15,092 97,222 154,332 251,554
John J. Zei, Member 107,500 9,500 17,525 134,525 154,332 288,857
Total (active members) 1,248,630 57,000 411,005 1,716,635 1,371,516 3,088,151
Heliane Canepa, Member5) 23,267 4,000 8,341 35,608 35,608
Total (including former members) 1,271,897 61,000 419,346 1,752,243 1,371,516 3,123,759
The compensation shown in the table above is gross and based on the accrual principle.1) Attendance fees and expenses are based on the number of attended meetings of each member
of the Board of Directors (no attendance fees for the Chairman).2) Including social security contributions on the tax value of RSUs vested, options / WARs / SARs exercised
and restricted shares granted during the reporting period.3) Tax value per restricted share at grant date: for the Chairman of the Board of Directors CHF 90.71,
for the other members of the Board of Directors CHF 96.16.4) New member of the Board of Directors since June 2013.5) Heliane Canepa resigned from the Board of Directors at the annual shareholders meeting from June 18, 2013.
in CHF 2012 / 13
Fixed fee Attendance fee / expenses1)
Employer’s social insurance
contribution2)
Total cash compensation
Value of restricted
shares3)
Total compensation
Robert F. Spoerry, Chairman 500,000 2,500 56,129 558,629 291,300 849,929
Beat Hess, Vice-Chairman4) 105,986 7,000 17,215 130,201 154,375 284,576
Heliane Canepa, Member5) 107,500 10,000 42,201 159,701 159,701
Michael Jacobi, Member 125,000 10,000 25,917 160,917 154,375 315,292
Andy Rihs, Member 100,000 8,500 27,336 135,836 154,375 290,211
Anssi Vanjoki, Member 107,500 10,500 18,197 136,197 154,375 290,572
Ronald van der Vis, Member 100,000 8,500 17,454 125,954 154,375 280,329
John J. Zei, Member 107,500 11,000 15,914 134,414 154,375 288,789
Total (active members) 1,253,486 68,000 220,363 1,541,849 1,217,550 2,759,399
William D. Dearstyne, former member6) 28,493 3,000 43,531 75,024 75,024
Total (including former members) 1,281,979 71,000 263,894 1,616,873 1,217,550 2,834,423
The compensation shown in the table above is gross and based on the accrual principle.1) Attendance fees and expenses are based on the number of attended meetings of each member
of the Board of Directors (no attendance fees for the Chairman).2) Including social security contributions on the tax value of options / WARs / SARs exercised
and restricted shares granted during the reporting period.3) Tax value per restricted share at grant date: for the Chairman of the Board of Directors CHF 79.46,
for the other members of the Board of Directors CHF 84.22.4) New member of the Board of Directors since June 2012.5) Heliane Canepa will resign from the Board of Directors at the annual shareholders meeting
from June 18, 2013 and therefore did not participate in the EEAP 2013.6) William D. Dearstyne resigned from the Board of Directors at the annual shareholders meeting
from June 19, 2012.

123Financial statements of Sonova Holding AG
Sonova Annual Report 2013 / 14
Aside from these payments, no other payments were made to current and former members of the Board of Directors or persons closely linked to them in this reporting period.
Management Board compensationThe members of the Management Board receive a fixed and variable salary, fringe benefits, employers pension and social insurance contributions and a long term incentive in options and RSUs. Starting with the 2014 EEAP the future vesting in a given year is subject to reaching a pre-defined minimum ’Return On Capital Employed’ (ROCE) target.
For the year under review, members of the Management Board had a target variable cash compensation averaging at 50 % of the fixed base salary; for the CEO it was 62.5 %. The vari-able cash compensation for the Management Board is based on three performance target categories: Group, business unit, and individual level. As with all other employees, if less than a certain threshold of a given performance target is achieved, no variable cash compen-sation is paid out on that specific target. If the performance meets the given target, 100 % of the related variable cash compensation is paid out. If performance exceeds a given target, the related variable cash compensation may go above 100 % but is capped at a maximum of 200 % of the targeted amount.
Group performance targets are linked to its budget and the specific metrics are sales, EBITA, free cash flow, and earnings per share (EPS). Business unit performance targets are sales, EBITA, average sales price (ASP), and operating expenses of the respective business unit. Group and business unit performance targets together are weighted at between 60 % and 80 % of the total. The three to five individual performance targets for each member of the Management Board, are weighted between 20 % and 40 % of the total.
The highest total remuneration for a Management Board member in the year under review was paid to the CEO, Lukas Braunschweiler. His fixed base salary was CHF 800,000 and the target variable cash compensation was CHF 500,000 (62.5 % of the fixed base salary). His effective variable cash payout for performance in the year under review was CHF 672’040, (84.0 % of the fixed base salary ), whereas the maximum potential variable cash payout would have been CHF 1,000,000 (125 % of the fixed base salary). In addition, an equity grant (EEAP) with a 2014 fair value of CHF 849,975, fringe benefits of CHF 24,496, employer’s pension contributions of CHF 126,764 and employer’s social insurance contribution of CHF 101,722 are all reflected in Lukas Braunschweiler’s total remuneration of CHF 2,574,997.
The following table shows the compensation for the CEO (highest compensation) and the other members of the Management Board for the financial year 2013 / 14 and the previous year. Payments to twelve other members of the Management Board are covered in the table for the 2013 / 14 financial year. The cumulated effective variable cash payout in % of the cumulated fixed base salary of the other members of the Management Board was 71.1 %. Payments to ten other members of the Management Board are covered in the table for the 2012 / 13 financial year, of whom two left the Management Board during that year.
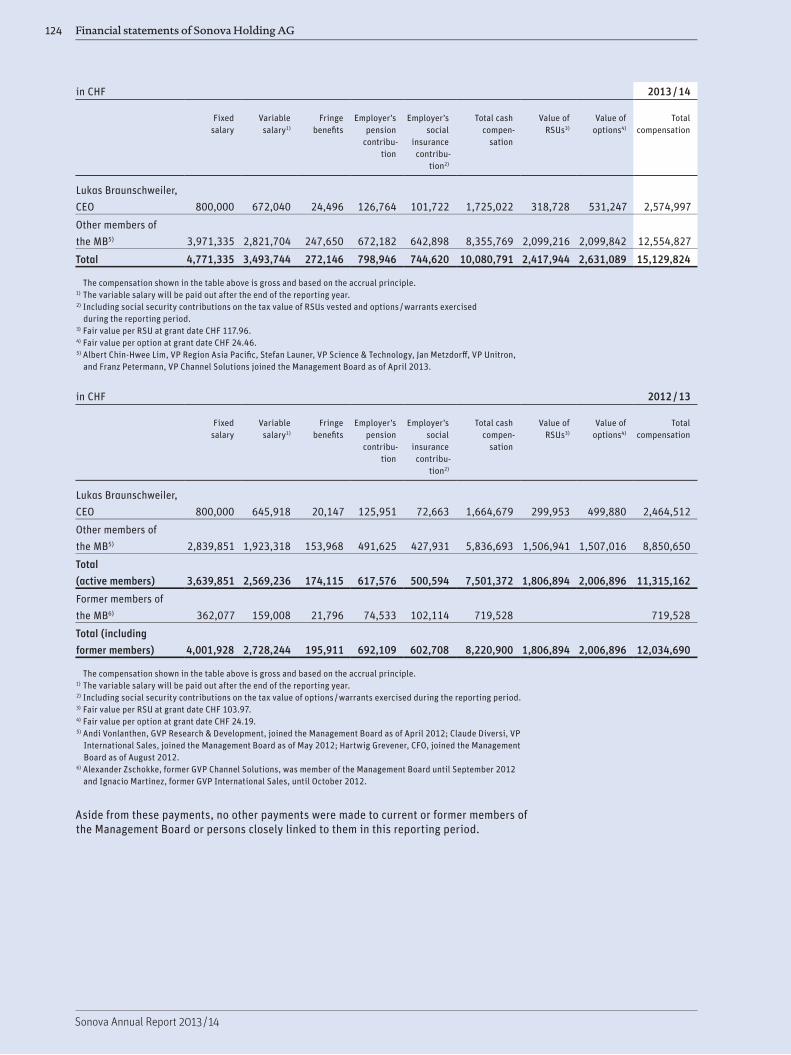
124 Financial statements of Sonova Holding AG
Sonova Annual Report 2013 / 14
in CHF 2013 / 14
Fixed salary
Variable salary1)
Fringe benefits
Employer’s pension
contribu-tion
Employer’s social
insurance contribu-
tion2)
Total cash compen-
sation
Value of RSUs3)
Value of options4)
Total compensation
Lukas Braunschweiler, CEO 800,000 672,040 24,496 126,764 101,722 1,725,022 318,728 531,247 2,574,997
Other members of the MB5) 3,971,335 2,821,704 247,650 672,182 642,898 8,355,769 2,099,216 2,099,842 12,554,827
Total 4,771,335 3,493,744 272,146 798,946 744,620 10,080,791 2,417,944 2,631,089 15,129,824
The compensation shown in the table above is gross and based on the accrual principle.1) The variable salary will be paid out after the end of the reporting year.2) Including social security contributions on the tax value of RSUs vested and options / warrants exercised
during the reporting period.3) Fair value per RSU at grant date CHF 117.96.4) Fair value per option at grant date CHF 24.46.5) Albert Chin-Hwee Lim, VP Region Asia Pacific, Stefan Launer, VP Science & Technology, Jan Metzdorff, VP Unitron,
and Franz Petermann, VP Channel Solutions joined the Management Board as of April 2013.
in CHF 2012 / 13
Fixed salary
Variable salary1)
Fringe benefits
Employer’s pension
contribu-tion
Employer’s social
insurance contribu-
tion2)
Total cash compen-
sation
Value of RSUs3)
Value of options4)
Total compensation
Lukas Braunschweiler, CEO 800,000 645,918 20,147 125,951 72,663 1,664,679 299,953 499,880 2,464,512
Other members of the MB5) 2,839,851 1,923,318 153,968 491,625 427,931 5,836,693 1,506,941 1,507,016 8,850,650
Total (active members) 3,639,851 2,569,236 174,115 617,576 500,594 7,501,372 1,806,894 2,006,896 11,315,162
Former members of the MB6) 362,077 159,008 21,796 74,533 102,114 719,528 719,528
Total (including former members) 4,001,928 2,728,244 195,911 692,109 602,708 8,220,900 1,806,894 2,006,896 12,034,690
The compensation shown in the table above is gross and based on the accrual principle.1) The variable salary will be paid out after the end of the reporting year.2) Including social security contributions on the tax value of options / warrants exercised during the reporting period.3) Fair value per RSU at grant date CHF 103.97.4) Fair value per option at grant date CHF 24.19.5) Andi Vonlanthen, GVP Research & Development, joined the Management Board as of April 2012; Claude Diversi, VP
International Sales, joined the Management Board as of May 2012; Hartwig Grevener, CFO, joined the Management Board as of August 2012.
6) Alexander Zschokke, former GVP Channel Solutions, was member of the Management Board until September 2012 and Ignacio Martinez, former GVP International Sales, until October 2012.
Aside from these payments, no other payments were made to current or former members of the Management Board or persons closely linked to them in this reporting period.

125Financial statements of Sonova Holding AG
Sonova Annual Report 2013 / 14
Additional information regarding payments to the members of the Board of Directors and the Management BoardNo fees were paid for additional services beyond the stated compensation, nor were any loans awarded or guarantees given to members of the Board of Directors or the Management Board or persons closely linked to them in this reporting period.
Shareholdings of members of the Board of Directors and the Management Board Shareholdings of the Board of DirectorsAs of March 31, 2014, the members of the Board of Directors and persons closely linked to them held directly and indirectly 3,769,112 Sonova shares / restricted shares (5.6 % of total share capital), 3,915 RSUs, 20,460 options, 5,115 SARs, 2,500,000 warrants and 250,000 WARs.
The following table shows the shareholdings of the individual members of the Board of Directors and persons closely linked to them:
31.3.2014 31.3.2013
Shares Restricted Shares1) 2)
RSUs2) Options2) Warrants2) 3) Shares Restricted Shares1) 2)
RSUs2) Options2) Warrants2) 3)
Robert F. Spoerry 15,000 11,049 500,000 12,000 7,839 950,000
Beat Hess 3,438 1,833
Michael Jacobi 2,260 3,438 783 5,115 500,000 2,000 1,833 1,043 5,115 950,000
Andy Rihs 3,713,258 3,438 783 5,115 500,000 4,560,498 1,833 1,043 5,115 950,000
Anssi Vanjoki 1,260 3,438 783 5,115 500,000 1,000 1,833 1,043 5,115 500,000
Ronald van der Vis 2,292 3,438 783 5,115 500,000 2,000 1,833 1,043 5,115 500,000
Jinlong Wang 1,605
John J. Zei 1,760 3,438 783 5,1154) 250,0005) 1,500 1,833 1,043 5,1154) 250,0005)
Total (active members) 3,735,830 33,282 3,915 25,575 2,750,000 4,578,998 18,837 5,215 25,575 4,100,000
Heliane Canepa 47,000 1,043 5,115 612,500
Total (including former member) 3,735,830 33,282 3,915 25,575 2,750,000 4,625,998 18,837 6,258 30,690 4,712,500
1) These shares are subject to a restriction period which varies from June 1, 2017 to June 1, 2019 depending on the grant date.
2) For further details see also Note 31 in the consolidated financial statements.3) Exercise ratio between warrants and options: 25:1.4) SARs (SARs grant the right to participate in the appreciation of Sonova shares without issuance of shares).5) WARs (WARs grant the right to participate in the appreciation of the Sonova shares without issuance of shares).

126 Financial statements of Sonova Holding AG
Sonova Annual Report 2013 / 14
The following table shows the detailed breakdown of the outstanding options / warrants:
31.3.2014
Options EEAP 122)
Warrants EEAP 113)
Warrants EEAP 104)
Total options
Total warrants1)
Robert F. Spoerry 250,000 250,000 500,000
Michael Jacobi 5,115 250,000 250,000 5,115 500,000
Andy Rihs 5,115 250,000 250,000 5,115 500,000
Anssi Vanjoki 5,115 250,000 250,000 5,115 500,000
Ronald van der Vis 5,115 250,000 250,000 5,115 500,000
John J. Zei 5,1155) 250,0006) 5,1155) 250,0006)
Total 25,575 1,500,000 1,250,000 25,575 2,750,000
EEAP 2014, no options or warrants have been granted - 100 % restricted shares.1) Exercise ratio between warrants and options: 25:1 (see also Note 31 in the consolidated financial statements).2) Exercise price CHF 95.85, vesting period 01.02.2012 – 01.06.2016 whereas one tranche being vested each year,
exercise period 01.06.2013 – 31.01.2019.3) Exercise price CHF 118.40, vesting period 01.03.2011 – 28.02.2015 whereas one tranche being vested each year,
exercise period 01.03.2012 – 29.02.2016.4) Exercise price CHF 131.00, vesting period 01.03.2010 – 28.02.2014 whereas one tranche being vested each year,
exercise period 01.03.2011 – 28.02.2015.5) SARs (SARs grant the right to participate in the appreciation of Sonova shares without issuance of shares).6) WARs (WARs grant the right to participate in the appreciation of the Sonova shares without issuance of shares).
31.3.2013
Options EEAP 122)
Warrants EEAP 113)
Warrants EEAP 104)
Warrants EEAP 095)
Total options
Total warrants1)
Robert F. Spoerry 250,000 250,000 450,000 950,000
Heliane Canepa 5,115 250,000 250,000 112,500 5,115 612,500
Michael Jacobi 5,115 250,000 250,000 450,000 5,115 950,000
Andy Rihs 5,115 250,000 250,000 450,000 5,115 950,000
Anssi Vanjoki 5,115 250,000 250,000 5,115 500,000
Ronald van der Vis 5,115 250,000 250,000 5,115 500,000
John J. Zei 5,1156) 250,0007) 5,1156) 250,0007)
Total 30,690 1,750,000 1,500,000 1,462,500 30,690 4,712,500
In 2013, the grants have been changed to 100 % in restricted shares.1) Exercise ratio between warrants and options: 25:1 (see also Note 31 in the consolidated financial statements).2) Exercise price CHF 95.85, vesting period 01.02.2012 – 01.06.2016 whereas one tranche being vested each year,
exercise period 01.06.2013 – 31.01.2019.3) Exercise price CHF 118.40, vesting period 01.03.2011 – 28.02.2015 whereas one tranche being vested each year,
exercise period 01.03.2012 – 29.02.2016.4) Exercise price CHF 131.00, vesting period 01.03.2010 – 28.02.2014 whereas one tranche being vested each year,
exercise period 01.03.2011 – 28.02.2015.5) Exercise price CHF 56.00, vesting period 01.03.2009 – 28.02.2013 whereas one tranche being vested each year,
exercise period 01.03.2010 – 28.02.2014.6) SARs (SARs grant the right to participate in the appreciation of Sonova shares without issuance of shares).7) WARs (WARs grant the right to participate in the appreciation of the Sonova shares without issuance of shares).

127Financial statements of Sonova Holding AG
Sonova Annual Report 2013 / 14
Shareholdings of the Management Board As of March 31, 2014, the members of the Management Board and persons closely linked to them held directly or indirectly 29,886 Sonova shares, 55,964 RSUs, 317,938 options, and 5,807,000 warrants.
The following table shows the shareholdings of the individual members of the Management Board and persons closely linked to them:
31.3.2014 31.3.2013
Shares RSUs1) Options1) Warrants1) 2) Shares RSUs1) Options1) Warrants1) 2)
Lukas Braunschweiler 7,782 7,934 67,963 7,000 6,014 46,244
Maarten Barmentlo 1,000 5,183 26,673 869,000 4,009 18,497 869,000
Claude Diversi 280 3,145 16,073 450,000 2,154 9,941 512,500
Hansjürg Emch 2,759 5,289 27,184 661,000 2,238 4,009 18,497 661,000
Hartwig Grevener 3,724 16,954 1,923 8,267
Sarah Kreienbühl 1,000 5,289 27,184 843,750 479 4,009 18,497 1,281,250
Stefan Launer3) 1,802 2,495 12,923 474,000
Albert Chin-Hwee Lim3) 2,020 9,243
Hans Mehl 1,851 5,289 27,184 1,012,500 1,330 4,009 18,497 1,137,500
Jan Metzdorff3) 766 3,202 14,500 93,750
Franz Petermann3) 853 2,012 8,968 111,250
Paul Thompson 2,621 5,289 37,184 843,750 2,100 4,009 38,497 1,281,250
Andi Vonlanthen 9,172 5,093 25,905 448,000 8,932 3,748 17,218 728,000
Total 29,886 55,964 317,938 5,807,000 22,079 33,884 194,155 6,470,500
1) For further details see also Note 31 in the consolidated financial statements.2) Exercise ratio between warrants and options: 25:1 (see also Note 31 in the consolidated financial statements).3) Member of the Management Board since April 2013.

128 Financial statements of Sonova Holding AG
Sonova Annual Report 2013 / 14
The following table shows the detailed breakdown of the outstanding options / warrants:
31.3.2014
Options EEAP 142)
Options EEAP 133)
Options EEAP 124)
Options (interim
CEO / CFO) 11 / 125)
Warrants EEAP 116)
Warrants EEAP 107)
Total options
Total warrants1)
Lukas Braunschweiler 21,719 20,669 25,575 67,963
Maarten Barmentlo 8,176 8,267 10,230 475,000 394,000 26,673 869,000
Claude Diversi 6,132 4,443 5,498 225,000 225,000 16,073 450,000
Hansjürg Emch 8,687 8,267 10,230 475,000 186,000 27,184 661,000
Hartwig Grevener 8,687 8,267 16,954
Sarah Kreienbühl 8,687 8,267 10,230 281,250 562,500 27,184 843,750
Stefan Launer 4,088 3,720 5,115 250,000 224,000 12,923 474,000
Albert Chin-Hwee Lim 5,110 4,133 9,243
Hans Mehl 8,687 8,267 10,230 562,500 450,000 27,184 1,012,500
Jan Metzdorff 6,132 4,340 4,028 31,250 62,500 14,500 93,750
Franz Petermann 4,088 3,307 1,573 48,750 62,500 8,968 111,250
Paul Thompson 8,687 8,267 10,230 10,000 281,250 562,500 37,184 843,750
Andi Vonlanthen 8,687 8,267 8,951 224,000 224,000 25,905 448,000
Total 107,567 98,481 101,890 10,000 2,854,000 2,953,000 317,938 5,807,000
1) Exercise ratio between warrants and options: 25:1 (see also Note 31 in the consolidated financial statements).2) Exercise price CHF 124.60, vesting period 01.02.2014 – 01.06.2018 whereas one tranche being vested each year, exercise period 01.06.2015 – 31.01.2021.3) Exercise price CHF 109.10, vesting period 01.02.2013 – 01.06.2017 whereas one tranche being vested each year, exercise period 01.06.2014 – 31.01.2020.4) Exercise price CHF 95.85, vesting period 01.02.2012 – 01.06.2016 whereas one tranche being vested each year, exercise period 01.06.2013 – 31.01.2019.5) Exercise price CHF 88.30, vesting period 28.05.2011 – 27.05.2015 whereas one tranche being vested each year, exercise period 28.05.2012 – 27.05.2016.6) Exercise price CHF 118.40, vesting period 01.03.2011 – 28.02.2015 whereas one tranche being vested each year, exercise period 01.03.2012 – 29.02.2016.7) Exercise price CHF 131.00, vesting period 01.03.2010 – 28.02.2014 whereas one tranche being vested each year, exercise period 01.03.2011 – 28.02.2015.
31.3.2013
Options EEAP 132)
Options EEAP 123)
Options (interim
CEO / CFO) 11 / 125)
Warrants EEAP 115)
Warrants EEAP 106)
Warrants EEAP 097)
Total options
Total warrants1)
Lukas Braunschweiler 20,669 25,575 46,244
Maarten Barmentlo 8,267 10,230 475,000 394,000 18,497 869,000
Claude Diversi 4,443 5,498 225,000 225,000 62,500 9,941 512,500
Hansjürg Emch 8,267 10,230 475,000 186,000 18,497 661,000
Hartwig Grevener 8,267 8,267
Sarah Kreienbühl 8,267 10,230 562,500 562,500 156,250 18,497 1,281,250
Hans Mehl 8,267 10,230 562,500 450,000 125,000 18,497 1,137,500
Paul Thompson 8,267 10,230 20,000 562,500 562,500 156,250 38,497 1,281,250
Andi Vonlanthen 8,267 8,951 224,000 224,000 280,000 17,218 728,000
Total 82,981 91,174 20,000 3,086,500 2,604,000 780,000 194,155 6,470,500
1) Exercise ratio between warrants and options: 25:1 (see also Note 31 in the consolidated financial statements).2) Exercise price CHF 109.10, vesting period 01.02.2013 – 01.06.2017 whereas one tranche being vested each year, exercise period 01.06.2014 – 31.01.2020.3) Exercise price CHF 95.85, vesting period 01.02.2012 – 01.06.2016 whereas one tranche being vested each year, exercise period 01.06.2013 – 31.01.2019.4) Exercise price CHF 88.30, vesting period 28.05.2011 – 27.05.2015 whereas one tranche being vested each year, exercise period 28.05.2012 – 27.05.2016.5) Exercise price CHF 118.40, vesting period 01.03.2011 – 28.02.2015 whereas one tranche being vested each year, exercise period 01.03.2012 – 29.02.2016.6) Exercise price CHF 131.00, vesting period 01.03.2010 – 28.02.2014 whereas one tranche being vested each year, exercise period 01.03.2011 – 28.02.2015.7) Exercise price CHF 56.00, vesting period 01.03.2009 – 28.02.2013 whereas one tranche being vested each year, exercise period 01.03.2010 – 28.02.2014.

129Financial statements of Sonova Holding AG
Sonova Annual Report 2013 / 14
Appropriation of available earnings
As proposed by the Board of Directors to the Annual General Shareholders’ Meeting of June 17, 2014:
1,000 CHF 31.3.2014 31.3.20131)
Carried forward from previous year 1,427,440 964,876
Allocation from reserve for treasury shares 1,537 1,417
Net profit for the year 258,231 461,147
Available earnings 1,687,208 1,427,440
Dividend distribution (127,610)
Balance to be carried forward 1,559,598 1,427,440
1) Approved by the Annual General Shareholders’ Meeting of June 18, 2013.2) If the Annual Shareholders’ Meeting approves the proposed appropriation of available
earnings, a gross dividend of CHF 1.90 per registered share of CHF 0.05 will be paid out (previous year distribution of CHF 1.60 from reserve from capital contributions).
Reserve from capital contributions
1,000 CHF 31.3.2014 31.3.20131)
Carried forward from previous year 16,896 69,977
Capital increase from conditional capital 1,646 54,360
Reserve from capital contributions 18,542 124,337
Distribution (107,441)
Balance to be carried forward 18,542 16,896
1) Approved by the Annual General Shareholders’ Meeting of June 18, 2013.

130130 Financial statements of Sonova Holding AG
Sonova Annual Report 2013 / 14
Report of the statutory auditor on the financial statements 2013 / 14 to the Annual General Shareholders’ Meeting of Sonova Holding AG Stäfa
Report of the statutory auditor on the financial statementsAs statutory auditor, we have audited the financial statements of Sonova Holding AG, which comprise the income statement, balance sheet and notes (pages 116 to 129) for the year ended March 31, 2014.
Board of directors’ responsibilityThe Board of Directors is responsible for the preparation of the financial statements in accordance with the requirements of Swiss law and the company’s articles of incorporation. This responsibility includes designing, implementing and maintaining an internal control system relevant to the preparation of financial statements that are free from material misstatement, whether due to fraud or error. The Board of Directors is further responsible for selecting and applying appropriate accounting policies and making accounting estimates that are reasonable in the circumstances.
Auditor’s responsibilityOur responsibility is to express an opinion on these financial statements based on our audit. We conducted our audit in accordance with Swiss law and Swiss Auditing Standards. Those standards require that we plan and perform the audit to obtain reasonable assurance whether the financial statements are free from material misstatement.
An audit involves performing procedures to obtain audit evidence about the amounts and disclosures in the financial statements. The procedures selected depend on the auditor’s judgment, including the assessment of the risks of material misstatement of the financial statements, whether due to fraud or error. In making those risk assessments, the auditor considers the internal control system relevant to the entity’s preparation of the financial statements in order to design audit procedures that are appropriate in the circumstances, but not for the purpose of expressing an opinion on the effectiveness of the entity’s internal control system. An audit also includes evaluating the appropriateness of the accounting policies used and the reasonableness of accounting estimates made, as well as evaluating the overall presentation of the financial statements. We believe that the audit evidence we have obtained is sufficient and appropriate to provide a basis for our audit opinion.
OpinionIn our opinion, the financial statements for the year ended March 31, 2014, comply with Swiss law and the company’s articles of incorporation.
Report on other legal requirementsWe confirm that we meet the legal requirements on licensing according to the Auditor Oversight Act (AOA) and independence (article 728 CO and article 11 AOA) and that there are no circumstances incompatible with our independence.
In accordance with article 728a paragraph 1 item 3 CO and Swiss Auditing Standard 890, we confirm that an internal control system exists which has been designed for the preparation of financial statements according to the instructions of the Board of Directors.
We further confirm that the proposed appropriation of available earnings complies with Swiss law and the company’s articles of incorporation. We recommend that the financial statements submitted to you be approved.
PricewaterhouseCoopers AG
Sandra Boehm Gian Franco BielerAudit expert Audit expertAuditor in charge
Zurich, May 14, 2014
Report of the statutory auditor on the financial statements

This page has intentionally been left blank
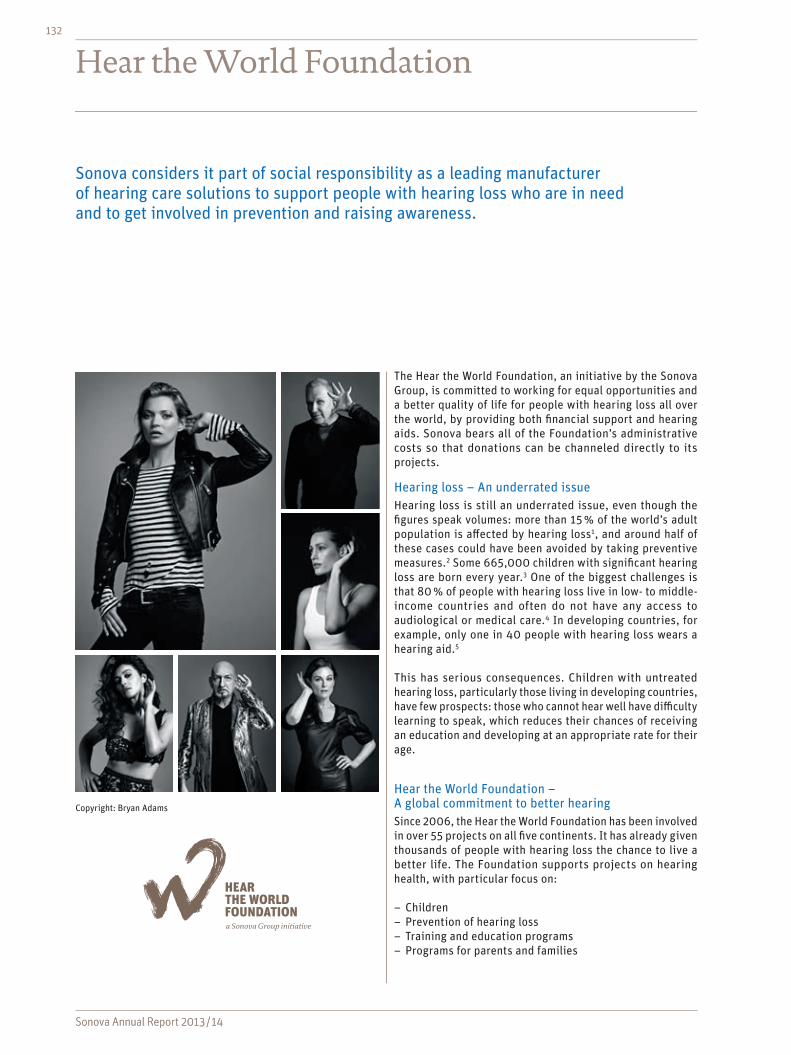
Sonova Annual Report 2013 / 14
132
Hear the World Foundation
Copyright: Bryan Adams
Sonova Annual Report 2013 / 14
Sonova considers it part of social responsibility as a leading manufacturer of hearing care solutions to support people with hearing loss who are in need and to get involved in prevention and raising awareness.
The Hear the World Foundation, an initiative by the Sonova Group, is committed to working for equal opportunities and a better quality of life for people with hearing loss all over the world, by providing both financial support and hearing aids. Sonova bears all of the Foundation’s administrative costs so that donations can be channeled directly to its projects.
Hearing loss – An underrated issueHearing loss is still an underrated issue, even though the figures speak volumes: more than 15 % of the world’s adult population is affected by hearing loss1, and around half of these cases could have been avoided by taking preventive measures.2 Some 665,000 children with significant hearing loss are born every year.3 One of the biggest challenges is that 80 % of people with hearing loss live in low- to middle-income countries and often do not have any access to audiological or medical care.4 In developing countries, for example, only one in 40 people with hearing loss wears a hearing aid.5
This has serious consequences. Children with untreated hearing loss, particularly those living in developing countries, have few prospects: those who cannot hear well have difficulty learning to speak, which reduces their chances of receiving an education and developing at an appropriate rate for their age.
Hear the World Foundation – A global commitment to better hearingSince 2006, the Hear the World Foundation has been involved in over 55 projects on all five continents. It has already given thousands of people with hearing loss the chance to live a better life. The Foundation supports projects on hearing health, with particular focus on:
– Children– Prevention of hearing loss– Training and education programs – Programs for parents and families
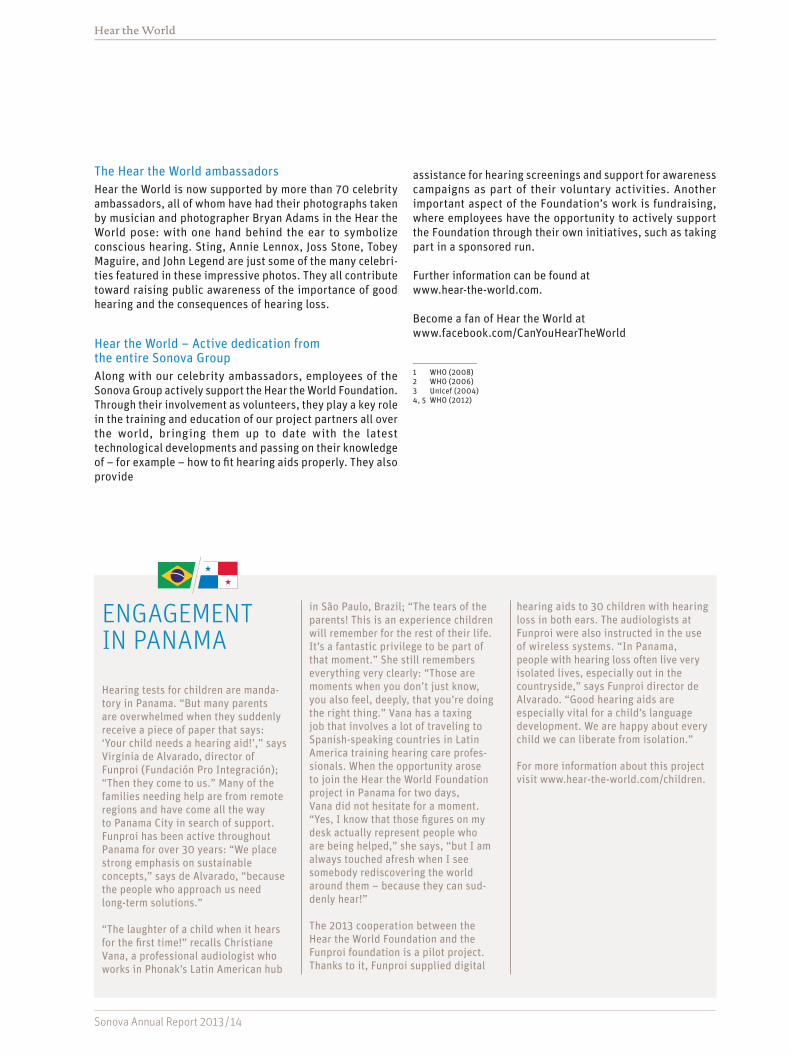
Highlights2013 14
Key figures2013 14
Key
figu
res
Hig
hli
ghts
Asia/Paci�c
Americas (excl. USA)
USA
EMEA
Cochlear Implants and Accessories
Miscellaneous
Wireless Communication Systems
Standard Hearing Instruments
Advanced Hearing Instruments
Premium Hearing Instruments
11
37
11 41
USA
Americas (excl. USA)
EMEA
Asia/Pacific 10
413 22
2229
PremiumHearing Instruments
StandardHearing
Instruments
WirelessCommunication
Systems
Miscellaneous
Cochlear Implants and Accessories
AdvancedHearingInstruments
SALES BY REGIONS 2013/14 IN % SALES BY PRODUCT GROUPS 2013/14 IN %
Asia/Paci�c
Americas (excl. USA)
USA
EMEA
Cochlear Implants and Accessories
Miscellaneous
Wireless Communication Systems
Standard Hearing Instruments
Advanced Hearing Instruments
Premium Hearing Instruments
11
37
11 41
USA
Americas (excl. USA)
EMEA
Asia/Pacific 10
413 22
2229
PremiumHearing Instruments
StandardHearing
Instruments
WirelessCommunication
Systems
Miscellaneous
Cochlear Implants and Accessories
AdvancedHearingInstruments
SALES BY REGIONS 2013/14 IN % SALES BY PRODUCT GROUPS 2013/14 IN %
800
600
400
200
0
1,400
1,200
1,000
1,600
1,800
2,000
45
40
35
30
25
20
15
10
5
0
450
400
350
300
250
200
150
100
50
0
450
400
350
300
250
200
150
100
50
0
9.00
8.00
7.00
6.00
5.00
4.00
3.00
2.00
1.00
0.00
450
400
350
300
250
200
150
100
50
0
SALES IN CHF M
EBITA IN CHF M EBITA MARGIN IN %
OPERATING FREE CASH FLOW IN CHF M
INCOME AFTER TAXES IN CHF M EPS IN CHF
2013
/14
20
09
/10
2010
/11
2011
/12
2012
/13
1,951
2013
/14
200
9/1
0¹⁾
2010
/11
2011
/12
2012
/13²
⁾3 ⁾
430
2013
/14
200
9/1
0
2010
/11
2011
/12
2012
/13
318
2013
/14
200
9/1
0¹⁾
2010
/11
2011
/12
2012
/13²
⁾3 ⁾
347
800
600
400
200
0
1,400
1,200
1,000
1,600
1,800
2,000
45
40
35
30
25
20
15
10
5
0
450
400
350
300
250
200
150
100
50
0
450
400
350
300
250
200
150
100
50
0
9.00
8.00
7.00
6.00
5.00
4.00
3.00
2.00
1.00
0.00
450
400
350
300
250
200
150
100
50
0
SALES IN CHF M
EBITA IN CHF M EBITA MARGIN IN %
OPERATING FREE CASH FLOW IN CHF M
INCOME AFTER TAXES IN CHF M EPS IN CHF
2013
/14
20
09
/10
2010
/11
2011
/12
2012
/13
1,951
2013
/14
200
9/1
0¹⁾
2010
/11
2011
/12
2012
/13²
⁾3 ⁾
430
2013
/14
200
9/1
0
2010
/11
2011
/12
2012
/13
318
2013
/14
200
9/1
0¹⁾
2010
/11
2011
/12
2012
/13²
⁾3 ⁾
347
1) Restated based on finalization of the acquisition accounting of Advanced Bionics.2) Restated following the implementation of IAS 19 (revised), refer Note 2.1. of the consolidated financial statements.3) Excluding one-off cost, mainly related to the increase of the product liability provision within the cochlear implants business
(see Note 7 of the consolidated financial statements).
+ 11.7 % sales growth in local currenciesConsolidated sales for the Group were CHF 1,951 million, up 8.7 % in Swiss f rancs and 11.7 % in local currencies. Both the hearing instruments and cochlear implants seg ment and all major regions cont r ibu- ted to the increase.
+ 8.8 % organic growth in hearing instrumentsDriven almost exclusively by organic growth, sales in the hear ing inst r uments segment reached CHF 1,756 million, an inc rea se of 6 . 5 % in Swiss f rancs and 9.5 % in local currencies. The bu siness out paced the estimated market growth rates and f ur ther expanded the Group’s leading market posit ion.
CHF 311.5 million net cash positionThe Group’s strong cash f lows resulted in a sound end-of-year balance sheet and solid net cash posit ion of CHF 311.5 million. The Board of Directors proposes to the 2014 AGM a dividend of CHF 1.90, up 19% f rom the distribution in the prior year.
ROCE of 27.7 % staying on track The return on capital em-ployed (ROCE) was 27.7 %, well on track towards our mid-ter m f inancial targets.
The Sonova Group has shown solid perfor mance in the f inancial year 2013/14. Thelaunch of new products and solutions across the business, drove sales and ear n ings g rowth. Our con stant pursuit of customer-driven innovation, paid off in strong results in both our business segments and all our brands.
6.6 % EBITA margin in cochlear implantsThe cochlear implants seg-ment achieved sales of CHF 195 million, an increase of 33.1% in Swiss f rancs and 36.0 % in local currencies.The prof itability improved st rongly, reaching CHF 12.8 million, representing an operating margin of 6.6 %.
CHF 430.1 million EBITA + 16.7 % in local currencies Group EBI TA reached CHF 430.1 million, up 11.6 % in Swiss f rancs and 16.7 % in local cur rencies versus the prior year (normalized for the ef fec t of one-of f costs). Operating margin improved by 50 basis points to 22.0 %, despite adverse cur rency impact.
SONOVA GROUP KEY FIGURES
in CHF m unless otherwise specified 2013 / 14Change in % (normalized)
Normalized performance 2012 / 131)/2)
Change in % (reported)
Reported performance
2012/131)
Sales 1,951.3 8.7% 1,795.3 8.7% 1,795.3
EBITA 430.1 11.6% 385.3 136.7% 181.7
EBITA margin 22.0% 21.5% 10.1%
EPS (CHF) 5.08 10.4% 4.60 207.9% 1.65
Operating free cash flow2) 318.4 (0.0%) 318.6 (0.0%) 318.6
ROCE3) 27.7% 10.4% 10.4%
ROE3) 20.3% 7.1% 7.1%
1) Restated following the implementation of IAS 19 (revised), see Note 2.1. of the consolidated financial statements.2) Excluding one-off cost, mainly related to the increase of the product liability provision within the cochlear implants business (see Note 7 of
the consolidated financial statements). Balance sheet related key figures (including respective ratios) as reported.3) For detailed definitions, please refer to “5 Year Key Figures”.
Hear the World
Sonova Annual Report 2013 / 14
ENGAGEMENT IN PANAMA
Hearing tests for children are manda-tory in Panama. “But many parents are overwhelmed when they suddenly receive a piece of paper that says: ‘Your child needs a hearing aid!’,” says Virginia de Alvarado, director of Funproi (Fundación Pro Integración); “Then they come to us.” Many of the families needing help are from remote regions and have come all the way to Panama City in search of support. Funproi has been active throughout Panama for over 30 years: “We place strong emphasis on sustainable concepts,” says de Alvarado, “because the people who approach us need long-term solutions.”
“The laughter of a child when it hears for the first time!” recalls Christiane Vana, a professional audiologist who works in Phonak’s Latin American hub
in São Paulo, Brazil; “The tears of the parents! This is an experience children will remember for the rest of their life. It’s a fantastic privilege to be part of that moment.” She still remembers everything very clearly: “Those are moments when you don’t just know, you also feel, deeply, that you’re doing the right thing.” Vana has a taxing job that involves a lot of traveling to Spanish-speaking countries in Latin America training hearing care profes-sionals. When the opportunity arose to join the Hear the World Foundation project in Panama for two days, Vana did not hesitate for a moment. “Yes, I know that those figures on my desk actually represent people who are being helped,” she says, “but I am always touched afresh when I see somebody rediscovering the world around them – because they can sud-denly hear!”
The 2013 cooperation between the Hear the World Foundation and the Funproi foundation is a pilot project. Thanks to it, Funproi supplied digital
hearing aids to 30 children with hearing loss in both ears. The audiologists at Funproi were also instructed in the use of wireless systems. “In Panama, people with hearing loss often live very isolated lives, especially out in the countryside,” says Funproi director de Alvarado. “Good hearing aids are especially vital for a child’s language development. We are happy about every child we can liberate from isolation.”
For more information about this project visit www.hear-the-world.com/children.
The Hear the World ambassadorsHear the World is now supported by more than 70 celebrity ambassadors, all of whom have had their photographs taken by musician and photographer Bryan Adams in the Hear the World pose: with one hand behind the ear to symbolize conscious hearing. Sting, Annie Lennox, Joss Stone, Tobey Maguire, and John Legend are just some of the many celebri-ties featured in these impressive photos. They all contribute toward raising public awareness of the importance of good hearing and the consequences of hearing loss.
Hear the World – Active dedication from the entire Sonova Group Along with our celebrity ambassadors, employees of the Sonova Group actively support the Hear the World Foundation. Through their involvement as volunteers, they play a key role in the training and education of our project partners all over the world, bringing them up to date with the latest technological developments and passing on their knowledge of – for example – how to fit hearing aids properly. They also provide
assistance for hearing screenings and support for awareness campaigns as part of their voluntary activities. Another important aspect of the Foundation’s work is fundraising, where employees have the opportunity to actively support the Foundation through their own initiatives, such as taking part in a sponsored run.
Further information can be found at www.hear-the-world.com.
Become a fan of Hear the World at www.facebook.com/CanYouHearTheWorld
1 WHO (2008)2 WHO (2006)3 Unicef (2004) 4, 5 WHO (2012)
Help for children in Panama: In a project launched by the Hear the World Foundation, the Funproi foundation received a donation of hearing aids. The fitting of the hearing aids on location was accom-panied by Sonova employee Christiane Vana from Brazil on an active assignment for the Hear the World Foundation.
000_SO_MR_1314_Cover_EN.indd 6-10 19.05.2014 10:20:53

Highlights2013 14
Key figures2013 14
Key
figu
res
Hig
hli
ghts
Asia/Paci�c
Americas (excl. USA)
USA
EMEA
Cochlear Implants and Accessories
Miscellaneous
Wireless Communication Systems
Standard Hearing Instruments
Advanced Hearing Instruments
Premium Hearing Instruments
11
37
11 41
USA
Americas (excl. USA)
EMEA
Asia /Pacific 10
413 22
2229
PremiumHearing Instruments
StandardHearing
Instruments
WirelessCommunication
Systems
Miscellaneous
Cochlear Implants and Accessories
AdvancedHearingInstruments
SALES BY REGIONS 2013/14 IN % SALES BY PRODUCT GROUPS 2013/14 IN %
800
600
400
200
0
1,400
1,200
1,000
1,600
1,800
2,000
45
40
35
30
25
20
15
10
5
0
450
400
350
300
250
200
150
100
50
0
450
400
350
300
250
200
150
100
50
0
9.00
8.00
7.00
6.00
5.00
4.00
3.00
2.00
1.00
0.00
450
400
350
300
250
200
150
100
50
0
SALES IN CHF M
EBITA IN CHF M EBITA MARGIN IN %
OPERATING FREE CASH FLOW IN CHF M
INCOME AFTER TAXES IN CHF M EPS IN CHF
2013
/14
20
09
/10
2010
/11
2011
/12
2012
/13
1,951
2013
/14
200
9/1
0¹⁾
2010
/11
2011
/12
2012
/13²
⁾3 ⁾
430
2013
/14
200
9/1
0
2010
/11
2011
/12
2012
/13
318
2013
/14
200
9/1
0¹⁾
2010
/11
2011
/12
2012
/13²
⁾3 ⁾
347
1) Restated based on finalization of the acquisition accounting of Advanced Bionics.2) Restated following the implementation of IAS 19 (revised), refer Note 2.1. of the consolidated financial statements.3) Excluding one-off cost, mainly related to the increase of the product liability provision within the cochlear implants business
(see Note 7 of the consolidated financial statements).
+ 11.7 % sales growth in local currenciesConsolidated sales for the Group were CHF 1,951 million, up 8.7 % in Swiss f rancs and 11.7 % in local currencies. Both the hearing instruments and cochlear implants seg ment and all major regions cont r ibu- ted to the increase.
+ 8.8 % organic growth in hearing instrumentsDriven almost exclusively by organic growth, sales in the hear ing inst r uments segment reached CHF 1,756 million, an inc rea se of 6 . 5 % in Swiss f rancs and 9.5 % in local currencies. The bu siness out paced the estimated market growth rates and f ur ther expanded the Group’s leading market posit ion.
CHF 311.5 million net cash positionThe Group’s strong cash f lows resulted in a sound end-of-year balance sheet and solid net cash posit ion of CHF 311.5 million. The Board of Directors proposes to the 2014 AGM a dividend of CHF 1.90, up 19% f rom the distribution in the prior year.
ROCE of 27.7 % staying on track The return on capital em-ployed (ROCE) was 27.7 %, well on track towards our mid-ter m f inancial targets.
The Sonova Group has shown solid perfor mance in the f inancial year 2013/14. Thelaunch of new products and solutions across the business, drove sales and ear n ings g rowth. Our con stant pursuit of customer-driven innovation, paid off in strong results in both our business segments and all our brands.
6.6 % EBITA margin in cochlear implantsThe cochlear implants seg-ment achieved sales of CHF 195 million, an increase of 33.1% in Swiss f rancs and 36.0 % in local currencies.The prof itability improved st rongly, reaching CHF 12.8 million, representing an operating margin of 6.6 %.
CHF 430.1 million EBITA + 16.7 % in local currencies Group EBI TA reached CHF 430.1 million, up 11.6 % in Swiss f rancs and 16.7 % in local cur rencies versus the prior year (normalized for the ef fec t of one-of f costs). Operating margin improved by 50 basis points to 22.0 %, despite adverse cur rency impact.
SONOVA GROUP KEY FIGURES
in CHF m unless otherwise specified 2013 / 14Change in % (normalized)
Normalized performance 2012 / 131)/2)
Change in % (reported)
Reported performance
2012/131)
Sales 1,951.3 8.7% 1,795.3 8.7% 1,795.3
EBITA 430.1 11.6% 385.3 136.7% 181.7
EBITA margin 22.0% 21.5% 10.1%
EPS (CHF) 5.08 10.4% 4.60 207.9% 1.65
Operating free cash flow2) 318.4 (0.0%) 318.6 (0.0%) 318.6
ROCE3) 27.7% 10.4% 10.4%
ROE3) 20.3% 7.1% 7.1%
1) Restated following the implementation of IAS 19 (revised), see Note 2.1. of the consolidated financial statements.2) Excluding one-off cost, mainly related to the increase of the product liability provision within the cochlear implants business (see Note 7 of
the consolidated financial statements). Balance sheet related key figures (including respective ratios) as reported.3) For detailed definitions, please refer to “5 Year Key Figures”.
Hear the World
Sonova Annual Report 2013 / 14
ENGAGEMENT IN PANAMA
Hearing tests for children are manda-tory in Panama. “But many parents are overwhelmed when they suddenly receive a piece of paper that says: ‘Your child needs a hearing aid!’,” says Virginia de Alvarado, director of Funproi (Fundación Pro Integración); “Then they come to us.” Many of the families needing help are from remote regions and have come all the way to Panama City in search of support. Funproi has been active throughout Panama for over 30 years: “We place strong emphasis on sustainable concepts,” says de Alvarado, “because the people who approach us need long-term solutions.”
“The laughter of a child when it hears for the first time!” recalls Christiane Vana, a professional audiologist who works in Phonak’s Latin American hub
in São Paulo, Brazil; “The tears of the parents! This is an experience children will remember for the rest of their life. It’s a fantastic privilege to be part of that moment.” She still remembers everything very clearly: “Those are moments when you don’t just know, you also feel, deeply, that you’re doing the right thing.” Vana has a taxing job that involves a lot of traveling to Spanish-speaking countries in Latin America training hearing care profes-sionals. When the opportunity arose to join the Hear the World Foundation project in Panama for two days, Vana did not hesitate for a moment. “Yes, I know that those figures on my desk actually represent people who are being helped,” she says, “but I am always touched afresh when I see somebody rediscovering the world around them – because they can sud-denly hear!”
The 2013 cooperation between the Hear the World Foundation and the Funproi foundation is a pilot project. Thanks to it, Funproi supplied digital
hearing aids to 30 children with hearing loss in both ears. The audiologists at Funproi were also instructed in the use of wireless systems. “In Panama, people with hearing loss often live very isolated lives, especially out in the countryside,” says Funproi director de Alvarado. “Good hearing aids are especially vital for a child’s language development. We are happy about every child we can liberate from isolation.”
For more information about this project visit www.hear-the-world.com/children.
The Hear the World ambassadorsHear the World is now supported by more than 70 celebrity ambassadors, all of whom have had their photographs taken by musician and photographer Bryan Adams in the Hear the World pose: with one hand behind the ear to symbolize conscious hearing. Sting, Annie Lennox, Joss Stone, Tobey Maguire, and John Legend are just some of the many celebri-ties featured in these impressive photos. They all contribute toward raising public awareness of the importance of good hearing and the consequences of hearing loss.
Hear the World – Active dedication from the entire Sonova Group Along with our celebrity ambassadors, employees of the Sonova Group actively support the Hear the World Foundation. Through their involvement as volunteers, they play a key role in the training and education of our project partners all over the world, bringing them up to date with the latest technological developments and passing on their knowledge of – for example – how to fit hearing aids properly. They also provide
assistance for hearing screenings and support for awareness campaigns as part of their voluntary activities. Another important aspect of the Foundation’s work is fundraising, where employees have the opportunity to actively support the Foundation through their own initiatives, such as taking part in a sponsored run.
Further information can be found at www.hear-the-world.com.
Become a fan of Hear the World at www.facebook.com/CanYouHearTheWorld
1 WHO (2008)2 WHO (2006)3 Unicef (2004) 4, 5 WHO (2012)
Help for children in Panama: In a project launched by the Hear the World Foundation, the Funproi foundation received a donation of hearing aids. The fitting of the hearing aids on location was accom-panied by Sonova employee Christiane Vana from Brazil on an active assignment for the Hear the World Foundation.
000_SO_MR_1314_Cover_EN.indd 6-10 19.05.2014 10:20:53

Annual Report 2013 14
An
nua
l Rep
ort 2
013
14
Investor information
Our Brands
Sonova Holding AGLaubisrütistrasse 288712 StäfaSwitzerlandPhone +41 58 928 33 33Fax +41 58 928 33 [email protected] www.sonova.com
DisclaimerThis report contains forward-looking statements which offer no guarantee with regard to future performance. These statements are made on the basis of management’s views and assumptions regarding future events and business performance at the time the statements are made. They are subject to risks and uncertainties including, but not confined to, future global economic conditions, exchange rates, legal provisions, market conditions, activities by competitors and other factors outside the company’s control.
Impr
int
Conc
ept &
Des
ign:
hild
a de
sign
mat
ters
, Zur
ich
Phot
ogra
phy:
Bra
zil —
Ehr
in M
acks
ey, V
ietn
am; G
roup
pho
tos
— Jo
s Sc
hmid
, Zur
ich
Publ
ishi
ng S
yste
m: M
ulti
med
ia S
olut
ions
AG
, Zur
ich
/ Pri
ntin
g: N
eidh
art +
Sch
ön A
G, Z
uric
h
This
Ann
ual R
epor
t is
also
ava
ilabl
e in
Ger
man
. Th
e En
glis
h ve
rsio
n is
the
gove
rnin
g te
xt.
028-
1303
-02
Prin
ted
in S
witz
erla
nd
©So
nova
Hol
ding
AG
201
4 Al
l rig
hts
rese
rved
Financial calendar
June 17, 2014General Shareholders’ Meeting of Sonova Holding AG at Zurich Hallenstadion, Zurich-Oerlikon
November 17, 2014Publication of Semi-Annual Report as of September 30, 2014Media and Analysts Conference
May 19, 2015Publication of Annual Report as of March 31, 2015Media and Analysts Conference
June 16, 2015General Shareholders’ Meeting of Sonova Holding AG at Zurich Hallenstadion, Zurich-Oerlikon
Financial informationCorporate & ad hoc news Annual Reports Semi-Annual Reports IR presentations www.sonova.com/en/investors
Information on the General Shareholders’ MeetingInvitation and agenda General Shareholders’ Meeting presentations General Shareholders’ Meeting minutes www.sonova.com/en/AGM
IR online news serviceIR News Service www.sonova.com/en/registration
Contact formwww.sonova.com/en/contact-us
Order form for financial reportswww.sonova.com/en/order-form
Sonova HeadquartersSonova Holding AGInvestor Relations Laubisrütistrasse 28CH-8712 StäfaSwitzerland Phone +41 58 928 33 33Fax +41 58 928 33 99E-mail [email protected] Website www.sonova.com
Director Investor Relations Thomas Bernhardsgrütter
Investor Relations AssociatesNicole JenniCorinne Hofmann
Share register ShareCommService AG Verena Deil Europastrasse 29 CH-8152 Glattbrugg Switzerland Phone +41 44 809 58 53Fax +41 44 809 58 59
Capital structure and shareholder rights
Share datawww.sonova.com/en/investors/share-data
Shareholder structure www.sonova.com/en/investors/ shareholder-structure
Restrictions on shareholder rights www.sonova.com/en/investors/ shareholder-participation-rights
Regulations and principlesArticles of AssociationOrganizational RegulationsRules on Board Operations and ProceduresCommittee ChartersCode of Conduct Supplier Principleswww.sonova.com/en/investors/ articles-association
Innovation – The key to emerging markets
For Sonova, growth potential in emerging countries is even greater than in our established markets. Such great opportunities present unique challenges: the aspirations of millions of new consumers can only be met through new approaches.
We unlock the potential of emerging markets with the key of con tinuous innovation – in what we make, how we make it, and how we sell it. We have validated that strategy through our business success in Brazil, illustrated in the stories throughout this report.
000_SO_MR_1314_Cover_EN.indd 1-5 19.05.2014 10:20:50