Thames Valley Multi Modal Study - Wycombe
168
Thames Valley Multi Modal Study Final Report JOB NUMBER: 441 1239 DOCUMENT REF: 6352-T.545 FINAL 14/1//03 Final – Steering Group 6/1 02/1/03 Second draft PWR TEM/PJG PWR 13/12/02 First draft PRW PWR 6/12/02 Originated Checked Reviewed Authorised Date Revision Purpose Description
Transcript of Thames Valley Multi Modal Study - Wycombe

Thames Valley Multi Modal Study
Final Report
JOB NUMBER: 441 1239 DOCUMENT REF: 6352-T.545
FINAL 14/1//03
Final – Steering Group 6/1 02/1/03
Second draft PWR TEM/PJG PWR 13/12/02
First draft PRW PWR 6/12/02
Originated Checked Reviewed Authorised Date
Revision Purpose Description

THAMES VALLEY MULTI MODAL STUDY Final Report
441 1239 i 6352-T.545-pic
Contents Section Page
1. Introduction 1-1 Background 1-1 Study Context 1-1 The Study Area 1-1 Scope of the Study 1-2 Study Overview 1-2 Structure of the Report 1-3
2. The Need for a Strategy for the Thames Valley 2-1 Introduction 2-1 The Starting Point 2-1 The Underlying Problem 2-3 Underlying Causes 2-6 The Future 2-8 Objectives – What is the Strategy Trying to Achieve? 2-9
3. Developing a Strategy 3-1 Problem Solving: Matching Interventions to Objectives 3-1 New and Widened Roads 3-2 Managing the Demand for Travel 3-2 The Role of Travel Plans 3-5 Improving Public Transport 3-7 Charging for Car Use 3-15 The Scope for Modal Shift for Freight 3-18 Localised Motorway Widening 3-21 Improved Management of Road Space 3-22 Managing Networks and Travel Using Information Technology 3-25 Overview: The Scope for Improvement 3-27
4. Components of the Strategy 4-1 Overview 4-1 Improved Public Transport 4-3 Travel Demand Management 4-22 Road User Charging 4-27 The Road Network 4-28 Strategy For Freight 4-32

THAMES VALLEY MULTI MODAL STUDY Final Report
441 1239 ii 6352-T.545-pic
5. Appraisal of the Strategy 5-1 Environmental 5-2 Safety 5-15 Economy 5-16 Accessibility 5-24 Integration 5-27 Supporting Analyses 5-42 Sensitivity to Key Assumptions 5-50 Contribution to the Government’s Ten Year Plan 5-51
6. Delivery of the Strategy 6-1 Need for Co-ordinated Delivery 6-3 Public Transport 6-4 Travel Plans 6-7 Road User Charging 6-7 Highways 6-8 Funding Sources 6-8
7. The Strategy in the Longer Term 7-1 Impacts of Road User Charging and Higher Growth 7-1 Future Land Use Policy 7-9 Longer Term Public Transport Provision 7-13 Conclusions 7-15
List of Tables
Table 2.1 – Local objectives 2-10 Table 3.1 – The impact of alternative growth scenarios (study area, peak hour) 3-4 Table 3.2 – Freight movements (Berkshire) 3-19 Table 3.3 – Study area indicators (morning peak hour) 3-28 Table 3.4 – Key indicators with alternative strategies (2016) 3-30 Table 4.1 – Strategy components 4-2 Table 4.2 – Public transport strategy components – key elements 4-3 Table 4.3 – Thames Valley interchange points 4-7 Table 4.4 – ‘Phase 1’ Rail Enhancements 4-9 Table 4.5 - ‘Phase 2’ rail enhancements 4-11 Table 4.6 – Phase 3 schemes/service enhancements 4-13 Table 4.7 – Quality Public Transport Corridors/Mass Transit: Reading and Blackwater
Valley 4-17 Table 4.8 – Inter-urban bus network provision 4-19 Table 4.9 – The effects of Road User Charging 4-27 Table 4.10 – Components of the road strategy 4-28

THAMES VALLEY MULTI MODAL STUDY Final Report
441 1239 iii 6352-T.545-pic
Table 4.11 – Million Tonnes Lifted (collected and delivered) 4-34 Table 4.12 – Transit Flows via Thames Valley 4-34 Table 5.1 – National and Local sub-objectives 5-2 Table 5.2 – Impacts of changes in Noise in 2031 relative to 2031 Reference Case 5-3 Table 5.3 – Changes in Emissions with the Strategy Options 5-5 Table 5.4 – AQMAs within the Study Area 5-6 Table 5.5 – Change in Transport Emissions from Roads within AQMAs for the Strategy
Options Compared with the Reference Case in 2016 5-7 Table 5.6 – Changes in Emissions with the Strategy Options 5-8 Table 5.7 – Modal Proportions for Access to Heathrow 5-14 Table 5.8 – Proportion of Veh kms on Congested Links (2016, morning peak) 5-17 Table 5.9 – Delay by Study Area Road Type (2016, morning peak, ‘000 hrs) 5-17 Table 5.10 – HGV kms on Congested Links (2016, morning peak) 5-18 Table 5.11 – HGV kms on Congested Links (2016, off peak) 5-19 Table 5.12 – Delay by Study Area Road Type (2016, off peak, ‘000 hrs) 5-19 Table 5.13 – Strategy Journey Times Relative to Reference Case for Public Transport
(Ref Case Time = 100 in each case), Morning Peak, 2016 5-20 Table 5.14 – Impacts of Public Transport Interventions 5-22 Table 5.15 – Population with Access to New Public Transport Facilities within a 250 m
Radius 5-24 Table 5.16 – Strategy (without road user charging) Journey Times Relative to Reference
Case for Highway (Ref Case Time = 100 in each case), Morning Peak, 2016 5-26
Table 5.17 – Strategy (with road user charging) Journey Times Relative to Reference Case for Highway (Ref Case Time = 100 in each case), Morning Peak, 2016 5-26
Table 5.18 – Strategy (without and with RUC): Central Government Appraisal Summary Table 5-36
Table 5.19 – Strategy (without RUC): Local Objectives Appraisal Summary Table (2016) 5-38 Table 5.20 – Strategy (with RUC): Local Objectives Appraisal Summary Table (2016) 5-40 Table 5.21 – Scheme Costs (£million, 2001 prices) 5-42 Table 5.22 – Financial performance of public transport schemes 5-43 Table 5.23 – Transport Economic Efficiency for Strategy without RUC 5-45 Table 5.24 – Transport Economic Efficiency for Strategy with RUC 5-46 Table 5.25 – Affordability and Financial Sustainability: Public Sector Investment for
Strategy (with and without RUC) 5-47 Table 5.26 – Affordability and Financial Sustainability: Private Sector Investment for
Strategy without RUC 5-48 Table 5.27 – Affordability and Financial Sustainability: Private Sector Investment for
Strategy with RUC 5-49 Table 5.28 – Economic Efficiency: Sensitivity Testing (no road user charging assumed
in each case) 5-50 Table 5.29 – Performance of strategy against PSA targets 5-52

THAMES VALLEY MULTI MODAL STUDY Final Report
441 1239 iv 6352-T.545-pic
Table 6.1 – Implementation Plan 6-2 Table 7.1 – Alternative strategies (RPG - 2031) 7-2 Table 7.2 – Alternative strategies (TEMPRO - 2031) 7-3 Table 7.3 – Transport Economic Efficiency for Alternative Strategy without RUC -
Tempro 7-4 Table 7.4 – Transport Economic Efficiency for Alternative Strategy without RUC - RPG 7-5 Table 7.5 - Alternative Strategy (without RUC): Central Government Appraisal Summary
Table – for RPG and Tempro planning assumptions 7-6 Table 7.6 – Light rail: High Wycombe – Marlow – Maidenhead 7-14 Table 7.7 – Impacts of enhanced inter-urban public transport 7-15
List of Figures
Figure 1.1 – Thames Valley Multi Modal Study Area 1-4 Figure 2.1 – Change in Peak Car Journey Times between current conditions (2001) and
the Reference Case 2-5 Figure 2.2 – Household and Employment Change (%, 1991-1998) 2-7 Figure 4.1 – Thames Valley Public Transport Strategy 4-6 Figure 4.2 – Priority Corridors for local measures for priority users and to ease
congestion 4-31 Figure 5.1 – Change in Emissions (%) in 2016 5-7 Figure 5.2 – Change in accessibility by Public Transport resulting from the Strategy with
RUC in the Morning Peak (2016) 5-21 Figure 5.3 – Change in Passenger Flows resulting from the Strategy without RUC in the
Morning Peak in 2016 5-23 Figure 6.1 – Implementation Plan 6-10
Appendix A – Glossary of Abbreviations

THAMES VALLEY MULTI MODAL STUDY Final Report
441 1239 1-1 6352-T.545-pic
1. Introduction
BACKGROUND
1.1 The Government Office for the South East commissioned WS Atkins Planning Consultants, supported by Roger Tym and Partners, and MDS Transmodal, to carry out the Thames Valley Multi Modal Study (TVMMS) in July 2001.
1.2 TVMMS was previously known as the London to Reading study and is one of several multi modal studies being funded by the (then) Department of Transport, Local Government and the Regions.
1.3 This document is the Final Report. It represents the culmination of the study and the basis on which to agree a transport strategy as the framework for transport investment and policy implementation in the Thames Valley for the foreseeable future.
STUDY CONTEXT
1.4 There are a number of other studies that have been or are currently being undertaken which impact on the TVMMS study area and these provide points of reference for understanding transport problems and issues in the Thames Valley area. Whilst these studies have different (but related) objectives, there is a need for consistency to ensure that recommended strategies are mutually supportive. These studies are:
♦ ORBIT – a multi-modal study undertaken on behalf of the Government Office for the South-East;
♦ SWARMMS – a multi-modal study undertaken on behalf of Government Office for the South West.
1.5 In addition a draft Regional Transport Strategy (RTS) for the south east was published for consultation during the Autumn of 2002. The TVMMS and Regional strategies need to be consistent and mutually supportive.
THE STUDY AREA
1.6 The study considers transport and land-use issues in an area covering parts of Berkshire and its environs as shown in Figure 1.1. The geography of the Thames Valley has a strong influence on the type and nature of travel demand in the area, and vice versa. The area is a sub-region characterised by a complexity of land uses. These individually and cumulatively influence transport conditions, and form the backdrop against which future land use and transport choices will be made. Key features of the study area are:
♦ A polycentric character. There is no dominant centre (Reading is the closest to it); instead there are several which together function as centres of employment and residential development. As a consequence there are several locations where current and future development is likely to take place.
THAMES VALLEY MULTI MODAL STUDY Final Report
441 1239 1-2 6352-T.545-pic
♦ A large rural component, much of which is constrained from development by national environmental (AONB, SSSI) and planning (Greenbelt) designations. This effectively limits the number of appropriate and likely locations for current and future development in the Thames Valley.
♦ A location to the west of a much bigger conurbation, in this case Greater London.
♦ A highways network characterised by west-east arteries (Motorways – M3, M4, and M40) and bisected by a series of north-south routes. In addition there are a series of train lines in the region, the main one extending from Paddington to the West Country through the sub-region, passing through Reading Station. The rail system mirrors the radial nature of the Motorway system, but does not have an equivalent orbital provision to the M25 on the road network.
♦ A major international airport – Heathrow – which has been a strong attractor to business, particularly ‘new’ multi-national industries such as computer software and pharmaceuticals.
1.7 The study has been undertaken in full compliance with the Department for Transport (DfT) Guidance On the Methodology for Multi Modal Studies (GOMMMS). The focus has been on long-term planning with a time horizon of 15 years (to 2016) and 30 years (to 2031). However, account has also been taken of strategic issues needing to be addressed in the short-term, in line, for instance, with the Government’s 10 Year Plan for transport.
SCOPE OF THE STUDY
1.8 Consistent with all multi-modal studies, the emphasis within this study is upon developing a strategy. Individual components have been developed to a level to assess the deliverability issues and constraints associated with the strategy. Many of these schemes will however need to be developed further in a more local context (demand, appraisal, consultation).
1.9 The study has deliberately avoided detailed consideration of those local measures typically pursued through Local Transport Plans (LTPs), not because we don’t believe that these have a critical role to play, but because these are best dealt with at the more local level. This includes important measures relating to walking, cycling, and school travel.
1.10 Another characteristic of a study of this nature is that many of the initiatives under review have costs, benefits, and impacts well beyond the study area and beyond the remit of the study. The impacts within the area are assessed to enable the contribution of these initiatives to the Thames Valley area to be understood and promoted where appropriate.
STUDY OVERVIEW
1.11 Our study has sought to identify the most effective means of addressing current and future transport-related problems in the Thames Valley. This has required an understanding of the root causes of transport problems within the area and how these problems are likely to develop and change in future. But it has also required us to give careful consideration to what it is that we are trying to achieve. Improvement
THAMES VALLEY MULTI MODAL STUDY Final Report
441 1239 1-3 6352-T.545-pic
in transport provision in the area is an important end in itself, but our work is predicated on the strong links between transport and wider economic, environmental and social policy. A set of study specific objectives have been developed to provide a basis for assessing the merits of alternative ways forward. These reflect national policy and also local aspirations that emanate from local policy documentation, and consultation undertaken as part of the study.
1.12 Addressing the transport problems of the Thames Valley represents a major challenge. While a number of independent interventions can all contribute towards an easing of specific problems, the scale and nature of the overall problem requires a strategy which is capable of implementation on a consistent basis across the whole of the Thames Valley sub-region. There will be a need for change: change at the level of central and local government in the way transport is funded, planned and administered across the area; change in the level and quality of transport provision; and change in the way those who live and work in the area make their travel choices.
STRUCTURE OF THE REPORT
1.13 The report is structured in six further chapters:
♦ Chapter 2: explains why a transport strategy for the Thames Valley is needed and what the strategy should be seeking to achieve.
♦ Chapter 3: describes the interventions considered as part of the strategy development process, with reference to national and local policy objectives and the problems and issues emerging from early phases of the study. This work provided the basis for understanding the broad scope for change and for guiding the strategy development. The concluding part of Chapter 3 summarises these findings.
♦ Chapter 4: presents the preferred strategy, detailing the components within a number of different types of intervention.
♦ Chapter 5: appraises how the strategy contributes to both national and local policy objectives.
♦ Chapter 6: considers delivery issues and presents an implementation plan for delivering the preferred strategy.
♦ Chapter 7: reviews the longer-term issues and the conditions under which the preferred strategy will need to be reinforced or modified by the introduction of further interventions.

THAMES VALLEY MULTI MODAL STUDY Final Report
441 1239 1-4 6352-T.545-pic
Figure 1.1 – Thames Valley Multi Modal Study Area
HIGH
WYCOMBE
BEACONSFIELD
SLOUGH
MAIDENHEAD
BRACKNELL
STAINES
GUILDFORD
BASINGSTOKE
READING
FARNHAM
CAMBERLEY
Woking
Egham
Windsor
Rickmansworth
Thatcham
Odiham
Fleet
Aldershot
Henley-on ThamesGoring
ChalfontSt Peter
Tadley
Theale
Wokingham
Earley
Yateley
SonningCommon
A322
A339
A33
A287
A331
A31
A404
A40
M3
M25
M3
M25
M4
M25
M40
M40
M4
M4
M4
HEATHROW
Hartley Wintney
Crowthorne
Marlow
Wargrave
Binfield
Twyford
Ascot
Poyle
Hook

THAMES VALLEY MULTI MODAL STUDY Final Report
441 1239 2-1 6352-T.545-pic
2. The Need for a Strategy for the Thames Valley
INTRODUCTION
2.1 This section explains the genesis for the study, the underlying issues associated with the particular characteristics and performance of the Thames Valley transport systems and the policy objectives that articulate what any transport strategy should be seeking to achieve.
2.2 The multi-modal studies present the opportunity to consider the transport problems of an area in a ‘holistic’ manner. This approach aims to develop strategies and interventions which address the root causes of problems whilst recognising the inter-relationship between transport and other areas of planning and policy. The multi-modal study approach acknowledges the dangers of attempting to tackle only the symptoms. In the past this has led to the ‘predict and provide’ approach to transport planning, characterised by responding to rising highway congestion with the provision of new highway capacity.
2.3 The particular challenge which arises with this more holistic approach is to identify and, where possible, quantify the ‘driving forces’ influencing the nature and performance of the transport system in an area. Hence the particular requirement within the multi-modal studies for an in-depth analysis of both the current situation, and of a future based upon the continuation of current trends. This analysis should provide a firm basis for identifying appropriate components of a future strategy.
2.4 Our analysis of the current situation is set out in detail in the April 2002 Problems and Issues report.
2.5 There is a danger of over-simplifying the nature of the problem in the Thames Valley, given the complex set of interactions (some extending well beyond the field of transport) which explain why the area’s transport system operates as it does currently. Issues which are pertinent for strategy development range broadly from strategic considerations relating, for instance, to the future distribution of population and jobs, to much more localised issues such as obstacles to the delivery of improved local bus services.
THE STARTING POINT
2.6 Much evidence existed at the outset of our study on the symptoms and effects of transport and transport-related issues in the Thames Valley area. A number of recurring themes were apparent through Thames Valley transport policy documents, study reports from other previous and concurrent studies (ORBIT, SWARMMS, and others), and – not least – through the views and perceptions of those living and working in the area expressed during consultation, both for previous studies and during the early stages on our own work. These themes are discussed in our April 2002 Problem of Issues and report and include:

THAMES VALLEY MULTI MODAL STUDY Final Report
441 1239 2-2 6352-T.545-pic
♦ The problem of traffic congestion on the strategic and local highway networks, which is impacting on business efficiency, access to Heathrow and the environment. These two latter factors were arguably the main reasons why companies moved into the Thames Valley and continued deterioration could deter inward investment in the future.
♦ Poor availability of alternatives to the car – local buses are failing to offer the level of service and range of destinations needed, and trains are overcrowded at peak times and perceived to be unreliable and expensive.
♦ Limited opportunities for interchanging between modes – where there is parking available at stations, for example, there are concerns about personal and vehicle security.
♦ Traffic using unsuitable roads – the impacts on local roads of recurrent or incident-related congestion on the trunk road network.
♦ The polycentric nature of the Thames Valley area which generates disparate movements between centres that cannot be easily or cost effectively accommodated by conventional public transport.
2.7 In additional to the problems identified above, our study brief required the study to consider the following:
♦ The case for widening of the M4 between Junctions 4b and Junction 8/9;
♦ The remittance to this study, through the Secretary of State’s decision letter on Heathrow Terminal 5 (T5), of the need to widen the M4 between Junctions 3 and 4b;
Top 3 Problems Of those who responded to our questionnaire survey on the worst aspects of transport in the Thames Valley, 55% identified the poor quality of public transport as one of their Top 3 problems.
Similar views were expressed in the study workshops and focus groups.
0 10 20 30 40 50 60
Unreliable journey times
Too few Thames Crossings
No public transport available
Fares too expensive
Speed/volume of urban traffic
Congestion on major roads
School run
Poor public transport
% of respondents
“There is a great fondness for the car, for travel and as a status symbol. Public transport is seen as a twilight activity for those who can’t afford a car.” (WRG1)

THAMES VALLEY MULTI MODAL STUDY Final Report
441 1239 2-3 6352-T.545-pic
♦ North/south public transport provision across the Thames Valley, in line with the identification of the need for a public transport study of the Western Wedge identified in RPG9;
♦ The context provided by the ‘over-arching strategies’ emerging from the SWARMMS and ORBIT studies.
THE UNDERLYING PROBLEM
2.8 Congestion on the road network in particular underlies many of the transport-related problems and issues in the Thames Valley. In other areas of the country the focus of a transport strategy may be to encourage regeneration, or to reduce peripherality through better regional links. In the Thames Valley the key recurring theme is how to sustain the many positive attributes of the sub-region in the face of an increasing imbalance between transport demand and supply, which manifests itself most clearly in congestion on the road network. (Rail network capacity is also on issue, as discussed further in Chapter 4).
Congestion, and its Impacts
2.9 The scale of road-based demand in the Thames Valley is such that during the morning and evening workday peaks, demand is at, or exceeds, available road capacity. This results in congestion and increasingly unreliable journey times which affect private vehicle users, and also freight and public transport operators.
2.10 Model representations of current morning peak travel conditions suggest that across the study area network as a whole nearly 30% of average journey times are spent in delays and queues. Congestion and unreliability is also increasingly being experienced on the public transport system. Our analysis of the future performance of the transport system shows that, without intervention, peak time road congestion will intensify on roads which are already congested, and that congestion will spread across more of the network. By 2016 we estimate an increase of over 70% relative to 2001 in the number of hours of delay on the highway network during peak periods.
2.11 While the direct effects of increasing traffic and congestion are a deterioration in the performance of the road network, in the form of increased delay, and longer and less reliable journey times, wider adverse impacts are experienced.
2.12 The magnitude of travel demand has adverse implications on the environment. Effects are worst during times of congestion, but impacts of road traffic in terms, for instance, of noise, severance and air quality are felt well beyond the peak periods. A number of Air Quality Management Areas (AQMA) have been designated within the study area (described in detail in Chapter 5), overwhelmingly as a result of traffic emissions. AQMA are areas where air pollution exceeds recommended levels.
2.13 With the continuation of current trends, increasing traffic levels will result in 3000 more people being classified as ‘annoyed by noise’, and a 45% increase in CO2 road emissions by 2016.
“I am a painter and decorator and the congestion has got so bad that I specify in my ads that I do not take jobs in the centre of Reading.” (Focus group with blue collar workers) “If you go for a job interview they ask how you will come to work…If you come by public transport they know that you will be late much of the time.” (Focus group with people of an ethnic background) “I’ve waited an hour and a half; the previous bus just didn’t run and the next one was late!” (Focus group with older people in Marlow)

THAMES VALLEY MULTI MODAL STUDY Final Report
441 1239 2-4 6352-T.545-pic
2.14 Road traffic also generates both real and perceived safety concerns, particularly for pedestrians and cyclists, and these are most acute where traffic uses unsuitable local roads, often to avoid congestion on the trunk road network. Speeding traffic and heavy goods vehicles on rural and other local roads are concerns frequently expressed through the consultation process, in terms of their impacts both on safety and the environment.
2.15 The car-based culture has clear implications for the significant minority who do not have access to a car (19% across the study area, compared to 21% in the South East as a whole, and 29% nationally). This goes beyond the disadvantage of only having a limited range of travel options to choose from. Those without a car are particularly vulnerable to the effects of road traffic congestion in terms of dependency on unreliable public transport, deteriorating accessibility to services and increased safety and personal security concerns, compounding the effects of social exclusion.
2.16 Rural areas in the Thames Valley are amongst the least deprived in the country, but feature poor public transport and access to services. This carries particular implications for those living in inaccessible areas without transport provision. In urban areas the issue is rather different: some urban areas have lower than average levels of car ownership, (notably Reading, and Slough where 30% and 25% of households respectively do not have access to a car). Even for car owning households there is a dependence on a public transport system which can fall short of the needs of the potential user in terms of information provision, quality, safety and frequency of services, and the availability of services beyond the normal working day.
2.17 Changes in peak hour accessibility arising from increasing traffic levels and congestion are shown in Figure 2.1.
2.18 Congestion brings considerable inefficiencies to the local economy, affecting most businesses to some degree, but with particular implications for those operating road-based public transport or moving freight in the area. Concern amongst local businesses relates not just to lengthening journey times, but also the degree of unreliability in journey times which arises at times of congestion. There is a fear that worsening congestion could deter future investment in the area.
Key Concerns Concerns about safety dominated the findings of the questionnaire survey in the first newsletter. 62% of resp-ondents said that safety was the most serious outcome of the transport problems in the Thames Valley. 0 10 20 30 40 50 60 70
Noise
Cost of congestion
Environmental damage
Air quality
Road safety
% of respondents

THAMES VALLEY MULTI MODAL STUDY Final Report
441 1239 2-5 6352-T.545-pic
Figure 2.1 – Change in Peak Car Journey Times between current conditions (2001) and the Reference Case
!
!
!
!
!
!
!
!
!
!
!
!
!
!
!
!!
!
!
!
!
!
!
!
ALTON
FLEET
ESHER
SLOUGH
HARROW
WOKING
STAINES
DORKING
ABINGDON
ALDERSHOT
CAMBERLEY
BRACKNELL
FARNBOROUGH LEATHERHEAD
BEACONSFIELD
NEWBURY
FARNHAM
READING
WATFORD
AMERSHAM
GUILDFORD
MAIDENHEAD
BASINGSTOKE
HIGH WYCOMBE
13
14
12
20
18
18
16
12
4
13 21
9
21
21
17
8
17
12
15
8
17
22
9
76
13
13
76
15
9
1514
14
8
7
9
22
14
7
14
19
13
5
1214
156
13
18
9
7
11
20
4
9
14
9
15
7
12
4
10
16
4
18
7
4
6
12
17
12
17
5
13
17
16
4
19
15
15 14
17
1013
12
15
14
6
13
14
13
11
18
14
13
16
20 20
15
17
15
13
11
15
17
13
23
9
19
13
5
16
20
15
8
15
14
10
12
9
10
18
11
18
15
14
18
1115
18
12
10
1614
15
22
14
19
18
22
1312
23
19
21
19
19
14
14
16
17
13
23
3
22
15
22
20
15
18
24
20
18
19
11
16
14
17
23
14
14
18
14
10
29
1616
21
15
18
12
2220
15
23
9
32
18
14
26
1312 15
18
2223
19
17
14
30
21
13
22
15
11
13
14
14
1517
15
16
1714
Thames Valley MMS
Figure 2.1 Change in Car Accessibility between Current Conditions and Reference Case (2016)
Date: 14/01/2003 09:08:57 Prepared by: enielsen Mxd file location: C:\TVMMS\GISData\Maps\13f_Car Time From Zone Final.mxd
LegendPercentage increase in peak journey time between current conditions (2001) and Reference Case (2016)
0% - +1%
+1.1% - +5%
+5.1% - +10%
+10.1% - +15%
+15.1% - +30%
+30.1% - +45%
+45.1% - +60%

THAMES VALLEY MULTI MODAL STUDY Final Report
441 1239 2-6 6352-T.545-pic
UNDERLYING CAUSES
2.19 Part of the reason for increased congestion has been the burgeoning growth in the local economy in recent years. The increase in jobs between 1991 and 1998 exceeded 20% in much of the Thames Valley, compared to corresponding changes of 16% and 9% respectively over the South East and nationally. This reflects the particular attractions of the area for business investment, particularly in the ‘High Value Service’ sector. Much of this growth has been accommodated in developments which have further accentuated the ‘car-based’ culture, including many of the business park type developments which feature strongly in the area.
2.20 Much of the growth in the Thames Valley economy mirrors growth in the UK economy generally. However this tells only part of the story, as Thames Valley growth has significantly outstripped national growth (4% growth per annum, outstripping both the national and South East economy), implying a number of ‘special factors’ underlying the Thames Valley economy.
2.21 Analysis for the Western Wedge study indicates that between 1995 and 1999, around 60% of the growth in jobs within the area is attributable to growth in the national economy.
2.22 The majority of the remaining 40% of new jobs created reflect the distinctive characteristics of the Thames Valley economy, in terms of its ability to compete within the national economy.
2.23 Two significant study area ‘drivers of growth’ appear to distinguish growth in the Thames Valley economy from growth nationally:
♦ Heathrow airport and related activities; and
♦ The hi-tech and business/financial services sector (referred to as ‘High Value Service’ sector, or HVS within this report).
2.24 The recent growth in the HVS sector is highlighted by the significant increase in the proportional share of study area employees (accounting for around 27% of the study area work force, compared to 20% in 1991) and the number of major employers working in the telecoms (Vodafone), IT (Oracle, Microsoft), hi-tech manufacturing or financial and business services (KPMG, Dun and Bradstreet) sectors who have chosen to locate in the Thames Valley.
2.25 The growth in these sectors in the Thames Valley reflect the strong ‘pull’ which this area has exerted in recent years for these activities. A significant factor quoted in surveys of businesses who have chosen to locate in the Thames Valley undertaken by Thames Valley Economic Partnership (TVEP) is the proximity of London and Heathrow, and the availability of strategic transport links. Paradoxically, it is the quality of these transport links which now features amongst businesses as one of the main threats associated with their continued location in the Thames Valley.
2.26 Transport links are not the only factor explaining the choice to locate in the Thames Valley. Other strengths of the area include the environmental quality and, for this sector, the particular appeal of the concentration of existing IT and technical skills,

THAMES VALLEY MULTI MODAL STUDY Final Report
441 1239 2-7 6352-T.545-pic
the clustering of other HVS (as partners or customers), and the availability of attractive, flagship development sites.
2.27 However, most new jobs result in a new trip to work and the preferences of some of the key growth activities within the local economy have been for out-of-town or edge-of-town business park type development, due to the availability of car parking, good access and high quality image and landscaping. Low density developments, typically with a single land use type, permitted by the laissez-faire approach to land use planning in the 1980s, have increased the distance between home, work and social/leisure opportunities and engendered car dependency. Green Belt and other environmental designations constrain further development in what are often more accessible locations.
2.28 In addition, a proliferation of private schools, and a lack of adequate provision in new housing areas have led to households opting not to send their children to their ‘catchment’ school. In these cases, pupils do not qualify for free school buses and there is therefore yet more reliance on the car for school journeys, over what can be long journey lengths.
2.29 The high growth in the demand for staff in the Thames Valley has led to below-average unemployment levels and very high economic activity rates1 which means that there are now labour shortages across all employment sectors. All Thames Valley districts display unemployment rates equivalent to or below the 2% ‘frictional rate of unemployment’ which is the natural state of a buoyant economy necessary to facilitate job turnover. Almost inevitably, recruitment increasingly involves targeting residents beyond the Thames Valley, targeting people who by necessity will have to travel longer distances to work.
Figure 2.2 – Household and Employment Change (%, 1991-1998)
1 The proportion of the working population (aged between 16 and 65) that is economically active.
0%
10%
20%
30%
40%
50%
60%
70%
South
Buckin
gham
shire
Brack
nell F
orest
Readin
g Hart
Winche
ster
THAM
ES VA
LLEY
Rushm
oor
Surre
y Hea
th
Hillingd
onSlo
ugh
Windso
r and
Maid
enhe
ad
Runny
mede
Wyco
mbe
SOUTH
EAST
Wes
t Berk
shire
Basing
stoke
and D
eane
Wok
ingha
m
ENGLA
ND
South
Oxfords
hire
Houns
low
Speltho
rne
Area
% C
han
ge
Household Grow th Employment Grow th

THAMES VALLEY MULTI MODAL STUDY Final Report
441 1239 2-8 6352-T.545-pic
Burnham, South Bucks: Nearly one third
of all household growth in the South East has been in the Thames Valley
2.30 The buoyancy of the Thames Valley economy has made the area a popular place to live, and has resulted in overall housing shortages and house price increases, resulting in a particularly acute affordable housing crisis. While growth in jobs has outstripped the growth in population (Figure 2.2), the resident population and the number of households in most Thames Valley districts have nonetheless been growing rapidly.
2.31 For example, Bracknell Forest and Reading have seen a 21% rise in households through the 1990s, and there has been an increase across the Thames Valley as a whole of 14% - well above the South East average of 11%.
2.32 The high prices and shortage of available housing have important implications for quality of life in that:
♦ Average wage earners can only afford to move to smaller or poorer quality accommodation;
♦ People on low incomes cannot afford to buy any properties at all; and
♦ Many people working in the Thames Valley cannot afford to live there and so they are forced to commute.
2.33 In summary, the growth of the local economy has contributed significantly to an increase in travel. The location of new development has reinforced the role of the car as the dominant mode. The shortage of labour has encouraged employers to attract staff from further afield, which combined with a shortage of affordable housing, has encouraged long-distance commuting, often by car.
2.34 This is accentuated by high levels of car ownership and limited availability of alternative modes, and a level of infrastructure investment well below that necessary to increase capacity in line with demand.
THE FUTURE
2.35 The above issues are pertinent to strategy development as they present obstacles to the delivery of local improvements. They also establish a pattern of land uses that influences the future distribution of jobs and households that will determine future travel demand.
2.36 Transport conditions already represent a distinct threat to the future economic prosperity, environmental quality and social well-being of the Thames Valley.
2.37 Whilst there is inevitable uncertainty over the scale and distribution of future demographic and economic changes in the area (see Chapter 3), forecasts indicate that travel demand will continue to increase both for car trips (30 to 40% by 2031) and public transport (over 80% by 2031, including the impacts of modal shift from the road network) giving rise to more widespread congestion and consequent adverse impacts on quality of life.

THAMES VALLEY MULTI MODAL STUDY Final Report
441 1239 2-9 6352-T.545-pic
2.38 In addressing the current and future transport problems in the Thames Valley we have to be cognisant of the interaction between transport and land-use and indeed the role that planning policies can play in influencing future travel patterns and conditions. Chapter 3 therefore addresses the role of both transport interventions and planning policies.
OBJECTIVES – WHAT IS THE STRATEGY TRYING TO ACHIEVE?
2.39 Before embarking upon the development of a strategy, it was important to establish what it was that we were trying to achieve. At a general level, the objectives of transport policy are well-defined. GOMMMS sets out a range of criteria against which strategies and schemes are to be assessed, reflecting the main strands of Government transport policy.
2.40 Within this broad context, however, we have sought to define and interpret these criteria more specifically for the Thames Valley: to reflect the distinct problems, opportunities and priorities of the study area. This has been done with reference to regional and local policy documentation, and through the consultation process.
2.41 The Government has defined five over-arching objectives for transport:
♦ Environment – reduce the direct and indirect impacts of transport including noise, atmospheric pollution, etc.
♦ Safety – reduce loss of life, injuries and damage.
♦ Economy – improve economic efficiency (journey times, operating costs and fares).
♦ Accessibility – improve the ease of reaching different locations by different modes.
♦ Integration – improve co-ordination between transport modes and between transport and other policy areas.
2.42 Within this broad context, we have developed more local objectives that relate to the aspirations of regional and local planning policies, our steering group and those who participated in the consultation exercises associated with the study2. These local objectives are shown in Table 2.1.
2 The first Wider Reference Group meeting focused on the existing problems in the Thames Valley and a vision for the future. The second meeting specifically considered the draft strategy objectives and interventions that could deliver the desired outcomes. A series of focus group were held at the beginning of the study. Participants were asked to describe the worst aspects of transport and their priorities for improvement.

THAMES VALLEY MULTI MODAL STUDY Final Report
441 1239 2-10 6352-T.545-pic
Table 2.1 – Local objectives
Local Objective Sub-Objective
Facilitate sustainable economic development
♦ Stricter development control to balance growth in jobs and houses and focus development in sites served by good quality public transport
♦ Provide a wider choice of travel
♦ Better journey time reliability
♦ Reduce need to travel for work purposes
Improve public transport access to Heathrow
♦ Improve rail access from the study area
Reduce congestion ♦ Reduce effects of congestion, including on public transport and freight operators
Protect and enhance the natural and built environment
♦ Urban renaissance and controlling further suburbanisation
♦ Protect landscape, townscape and heritage sites
♦ Reduce impact of freight movements
Improve travel choices and increase the attractiveness of alternatives to cars and lorries
♦ Improve access to transport system e.g. physical access and information
♦ Increase choice of modes, especially for urban orbital movements, north-south movements and accessing key shopping and leisure destinations
♦ Reduce severance effects caused by heavy traffic flows
♦ Improve perceptions of public transport, safety and personal security
Improve people’s health and safety ♦ Improve health through better air quality
♦ Reduce accidents
♦ Improve perceptions of safety and security
Promote integration ♦ More transport interchanges
♦ Encourage consistency in transport policies across administrative boundaries e.g. co-ordinate planning policies, parking standards
♦ Stricter application of land use policies, e.g. mixed land uses and higher density developments
2.43 Further explanation on the indicators used to assess the effectiveness of our strategy in achieving these national and local objectives is given in Chapter 5 ‘Appraisal of the Strategy’.

THAMES VALLEY MULTI MODAL STUDY Final Report
441 1239 3-1 6352-T.545-pic
3. Developing a Strategy
PROBLEM SOLVING: MATCHING INTERVENTIONS TO OBJECTIVES
3.1 A range of potential multi-modal interventions, reflecting the Government’s transport policy, is set out in GOMMMS. It is for each of the multi-modal studies to identify those interventions which are most effective and appropriate within their area, on the basis of particular existing and future problems, issues and local priorities.
3.2 Within this section we describe how the interventions within our strategy evolved against the broad objectives set out in the previous chapter, and with reference to the findings of the detailed work undertaken in the early phases of the study.
3.3 A clear link can be drawn between some initiatives, and the transport problems and objectives that they are designed to address. For instance, strong linkages exist between problems of high car-dependency for a particular movement, the objective of encouraging modal shift from car to public transport and the intervention of improving public transport. However, in practice the linkages are far more complex and cross-cutting than this.
3.4 The range of interventions we considered emerged from consultation with stakeholders, reviews of existing proposals, diagnosis of the problems and liaison with other strategic studies impinging on the Thames Valley.
3.5 Consultation with stakeholders, and diagnosis of future problems, (including their underlying causes and inter-relationships) as well as technical analysis all formed part of the preliminary appraisal of these interventions.
3.6 Initial work focused primarily on understanding the role that different types of intervention could play at a strategic level. What reduction in area-wide congestion could be achieved? What are the overriding environmental constraints? What emphasis do stakeholders and the wider public place on increasing road capacity to accommodate more traffic, providing better alternatives to the car through improved public transport and managing the demand for travel?
3.7 This preliminary appraisal provided not a detailed technical evaluation of options but, instead, guiding principles to help focus the development of a preferred transport strategy on solving transport problems, in tune with national and local policy objectives and stakeholders’ aspirations.
3.8 In the remainder of this Chapter we set out, for a wide range of interventions, the key areas which, with reference to current and future problems and issues, emerged as guiding principles and points of reference for preferred strategy development. Later in the report we describe how these principles have been interpreted as a more specific set of objectives and indicators used within an appraisal framework to quantify in detail how the strategy performs.

THAMES VALLEY MULTI MODAL STUDY Final Report
441 1239 3-2 6352-T.545-pic
NEW AND WIDENED ROADS
3.9 One option is to accept that recent trends in the use of the car in the Thames Valley will continue into the future, and to introduce new road capacity to accommodate this growth without worsening congestion.
3.10 It is clear that proposals for major enhancements to highway capacity, either through new roads or widening of the existing (mainly east/west) trunk routes, are severely constrained because of the very high quality of the Thames Valley environment. This is reflected by the number of environmental designations of more than local significance (relating, for instance, to landscape and biodiversity) enshrined in local planning policy.
3.11 Our consultation work also highlighted the high value placed on the environment, both by study area residents and by business activities which have chosen to locate in the area. The quality of the environment is seen as one of the factors which has contributed to the success of the area. Little support was apparent for new road construction in our consultation, apart from more local schemes designed to address specific ‘hot-spots’.
3.12 Recognising these environmental constraints (which are set out in detail in our Problems and Issues Report), our approach to strategy development has been to examine the scope and level of impact of other (potentially less environmentally damaging) interventions, before assessing the merits of highway schemes.
3.13 This is not to say that a strategy of major new highway provision was assessed only on the basis of its environmental impacts. While there is a clear need to protect areas of high environmental quality, there will also be growing pressures to reduce the impacts of travel demand on the quality of the environment across the study area as a whole, and new highway infrastructure is one potential option in trying to achieve this. (It is, of course, also the case that similar environmental constraints apply to the provision of new rail infrastructure.) Our consideration of the scope for highway improvements is described further later in this Chapter, and also in Chapter 7, in the context of other longer term considerations.
MANAGING THE DEMAND FOR TRAVEL
3.14 Given the constraints on the provision of new transport infrastructure, how much can be achieved by managing the demand for travel?
3.15 Reducing road traffic levels is a theme which resonates through Government transport policy. There are two aspects to this: reducing the need to travel overall, and encouraging modal shift from car to other modes. The following section considers the first of these aspects at the ‘macro’ level (through the long term influence of land use planning and development on future demand) and at the more ‘micro’ level (through LTP and travel plan type initiatives).
Influencing Travel Demand Through Land Use Planning
3.16 The level of travel demand has increased rapidly in the Thames Valley over recent years. Part of the reason for this has been the burgeoning growth in the local economy in recent years. The increase in jobs in the Thames Valley between 1991

THAMES VALLEY MULTI MODAL STUDY Final Report
441 1239 3-3 6352-T.545-pic
and 1998 has been highlighted in Chapter 2. This reflects the particular attractions of the area for business investment, particularly in the ‘High Value Service’ sector.
3.17 The growth in jobs has out-stripped the availability of housing, and a larger labour catchment has led to a pattern of longer commuting trips from increasingly further a-field. This situation occurs for several reasons – there is not enough housing in locations near to jobs, and when there is available housing there is generally not enough of it. Also, there has been an increasing tendency to provide land for employment and housing uses independently of each other, including out of town business parks, without a consideration of the linkages between the two and of the consequences for travel demand.
3.18 While any transport decision has an influence on land use, and vice versa, these influences are not always positive. Much of the recent growth in the economy in the Thames Valley has been accommodated in developments which have further accentuated the ‘car-based’ culture, for example, out-of-town business park type developments feature strongly in the area. With the possible exception of the growing number of contra-peak trips from Greater London to the Thames Valley, these trips are often being made from areas with poor public transport links to the Thames Valley, further accentuating car use, and disadvantaging those without access to a car.
3.19 The pattern of lengthening and increasingly car-based commuting is not sustainable, particularly given the congestion which already exists in the Thames Valley as highlighted above.
3.20 The planning system has a major role to play in exploring the relationship between transport and land use to create a more sustainable and therefore acceptable, in modern policy terms, set of spatial circumstances. How these are defined varies from place to place, and will therefore have specific characteristics in the Thames Valley. However, the general principles which dictate the sustainability and therefore acceptability of a transport solution or a land use solution in the context of overall transport/land use relationship are set out in Government policy in Planning Policy Guidelines Note 13 (PPG 13), dated March 2001, which stresses reducing the need to travel and a modal shift to public transport. Regional Planning Guidance (9) for the South East, and the emerging Regional Transport Strategy serve to provide a more appropriate regional interpretation of this policy for most of the study area. (Parts of the study area within the Greater London area are covered by the Mayor of London’s spatial and transport strategies). A more detailed description of PPG 13 is provided in Chapter 5, as part of the Land Use Appraisal.
3.21 In forecasting future levels and patterns of future travel demand in the Thames Valley it is necessary to take a view on how, and to what to extent, the implementation of good planning policy and practice can play a role. In practice, future levels and patterns of demand will be influenced by a range of variables, each with its own uncertainties, and only some of which can be determined by land use planning policy. It may be overly pessimistic, for instance to assume, as a starting point, that future travel demand will continue to follow past trends in spite of policies designed to encourage more sustainable outcomes.
3.22 However, as discussed above, experience in the Thames Valley over recent years demonstrates that the presence of strong planning guidelines and policies, and the

THAMES VALLEY MULTI MODAL STUDY Final Report
441 1239 3-4 6352-T.545-pic
willingness of planning practitioners to implement them, provide no guarantees that the adverse impacts of transport decisions on land use, and vice versa, are always mitigated against, or that opportunities for more sustainable development are always realised. The planning system must operate within the context of a complex range of pressures and priorities, and trade-offs are often made which work against the outcomes of current policy.
Alternative Planning Scenarios
3.23 The study has considered the impact of land use planning policy on travel growth in the future. We have compared forecasts of travel demand based upon the implementation of planning policy with those based upon an alternative trend-based scenario. This highlights the critical importance of the proactive implementation of national and regional planning policy on the future performance of the Thames Valley transport system. This is even before considering the possible impacts of transport and land use interventions arising from this, and other similar studies.
3.24 We have looked at two alternative scenarios of future growth, the so-called ‘RPG’ and ‘Tempro’ scenarios. The RPG scenario equates to a policy-based scenario (see panel overleaf). TEMPRO, on the other hand, represents a higher growth scenario, and is loosely trend-based, though because of implausibly high levels of economic activity may, in practice, overstate even higher-end levels of forecast growth.
3.25 The alternative scenarios of growth have significant implications for the level of travel demand and performance of the transport system even up to 2016, as illustrated in Table 3.1.
Table 3.1 – The impact of alternative growth scenarios (study area, peak hour)
Base (2001)
2016 – RPG
2016 – Tempro
2031 – RPG
2031 – Tempro
Car trips (‘000) 254 312 (+23%) 339 (+34%) 348 (+37%) 375 (+48%)
Total vehicle kms (‘000) 4615 5790 (+25%) 6145 (+33%) 6408 (+39%) 6790 (+47%)
Total vehicle hours (‘000) 92 133 (+44%) 153 (+66%) 181 (+98%) 206 (+124%)
Total hours of delay (‘000) 33 58 (+77%) 73 (+122%) 95 (+188%) 115 (+250%)
3.26 The need for intervention in any event is highlighted by the values in Table 3.1. Both growth scenarios bring significant increases in traffic and delay relative to now. However, the comparison of RPG and TEMPRO highlights the importance of the implementation of best practice planning policy, effectively as a platform upon which the more specific interventions being considered within this study can be developed.

THAMES VALLEY MULTI MODAL STUDY Final Report
441 1239 3-5 6352-T.545-pic
Planning Scenarios
The provision of a reference case comprising land use parameters (population, households, workforce and jobs) for the study area at various spatial scales and spanning the thirty year study period is a requirement of MMS as specified in GOMMMS.
Tempro was originally set up to this end, however, it is trend based, unrelated to land use and economic policy, and only provided one version of the future, both in terms of levels of growth and its distribution.
An alternative scenario was prepared up to 2016 based on several land use assumptions. The main one is the use of dwelling assumptions incorporated in regional planning guidance, which effectively drives the growth levels and distribution of the population, workforce and employment parameters in this set of forecasts. These RPG dwelling figures lower growth levels and shift the distribution of housing growth to those parts of the Thames Valley where regional policy wants it to be.
Also, compared to Tempro, the workforce/population ratio was controlled at a maximum level of 0.55 (approximates to a 90 percent Economic Activity rate) to ensure that unrealistic levels of economic activity were not included. Consequently some of the district level workforce forecasts were reduced. In addition, in areas identified as Priority Areas for Economic Regeneration, workforce/population ratios were increased to reflect increases in economic activity in these areas. Finally, it was assumed that the 1998 ratio between workforce and jobs is maintained up to 2031 for the study area as a whole, i.e. commuting patterns over the area as a whole are not predicted to lengthen over this time period.
Beyond 2016, it was considered that a policy based scenario would effectively experience a ‘gear change’. This was because the actual spatial consequences of other policy initiatives contained within RPG and national planning guidance would be realised, such as policies focussing all forms of development in urban areas, developments which reduce the need to travel, and advocating mixed use developments.
In core study area districts we increased the proportion of growth in urban zones by 10%, capping urban distributions at ninety percent, and distributing the loss of growth proportionally across rural zones.
THE ROLE OF TRAVEL PLANS
3.27 Managing the change of land use and development over time, can (as shown above) have major impacts on future traffic levels, but these are felt mainly in the longer term. More immediate impacts on travel patterns can be achieved through initiatives targeted at changing travel behaviour relating to existing and well-established land uses.
Travel Plans
3.28 A travel plan is a general term for a package of measures tailored to the needs of individual companies and other institutions (hospitals, schools) and aimed at promoting greener, more efficient travel choices. It involves the development of a set of mechanisms and targets that together, can enable an organisation to reduce the impact of travel and transport on the environment. It can also bring a number of other benefits to an organisation, both for employees and staff.
• “I check my emails from home and go into the office late morning after the traffic.”
• “I work flexible hours and homework two days a week. I’ve never missed a school play or a sports day. How many working parents can say that?”

THAMES VALLEY MULTI MODAL STUDY Final Report
441 1239 3-6 6352-T.545-pic
3.29 Travel plans have been around for over 25 years in the US, 15 years in the Netherlands, but were first introduced into the UK in 1995. They are an accepted method of reducing travel to work internationally.
3.30 Travel plans in the Thames Valley are on the whole still at an early stage of development, yet those that are being implemented which offer a comprehensive range of initiatives are already showing impressive modal shifts. These current plans serve to highlight what can be achieved through the development and implementation of a range of measures aimed, for instance, at reducing single occupancy vehicle commuting. There are a number of good examples of travel plans being developed and implemented across the Thames Valley in a range of organisations including hospitals, Government departments, higher education, local authorities and businesses. These include, Waitrose, Oracle, GlaxoSmithKline, World Com, Green Park, Royal Berkshire Hospital, Government Office for the South East and the Environment Agency.
3.31 We regard the Thames Valley as having excellent potential for further, more intensive, development and application of travel plan initiatives, and could aim to ‘lead the way’ nationally in this respect.
3.32 This potential relates specifically to the type and structure of economic activity within the area. The knowledge based sector (KBS) has appeared as the driving force behind the Thames Valley economy and in recent years, it is this sector that has grown the most in terms of percentage change. 7 out of the top 20 KBS industries in the UK are based in the area employing 30% of the workforce compared to 21% nationally. The service sector also makes a significant contribution. In 1998, 81% of employees worked in the service sector compared to 79.5% in the South East and 75.6% in the UK as a whole.
3.33 A high proportion of UK and international company headquarters are located in the area. Within the Thames Valley clusters of companies in the telecom, IT, high tech manufacturing, financial and business service sectors have formed. Many of these are US based multi-national companies with 14 of the top 50 billion-dollar brands, including Microsoft, Oracle, and Dun&Bradstreet. These, and other major UK employers, have developed as partners in business as well as customers to those already established. This concentration has resulted in a large supply of skilled IT and technical service workers.
3.34 The business park has become characteristic of the employment geography of the Thames Valley. The area has the highest concentration of business parks in the UK, with examples including Stockley Park and Bedfont Lakes in West London (near Heathrow), and Thames Valley Business Park, Green Park and Arlington Business Park in Reading. The occupiers are commonly in the ‘high tech’ or KBS sectors, such as Microsoft, Oracle, Sun Microsystems and Glaxo, though there are some other, traditional sectors, including the major management consultancies.
3.35 The characteristics outlined above lend themselves to travel reduction methods including teleworking, video-conferencing and compressed working weeks.
3.36 Travel plans in the Thames Valley have achieved an average of around a 10% modal shift in commuting over the past few years. The majority of this shift has been to non-car modes. Evidence from around the UK has shown that up to 65% modal shift

THAMES VALLEY MULTI MODAL STUDY Final Report
441 1239 3-7 6352-T.545-pic
can be achieved given a favourable set of circumstances. Although this may be achievable in exceptional circumstances, it is unlikely to be the norm.
3.37 Around 50% of the Thames Valley workforce is employed in organisations of more than 100 people, i.e. the types of organisation which are likely to be more receptive to travel plan initiatives. If a reduction in car demand of around 10 to 20% at these organisations is assumed (depending on location, and broadly in line with a range of impacts elsewhere), this equates to an overall reduction in peak period travel of around 8 to 10%, (allowing also for the fact that not all peak period trips are journeys to work).
3.38 We estimate that around 5% of car commuting workers could be involved in some form of tele-working by 2016. Additionally, 5% of employers business mileage could be replaced by video-conferencing.
3.39 A co-ordinated approach to travel plans could seek to exploit the potential synergies between different types of plan, for instance a school travel plan which releases the parent from the need to drive their child to school, and an employer’s travel plan which encourages parents to use public transport.
3.40 There are strong potential synergies between travel plan initiatives and other elements of the strategy. As highlighted later, benefits could be maximised by co-ordinating initiatives with plans for enhanced public transport provision (prioritised shuttle buses between station and interchange hubs, and business parks for instance) and for re-allocation of road space (priority arrangements for car sharers, such as HOV lanes, adjacent to major employment areas).
IMPROVING PUBLIC TRANSPORT
3.41 Reference was made earlier to the impact that new development and land use decisions have had in the Thames Valley in further accentuating the reliance on the car. However, in practice, the issue is a much wider one relating to the imbalance in car and public transport ‘cost’.
3.42 ‘Cost’ in this context relates to the full range of factors which are taken into account in how individuals choose to travel – the fare, access to the system, wait time, overall journey time, perceived quality and journey ‘ambience’, reliability, and the need to interchange. Our early work demonstrated, with a number of specific examples of the relative ‘costs’ of car and public transport, why car (even allowing for congestion, unreliability, and parking charges) proves the preferred choice for most Thames Valley trips.
3.43 The Thames Valley is currently heavily reliant on the private car. Proportions of trips made by car across a range of trip purposes, is higher than the national average. For instance 68% of study area residents travel to work by car, close to the national average, and this rises to around 80% for those travelling inbound or outbound across the study area boundary for work. Higher than average journeys to school are made by car and trips to Heathrow from the west are heavily car-reliant (90%).
3.44 The dependence on the car for journeys to work in the Thames Valley is a major contributory factor to high levels of peak hour congestion. There are two important

THAMES VALLEY MULTI MODAL STUDY Final Report
441 1239 3-8 6352-T.545-pic
and interrelated factors at play here: the distribution of commuting trips, influenced by changing patterns in the relationship between where people work and live, and the travel options available for those making these trips. Both of these factors have critical implications for the form and content of the strategy: land use factors have been discussed in the previous section, below, we examine modal choice factors.
3.45 In accounting for current mode choice behaviour, and examining how this behaviour might be influenced in future, it is important to consider the range of factors involved, and their relative importance (which will often vary with the purpose and destination of the trip). We consider, below, aspects associated with public transport provision. The costs of car use are considered in a later section.
3.46 Our strategy development has placed a strong focus on the scope for, and impact of, improving the quality of public transport in the Thames Valley. The following sections consider, with reference to the current situation, what needs to be achieved in terms of the level, coverage and quality of public transport provision to address this imbalance.
3.47 Much of the discussion focuses on upgrading public transport to encourage modal shift from car. While improving public transport to reduce dependency on the car is an essential component of our strategy, public transport enhancements have a wider role than this. Those who do not have the option of a car to meet their travel needs are particularly vulnerable to the reduced levels of accessibility associated with operating current public transport services in increasing levels of congestion.
3.48 Our work recognises that a strategy based primarily on serving commuters, while not necessarily incompatible with the wider and more subtle travel needs and demands of the Thames Valley as a whole, will also not necessarily respond to them. Accordingly, while the focus of discussion below is upon catering for the journey to work, we are mindful of the need to respond to wider requirements and opportunities.
Modal Shift in the ‘Do-Nothing’
3.49 In future, even with only limited improvements to public transport, some shift from car to public transport is likely, as increasing road congestion levels for some movements forces drivers ‘at the margin’ to opt for the public transport alternative. Our analysis shows that, up to 2016 (RPG growth) peak period car demand will grow by 23%, and that over the same period public transport demand will grow by 45% – much higher growth, but from a much lower base. This results in an increase in the proportion using public transport from 6% in 2001 to 7% in 2016.
3.50 However, a pattern of travel choices based increasingly on shift towards the ‘second worst’ option due to increasing highway congestion (or, indeed, higher car costs through road pricing measures, discussed later) is wholly incompatible with a transport system designed to support economic efficiency. Road-based public transport (in the absence of extensive priority measures across the Thames Valley area) would suffer the same deterioration in accessibility as illustrated in Figure 2.1.
Matching Public Transport Provision to Demand Patterns
3.51 In considering a future pattern of public transport provision we have made reference to forecasts of key corridors of future peak period travel demand. With the

THAMES VALLEY MULTI MODAL STUDY Final Report
441 1239 3-9 6352-T.545-pic
importance of modal shift in mind, this analysis has focused on those corridors with high current and forecast levels of car dependency. Most of the largest commuting movements are to and from Central London, but much of this demand is already rail and coach based.
3.52 The polycentric nature of the Thames Valley gives rise to a highly diverse patterns of origins and destinations for journey to work trips, accentuated by the high number of workplaces outside town centres and distributed across the area in business park-type developments.
3.53 Nonetheless, certain strong peak period patterns of demand are clearly discernable and point towards possible priority corridors for public transport enhancement. These include:
♦ Reading/Basingstoke;
♦ Reading/Wokingham/Bracknell;
♦ Reading/High Wycombe;
♦ Reading/Maidenhead;
♦ Reading/Oxfordshire;
♦ Slough/Windsor/Maidenhead;
♦ Blackwater Valley towns;
♦ Surrey – Reading/Bracknell/Wokingham;
♦ Hants – Reading/Bracknell/Wokingham.
3.54 This diverse pattern of travel demand presents a major challenge in terms of viable public transport provision. Provision of public transport services to replicate directly this complex demand pattern is, in most cases, unlikely to be cost-effective. Consolidating services on a more select number of key routes, with connector services feeding into a number of ‘hubs’ on this route, provides the volume of demand to justify higher frequency services on ‘trunk’ routes between key hubs. As discussed further below, some of these main trunk routes within the study area are effectively pre-determined by the current study area rail network.
3.55 Of course, many of these movements across the Thames Valley already have the option of using rail. It is important to exploit the potential of the existing infrastructure and network of rail services to the full.
3.56 We have looked at potential opportunities to carry additional passengers at minimal or no extra cost, and particularly for ‘reverse’ or contra-peak commuting flows. Our analysis suggest there are significant contra-peak flows out of London and that, whilst rail already carries the vast majority of peak directional trips to London, much of this reverse commuting is made by car (e.g. London – Slough/Maidenhead).
3.57 Although rail is the dominant mode of travel from most parts of the Thames Valley into Central London, the same does not hold true for a number of other destination areas, e.g. West London. We have looked at opportunities for better serving this market through modification of existing train services, and minimal or no infrastructure investment, for example by routeing more trains via the Hounslow Loop to serve Hounslow and Brentford.

THAMES VALLEY MULTI MODAL STUDY Final Report
441 1239 3-10 6352-T.545-pic
3.58 The existing rail network would be well suited to catering for at least a proportion of the following flows:
♦ London – Slough/Maidenhead (contra-peak);
♦ London/West London – Egham/Staines//Ascot/Bracknell/Wokingham;
♦ London – Beaconsfield/High Wycombe;
♦ Reading – Basingstoke (both directions);
♦ Reading – Wokingham – Bracknell (both directions);
♦ Reading – Maidenhead – Slough (both directions);
♦ Slough – Windsor (both directions);
♦ Reading – Oxfordshire.
3.59 There will of course be a number of reasons why it is difficult for these trips to be captured by rail, including:
♦ Distance of origin or destination address (or both) from the nearest station;
♦ Access to a non-residential parking space at the workplace;
♦ Unattractive train services;
♦ Pre-disposition against use of rail.
3.60 The structure of rail fares is largely geared to central London which, together with the taper on fare scales, can make the fare cost of relatively short distance trips quite high. There are opportunities to increase the attractiveness of rail, especially for contra-peak trips, through selective reductions in fares by arrangement with local employers. There are a number of precedents for this including an arrangement with Chiltern Trains for contra-peak travel to and from Aylesbury (including for Buckinghamshire CC staff) whereby off-peak fares apply such that the fare cost of local travel becomes broadly comparable to the ‘petrol only’ cost of making the journey by car.
3.61 Poor accessibility to the rail network is also often perceived as a deterrent to use of the system, particularly for short to middle distance trips where access to and from stations can make up a significant proportion of overall journey time and cost. This can be addressed by building new stations where appropriate to better serve local land uses, especially in areas of new development. However, it must be borne in mind that additional station stops will add to journey time for ‘through’ passengers, and hence a careful balance has to be drawn between the needs of the various groups.
Inter-urban buses
3.62 Currently, there are generally sparse levels of service on inter-urban bus routes in the Thames Valley. While the network is fairly comprehensive, frequency is often low and many journeys cannot be made without un-coordinated interchange. The Blackwater Valley towns, for instance, illustrate the pattern across the study area of reasonable local
“I am not a car owner and so I use public transport … services are infrequent and unreliable.” (WRG1) “It is easy for me to get into Didcot or Oxford, but it’s very hard to go from Reading to Wallingford.” (WRG1) “To get from Woodley to Lower Earley, you have to get a bus to Reading and then get another bus out.” (Focus group with blue collar workers)

THAMES VALLEY MULTI MODAL STUDY Final Report
441 1239 3-11 6352-T.545-pic
services, but poor inter-urban links to serve the dispersed pattern of urban areas and development.
3.63 Operating margins tend to be diminishing and companies are under pressure to concentrate resources on more profitable routes. Inter-urban routes are often marginal and it is not unusual for them to be shortened or removed completely. Coupled with the continuing demise of independent operators, this has led to the loss of coach links to Central London and between Reading and Basingstoke and Reading and Aldershot – both corridors carrying significant and increasing volumes of commuter demand.
3.64 Existing services tend to operate on historic timetables that have not been adjusted to reflect changes in land use and other factors that have taken place in the Thames Valley. Operators are only now developing sophisticated route costing packages to determine the profitability of routes and ticket machines which can provide information on travel patterns. Of course, these only report on existing journeys, and do not identify potential demand for new services.
3.65 About 80% of the most frequent inter-urban services start, finish or pass through the location of their depot. However, most of these are located in the major centres and there is little evidence of buses diverting off-route or running empty on ‘positioning’ journeys. The pattern of provision therefore often reflects current depot locations rather than patterns of existing and potential demand.
Rail constraints
3.66 Unlike bus, rail is unencumbered by increasing road congestion, and theoretically better positioned to offer the level of service sought by car drivers. However, a key issue is that there are a number of capacity constraints on the existing rail network which constrain the ability to offer substantially enhanced levels of service.
3.67 On the rail network, there is a tendency for the operators, in the face of limited capacity, to prioritise the more profitable strategic services, although they are subject to certain constraints on their ability to change services as a result of the Passenger Service Requirements (PSR). This means that train frequencies, timings and stopping patterns are often not in line with local requirements.
3.68 Key constraints which limit the ability to improve service frequencies, increase speeds and reduce journey times include:
♦ Capacity limitations at Reading station – this is the single greatest constraint on train service frequency improvements on the Great Western Main Line (GWML). The number of platforms for fast line services is unduly restrictive; there is only limited platform capacity for South West Trains (SWT) North Downs Line services; reversals of Virgin Cross Country (VCC) trains between the Basingstoke and Oxford routes utilises platform capacity (although a scheme to enable trains to reverse in Platform 3 is being implemented which will help to alleviate the problem of conflicting train movements); and there are restrictions in the signalling system;
♦ Number and length of platforms at London Paddington – several platforms are unable to accommodate full length (IC 125) trains;

THAMES VALLEY MULTI MODAL STUDY Final Report
441 1239 3-12 6352-T.545-pic
♦ Limited capacity on the fast and the slow lines between Paddington and Reading due to service intensity, train speed differentials and the mixed stopping patterns of train services. On the fast lines, the superior acceleration of Heathrow Express trains enables them to create sufficient distance ahead of a following High Speed Train (HST) to limit the impact;
♦ Airport Junction where Heathrow Express trains join the Main Line – particularly the need for Heathrow Express trains to join the ‘Up Fast’ line between trains running at up to 125 mph;
♦ Line capacity on the approaches to London Waterloo. We understand from Railtrack that there is some spare capacity on the Windsor Lines, with the capability to accommodate up to around 21 trains per hour (tph) compared with the 14-15 tph operating currently;
♦ Terminal capacity at Waterloo, and the availability of platforms of sufficient length to accommodate long trains;
♦ Line speed restrictions, particularly on the ‘Southern’ routes away from the South West Main Line – typical line speeds on the Reading – Waterloo route and the North Downs Line are 60 – 70 mph;
♦ Capacity limitations on the North Downs Line due to differential stopping patterns of trains, and platform capacity restrictions at Guildford and Redhill stations;
♦ Restricted platform lengths – under Health and Safety Executive (HSE) safety requirements, station platforms have to be sufficiently long to accommodate the maximum length sliding door stock trains which would use those platforms under normal circumstances. Many station platforms in the study area would not be able to accommodate longer trains without extension which, depending on the layout of individual stations, may involve very significant cost;
♦ Flat junctions, e.g. Wootton Bassett, Didcot, Reading East and West, Wokingham, Ash, Guildford, Woking where conflicting train movements constrain junction capacity. This limits the ability to operate additional trains at peak times;
♦ Differential train speeds and/or variation of stopping patterns (both reduce the maximum number of paths achievable over any section of line).
3.69 The Great Western Main Line (GWML) was one of two routes selected for experimental fitment of Automatic Train Protection (ATP) systems following the Clapham Junction accident in 1988. Trains not suitably equipped with ATP are not allowed to operate into Paddington, thus constraining the operation of certain rolling stock types on parts of the GWML.
3.70 At Reading station the track layout is designed to cater predominantly for east-west train movements. However, the recent growth in north-south traffic (passenger and freight), coupled with continued growth in east-west traffic, has resulted in the station becoming a bottleneck in the system.
3.71 The conflicts between east-west train movements and north-south movements give rise to similar problems at Reading West and Didcot East. Capacity to the west of Didcot East is limited by differential running speeds of local and long-distance services, and also freight.

THAMES VALLEY MULTI MODAL STUDY Final Report
441 1239 3-13 6352-T.545-pic
3.72 Further pressure on capacity in the Reading – Didcot – Oxford area will arise as and when additional freight services between Dibden Bay (Southampton) and the West Midlands via Basingstoke, Reading and Oxford are introduced.
3.73 In spite of the infrastructure constraints outlined above, there is some scope to increase seat capacity through longer trains and timetable changes. This is currently the subject of a study by SRA/Railtrack, and is discussed further in Chapter 4.
Matching Provision to Market Requirements and Expectations
3.74 The question of the most appropriate mode of transport to serve the range of travel demands is a complex one requiring consideration of potential demand levels, cost, physical feasibility, and – crucially – user needs and expectations.
3.75 The ‘image problem’ of road-based public transport in the UK is well-established. Experience, supported by research, shows that public transport use is considered a ‘last resort’ by many current car users. However research (backed by recent modal shift successes with the implementation, for instance, of urban light rail schemes in the UK) also shows that the problem, apparent at a national level, is not necessarily with public transport per se, but with the perceptions of poor quality and reliability associated with current provision.
3.76 A pre-requisite for attracting car users to bus in the Thames Valley will be to address current reliability problems, and to reduce journey times. We have not undertaken surveys to quantify bus reliability for ourselves, and operators proved unwilling to divulge information from their own monitoring, but one large company suggested that more than 10% of services run late. The main reasons given for this are:
♦ traffic congestion – limited bus priority provision exists, except in some of the main urban areas such as Reading. Operators also report serious disruption to inter-urban services arising from traffic re-routing as a result of incidents on the Motorway network; and
♦ staff shortages – Reading Buses for instance report a 13% shortfall in staff. Lack of skilled maintenance staff has prompted some operators to employ commercial dealers to maintain their vehicles, which increases costs, and can, in turn, lead to increased fares or cuts in service frequencies.
3.77 In terms of offering faster inter-urban links, a further issue is that current inter-urban buses tend to route through as many settlements as possible to capture all potential passengers. For example, the shortest route between Bracknell and Slough by road is 12 miles, however, the 191 takes 50 minutes to complete as it serves Ascot and Windsor en route.
The Need for an Integrated Multi-modal System
3.78 The preceding discussion would suggest that a system which is predominantly rail-based would achieve most in terms of attracting car-drivers. In practice, however, different modes will be appropriate or feasible in different corridors. The challenge will be to replicate some of the positive characteristics of rail across a system comprising a range of modes, and – most importantly of all – to ensure that the network operates as a cohesive and integrated system.

THAMES VALLEY MULTI MODAL STUDY Final Report
441 1239 3-14 6352-T.545-pic
3.79 Much of the pattern and nature of public transport provision is pre-determined by the existence of an established rail network within the Thames Valley, which caters not only for local demand but also major inter-regional movements through the study area. The configuration of the study area rail network forms an important starting point, and we have explored the scope for a ‘hierarchical’ pattern of provision by mode with enhanced rail providing the main ‘trunk’, supported by local feeders (‘spokes’) served by buses. However, the major constraint here is the absence of a continuous north/south rail link across the study area.
3.80 The ‘hub and spoke’ concept carries with it a requirement for many journeys to interchange from one service to another, or – in same cases – between modes. Interchange acts as a disincentive to public transport use, unless it is designed in such a way as to minimise the ‘interchange penalty’ – by making the interchange fast, convenient and safe. Integrated ticketing and fares systems, allied with good information will have an important role to play here.
3.81 The appeal of public transport is judged on the attractiveness of the options from door to door. So, integration needs to be across inter-urban services, but must also consider local services.
3.82 Currently, there are few examples of buses and trains operating integrated timetables and bus timetables rarely advertise connections with other bus services or with trains. There are, however, some examples of passengers being able to buy a bus ticket ‘add-on’ with a rail ticket, such as in Reading. Bus companies are unable to offer the same service for the sale of train tickets for a number of reasons including the number of journey possibilities and the fact that cash is the only means of payment. Where buses serve railway stations timetable information is rarely available.
Delivery Issues
3.83 Our work on the development of a strategy for public transport for the Thames Valley has been mindful of the realities associated with current arrangements for public transport provision. We discuss in Chapter 6 the mechanisms which we believe need to be put in place to ‘deliver’ our public transport proposals; as a pre-cursor for this, we highlight in the following text some aspects of current arrangements which influence current public transport provision.
3.84 A number of obstacles exist to the provision of good integrated services across the whole of the study area (other than in the GLA area, where different arrangements apply) to reflect commuter patterns. A variety of local, inter-urban and longer distance bus services are provided by First Group, Arriva and Reading Buses. The Competition Act (1998) has constrained moves to provide integrated timetables and joint ticketing initiatives between operators as these may be deemed anti-competitive, even though they would lead to improved services. Fines can amount to up to 10% of an operator’s turnover. In practice, Thames Valley operations tend to cover discrete areas and so there is little competition for routes, meaning that, within these areas, more integrated timetables and simple fares structures can be introduced. However, much of the travel transcends these discrete areas.
3.85 Buses currently operate across the boundaries of several unitary local authorities across the Thames Valley area. There are numerous cross-boundary services,

THAMES VALLEY MULTI MODAL STUDY Final Report
441 1239 3-15 6352-T.545-pic
including the 191 service which runs through Reading, Wokingham, Bracknell Forest, Windsor, Maidenhead and Slough. There is also evidence of many evening and Sunday services funded by one authority but operating in other authorities’ areas. For example, the 41/43 is funded by Surrey County Council but also operates through Slough, Windsor and Maidenhead.
3.86 A common theme from operators consulted as part of this study in response to the possibility of a more pro-active approach to developing new routes and services, and ‘growing’ their business, is that they are too busy ‘fire-fighting’ the day to day implications of staff shortages.
CHARGING FOR CAR USE
3.87 Charging for public parking is, of course, well-established. There is less experience however of other forms of charging targeted at car use (other than fuel tax), in spite of the ‘green light’ given to local authorities by Government for initiatives such as workplace parking levies, and urban cordon charging. As part of a wider strategy the concept of charging could play a role in complementing and/or supporting the other key initiatives above, such as reducing the need to travel, and encouraging modal shift from car.
3.88 We have undertaken analysis to examine the modal shift impact of major enhancements in public transport, but have also sought to establish how much additional benefit could be achievable by influencing the ‘car side of the mode choice equation’ through charging. Local authorities have been given the powers to implement some of these measures now (cordon charging and workplace parking levies); others (area-wide congestion charging), will require longer to implement, requiring new legislation and developments in technology.
Road User Charging (RUC)
3.89 Road-user charging is a mechanism through which motorists pay to use a defined area of road, for example, by tolling, and this is currently used extensively across Europe, and on key bridges in the UK. It can also form part of a larger scheme to charge for use of road space, and provide a means through which road space can be re-allocated in favour of public transport. Road user charging can be applied using a number of alternative methods as outlined below.
3.90 Road-user charging may be a useful tool to reduce congestion, but it can also be used to raise revenue for increasing investment in public transport or the construction of a new road. It is commonly referred to as “congestion charging”, particularly by the media, but in practice, congestion charging is just one possible form of road-user charging, as explained below.
3.91 When deciding to make a journey, a driver will usually only take into account the costs that they impose upon themselves, e.g. cost of fuel (higher in stationary traffic), or personal congestion cost if delayed due to heavy traffic. Internalising these costs means that the motorist should pay the costs generated by a system that they benefit from, and impose on others, such as:
♦ Costs of extra congestion for all other vehicles on the road due to the driver being there;

THAMES VALLEY MULTI MODAL STUDY Final Report
441 1239 3-16 6352-T.545-pic
♦ Pollution/environmental costs;
♦ Accident costs.
Zone and Cordon Charging
3.92 Cordon charging involves setting up a linear cordon and charging at access points to the zone, as is due to be implemented in early 2003 in central London. The user would then pay a charge depending on how many crossings into the zone are made, or in some cases, for how long. It can incorporate varying charging scales according to type of vehicle, time of day etc. However, a disadvantage is that vehicles will often 'skirt' around the edges of zones to avoid paying the charges, increasing the congestion outside the zone.
3.93 We have undertaken analysis of the potential impacts of a cordon charging strategy in the Thames Valley context. This examined the impacts of applying charging cordons around the larger towns within the study area. The analysis sought to establish the level of congestion relief as a result of traffic reduction due to modal shift or other responses. Our conclusion was that cordon charges are likely to be less effective in meeting the needs of the Thames Valley than an area-wide system. The main concern with cordon charging relates to the high number of through movements in the key urban centres, and the proportion of peak period journey to work trips destined for areas falling outside the cordons. Accordingly, our analysis indicated that the main response to cordon charges was re-routing of traffic rather than modal shift, with a net detrimental effect on the performance of the highway network and study area noise and air quality levels.
3.94 While not recommending cordon charges as an area-wide element of our strategy, we recognise that more selective applications may be appropriate for centres of major trip attraction and generation which are able to provide the level and quality of public transport provision to present a real alternative to car use. Within the study area, Reading and Heathrow may fall into this category, although any scheme would need to be subject to detailed local appraisal and consultation.
Distance-based Charging
3.95 With distance-based charging, the fee levied is proportional to the distance travelled. In urban areas, a cordon might be defined and drivers charged according to the distance travelled within the cordon. The drawback of distance-based charging is that drivers are encouraged to use the shortest routes, which are not always the most suitable (for instance, a direct route through a town or village, rather than a by-pass).
Time-based Charging
3.96 With time-based charging, the driver is charged a fee related to how much time is spent on charging roads, or in an urban area, within a cordon. Implications of this are that if traffic congestion is higher, then the driver spends more time in the zone, and hence would be charged more. The driver would then perhaps choose not to enter the zone/cordon at busy times of day. The problem with time-based charging is that it would encourage drivers to drive faster to spend less time in the charging zone.

THAMES VALLEY MULTI MODAL STUDY Final Report
441 1239 3-17 6352-T.545-pic
Congestion Charging
3.97 This can be considered as a sub-set of road-user charging, as the fee levied would be directly related to the extent to which a vehicle uses congested links, as measures through satellite positioning and road-side sensors. This would mean that, in an urban area, within a defined cordon, use of any road at any time could result in a congestion charge being levied, depending entirely on the traffic conditions. The definition of 'congestion' is critical to the way the scheme is implemented and how users are charged.
Charging in the Thames Valley
3.98 This study has considered the scope for charging, and the most appropriate form of implementation, taking account of the particular characteristics of travel demand in the Thames Valley (and, indeed, the findings of the ORBIT work). Our analysis suggests that an area-wide system is more likely to respond to the specific characteristics of the Thames Valley, than one based on urban cordons. This could be implemented as either a time or distance-based system (though for the purposes of our analysis we have assumed the distance-based system recommended within the ORBIT study).
3.99 There is an important political dimension here. Charging for road use holds, for some, connotations of infringements on personal freedom, and can be interpreted as anti-road. For this reason, it will be important that interventions are closely targeted at, and linked to, acknowledged problems such as peak period traffic congestion, and the associated adverse impacts. The availability of attractive alternatives is another critical consideration if schemes are to win support. Restrictions on road use per se are likely to be unpopular, and to reduce the chances of the successful implementation of the strategy overall.
Parking Policy
3.100 Local authorities can have some influence on modal choices through policies on parking provision and pricing. It is not appropriate for this study to examine and recommend parking policy at the local level. A review of LTPs within the study area suggests that the potential role of parking policy to contribute to wider strategic aims is well understood; often, however, this is off-set against local economic objectives.
3.101 However, we have considered the potential benefits of a more co-ordinated approach across the Thames Valley. While we have not quantified the impacts directly in our strategy appraisal, we have assumed that a co-ordinated approach to parking policy will be an important component within the wider strategy.
3.102 The amount and cost of parking available to those travelling into town centres for work purposes is the key determinant of mode choice. Currently, the extent to which local authorities can make any significant impact through parking policy depends upon how much of the parking stock is within their ownership. Commuter parking stock includes public car parks (operated either privately or by local authorities) and Private Non- Residential (PNR) parking. In Reading town centre for instance, of a total off-street parking stock estimated at around 20000 spaces, some 12000 are PNR, and 8000 public spaces. Of the 8000 public spaces, less than 1000 are priced

THAMES VALLEY MULTI MODAL STUDY Final Report
441 1239 3-18 6352-T.545-pic
at rates which are likely to be attractive to those parking their cars for the working day.
3.103 Characteristics such as the proportion of the parking stock which is PNR, how much is within local authority control, how much is given over to long-stay parking, and what charges are levied are highly variable across the study area. Also variable, is the level of commitment shown in current local authority policy documents to the use of parking as a mechanism for demand management.
3.104 This study recognises that the imposition of specific area-wide policies and pricing structures would fail to allow for local priorities and needs. However, we believe that there is scope for a more co-ordinated approach to parking provision across the study area as part of the wider package of measures designed to re-dress the imbalances between car and public transport use.
3.105 Such a co-ordinated approach across neighbouring authorities would have a number of purposes:
♦ To ensure that parking policy does not compromise accessibility to town and city centres relative to peripheral and out- of- town locations;
♦ To create area-wide accessibility indices, both current and projected, in a format that will allow car parking standards and charging levels to be derived in a consistent, yet flexible way throughout the area;
♦ To encourage closer integration between land use and transport issues at an area-wide and site-specific level.
3.106 The study has also considered the scope for workplace parking levies in the Thames Valley. As highlighted above, our preferred method of charging would be an area-wide system, notwithstanding on-going uncertainties relating to appropriate technologies. Our concerns with workplace parking charges in the Thames Valley are similar to those expressed for cordon charging: the wide dispersion of peak period journey to work trips makes providing alternative modes more difficult than in circumstances of highly consolidated trip destinations (such as in major city centres). There is also a concern that any road capacity released as commuters to the Thames Valley choose to find alternatives to the car, could encourage new and re-routed trips onto the Thames Valley road network.
Other Modal Shift Initiatives
3.107 Our strategy development work has not looked in detail at more localised modal shift initiatives such as school buses, and encouraging more walking and cycling. Nonetheless, these will continue to have a key role to play through the LTP process.
THE SCOPE FOR MODAL SHIFT FOR FREIGHT
3.108 Table 3.2 below summarises the broad volumes of freight to, from, within and across Berkshire by mode (similar information at the study area level was not available). Most freight (around 90% of tonnes lifted) is currently transported by road. Policy at both the national and regional level seeks where possible to encourage a shift of freight movements from road to rail. The scope for such a shift has been given careful attention as part of this study, taking account of the type and pattern of freight

THAMES VALLEY MULTI MODAL STUDY Final Report
441 1239 3-19 6352-T.545-pic
movements in the area, (including the distance over which freight is moved) and capacity constraints on the study area rail network, including the need to balance rail passenger and freight demands.
3.109 Table 3.2 demonstrates the significance of freight traffic passing through the area (both by road and rail) as a proportion of overall freight movements. This reflects the geographical location of Berkshire in relation to London, the South Coast, the Midlands and the North.
Table 3.2 – Freight movements (Berkshire)
Road Annual Tonnes (tonnes lifted, millions)
Rail Annual Tonnes (tonnes lifted, millions)
Intra Berkshire 6.0 0
From Berkshire 8.9 0
To Berkshire 8.9 1.9
Transit East/West 35.2 1.6
Transit North/South 3.5 3.3
TOTAL 62.5 6.8
Source: MDS Transmodal GBFM
3.110 The main industries in the study area generating significant volumes of freight are manufacturing, retail and airfreight. Freight generating activities broadly reflect the distribution of land use across the study area, with a relatively dissipated pattern of activity (although with airfreight there is particular clustering of activity in the vicinity of Heathrow). There is no ‘heavy’ industry such as steel making or car manufacturing.
3.111 We have developed freight aspects of our strategy for the Thames Valley by examining the level and pattern of freight activity in the area (as summarised above), and critically, the factors which underlie and account for where, when and how freight is moved. Many of the characteristics of freight activity in the area mirror characteristics of the freight industry at a national level.
3.112 One of the main factors affecting modal choice for freight is the relative cost of road and rail which, in turn, is a function party of the distance over which freight is being moved. Road freight currently dominates the movement of goods in the Thames Valley. One of the main barriers to using rail freight – along with the perceived quality of service or reliability problems and a lack of facilities – is the cost compared to road transport. However under the right circumstances rail freight can be cost competitive.
3.113 The vast majority of road freight transported in the Thames Valley is moving to and from counties/regions where rail freight is currently economically uncompetitive (8 million tonnes per annum from Berkshire and 7.4 million tonnes per annum to Berkshire). This accords with the perception of the relative attractiveness of the modes apparent in consultation undertaken with freight operators for the purposes of

THAMES VALLEY MULTI MODAL STUDY Final Report
441 1239 3-20 6352-T.545-pic
this study. Most organisations interviewed were moving goods over shorter distances.
3.114 Where cargoes are capable of moving siding to siding (thus economically competitive), rail freight is already being used. It is likely that shorter distance flows in the Thames Valley currently being undertaken by road would not be able to move siding to siding i.e. shipper and receiver is not rail connected and a road haul would be required at some stage. These flows will thus be more economically competitive by road. Long distance flows by road are very small in volume, less than 100,000 tonnes per annum from Berkshire and around 150,000 tonnes to Berkshire. Approximately 1 million tonnes per annum moves to and from Berkshire to regions where rail should be able to offer a cost package equal to road transport. However other factors, set out below, may explain why these flows currently move by road.
3.115 The interesting flows by road however are those to and from the so called 'borderline' regions where road and rail are likely to be equally economically competitive. Approximately 0.9 million tonnes of goods are collected in Berkshire for these regions and just over 1.2 million tonnes of goods are delivered in Berkshire from these areas by road. Given the availability of grant funding and a service package of sufficient quality, these flows could move by rail and derive a cost advantage.
3.116 Our analysis suggests, therefore, that up to 2.0 million tonnes of goods currently moved by road in Berkshire could be attracted to rail and derive a cost benefit. It would, of course, be unreasonable to suggest that the totality of this traffic would actually convert to rail. In addition to the constraints on capacity which exist on the rail network there are, as explained below, a wide range of other factors which in practice make that conversion difficult.
3.117 As well as the economic choice, shippers in the Thames Valley region will use other criteria when deciding which mode of transport to use. These will include:
♦ Availability of facilities. Most locations are not directly rail connected and are a sufficient distance away from the mainline to make a rail connection impossible. Additionally there are currently no intermodal terminal facilities in the Thames Valley region;
♦ Quality of service. The road transport market operates in a highly competitive environment, not only in cost terms but also the quality of service provided. Road hauliers generally provide a high level of service, and it is fairly easy to change to another haulier if service standards are not being met. The rail freight industry has yet to prove it can match such standards. While there are doubts concerning the rail industry's ability to deliver, shippers are reluctant to use it. Many shippers are prepared to pay extra for the quality of service. Therefore while rail may offer a cheaper solution, shippers will pay extra to guarantee delivery;
♦ Flexibility. Many companies located in the Thames Valley operate in a strict 'just in time' environment, where deliveries have to be despatched with short lead times. Road haulage is more flexible and able to respond quickly in such an environment;
♦ Handling. Additional handling of freight on intermodal trips affects not just cost, but also risk of damage to products and security concerns;

THAMES VALLEY MULTI MODAL STUDY Final Report
441 1239 3-21 6352-T.545-pic
♦ Environment. Companies wishing to stress their 'green credentials' may wish to use rail freight even though road transport may offer a cheaper solution;
♦ Product flows. Different types of product flows lend themselves to different modes of transport. Small volume and highly fluctuating product flows are best suited to road transport where as large volume regular flows of low value goods normally suit rail freight;
♦ Customer requirements. Customers may stipulate which mode of transport they require goods to be delivered by.
LOCALISED MOTORWAY WIDENING
3.118 A general strategy of providing major new highway capacity across the Thames Valley, including systematic widening of the study area road network, was one of the broad approaches tested during the strategy development work. The concluding section of this chapter summarises the key reasons why this approach was not pursued further in the development of the preferred strategy. In broad terms, the level of improvement in highway network performance resulting from significant capacity enhancements to the Thames Valley road network, based upon widening of the east/west Motorway routes through the Thames Valley area, was modest relative to the adverse impact on overall traffic levels, noise and air quality, even before examining the wider environmental impacts associated with road widening.
3.119 However, in looking at measures designed to improve the performance of the Motorway network, we looked again at the possible case for, and merits of, more localised widening of key ‘problem’ sections of the Motorway network. This was undertaken alongside a more general review of interventions designed to reduce congestion on the Motorway, the recommendations from which are set out in Chapter 4. As part of this we have looked specifically at J3-4b of the M4, as consideration of this section was remitted directly to this study as a result of the T5 decision.
M4 – J3 to J4b
3.120 In terms of the critical stretch between Junctions 4b and 3, the problems for drivers relate as much to leaving the motorway as to using it. East of Junction 3, the capacity of the onward continuation of M4 is governed by the 2 lane restriction of the elevated section at Chiswick. South of Junction 3, the junctions on the A312 route are heavily congested. The Hayes Bypass route to the north of Junction 3 provides a high standard link with many parts of north and west London. In consequence it is heavily used and the at-grade junction with the A437 at Bull’s Bridge is already severely overloaded.
3.121 Against this background, the potential benefits of widening the M4 between Junctions 4b and 3 would be substantially offset by the additional congestion introduced to the non-motorway network.
3.122 The main effect of providing additional motorway capacity would be to encourage additional traffic to use the motorway, resulting in a similar peak level of service as currently exists on the motorway – but for more drivers – and significantly exacerbating the conditions downstream of Junction 3 for all existing users.

THAMES VALLEY MULTI MODAL STUDY Final Report
441 1239 3-22 6352-T.545-pic
3.123 The main source of the additional traffic is likely to be drivers transferring from parallel routes (including the entirely welcome relief of traffic using some residential roads). But an element of the increase would inevitably be those who had previously avoided the worst of the congestion by travelling outside of the main peak, or by other modes, or to other destinations, or had avoided travelling altogether.
3.124 We believe therefore that the widening would be satisfying a latent demand for increased car usage, and acting in conflict with many aspects of the central TVMMS strategy with little to show in terms of overall travel benefits. As part of the planning approval for Terminal 5 a series of public transport improvements are proposed, although these are designed primarily for movements to and from the east of Heathrow (an issue addressed in our own strategy recommendations in Chapter 4). Widening of the M4 over this critical stretch would work against local authority and BAA objectives to further encourage public transport as a means of access for airport users.
M4 – West of M25
3.125 Other than the section between J4b and Junction 5, which is four lane, the M4 to the west of the M25 is of dual three lane standard. Our analysis of future flows on this section indicates that, both with and without road user charging, heaviest peak hour flows are between Junction 7 and 8/9, and that this link is forecast to be at capacity.
3.126 In general terms, options for providing increased capacity on Motorways could include use of the hard shoulder, either as an additional standard lane or as additional carriageway width enabling an extra lane to be provided with sub-standard lane and hard shoulder widths. ‘Hard shoulder widening’ is available only intermittently along the M4 east of the M25, leaving the option of only widening sections which can accommodate this type of widening, or widening the Motorway beyond existing boundaries.
3.127 Intermittent widening is likely to attract additional traffic to the Motorway system which then needs to be accommodated by adjacent non-widened sections. This may have merit if the additional capacity is then provided where it is most required, but, in this case, the highest flow section, J7 to J8/9, is one where hard shoulder widening is specifically not possible, because there is no hard shoulder at the structures or at the Thames Crossing. There are also several sections showing forecast demand levels which are approaching 7000 passenger car units (pcus) per hour in the AM peak. Some of these are sections where the difficulties and costs of widening would be very substantial.
IMPROVED MANAGEMENT OF ROAD SPACE
3.128 Earlier in this chapter we have considered addressing congestion through major new highway provision, through reductions in the volume of traffic by managing travel demand and/or encouraging a shift to public transport. Another important tool to consider is better network and traffic management (through physical measures) to encourage more efficient use of available road space.
3.129 Our analysis suggests that there remain a considerable number of highway-based trips which are ‘out-of-scope’ for travel management and modal shift initiatives.

THAMES VALLEY MULTI MODAL STUDY Final Report
441 1239 3-23 6352-T.545-pic
While other elements of the strategy may bring about a better balance in demand and supply across the network, congestion will remain and, in some specific areas, may intensify significantly, eroding some of the wider benefits delivered by a wider strategy.
3.130 In this context, we are also acutely aware that in many cases, there is need for action now, and many of the larger impacts considered for inclusion in a strategy will not be felt for some years into the future.
3.131 There have been two dimensions therefore to our considerations of better management of the highway network; measures designed to bring shorter term relief, and measures designed to support and complement wider components within the strategy in the longer term.
3.132 It should be emphasised that, because of the strategic nature of this study, we have not undertaken specific detailed analysis of individual sections of the road network. We have aimed, instead, to provide some guidelines within a strategic context, to be taken forward as appropriate by the delivery agencies. In terms of the study area Motorway network, for instance, our work is designed to ‘dovetail’ with the considerations of exercises such as the Route Management Strategies (RMS). However, where possible we have presented examples of the types of locations where proposed measures may be appropriate. Interventions considered are summarised below.
Local Highway Improvements
3.133 Our study has reviewed proposals for improvements to Junctions 4 and 11 of the M4, in terms of their compatibility with our emerging strategy. In both cases, the schemes could be shown to offer local traffic benefit, relatively low risk of generating new road-based traffic or adverse strategic traffic re-routing, and also offered potential for initiatives designed to encourage modal shift. We believe that the general principles used in this analysis should be applied to proposals for junction improvements in the Thames Valley coming forward in the future.
3.134 It is not the role of this study to identify and develop specific proposals at individual junctions across the study area. Such measures need to be progressed through the LTP process for the local road network, or the Route Management Strategies for trunk roads, on the basis of more localised analysis and consultation. However, our work has identified a number of corridors which are likely to be ‘at stress’ in future, even with the implementation of other measures within our strategy.
3.135 We have also looked at some indicative schemes for further investigation at particular ‘pinch-points’ in the trunk network (principally the merges and diverges at junctions).
Priority Allocation to Public Transport
3.136 Reference has been made earlier to the impacts of congestion on both passengers and operators. Providing priority measures can assist in improving journey time and reliability.

THAMES VALLEY MULTI MODAL STUDY Final Report
441 1239 3-24 6352-T.545-pic
Freight Routing Strategies
3.137 Freight movements both suffer from, and contribute to, problems of congestion and unreliability in the Thames Valley transport system. Improving freight efficiency and minimising its impact are both important strands of this study. Accordingly, we have sought to identify and test a range of measures specifically designed to aid the efficient movement of freight, and to reduce the adverse impacts of freight movement.
3.138 The main problem identified by freight operators during consultation undertaken for this study was the high level of congestion in the Thames Valley area, and in particular, on certain parts of the road network. Areas of particular concern include;
♦ The M25 in general, and the section from the M40 to Clacketts Lane services in particular. This section experiences high traffic levels and congestion for most of the working day, i.e. 07.00 to 19.00;
♦ M4 from Reading to the M25. This section experiences high traffic levels and congestion, particularly at peak times, such as the morning and evening peak rush periods.
3.139 The high levels of traffic and associated congestion impacts on the efficiency of freight operations. Congestion causes delays to deliveries and introduces a degree of uncertainty into the timing of schedules. However as the congestion is known about, and occurs on a daily basis, most operators stated that, where possible, they avoid these sections by scheduling vehicles at other times of the day e.g. early morning or operating long distance trunking at night. Therefore while the congestion is a problem, operators have ‘learnt to live with it’. While this means delays are reduced and most deliveries occur on time, it has significantly shaped the distribution operations by forcing deliveries to occur at certain times of the day to avoid congestion, thus reducing operational flexibility.
3.140 In order to increase operational flexibility and further avoid congestion, operators are seeking to schedule more vehicles during the night time. However, obstacles to more night time operation identified by operators include:
♦ Restrictions imposed by local authorities at some delivery locations, with a perception that restrictions are applied inconsistently across the Thames Valley;
♦ Some delivery locations will not accept deliveries at night time.
Priority Allocation to High Occupancy Vehicles (HOV)
3.141 Around 80% of private cars travelling on the Thames Valley road network in the morning peak have a single occupant. More efficient use of road-space could be made if travellers with common origins and destinations could be encouraged to car share. The primary means for encouraging car sharing is through the travel demand mechanisms discussed elsewhere in this report, and in particular, company travel plans. In particular we have highlighted the strong potential within the Thames Valley for car sharing initiatives arising from the heavy clusters of employment locations, such as business parks, and the offices of large global companies (although this is mitigated against by the dispersion of employee catchment areas). Major employers can (and do currently) contribute through priority car parking spaces for car sharers, and car sharing clubs on company intranet sites.
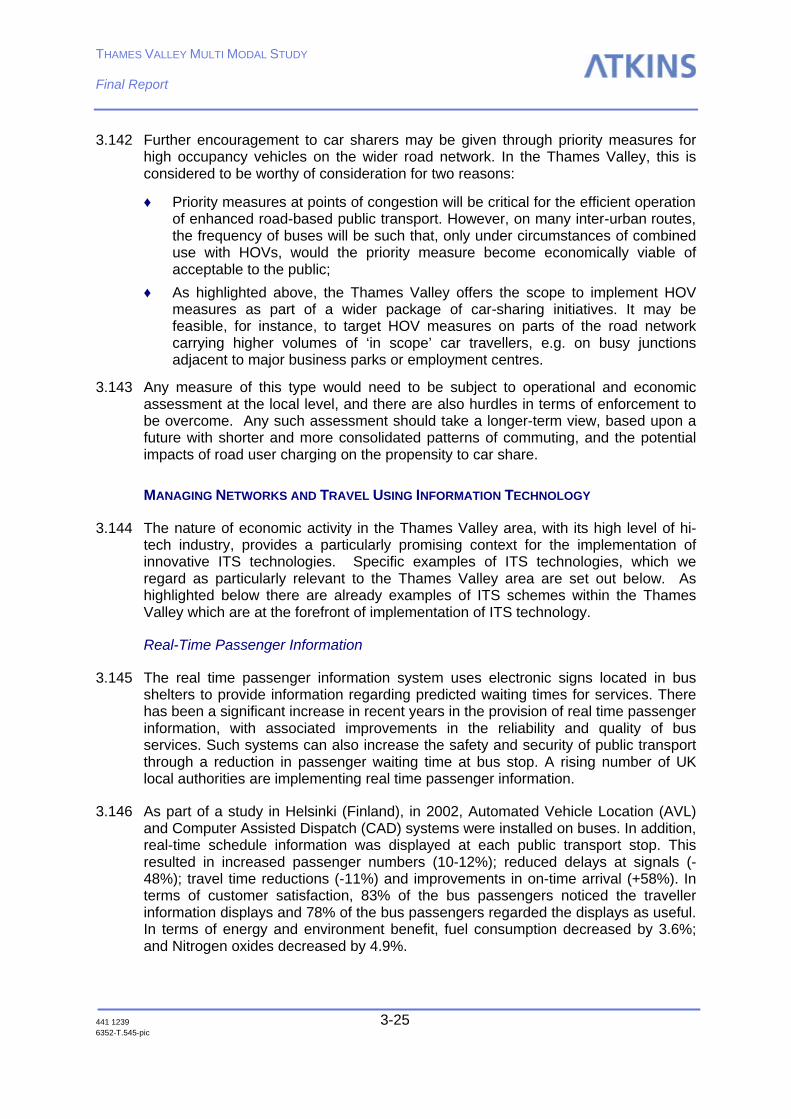
THAMES VALLEY MULTI MODAL STUDY Final Report
441 1239 3-25 6352-T.545-pic
3.142 Further encouragement to car sharers may be given through priority measures for high occupancy vehicles on the wider road network. In the Thames Valley, this is considered to be worthy of consideration for two reasons:
♦ Priority measures at points of congestion will be critical for the efficient operation of enhanced road-based public transport. However, on many inter-urban routes, the frequency of buses will be such that, only under circumstances of combined use with HOVs, would the priority measure become economically viable of acceptable to the public;
♦ As highlighted above, the Thames Valley offers the scope to implement HOV measures as part of a wider package of car-sharing initiatives. It may be feasible, for instance, to target HOV measures on parts of the road network carrying higher volumes of ‘in scope’ car travellers, e.g. on busy junctions adjacent to major business parks or employment centres.
3.143 Any measure of this type would need to be subject to operational and economic assessment at the local level, and there are also hurdles in terms of enforcement to be overcome. Any such assessment should take a longer-term view, based upon a future with shorter and more consolidated patterns of commuting, and the potential impacts of road user charging on the propensity to car share.
MANAGING NETWORKS AND TRAVEL USING INFORMATION TECHNOLOGY
3.144 The nature of economic activity in the Thames Valley area, with its high level of hi-tech industry, provides a particularly promising context for the implementation of innovative ITS technologies. Specific examples of ITS technologies, which we regard as particularly relevant to the Thames Valley area are set out below. As highlighted below there are already examples of ITS schemes within the Thames Valley which are at the forefront of implementation of ITS technology.
Real-Time Passenger Information
3.145 The real time passenger information system uses electronic signs located in bus shelters to provide information regarding predicted waiting times for services. There has been a significant increase in recent years in the provision of real time passenger information, with associated improvements in the reliability and quality of bus services. Such systems can also increase the safety and security of public transport through a reduction in passenger waiting time at bus stop. A rising number of UK local authorities are implementing real time passenger information.
3.146 As part of a study in Helsinki (Finland), in 2002, Automated Vehicle Location (AVL) and Computer Assisted Dispatch (CAD) systems were installed on buses. In addition, real-time schedule information was displayed at each public transport stop. This resulted in increased passenger numbers (10-12%); reduced delays at signals (-48%); travel time reductions (-11%) and improvements in on-time arrival (+58%). In terms of customer satisfaction, 83% of the bus passengers noticed the traveller information displays and 78% of the bus passengers regarded the displays as useful. In terms of energy and environment benefit, fuel consumption decreased by 3.6%; and Nitrogen oxides decreased by 4.9%.

THAMES VALLEY MULTI MODAL STUDY Final Report
441 1239 3-26 6352-T.545-pic
3.147 Within the Thames Valley, the Reading bus fleet is being upgraded from an earlier beacon based AVL system to GPS. This is providing comprehensive information to both travellers and operators.
Real-time Traffic Information and Public Transport Information on Internet or Wireless Mobile Communication
3.148 Real-time traffic and public transport information would enable businesses and individual travellers to arrange journey schedules before and whilst travelling. This would be in line with the needs of businesses and individual travellers for journey reliability expressed during construction for this study.
3.149 This information can be received using a number of different media channels such as mobile phone with GSM and SMS and Internet. An example of such a service it that provided by the Highway Agency provide the M25 real traffic information on web, updated every minute. Additional wireless mobile communication and other associated technologies are continually developing, for example GPRS and 3G and these technologies with real time traffic information system would provide reliable traffic and travel information anywhere.
Traffic and Traveller Information using Variable Message Signs
3.150 Variable Message Signs (VMS) have been developed to satisfy a desire for greater flexibility in displaying information. The two most common requirements are for the ability to:
♦ Display a single legend during limited periods of the day;
♦ Select from a “menu” of messages and thereby alter the sign to cater for varying traffic conditions.
3.151 VMSs, for example, can be used as advance direction signs to temporarily divert traffic away from areas of congestion caused by road-works, physical barriers, or seasonal weather hazards. Also, VMS can be used to divert over-height or over-weight vehicles, provide parking advice, inform drivers that the road users are travelling too fast or too close to the vehicle in front, advise of queuing or congestion ahead, or apologise for delays.
3.152 A network of VMS has been installed in Reading to assist in the management of available car park spaces and the surrounding road networks. Currently this is being monitored and operated manually, but automatic management systems are being developed.
Pre Trip Journey Planning
3.153 For journey planning, passengers need information on timetabling, services, fares, interchange details and facilities, how to book and delays and engineering works. Pre-trip Journey Planning is already installed in some local authorities such as Hampshire County Council, Nottinghamshire County Council and the system is developing. Pre Trip Journey Planning may well have real potential in the Thames Valley, if implemented on an area-wide basis.

THAMES VALLEY MULTI MODAL STUDY Final Report
441 1239 3-27 6352-T.545-pic
Priority Lane Enforcement System and CCTV
3.154 Publicity campaigns can highlight the importance of bus lanes in improving the speed and reliability of buses and show the impact of driver compliance with the restrictions. The aim of bus lane enforcement is to improve journey times and reliability, consequently encouraging greater use of buses.
3.155 In recent years, cameras, including CCTV, have been used as a very effective means of detecting speeding or jumping red traffic lights. The same technology can also be applied to priority lane enforcement detecting infringements of the use of the priority lanes.
3.156 The concept of current systems is to detect and record vehicle registration numbers of illegal users of the bus lane using road side and/or in-bus cameras and forward the data to enforcement agencies to continue the prosecution process.
Advanced Fare Payment Systems – Smart Card Technology
3.157 Smart Card is the “touch and go” electronic payment system that offers users an easy and hassle-free way to travel through single and multi modal transport networks. Each Smart Card contains a built-in microchip which stores its owner’s payment information. Users ‘beep’ their Smart Card on a fare processing machine which automatically deducts the correct amount from the card.
3.158 First Group introduced ’FirstCard’ in Bradford in April 2000. The FirstCard is the first smartcard technology of this kind to be used on public transport in the UK. Passengers are now able to charge up their card either at conveniently located machines or on any First bus. Transport for London and London Underground are introducing new ticketing products using Smart Card technology. By 2003, Smart Card will allow travellers to use all services within the Transport for London network.
3.159 The Smart Card embraces the following features:
♦ Fast transactions – applicable in a range of different services including for example public transport, car parks, tunnels or bridge tolling.
♦ High stability – the remote contactless feature allows the Smart Card to operate with more stability.
♦ Flexibility in applications – the Card contains many features which can be used for a range of everyday needs, including transport, security door access, and electronic cash.
♦ Recycle usage – the card is reloadable, so there is no need for disposal, and the material used to fabricate the card is also environmentally friendly.
OVERVIEW: THE SCOPE FOR IMPROVEMENT
3.160 The strategy development process has adopted an incremental approach to testing packages of measures, broadly following the sequence of interventions as discussed in previous sections of this Chapter. Forecasts of travel demand and the impacts on traffic congestion informed this process.

THAMES VALLEY MULTI MODAL STUDY Final Report
441 1239 3-28 6352-T.545-pic
3.161 Table 3.3 illustrates the magnitude of change in car travel and travel conditions at a study-wide level, achievable with various packages of intervention. An incremental approach indicates the cumulative impact of combining different types of intervention. Early tests examined the effects of travel demand management and public transport enhancements independently. However, the two are inextricably linked. The full potential of travel demand initiatives will only be realised if the alternative options are available for when and how people travel (and individual travel plan participants can only have a partial influence on this). Conversely, major investment in public transport will need to be supported by initiatives designed to encourage modal shift, down to the level of individual employers and institutions.
3.162 Our analysis has provided direct quantification of the demand impacts of specific public transport enhancements. It has not however sought to quantify the mode shift impacts associated with travel demand management. For this reason, while overall traffic reduction estimates are fully taken account of, estimates of overall public transport demand and revenue are likely to be conservative.
Table 3.3 – Study area indicators (morning peak hour)
Car trips (‘000)
Hours of delay (‘000)
Vehicle kms (‘000)
Base (2001) 254 33 4615
Reference Case (2016) 312 58 5790
TEST 1: travel demand management and public transport enhancements
284 43 5366
TEST 2: TEST 1 + road user charging (distance based – 2016)
272 37 4689
TEST 3: TEST 2 + motorway widening 274 36 4717
3.163 Some key conclusions for strategy development were drawn from this analysis:
♦ Travel demand management/public transport enhancements alone would bring benefits relative to the reference case, but still represent significant deterioration relative to now (note that impacts associated with land use initiatives are forecast to take effect largely beyond 2016, as discussed later);
♦ The impacts of modal shift are worthwhile, but further intervention is required to bring traffic levels down towards today’s level;
♦ Even with road user charging, traffic levels and performance are similar to today’s (though the effects are variable across the study area: some areas benefit significantly relative to now. This is discussed later);
♦ Even with road user charging, there will be a requirement for further intervention to address specific problems of congestion on the road network;
♦ The scale of change in accessibility and traffic conditions achievable by any one package of intervention means that these packages should not be viewed as choices but all as component parts of a multi-dimensional strategy.
3.164 Overall, in order to provide the accessibility levels necessary to maintain a thriving economy, high quality environment and an inclusive society a transport strategy for

THAMES VALLEY MULTI MODAL STUDY Final Report
441 1239 3-29 6352-T.545-pic
the Thames Valley has, at a minimum, to draw on a combination of travel demand management, public transport enhancements, charging measures and localised highway improvements to make better use of road space and to deal with localised congestion issues.
3.165 The issue is not one of choosing between broad alternative directions for transport policy but more a matter of pursuing a mix of mutually reinforcing interventions that in combination increase the effectiveness of the strategy as a whole, and identifying what level of intervention is necessary, feasible, acceptable and affordable.
3.166 The combined effects of this mix of interventions and, in particular, charging measures, together with the limited impact on congestion of investment in new and widened roads indicates that major road building should not be part of the strategy at least in the short to medium term.
3.167 Of course, alternatives cannot be dismissed in their entirety. Ineffective delivery of the strategy itself, as well as the inevitable uncertainty regarding the scale and distribution of economic growth in the long-term, could improve the case in the longer-term for greater investment in new road capacity. In addition, there is considerable uncertainty as to the extent to which charging measures will be implemented. Charging is of crucial importance and the absence of charging could increase the need for investment in new capacity, including roads.
3.168 The crucial role of charging within the strategy was highlighted in our strategy development work. Table 3.4 sets out a range of broad indicators relating to a strategy with and without road user charging (RUC), and also looking at an ‘alternative’ strategy based upon increasing motorway capacity.
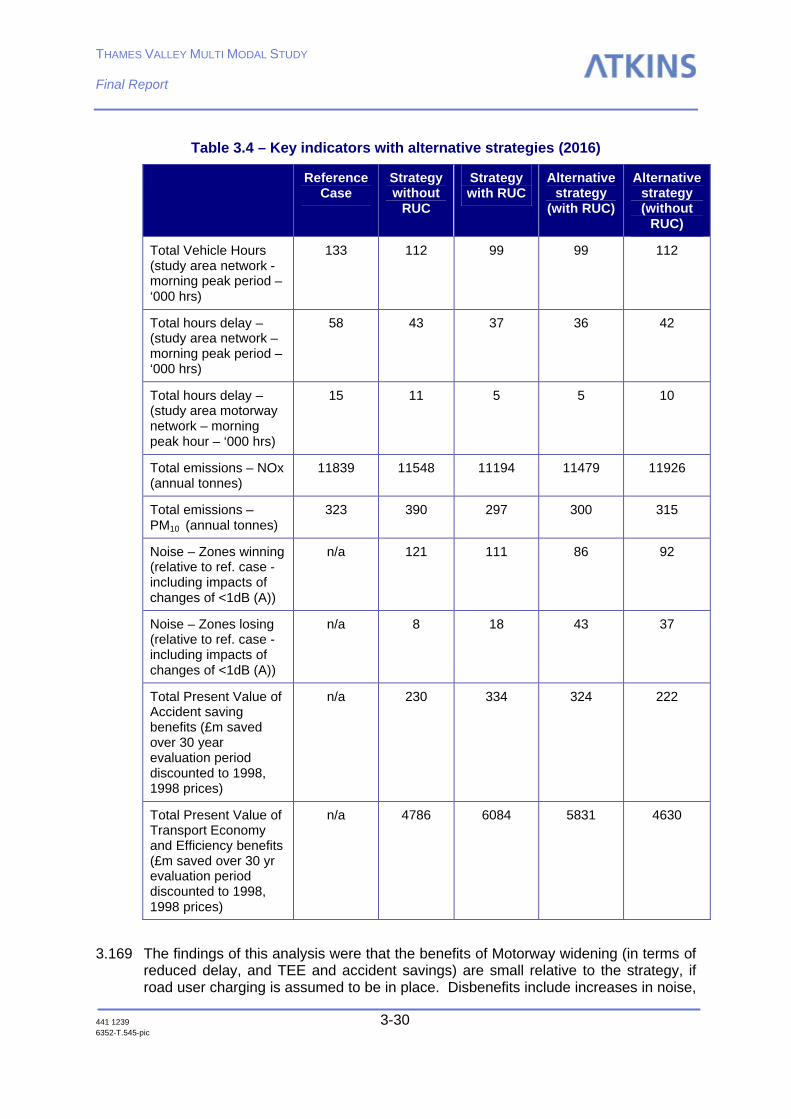
THAMES VALLEY MULTI MODAL STUDY Final Report
441 1239 3-30 6352-T.545-pic
Table 3.4 – Key indicators with alternative strategies (2016)
Reference Case
Strategy without
RUC
Strategy with RUC
Alternative strategy
(with RUC)
Alternative strategy (without
RUC)
Total Vehicle Hours (study area network - morning peak period – ‘000 hrs)
133 112 99 99 112
Total hours delay – (study area network – morning peak period – ‘000 hrs)
58 43 37 36 42
Total hours delay – (study area motorway network – morning peak hour – ‘000 hrs)
15 11 5 5 10
Total emissions – NOx (annual tonnes)
11839 11548 11194 11479 11926
Total emissions – PM10 (annual tonnes)
323 390 297 300 315
Noise – Zones winning (relative to ref. case - including impacts of changes of <1dB (A))
n/a 121 111 86 92
Noise – Zones losing (relative to ref. case - including impacts of changes of <1dB (A))
n/a 8 18 43 37
Total Present Value of Accident saving benefits (£m saved over 30 year evaluation period discounted to 1998, 1998 prices)
n/a 230 334 324 222
Total Present Value of Transport Economy and Efficiency benefits (£m saved over 30 yr evaluation period discounted to 1998, 1998 prices)
n/a 4786 6084 5831 4630
3.169 The findings of this analysis were that the benefits of Motorway widening (in terms of reduced delay, and TEE and accident savings) are small relative to the strategy, if road user charging is assumed to be in place. Disbenefits include increases in noise,

THAMES VALLEY MULTI MODAL STUDY Final Report
441 1239 3-31 6352-T.545-pic
and adverse impacts on air quality. However if compared to the strategy without road user charging, the benefits of widening are more evident (though the negative noise and air quality impact remain).
3.170 This analysis highlights the crucial importance of road user charging to our strategy. However, allowing for the uncertainty associated with the future implementation of RUC, we have followed the approach taken in the ORBIT study, of assessing the justification for widening on the basis of future demand with road user charging in place.
3.171 A number of questions arise from this:
♦ While our work shows little justification for area-wide widening if RUC is in place, are there selective individual sections of the motorway network where traffic volumes may imply consideration of widening? This has been addressed earlier in this Chapter;
♦ What should be the response if a point is reached in the future where road user charging is rejected as an option? This is considered in Chapter 7, in the context of a range of longer terms issues;
♦ In the absence of widening, which other measures could be included in our strategy to ease congestion on the motorway network? This is considered in Chapter 4.
3.172 Through a combination of technical appraisal and consultation with stakeholders, we have further examined the issues and have developed a preferred transport strategy in accordance with these guiding principles. Chapter 4 presents the components of this strategy and Chapter 5 the appraisal, explaining how the strategy contributes to both national and local policy objectives. Chapter 7 addresses longer-term issues and the consideration of alternatives, including the implications of area-wide charging not being implemented, and how this impinges on the justification for investment in new and widened roads.

THAMES VALLEY MULTI MODAL STUDY Final Report
441 1239 4-1 6352-T.545-pic
4. Components of the Strategy
OVERVIEW
4.1 Our proposed strategy comprises a number of strongly inter-related components. Within this chapter we describe these components and the contribution that they make to the overall strategy. Of critical importance is that, while each individual component of the strategy may have worthwhile impacts if introduced in isolation, addressing the major challenges facing the Thames Valley in the future will require the strategy to be implemented as a single integrated package.
4.2 Integrated implementation can not necessarily mean simultaneous implementation. As a result of a number of potential obstacles relating to legislation, funding and technology, some components will be capable of earlier implementation than others. Assumptions relating to the sequencing of strategy components have been guided as much by the practical realities of implementation, as by the ‘need’ for the component, in terms of the size of contribution to the overall strategy objectives. As a result, some of the ‘higher impact’ components are only assumed to be in place at a relatively late stage during the strategy implementation period. Capacity enhancements at Reading station, for instance, are central to the overall strategy. We have assumed an implementation date of 2012 through this reflects the availability of funding, rather than when the enhancement is required.
4.3 In Chapter 3 we set out in detail the over-riding considerations in developing a strategy for the Thames Valley, as follows:
♦ The need to maintain and enhance accessibility, in particular to sustain the Thames Valley economy;
♦ The environmental constraints which apply to the provision of new transport infrastructure;
♦ The risks of accentuating the existing high levels of car dependency for trips through and within the Thames Valley by providing substantial new highway capacity within the study area;
♦ The need to widen choices in terms of when and how people travel, through travel demand initiatives;
♦ The need for a step-change in the level and quality of public transport provision;
♦ The need for shorter term interventions to address existing congestion problems, through better traffic management and information.
4.4 Accordingly, the key inter-related strands of the strategy are:
♦ Modal shift and improved accessibility through improved public transport;
♦ Managing the demand for travel through LTPs, travel plan initiatives, and road user charging;
♦ Improved management of road space through design and information.
4.5 An overview of the strategy is provided in Table 4.1, with the following sections setting out the individual components of the strategy.

THAMES VALLEY MULTI MODAL STUDY Final Report
441 1239 4-2 6352-T.545-pic
Table 4.1 – Strategy components
Strategy element
Schemes/measures Comments
Improved public transport
Designated transport hubs to form a multi-modal integrated ‘hub-and-spoke’ pattern of provision
8 study area hubs identified
Potential strategic ‘Park&Ride’ locations identified
Phased rail enhancements Major impacts critically reliant upon new capacity (Reading station upgrade) and new links (Heathrow – GWML; Heathrow – Staines)
New Inter-urban bus services between hubs
Requires co-ordinated implementation across study area, and priority measures on key corridors of provision.
Parts of network potentially ‘upgradeable’ in longer term (e.g. High Wycombe – Maidenhead, Bracknell – Reading)
Enhanced urban/local services (including mass transit/quality corridors on higher demand corridors in Reading and Blackwater Valley)
Links at local level (‘spokes’) will be critical. Local bus services not defined in detail for this study; to be implemented through LTP process. Sub-regional role of mass transit/quality corridor schemes assessed in this study
Demand responsive transport Flexible public transport provision to meet specific requirements. Not defined in detail; to be implemented through LTP process
Travel Demand Management
Travel plan initiatives Full benefits only achievable with joint implementation with public transport enhancements outlined above.
Applies to schools, hospitals etc, as well as commercial activities
Local Transport Plans Continued role in encouraging modal shift at the local level
Land use planning Shorter term: implementation of good practice.
Longer term: locational decisions to capitalise upon improved public transport accessibility
Road User Charging Critically inter-related with public transport improvements.
Subject to political/technological uncertainty; hence not assumed as ‘core’ strategy element
Management of road space
Traffic flow management through design and technology
Shorter term measures to improve traffic flow and congestion on the road network: subject to detailed localised assessment
Facilities for priority users: public transport, freight, High Occupancy Vehicles
Public transport priority measures required alongside inter-urban bus enhancements.
Efficient use of space may require more than a single permitted priority user
Subject to detailed local appraisal
Localised highway improvements
Measures to ease road congestion, but subject to review of potential strategic and local impacts.
Subject to detailed local appraisal
Freight-specific measures
Modal shift Implementation of initiatives beyond the Thames Valley study area designed to shift freight from road to rail
Management of road-based freight
Measures to mitigate the impacts of freight flows
Measures to manage freight flow
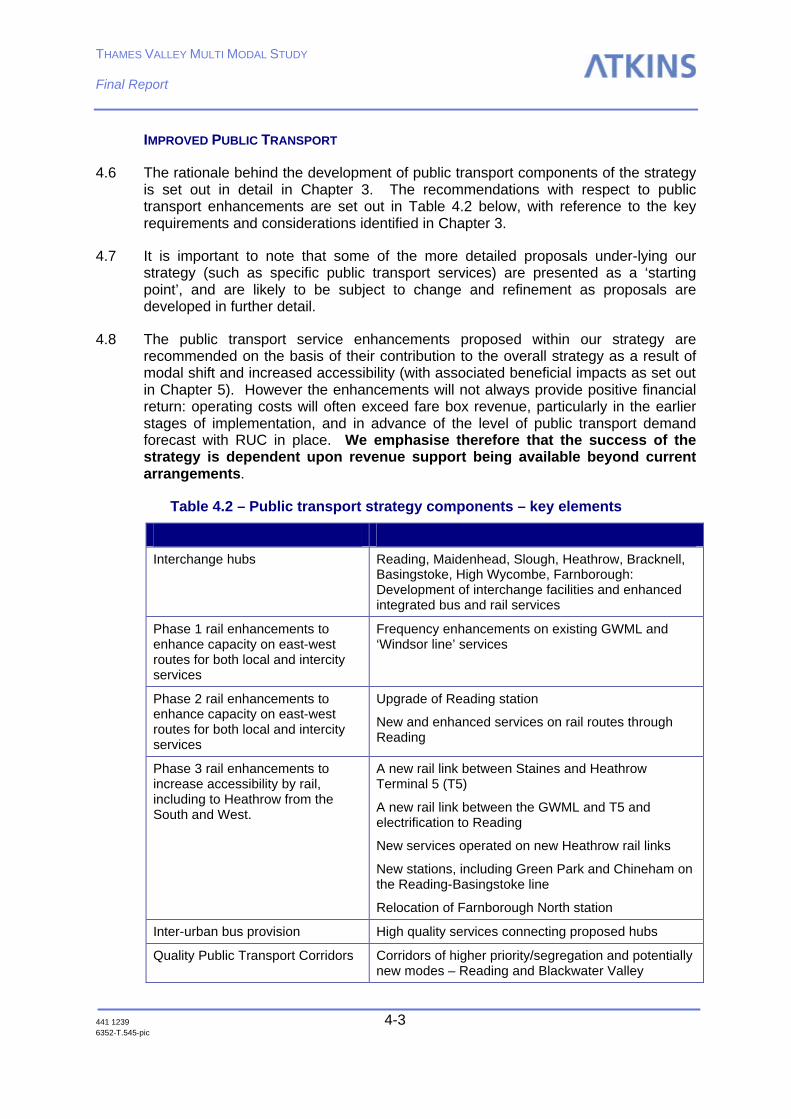
THAMES VALLEY MULTI MODAL STUDY Final Report
441 1239 4-3 6352-T.545-pic
IMPROVED PUBLIC TRANSPORT
4.6 The rationale behind the development of public transport components of the strategy is set out in detail in Chapter 3. The recommendations with respect to public transport enhancements are set out in Table 4.2 below, with reference to the key requirements and considerations identified in Chapter 3.
4.7 It is important to note that some of the more detailed proposals under-lying our strategy (such as specific public transport services) are presented as a ‘starting point’, and are likely to be subject to change and refinement as proposals are developed in further detail.
4.8 The public transport service enhancements proposed within our strategy are recommended on the basis of their contribution to the overall strategy as a result of modal shift and increased accessibility (with associated beneficial impacts as set out in Chapter 5). However the enhancements will not always provide positive financial return: operating costs will often exceed fare box revenue, particularly in the earlier stages of implementation, and in advance of the level of public transport demand forecast with RUC in place. We emphasise therefore that the success of the strategy is dependent upon revenue support being available beyond current arrangements.
Table 4.2 – Public transport strategy components – key elements
Interchange hubs Reading, Maidenhead, Slough, Heathrow, Bracknell, Basingstoke, High Wycombe, Farnborough: Development of interchange facilities and enhanced integrated bus and rail services
Phase 1 rail enhancements to enhance capacity on east-west routes for both local and intercity services
Frequency enhancements on existing GWML and ‘Windsor line’ services
Phase 2 rail enhancements to enhance capacity on east-west routes for both local and intercity services
Upgrade of Reading station
New and enhanced services on rail routes through Reading
Phase 3 rail enhancements to increase accessibility by rail, including to Heathrow from the South and West.
A new rail link between Staines and Heathrow Terminal 5 (T5)
A new rail link between the GWML and T5 and electrification to Reading
New services operated on new Heathrow rail links
New stations, including Green Park and Chineham on the Reading-Basingstoke line
Relocation of Farnborough North station
Inter-urban bus provision High quality services connecting proposed hubs
Quality Public Transport Corridors Corridors of higher priority/segregation and potentially new modes – Reading and Blackwater Valley

THAMES VALLEY MULTI MODAL STUDY Final Report
441 1239 4-4 6352-T.545-pic
4.9 There is a need for a public transport system which is integrated both spatially, at the regional, inter-urban and local levels, and across different modes. The dissipated pattern of demand lends itself best to a ‘hub-and-spoke’ pattern of provision, with demand ‘consolidated’ onto a number of key corridors of prioritised, higher frequency and quality services, rather than dispersed across a wide range of routes where good quality provision would be less viable. This study recommends (with reference to the wider regional proposals set out in the Regional Transport Strategy) the development of public transport hubs at eight locations: Reading, Maidenhead, Slough, Heathrow, Bracknell, Basingstoke, High Wycombe, and Farnborough. A pre-requisite for such a system is reliable, safe and convenient interchange facilities at the ‘hubs’.
4.10 The existing rail network provides an obvious starting point for such a system, with larger study area rail stations forming key components at hubs, and existing rail lines providing inter-urban links between hubs. However the existing rail system is constrained in two ways in terms of its ability, for instance, to replicate current patterns of inter-urban car-based commuting:
♦ Lack of capacity on existing, predominantly east-west, rail services; and
♦ The absence of north/south rail links across the study area.
4.11 The issue of lack of capacity on existing services has led to a number of recommendations for enhanced rail services on existing rail lines. Some of these enhancements are feasible within existing infrastructural constraints. However, the more significant impacts (both for Thames Valley local services, and for inter-city services operating through the study area) can only be achieved with new infrastructure schemes. Of these, the most critical within the Thames Valley study area is the enhancement of capacity at Reading Station.
4.12 Rail is also widely acknowledged through behavioural research as being the preferred alternative of current car users. Opportunities for the provision of new north/south rail links have been reviewed. In most case, the provision for new inter-urban heavy rail lines on new alignments across the Thames Valley is ruled out on the basis that demand levels would not justify the high environmental and financial costs involved. In the east of the study area, however, the study recommends the provision of new rail infrastructure to connect Heathrow to the Southern rail network to the south, and to the Great Western Main Line to the north.
4.13 In parts of the study area, buses will have a critical role to play in providing the inter-urban links not currently feasible by rail. We have therefore recommended new inter-urban bus services linking study area hubs.
4.14 Good quality public transport provision will be required on the ‘spokes’. We have recommended, therefore, for more detailed development at the local level:
♦ Local bus services promoted through the LTP process. These would operate, as currently, within urban areas, and provide inter-urban connections to smaller urban areas, but would be configured to serve hubs and integrate with inter-urban bus and rail services. Flexible (demand responsive) services catered to specific needs will also have an important role to play;
♦ Commuter shuttle services, promoted through travel plan initiatives, between hubs and key employment areas, including out-of-town business parks;
THAMES VALLEY MULTI MODAL STUDY Final Report
441 1239 4-5 6352-T.545-pic
♦ Quality public transport corridors/mass transit schemes (Reading and Blackwater Valley). On selected corridors within the study area, the level of actual or potential public transport demand may warrant public transport provision with higher levels of segregation and higher frequencies than associated with conventional bus services. Schemes are currently being appraised at the more local level within Reading and Blackwater Valley, and have been included within the public transport strategy on the basis of their ability to provide high quality links to the wider inter-urban network.
4.15 Figure 4.1 provides a simplified overview of the main components of the public transport strategy.
4.16 In the following sections we set out each public transport strategy element in turn, describing the specific objectives which the measure is designed to address, and the likely levels of cost and benefits. It is important to emphasise a number of points with respect to the analysis presented at this level:
♦ It has not been possible (or appropriate in the MMS context) to undertake a very detailed assessment of individual components of the strategy, and individual impacts (revenues, patronage, user/non-user benefits) have in some cases been derived from model runs of packages of measures, rather than being assessed individually;
♦ Costs are indicative, for many of the measures we have attempted to derive a cost ‘attributable to the Thames Valley’ from an overall cost associated with services or infrastructure with impacts well beyond our study area;
♦ As stated in Chapter 3, we have not explicitly allowed for modal shift impacts associated with travel demand management. Patronage and revenue for public transport therefore represents a conservative estimate.

THAMES VALLEY MULTI MODAL STUDY Final Report
441 1239 4-6 6352-T.545-pic
Figure 4.1 – Thames Valley Public Transport Strategy
Gr0714
Key
Inter-urban express bus
Inter-urban express bus (upgradeable to LRT)
Reading mass transit
Sub-regional/cross country services
New rail links
New station
Local interchange
Sub-regional Hubs
Regional Hubs
Figure 4.1 Thames Valley Public Transport Strategy
High Wycombe
MarlowHenley
Uxbridge
Beaconsfield
Windsor
Slough
BracknellAscot
Reading
Maidenhead
Basingstoke
Guildford
Heathrow
Sandhurst
GreenPark
Chineham
P&R
P&R
NBDoes not show serviceenhancements on existingrail lines
Farnborough
Staines
WokinghamM4,J11
New Rail Linksto Heathrow

THAMES VALLEY MULTI MODAL STUDY Final Report
441 1239 4-7 6352-T.545-pic
Transport Interchange points
4.17 With the ‘hub and spoke’ pattern of service provision envisaged for the Thames Valley (and for the South-East as a whole in the ORBIT multi-modal study and the Regional Transportation Strategy), the location, scale and quality of interchange becomes an important starting point in developing measures to enhance the transport system. While transportation considerations are paramount (providing facilities where they are most needed) there are also important land use and development implications (discussed later in this report).
4.18 We have identified a ‘hierarchy’ of interchange for the Thames Valley, using the regional context of the Regional Transport Strategy as a point of reference. The hierarchy comprises:
♦ ‘Regional Hubs’ – Regional Transport Strategy hubs – transport interchange and development potential;
♦ ‘Regional Interchange points’ – focus on transport interchange;
♦ ‘Sub-regional hubs’ – transport interchange and development potential;
♦ ‘Sub-regional inter-change points’ – focus on transport interchange;
♦ Local interchange points – generally transport interchange.
Table 4.3 – Thames Valley interchange points
Interchange type Location
Regional hub Reading, Slough, Basingstoke
Regional Interchange Heathrow
Sub-regional hub Bracknell, Maidenhead, Farnborough, High Wycombe
Local interchange Various, including P&R locations (see below)
4.19 Features of each of the identified interchange points are described below.:
♦ Reading (RTS regional hub) – major redevelopment of the station area, with transport implications of a regional significance and beyond. Proposals here are considered in more detail elsewhere in the report;
♦ Heathrow (RTS gateway) can play a role as a key interchange point, in addition to being a major trip attractor. The real potential arises with schemes such as the Staines – Heathrow link, which open up new links to Heathrow from the south, with the potential to integrate with enhanced services between Heathrow and the west (initially bus-based, but replaced by rail in the longer term);
♦ Basingstoke – RTS regional hub, providing opportunities for interchange to areas beyond the Thames Valley.
♦ Slough (RTS Regional hub) presents interchange opportunities for the eastern part of the Thames Valley. These could be integrated into the current ‘Heart of Slough’ initiative (which envisages extended bus priority facilities through the Town Centre), and serve to support the potential function of Slough as a ‘western gateway for Heathrow’;

THAMES VALLEY MULTI MODAL STUDY Final Report
441 1239 4-8 6352-T.545-pic
♦ Bracknell provides another, more central location for potential interchange. A current study is examining options for management of the town centre, and associated improvements to public transport links;
♦ Maidenhead lies potentially at a strategic point of interchange between existing and enhanced east/west links. A current transport study is examining options for management of the town centre, and associated improvements to public transport links;
♦ High Wycombe – creation of new interchange opportunities for areas beyond the Thames Valley to the north;
♦ A number of edge-of-town interchange locations discussed further below in the context of Park and Ride. We envisage current Park & Ride proposals at M4 J11 and M40 Handy Cross as potentially taking on more strategic significance as these locations are developed as interchange points;
♦ Farnborough – opportunities for interchange as discussed below.
4.20 We note that at a number of these locations, transport provision over and above that which has been identified in this study will be required to meet transport needs at the more local level.
Enhanced rail services
4.21 The rail component of our strategy is designed to maximise the role of the rail network within the Thames Valley, alongside other public transport modes, in meeting the objectives set for the area in terms of modal shift and improved accessibility. Our proposals however reflect the realities of current constraints on funding within the industry. This has not discouraged us from considering major new rail-based initiatives, as our work has demonstrated, as highlighted below, that such schemes contribute significantly towards meeting strategy objectives. Rather, we have taken a prudent view of when such schemes could be implemented. The rail enhancements outlined below are based upon a phased implementation taking account of operational, physical and funding constraints.
4.22 In line with the key objective of providing attractive alternatives to the car for the journey to work, we have focussed upon enhancements to rail services during the commuting peak periods. As highlighted in previous sections of the report, the major issue associated with enhanced peak hour services is the presence of a number of constraints on rail network capacity. On the Great Western Main Line only a limited level of enhancement is feasible without infrastructural works on the GWML, of which by far the most significant within the Thames Valley study area is the upgrading of Reading station. We understand that the necessary works are unlikely to be in place until 2012. We have therefore assumed a limited level of service enhancement pre-Reading station upgrade (‘phase 1’), and a more extensive set of enhancements (including the enhancements to longer-distance services recommended by SWARMMS) beyond 2012 (‘phase 2’). Phase 3 comprises a set of further infrastructural measures and service enhancements, some of which could be implemented concurrently with phase 2.
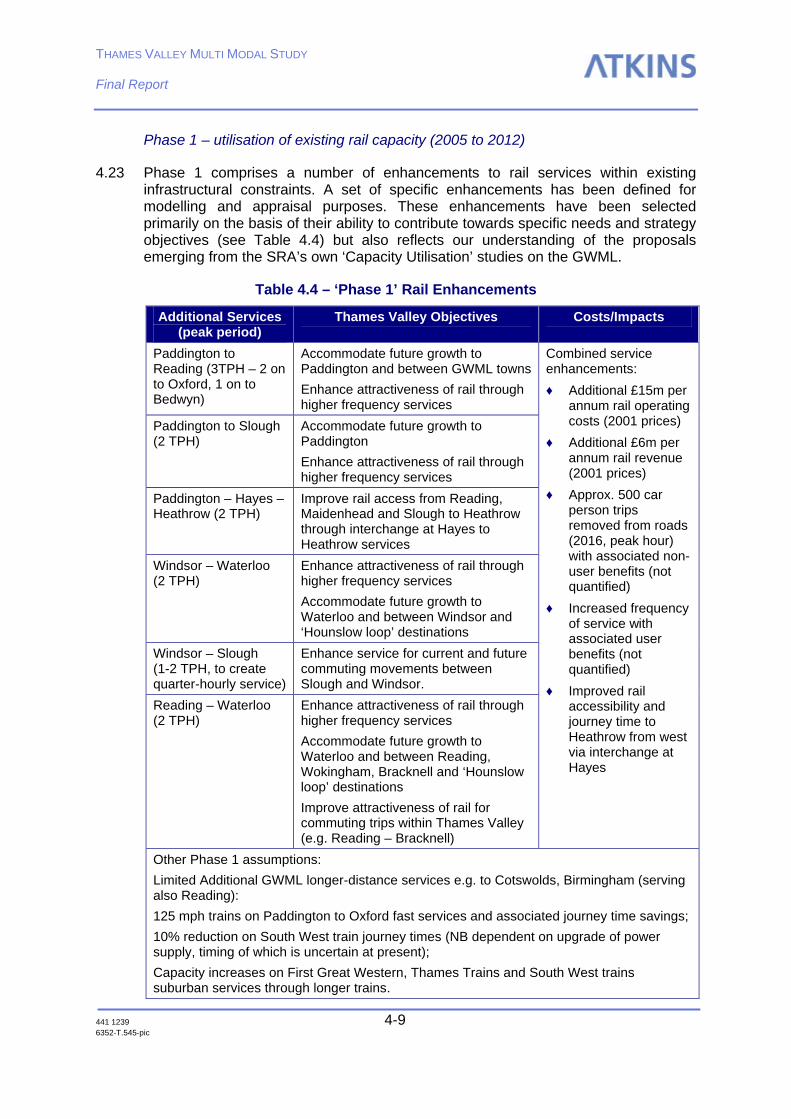
THAMES VALLEY MULTI MODAL STUDY Final Report
441 1239 4-9 6352-T.545-pic
Phase 1 – utilisation of existing rail capacity (2005 to 2012)
4.23 Phase 1 comprises a number of enhancements to rail services within existing infrastructural constraints. A set of specific enhancements has been defined for modelling and appraisal purposes. These enhancements have been selected primarily on the basis of their ability to contribute towards specific needs and strategy objectives (see Table 4.4) but also reflects our understanding of the proposals emerging from the SRA’s own ‘Capacity Utilisation’ studies on the GWML.
Table 4.4 – ‘Phase 1’ Rail Enhancements
Additional Services (peak period)
Thames Valley Objectives Costs/Impacts
Paddington to Reading (3TPH – 2 on to Oxford, 1 on to Bedwyn)
Accommodate future growth to Paddington and between GWML towns
Enhance attractiveness of rail through higher frequency services
Paddington to Slough (2 TPH)
Accommodate future growth to Paddington
Enhance attractiveness of rail through higher frequency services
Paddington – Hayes – Heathrow (2 TPH)
Improve rail access from Reading, Maidenhead and Slough to Heathrow through interchange at Hayes to Heathrow services
Windsor – Waterloo (2 TPH)
Enhance attractiveness of rail through higher frequency services
Accommodate future growth to Waterloo and between Windsor and ‘Hounslow loop’ destinations
Windsor – Slough (1-2 TPH, to create quarter-hourly service)
Enhance service for current and future commuting movements between Slough and Windsor.
Reading – Waterloo (2 TPH)
Enhance attractiveness of rail through higher frequency services
Accommodate future growth to Waterloo and between Reading, Wokingham, Bracknell and ‘Hounslow loop’ destinations
Improve attractiveness of rail for commuting trips within Thames Valley (e.g. Reading – Bracknell)
Combined service enhancements:
♦ Additional £15m per annum rail operating costs (2001 prices)
♦ Additional £6m per annum rail revenue (2001 prices)
♦ Approx. 500 car person trips removed from roads (2016, peak hour) with associated non-user benefits (not quantified)
♦ Increased frequency of service with associated user benefits (not quantified)
♦ Improved rail accessibility and journey time to Heathrow from west via interchange at Hayes
Other Phase 1 assumptions:
Limited Additional GWML longer-distance services e.g. to Cotswolds, Birmingham (serving also Reading):
125 mph trains on Paddington to Oxford fast services and associated journey time savings;
10% reduction on South West train journey times (NB dependent on upgrade of power supply, timing of which is uncertain at present);
Capacity increases on First Great Western, Thames Trains and South West trains suburban services through longer trains.

THAMES VALLEY MULTI MODAL STUDY Final Report
441 1239 4-10 6352-T.545-pic
4.24 Service enhancements on the study area rail network are currently the subject of negotiation as part of the on-going re-franchising process with study area train operating companies for services on South West Trains (SWT) and on the GWML (First Great Western and Thames Trains). The negotiations are confidential, so it has not been possible for this study to review the compatibility of emerging proposals with the Thames Valley strategy. It should also be noted that changes are likely to arise as a result of ongoing capacity utilisation studies being carried out by the SRA in association with Railtrack. It is noted however that:
♦ For phase 1 we have assumed for modelling purposes a set of enhancements which contribute to specific objectives; in practice, there are numerous variations on local service enhancements which could ‘deliver’ similar benefits. On this basis the emergence of alternative proposals from the re-franchising process is not necessarily incompatible with the current study; it is recommended however that such proposals are reviewed with Thames Valley needs and objectives in mind;
♦ Incompatibility with the current study would arise if proposals arise out of on-going negotiations and studies which would reduce frequencies or worsen journey times from principal stations, e.g. Maidenhead, Slough. Our proposed strategy has been developed on the assumption that such degradation of service quality would not occur.
4.25 The phase 1 enhanced rail services set out above are recommended on the basis that they are shorter-term measures capable of implementation without major investment in infrastructure, and make a worthwhile contribution towards study objectives in terms of modal shift and benefits to public transport users.
Phase 2 – Service enhancements with GWML infrastructure improvements
4.26 Enhancements beyond those set out in phase 1, will require infrastructural measures to increase capacity on the Great Western Main Line.
4.27 Phase 1 enhancements, while worthwhile, only represent a relatively modest element of the potential contribution of rail towards strategy objectives. For rail to realise its full potential, both to serve the Thames Valley area, and longer-distance movements through the Thames Valley (which contribute towards a reduction in road-based movements through the area), major infrastructural schemes to increase capacity are essential. Table 4.5 sets out phase 2 service enhancements, highlighting the contribution that these make to the Thames Valley strategy.
4.28 The major capacity bottleneck on the rail system within the study area is Reading station, and none of the phase 2 service enhancements are feasible without redevelopment of the station to provide additional capacity. Reading station upgrade is therefore central to the strategy for the Thames Valley, as well as playing a critical role in the development of the regional and national rail network. It is recommended that the redevelopment of Reading station is reviewed for earliest possible inclusion in the SRA’s Strategic Plan. We have assumed implementation by 2012. Delays beyond this date would undermine the potential contribution of rail to encouraging modal shift both within and through the study area, particularly in the context of a possible road user charging strategy to be implemented around 2012.

THAMES VALLEY MULTI MODAL STUDY Final Report
441 1239 4-11 6352-T.545-pic
Table 4.5 - ‘Phase 2’ rail enhancements
Schemes/Additional Services (peak period)
Thames Valley Objectives Costs/Impacts
Upgrade of Reading station (2012)
Enhanced Inter-city services as recommended in SWARMMS:
Paddington – Cardiff (2TPH), Bristol (2TPH), Penzance (0.5 TPH), Plymouth (0.5 TPH), Great Malvern (0.5 TPH), Stratford –Upon-Avon (0.5 TPH)
Improved service frequency at Reading, reduction in over-crowding, and accommodation of future growth.
Traffic relief on trunk routes through Thames Valley as a result of shift of longer-distance movements from road to rail in response to improved service frequency.
Guildford – Reading – Basingstoke (2 TPH)
Create new cross-Reading rail-based travel opportunities
Provide rail-based alternative from across Thames Valley for trips to Green Park
♦ Capital costs: Reading station up-grade £150m is total cost for railway infrastructural works only (not the full station upgrade)
♦ Additional £42m per annum operating costs (Thames Valley costs only)
♦ Additional £9.5m per annum rail revenue (2001 prices) – £16.5m p.a. with RUC
♦ Approx. 600 car person trips removed from roads (2016, peak hour) with associated non-user benefits of £15m per annum
♦ Increased frequency with associated user benefits of £18m per annum
4.29 While Reading station up-grade allows for the combined service enhancements of phase 1 and phase 2, there remains considerable uncertainty over the ability of other elements of the GWML to accommodate enhancements in both phases. This study is being undertaken against a background of considerable uncertainty on possible future service patterns because of the continuing work with respect to the allocation of limited capacity on the GWML arising from the (potentially competing) requirements of SWARMMS (and the subsequent GWML economic study), the SRA’s own route capacity utilisation work, and the possible requirements of Crossrail.
4.30 Because of these uncertainties, it has been difficult for this study to establish the compatibility between our proposed service enhancements, and those arising from SWARMMS and other initiatives. Our service enhancements are proposed on the assumption that they do not compromise aspirations for longer-distance service enhancements as set out in SWARMMS and can be accommodated alongside them.
4.31 However, in the absence of additional capacity on the approaches to Paddington (in the form of six-tracking to the east of the Airport Junction) some compromise may be required. In general terms, line capacity is maximised where all trains using a given section of line are all running at the same speed and operating to identical station stopping patterns. On four-track sections such as the GWML, this implies running all FGW services on the fast lines, and any residual Thames fast services being upgraded to 125 mph operation. Currently, a number of Thames services use the fast lines for part or all of the journey between Reading and Paddington, and transfer of these services to the relief lines would adversely affect capacity on those lines.

THAMES VALLEY MULTI MODAL STUDY Final Report
441 1239 4-12 6352-T.545-pic
Clearly, the CUS will seek to make best utilisation of capacity on these lines which may imply either speeding up some existing stopping services, slowing down some existing fast or semi-fast services on the relief lines, or some combination of these.
4.32 We understand that phase 1 and 2 enhancements will require additional platform capacity at Paddington. While this is beyond our study area, it is clearly a major determinant of service patterns within it, and we would therefore recommend that further work is undertaken to consider capacity issues at Paddington in the light of the outcome of the capacity utilisation studies on the GWML, and the requirements and priorities emerging from this study and from SWARMMS.
Phase 3 – New rail infrastructure (beyond 2012)
4.33 Our recommendations for the third phase of the Thames Valley rail strategy are based upon the longer-term creation of a wide range of new and enhanced rail-based travel opportunities (either direct or with interchange) to, from and within the Thames Valley by providing new rail links and stations, as follows:
♦ A new link from Heathrow airport, via a new Terminal 5 station, to the existing Railtrack network to the south-west of Heathrow, at Staines (This is essentially an infrastructural scheme which has formed the basis for the well-established ‘Airtrack’ concept, promoted in the past by a combination of BAA, British Airways, local authorities and Railtrack);
♦ A new link from Heathrow airport to the Great Western Mainline in the vicinity of Iver;
♦ Relocation of Farnborough North station to a point where the North Downs Line and the SW Main Line intersect.
4.34 We have also considered the role of the proposed Crossrail scheme as part of phase 3. The Crossrail scheme is currently being promoted by SRA and TfL, and consultation has recently been undertaken on a cross-London system with an extension in the west along the GWML to Reading. The final recommendations of this study are not yet available. This study supports the concept of new rail links from the GWML towns within the Thames Valley to Central London and beyond, but is concerned that the implementation of Crossrail should represent a net increase in the level of rail provision within the Thames Valley. We understand that capacity constraints on the approaches to Paddington could result in Crossrail services partially replacing, rather than being additional to, GWML local services, potentially representing an overall diminution in service level from Reading, Maidenhead and Slough to Central London, especially if Crossrail is promoted as an urban Metro (as currently favoured by TfL) with all-stations services replacing existing semi-fast trains.
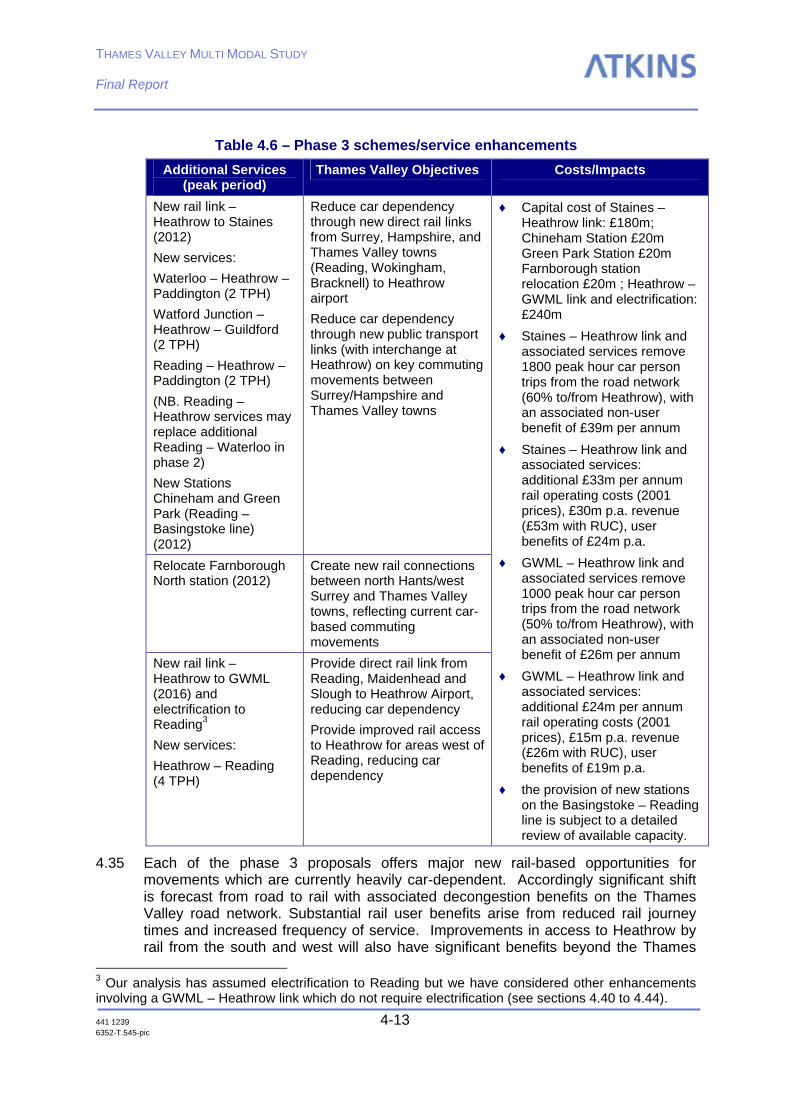
THAMES VALLEY MULTI MODAL STUDY Final Report
441 1239 4-13 6352-T.545-pic
Table 4.6 – Phase 3 schemes/service enhancements
Additional Services (peak period)
Thames Valley Objectives Costs/Impacts
New rail link – Heathrow to Staines (2012)
New services:
Waterloo – Heathrow – Paddington (2 TPH)
Watford Junction – Heathrow – Guildford (2 TPH)
Reading – Heathrow – Paddington (2 TPH)
(NB. Reading – Heathrow services may replace additional Reading – Waterloo in phase 2)
New Stations Chineham and Green Park (Reading – Basingstoke line) (2012)
Reduce car dependency through new direct rail links from Surrey, Hampshire, and Thames Valley towns (Reading, Wokingham, Bracknell) to Heathrow airport
Reduce car dependency through new public transport links (with interchange at Heathrow) on key commuting movements between Surrey/Hampshire and Thames Valley towns
Relocate Farnborough North station (2012)
Create new rail connections between north Hants/west Surrey and Thames Valley towns, reflecting current car-based commuting movements
New rail link – Heathrow to GWML (2016) and electrification to Reading3
New services:
Heathrow – Reading (4 TPH)
Provide direct rail link from Reading, Maidenhead and Slough to Heathrow Airport, reducing car dependency
Provide improved rail access to Heathrow for areas west of Reading, reducing car dependency
♦ Capital cost of Staines – Heathrow link: £180m; Chineham Station £20m Green Park Station £20m Farnborough station relocation £20m ; Heathrow – GWML link and electrification: £240m
♦ Staines – Heathrow link and associated services remove 1800 peak hour car person trips from the road network (60% to/from Heathrow), with an associated non-user benefit of £39m per annum
♦ Staines – Heathrow link and associated services: additional £33m per annum rail operating costs (2001 prices), £30m p.a. revenue (£53m with RUC), user benefits of £24m p.a.
♦ GWML – Heathrow link and associated services remove 1000 peak hour car person trips from the road network (50% to/from Heathrow), with an associated non-user benefit of £26m per annum
♦ GWML – Heathrow link and associated services: additional £24m per annum rail operating costs (2001 prices), £15m p.a. revenue (£26m with RUC), user benefits of £19m p.a.
♦ the provision of new stations on the Basingstoke – Reading line is subject to a detailed review of available capacity.
4.35 Each of the phase 3 proposals offers major new rail-based opportunities for movements which are currently heavily car-dependent. Accordingly significant shift is forecast from road to rail with associated decongestion benefits on the Thames Valley road network. Substantial rail user benefits arise from reduced rail journey times and increased frequency of service. Improvements in access to Heathrow by rail from the south and west will also have significant benefits beyond the Thames
3 Our analysis has assumed electrification to Reading but we have considered other enhancements involving a GWML – Heathrow link which do not require electrification (see sections 4.40 to 4.44).

THAMES VALLEY MULTI MODAL STUDY Final Report
441 1239 4-14 6352-T.545-pic
Valley which it has not been possible to quantify within this study. Full scheme costs have been assumed and, hence, the comparison of costs and benefits set out above, and included within the wider strategy appraisal underplays the full case for these schemes. It is recommended that new rail links to Heathrow from Staines and from the GWML, and the Farnborough station relocation and interchange facilities are reviewed for earliest possible inclusion in SRA’s Strategic Plan. The Staines – Heathrow link project appears in the SRA’s Strategic Plan for the period to 2010 only as a ‘scheme for further development’ but without any funding commitment.
Staines – Heathrow link – further issues
4.36 Our assumptions on the service pattern operating along a new Staines-Heathrow link is based upon the traditional ‘Airtrack’ concept, and is consistent with assumptions adopted in the ORBIT multi-modal study
4.37 The estimated cost of the link includes a new chord at Staines to avoid a reversal of trains from Reading and Guildford in Staines station. A new station could also be built at Staines High Street which, in addition to providing an interchange facility, would better serve Staines town centre.
4.38 The existing Heathrow Express rail route is to be extended to a new station at Terminal 5, and the designs of the new station include passive provision for an extension westwards by provision of an additional platform at T5 station for through services. The cost of extending the tunnels westwards from T5 can be expected to be considerably lower if it can be integrated with the main extension project than if it were to follow as a free-standing project. Given the time required to secure the necessary statutory consents through a Transport and Works Act Order, approval of the Staines-Heathrow link is required in time to allow for design of a westward extension to be integrated into the overall T5 station design.
4.39 The route from the South West Main Line to Heathrow via Virginia Water, Egham and Staines, even with a new spur to avoid reversal at Staines station, is relatively tortuous and consideration might be given in the longer term for construction of a new direct rail route alongside the M25 between Chertsey and the Heathrow area. This would significantly reduce journey times on Airtrack and also avoid creating additional congestion in the Staines station/junction area. This route has not been appraised in detail as part of this study.
GWML – Heathrow link – further issues
4.40 A new link between the GWML and Heathrow from a point in the vicinity of Iver would facilitate improved rail access from the west, currently only achieved by use of the RailAir Link coach service from Reading or via Paddington and Heathrow Express. This would be subject to electrification and the provision of rolling stock which meets the stringent fire safety requirements for operation in the airport tunnels.
4.41 Referred to in previous studies as ‘the Western link’, the scheme has been assessed within this study in terms of the scope to offer a direct service between Thames Valley towns on the GWML to the west of Heathrow and Heathrow itself, based upon the extension of some London-Heathrow services (Heathrow Express) to Reading (although, as highlighted above, significant uncertainties exist – relating to capacity

THAMES VALLEY MULTI MODAL STUDY Final Report
441 1239 4-15 6352-T.545-pic
constraints on the GWML to the east of Airport Junction, and concerns over ‘dilution’ of the HEX brand).
4.42 The emergence of more recent proposals has prompted consideration of the opportunities offered for new services with both Heathrow links (to Staines and GWML) in place. Subject to provision of a suitable link into the airport or by interchange at Staines West or other new station on the surface section of the Staines – Heathrow link, the opportunity would exist to offer through services on a south-east – north-west axis. Such a concept holds particular appeal in the Thames Valley context, as it replicates strong patterns of commuting, which are currently difficult to make by public transport, and are consequently heavily car dependent.
4.43 We understand that proposals are emerging to use a new Staines/Heathrow/GWML link to operate Virgin Cross Country services which currently run via Reading between Brighton, Gatwick Airport, Portsmouth, Guildford in the South and Oxford, Birmingham and areas further north. Such services would provide a direct link between Heathrow and Oxford, Reading, Maidenhead and Slough, but would also provide new direct links between each of these Thames Valley locations and Woking, Guildford, and points further east into Surrey and South-East England (though, of course direct links already exist between Reading and Guildford).
4.44 This would result in a de facto broadening of the role of Cross Country services by linking a number of parts of the South East Region into Heathrow. While costs and impacts have not been quantified within this study, the anticipated impacts of such a service are likely to be highly beneficial in relation to the Thames Valley strategy and it is recommended that the potential for such services are investigated further as part of the further development of proposals for new links to Heathrow.
Farnborough station relocation – further issues
4.45 Proposals for enhancements to public transport in the Blackwater Valley are described later.
4.46 While the Blackwater Valley system with interchange at Farnborough Main is envisaged to perform a function which is predominantly local to the Blackwater Valley towns, or acting as a feeder to sub-regional systems, it is less well placed to improve links between points outside the Blackwater Valley study area. In particular, there is no convenient rail connection between the increasingly important North Downs Line and the SW Main Line, hence journeys such as Woking – Wokingham – Reading, Gatwick/Redhill/Dorking – Basingstoke are impractical by rail, other than by multiple interchanges, circuitous routeings or a somewhat nebulous ‘interchange’ between Farnborough Main and either North Camp or Farnborough North.
4.47 These needs could be at least partially addressed by re-locating the current Farnborough North station at the point where the North Downs Line and the SW Main Line intersect. This is envisaged as a relocation of the North Downs line station with covered, pedestrian links to the station at Farnborough Main. It would perform a more distinctly sub-regional function than the Blackwater Valley rapid transit system. (The two are not mutually exclusive but serve different functions).

THAMES VALLEY MULTI MODAL STUDY Final Report
441 1239 4-16 6352-T.545-pic
Quality Public Transport Corridor/Mass Transit Proposals
Blackwater Valley Public Transport Enhancements
4.48 A recent study has examined the potential for providing better public transport connectivity between the key urban areas in the Blackwater Valley area, recognising the high level of inter-action between them in travel demand terms, and the fragmented nature of the current public transport system. Options considered have included bus-based schemes, and tram/light rail systems, in some cases operating on or replacing heavy rail lines.
4.49 Each of the options considered assumes interchange onto the Blackwater Valley system at the Farnborough Main station on the South West Main Line between Basingstoke and London Waterloo.
4.50 In the wider Thames Valley context, this scheme would play a number of important sub-regional roles in addition to serving the Blackwater Valley. The principal ones are:
♦ Opportunities for trips in the Basingstoke-Waterloo line corridor from both east and west to benefit from improved interchange at Farnborough Main for local trips into the Blackwater Valley towns and as far north as Bracknell;
♦ Improved access for a range of Blackwater Valley towns to Bracknell, with the potential interchange here on to a range of services to other parts of the Thames Valley.
4.51 Our strategy assumes that this would be introduced initially as a bus-based system, with the possibility of upgrade to light rail type technology (either in isolation, or as part of a wider Thames Valley system) at a later stage.
Reading Public Transport Enhancements
4.52 The need for a Reading Mass Transit system has been identified in the Reading Area Transport Study (RATS) and the system is at an early planning stage. This study does not provide a basis for detailed assessment of the proposal, but has identified clear benefits of such a system, both in terms of modal shift from car within the Reading area, and in its ability to link with the proposed enhancements to the inter-urban public transport (particularly potential links from Reading station and town centre to the proposed inter-urban bus network at J11 and in South East Reading).

THAMES VALLEY MULTI MODAL STUDY Final Report
441 1239 4-17 6352-T.545-pic
Table 4.7 – Quality Public Transport Corridors/Mass Transit: Reading and Blackwater Valley
Proposal Thames Valley objective
Blackwater Valley (bus based system)
Improved local links between Blackwater Valley towns and sub-regional public transport system
Modal shift from car for local movements
Reading Improved local links between Reading and sub-regional public transport system
Modal shift from car for local movements
♦ Indicative capital costs: Blackwater Valley: £60m, Reading: £95m
♦ Indicative operating cost: Blackwater Valley £2.5m p.a., Reading: (£7m) p.a.
♦ Removal of 1300 car person trips from the road network (2016, peak hour – only partial representation of local movements)
♦ Non-user benefits estimated at £22.5m p.a., user benefits at £12m p.a. (2016, 2001 prices – partial representation)
4.53 Our analysis suggests that enhanced public transport proposals for the Blackwater Valley and Reading can make an important contribution both in enhancing inter-urban public transport links in the area (directly and through interchange) and in providing integration with more local services. A number of Quality Public Transport lines are included within our recommended strategy although demand data is not available to determine the likely full usage of such proposals. It is recommended that the appropriate local authorities continue to undertake more detailed feasibility studies into the proposed schemes to determine the full financial, commercial and transport case for these schemes, and to identify the most appropriate bus or light rail based technologies. A more detailed assessment could take account of data from this study on opportunities to promote the schemes in a more strategic context.
Light Rail in Thames Valley
4.54 We consider further in Chapter 7 the longer-term scope for light rail in the Thames Valley, including a potential link between High Wycombe and Maidenhead.
Inter-urban Bus Network
4.55 We have proposed a series of inter-urban bus links for movements between study area towns, and between the study area and areas beyond. In doing so, we have concentrated in particular on those movements for which there is significant demand, but which are currently unattractive or unrealistic by public transport. This has sought in particular to provide public transport options for north/south movements which are difficult to make by rail without significant detour and interchange.
4.56 As discussed in the previous chapter, the attributes of service which are required to encourage modal shift from car are speed, reliability and comfort – attributes more closely associated with rail than bus. However demand levels along most Thames
THAMES VALLEY MULTI MODAL STUDY Final Report
441 1239 4-18 6352-T.545-pic
Valley corridors are – at least in the shorter term – insufficient to justify the significant investment required for rail (other than the opportunities associated with Heathrow described above), quite apart from the environmental implications of new north/south transport links (whether road or rail) across the Thames Valley.
4.57 The new bus services identified would require a minimum level of service to meet the objectives set for them:
♦ A frequency associated with a ‘turn-up-and-go’ type provision – ideally at least 4 services per hour during peak times;
♦ Good quality and comfortable vehicles;
♦ State-of-the-art marketing and information provision, and competitive and attractive fares. Services would ideally carry a distinctive branding;
♦ Secure, convenient and safe waiting and interchange facilities;
♦ Priority measures designed to offer journey times and reliability levels which are competitive with car.
4.58 We propose a number of priority routes for such a service (illustrated in Figure 4.1), though we would also expect the provision to be adaptable to complement other parts of the public transport strategy as they evolve (bus-based systems offer particular attractions of flexibility in this respect). The identified routes and services are as follows:
♦ Guildford – Bracknell – Maidenhead – High Wycombe (potentially starting at Bracknell once the Staines-Heathrow rail link is implemented). Potentially extended beyond High Wycombe and Guildford as required (in line with the ORBIT orbital coach network);
♦ Reading – Maidenhead – High Wycombe (potentially substituted longer-term by a Maidenhead – High Wycombe rail link, with interchange to Reading at Maidenhead);
♦ Reading – Maidenhead – Slough – Heathrow (potentially substituted by rail services with the introduction of a Western link from GWML to Heathrow);
♦ Bracknell – Ascot – Slough – Beaconsfield – High Wycombe;
♦ Slough- Uxbridge.
4.59 Key costs and impacts of the proposed inter-urban bus services are given in Table 4.8.

THAMES VALLEY MULTI MODAL STUDY Final Report
441 1239 4-19 6352-T.545-pic
Table 4.8 – Inter-urban bus network provision
Proposal Thames Valley objective Costs/impacts
Enhanced inter-urban bus services (as described above)
Enhanced public transport provision on north/south corridors not served by rail, and with current high car dependence
Enhanced public transport links to Heathrow in advance of longer-term rail-based schemes
Connections between non rail-connected hubs
♦ Capital costs: £50m for interchange
♦ Operating costs: £7.6m p.a. (2006, 2001 prices)
♦ Revenue: £3.6m p.a. (2006, 2001 prices)
♦ Car person trips extracted from road network: approx. 300 in morning peak hour (2006), with associated non-user benefits (not quantified)
♦ User benefits (not quantified) including end-to-end journey time savings: e.g. Reading to Maidenhead – 12%
♦ Requires investment in improved stops, information, priority measures through LTP process
4.60 Table 4.8 indicates that, in the early years at least (prior to the implementation of other elements of the strategy, including, possibly, road user charging) operating costs exceed revenue, and that some form of revenue-support or pump-priming would be required. However, these bus services represent the only viable shorter-term alternative for reducing car-dependency for north-south commuting movements across the study area, and for providing the necessary level of service between the identified Thames Valley hubs. Subject to attainment of the service characteristics set out above, the proposals are forecast to make a worthwhile contribution to modal shift from the road network. It is recommended that further work is progressed on developing these proposed services, with particular regard to identifying the appropriate operational structure, and the development of the improved infrastructure and priority measures on key corridors.
Strategic Park & Ride
4.61 Park & Ride can form an important component of urban transport strategies, and initiatives progressed through the LTP process will play an important role alongside the more strategic measures being considered in this study. For the purposes of this work we have focused on the scope for ‘strategic’ Park & Ride, which we define as a facility for which the public transport ‘leg’ of the journey is longer than from the periphery of a town into the town centre.
4.62 We have identified a number of sites which we believe are worthy of further investigations in this strategic context, though most have already been ‘earmarked’ through the LTP process, to perform a more local role.

THAMES VALLEY MULTI MODAL STUDY Final Report
441 1239 4-20 6352-T.545-pic
4.63 The sites considered are envisaged as being potentially multi-purpose as outlined below. Sites considered, and their potential functions are:
Mereoak (J11 of the M4)
♦ Reading town centre;
♦ Inter-urban express coach network.
Handy Cross (J4 of the M40)
♦ High Wycombe;
♦ Inter-urban express bus network.
Site off the M3 (e.g. Longcross Station)
♦ Heathrow (with the implementation of the Staines – Heathrow link);
4.64 It is important to note that there are likely to be other sites across the Thames Valley area which can perform an effective Park and Ride function. We only identify those which make a specific contribution to the strategy.
Other Elements of the Public Transport Strategy
4.65 We have emphasised in the discussion in Chapter 3 the critical requirement to treat the whole of the public transport network as an integrated system across modes, and extending from local to sub-regional provision.
Local Services
4.66 This study has not looked in detail at local bus services within urban areas. We have no illusions about the difficulties associated with bus provision currently, and we address these difficulties in Chapter 6: Implementation and delivery of the Strategy. However, initiatives through the LTP process and Quality Bus Partnerships (QBPs) to provide greater bus priority and enhanced services will have a key role to play in ‘delivering’ the strategy at the local level.
4.67 It is likely that there will be scope to re-cast some local services to support and complement the wider public transport strategy. More ‘traditional’ tendered services (including those receiving funding through local authorities) will have a role to play, but there is a need to look also at some more innovative types of local service, deliverable through new partnerships and funding sources. Local companies will have a key role to play, with strong synergies with the travel demand management component of the strategy.
Company Shuttle Buses
4.68 Some companies already operate shuttle bus services to and from stations (Vodafone in Newbury, for instance). We see real scope in extending arrangements across business parks (‘bespoke’ services are already operated to Thames Valley Park and Green Park in Reading) and linking to some of the key hubs identified above. The current arrangements at stations, while very worthwhile, may in practice only capture some non-car based demand: extending shuttle services from key
THAMES VALLEY MULTI MODAL STUDY Final Report
441 1239 4-21 6352-T.545-pic
business parks to multi-modal hubs would open up an extensive range of new public transport opportunities.
4.69 There are other forms of demand responsive transport worthy of consideration, designed also to respond to the needs of the travelling public beyond the journey to work. This is discussed below.
Demand Responsive Transport
4.70 The past four to five years have seen the introduction of a number of flexibly routed local bus services available to all persons, as opposed to just the less mobile. Taxi-buses for instance are proposed to supplement the enhanced interurban bus network by providing a service from home to a ‘transport hub’ on the network.
4.71 A number of demand responsive services already operate in the Thames Valley area. It would be advantageous to incorporate these existing services, which are detailed below:
♦ Twyford Link services – covering Twyford, Wargrave, Charvil, Ruscombe and surrounding areas. Passengers can book a seat ahead of their journey;
♦ Hurley Link – a ‘ring and ride’ service featuring a flexible route within the rural area of West Maidenhead, providing a link from Hurley to Maidenhead, Henley and Marlow;
♦ ‘Call a Bus’ – A rural bus service which operates in the rural north east of West Berkshire serving 6 towns at least twice a day on a mainly DRT basis. Additional funding (Rural Bus Challenge) was secured in 2002 to increase the frequency and extend some of the existing routes.
Timetables, Marketing and Publicity
4.72 Improvements can be made to timetables, marketing and publicity in the short term and should be co-ordinated by Local Authorities to ensure that all services are publicised, not just those of the operators who have the resources to publish timetables. In addition to traditional paper timetables the introduction of more innovative means, such as the use of the internet and mobile telephone technology should be considered.
4.73 An objective of the bus and coach strategy is to increase bus use and in particular to enable more inter-urban movements to be made using public transport. With this in mind it is recommended that an Information Strategy be developed which covers the whole of the Thames Valley, to ensure consistency, and make finding travel information simple for passengers wherever they are in the Thames Valley. This should be developed by a working group with representatives from Local Authorities, bus operators and user groups, with information being funded by Local Authorities and bus operators. This is likely to take longer to achieve than if each authority had its own strategy but improvements can be made to the quality of existing information whilst this is being developed.
4.74 Further implementation of real time bus information beyond the current schemes referred to in Chapter 3 is recommended as part of the strategy, particularly as people are being encouraged to interchange between services. This is likely to be a medium to long term scheme due to the cost and the difficulties in getting all

THAMES VALLEY MULTI MODAL STUDY Final Report
441 1239 4-22 6352-T.545-pic
operators involved. Real time information can be best achieved through a QBP to ensure that all operators agree to the introduction of the same on bus systems to ensure compatibility.
4.75 Other ITS technologies, some of which are currently being considered or implemented within the study area are regarded as having particular potential for contributing to the wider Thames Valley public transport strategy, and are worthy of further investigation:
♦ Public Transport information on Internet or wireless mobile communication;
♦ Traffic and Traveller information using Variable Message Signs;
♦ Pre Trip Journey Planning;
♦ Priority Lane Enforcement System and CCTV;
♦ Advanced Fare Payment Systems – Smart Card Technology.
TRAVEL DEMAND MANAGEMENT
4.76 There are a number of elements to our proposals for travel demand management, and these are discussed in turn below:
♦ Influencing travel demand through the LTP process, and through travel plan initiatives;
♦ Land use planning interventions designed to influence the level and pattern of travel demand;
♦ Road user charging.
LTPs
4.77 Our work recognises the continuing importance to the overall strategy of the Local transport Plan process in identifying measures to influence modal shift and travel behaviour at the local level. We support in particular, initiatives through the LTP process to encourage modal shift to walking, cycling and public transport for journeys to work and school, and for other purposes, as these can make an important contribution to congestion relief at the local level.
Travel Plans
4.78 The principles and objectives of travel plans are set out in Chapter 3. We recommend a co-ordinated area-wide approach to travel demand management. As discussed further in chapter 6, the key requirements in this context are:
♦ An appropriate area-wide implementation body and forum; and
♦ Dedicated staff responsible for implementation.
Land Use Interventions
4.79 Both strategic and localised land use policies will be required in various regional, strategic and local planning documents to reinforce linkages between the improved public transport provision associated with the strategy and future distribution of land

THAMES VALLEY MULTI MODAL STUDY Final Report
441 1239 4-23 6352-T.545-pic
use, and discourage development activity that would be contrary to the achievement of a better transport system (public and private) for the Thames Valley as whole.
4.80 We recommend that policies cover the aspects discussed below. These are listed as a generic set, appropriate in the most general sense to all locations in the Thames Valley. In some cases, exceptions are recognised, and particular centres/locations are identified, however, these suggestions are intended to provide an indication of the overall direction and content of policy rather than the provision of a definitive policy for each location within the Thames Valley. These policy statements accord with the current sentiment of planning, as set out in the Land Use policy appraisal in Chapter 5.
Strategic Policy
4.81 Strategic policies will be required to reinforce the land use consequences and opportunities created by the enhanced public transport provision. This could include:
♦ A policy which sets out a hierarchy of hubs and interchanges for the Thames Valley subregion. This should specify what a hub is and how it is distinct from an interchange. It should also state where they are located. An illustration of hubs and interchanges in the Thames Valley is found in Figure 4.1. The critical difference between hubs and interchanges for the purpose of generic land use policy relates to the appropriateness or otherwise of additional development. Hubs are areas which are the focus of development. Interchanges, while they are locations for modal shift, are not appropriate for significant associated development. This distinction accords with policy in the emerging Regional Transport Strategy for the South East.
♦ The recognition that hub locations will be the focus for future concentrations of development activity (whether it be housing and associated infrastructure or employment and associated infrastructure). This will therefore lead to considerable additional pressure for land within and potentially beyond the built up area of the hub, resulting in an increase in the size of the centre over the longer term.
♦ Policies discouraging major development activity in locations other than hub locations. The majority of growth in the Thames Valley up to 2030 should be encouraged to locate in centres containing a hub. The obvious exceptions to this as far as the current public transport strategy is concerned relates to Heathrow, where development activity should not be encouraged, because of the unique airport function.
♦ Generally, policy should discourage development away from the hub centres or those locations readily accessed to them by public transport. Any development in these more remote locations should prove/provide that demand response mechanisms are in place to link the trip generating consequences of any additional development with an enhanced public transport network.
♦ A policy setting out a long term regional/sub-regional commitment to a pattern of development that corresponds with and encourages the development of an effectively functioning transport network in the Thames Valley, focussing on the public transport strategy. This commitment should be articulated via a series of target dates for the achievement of certain developments e.g. phasing of

THAMES VALLEY MULTI MODAL STUDY Final Report
441 1239 4-24 6352-T.545-pic
interchange expansion, associated timing of mixed use developments, allocations in plans and estimates of greenfield land takes etc.
Interchange Hubs
4.82 Interchange hubs are essentially the spaces used for modal shift i.e. bus and rail stations, coach stations, car parks etc.
4.83 We have identified a number of key points of substantially improved public transport service within our strategy. Other than Heathrow these are in town centre locations. The policies below seek to encourage hub development in town centre locations, while resisting their location in out of town locations. Heathrow is an obvious exception to this rule and should be treated differently.
4.84 There are several possible planning policies that could support the development and effective operation of these interchange hubs. Six possible policy types are listed below:
♦ Policies safeguarding land for hubs and public transport arteries, as well as associated development sites. Policies should link the hub location in with the wider sub-region.
♦ Local authorities should be encouraged to develop policies for major transport interchanges as part of wider town centre development and/or regeneration (this is already being undertaken in a number of Thames Valley towns).
♦ Interchange hubs should be presented as part of mixed use development and an opportunity to bring forward brownfield sites.
♦ Interchange hubs should be located in existing town centre locations where there is already an operational interchange i.e. a site with a station, bus station etc. Where major hub expansion is not immediately feasible due to the existing built up area, every effort should be made to intensify and re-develop adjacent town centre sites in the longer term as part of comprehensive development which reinforces existing concentrations of development activity rather than focussing away from those centres. Authorities should be encouraged to use Compulsory Purchase Order Powers to this effect.
♦ Policies should be drafted to resist as far as possible the out of town siting of major hubs and interchanges, subject to exceptional circumstances (which could include the strategic results and recommendations arising from the multi modal process, which could potentially override localised amenity issues).Generally hub location should be determined as a result of a sequential test process, which effectively focuses development as far as is possible in town centres and according with the pre-existing transport infrastructure.
Localised Hub Area
4.85 To maximise the land use and economic benefits of the hub and spoke strategy, land use policy immediately adjacent to and further away from the precise hub location must also complement that strategy. Again, this statement applies to those hubs located in established town centres and Heathrow is an exception to this for the reasons outlined above. This results in the following most obvious possible policy responses:

THAMES VALLEY MULTI MODAL STUDY Final Report
441 1239 4-25 6352-T.545-pic
♦ A policy recognising the hub as a mixed use location, around which both commercial, residential and other associated development is encouraged.
♦ A policy which recognises that being a centre with a hub within it will result in a requirement for an additional (not insignificant) additional allowance of employment and residential land to account for the redistribution of some future growth in those hub locations. These development sites must be readily accessible to the hub and spokes coming from it, and the supply of those sites must be sufficient to meet the demands for additional growth in those centres, while reducing, as far as is possible, inter-centre (i.e. longer distance) commuting.
♦ The planning for land use in the wider hub area (i.e. built up area) should be arranged such that development (whether it be residential and/or commercial or another use) becomes essentially more urban and dense the closer it is located to the hub. Examples of policies include:
♦ Policy focussing high density employment uses within a certain radius of transport nodes. This can include high rise buildings, although a strong design ethos should be maintained. Minimum density standards and a radius from the town centre should be applied. The policy is likely to stipulate that these employment uses should be B1 office uses (i.e. high density uses), and perhaps suitable for major flagship occupiers.
♦ Policy requiring residential development in close proximity to any interchange to be high density, with no or limited car parking allocation, and communal gardens, if any. Minimum density standards and a radius from the town centre should be applied.
♦ Moving outwards, policies for housing, commercial and other uses should be encouraged such that they: − Are subject to less rigorous density requirements; − Comprise mixed use developments; − Link as effectively as possible with the spoke network within the built up area.
(Authorities are obviously encouraged to develop ‘non-strategic’ spokes within the built up area to enable their population to have access to the town centre);
− Allowances for site specific requirements – for example bad neighbour industry (not wanting to be located adjacent to residential development?) and potentially distribution businesses (adjacent to motorways) should be made;
− Policy makers should be conscious however of the possibility of long term development sprawl and the requirement to maintain appropriate densities to permit practicable public transport solutions as far as is possible e.g. higher density clusters of development separated by publicly owned parking and open space.
4.86 The process of concentrating hub development in town centre locations may result in the displacement of other pre-existing uses to different sites. In addition, the principle of concentrating more overall development activity (to accommodate growth over the thirty year period) will provided added pressure for development sites in the hubs. As far as possible, every effort is made to relocate or allocate these uses within the existing built up area on previously developed land (brownfield sites). However, a logical outcome of this concentration policy is a requirement to locate more development on greenfield locations adjacent to the built up areas of the hubs. Greenfield sites in certain areas therefore become justifiable on strategic

THAMES VALLEY MULTI MODAL STUDY Final Report
441 1239 4-26 6352-T.545-pic
transportation and land use strategy grounds. Were this to ever become the case, several criteria need to be satisfied to identify the suitability of certain greenfield sites. These would be likely to include:
♦ Assurance that there is no additional capacity in the hub centre (perhaps proven by an urban capacity study as per current practice).
♦ Identification of appropriate sites by virtue of: − Their location adjacent to spokes linking to the interchange itself. − The environmental designation of the site- i.e. it cannot be nationally
environmentally designated (not a RAMSAR, AONB, National Park, SSSI etc) and preferably not a national greenbelt designation. Greenfield sites which have local ecological designations and local strategic gap and wedge designations or are open greenfield land are the least protected against development in this context.
− Any development is sensitive to the wider local environment, well serviced, and well designed.
Spokes and Other Areas
4.87 The hubs are not the only location of current and future development activity, but, to accord with the current thrust of planning policy, should probably be the main focus. Accordingly, while development should not be prevented definitively from occurring outside the hub centres, it should not be:
♦ At a scale that would unreasonably increase the size of a particular centre. Those centres unconnected to the hub and spoke network should not grow significantly and therefore increase their relative inaccessibility to more people. A policy of maintaining centre size is therefore reasonable.
♦ A large development proposal increasing the overall scale of development for the centre as a whole. These should be resisted generally irrespective of use or purpose (commercial or residential).
♦ Development along spokes (i.e. ribbon development). This should be discouraged and should only occur when: − There are no appropriate sites within the defined town centre; − There are no appropriate sites on the edge of the town centre (greenfield
according to the criteria based policies, see above); − There is a suitable node along the spoke appropriate for development i.e. the
location of a train station, or large scale bus route stop; − There are no national environmental designations or Green Belt designation.
4.88 Only in exceptional circumstances will larger developments be permitted. When this occurs, development proposals should take the transport and accessibility context into account, and, provide resources for additional and appropriate demand response mechanisms, as well as provision for other supporting uses (schools, community centres and so on). An example of an exceptional circumstance is planning for freight activity, often logically appropriate for more out of town locations. In the instance of freight specifically, it is encouraged that land use policy should permit freight on sites with potential current or future public transport ethos underpinning the TVMMS strategy.

THAMES VALLEY MULTI MODAL STUDY Final Report
441 1239 4-27 6352-T.545-pic
4.89 Authorities should identify at what point development pressure is sufficient to warrant consideration for development of a new hub. In the most extreme circumstances, this is the most appropriate way to safeguard the sustainability of spoke and other areas.
ROAD USER CHARGING
4.90 In Chapter 3 we set out a number of alternative approaches to road user charges. We believe that the most appropriate system for the Thames Valley is one capable of implementation across the full study area (and, potentially, beyond) rather than being targeted at specific locations (town centre cordons) or specific users (workplace parking levies). Such schemes would however require intensive use of new technology. Road user changing remains unproven both in terms of technology and public acceptability. Because of uncertainties surrounding how and when the system could be implemented, we have tested the impacts of our strategy both with and without RUC.
4.91 Our strategy analysis is based upon an extension into the Thames Valley of the system envisaged in the ORBIT study. We have not undertaken detailed analysis of the optimum charging level, or differential charges by user, but have looked at the impact of an average charge assumed to be 6.5 p/km. In line with ORBIT, we have assumed that RUC would be operational by 2011.
4.92 Table 4.9 sets out the impacts of road user charging introduced on the basis described above, and illustrates at a strategic level the extent to which road user charging can contribute to managing the overall future growth and impact of road-based travel demand.
Table 4.9 – The effects of Road User Charging
Car trips (‘000) Hours of delay (‘000)
Vehicle kms (‘000)
Base (2001) 254 33 4615
Reference Case (2016) 312 58 5790
Strategy without RUC (2016) 284 43 5366
Strategy with RUC (2016) 272 37 4689
4.93 Our proposed strategy continues to hold even without road user charging. However, we believe that road user charging is the most effective way of ‘locking in’ and capitalising upon the benefits delivered by the wider strategy, and the only means of maintaining road traffic levels and impacts at broadly current day levels. Accordingly, we recommend that work continues as a priority into the technical feasibility of road user charging, in the form envisaged for implementation in the Thames Valley.

THAMES VALLEY MULTI MODAL STUDY Final Report
441 1239 4-28 6352-T.545-pic
THE ROAD NETWORK
4.94 Our strategy for the Thames Valley road network places the emphasis upon better management of existing road space, rather than the provision of significant new highway capacity to accommodate increasing levels of travel demand. In Chapter 3 we set out the reasons why the provision of significant new highway capacity across the Thames Valley (including, for instance, widening of the busiest parts of the study area motorway network) was not pursued in the development of our preferred strategy.
4.95 However, our work has also shown that, even with travel demand management and public transport enhancements in place, the overall magnitude of car-based demand remains higher than now (although not significantly so at 2016 with road user charging in place). While other elements of the strategy may bring about a better balance in demand and supply across the network, congestion will remain and, in some specific areas, may intensify significantly, eroding some of the wider benefits delivered by a wider strategy.
4.96 In this context, we are also acutely aware that in many cases, there is need for action now, and many of the larger impacts considered for inclusion in a strategy will not be felt for some years into the future.
4.97 There have been two dimensions therefore to our considerations of better management of the highway network; measures where the focus is on shorter term relief, and measures with a focus on supporting and complementing wider components within the strategy in the longer term. The key strands of our strategy for the road network are shown in Table 4.10.
Table 4.10 – Components of the road strategy
Measure In advance of wider strategy implementation
Alongside wider strategy implementation
Traffic flow management through design and technology
** **
Facilities for priority users * **
Localised highway improvements
** **
Traffic flow management through design and technology
4.98 This strategy component involves identification, through the LTP process for local roads, and through the HA’s Route Management Strategies for trunk roads, of measures designed to reduce congestion broadly within existing road space, either through changes to the road layout, or through use of technology to better control traffic movements. It is not the role of this study to be prescriptive about the measures required, as these will need to be subject to detailed local design and consideration. However, a number of indicative measures have emerged from our work, in the form of a possible ‘long-list’ for further consideration beyond this study.

THAMES VALLEY MULTI MODAL STUDY Final Report
441 1239 4-29 6352-T.545-pic
Intelligent Transport Systems (ITS)
4.99 Reference is made earlier in this chapter to extension of some of the leading public transport ITS applications which exist currently in the Thames Valley. ITS also has an important role to play in better management of the local road network. We support the initiatives currently being implemented or planned in this respect, such as extension of the GPS AVL tracking network to non-Public Transport Vehicles in Reading, and recognise the important contribution of such measures to the overall strategy.
Integrated Demand Management (IDM) on the trunk road network
4.100 IDM is a term used by the Highways Agency to cover a variety of measures to improve journey time reliability, reduce congestion and possibly marginally increase highway capacity without general widening. These measures might include better incident detection measures, more electronic traffic signs to manage incidents, more CCTV coverage, and variable speed limits.
4.101 This study recognises the need and strongly supports the implementation of such measures in advance of, and alongside, other key elements of the Thames Valley strategy, recognising the continuing need throughout and beyond the strategy implementation period to tackle road-based congestion. We have made an allowance within our strategy costing for the implementation of such measures, both on the local and trunk road networks, and have assumed that they would be implemented over the earlier years of the strategy 30 year timeframe. The impacts in terms of reductions in congestion and other benefits have not been measured explicitly, though are likely to be captured within the quantified impacts of traffic reduction associated with travel demand management initiatives more generally.
Measures for priority users
4.102 The way in which road space is allocated and managed is often subject to opportunities and constraints at a very local level. It is difficult therefore for a strategic study such as this to identify in any detail any specific strategy components and interventions. However, it is appropriate to state general aspirations in terms of allocation of road space to complement wider elements of the strategy.
4.103 We have already highlighted the critical importance of providing priority measures for buses if our proposals for inter-urban service enhancements are to have any impact in terms of modal shift. For most of the network, outside the main urban areas, there will not be the frequency of services (even with the enhancements we propose) to justify capacity re-allocation on economic grounds, or to win acceptability from a sceptical public.
4.104 However, there is a real danger that without priorities, the proposed enhancements could be counter-productive, further adding to perceptions of poor reliability associated with bus, which could have a damaging impact on the potential to up-grade public transport in the longer-term.
4.105 Accordingly, we believe that there is a need for a looser interpretation of priority users which encompasses also those travelling in high occupancy vehicles. HOV

THAMES VALLEY MULTI MODAL STUDY Final Report
441 1239 4-30 6352-T.545-pic
lanes (including buses) have been trialled to date – with some success – on main urban radial routes into City Centres such as Bristol and Leeds. While we recognise that within the Thames Valley there is not the intensity of common origins and destinations usually required for such schemes, we do believe that there are promising synergies with other elements of the strategy, such as travel plans, and ITS (and, potentially RUC).
4.106 This could mean for instance, car sharing clubs at business parks, backed by financial incentives and priority parking, and priority facilities on the wider highway network. Enforcement would be made easier through development of ITS, though we accept that enforcement remains on area of uncertainty, and a potential threat to the deliverability of such measures.
4.107 We have examined the scope for introducing measures designed to ease the flow of traffic generally, and at the same time (in line with the wider aspirations of the strategy – to offer priorities for specific users) HOV, buses and freight. We illustrate here indicative examples at junctions on M4 west of M25. It should be noted that these are indicative and not designed to preclude improvements at other study area Motorway junctions.
Junction 8/9
♦ Consideration of priority access potential in the ramp arrangements. Redesign of eastbound and westbound merges as a ramp-metered facility with a priority facility.
Junction 7
♦ As potential arrangements for Junction 8/9. Priority afforded also to freight vehicles.
Junction 10
♦ Provision of priority lanes on connecting links both from north and south.
Junction 4b
♦ Redesign of the M4 passing through J4b to reduce from D3 to D2 standard. Priority arrangements as outlined above for Junction 10.
4.108 In all of these arrangements, the definition of what constitutes ‘priority traffic’ (in particular, how ‘high occupancy’ is defined) will need to match the capacity provision for the prioritised and non-prioritised flow levels. This will require detailed surveys and a judgement of how the priority share would change as a result of the measures to be introduced.
4.109 Relatively little consideration has been given to enforcement methods at this stage, but the introduction of traffic signals should provide a suitable starting basis for these.
4.110 We recommend that priority measures designed to support the Thames Valley strategy are identified, designed and appraised through the LTP and RMS processes, with reference to the broad corridors highlighted in Figure 4.2.

THAMES VALLEY MULTI MODAL STUDY Final Report
441 1239 4-31 6352-T.545-pic
Figure 4.2 – Priority Corridors for local measures for priority users and to ease congestion
HIGHWYCOMBE
BEACONSFIELD
SLOUGH
MAIDENHEAD
BRACKNELL
STAINES
GUILDFORD
BASINGSTOKE
READING
FARNHAM
CAMBERLEY
Woking
Egham
Windsor
Rickmansworth
Thatcham
Odiham
Fleet
Aldershot
Henley-on ThamesGoring
ChalfontSt Peter
Tadley
Theale
Wokingham
Earley
Yateley
SonningCommon
A322
A339
A33
A287
A331
A31
A404
A40
M3
M25
M3
M25
M4
M25
M40
M40
M4
M4
M4
HEATHROW
Hartley Wintney
Crowthorne
Marlow
Wargrave
Binfield
Twyford
Ascot
Poyle
Better Management Corridors
Priority Improvement Corridors
Hook

THAMES VALLEY MULTI MODAL STUDY Final Report
441 1239 4-32 6352-T.545-pic
Localised highway improvements
4.111 It is not the role of this study to identify and develop specific proposals at the local level or at individual junctions across the study area. Such measures need to be progressed through the LTP or RMS processes on the basis of a much more localised analysis and consultation. However, our work has identified a number of broad corridors which are likely to be ‘at stress’, in future, even with the implementation of other measures in our strategy (see Figure 4.2). From the strategic perspective of this study, we would expect any proposals for improvements to the highway network to look also at provision for other modes, and to be developed at a scale which does not create generated car-based demand or result in the re-routing of traffic from the trunk road network through the Thames Valley onto more local roads.
New Thames Crossing
4.112 One issue which has featured strongly in our consultation process, and indeed in our own analysis, is the degree of congestion and delay at the Thames Crossings at the western end of our study area. Proposals for a new bridge in the Reading area have been the subject of a recent study by TRL, and we have given considerations within this study to the impacts of such a proposal.
4.113 We believe that a new bridge has the potential to deliver benefits which are consistent with the general principles of this study, but recognise the concerns of some that the bridge could result in significantly increased traffic levels on both sides of the river. In line with the principles set out above, we see merit in the proposal provided that it creates new public transport opportunities, and minimises generated demand or strategic re-routing.
4.114 Accordingly, we have recommended that the case for the bridge be considered further, but as part of a package for the Reading urban area which considers also the scope for re-allocation of existing north-south capacity across the river to public transport.
4.115 If new prioritised capacity is to be provided to public transport across the Thames Bridges in the Reading area, there is some logic in this being provided across the existing bridges which carry the bulk of existing (and potential) north/south public transport movements. However, given the potential location of a new bridge providing direct access at its southern side to the Thames Valley business park, and to faster routes (by-passing central Reading) to other employment centres to the south and east of Reading, there may be merit in considering public transport (and potentially) HOV measures on any new bridge being provided at this location.
STRATEGY FOR FREIGHT
4.116 Other elements of the strategy will have indirect or ‘passive’ impacts for freight, and these impacts are highlighted within the strategy appraisal set out in the next chapter. However, our strategy also comprises a number of measures relating specifically to freight movements. These fall into two categories:
♦ Measures designed to facilitate and encourage shift from road to rail; and
♦ Measures designed to manage the flow of road-based freight movements.

THAMES VALLEY MULTI MODAL STUDY Final Report
441 1239 4-33 6352-T.545-pic
Shift from Road to Rail
4.117 We have highlighted in an earlier part of this report that, for a range of reasons relating to the pattern of freight movement, the scope to transfer Thames Valley freight from road to rail is generally limited. However, a distinction needs to be drawn between movements through the area, and those generated within it. Movements through the area have better potential to transfer to rail, with resultant worthwhile impacts within it, but we are less able within the context of this study to examine such measures. Movements to and from the area are very much influenced by the availability or otherwise of suitable freight transhipment facilities. Both types of movement are discussed further below.
4.118 We have considered how known policy options, such as the 10 Year Plan and rail infrastructure improvements, might influence the future volumes of road and freight movement across the area. The purpose of this analysis is less to identify specific freight components of our strategy within the study area, and more a case of highlighting those measures beyond our area which may bring benefits within it. While not an outcome of our strategy, we have chosen not to treat these impacts as a ‘given’ within our Reference Case scenario, as we wish to highlight their impacts, and hence their significance alongside measures which this study is better placed to influence.
4.119 The major SRA Strategic Plan schemes associated with these changes, and relevant either directly or indirectly to the Thames Valley are:
Short to Medium Term Schemes up to 2006
♦ Southampton-West Midlands upgrade.
Longer Term Schemes up to 2010
♦ North East – South West axis;
♦ GWML – gauge clearance to Bristol and Cardiff.
4.120 These schemes are identified in the 2002 Strategic Plan for feasibility work, and for potential delivery in 2005-2010, subject to further value for money analysis.
4.121 The effect of known policy options, such as the 10 Year Plan and rail infrastructure improvements, on the future volumes of road and freight movement across the area has been assessed. Overall tonnes moved is forecast to remain relatively static, with a 4.6% forecast increase in tonnes moved from 2001 to 2016. However, goods are being sourced from further a-field. This means that Tonne-kilometres (the more representative measure of the amount of traffic on the UK transport networks) is forecast to rise faster (by 27%).
4.122 Table 4.11 shows forecast road and rail freight tonnages to and from Berkshire, Buckinghamshire, Oxfordshire, Surrey and Greater London based on two scenarios:
♦ Scenario 1 – Continuation of current trends;
♦ Scenario 2 – Implementation of the 10 year plan, but with no major freight transhipment facility in the Thames Valley.

THAMES VALLEY MULTI MODAL STUDY Final Report
441 1239 4-34 6352-T.545-pic
Table 4.11 – Million Tonnes Lifted (collected and delivered)
Scenario 1 Scenario 2
Wider Area Berks Wider Area Berks
Road 134.0 15.7 124.9 14.5
Rail 10.9 0.9 18.9 2.1
Wider area = counties in and surrounding the Thames Valley area
4.123 Road freight is forecast to decrease across the wider area by 9 m (tonnes lifted), with a decrease in Berkshire of 1.2 m. Rail freight in the wider area is increased by 8 m in Scenario 2 compared to Scenario 1. In Berkshire the equivalent increase is 1.2 m tonnes lifted.
4.124 As well as examining traffic originating or destined for the above counties, flows transiting the Thames Valley were examined. These are shown, for the two scenarios described above, in Table 4.12.
Table 4.12 – Transit Flows via Thames Valley
Road Flows Tonnes Lifted
2016 Scenario 1 2016 Scenario 2
East to West 17,545,494 17,164,563
West to East 15,664,989 15,054,625
North to South 4,664,140 4,397,182
South to North 7,024,681 6,458,038
Total 44,899,304 43,074,408
Rail Flows
2016 Scenario 1 2016 Scenario 2
East to West 1,421,052 Little impact
West to East 2,448,525 Little impact
North to South 1,365,437 Little impact
South to North 1,365,316 Little impact
Total 6,600,330 18,864,565
Source: MDS Transmodal GBFM
4.125 The Thames Valley conveys more freight that is transiting the region than collected or delivered. Therefore it is likely to be measures implemented at a national level (i.e. 10 Year Plan, SRA Freight Strategy) that will have more of an effect on freight than local measures.
4.126 Applying the assumptions of changes in freight cost adapted in the SRA 10-yr plan gives a shift from road to rail through the Thames Valley at 2016, with a reduction in road based freight movements from 45m to 43m tonnes lifted, and an increase in rail freight movements from 7m to 19m tonnes lifted. We support the schemes and

THAMES VALLEY MULTI MODAL STUDY Final Report
441 1239 4-35 6352-T.545-pic
initiatives outlined in the SRA’s Strategic Freight Plan on the basis that the net effect is a reduction in road freight movements through the Thames Valley (relative to the reference case) and an increase in rail freight movements. However, we also note that impacts are modest.
4.127 The scope for transfer to rail for freight to and from the Thames Valley is constrained by the lack of a suitable facility for transfer. Proposals for such a facility in the eastern part of the study area were recently rejected on the basis of, inter alia, environmental impacts and the adverse impact on road traffic flows in the vicinity of the proposed site. We have not identified a suitable alternative site as part of this study. We recommend however that further work is undertaken to establish if alternative proposals for freight transfer facilities can be brought forward (either at this site or others in the Thames Valley) which are capable of better balancing the potential local and national benefits of freight transfer to rail with local adverse impacts.
Measures Designed to Manage Road Freight
4.128 Our strategy seeks to minimise the negative impacts of freight movement while ensuring that the transport system is capable of supporting the efficiency of freight movement required to sustain the local economy.
Freight Quality Partnerships (FQPs)
4.129 Some FQPs already operate in the area, though we recommend that they are developed and enhanced further. Flexibility exists within current FQP arrangements to consider whether FQPs should be localised in nature i.e. specific to one freight attracting area, or if general FQPs for particular areas, e.g. a whole town or all the study area, would be the best way forward. It is not the role of this study to be prescriptive on the nature and location of FQPs, given the area-specific nature of these measures.
4.130 While there is no 'off the shelf' model that can be directly applied to the Thames Valley, FQPs could be organised along the following lines in the Thames Valley.
♦ Industrial Areas FQPs. This could be a partnership between a Local Authority and the occupants of a particular industrial area/estate e.g. Slough Trading Estate and Slough BC;
♦ Retail Area FQPs This could be a partnership between a Local Authority and the occupants of a particular retail area such as a town centre or out of town retail park. This type of FQP was the basis of the FTA 'Delivering the Goods' initiative;
♦ Individual FQPs. Some organisations may be large enough and attract sufficient quantities of goods vehicle traffic for a local authority to engage in an individual partnership with that organisation. In the Thames Valley, such organisation could include Mars UK and Scottish Courage;
4.131 There is a potential synergy between FQPs and 'travel to work' plans as part and their devising and introduction could form part of the above mentioned FQPs. In particular during the initial phase of establishing FQPs, discussion could help identify:
♦ Whether particular locations, such as an industrial estate or large individual employers, have problems associated with travel to work congestion;

THAMES VALLEY MULTI MODAL STUDY Final Report
441 1239 4-36 6352-T.545-pic
♦ If problems do exist, constructive solutions could be worked out and established at a FQP level rather than by individual employer. These could include setting up car sharing schemes or Local Authorities requiring that future Bus Quality Partnerships include services to and from industrial areas, particularly late morning and early evening.
4.132 While many employees in the Thames Valley are probably not large enough to warrant running their own company bus schemes, collectively a whole industrial estate is large enough to provide the critical mass required. Therefore the FQPs suggested above should explore two potential solutions as part of their operation.
♦ Establishing their own bus services to and from the area covered by the FQP. The schemes could be underwritten by the Local Authority concerned and their expertise in contracting out services used to manage any tender negotiations should there be a case for their establishment, but should be self financing in that charges to employees using the service should cover operating costs;
♦ Similarly car sharing schemes could be organised on a FQP basis rather than by individual employer.
Lorry Lanes and Freight Routing
4.133 As discussed earlier in this chapter, one of the potential classes of ‘priority users’ in initiatives designed to re-allocate road space more efficiently, are goods vehicles. However, such facilities are best implemented within Freight Routing schemes. Freight routing generally involves the following:
♦ Selecting the most suitable road to a freight attracting location from a trunk route. Where an appropriate route is not obvious, this can be achieved through survey work and consulting freight operators;
♦ If required, upgrading the chosen route to allow easier passage of goods vehicles. This could include local widening of the road, provision of extra lanes, imposition and policing of parking restrictions (e.g. red routes) and the installation of traffic lights/filter lanes at the entrance to the freight attracting location, and shared bus/HGV lanes;
♦ Erecting suitable freight advisory signs in the standard format i.e. black background, white freight vehicle picture and white writing;
♦ If required, goods vehicles should be forced to use the designated freight routes through the use of weight restrictions on alternative and un-suitable routes, a power granted local authorities under the Road Traffic Regulation Act 1984.
4.134 We have developed for this study an indicative freight routing strategy, designed to mitigate the impacts of freight movements in the Thames Valley. We recommend that this strategy be developed further through consultation between local authorities and freight operators, and (where appropriate) the Highways Agency.
Urban Consolidation Centres
4.135 Urban consolidation centres have been proposed as one solution to urban freight problems. These are large warehouses located on the edge of urban areas close to motorway junctions. Large goods vehicles on retail deliveries (more suited to motorway trunking as opposed to urban deliveries) can unload their goods to the warehouse, where they can be consolidated with other deliveries and loaded onto

THAMES VALLEY MULTI MODAL STUDY Final Report
441 1239 4-37 6352-T.545-pic
smaller vehicles more suited to urban distribution e.g. lorries powered by LPG/CNG for onward delivery to retail units. However there is no 'one size fits all' scheme. BAA already operates a similar centre at Heathrow, but this is subject to specific contractual and commercial arrangements. We believe that there is benefit in urban consolidation centres being considered further through consultation between authorities and operators, with particular regard to how they might be structured/operated at the main urban retail centres in the study area. Possible locations could include:
♦ Reading
♦ Slough
♦ High Wycombe
♦ Bracknell
♦ Basingstoke
4.136 Such centres could be encouraged by allowing environmentally friendly vehicles i.e. LPG/CNG that operate from them to be exempt from any delivery restrictions that may exist.

THAMES VALLEY MULTI MODAL STUDY Final Report
441 1239 5-1 6352-T.545-pic
5. Appraisal of the Strategy 5.1 This chapter details the results of the appraisal of the strategy described in the
previous chapter. The appraisal has been carried out in accordance with GOMMMS, the Guidance on the Methodology for Multi-Modal Studies.
5.2 The recommended strategy has been appraised at two levels:
♦ Against the Government’s over-arching transport objectives; and
♦ Against the study’s local objectives.
5.3 There is a significant overlap between the appraisal of the strategy against the two sets of objectives. This is because, in most cases, the local objectives are interpretations of the national objectives, adapted to reflect specific local concerns and priorities, rather than being distinctly different.
5.4 The strategy has been appraised against the national criteria as set out in GOMMMS. This requires an appraisal under the following five criteria:
♦ To protect and enhance the natural and built environment;
♦ To improve safety for all travellers;
♦ To contribute to an efficient economy;
♦ To promote accessibility to everyday facilities for all, especially those without a car; and
♦ To promote the integration of all forms of transport and land-use planning, leading to a better, more efficient transport system.
5.5 The above criteria are sub-divided into further sub-objectives both at a national level as set-out in GOMMMS and at a local level as set out in Table 5.1.

THAMES VALLEY MULTI MODAL STUDY Final Report
441 1239 5-2 6352-T.545-pic
Table 5.1 – National and Local sub-objectives
Objective National Sub-Objective Local Sub-Objective
ENVIRONMENT Noise Local Air Quality Greenhouse Gases Landscape Townscape Heritage of Historic Resources Biodiversity Water Environment Physical Fitness Journey Ambience
Reduce key pollutants in AQMAs
Reduce the environmental impacts of freight movements
Reduce the environmental impacts of access to Heathrow
Protect rural parts of study area
SAFETY Accidents Security
Reduce risks to pedestrians and cyclists
Improve perceptions of safety and personal security
ECONOMY Economic Efficiency Reliability Wider Impacts
Facilitate sustainable economic development
Reduce adverse impacts of congestion and unreliability on freight
Improve public transport levels of service
Improve access to Heathrow from the study area.
ACCESSIBILITY Option Values Severance Access to the Transport System
Increase choice of travel modes for north/south movements
Increase level of service provided by alternative modes
INTEGRATION Transport Interchange Land-use Policy Other Government Policies
Encourage development in sites with increased public transport accessibility
Encourage consistency in transport policy across administrative boundaries
5.6 In the remainder of this Chapter we present the appraisal findings against each of the higher level national policy objectives, firstly for the national sub-objectives and secondly for the local sub-objectives.
ENVIRONMENTAL
5.7 This section highlights the environmental implications of the strategy. The level of impact in relation to each of the environmental topics assessed is summarised below under headings which relate to the Appraisal Summary Table (AST). A

THAMES VALLEY MULTI MODAL STUDY Final Report
441 1239 5-3 6352-T.545-pic
comprehensive view of the environmental impacts will only be possible once detailed designs of individual elements of the strategy have been completed. This assessment therefore seeks, in line with GOMMMS, only to identify key constraints and evaluate the overall environmental impact of the strategy.
5.8 This assessment has considered the environmental impacts of the strategy by reviewing the impacts of each of the possible elements and, where possible quantifying the overall impacts, such as for noise and air quality. Each of the 10 environmental sub-objectives is considered. The following sections summarise the main issues for each.
5.9 Our assessment has also considered the environmental impacts of a new Thames crossing in Reading. As noted earlier in this report, our findings on this proposal are subject to more detailed assessment in the local context.
National sub-objective: Noise
5.10 Transport is a key source of noise ‘annoyance’, the feeling of displeasure evoked by noise. The GOMMMS approach uses changes in the overall community noise annoyance to evaluate the impact of strategies upon noise; although, because of the complexity of assessing a local environmental impact on a strategic level, there are inevitable uncertainties in the approach.
5.11 For this assessment changes in noise of 1 dB(A) have been employed as a threshold for significant change, the smallest measurable change in noise that has been found to affect the degree of annoyance. For well trafficked roads, flow changes of 20-25% are needed in order to produce noise level changes of 1 dB(A), assuming that the speed and traffic mix remain constant. A 1 dB(A) change in railway noise corresponds to a 20-25% change in the number of noise events. Because of the relatively large changes in the noise source required to produce a discernible difference in noise annoyance, the strategy has very small impacts upon the overall numbers of people annoyed by noise. Table 5.2 presents a summary of this analysis along with an estimate of the impacts of the strategy if changes in noise of any scale (including those less than 1 dB(A)) are assumed to affect the overall number of people annoyed by noise.
Table 5.2 – Impacts of changes in Noise in 2031 relative to 2031 Reference Case
Strategy (with RUC)
Strategy (without RUC)
Number of zones experiencing decrease in population annoyed (based on changes > 1.0 dBA)
29 25
Change in total number of people annoyed (based on changes > 1.0 dBA)
-negl. -negl.
Number of zones experiencing decrease in population annoyed (based on all changes in noise)
111 121
Change in total number of people annoyed (based on all changes in noise)
-550 -550

THAMES VALLEY MULTI MODAL STUDY Final Report
441 1239 5-4 6352-T.545-pic
5.12 On the basis of this zonal analysis it is clear that the Strategy will produce no meaningful noise changes. In spite of significant reductions in road traffic with the strategy (-10% relative to the reference case with road user charging), reductions on individual roads are generally less than the 20-25% required to bring about a significant noise change. Nonetheless, the strategy creates the context within which more local measures (such as freight routing strategies) could be implemented to further reduce traffic in noise sensitive areas.
5.13 The potential direct adverse effects associated with noise emanating from the proposed rail links to Heathrow are likely to be limited to the Staines town centre and a few properties on the western outskirts of West Drayton. The scale of these adverse effects, and hence the need for and practicality of achieving noise mitigation, will need to be assessed by reference to specific proposals.
5.14 The noise effects associated with the introduction of other additions to the public transport network will be highly dependent upon the details of each scheme, viz the routeing, mitigation measures, frequency of service and changes in vehicle flows. The temporal distribution of noise levels adjacent to these transport corridors will also alter due to the replacement of cars with buses or trams. The number and magnitude of “peak” noise level events is likely to increase, with a potentially adverse effect on community noise annoyance. Road user charging is unlikely to have any significant effect upon community noise annoyance.
5.15 The noise effects of the strategy are broadly neutral.
National sub-objective: Local Air Quality
5.16 The Air Quality Strategy for England, Scotland, Wales and Northern Ireland4 sets Government targets for eight pollutants. Transport, especially vehicles, are an important source of several of these pollutants, most notably nitrogen dioxide and PM10 for which objectives are the most challenging to meet. The GOMMMS methodology focuses upon evaluating changes in air pollution for these pollutants and is the basis of the approach adopted in this assessment.
5.17 For each strategy option, the likely impact upon local air quality was assessed qualitatively. In addition, a quantitative assessment was performed of the overall impact of the strategy by calculating the change in transport emissions and the population weighted emissions (used as the air pollution metric by GOMMMS). This overall quantitative assessment has considered differences between the existing case and 2016 with and without the introduction of the strategy options. Changes in emissions (or populated weighted emissions) are a reasonable proxy for changes in air pollution levels for PM10 and nitrogen oxides where transport sources predominate – as is the case adjacent to major roads and within urban areas in large parts of the study area.
5.18 The assessment of individual strategy elements suggests public transport options in heavily congested areas, such as the new rail links to Heathrow, offer the greatest benefits for air quality, because they are most effective in attracting trips from road to
4 DETR, 2000, The Air Quality Strategy for England, Scotland, Wales and Northern Ireland, Stationary Office

THAMES VALLEY MULTI MODAL STUDY Final Report
441 1239 5-5 6352-T.545-pic
rail. The overall assessment is that the strategy will achieve a slight beneficial impact for local air quality overall, although the effects of individual schemes will vary.
5.19 Table 5.3 shows emissions of PM10 and oxides of nitrogen (NOx) in 2016. The change in emissions has been calculated for the 2016 reference case with respect to the existing case in 2001, and for the strategy with and without road user charging in 2016 with respect to the 2016 reference case.
Table 5.3 – Changes in Emissions with the Strategy Options
Pollutant Metric 2001 2016 2016 2016
Existing Reference Strategy without RUC
Strategy with RUC
Emissions (t per annum)
25,268 11,839 11,548 11,194 NOx
% change - -53 % -2 % -5 %
Emissions (t per annum)
813 323 309 297 PM10
% change - -60 % -4 % -8 %
5.20 The table shows a decrease in emissions of NOx and PM10 of 53% and 60% respectively in 2016 compared to 2001 as a result of the increasing use of cleaner vehicles and improved fuels. In comparison the strategy options achieve a further 2 to 5% reduction in nitrogen oxides transport emissions in the study area and 4 to 8% reduction in PM10. The strategy with road user charging has the lowest emissions, in line with the reduction in road traffic caused. The changes in emissions in 2016 with the strategy options compared to the reference case are illustrated in Figure 5.1.
Local sub-objective: Impacts in Air Quality Management Areas (AQMAs)
5.21 A key environmental sub-objective of the strategy is to contribute to improving air quality in areas in which Government objectives are projected to be exceeded, Air Quality Management Areas (AQMAs). All AQMAs within the study area are overwhelming designated as a result of traffic emissions. Table 5.4 lists AQMAs within the study area.
5.22 Between 2001 and 2016 the introduction of increasing numbers of cleaner vehicles as a result of vehicle emission legislation will have a significant effect upon road transport emissions across the UK and Thames Valley area. Between 2001 and 2016 transport emissions are projected to decline by over 50%. This decline is due to the increasing proportions of cleaner vehicles in use and would be expected to achieve current air quality targets long before 2016.
5.23 Table 5.5 shows the impact of the different strategy options upon transport emissions from roads within the existing AQMAs. The percentage change is between the reference case for 2016 and the different strategy options.

THAMES VALLEY MULTI MODAL STUDY Final Report
441 1239 5-6 6352-T.545-pic
Table 5.4 – AQMAs within the Study Area
District Council
Pollutants Location
PM10
NO2
An area extending 55m east and west of the centre line of the M25 between Junctions 11 and 13
Runnymede BC
NO2 An area extending 70m east and west of the centre line of the M25 between Junction 11 and the southern boundary of the borough at New Haw/Byfleet
Rushmoor BC
NO2 A ribbon of land straddling the M3 between junctions 4 and 4a.
NB: Recent information indicates the council intend to undesignate the AQMA
Spelthorne BC
NO2 An area encompassing the whole of the borough including the majority of Staines, Shepperton, Ashford, Sunbury on Thames; extending from west of the M25 in the north west to the River Thames in the south east
Surrey Heath BC
NO2 The strip of land from Frimley Road, Camberley to Ravenswood Roundabout, Camberley adjacent to the M3.
Wokingham DC
NO2 The A329 Berkshire Way, A329(M) and A3290 from the borough boundary with Bracknell Forest BC up to and including the roundabout with the A4 London Road, Earley, extending 10m from the roadside.
The M4 motorway from the borough boundary with Reading BC to the borough boundary with the Royal Borough of Windsor and Maidenhead extending 60m from the roadside.
London Borough of Hillingdon
NO2
PM10
The area defined by the A40 corridor, east to Yeading Brook and along the Chiltern-Marylebone railway line, to the southern borough boundary
London Borough of Hounslow
NO2
PM10
Comprising the electoral wards of Heston West, Heston Central, Hounslow Heath, Cranford and parts of Feltham North and East Bedfont wards lying north of the A315 Staines road.
Comprising the electoral wards of Brentford Clifden, Gunnersbury, Turnham Green, Chiswick Riverside and Chiswick Homefields.
Specific roads in Spring Grove, Hounslow.
Harlington Road West, Feltham.

THAMES VALLEY MULTI MODAL STUDY Final Report
441 1239 5-7 6352-T.545-pic
Figure 5.1 – Change in Emissions (%) in 2016
-9
-8
-7
-6
-5
-4
-3
-2
-1
0NOx PM10 CO2
% c
hang
e
Strategy Strategy & RUC
Table 5.5 – Change in Transport Emissions from Roads within AQMAs for the Strategy Options Compared with the Reference Case in 2016
AQMA Pollutant Strategy without RUC Strategy with RUC
NOX -4% -6% Hillingdon
PM10 -5% -8%
NOX -7% -7% Hounslow
PM10 -10% -11%
NOX -1% -3% Runnymede
PM10 -2% -7%
Spelthorne NOX -3% -4%
Surrey Heath NOX 0% -3%
Wokingham – A329M NOX -4% -5%
Wokingham – M4 NOX -2% -6%
Wycombe NOX -1% -11%
5.24 Table 5.5 shows that the Strategy can be expected to improve air quality within AQMAs by between 2 and 11%. The impact of road user charging is to reduce

THAMES VALLEY MULTI MODAL STUDY Final Report
441 1239 5-8 6352-T.545-pic
transport emissions by an extra 1-2 per cent. The strategy therefore has a slight beneficial impact in AQMAs.
National sub-objective: Greenhouse Gases
5.25 Global warming is a major international environmental issue and transport is an important source of UK greenhouse gas emissions, in particular carbon dioxide. The UK is committed to reducing emissions of a basket of greenhouse gases by 12.5% by 2008 to 2012. Emissions from transport are currently increasing and measures to slow this increase are therefore desirable. The GOMMMS methodology uses the change in emissions of carbon dioxide to assess the impact of schemes upon global warming. An assessment of the effect of the strategy options upon changes in emissions of greenhouse gases has been undertaken by considering the change in transport emissions of carbon dioxide between the base-case (2001) and 2016 with and without the introduction of the strategy options.
5.26 The net change in transport emissions of carbon dioxide within the study area is shown in Table 5.6. The change in emissions has been calculated for the 2016 reference case with respect to the existing case in 2001, and for the strategy options in 2016 compared to the 2016 reference case. Between 2001 and 2016 carbon dioxide emissions from transport in the study area are projected to increase by 22% largely as a consequence of increased traffic. The strategy is projected to achieve reductions of between 4 and 8 per cent in emissions. The strategy with road user charging produces lower emissions. The strategy overall has a slight beneficial impact in terms of greenhouse gas emissions.
Table 5.6 – Changes in Emissions with the Strategy Options
Pollutant 2001 2016
Existing Reference Strategy without RUC
Strategy with RUC
Emissions (t) 3,369,786 4,094,543 3,913,957 3,764,234 CO2
% change - 22 % -4 % -8 %
National sub-objective - Landscape
5.27 The landscape is both the physical and cultural characteristics of the land itself and the way that we perceive those characteristics to combine and contribute to give a ‘sense of place’. The assessment describes, using the GOMMMS approach, the key characteristics of the landscape, why these are important, and how they would be affected by each element of the strategy by considering:
♦ The character of the landscape and the proposal’s impacts on the local distinctive pattern of landscape elements;
♦ How visually intrusive the scheme could be upon the field of view and visual amenity;
♦ The tolerance of the landscape i.e. its ability to accommodate further change.

THAMES VALLEY MULTI MODAL STUDY Final Report
441 1239 5-9 6352-T.545-pic
5.28 The general development pressures owing to the proximity to London, the expansion of urban areas and airport growth have created development that is unrelated to the character of the surrounding area and has significantly contributed to the overall fragmentation of the landscape.
5.29 The proposed new rail links to Heathrow and surrounding urban areas would generally have a negative impact on the character of the landscape, sub-dividing the landscape into smaller parcels and reducing the amount of open space within the urban fringes. Other proposed public transport developments generally have a minimal impact on the landscape, as they follow existing transport corridors or are focussed on urban areas.
5.30 A new Thames Crossing at Reading would occupy a sensitive river floodplain and interrupt the delicate framework of hedges and woodlands and flooded gravel pits east of Reading. The scheme would have a negative effect on a landscape that provides important visual and recreational amenity for the surrounding urban communities.
5.31 Overall, the Strategy would have a slight adverse impact upon the landscape.
National sub-objective: Townscape
5.32 Townscape comprises the physical and social characteristics of the built and un-built urban environment and the way we perceive those characteristics. These elements combine to give a sense of place. The communities within the study area have been assessed using the GOMMMS approach, considering the effects of strategy options upon the distinctive quality and substantial local diversity. Specifically, the scheme appraisals have described:
♦ The characteristic features of the townscape;
♦ The relationship between the townscape and the proposals;
♦ The impact of the proposals on the townscape features.
5.33 The wide clay floodplains of the Thames Valley are dominated by the towns Reading, Bracknell and Slough, together with particular concentrations of development associated with Heathrow Airport and M25. There are very few villages retaining traditional character. The fringe zone of Greater London has seen rapid and often haphazard development which gives the overall impression of a lack of co-ordination between the numerous activities and land uses.
5.34 The proposals to provide new rail links to Heathrow and surrounding urban areas would have varied effects on the townscape, depending on the scale of the works required and the existing condition of the townscape.
5.35 A new rail link to Heathrow from the south would have a significant visual impact upon Staines town centre due to the invasive design of the proposed station and elevated line. The design requires detailed investigation and specific issues need to be addressed in order to ascertain whether the scheme would have a positive or negative effect on the townscape as a whole, and this would depend upon the design and mitigation implemented.

THAMES VALLEY MULTI MODAL STUDY Final Report
441 1239 5-10 6352-T.545-pic
5.36 A new rail link to Heathrow from the north would have a negative impact on the eastern edge of Poyle, although this would be minimised due to its alignment along the route of an existing disused track. The proposed rail line would have a visual impact at the centre of Poyle where it would cross a main road and possibly result in the demolition of some residential properties. It is not possible to state where the effect of this would be positive or negative until a more detailed assessment is carried out.
5.37 Other proposed public transport developments occur in and around the central green heart of the Thames Valley, including the Blackwater Valley Rapid Transit System and a new rail interchange at Farnborough. The introduction of new rapid transit systems have mixed impacts upon townscape. Rapid transit systems tend to have a greater impact on townscape due to the associated infrastructure and road widening. Where road widening accompanies segregated routes, the negative effects are likely to be greater, with the loss of buildings and street trees.
5.38 Where additional bus services are provided, the impact on the townscape would generally be neutral, due to the lack of permanent change. However in localised areas where concentrations of buses stop, the noise and visual intrusion could have a negative impact.
5.39 The new Thames crossing in Reading would improve traffic flow within the area, especially in Sonning. The impact upon townscape cannot be readily assessed but is likely to be broadly neutral, given that no major infrastructure changes would be required in the existing urban area.
5.40 The overall impacts of the strategy upon townscape would be mixed and would depend to a large extent upon detailed scheme design. Through adoption of good practice in the design and use of appropriate mitigation a net neutral or slight beneficial effect is possible.
National sub-objective: Biodiversity
5.41 The potential impacts on biodiversity have been assessed by considering the likely impacts of each of the options upon sites designated for nature conservation. It has been assumed that good practice has been followed in introducing mitigation measures to reduce impact. For some schemes it has not been possible to assess the impacts on locally designated sites such as County Wildlife Sites or Local Nature Reserves. However, even where there are no designations this should not be taken to mean that the area has no biodiversity importance or the scheme no potential impacts. Further detailed surveys of the sites affected by each strategy element would be necessary to robustly define the impacts of the strategy.
5.42 New transport infrastructure, where these pass across previously undeveloped land, could have a significant impact on biodiversity as landtake will lead to the loss and segregation of habitats. Areas supporting rare flora and fauna could potentially be destroyed, and habitats such as ancient woodland, that cannot be wholly recreated, could be lost. The reduced traffic flows arising from the introduction of the proposed strategy should however have a positive benefit by reducing kills of animals such as badgers. Where traffic is projected to increase mitigation measures, such as the

THAMES VALLEY MULTI MODAL STUDY Final Report
441 1239 5-11 6352-T.545-pic
construction of badger proof fencing, could be implemented to further reduce some of these negative impacts.
5.43 Where improvements to public transport make use of existing corridors negative impacts on biodiversity are greatly reduced. However, disturbance of wildlife during construction and operation of new infrastructure may also have a significant impact on biodiversity. This is of particular concern where development is proposed to take place close to sensitive protected sites such as the South West London Waterbodies SPA and Ramsar site, which lie close to the proposed southern rail link to Heathrow. These sites are designated for their European importance for birdlife. The exact impact of the development on birds is difficult to quantify, however there is the potential that it could have a negative impact on bird populations at these sites as a result of increased disturbance and loss of habitat.
5.44 The Heathrow to GWML link is similarly expected to impact upon biodiversity within the Colne Valley Regional Park – although the site is of less importance for biodiversity. The impact on biodiversity of schemes such as the new station in Farnborough will depend on the detailed design, and it is likely to be possible to avoid, or at least minimise, adverse effects at the design stage.
5.45 The net effects of the strategy on biodiversity are slightly adverse, and strongly adverse where the new rail links to Heathrow impact on internationally and nationally designated sites.
National sub-objective: Heritage and Historic Resources
5.46 The man-made historic environment or heritage comprises:
♦ Buildings (individually or in association);
♦ Areas such as parks, gardens, other designated landscapes or public spaces, remnant historic landscapes and archaeological complexes;
♦ Sites, such as ancient monuments, places with historic associations and preserved evidence of human effects upon landscape.
5.47 Heritage also includes the sense of identity and place which the combination of these features provides. In accordance with the GOMMMS approach for assessing heritage impacts at the strategy level, the effects of each option have been considered to determine whether they are:
♦ Positive, contributing to the protection or enhancement of the heritage;
♦ Negative, detrimental to protection of the heritage;
♦ Mixed, where there is a combination of positive and negative impacts but it is not possible to resolve the balance between these;
♦ Indeterminate, where the information available does not enable any secure conclusions to be drawn.
5.48 Appraisal of impacts was undertaken against national and local heritage policy objectives.
5.49 Where developments stay within the existing road and rail route footprints, there is likely to be a slight beneficial effect on the heritage resource with potentially a slight

THAMES VALLEY MULTI MODAL STUDY Final Report
441 1239 5-12 6352-T.545-pic
adverse effect if these schemes involve widening of the routes. Schemes such as enhanced rail services and rapid transit or other public transport schemes that use existing transport corridors will therefore have neutral effects. Significant negative impacts may occur where schemes involve new land-take affecting previously undisturbed ground, such as the proposals for the:
♦ New Thames crossing in Reading;
♦ Southern rail link to Heathrow;
♦ Northern rail link to Heathrow.
5.50 The overall impact of the strategy upon heritage is slightly adverse, but further consideration would need to be given at the detailed design stage to where, and to what extent, historic sites are affected.
National sub-objective: Water Environment
5.51 The assessment of the effects of the strategy upon the water environment has considered the potential impacts of individual strategy elements upon chemical water quality, water resources and floodplain capacity. The assessment was based upon information readily available from the Environment Agency’s web site and did not include any consultation or verification of information. The assessment comprised a combination of route based and strategic level assessment. For relevant options the impacts of modal shift achieved has also been considered. For consistency and to enable the comparison of various options it has been assumed within the assessment that:
♦ Untreated runoff will discharge to surface watercourses and groundwater;
♦ A modal shift from road to public transport will result in reduced pollution of the aquatic environment;
♦ Runoff from rail systems is less than from roads.
5.52 Options which are likely to encourage a modal shift away from the use of roads have the greatest potential to maintain or improve current water quality. Schemes involving the use of existing lines of communication such as links on existing transport routes are likely to have the least impact. Schemes involving new construction along or adjacent to river corridors (for example new rail links to Heathrow) could potentially offer opportunities for the physical enhancement of watercourses, although these schemes may also have adverse implications for flood storage and conveyance. The overall effect of the strategy is likely to be broadly neutral although, if improvements were implemented to river corridors as part of the infrastructure developments, some positive benefits could be achieved.
National sub-objective: Physical Fitness
5.53 A range of health outcomes, such as coronary heart disease benefit from increasing physical activity and the Department of Health recommend people should exercise for 30 minutes or more on most days. This level of activity can easily be built into everyday life through walking and cycling and transport strategies therefore have an important role in promoting these types of physical activity. The GOMMMS approach is to measure changes in walking and cycling arising from the strategy.

THAMES VALLEY MULTI MODAL STUDY Final Report
441 1239 5-13 6352-T.545-pic
5.54 The models developed for this study are not sufficiently detailed to provide quantitative information on changes in walking and cycling. The Physical Fitness criteria has therefore been assessed by qualitatively considering the impact of each proposal on walking and cycling in terms of the likely number of people engaging in, and duration of, these activities.
5.55 Schemes specifically designed to encourage cycling and walking are particularly beneficial for physical fitness and health. The strategy does not include detailed proposals to promote cycling and walking, although the implementation of such measures is encouraged as part of the Local Transport Plan process. However, the introduction of additional public transport infrastructure should tend to increase physical activity by reducing car use.
5.56 By discouraging private vehicle use, road user charging should be beneficial for physical fitness. The overall impact of the strategy is expected to be slightly beneficial for physical fitness.
National sub-objective: Journey Ambience
5.57 Travel usually arises from a requirement or desire to engage in some other activity whether work, leisure or of necessity. The quality of the journey therefore has an impact upon the individual’s quality of life. Journey quality is affected in several ways: ride quality, environmental quality (such as temperature, smoking, lighting, noise and interior décor) and how the person interacts with other travellers (such as loud talking or presence of drunks). The GOMMMS approach assesses journey quality against three criteria:
♦ Travellers care – quality of facilities for public transport users, cyclists and pedestrians; quality of directions and stopping places for car drivers
♦ Travellers views – access to and quality of views to surrounding land/townscape
♦ Travellers stress – frustration, fear of accidents and route uncertainty.
5.58 For this assessment, the effect of each of the strategy elements has been considered against each journey ambience criteria to evaluate whether it is beneficial, neutral or degrades journey ambience. The overall effect of the strategy elements upon journey ambience is then evaluated by considering the combined effect of each element and any secondary effects not addressed by assessing each element separately.
5.59 In general public transport initiatives tend to be favourable for journey ambience where they include development of improved facilities. Favourable schemes for journey ambience include the new rail links to Heathrow, and enhanced rail and bus services. The overall impact of the strategy on journey ambience is moderately beneficial.
Local sub-objective: Reduce Environmental Impacts of Freight Movement
5.60 There are two elements to the strategy for freight: mode shift from road to rail, and reductions in the impact of road freight.

THAMES VALLEY MULTI MODAL STUDY Final Report
441 1239 5-14 6352-T.545-pic
Mode shift
5.61 Our strategy does not include any specific measures to encourage shift of freight from road to rail, but highlights the requirement to identify appropriately sized and located road to rail freight transfer facilities to accommodate the (relatively small) proportion of freight movements to and from the Thames Valley which may be suitable for rail transfer. In the absence of such facilities, the main mode shift impacts will be for through movements, and these are reliant upon initiatives and measures beyond the study area, the impacts of which are discussed in Chapter 4. In both cases the levels of transfer involved are modest, with impacts on the environment likely to be neutral or slightly beneficial.
Road Freight Initiatives
5.62 We have not quantified the impacts of a series of measures designed to reduce the impact of freight movements on the environment, such as FQPs, routing and signing strategies and urban consolidation centres. However, we would expect such measures to have beneficial impact overall.
5.63 Overall the strategy is assessed to have a slight beneficial impact on this sub-objective.
Local sub-objective: Reduce Environmental Impacts of Access to Heathrow
Table 5.7 – Modal Proportions for Access to Heathrow
Reference case (2016)
Strategy without RUC (2016)
Strategy with RUC (2016)
Car (%) 77 60 53
Public Transport (%) 33 40 47
5.64 Table 5.7 demonstrates how the strategy assists in encouraging a mode shift from car to public transport for trips to Heathrow. The strategy with road user charging moves the modal proportions close to the target of 50% of movements by public transport which has been set by BAA. The environmental impacts of movements to Heathrow have not been quantified explicitly; the modal shift shown makes a significant contribution towards the beneficial environmental impacts of the strategy overall. The strategy has been assessed as having a moderate beneficial impact on this sub-objective
Overall Environmental Assessment
5.65 The impacts of the strategy upon the environment are mixed and, in some cases, uncertain in the absence of the more detailed analysis which moves beyond the scope of this study into the detailed design stage.
5.66 The most significant environmental benefits arise from the reductions in traffic volumes made possible through improved public transport and potentially, through road user charging. The strategy makes a major contribution to the shift from road to public transport of trips to Heathrow from the west. This is particularly beneficial for

THAMES VALLEY MULTI MODAL STUDY Final Report
441 1239 5-15 6352-T.545-pic
air quality, greenhouse gas emissions and water but may also have small benefits for biodiversity and townscape. The greatest improvements in environmental quality are achieved if road user charging is included within the strategy.
5.67 The following overall conclusions can be drawn:
♦ Public transport initiatives are predicted to be beneficial for air quality, greenhouse gas emissions, water quality and physical fitness and journey ambience;
♦ Road user charging is beneficial for air quality, noise, greenhouse gas emissions and water quality. There may be small benefits for other environmental sub-objectives;
♦ The proposed southern rail link to Heathrow impacts upon internationally protected ecological sites and may have significant impacts;
♦ The new rail links to Heathrow pass through the Colne Valley Regional Park further fragmenting this area of the greenbelt;
♦ Additional rapid transit and bus services will tend to be favourable or neutral for the environment unless they involve new land-take, in which case the outcomes are more mixed.
5.68 The overall conclusion is that the current strategy has mixed environmental impacts the most significant negative effect of these being potential harm by the southern link to Heathrow to an internationally protected wildlife site. Overall environmental effects would be reduced by:
♦ Maximising the use of existing transport corridors, e.g. bus and mass transit enhancement proposals;
♦ Sympathetic design or environmental improvement schemes to mitigate townscape, water and biodiversity impacts;
♦ Including schemes to promote use of public transport, walking and cycling;
♦ Tunnelling under particularly sensitive sites, although the cost of this is likely to be unpractical.
SAFETY
National sub-objective: Accidents
5.69 The recommended strategy will result in a significant improvement in road safety. Without road user charging, it results in over 5000 casualties being avoided over a 30 year period, including 30 fatalities and about 400 serious casualties. The equivalent figures with road user charging are 8,000 casualties avoided, including 60 fatalities and about 600 serious casualties. This has been assessed as large beneficial.
National sub-objective: Security
5.70 The public transport elements of the strategy would include measures to increase the personal security of travellers as an integral part of the recommendations. This is assessed as moderate beneficial.

THAMES VALLEY MULTI MODAL STUDY Final Report
441 1239 5-16 6352-T.545-pic
5.71 The overall safety implications of the strategy are quantified in the Appraisal Summary Tables. Here we look at two specific safety objectives.
Local sub-objective: Safety for Pedestrians and Cyclists
5.72 As a broad indicator, we have looked at the impact of our strategy on the level of traffic on study area urban roads. Without road user charging traffic on study roads reduces by 7% (4% off-peak) relative to the reference case. The corresponding figures with road user charging are -12% and - 4%. Average speeds are predicted by the model to increase during both time periods. In practice, the traffic reductions would need to be accompanied by traffic management and safety measures to realise the full benefits. The strategy’s overall impact on this sub-objective is potentially slightly beneficial, subject to the implementation of local measures designed to manage traffic speeds with reduced traffic volumes.
Local sub-objective: Security – Perceptions of Safety
5.73 The strategy includes recommendations for upgrading facilities at railway stations and at interchange points and hubs, to bring them to a minimum standard of acceptability for their level of usage. These proposals include measures to improve security and the perception of security through the provision of CCTV monitoring and Help Points. Improved provision for cycle lockers will also add to the overall improved security. The strategy has been assessed to have a slightly beneficial impact on this sub-objective.
ECONOMY
National sub-objective: Economic Efficiency
5.74 The assessment of the economic efficiency of the strategy has been undertaken using TUBA for a 30 year appraisal period between 2005 and 2034. The recommended strategy will result in a significant return on the investment. Without road user charging it provides a Net Present Value (NPV) of £4.8 billion on a Present Value of Cost of £1.6 billion, producing a Benefit to Cost Ratio (BCR) of 4.0. If road user charging is included in the strategy, the NPV increases £6.1 billion and the BCR to 4.8. The strategy has been assessed to have a large beneficial impact on this sub-objective.
5.75 Further details of the economic appraisal are given in the Transport Economic Efficiency tables (Table 5.23 and 5.24) below.
National sub-objective: Reliability
5.76 The assessment of reliability has considered the changes in route stress (congestion) in the 2016 AM peak hour as this identifies the period of greatest congestion. The strategy provides significant improvements to reliability when compared to the reference case, and is judged to have a moderate beneficial impact overall.
5.77 Local businesses place a particular value on the level of reliability in the transport system. Reliability is difficult to quantify directly, but a useful measure is the extent of the highway network below, approaching, at and over capacity. The more of the

THAMES VALLEY MULTI MODAL STUDY Final Report
441 1239 5-17 6352-T.545-pic
network below capacity, the less risk of network instability leading to delay and variable journey times.
5.78 Table 5.8 sets out this analysis across the Thames Valley highway network as a whole.
Table 5.8 – Proportion of Veh kms on Congested Links (2016, morning peak)
Base Ref case Strategy (without RUC)
Strategy (with RUC)
Below capacity (%) 55 36 40 54
Approaching capacity (%) 25 18 20 28
At capacity (%) 10 18 24 7
Over capacity (%) 9 25 15 9
Significantly over capacity (%) 1 3 1 2
5.79 The strategy reduces the extent of the network which is at or over capacity, and would be expected therefore to contribute to improved levels of reliability, particularly if supported by measures designed to improve the flow of traffic through design and ITS. The real impact in terms of improved reliability comes with RUC, with estimates of 18% of the network at or over capacity, compared to 20% in the current situation (2001).
5.80 An alternative analysis of the impact of the strategy (Table 5.9) is to examine the levels of delay by road type. This shows that the strategy brings reductions in delay on all road types relative to the Reference Case. With RUC, reductions in delay are greater with a significant reduction in delay on the Motorway network relative to the current situation (2001). Again, no explicit account has been taken of the effects of design improvements and ITS in this quantification, but these would serve to re-enforce the beneficial impacts. The effect of the strategy on reliability is therefore moderately beneficial.
Table 5.9 – Delay by Study Area Road Type (2016, morning peak, ‘000 hrs)
Base Ref Case Strategy (without RUC)
Strategy (with RUC)
Motorway 8.6 14.7 10.7 5.3
Built up Trunk/A roads 10.1 16.6 12.8 13.1
Non Built up Trunk/A roads 7.9 15.3 11.4 10.4
Other roads 6.1 11.4 8.2 8.1
Total 32.7 58.0 43 37

THAMES VALLEY MULTI MODAL STUDY Final Report
441 1239 5-18 6352-T.545-pic
National sub-objective: Wider Impacts
5.81 The specific aspects of the strategy in terms of supporting sustainable economic growth are presented in the discussion below relating to local sub-objectives. We judge the strategy as having a moderate beneficial impact.
Local sub-objective: Facilitate Sustainable Economic Growth
5.82 The transport system affects economic performance in a variety of ways – influencing, for example, the region’s capacity to attract new investment, the performance and market penetration of established firms and the attraction of tourists. The overall performance of the strategy within the TUBA appraisal will provide a measure of its impacts on the region’s economic performance. However, its effects on a range of aspects of strategic accessibility – and in particular how far it alleviates key constraints – are also important, especially in relation to efforts to attract new investment.
5.83 In overall terms the strategy shows a strong performance on the TUBA analysis with a net present value (NPV) of over £4.8 billion and benefit/cost ratio (BCR) of 4.0 without road user charging and an NPV of £6.1 billion and BCR of 4.8 if charging is included. Much of the benefit will accrue to the residents of the region and businesses located within it. The impact of the strategy on this sub-objective has been assessed as large beneficial.
Local sub-objective: Reducing the Impact of Congestion on Freight and Distribution Movements
5.84 The capacity of the transport system to meet the specific needs of the freight sector is an important aspect of its influence on overall economic performance. Reliability is a crucial factor for road-based freight movements.
5.85 Freight movements will benefit from the same improvements in network performance (reduced delay and improved reliability) available to general road traffic on the strategic road network, and, as highlighted above, significant impacts are forecast with RUC. As shown in the tables, delay, and the numbers of links on the road system as a whole which are at or above capacity is reduced relative to the reference case. Our model gives impacts specific to HGV movements. This shows a broadly similar beneficial impact for freight movements as is apparent for general road traffic.
Table 5.10 – HGV kms on Congested Links (2016, morning peak)
Base Ref case Strategy (without RUC)
Strategy (with RUC)
Below capacity (%) 57 36 39 53
Approaching capacity (%) 27 17 19 31
At capacity (%) 9 19 26 7
Over capacity (%) 7 25 14 8
Significantly over capacity (%) 1 2 1 1

THAMES VALLEY MULTI MODAL STUDY Final Report
441 1239 5-19 6352-T.545-pic
5.86 No explicit account is taken here of the additional effects of a freight routing strategy. While these may be expected to accentuate improvements in reliability for freight movements, it is noted that the impacts of the freight routing strategy are likely to be to lengthen some freight movements, with potential marginal time and costs disadvantages to these movements (though the routes identified – primarily the strategic road network – will be the ones where priority measures are implementable, and which will benefit most from reductions in delay and unreliability). Indeed, improvements in level of service on the strategic road network will, in themselves, be consistent with the basic principles of the routeing strategy.
5.87 It is noted that many freight movements in the Thames Valley occur during off-peak times, specifically to avoid peak period delay and unreliability. In improving peak period conditions, greater flexibility is offered on time of operation (with less of a requirement to ‘avoid the peaks’). However, many movements will continue to occur off-peak and tables 5.11 and 5.12 present impacts on delay and reliability during average off-peak periods.
Table 5.11 – HGV kms on Congested Links (2016, off peak)
Base Ref case Strategy (without RUC)
Below capacity (%) 83 50 56
Approaching capacity (%) 14 29 27
At capacity (%) 1 16 13
Over capacity (%) 2 4 4
Significantly over capacity (%) 0 1 0
Table 5.12 – Delay by Study Area Road Type (2016, off peak, ‘000 hrs)
Base Ref case Strategy (without RUC)
Motorway 1.7 5.4 4.9
Built up Trunk/A roads 3.9 7.3 6.5
Non Built up Trunk/A roads 2.9 5.6 5.0
Other roads 2.2 4.3 3.9
Total 10.7 22.6 20.2
5.88 The improvements in journey times and reliability along the Motorways will be an important aspect of the package from the viewpoint of the freight/distribution sector. These are significant even without road user charging and in the inter peak and overall, the impact of the strategy on this sub-objective has been assessed as moderate beneficial.
Local sub-objective: Improve Public Transport levels of service
5.89 In a similar manner to freight operations, the wider impacts of the strategy (described above) in terms of the efficiency of the operation of the transport system will also

THAMES VALLEY MULTI MODAL STUDY Final Report
441 1239 5-20 6352-T.545-pic
benefit road-based public transport operations. This will be accentuated by measures included within the strategy to prioritise public transport movements in areas of congestion (the impacts of which have not been quantified directly within this study). Important in this context are those measures implemented within urban areas through the LTP process.
5.90 The strategy includes significant public transport investments which will be important in enhancing local, sub-regional and regional links. The impact of the strategy is shown in Table 5.13, which gives change in public transport wait and journey time for movements across and within the study area, and in Figure 5.2 which shows the changes in overall public transport accessibility (measured as a combination of a range of trip attributes – journey time, wait time, interchange and fare) across the study area.
5.91 This shows that the public transport strategy brings benefits in public transport provision across the Thames Valley, but with particular impacts on a north/south axis. This analysis has been undertaken for the peak period, and represents therefore the benefits available to the local economy of increased journey to work accessibility.
5.92 The strategy offers more reliable access to potential job opportunities for non-car owners. (This is an ‘economy’ issue, but also has implications for accessibility, and specifically questions of social inclusion.)
5.93 The changes presented in the table may be explained in terms of faster rail services, increased service frequency, the provision of direct services and the linking together of locations not previously linked (e.g. Bracknell to High Wycombe). It shows quite clearly the improved connectivity to locations such as Bracknell, and much improved linkages between the towns in the study area.
Table 5.13 – Strategy Journey Times Relative to Reference Case for Public Transport (Ref Case Time = 100 in each case), Morning Peak, 2016
Location
Bas
ing
sto
ke
Bra
ckn
ell
Far
nb
oro
ug
h
Gu
ildfo
rd
Hea
thro
w
Hig
h
Wyc
om
be
Mai
den
hea
d
Rea
din
g
Slo
ug
h
Sta
ines
Basingstoke - 87 96 91 80 90 87 96 80 82
Bracknell 85 - 75 88 54 61 73 75 68 78
Farnborough 97 75 - 92 90 97 83 90 84 82
Guildford 93 90 96 - 82 87 88 97 81 72
Heathrow 77 58 93 75 - 93 53 58 67 43
High Wycombe 91 64 95 90 91 - 90 88 92 86
Maidenhead 88 76 88 89 50 91 - 76 76 64
Reading 98 77 94 96 60 80 72 - 66 76
Slough 85 75 86 86 66 85 79 74 - 80
Staines 81 75 81 70 43 80 65 72 82 -

THAMES VALLEY MULTI MODAL STUDY Final Report
441 1239 5-21 6352-T.545-pic
Figure 5.2 – Change in accessibility by Public Transport resulting from the Strategy with RUC in the Morning Peak (2016)
!
!
!
!
!
!
!
!
!
!
!
!
!
!
!
!!
!
!
!
!
!
!
!
ALTON
FLEET
ESHER
SLOUGH
HARROW
WOKING
STAINES
DORKING
ABINGDON
ALDERSHOT
CAMBERLEY
BRACKNELL
FARNBOROUGH LEATHERHEAD
BEACONSFIELD
NEWBURY
FARNHAM
READING
WATFORD
AMERSHAM
GUILDFORD
MAIDENHEAD
BASINGSTOKE
HIGH WYCOMBE-6
-3
-8
-2
-8
-8
-3
-4
-2
-4
-9
-2
-3
-3
-6
-4
-4
-4
-4
-4
-9
-2
-7
-2
-2
-1
-5
-2
-3
-13
-3
-8
-5
-2
-9
-4
-4-4
-10
-5
-8
-5
-2
-7
-6
-9
-3
-6-10
-21 -10
-7
-6
-8
-2
-6
-1
-5
-6
-9
-6-12-12
-9
-7
-2
-6
-15
-9
-1
-5
-6
-10
-10
-6
-3
-8
-10-9
-10
-9
-10
-6
-6
-6
-13
-8
-4
-13-8
-4
-12
-13
-2
-3
-8
-5
-8
-10
-6
-3
-24
-2
-6
-4
-11
-4
-8
-2
-8
-9-13
-2
-13
-12
-6
-15-11
-7
-13
-8
-13
-5-15
-14
-13
-14
-5
-13-5
Date: 14/01/2003 10:06:38 Prepared by: enielsen Mxd file location: C:\TVMMS\GISData\Maps\3f2_Public Transport From Zone.mxd
Thames Valley MMS
Fig. 5.2Change in public transport accessibility with the strategy(2016)
LegendPercentage change in the total cost of travelling by PT from each zone (between the Reference Case and Strategy with RUC scenario in 2016)
-31.2% - -30%
-29.9% - -20%
-19.9% - -10%
-9.9% - -5.1%
-5.0% - -1.1%
-1.0% - 0%
Based on index of multiple deprivation
Most deprived wards

THAMES VALLEY MULTI MODAL STUDY Final Report
441 1239 5-22 6352-T.545-pic
5.94 Figure 5.3 illustrates how this level of service translates in demand terms. Changes in morning peak public transport flows in 2016 (relative to the reference case) are illustrated. The main increases are, as would be expected, consistent with the main corridors of enhanced service provision.
5.95 The economic analysis using the TUBA software gives overall economic impacts for the strategy; in the following sections we present impacts on a more scheme-specific basis.
Table 5.14 – Impacts of Public Transport Interventions
Additional Peak hour demand (2016, no RUC,
relative to reference case) Partial representation of
local demand
Public transport user benefits (discounted £ ‘000, for single year – 2016, 1998 prices)
Phase 1 Rail enhancements and bus service enhancements (including mass transit schemes)
2400 25200
As above, plus
Phase 2 service enhancements
3300 31400
As above, plus Staines – Heathrow link, other ‘sub-regional’ enhancements
5050 39800
As above, plus GWML – Heathrow link
6000 46100
5.96 Table 5.14 shows that there are worthwhile demand and user benefit impacts associated with each of the individual interventions, when considered incrementally. It should be emphasised that this analysis only captures the Thames Valley related benefits of some of the enhancements. Upgrading Reading station will have significant regional benefits which we are not in a position to quantify, and which have therefore not been included. Nonetheless, even those benefits associated with Reading station up-grade which accrue within the Thames Valley area are significant. Overall, the strategy has a large beneficial impact in terms of enhancing levels of service by public transport.

THAMES VALLEY MULTI MODAL STUDY Final Report
441 1239 5-23 6352-T.545-pic
Figure 5.3 – Change in Passenger Flows resulting from the Strategy without RUC in the Morning Peak in 2016
Reading
Slough
Maidenhead
Bracknell
Heathrow
Camberley
High Wycombe

THAMES VALLEY MULTI MODAL STUDY Final Report
441 1239 5-24 6352-T.545-pic
Abstraction from the Highway Network
5.97 Modal shift from car to public transport relates to a range of objectives. In the context of performance of the local economy, it represents a better balance of available supply and demand, and improvements in the performance of the highway network. The TUBA analysis gives a total benefit of £4245 million to residual highway users from traffic reductions, and associated travel time and vehicle operating cost benefits (‘non-user’ benefits) if the strategy is implemented without road user charging. These benefits rise to £5825 million if charging is included in the strategy.
Local sub-objective: Improve Access to Heathrow
5.98 One of the reasons often given for the economic success of the Thames Valley is the level of accessibility available to Heathrow airport. As time passes, this accessibility is diminishing for most, as the road network becomes more congested. Our strategy includes measures designed to provide a ‘step-change’ in the quality of transport links between the Thames Valley and Heathrow. Table 5.13 above and Tables 5.16 and 5.17 below set out explicitly the change in journey times between Thames Valley towns and Heathrow airport. The strategy has a large beneficial impact.
ACCESSIBILITY
National sub-objective: Option Values
5.99 The introduction of the strategy has already been shown, in the local assessment, to improve the overall travel times between key areas within the study area. Relating specific elements of the strategy to population shows that the introduction of public transport schemes has provided additional options to residents living within a 250 metre radius of the key access points and new enhanced public transport services. These additional options and the level of population lying within 250 m of them are identified in Table 5.15 below.
Table 5.15 – Population with Access to New Public Transport Facilities within a 250 m Radius
Scheme Population within 250 m
New Stations 2000
Interchange Hubs 9000
New Public Transport Services 25000
5.100 This table shows that, for the public transport schemes identified above, a total of 36,000 people increase their options for travel.
5.101 Overall it is considered that the preferred package will have a moderate beneficial impact.

THAMES VALLEY MULTI MODAL STUDY Final Report
441 1239 5-25 6352-T.545-pic
National sub-objective: Severance
5.102 Most of the rail proposals involve the re-use or widening of existing transport corridors and as such the impact on severance is likely to be slight. Overall the impact is assessed as neutral.
National sub-objective: Access to Transport
5.103 The strategy provides a substantial improvement in public transport throughout the study area. New rail stations and interchange hubs are included in the strategy that will significantly increase opportunity for people to access the public transport network.
5.104 However as most of the study area population resides in the urban areas, the key impact in this respect will relate to the degree of integration between local and sub-regional services. So, while key elements of our strategy bring very large benefits for those in the vicinity of new stations and hubs, the overall effect, given the distribution of population, will be slightly beneficial.
Local sub-objective: Increase Levels of Service Available by Alternative Modes
5.105 The broad thrust of the package emphasises development of the role of public transport and this is clearly supportive of policies of improving access to employment opportunities from areas of deprivation and overcoming social exclusion more generally – although, of course, other barriers such as skill match may be as, or more, important than transport as constraints on the take-up of jobs. Nevertheless, particular mention can be made of the improved access to central area jobs provided by the public transport investment.
5.106 Many of the transport-related impacts of social exclusion have implications at the most local levels, for instance, in terms of the absence of radial public transport services to encourage maximum accessibility to job opportunities, including those not located within town centres. This issue will need to be addressed at the local level, and we understand that Reading, for instance, is placing particular emphasis on non-radial movements in its transport strategy. In the most deprived areas and amongst the most deprived groups, the cost of public transport is often the crucial issue, and fares policy will be a crucial consideration. We believe that that the revenue generating potential of the strategy as a whole (with road user charging) presents the opportunity to develop a fares policy with specific social objectives in mind.
5.107 Overall the strategy has been assessed as having a moderate beneficial impact on this sub-objective.
Local sub-objective: Increase Choice of Travel for North/South Movements
5.108 This objective relates to improving accessibility overall on a north/south axis, but with particular regard to diversifying the range of options available, i.e. to improve public transport provision. The broad impacts of the strategy on public transport provision (including north/south) have been set out above. Here, we focus on the highway impacts.

THAMES VALLEY MULTI MODAL STUDY Final Report
441 1239 5-26 6352-T.545-pic
5.109 The assessment of highway accessibility across the region has been undertaken between a number of key locations (Tables 5.16 and 5.17). This assessment shows that the introduction of the strategy measures has improved the overall journey times between each location, with the inclusion of charging bringing substantial additional gains on most routes. Overall it is considered that the strategy will have a large beneficial impact on this sub objective.
Table 5.16 – Strategy (without road user charging) Journey Times Relative to Reference Case for Highway (Ref Case Time = 100 in each case), Morning Peak, 2016
Location
Bas
ing
sto
ke
Bra
ckn
ell
Far
nb
oro
ug
h
Gu
ildfo
rd
Hea
thro
w
Hig
h
Wyc
om
be
Mai
den
hea
d
Rea
din
g
Slo
ug
h
Sta
ines
Basingstoke - 87 90 92 83 90 87 93 88 89
Bracknell 96 - 90 92 79 89 90 92 87 89
Farnborough 92 76 - 95 84 85 84 90 80 85
Guildford 90 82 92 - 84 91 89 93 86 87
Heathrow 95 89 92 98 - 94 91 92 89 93
High Wycombe 94 93 93 97 89 - 95 96 95 94
Maidenhead 96 88 90 98 81 95 - 94 93 92
Reading 94 88 90 92 78 88 81 - 83 85
Slough 95 90 88 94 82 92 93 95 - 91
Staines 95 89 93 98 86 92 85 89 86 -
Table 5.17 – Strategy (with road user charging) Journey Times Relative to Reference Case for Highway (Ref Case Time = 100 in each case), Morning Peak, 2016
Location
Bas
ing
sto
ke
Bra
ckn
ell
Far
nb
oro
ug
h
Gu
ildfo
rd
Hea
thro
w
Hig
h
Wyc
om
be
Mai
den
hea
d
Rea
din
g
Slo
ug
h
Sta
ines
Basingstoke - 82 79 81 74 87 81 91 81 80
Bracknell 97 - 82 84 79 86 89 95 92 87
Farnborough 84 70 - 84 70 80 78 87 78 76
Guildford 84 80 93 - 71 79 82 88 75 81
Heathrow 82 87 77 76 - 82 83 84 84 86
High Wycombe 86 93 84 81 79 - 93 100 91 87
Maidenhead 96 84 81 80 71 98 - 99 89 83
Reading 95 85 86 85 70 93 81 - 80 79
Slough 83 94 77 75 76 88 94 95 - 89
Staines 88 90 85 86 80 86 82 86 82 -

THAMES VALLEY MULTI MODAL STUDY Final Report
441 1239 5-27 6352-T.545-pic
INTEGRATION
National sub-objective: Interchange
5.110 Promotion of public transport integration is a key element of the recommended strategy. A number of hub stations are proposed that provide interchange between rail and bus services. The study recommendations for new and improved interchange are thus assessed as slightly beneficial.
National sub-objective: Compatibility with Land Use Policy
5.111 The policy framework guiding the location of development in relation to transport provision continues to develop as the importance of the inter-relationship between the two on sustainable settlement form is increasingly recognised. Key references are planning policy guidance notes (PPGs) although important interpretations and developments of policy are contained within other documents including Government committee reports, strategies & plans, White Papers and ministerial statements.
5.112 Key aspects of the content of some of these documents are highlighted below, to illustrate where the thrust of policy now lies. At the bottom of this section, these key policy tenets are assessed on a general basis, with comments relating to the main themes of the strategy, rather than points of detail.
Current Policy - transport
5.113 PPG1 sets out the basis of the planning system as a means of enabling provision of homes and jobs in a sustainable manner. An important strand is the shaping of new development patterns in a way which minimises the need to travel, reflecting the Government’s commitment to “concentrating development for uses which generate a large number of trips in places well served by public transport, especially town centres.”5
5.114 Local authorities are encouraged to integrate transport and land use such that reliance on the private car is reduced and use of public transport is encouraged. Maximum use should be made of previously developed sites in locations which have access to a range of transport facilities for the provision of housing. Outside urban areas, sites should be well served by public transport. Town centres (city, town and suburban) have an important role to play in sustainable development as they can be a focus for development (retail, employment, services and facilities) which is easily accessible by various modes, especially those other than the car.
5.115 PPG 13 (Transport) is currently the primary policy reference for planning and transport. It recognises that, while we need to be able to access facilities and services, jobs and shops, increasing road traffic is detrimental to the environment, economy and our health. Thus, it aims to integrate planning and transport to promote more sustainable transport choices for people and freight, reduce the need to travel, particularly by car and increase accessibility by public transport, walking and cycling.
5 PPG 1, General Policy & Principles, Feb 1997

THAMES VALLEY MULTI MODAL STUDY Final Report
441 1239 5-28 6352-T.545-pic
5.116 Means of achieving these aims include managing urban growth to make best use of public transport and focusing major generators of travel in city, town and district centres and near to major public transport interchanges. The level of parking provision is noted as a key factor influencing travel choices, and may be more significant than the availability of a public transport service, thus limiting it may help to reduce travel demands.
5.117 Reducing the need to travel can be realised by locating frequently used facilities close to where people live so that they are accessible by walking and cycling. Housing should also be located in the main within existing urban areas, at increased densities in locations which are highly accessible by modes other than the car. Developments for shopping, jobs, leisure and other services also should be accessible by non-car modes.
5.118 In addition to the reduction in traffic levels, improving accessibility by non-car modes has wider benefits in terms of addressing aspects of social exclusion.
5.119 Despite the obvious difficulties in encouraging use of public transport in rural areas, PPG 13 maintains that the same principles should apply to these areas as to urban, in that development should be located in the most accessible locations, generally within existing ‘service centres’.
Strategy Performance
5.120 The Thames Valley multi modal process supports the sentiment in PPG 13 in encouraging interlinkages between planning and transport. This is implicit within the strategy itself, as it has been driven by a set of planning policy influenced forecasting numbers for the Thames Valley over the study period.
5.121 Not surprisingly, the majority of the recommendations arising from the transport strategy accord with PPG 13. The strong public transport emphasis, and its concentration, primarily in existing centres, support the policy shift towards more sustainable transport modes; the lesser reliance on highway based improvements, and provision for interchanges to encourage people to get out of their cars to enter town centres also complement policy objectives. Also the selected development of out of centre interchanges can be justified in policy terms as a method of reducing congestion in town centres.
5.122 In the longer term, land use policy should be used to support the strategy and in so doing further help reduce the need to travel. In this way it will build on the public transport core of the study, by concentrating development in and around town centre hubs, discouraging it outside the built up areas, and encouraging fine grain mixed use and good design in development to allow for more non-motorised and public transport modes within centres; while limiting growth outside them.
5.123 In general terms therefore, the strategy has a large beneficial impact in supporting planning objectives relating to transport.
THAMES VALLEY MULTI MODAL STUDY Final Report
441 1239 5-29 6352-T.545-pic
Current policy - Sustainability
5.124 The policy context for the English Town and Country Planning system is framed in the UK’s sustainability strategy, Achieving a Better Quality of Life. This document defines sustainability as ‘ensuring a better quality of life, now and for generations to come’. More specifically, it lists four main objectives:
(i) Social progress which recognises the needs of everyone; (ii) Effective protection of the environment; (iii) Prudent use of natural resources; (iv) Maintenance of high and stable levels of economic growth and employment.
5.125 What the sustainability principles show is that planning effectively operates as a referee, aiming to strike a balance between different objectives, which at times will conflict. This should be borne in mind when considering planning for the Thames Valley. The production of a transport strategy that is integrated with the planning system is critical if the transport system can be sustainable.
5.126 Sustainability is also one of the three General Principles underpinning the planning system and outlined in national government guidance (PPG 1).
Strategy Performance
5.127 In its purest form, the provision of a transport system- because it uses resources- is unsustainable. However, to meet other sustainability objectives; including social inclusion and economic prosperity it is a necessity.
5.128 The strategy, with its public transport emphasis and travel demand management measures, scores well when set against sustainability objectives. While it is using resources, it tries to limit this use with effective essentially public transport oriented responses. An associated ‘consolidated’ land use strategy will further enhance the sustainability of the strategy, in encouraging development in existing centres, fostering mixed use and good design principles and in so doing reducing the need to travel.
5.129 It cannot be ignored that there are some components of the strategy that are more unsustainable – this includes highway improvements which reinforces current car use. However, it is unrealistic in the Thames Valley to not provide for improved highway networks, particularly given its poly-centric and in places, rural nature, as well as the positioning of major arterial routes within and surrounding it (the M4, M3 and M40).
5.130 Also, many of the highway provisions are designed to influence and encourage more public transport on those routes. The public transport approach is reinforced here with provision to manage the highways (including bus and freight priority lanes) and also interchanges to take private cars off the roads in town centre and encourage the use of buses.
5.131 The provision of area wide charges in the longer term also show that there is a longer term commitment to encouraging more sustainable travel patterns. Charges may provide the ultimate ‘stick’ to reinforce the ‘carrot’ of the other public transport

THAMES VALLEY MULTI MODAL STUDY Final Report
441 1239 5-30 6352-T.545-pic
initiatives, and in so doing may effect a final modal shift from private to public modes of transport in the Thames Valley. How effective these are and therefore how sustainable the strategy ultimately is depends on how far these principles are rolled out across the Thames Valley.
5.132 In general terms therefore, the strategy has a large beneficial impact in supporting planning objectives relating to sustainability.
Current Policy – Mixed Use
5.133 In addition, the encouragement of mixed use developments is a major theme running through national, regional and local planning policy. PPG 1 identifies mixed use developments as a means of achieving a more sustainable settlement form as the closer proximity of different uses results in fewer trip demands, thus reducing the need to travel. It is recognised that such developments, particularly in town centres will require reduced parking provision and higher density development to be successful.
5.134 Maximum use needs to be made of the most accessible sites by seeking intensive, mixed development for high travel generating uses including offices, retail, leisure and hospitals in combination with residential uses.
5.135 For the purposes of this study, mixed use is interpreted both locally (scheme wide) but also centre wide- in that it encourages diversity in our towns and cities and is a move against functional segregation.
5.136 For the purposes of the Thames Valley, the mixed use concept is important as it endorses an approach to forecasting and quantifying policy which effectively concentrates development of all types closer together.
Strategy Performance
5.137 By applying the principles of mixed use development, at the micro as well as macro scale it is possible to reduce the need to travel. This links in with the ultimate truism that if destinations are brought closer together, trips become shorter and less complex.
5.138 The strategy does not provide micro scale transport solutions- it therefore does not focus on non-motorised transport (walking and cycling) and fine grained development forms, although it provides a framework which ultimately encourages the provision of those smaller scale transport solutions and development types.
5.139 In its hub and spokes strategy it is effectively advocating public transport nodes in the main centres, and is also suggesting in many cases the significant upgrading/rebuilding of those stations/interchanges. The adoption of principles of mixed use in these situations- as is currently being suggested at Reading Station for example- can only bode well for other parts of the main centres in the Thames Valley.
5.140 Therefore, the strategy scores well against this set of planning objectives as far as it is possible to do so. A supporting set of strategic and local planning policies in each
THAMES VALLEY MULTI MODAL STUDY Final Report
441 1239 5-31 6352-T.545-pic
of the hub locations are required if these objectives are to be met at the more local level in such a way that it fits in with the strategy.
5.141 In general terms therefore, the strategy has a slightly beneficial impact in supporting planning objectives relating to mixed use, subject to supporting policies at the local level.
Current Policy – Good Design
5.142 Increasingly town planning includes an emphasis on good design in our built environment. This is to improve the utility of the urban form. The requirement for sound design criteria is spelt out in PPG 1, and design is the third key principle for the planning system.
5.143 For the Thames Valley, design is directly relevant for transport: land use policy, not only in directing the form of particular buildings (i.e. flagship interchange buildings), but also in facilitating the achievement of uses that other schemes have not. It is also practically of use in setting design standards for different buildings. These include standards relating to housing densities, office sizes, circulation space and so on.
5.144 PPG 13 also recognises that good design can encourage access by walking, cycling and public transport through ensuring that spaces are well connected and safe for people to use. Mixed use developments also have a role to play here as they encourage walking as the most convenient mode of access. By supporting activities outside the standard working day, they can also ensure that the area is populated by people offering informal surveillance and contributing to a perception of safety for longer periods of the day and night.
Strategy Performance
5.145 The principles of good design must be followed if mixed use development principles are to work and this, in turn, ultimately increases the likelihood that there will be less demand to travel in the longer term.
5.146 The strategy only operates at a strategic level and therefore, as with the potential linkages between the principle of mixed use development, effectively provides a framework within which good design principles can be introduced to support the strategy and encourage more localised sustainable transport linkages in a more fine grained urban environment.
5.147 Certain elements of the strategy- the out of town interchanges and the town centre stations, and also the highway improvements, in themselves require good design to be operationally effective and to also mesh effectively with the wider area- whether it be the existing built up area or, in a small minority of cases, those out of town locations. Good design principles therefore must underpin the land use interventions promoted in the longer term to support the strategy.
5.148 In general terms therefore, the strategy has a slightly beneficial impact in supporting planning objectives relating to good design, subject to supporting policies at the local level.

THAMES VALLEY MULTI MODAL STUDY Final Report
441 1239 5-32 6352-T.545-pic
Current Policy – Environment
5.149 Safeguarding the environment for current and future generations is an important mainstay of Sustainability. This is carried further in PPG 7, which focuses on The Countryside, and is largely based on the Rural White Paper.
5.150 This prioritises sustainable development as the overriding consideration when planning for the countryside. While PPG 7 advocates healthy economic activity in the countryside, this does not mean large-scale economic development. Any development must enhance the environment and be sensitively related to existing settlement patterns. Planners must also consider special countryside designations, including, in descending order of protection, National Park, Areas of Outstanding National Beauty (AONBs), Green Belts and Sites of Special Scientific Interest (SSSIs). There is a strong onus against any development in these areas.
Strategy Performance
5.151 Generally, the strategy supports the sentiments of the planning system relating to the environment. In focussing development in existing centres, and directing public transport initiatives to those centres, it is effectively consolidating development patterns in the Thames Valley and in so doing is protecting the open countryside. In addition, there are no explicit proposals impinging on any areas with special environmental designations.
5.152 However, the environmental credentials of the strategy are not completely robust. This is for two reasons. Firstly, there are several locations where out of town interchanges or stations are proposed. These are to service either existing or future out of town developments (e.g. Green Park). However, these developments are out of town and impinge on areas of open countryside. Secondly, any long term consolidated planning strategy is likely to require greenfield land takes; simply due to the shortage of brownfield sites coupled with the added requirement to accommodate more growth in those centres over the longer term.
5.153 It is our view however, that while the sentiments of PPG 7 are not adhered to religiously, there are certain more environmentally sensitive proposals which may be justifiable on wider sub-regional sustainability grounds despite obvious contravention to PPG 7. There is a requirement for pragmatism on this point.
5.154 In general terms therefore, the strategy has a slightly beneficial impact in supporting planning objectives relating to the environment, although with the potential for large adverse impacts in the event of future Greenfield land-take.
Current Policy: Use specific guidance
5.155 Planning policy also comprises specific sets of guidance (albeit to differing levels of exactness) for particular uses. This includes town centres and retail (PPG 6), housing (PPG 3), and commercial and firms (PPG 4). Critical aspects of PPG 3, 4 and 6 are listed below; a brief appraisal of all three of these documents relative to the strategy is provided at the end of the section.
THAMES VALLEY MULTI MODAL STUDY Final Report
441 1239 5-33 6352-T.545-pic
PPG 3 – Residential
5.156 Although principally concerned with ensuring that housing requirements are met, this PPG also emphasises the contribution that the location of housing can make to the achievement of more sustainable development patterns. The guidance advises that local authorities should give priority to re-using previously developed land within urban areas, bring empty houses back into use and convert existing buildings rather than developing greenfield sites for housing.
5.157 In terms of the relationship with transport, development should make use of and support accessibility by public transport to jobs, facilities and services, thereby reducing dependence on travel by car. The needs of people should also take precedence over traffic movement within new housing developments. More specifically, larger housing developments should be located “around major nodes in good quality public transport corridors….and be accessible by a range of non-car modes”.
5.158 In addition, the ‘inefficient use of land’ should be avoided, by seeking densities of 30-50 dwellings per hectare, and even higher densities in places with good public transport accessibility and the nodes referred to above.
5.159 In addition, PPG 3 places the emphasis on locating housing in previously developed land and centres, and sets out a search sequence which prioritises these areas above other out of town and greenfield locations. PPG 3 advocates a mixture of tenures and also sets out requirements for affordable housing.
PPG 4 – Industrial & Commercial Development & Small Firms
5.160 PPG 4 advises that readily available sites should be allocated such that the locational needs of differing businesses can be satisfied. However, it also recognises that there are other issues in the wider public interest that should be acknowledged. Thus new development should be directed towards locations which minimise the number and length of journeys and which encourage travel by ‘energy efficient modes of transport’.6
5.161 Distribution parks serving many businesses should be located away from urban centres as the large number of vehicle movements that these facilities generate would add to congestion. Wherever possible these sites should be accessible by rail or water.
5.162 Mixing appropriate business and commercial uses with residential uses should be allowed subject to environmental and other amenity considerations. Flexibility in terms of the uses of existing buildings is also considered preferable to allowing premises to remain empty or underused. Optimum use should be made of previously developed land, taking accessibility by public transport into account.
6 PPG 4 Industrial & Commercial Development & Small Firms

THAMES VALLEY MULTI MODAL STUDY Final Report
441 1239 5-34 6352-T.545-pic
PPG 6 – Town Centres and Retail
5.163 Town centres are the preferred locations for retail and leisure uses. A hierarchy of town centres should be identified to guide major retail and leisure developments, taking into account their accessibility by public transport. If no town centre location can be found, an edge of centre site is the best alternative. Out of centre sites should only be considered if there are no suitable central/edge of centre sites and where they are or will be well served by public transport.
Strategy performance
5.164 These type-specific planning policy guidance notes relate the form, size and location of retail, residential and B class (industrial and commercial) development to transport policy as well as the other planning policy principles – good design, mixed use, environment, and sustainability – to varying degrees of detail.
5.165 The retail and residential policies in particular recognise that both development forms are trip generators, and each adopt policies seeking to locate these forms of development close to public transport nodes, and definitely, as far as possible within the built up area. The commercial and small firms guidance is less clear on this point, instead recognising that different forms of use have different transport requirements- for example distributional uses.
5.166 The strategy does not currently fully link in with these policies. This would be part of the role of the longer term consolidated planning strategy. However, several critical complementary assumptions have been made thus far. Firstly, the strategy has been based on policy driven aspirations regarding distributions and growth levels at regional and structure planning levels; therefore future housing and other development provision is ‘planned’ in the model in those locations where policy is directing it. Secondly, the hubs and spokes policy effectively encourages a consolidation of existing land use patterns and focussing development in the built up area, which accords with the sequential tests used for retail and also housing development.
5.167 The strategy already broadly supports the locational requirements for residential and retail and town centre development. Policy for employment uses is more vaguely defined and less town centre oriented; and therefore how it links with the strategy is less clear.
Summary: How do these Policy Assumptions relate to the Thames Valley?
5.168 Any land use policy framework for the Thames Valley study area must take on board these strands of policy.
5.169 Land use policy must above all be sustainable. To do that it must:
♦ Help reduce the need to travel;
♦ Focus development near transport hubs, and to a lesser extent interchanges;
♦ Encourage a modal shift to public transport and non motorised forms;

THAMES VALLEY MULTI MODAL STUDY Final Report
441 1239 5-35 6352-T.545-pic
♦ Concentrate development in the existing built up area (intensification, higher densities, previously developed land);
♦ Encourage mixed use and high quality design standards;
♦ Protect the environment;
♦ Encourage growth but not at all costs.
5.170 Our interpretation of these key policy strands for the Thames Valley, suggests:
♦ Concentrating all development in and around hub locations, and, within hub locations, along spoke arteries as far as is possible;
♦ Promoting mixed use and high density development, particularly close to the interchanges;
♦ Encouraging employment and housing uses in close proximity to each other;
♦ Discouraging commuting. Meeting additional demand for jobs from within i.e. by the provision of a balanced number of houses and associated development;
♦ There may be a case for greenfield development in the event that wider sustainability principles are being met, with regard to significant reductions in travel levels and distances.
Local Sub-objective: Encourage Consistency in Transport Policy Across Administrative Boundaries
5.171 A fundamental part of the strategy relates to improving the integration between transport modes. This will be achieved through individual schemes included in the strategy as well as through a number of policy recommendations, discussed in detail in Chapter 6: Implementation and Delivery of the Plan. Of central importance in this respect are our proposals for a joint implementation mechanism and team, to oversee implementation of the strategy, and to provide consistent and co-ordinated planning functions across the Thames Valley. With such a team in place, we believe that the strategy would score very highly against this sub-objective. The strategy impact is large beneficial in this respect.

THAMES VALLEY MULTI MODAL STUDY Final Report
441 1239 5-36 6352-T.545-pic
Table 5.18 – Strategy (without and with RUC): Central Government Appraisal Summary Table Problems: Congested road network with poor sub-regional public transport. PVC to Gov: -£1031 million (without
RUC) £3598 (with)
OBJECTIVE SUB-OBJECTIVE QUALITATIVE IMPACTS QUANTITATIVE MEASURE ASSESSMENT
Environment Noise Noise impacts reflect the level and distribution of traffic flow changes. Due to the large changes in traffic needed to produce significant noise benefits the strategy has minimal noise impacts compared to the reference case in 2031. More of the study area population will be affected by noise than now (base case 2001).
121 Zones winning without RUC (/111 with RUC) 8 Zones losing without RUC (/18 with RUC) If only changes of greater than 1dB(A) are considered, 13 zones win and 25 lose without RUC (25 and 29 with RUC) and all other zones experience no change.
Neutral - 6750 more people annoyed in 2031 than base and 550 less annoyed than in reference case (including possible impacts of noise changes of less than 1dB(A)), Negligible impact if only changes of greater than 1dB(A) are considered
Local Air Quality The strategy achieves modest reductions in transport emissions of PM10 and nitrogen oxides compared with the reference case and can therefore be expected to contribute towards improved air quality. Public transport schemes within the strategy are especially beneficial in promoting modal shift and reducing traffic and therefore emissions levels. The net change in emissions (in 2016) compared to the reference case is greatest with RUC but less than 10% for all pollutants and therefore modest compared to the improvement achieved compared to the base case (greater than 50%) as a result of cleaner vehicles and improved fuels. Reductions in emissions are also experienced in 7 of the 8 AQMAs within the study area if RUC is not included with the Strategy and in all 8 of the AQMAs if RUC is included.
Zones (out of 129) winning (without RUC/with RUC) (based on GOMMMS emissions estimates) For NOx compared to Base
128/128 For NOx compared to Ref
128/117 For PM10 compared to Base
128/128 For PM10 compared to Ref
128/124
Overall NOx Emissions (without RUC/with RUC) (2016): Compared to Base: -54%/-56% Compared to Reference -2%/-5% Overall PM10 Emissions (without RUC/with RUC) (2016): Compared to Base -62%/-64% Compared to Reference -4%/-8%
Greenhouse Gases The strategy achieves a modest reduction in transport emissions of carbon dioxide compared to the reference case. Compared to the base case the strategy only partly offsets the significant increase in carbon dioxide emissions as a result of traffic growth
. Change in CO2 emissions (without RUC/with RUC) (2016):: Compared to Base 16%/12% Compared to Reference -4%/ -8%
Landscape New infrastructure tends to have a negative effect upon the existing landscape where the development is outside the existing transport corridor. The Thames Crossing proposal is likely to be particularly damaging for the landscape.
Not applicable Slight adverse, but impacts can be minimised through use of existing infrastructure.
Townscape The majority of strategy elements have no significant impact upon townscape, or effects cannot be determined without detailed design (such as new rail links to Heathrow). On road rapid transit schemes can be damaging if overhead wires are required.
Not applicable Neutral or slight beneficial if good practice in design is adopted and appropriate mitigation is used.
Heritage of Historic Resources
New infrastructure tends to have a negative effect upon the existing landscape where the development is outside the existing transport corridor. New rail links to Heathrow are anticipated to be the most damaging.
Not applicable Slight adverse, large adverse where developments may impact upon heritage sites.
Biodiversity Construction of new transport routes and widening of existing routes have a negative impact on biodiversity caused by loss and segregation of habitats and disturbance to wildlife during construction and operation. Elements of the strategy where existing roads and railway lines are used have only neutral to minor adverse impacts. The new southern rail link to Heathrow is predicted to have a serious adverse impact on biodiversity caused by its impact on internationally and nationally designated sites.
Not applicable Slight adverse, large adverse where developments impact on internationally and nationally designated sites.

THAMES VALLEY MULTI MODAL STUDY Final Report
441 1239 5-37 6352-T.545-pic
Problems: Congested road network with poor sub-regional public transport. PVC to Gov: -£1031 million (without
RUC) £3598 (with)
OBJECTIVE SUB-OBJECTIVE QUALITATIVE IMPACTS QUANTITATIVE MEASURE ASSESSMENT
Environment (cont.)
Water Environment The overall reduction in traffic will benefit water quality by reducing runoff and the net impact of the strategy upon water quality should therefore be positive. Construction of public transport links across flood plains, such as the northern rail link to Heathrow are unfavourable although these options may offer opportunities for the physical enhancement of the water environment.
Not applicable Broadly neutral, but could be made slight beneficial by taking up opportunities for physical enhancement.
Physical Fitness Public transport elements of the strategy are generally favourable for physical fitness, encouraging walking and cycling. Benefits could be significant if good facilities for cyclists are included within detailed plans. Similarly road user charging is beneficial by discouraging private car use.
Not applicable Slight Beneficial
Journey Ambience The effect of different strategy elements is variable ranging from strongly beneficial for some public transport initiatives to neutral for road user charging. The net impact is expected to be beneficial.
Not applicable Moderate Beneficial.
Safety Accidents The strategy results in a significant improvement in road safety, particularly if RUC is included Annual casualty savings in 2016
3 fatal, 39 serious and 505 slight without RUC
6 fatal, 57 serious and 783 slight with RUC
Large beneficial
PVB
£230 million without RUC
£334 million with RUC
Security Substantial new public transport interventions incorporating security improvements Not applicable Moderate beneficial
Economy Economic Efficiency
The strategy provides a substantial return on the investment. Without RUC, it provides a Present Value of Benefits of £6385 million on a Present Value of Cost of £1599 million if RUC is not included and PVB of £7683 million if RUC is included
Changes in Indicators of Efficiency: (Without/with RUC)
Delay per highway veh km travelled: -20%/-24%
Kms travelled by PT vehs 49%/49%
NPVs (£ million) (Without/with RUC)
User Benefits £6498 / £3985
Private Providers £0 / £0
Public Providers -£335 / £3917
Other Government -£1377 /-£1819
Reliability Modal shift and traffic reductions, combined with better management of flows through design and ITS reduces proportion of network ‘at stress’ relative to the reference case.
Not applicable Moderate beneficial: Reduction in ‘at’ and ‘above’ stress levels of:19% without / 68% with RUC
Wider Impacts Benefits to sustainable development of the local economy through significantly improved access to Heathrow, and wider range of journey to work options, through public transport enhancements.
Not applicable Moderate beneficial
Accessibility Option Values The new stations, hubs and mass transit services provide another transport option for 36000 people living within 250m, 2% of the study area population.
Not applicable Moderate beneficial
Severance New rail schemes would increase severance slightly, though this could be mitigated (particularly for light rail schemes). 0.2% of the study area population lives within 250m of a new rail link.
Not applicable Neutral
Access to Transport Improvements in the level of access to public transport within the study area results in a slight positive change in accessibility index, however larger benefits will be attainable with improvements at the local level (and in urban areas) to complement the strategy.
Overall accessibility index:
92 Reference Case, 93 Strategy
Slight beneficial
Integration Interchange The strategy will improve interchange between modes Not applicable Slight beneficial
Land Use Policy The strategy is consistent with land-use policies Not applicable Varying between slight and large beneficial for different policy streams
Other Policies The strategy is broadly consistent with regional and national policies Not applicable Neutral

THAMES VALLEY MULTI MODAL STUDY Final Report
441 1239 5-38 6352-T.545-pic
Table 5.19 – Strategy (without RUC): Local Objectives Appraisal Summary Table (2016)
OBJECTIVE SUB-OBJECTIVE QUALITATIVE IMPACTS QUANTITATIVE MEASURE ASSESSMENT
1) Reduce key pollutants in AQMA Lower traffic levels result in reduced emissions in all AQMAs (by up to 10%)
%age change in Annual Emissions from Road Traffic
NOx PM10
Hillingdon -4% -5%
Hounslow -7% -10%
Runnymede -1% -2%
Spelthorne -3% -4%
Surrey Heath 0% -2%
Wokingham – A329M -4% -6%
Wokingham – M4 -2% -5%
Wycombe -1% -3%
Slight beneficial
2) Reduce the environmental impacts of freight movements
The strategy includes measures such as FQPs, routing and signing strategies and urban consolidation centres which are designed to reduce environmental impact and are expected to have a significant beneficial effect. Mode shift of freight from road to rail should also have a beneficial impact through reducing traffic levels but will be more affected by nationwide rather than Thames Valley level measures and the impact is expected to be modest
Not applicable
Slight beneficial
3) Reduce the environmental impacts of access to Heathrow
Strategy encourages mode shift from car to public transport for trips to Heathrow. The associated reduction in traffic will contribute towards the beneficial environmental impacts of the strategy overall.
Proportion of trips to Heathrow made by Public Transport
Ref Case
33%
With Strategy
40%
Moderate beneficial
Environment
4) Protect rural parts of the study area The strategy reduces traffic levels on all road types and therefore reduces the detrimental impact of traffic on the study area’s rural areas. It also focuses development in existing centres and directs public transport initiatives to those centres, effectively consolidating development patterns in the Thames Valley and protecting the open countryside. However, several out of town interchanges or stations are proposed (to service existing or future developments) and in the long term greenfield sites are likely to be needed due to the shortage of brownfield sites and the likely level of growth to be accommodated.
Not applicable
Slight beneficial
Morning Inter Peak
Change in traffic levels on urban roads -7% -4%
Safety 1) Reduce risks to pedestrians and cyclists
Traffic levels on the urban roads most likely to be used by cyclists and pedestrians reduce in both the Morning and Inter Peak, improving conditions. However there is also an associated increase in the average speed of vehicles on the same roads. Change in average speeds on urban roads 7% 2%
Slight beneficial, subject to
supporting local measures
2) Improve perceptions of safety and personal security
The strategy includes substantial new public transport interventions which incorporate security improvements such as CCTV monitoring, help points and cycle lockers at rail stations and interchange points and hubs
Not applicable Slight beneficial

THAMES VALLEY MULTI MODAL STUDY Final Report
441 1239 5-39 6352-T.545-pic
OBJECTIVE SUB-OBJECTIVE QUALITATIVE IMPACTS QUANTITATIVE MEASURE ASSESSMENT
1) Facilitate sustainable economic development
The strategy performs well in an assessment of the relative costs and benefits for the Thames Valley over a 30 year period. The result is a Benefit to Cost ratio of 4.0 and the NPV of £4.8Billion
Value of travel time and vehicle operating cost savings in the Thames Valley (over 30
years)
£6.6 Billion
Large beneficial
2) Reduce adverse effects of congestion & unreliability on freight distributors and public transport operators
The strategy reduces the extent to which HGV traffic travels on roads that are at or over capacity and is therefore at risk of network instability and associated delay & journey time variability.
Percentage of HGV kms in the morning peak in the study area that are travelled on links
that are Ref Case With
Strategy
The freight routing strategy should build on the general reliability improvements in the highway network although it may add to distance for some journeys.
Below and Approaching Capacity
At or Over Capacity
53
47
58
42
Moderate beneficial
3) Improve public transport levels of service
Road based PT will benefit from the general improved efficiency of the road network. This will be reinforced by both the proposed measures to prioritise PT movements and the significant investment in improving local, subregional and regional transport links which should act to reduce overall journey times
Not applicable
Large beneficial
Economy
4) Improve access to Heathrow The strategy includes measures designed to provide a step change in PT provision and also relieves congestion on the highway network surrounding Heathrow. This leads to substantial reductions in journey times to Heathrow and a much higher proportion of the study area living within a 60 minute radius of the airport
Change in resident population within 60 mins of Heathrow:
(Morning Peak)
By PT
17%
By Car
48% Large
beneficial
Strategy journey costs compared to Reference Case costs (Ref = 100):
PT Car
Farnborough-Slough 84 80
Guildford-Maidenhead 88 89
1) Increase choice of travel modes for north-south movements
Improved PT services including faster services, more frequent services, direct services and new links between previously unlinked locations reduce the average journey times and so improve public transport as a travel option on the North/South axis in the Thames Valley. Reduced congestion also results in reduced average highway journey times between North and South
Reading – High Wycombe 80 88
Large beneficial
Accessibility
2) Increase level of service provided by alternative modes
The strategy emphasises the development of public transport, recognising its role in opening up opportunities and helping to overcome social exclusion. The time and cost of making a wide variety of movements over the study area are significantly reduced by the strategy, improving public transport as option
Not applicable Moderate beneficial
1) Encourage development in sites with increased public transport accessibility
The strategy is consistent with land use policy. As such it encourages development to be focussed around areas receiving significant amounts of public transport investment and therefore experiencing significant improvements in accessibility.
Not applicable Large beneficial
Integration
2) Encourage consistency in transport policy across administrative boundaries
The strategy includes a proposed joint implementation mechanism and team to oversee implementation of the strategy and to provide consistent and co-ordinated planning functions across the Thames Valley and therefore should score very highly against this sub-objective.
Not applicable Large beneficial

THAMES VALLEY MULTI MODAL STUDY Final Report
441 1239 5-40 6352-T.545-pic
Table 5.20 – Strategy (with RUC): Local Objectives Appraisal Summary Table (2016)
OBJECTIVE SUB-OBJECTIVE QUALITATIVE IMPACTS QUANTITATIVE MEASURE ASSESSMENT
1) Reduce key pollutants in AQMA Lower traffic levels result in reduced emissions in all AQMAs (between 3 and 13%)
%age change in Annual Emissions from Road Traffic
NOx PM10
Hillingdon -6% -8%
Hounslow -7% -11%
Runnymede -3% -7%
Spelthorne -4% -8%
Surrey Heath -3% -8%
Wokingham – A329M -5% -9%
Wokingham – M4 -6% -12%
Wycombe -11% -13%
Slight beneficial
2) Reduce the environmental impacts of freight movements
The strategy includes measures such as FQPs, routing and signing strategies and urban consolidation centres which are designed to reduce environmental impact and are expected to have a significant beneficial effect. Mode shift of freight from road to rail should also have a beneficial impact through reducing traffic levels but will be more affected by nationwide rather than Thames Valley level measures and the impact is expected to be modest
Not applicable Slight beneficial
Ref Case
With Strategy
3) Reduce the environmental impacts of access to Heathrow
Strategy encourages mode shift from car to public transport for trips to Heathrow coming close to BAAs 50% target. The associated reduction in traffic will contribute towards the beneficial environmental impacts of the strategy overall. Proportion of trips to Heathrow made by
Public Transport 33% 47%
Moderate beneficial
Environment
4) Protect rural parts of the study area The strategy reduces traffic levels on all road types and therefore reduces the detrimental impact of traffic on the study area’s rural areas. It also focuses development in existing centres and directs public transport initiatives to those centres, effectively consolidating development patterns in the Thames Valley and protecting the open countryside. However, several out of town interchanges or stations are proposed (to service existing or future developments) and in the long term greenfield sites are likely to be needed due to the shortage of brownfield sites and the likely level of growth to be accommodated.
Not applicable
Slight beneficial
Morning Inter Peak
Change in traffic levels on urban roads -12% -4% Change in average speeds on urban roads 9% 2%
Safety 1) Reduce risks to pedestrians and cyclists
Traffic levels on the urban roads most likely to be used by cyclists and pedestrians reduce in both the AM and Inter Peak, improving conditions. However there is also an associated increase in the average speed of vehicles on the same roads
Slight beneficial, subject to
supporting local measures.
2) Improve perceptions of safety and personal security
The strategy includes substantial new public transport interventions which incorporate security improvements such as CCTV monitoring, help points and cycle lockers at rail stations and interchange points and hubs
Not applicable Slight beneficial

THAMES VALLEY MULTI MODAL STUDY Final Report
441 1239 5-41 6352-T.545-pic
OBJECTIVE SUB-OBJECTIVE QUALITATIVE IMPACTS QUANTITATIVE MEASURE ASSESSMENT
1) Facilitate sustainable economic development
The strategy performs well in an assessment of the relative costs and benefits for the Thames Valley over a 30 year period. The result is a Benefit to Cost ratio of 4.8 and the NPV of £6.1 Billion
Value of travel time and vehicle operating cost savings in the Thames Valley (over 30
years)
£8.1 Billion
Large beneficial
Percentage of HGV kms in the Morning Peak in the study area that are travelled on links
that are
Ref Case With Strategy
Below and Approaching Capacity 53 83
2) Reduce adverse effects of congestion & unreliability on freight distributors and public transport operators
The strategy reduces the extent to which HGV traffic travels on roads that are at or over capacity and is therefore at risk of network instability and associated delay and journey time variability. The freight routing strategy should build on the general reliability improvements in the highway network although it may add to distance for some journeys.
At or Over Capacity 47 17
Moderate beneficial
3) Improve public transport levels service Road based PT will benefit from the general improved efficiency of the road network. This will be reinforced by both the proposed measures to prioritise PT movements and the significant investment in improving local, subregional and regional transport links which should act to reduce overall journey times
Not applicable
Large beneficial
By PT By Car
Economy
4) Improve access to Heathrow The strategy includes measures designed to provide a step change in PT provision and relieves congestion on the highway network surrounding Heathrow and therefore leads to substantial reductions in journey times and a much higher proportion of the study area living within a 60 minute radius of the airport
Change in resident population within 60 mins of Heathrow:
(Morning Peak) 17% 80% Large beneficial
Strategy journey costs compared to Reference Case costs (Ref = 100):
PT Car
Farnborough-Slough 84 78
Guildford-Maidenhead 88 82
1) Increase choice of travel modes for north-south movements
Improved PT services including faster services, more frequent services, direct services and new links between previously unlinked locations reduce the average journey times and so improve public transport as a travel option on the North/South axis in the Thames Valley. Reduced congestion also results in reduced average highway journey times between North and South
Reading – High Wycombe 80 93
Large beneficial
Accessibility
2) Increase level of service provided by alternative modes
The strategy emphasises the development of public transport, recognising its role in opening up opportunities and helping to overcome social exclusion. The time and cost of making a wide variety of movements over the study area are significantly reduced by the strategy, improving public transport as option
Not applicable Moderate beneficial
1) Encourage development in sites with increased public transport accessibility
The strategy is consistent with land use policy. As such it encourages development to be focussed around areas receiving significant amounts of public transport investment and therefore experience significant improvements in accessibility.
Not applicable Large beneficial
Integration
2) Encourage consistency in transport policy across administrative boundaries
The strategy includes a proposed joint implementation mechanism and team to oversee implementation of the strategy and to provide consistent and co-ordinated planning functions across the Thames Valley and therefore should score very highly against this sub-objective.
Not applicable Large beneficial

THAMES VALLEY MULTI MODAL STUDY Final Report
441 1239 5-42 6352-T.545-pic
SUPPORTING ANALYSES
5.172 The Guidance on the Methodology for Multi-Modal Studies (GOMMMS) identifies three supporting analyses that should be presented in addition to the Central Government Appraisal Summary Table. These three analyses cover:
♦ distribution and equity;
♦ affordability and financial sustainability; and
♦ practicality and public acceptability.
Distribution and Equity
5.173 The recommended strategy has been developed through the detailed strategy and option development process to meet the study objectives and address the identified problems and issues. The appraisal of the performance of the recommended strategy against the study objectives is summarised in the Local objectives Appraisal Summary Table (Table 5.19 and 5.20). As required by GOMMMS the LAST includes an assessment of the distributional consequences of the strategy.
5.174 From this appraisal it can be seen that the recommended strategy brings benefits across the study area. Analysis has shown that the number of people adversely affected by the strategy (e.g. by increased traffic noise as a result of re-routing arising from road user charging) is small and is greatly outweighed by those who benefit.
5.175 The issue of equity is covered in the Transport Economic Efficiency table (Tables 5.23 and 5.24). The TEE table illustrates the breakdown of the strategy’s economic net present value by different recipients of costs and benefits.
Affordability and Financial Sustainability
5.176 The overall costs of the strategy are given in Table 5.21.
Table 5.21 – Scheme Costs (£million, 2001 prices)
Capital Costs Operating Costs (per annum)
Rail 632.0 114.1
Mass transit & bus 203.5 17.1
Highway 305.1 10.0
Other 10.0 10.0
Total 1150.6 151.2
NB: Road user charging implementation and operating costs not included
5.177 It is important to note that there will be significant costs associated with implementing the strategy at the local level (arising from non-specified schemes pursued through the LTP process) which are not included in the cost estimates in Table 5.21. The costs in Table 5.21 relate to the specific schemes and measures identified in

THAMES VALLEY MULTI MODAL STUDY Final Report
441 1239 5-43 6352-T.545-pic
Chapter 4, for which impacts and benefits have also been quantified and included within the appraisal.
5.178 Whilst the prime economic assessment criteria for the recommended strategy is the overall value for money as expressed in the CGAST, the Government wishes also to understand the overall financial performance. The Affordability and Financial Sustainability summary as shown below provides an overall assessment of the likely public expenditure required to deliver the strategy. The public sector investment profile is shown in Table 5.25. The profile of private sector expenditure is shown in Tables 5.26 and 5.27 (for the strategy without and with road user charging respectively).
5.179 A summary of the overall financial performance of the public transport schemes is shown in Table 5.22 below. This shows the net affect across the public transport system as a whole of operating surpluses for some schemes (e.g. + £1.9m for bus/mass transit at 2011 with RUC), and operating defecits for others (e.g. - £9.7m for rail at 2011 with RUC).
Table 5.22 – Financial performance of public transport schemes
Year Without RUC With RUC
Subsidy Surplus Difference Subsidy Surplus Difference
2006 £14.0m £0.0m -£14.0m £14.0m £0.0m £-14.0m
2011 £10.7m £0.0m -£10.7m £9.7m £1.9m £-7.8m
2016 £50.6m £0.8m -£49.7m £4.8m £12.0m £7.2m
2021 £50.9m £0.0m -£50.9m £4.8m £9.9m £5.0m
Practicality and Public Acceptability
5.180 The practicality of each of the strategy elements has been assessed in broad terms as part of this study. However, further feasibility and development work would need to be completed before schemes are implemented.
5.181 The public acceptability of the strategy has been assessed through a major public consultation exercise undertaken in October 2002, involving public exhibitions, a meeting of the Wider Reference Group, and circulation of a newsletter and questionnaire. The response to the strategy as a whole was generally neutral or favourable, although a number of detailed comments were received with respect to specific elements of the strategy (see panel overleaf).

THAMES VALLEY MULTI MODAL STUDY Final Report
441 1239 5-44 6352-T.545-pic
PUBLIC REACTIONS TO THE DRAFT STRATEGY
Responses to the Questionnaire
20,000 copies of the final newsletter containing a short self-completion questionnaire on the draft strategy were distributed to public locations throughout the study area to support the public exhibitions. An electronic copy was also placed on the study website so that the public could view the newsletter on-line and send a response via email.
We received over 600 responses, mainly from people who live or work in the study area. 60% of these supported the draft strategy, a third said they were undecided and 7% disagreed with it.
The road proposals were considered to be the most effective element of the strategy; 59% of the respondents felt that investment in roads would have the greatest impact on the transport problems in the Thames Valley. 30% said public transport improvements and 11% said travel management.
Despite the lack of confidence in travel management, there is a great deal of potential for travel plans and other employer-led initiatives aimed at reducing peak period traffic. For example, 45% of the respondents said that they would be prepared to avoid travelling at peak times and 30% said they would avoid peak times and work at home (see chart).
Q. Would you be prepared to:
i) car share
ii) avoid travelling at peak times
iii) work at home?
22% of respondents were in favour of some form of road user charging, mainly to reduce congestion in the main towns and bridges over the Thames and to generate additional funds that could be spent on local transport improvements, in particular, better public transport. 73% of respondents were not in favour of charging. Their main reasons were that public transport did not provide a good enough alternative to the car, charging would be another tax on motorists, and re-routeing may increase traffic on unsuitable roads.
Written Submissions on the Draft Strategy We received 34 written responses to the consultation on the draft strategy. Most of these came from formal stakeholders including local authorities, shire districts and parish councils and environmental groups. There were no key themes running through the correspondence, but several respondents felt that the strategy was not bold enough and expressed their disappointment at the forecast outcomes did not improve on current levels of congestion and air pollution. There was some concern that attempting to remove ‘local’ traffic from the motorways would increase congestion on local roads that would led to higher risk of accidents and community severance effects. There were conflicting views on the benefits of a hub and spoke approach to public transport; some respondents agreed that channelling people into key corridors of movement was the only way to provide cost effective public transport in the Thames Valley. Whereas others claimed that the hubs would lead to greater pressure for development in greenbelt areas, and there would be additional traffic that would intensify existing congestion, severance, etc in the vicinity. There were also differences in opinion over the benefits of transferring freight from road to rail. Some respondents felt that more effort should be made to encourage modal shift, whereas others were concerned that transhipment centres would increase heavy vehicle flows. Several respondents called for a stronger justification of the rail improvements contained in the draft strategy as they perceived that the Strategic Rail Authority would fail to recognise their importance. There were also calls for travel plans to be made mandatory or for employers to be offered financial incentives to ensure that plans delivered changes in travel behaviour.
Car share
Work at home
Avoid peak
4 12
23
5
3
1812
None of these options 22%

THAMES VALLEY MULTI MODAL STUDY Final Report
441 1239 5-45 6352-T.545-pic
Table 5.23 – Transport Economic Efficiency for Strategy without RUC
Impact TOTAL Present Value User Benefits 1998 prices and values (£000s) Personal travel Car Private (Goods) Public transport Other
Travel Time 5807890 2883828 611087 2312974 Vehicle operating costs 748618 543467 205151 0 User charges -58882 0 0 -58882 NET IMPACT 6497626
(1) 3427295 816238 2254093 0
Private Sector Provider Impacts Public transport Other Revenue 568356 568356 Operating costs -819113 (a) -819113 Investment costs -444712 (b) -444712 Grant/subsidy 695470 695470 NET IMPACTS 0 (2) 0 0 Public Sector Provider Impacts Road Infrastructure Private (Goods) Public Transport Other Revenue 0 0 0 0 Operating costs -4080 (c) 0 0 -4080 Investment costs -331209 (d) -236647 -1092 -93470 NET IMPACTS -335290 (3) -236647 -1092 -97551 0 Other Government Impacts Road Infrastructure Private (Goods) Public Transport Other Grant/Subsidy payments -695470 (e) 0 0 -695470 Indirect tax revenues -681199 -465007 -143524 -72668 NET IMPACTS -1376669 (4) -465007 -143524 -768138 0 TOTAL Net Present Value, NPV 4785668 (6)=(1)+(2)+(3)+(4) Present Value of Costs, PVC -1599116 (7)=(a)+(b)+(c)+(d) Present Value of Cost to Government -1030760 (8)=(3)+(e) Benefit/Cost Ratio, BCR 4.0 (9)=((6)-(7))/-(7) Value/Cost to Government Ratio, VCGR 4.6 (10)=(6)/-(8)

THAMES VALLEY MULTI MODAL STUDY Final Report
441 1239 5-46 6352-T.545-pic
Table 5.24 – Transport Economic Efficiency for Strategy with RUC
Impact TOTAL Present Value User Benefits 1998 prices and values (£000s) Personal travel Car Private (Goods) Public transport Other
Travel Time 6920366 3863817 829364 2227184 Vehicle operating costs 1131849 831940 299909 0 User charges -4066811 -3603726 -402870 -60216 NET IMPACT 3985404 (1) 1092031 726403 2166969 0
Private Sector Provider Impacts Public transport Other Revenue 945050 945050 Operating costs -819113 (a) -819113 Investment costs -444712 (b) -444712 Grant/subsidy 318775 318775 NET IMPACTS 0 (2) 0 0
Public Sector Provider Impacts Road Infrastructure Private (Goods) Public Transport Other Revenue 4252487 3878268 374219 0 Operating costs -4080 (c) 0 0 -4080 Investment costs -331209 (d) -236647 -1092 -93470 NET IMPACTS 3917197 (3) 3641621 373127 -97551 0
Other Government Impacts Road Infrastructure Private (Goods) Public Transport Other Grant/Subsidy payments -318775 (e) 0 0 -318775 Indirect tax revenues -1499842 -1171527 -207483 -120832 NET IMPACTS -1818618 (4) -1171527 -207483 -439608 0
TOTAL Net Present Value, NPV 6083982 (6)=(1)+(2)+(3)+(4) Present Value of Costs, PVC -1599116 (7)=(a)+(b)+(c)+(d) Present Value of Cost to Government 3598421 (8)=(3)+(e) Benefit/Cost Ratio, BCR 4.8 (9)=((6)-(7))/-(7) Value/Cost to Government Ratio, VCGR -1.7 (10)=(6)/-(8)

THAMES VALLEY MULTI MODAL STUDY Final Report
441 1239 5-47 6352-T.545-pic
Table 5.25 – Affordability and Financial Sustainability: Public Sector Investment for Strategy (with and without RUC)
Cost breakdown by Measure (£million, 2001 prices)
Investment Cost Total Undiscounted
Highway Improvements
Rail Improvements
Mass Transit & Bus
Travel Demand Management
2002-2006 122.5 61.0 0.0 50.0 10.0
2007-2011 244.1 244.1 0.0 0.0 0.0
2012-2016 61.9 0.0 0.0 61.9 0.0
Total 427.0 305.1 0.0 111.9 10.0
Private Sector Contributions 0 0 0 0 0 Investment net of contributions 427.0 305.1 0.0 111.9 10.0 Public Sector Operations
2006
Change in Operator Costs 12.0 2.0 0.0 0.0 10.0
Change in Operator Revenues 0.0 0.0 0.0 0.0 0.0
Net IMPACT -12.0 -2.0 0.0 0.0 -10.0
2011
Change in Operator Costs 20.0 10.0 0.0 0.0 10.0
Change in Operator Revenues 0.0 0.0 0.0 0.0 0.0
Net IMPACT -20.0 -10.0 0.0 0.0 -10.0
2016
Change in Operator Costs 20.6 10.0 0.0 0.6 10.0
Change in Operator Revenues 0.0 0.0 0.0 0.0 0.0
Net IMPACT -20.6 -10.0 0.0 -0.6 -10.0
2021
Change in Operator Costs 20.6 0.0 0.0 0.6 0.0
Change in Operator Revenues 0.0 0.0 0.0 0.0 0.0
Net IMPACT -20.6 -10.0 0.0 -0.6 -10.0
NB Road user charging implementation and operating costs not included

THAMES VALLEY MULTI MODAL STUDY Final Report
441 1239 5-48 6352-T.545-pic
Table 5.26 – Affordability and Financial Sustainability: Private Sector Investment for Strategy without RUC
Cost breakdown by Measure (£million, 2001 prices)
Investment Cost Total Undiscounted
Rail Improvements Mass Transit & Bus
2002-2006 0.0 0.0 0.0
2007-2011 0.0 0.0 0.0
2012-2016 723.6 632.0 91.6
Total 723.6 632.0 91.6
Capital Grants 0 0 0
Private Sector NET IMPACT
Investment net of capital grant 723.6 632.0 91.6
Private Sector Operators
2006
Change in Operator Costs 22.6 15.0 7.6
Change in Operator Revenues 8.6 5.3 3.3
Net IMPACT -14.0 -9.7 -4.3
Subsidy 14.0 9.7 4.3
2011
Change in Operator Costs 22.6 15.0 7.6
Change in Operator Revenues 11.9 5.3 6.6
Net IMPACT -10.7 -9.7 -1.0
Subsidy 10.7 9.7 1.0
2016
Change in Operator Costs 130.5 114.1 16.4
Change in Operator Revenues 80.8 63.5 17.3
Net IMPACT -49.7 -50.6 0.8
Subsidy 50.6 50.6 0.0
2021
Change in Operator Costs 130.5 114.1 16.4
Change in Operator Revenues 79.7 63.5 16.1
Net IMPACT -50.9 -50.6 -0.3
Subsidy 50.9 50.6 0.3
Operations net of subsidy
2006 0.0 0.0 0.0
2011 0.0 0.0 0.0
2016 0.8 0.0 0.8
2021 0.0 0.0 0.0

THAMES VALLEY MULTI MODAL STUDY Final Report
441 1239 5-49 6352-T.545-pic
Table 5.27 – Affordability and Financial Sustainability: Private Sector Investment for Strategy with RUC
Investment Cost Total Undiscounted
Cost breakdown by measure (£million, 2001 prices)
Rail Improvements Mass Transit & Bus
2002-2006 0.0 0.0 0.0
2007-2011 0.0 0.0 0.0
2012-2016 723.6 632.0 91.6
Total 723.6 632.0 91.6
Capital Grants 0 0 0
Private Sector NET IMPACT
Investment net of capital grant 723.6 632.0 91.6
Private Sector Operators
2006
Change in Operator Costs 22.6 15.0 7.6
Change in Operator Revenues 8.6 5.3 3.3
Net IMPACT -14.0 -9.7 -4.3
Subsidy 14.0 9.7 4.3
2011
Change in Operator Costs 22.6 15.0 7.6
Change in Operator Revenues 14.8 5.3 9.5
Net IMPACT -7.8 -9.7 1.9
Subsidy 9.7 9.7 0.0
2016
Change in Operator Costs 130.5 114.1 16.4
Change in Operator Revenues 137.7 109.3 28.5
Net IMPACT 7.2 -4.8 12.0
Subsidy 4.8 4.8 0.0
2021
Change in Operator Costs 130.5 114.1 16.4
Change in Operator Revenues 135.5 109.3 26.3
Net IMPACT 5.0 -4.8 9.9
Subsidy 4.8 4.8 0.0
Operations net of subsidy
2006 0.0 0.0 0.0
2011 1.9 0.0 1.9
2016 12.0 0.0 12.0
2021 9.9 0.0 9.9
NB Road user charging implementation and operating costs not included.

THAMES VALLEY MULTI MODAL STUDY Final Report
441 1239 5-50 6352-T.545-pic
SENSITIVITY TO KEY ASSUMPTIONS
5.182 GOMMMS requires that analysis is undertaken of the sensitivity of the economic case for the strategy to a range of eventualities relating to alternative outcomes on key components. This analysis also serves to illustrate the contribution made to the overall strategy by individual components. We have already highlighted throughout the impacts of the strategy with and without road user charging. In Chapter 7 we also consider the impacts of higher growth levels, and of an ‘alternative strategy’ which includes Motorway widening. The following additional tests have been undertaken, reflecting in particular the current uncertainty surrounding funding for rail infrastructure:
♦ Reduced impact from travel demand management (assuming half the level of traffic reduction adopted in the central case);
♦ Central strategy with delayed implementation of rail infrastructure (Staines – Heathrow link to 2016, GWML – Heathrow link to 2020);
♦ Central strategy without the GWML to Heathrow rail link;
♦ Central strategy without either Heathrow rail link;
♦ Central Strategy with doubling of all capital cost.
5.183 Our sensitivity test on reduced travel demand impacts responds to the potential for more of the benefits of reduced traffic to be eroded by induced demand. In practice, if implemented as part of the wider strategy, we believe that induced demand could be managed through physical design measures (e.g. reallocation of road space to public transport) or through road user charging, if implemented.
Table 5.28 – Economic Efficiency: Sensitivity Testing (no road user charging assumed in each case)
Central Strategy
Reduced Travel Demand Management
Impact
Delayed Implementation of rail schemes
No rail link GWML – Heathrow
No new rail links to Heathrow
Capital Costs
Doubled
Net Present Value (£m)
4800 3300 4600 4600 4100 4000
Benefit Cost Ratio
4.0 3.1 4.2 4.2 4.8 2.7
5.184 In each of the sensitivity tests, the Net Present Value reduces relative to the central case, but remains strongly positive. The removal of the rail infrastructure schemes increases the Benefit Cost Ratio (BCR). This is because, while these new rail links have a benefit cost ratio of significantly greater than 1 in their own right, their BCRs are lower than for the remaining elements of the strategy. This partly reflects that as part of this assessment, we have assumed a large proportion of the costs of these schemes, but only those benefits which relate to the Thames Valley area.

THAMES VALLEY MULTI MODAL STUDY Final Report
441 1239 5-51 6352-T.545-pic
CONTRIBUTION TO THE GOVERNMENT’S TEN YEAR PLAN
5.185 The Government’s Ten Year Plan, published in July 2000, established national priorities for the transport system along with an allocation of funding that was assessed as needed to meet those priorities. The Plan also set out a number of transport-related targets and indicators. The measures within the Plan have been developed to contribute to their achievement.
5.186 In this section, the degree to which the recommended strategy contributes to meeting the targets and indicators of the Ten Year Plan are described.
Public Service Agreement
5.187 The DfT’s expenditure on transport (both revenue and capital), as set out in the Ten Year Plan, seeks to deliver (or contribute to) the attainment of a number of targets. The targets were established by the DfT’s public service agreement. The contribution of the TVMMS strategy to the DfT’s public service agreement is reviewed in Table 5.29 below. In line with advice in GOMMMS, this assessment is undertaken for the nearest modelled year within TVMMS to 2010, namely 2016.
5.188 The Ten Year Plan highlights a number of other relevant targets and indicators. With respect to these the following is noted:
♦ The development of the study area’s rail network and interchanges both in the short and medium term will improve passenger satisfaction;
♦ The creation of a co-ordinating body will improve the development of services across local authority boundaries and further add to the attractiveness of public transport.
5.189 While the strategy makes a contribution towards the Ten Year Plan, it does not fully meet its targets. Meeting the congestion target is critically dependent on road users charging, and is not achieved until beyond the 10 year timescale.

THAMES VALLEY MULTI MODAL STUDY Final Report
441 1239 5-52 6352-T.545-pic
Table 5.29 – Performance of strategy against PSA targets
PSA TARGET (see box below for full
description)
QUANTITATIVE INDICATOR Without RUC
With RUC Comment
1) Inter Urban roads (trunk, including motorway)
1) Reducing congestion on the inter-urban network a) Average time lost in base year 2.2 2.2
b) Average time lost in 2016 in Ref Case 3.6 3.6
c) Average time lost in 2016 with Strategy 2.8 2.0
d) %age change between a) and c) (i.e. Strategy /Base) 28% -8%
Measure: Average time (minutes) lost in
congestion per vehicle km over an average day
e) Change in total vehicle hours between Ref Case and Strategy in 2016 (millions) -223.8 -442.3
With RUC, the strategy reduces congestion on Thames Valley (TV) interurban roads to below 2001 levels, more than meeting the national target (for 2010). Without RUC the strategy’s impact on TV roads falls short of the national target.
2) All other roads
a) Average time lost in base year 10.7 10.7
b) Average time lost in 2016 in Ref Case 13.6 13.6
c) Average time lost in 2016 with Strategy 11.3 11.3
d) %age change between a) and c) (i.e. Strategy /Base) 6% 6%
e) Change in total vehicle hours between Ref Case and Strategy in 2016 (millions) -481.8 -516.1
The strategy reduces congestion levels on non interurban roads in 2016. However, this still represents an increase over 2001 levels.
2) Increase Rail Use a) Passenger km in base year 6.9 6.9
b) Passenger km in 2016 in Ref Case 9.6 9.6
c) Passenger km in 2016 with Strategy 12.4 13.4
Measure : Passenger kms travelled by rail per
average day (millions) d) %age change between a) and c) (i.e.
Strategy /Base) 81% 95%
e) Change in passenger kms between Ref Case and Strategy in 2016 (millions) 2.8 3.8
Whether or not RUC is included, the strategy causes large increases in rail trips which exceed the national targets (for 2010).
3 & 4) Increase Other PT Use a) Passenger km in base year 0.5 0.5
b) Passenger km in 2016 in Ref Case 0.7 0.7
c) Passenger km in 2016 with Strategy 0.9 0.9
Measure : Passenger kms travelled by other
PT per average day (millions) d) %age change between a) and c) (i.e.
Strategy /Base) 63% 69%
e) Change in passenger kms between Ref Case and Strategy in 2016 (millions) 0.2 0.2
Whether or not RUC is included, the strategy causes large increases in bus and mass transit trips which fall between the national targets (for 2010) for bus and light rail.
6) Improving Air Quality a) No. of AQMAs in study area in base year 8 8
PM10 8 8 b) No. of AQMAs with improved air quality in 2016 with Strategy NOx 7 8
Measure: Change in air quality in AQMAs
PM10 0 0
c) No. of AQMAs with worse air quality in 2016 with Strategy NOx 1 0
The strategy contributes to the national air quality PSA target by reducing PM10 and NOx emissions over the majority of the Study Area, including most of the AQMAs identified (all of them if RUC is included in the strategy.)

THAMES VALLEY MULTI MODAL STUDY Final Report
441 1239 5-53 6352-T.545-pic
PSA TARGET (see
box below for full description)
QUANTITATIVE INDICATOR Without RUC
With RUC Comment
7) Reducing Greenhouse Gases a) CO2 tonnes per year in base year 3,369,786 3,369,786
b) CO2 tonnes per year in 2016 in Ref Case 4,094,543 4,094,543 Measure: Tonnes of CO2 emitted per year c) CO2 tonnes per year in 2016 with
Strategy 3,913,957 3,764,234
d) Change in CO2 tonnes between Ref Case and Strategy in 2016
-180,585 -330,308
The strategy reduces traffic related CO2 emissions from the Study Area compared to the Ref Case (by 4% & 8% without and with RUC respectively). However, this still represents an increase over 2001 levels.
8) Reducing Accidents a) No. of KSI casualties in base year 888 888
Measure: Number of KSI per year
b) No. of KSI casualties in 2016 in Ref Case
678 678
c) No. of KSI casualties in 2016 with Strategy 636 615
d) Change in No. of KSI casualties between Ref Case and Strategy in 2016 -42 -63
The strategy contributes to the national target by building on underlying trends in safety improvement to achieve a significant reduction in KSI casualties in 2016 compared to 2001 (about 30%)
Department for Transports Public Sector Agreement (PSA) Targets (published July 2000)
1. to reduce road congestion on the inter-urban network and in large urban areas in England below current levels by 2010 by promoting integrated transport solutions and investing in public transport and the road network. 2. to increase rail use in Great Britain (measured in passenger kilometres) from 2000 levels by 50% by 2010, with investment in infrastructure and capacity, while at the same time securing improvements in punctuality and reliability. 3. to increase bus use in England (measured by the number of passenger journeys) from 2000 levels by 50% by 2010, while at the same time securing improvements in punctuality and reliability. 4. to double light rail use in England (measured by the number of passenger journeys) by 2010 from 2000 levels. 5. to cut journey times on London Underground services by increasing capacity and reducing delays. Specific targets will be agreed with the Mayor after the Public Private Partnership has been established. 6. to improve air quality by meeting our National Air Quality Strategy targets for carbon monoxide, lead, nitrogen dioxide, particles, sulphur dioxide, benzene and 1-3 butadiene. 7. to reduce greenhouse gas emissions by 12.5% from 1990 levels and move towards a 20% reduction in carbon dioxide emissions by 2010. 8. to reduce the number of people killed or seriously injured in Great Britain in road accidents by 40% by 2010 and the number of children killed or seriously injured by 50%, compared with the average for 1994-1998.

THAMES VALLEY MULTI MODAL STUDY Final Report
441 1239 6-1 6352-T.545-pic
6. Delivery of the Strategy 6.1 This section considers the actions required by a range of bodies to implement the
recommendations of this study. We set out a plan for implementation which takes account of potential funding requirements and sources, planning and implementation lead times, and – importantly – some of the practical constraints on transport providers which apply in trying to deliver solutions.
6.2 The implementation of the study recommendations will require many organisations to play a role, and a strong focus on area-wide co-ordination. This is likely to require new organisational arrangements to facilitate and oversee the strategy delivery. In this context, we re-iterate the point made earlier (in Chapter 4) that it is critically important that the strategy is implemented as a single integrated package. The implementation of the strategy will therefore require each of the delivery agencies to be involved, working together in a co-ordinated fashion.
6.3 We discuss below some of the key issues associated with the implementation of key areas of our proposed strategy, including a series of policy recommendations arising from these issues. The expected implementation dates are given in Table 6.1 and illustrated in Figure 6.1. The timing of individual elements of the strategy reflect practical considerations with respect to institutional and funding constraints, and we have deliberately taken a cautious view. Given the pressing nature of transport issues in the Thames Valley, and the current degree of imbalance between transport supply and demand, an implementation timescale based upon need rather than feasibility and practical considerations would seek much earlier implementation of the key infrastructural measures such as Reading station up-grade and rail links to Heathrow.
6.4 There are a number of issues of sequencing which underlie the implementation timescale:
♦ A mechanism for the co-ordinated implementation of the strategy needs to be in place from very early in the strategy timeframe, as many of the measures proposed (including many of those proposed prior to the major infrastructural interventions), will be dependant upon consistent area-wide implementation to be of maximum value;
♦ The traffic flow management measures need to be implemented early within the strategy timeframe, as they will play a critical role in addressing already pressing congestion issues, in advance of the implementation of the major infrastructural measures;
♦ Facilities associated with Quality Public Transport corridors, including priority measures and marketing and publicity initiatives, need to be in place prior to the introduction of the proposed inter-urban bus services (programmed for 2006);
♦ There is a particular requirement for the major elements of the public transport strategy to be programmed or in place as (and if) road user charging is implemented (assumed to be 2011).

THAMES VALLEY MULTI MODAL STUDY Final Report
441 1239 6-2 6352-T.545-pic
Table 6.1 – Implementation Plan
Strategy scheme/measure Recommendation/action Lead Promoting/ Implementation bodies
Implementation timescale
Joint implementation Set up mechanism and team to over-see and co-ordinate implementation of strategy
Local, regional and central government bodies with delivery agencies
2003-2005
Phased rail enhancements Implement enhanced local rail services SRA and TOCS in consultation with joint implementation team
2003-2012 for pre GWML up-grade, 2010-2012 for post-upgrade
Earliest possible inclusion of redevelopment of Reading station in the SRA’s Strategic Plan
SRA Further investigation commencing in 2003, with a view to implementation by 2012
Further work to review Paddington capacity issues in the light of the requirements emerging from TVMMS and SWARMMS
SRA Further investigation commencing in 2003, with a view to implementation by 2012
Earliest possible inclusion of new rail links to Heathrow, in the SRA’s Strategic Plan
SRA Further investigation commencing in 2003, with a view to implementation by 2012
New Inter-urban bus services between hubs
Further development work, with particular regard to operational structure, and the development of the key corridors
Joint implementation team, with local authorities and bus operators
2003-2005, commencing implementation in 2006
Enhanced urban/local services (including Reading and Blackwater Valley)
Further feasibility work on the Reading and Blackwater Valley schemes
Local authorities On-going from 2003, implementation 2009-2012
Pursue initiatives through the LTP process and QBPs to provide greater bus priority and enhanced local services
Local authorities, and bus operators through joint implementation mechanism
2003 onwards
Travel plan initiatives Establish co-ordinated area-wide approach to travel demand management
Joint implementation team, in consultation with local authorities
2004 onwards
Local Transport Plans Pursue initiatives through the LTP process to encourage modal shift to walking, cycling and public transport
Local authorities 2003 onwards
Land use planning Development of planning policies based upon hub and spoke transport enhancements
Local and regional planning authorities
2003 onwards
Road User Charging Undertake work into the technical feasibility of road user charging, in the form envisaged for implementation in the Thames Valley
Central Government (DfT), SEERA
For implementation by 2011
Road Traffic flow management through design and technology
Implementation of such measures in advance of, and alongside, other key elements of the Thames Valley strategy
HA, local authorities, through joint implementation mechanism
2004 onwards
Facilities for priority users: public transport, freight, High Occupancy Vehicles
Identification and appraisal of schemes through the LTP and RMS processes
HA, local authorities, through joint implementation mechanism
2004 onwards
Freight from road to rail Implementation of SRA’s Strategic Freight Plan SRA 2003 onwards
Further work to identify potential Thames Valley freight transfer facilities
Local authorities, SRA and freight operators – through the joint implementation mechanism
2004 onwards
Management of road-based freight
Further development of FQPs and freight routing strategies
Local authorities with freight operators, – through the joint implementation mechanism
2003 onwards

THAMES VALLEY MULTI MODAL STUDY Final Report
441 1239 6-3 6352-T.545-pic
NEED FOR CO-ORDINATED DELIVERY
6.5 Much of the success of the overall strategy is likely to rest upon the extent to which transport planning in future can be undertaken in a way which transcends existing local authority boundaries. There are a number of strands to our strategy, set out in detail in Chapters 3 and 4, which will be reliant on such an approach.
6.6 We therefore recommend the setting up of a joint implementation mechanism and team, designed to facilitate:
♦ ongoing strategic transport planning by a wide partnership. Local authorities are required to work with their neighbours and with transport deliverers in deciding transport priorities and strategies. The joint implementation mechanism could provide a formalised and co-ordinated approach for this within the Thames Valley. It would also provide a forum to consider and address legislative and financial barriers to implementation.
♦ coordinated transport measures. Major elements of the TVMMS strategy need to be delivered consistently across the area. The hub and spoke system and public transport measures proposed in the strategy require through-ticketing, consistent public transport information, and much improved interchange. The joint implementation mechanism would facilitate the development of a comprehensive public transport network, rather than a collection of different networks and incompatible systems. Similarly, the joint implementation mechanism would allow travel demand initiatives to be implemented consistently across the area and for the development of consistent parking standards across the area to be considered.
♦ implementation of cross-boundary schemes – the current Local Transport Plan guidance promotes cross-boundary working. This does happen at several levels within the Thames Valley. The unitary authorities are committed to delivering the local transport agenda and this is resource intensive. The joint implementation mechanism could assist the delivery and management of difficult and large scale transport projects which cross local authority boundaries.
♦ coordinated bidding for cross-boundary infrastructure: some infrastructure improvements and priority would be needed in order to deliver the TVMMS strategy. Some of these elements will need to be funded from the local transport pot and major scheme bids will need to be prepared. The joint implementation team could take the lead in maintaining and developing the TVMMS transport model to assist the technical assessment of these schemes.
6.7 We would anticipate the joint implementation mechanism operating across the TVMMS study area. However, it is not appropriate for this study to recommend specific boundaries, given the impending Planning Bill, and its considerations on setting spatial strategies. One model available for joint implementation is the Passenger Transport Executive (PTE) model.

THAMES VALLEY MULTI MODAL STUDY Final Report
441 1239 6-4 6352-T.545-pic
PUBLIC TRANSPORT
Rail
6.8 We have identified a number of shorter-term rail service enhancements which, our analysis indicates, bring benefits both to existing Thames Valley train users, and also assist in encouraging modal shift from the road network. However, as highlighted earlier in the report, there are considerable uncertainties (in particular on the GWML) over how limited capacity might be allocated in the future, given competing demands, and pending the outcome of the re-franchising process and capacity utilisation work being undertaken by the SRA.
6.9 We believe however that, as a very minimum, the existing level of service available at Thames Valley stations should be safeguarded through the franchising process. Alternatively, any diminution of services in the Thames Valley to accommodate longer-distance services would need to be considered in terms of overall impacts on the Thames Valley.
6.10 It is recommended that the rail infrastructure proposals are incorporated into the SRA’s Strategic Plan at its next review to commit the required funding for the schemes to make early progress. Railtrack clearly has a key role to play here and it should develop proposals to progress the recommendations through consultation, design and implementation.
Bus/Coach
Inter-urban Services
6.11 With existing pressures on operators margins and local authorities’ budgets it is unlikely that major changes to the existing bus and coach network will be feasible in the short term in the absence of changes to the way the bus industry is organised and funded.
6.12 There is some scepticism amongst operators as to whether or not these services can be provided commercially, and our own analysis suggests an operating deficit, at least in the early years of operation (and in the absence of road user charging).
6.13 The enhanced inter-urban bus network could be operated as local authority supported contracts, although in the current operating environment it is unlikely that they will have the budget or that such a network would be considered a priority when funding is already stretched. In many cases new supported services are only able to be funded at the cost of another service. Without additional funding the enhanced interurban bus network is unlikely to be introduced through local authority support for socially necessary services.
6.14 A Quality Bus Partnership, or a series of partnerships could be developed to include commitments on improvements to service quality but operators are only likely to agree to such improvements if they believe them to be commercially viable. It is unlikely that this approach would provide the full enhanced interurban bus network as there are likely to be some routes which operators will view less favourably from a commercial perspective. A basic objective of the proposed inter-urban enhancements

THAMES VALLEY MULTI MODAL STUDY Final Report
441 1239 6-5 6352-T.545-pic
is to provide a network of links, and ‘cherry-picking’ of key routes would significantly devalue the proposal.
6.15 A Quality Contract could facilitate the proposed enhanced interurban bus network, although it is not a short term solution, with a 21 month period required before introduction after the scheme is made. Additional funding will still be necessary or the introduction of the enhanced interurban bus network will be at the cost of existing services.
6.16 The QC would be most effective if it were a single agreement which covered the entire Thames Valley area to avoid duplication and secure the most efficient use of resources. The introduction of the network might be delayed while this is established and further delayed by getting agreements on the quantity and quality of the bus network. A QC is often considered to be a last resort, the Transport Act 2000 gives local authorities the power to introduce a scheme if they are satisfied that ‘making a quality contract is the only practicable way of implementing the policies set out in their bus strategies’. For a scheme of this magnitude it is likely that a QC will be the only practical way of introducing the scheme in its entirety.
6.17 To ensure that the enhanced interurban bus network could be introduced at the desired level and quality it will be necessary for network planning, some quality standards and integrated fare systems to be co-ordinated across the area. This is likely to be achievable only with some form of area wide public transport implementation mechanism. In Table 6.1 we have therefore highlighted the role in this respect of the local authorities through the joint implementation mechanism. This will ensure the most efficient use of resources and remove the concerns regarding gaps in the network caused by local authority boundaries. The introduction of such a mechanism would facilitate a consistent policy for bus and coach services across the area, but a single team would have no more or less control on the activity of commercial operators than individual authorities without some kind of partnership agreement.
6.18 In conclusion there are a number of possible means for an enhanced interurban bus network to be introduced. It is unlikely to be introduced in the short term (over the next two years) and, however it is organised, additional funding will be required to provide high frequency, high quality services. In the longer term though, as the network becomes more established it is envisaged that the requirement for additional funding will decrease. Other sources of potential funding are workplace travel plans, road user charging, Rural Bus Grant (RBG) and Challenge funding.
6.19 Local authorities in partnership with local transport operators should seek to develop the recommended services. The proposed joint implementation mechanism would have a key role to play here and this mechanism should therefore be established as a matter of priority. The success of the proposals for enhanced inter-urban bus provision will be dependant upon the availability of additional revenue funding support for local authorities, at least in the early years.
Demand Responsive Transport
6.20 In setting up a Demand Responsive Transport service there are a number of issues which require consideration including how the services will be funded (commercially, local authority Subsidy, RBG or Challenge funding), and a range of issues relating,

THAMES VALLEY MULTI MODAL STUDY Final Report
441 1239 6-6 6352-T.545-pic
for instance, to the possible configuration of network services and information provision.
6.21 With these considerations in mind it is perhaps realistic to suggest that, whilst DRT could be introduced over the coming 1-2 years, its introduction on a Thames Valley wide-scale is more likely to be beyond this, and the main issue to be addressed is funding.
6.22 It is unlikely such services will be commercially viable, at least initially. Wiltshire ‘Wigglybus’, for example, has been in operation since May 1999, supported by Rural Bus Challenge (RBC) funding. In 2002, despite reported ridership in the region of 2500 additional RBC funding of almost £1 million has been secured in order to continue the service with some expansion.
6.23 In the current climate it is unlikely that extensive Demand Responsive services will be established without funding from local or central government. Local authority budgets for supporting bus services are already over-stretched but if existing supported services can be replaced by DRT, funding might then become available. RBG and Challenge Funding, which whilst not guaranteed has been awarded for a number of other DRT services across the country (including ‘Call-a-Bus’ in West Berkshire). It is possible that, with passenger growth and economies of scale for call centres, for example, that the services will need less support in the longer term.
6.24 We have considered a programme for implementation of bus elements of our strategy. It is considered that, whilst some measures can be achieved in the short and medium term within the current legislative framework, others will only be achieved in the longer term through changes to the way the bus and coach industry is organised and funded.
6.25 With public transport already having a poor reputation in the area, as is the case across much of the United Kingdom, it is essential that any changes to bus and coach services within the Thames Valley are high quality and introduced with the necessary infrastructure, such as bus priorities and high quality interchanges. Failure to do this will further harm the reputation of public transport in the area.
6.26 In summary, it is clear that whilst a number of the measures proposed in the bus and coach strategy can be implemented within the current legislative framework they are unlikely to be achieved without further funding being made available.
6.27 In some cases funding can be re-routed from existing sources, for example, DRT services might be funded through existing rural services being removed. In other cases it might be necessary to take advantage of existing funding sources such as the Rural Bus Grant and Challenge funding. Some of the more ambitious schemes may, however, require new sources of funding or existing funding to be increased.
6.28 Were it not for funding constraints a number of the schemes proposed for the medium to longer term could be introduced in the short term, although rushing schemes through is not recommended where quality will be compromised.

THAMES VALLEY MULTI MODAL STUDY Final Report
441 1239 6-7 6352-T.545-pic
TRAVEL PLANS
6.29 The two inter-related factors underlying successful implementation of the travel plan elements of our strategy are:
♦ Dedicated staff responsible for promoting and co-ordinating initiatives at an area-wide level;
♦ ‘buy-in’ from the private sector, which will require an appreciation on the part of potentially participating companies of ‘what is in it for them’.
6.30 We would recommend the appointment of regional travel plan co-ordinators working within a proposed joint implementation team. The challenge here is less to develop new guidelines. There is a plethora of information and advice available on travel plans from organisations such as the Association for Commuter Transport, DfT and TravelWise. The main purpose would be to act as a catalyst for local initiatives and a main point of contact and source of information.
6.31 Travel plan co-ordinators should take a lead in the use of a new Travel Plan tool developed by the DfT as a way of monitoring local travel plan development and effectiveness. By doing this they will be able to establish a local Accreditation standard by which all travel plans could seek to be recognised. The DfT are actively considering developing a formal Accreditation process, and the Thames Valley should actively seek to take a lead in this.
6.32 A number of travel plan business forums have already been set up in the Thames Valley and are very active. There are many benefits from the development of these forums which will help to develop the standard to which travel plans are implemented by the sharing of good practice. There is a need to formalise these networks though so that they do not turn into ‘talking shops’ because however useful, there is a need to improve local transport provision. It is only when there is a critical mass of employers and employees that this can be effective.
6.33 We would also recommend that further work is undertaken to assess possible arrangements for providing financial incentives to companies to implement travel plans, potentially through the tax system.
ROAD USER CHARGING
6.34 Delivery of area-wide road user charging will require not only primary legislation and, hence, government commitment but also commitment at the local level. It is highly unlikely that charging will be acceptable if confined to the Thames Valley area and, hence, the wider area proposals recommended by ORBIT will need to be supported at a regional level. SEERA and the Major of London will have an important role to play here. Feasibility work is required to address technical system issues, enforcement, public acceptability and hypothecation of revenues.

THAMES VALLEY MULTI MODAL STUDY Final Report
441 1239 6-8 6352-T.545-pic
HIGHWAYS
Trunk roads
6.35 The relatively small-scale measures recommended for improving and prioritising traffic operations on the trunk road network need to be confirmed by the Highways Agency and then included within their Local Network Management Programme or confirmed by the Regional Planning Body and the Secretary of State, and entered into the Targeted Programme of Improvements at the appropriate stage in the development of the measures.
New Roads
6.36 The proposed new bridge across the River Thames would need the approval of each of the relevant local authorities. We believe that the scheme has the potential to deliver benefits which are consistent with the general principles of this study, but recognise the concerns of some that the bridge could result in significantly increased traffic levels on both sides of the river. Accordingly, we have recommended that the case for the bridge be considered further, but as part of a package for the Reading urban area which considers also the scope for re-allocation of existing north-south capacity across the river to public transport. It is suggested that a more detailed traffic assessment is undertaken, using available data from this study.
FUNDING SOURCES
6.37 The overall capital cost of the strategy is estimated to be in the order of £1150m. The breakdown of this cost by type of intervention together with approximated annual operating costs is shown in Table 5.21, and annual revenues generated are shown in Chapter 5.
6.38 The majority of the funding for the strategy is expected to be provided by Central Government and the SRA’s Strategic Plans for Freight and Passenger Transport. Recommendations have been made for the inclusion of the recommended rail schemes within the SRA’s Strategic Plan at the next review.
6.39 The major elements of cost associated with the public transport recommendations relate to the up-grade of Reading station, and the two new rail links to Heathrow. Given the regional significance of such schemes it has not been possible to establish the full economic case for these schemes within the context of this study. However, each scheme makes a significant contribution to the overall economic benefits associated with our strategy for the Thames Valley. It is expected that significant private sector investment could be attracted for the delivery of these schemes.
6.40 It is expected that private sector developer funding could be secured as a contribution towards a number of the public transport schemes through the development planning process, including enhancements to the inter-urban bus network. Local Authorities should explore opportunities to lever private sector finance where possible. In the longer term, revenue from road user charging could also be used to support enhanced bus and mass transit services.
THAMES VALLEY MULTI MODAL STUDY Final Report
441 1239 6-9 6352-T.545-pic
6.41 Scope exists for private sector contributions captured through the development planning process to help fund improvement schemes at motorway junctions.

THAMES VALLEY MULTI MODAL STUDY Final Report
441 1239 6-10 6352-T.545-pic
Figure 6.1 – Implementation Plan
Strategy Component
2003
2004
2005
2006
2007
2008
2009
2010
2011
2012
2013
2014
2015
2016
2017
2018
2019
2020
Rail
Service Enhancements (pre- Reading station)
Reading Station Redevelopment
Service Enhancements (post- Reading station)
New Stations (Green Park, Farnborough)
Staines – Heathrow link
GWML – Heathrow Link
Mass Transit
Reading
Blackwater Valley (Busway)
Bus & Coach
Inter-urban services
Interchange hubs
Highway
Priority measures
Junction improvements
Traffic management
Telematics
Road user charging
Freight management measures
Transport change/Travel behaviour
Joint Implementation team – set-up
Scheme planning/development Scheme implementation

THAMES VALLEY MULTI MODAL STUDY Final Report
441 1239 7-1 6352-T.545-pic
7. The Strategy in the Longer Term 7.1 In developing and testing alternative approaches to support and inform our strategy
development work, we have looked closely at impacts and performance in 2016. However, we have also looked beyond this, to 2031. Forecasting over this more extended period has a significant level of uncertainty attached to it, but it is important to assess the extent to which the strategy will still be appropriate or not in the context of possible developments into the longer term future.
7.2 A number of inter-related factor have been examined in this context:
♦ How the strategy performs (relative to alternatives with higher road capacity provision) assuming that road user charging is not implemented;
♦ How the strategy performs (relative to alternatives with higher road capacity provision) assuming that traffic growth occurs in future in line with TEMPRO growth forecasts rather than those given by our RPG scenario;
♦ how much impact land use interventions can have on future levels and patterns of travel demand in the Thames Valley;
♦ the role of further enhancements to public transport than those assumed within the central case strategy (set out in Chapter 4).
7.3 The main objective of this work is not to re-visit the basis for the recommended strategy as set out in detail elsewhere in this report, but to establish if there are any additional recommendations which it is appropriate to make at this stage in relation to the performance of the strategy into the longer term future.
IMPACTS OF ROAD USER CHARGING AND HIGHER GROWTH
7.4 In Chapter 3 we set out a comparison (Table 3.4) of the relative performance of three strategy variants – our preferred strategy with RUC, preferred strategy without RUC, and an ‘alternative strategy’ based upon Motorway widening7 (but with RUC). This concluded that, at 2016, the additional benefits of Motorway widening in terms of highway performance are small relative to the preferred strategy, if road user charging is in place. However, if compared to a preferred strategy without RUC, the benefits of widening (in terms of highway performance) are more apparent.
7.5 Table 7.1 gives corresponding 2031 values to those set in Table 3.4 for 2016. (A number of the indicators relate to the 30 year evaluation period as a whole, so the same values appear in both tables). Broadly similar conclusions can be drawn as for the 2016-based analysis, with road user charging having more impact on the performance of the highway network than the Motorway widening schemes. Even without road user charging at 2031, the benefits of the widening strategy in terms of highway performance (compared to the central strategy) are modest.
7 The alternative strategy has each of the components of the central strategy as described in Chapter 4, but includes also widening of 3 lane sections of the motorway network through the study area (M40, M4, M3) to 4-lane.

THAMES VALLEY MULTI MODAL STUDY Final Report
441 1239 7-2 6352-T.545-pic
Table 7.1 – Alternative strategies (RPG - 2031)
Reference Case
Strategy (without
RUC)
Strategy (with RUC)
Alternative Strategy (without
RUC)
Alternative strategy
(with RUC)
Veh hrs (’000s) (AM Peak) 181 148 133 146 132
Total hours delay (,000s) (AM Peak) – overall
95 69 59 67 57
Total hours delay (,000s)(AM Peak) – motorway network
27 19 12 17 11
Total emissions – NOx 15407 14838 14528 15272 14924
Total emissions – PM10 393 373 363 379 367
Noise – Zones winning (relative to ref. case – including impacts of changes < 1dB(A))
n/a 121 111 92 86
Noise – Zones losing (relative to ref. case – including impacts of changes < 1dB(A))
n/a 8 18 37 43
Present Value Benefit (PVB) – Accident savings £mill (relative to ref. case) (30 years)
n/a 230 334 222 324
Transport Economic Efficiency PVB – total (relative to ref. case) £mill (30 years)
n/a 6385 7683 6580 7784
7.6 Table 7.2 sets out corresponding results based on the higher level of growth given by TEMPRO growth forecasts. Again similar conclusions may be drawn. The benefits of the motorway widening strategy (with RUC, compared to the preferred strategy with RUC) in terms of vehicle hours, delay, and Transport Economy and Efficiency (TEE) are more evident than for the RPG analysis, but only modestly so.

THAMES VALLEY MULTI MODAL STUDY Final Report
441 1239 7-3 6352-T.545-pic
Table 7.2 – Alternative strategies (TEMPRO - 2031)
Reference Case
Strategy (with RUC)
Alternative Strategy
(without RUC)
Alternative strategy
(with RUC)
Veh hrs (,000s) (AM Peak) 206 153 166 151
Total hours delay (‘000s) (AM Peak) – overall
115 74 82 71
Total hours delay (,000s) (AM Peak)– motorway network
32 14 21 13
Total emissions – NOx 15558 14663 15459 15124
Total emissions – PM10 405 373 389 378
Noise – Zones winning (relative to ref. case – including impacts of changes < 1dB(A))
n/a 110 93 87
Noise – Zones losing (relative to ref. case – including impacts of changes < 1dB(A))
n/a 19 36 42
PVB – Accident savings £mill (relative to ref. case) (30 years)
n/a 354 243 346
TEE PVB – total (relative to ref. case) £mill (30 years)
n/a 9149 7900 9445
7.7 Tables 7.1 and 7.2 above focus upon ‘headline’ impacts/benefits associated with the alternative strategy. A more in-depth analysis, considering a wider range of impacts (including economic and environmental) is shown in Tables 7.3 to 7.5.
7.8 Tables 7.3 and 7.4 give the Transport Economic Efficiency outputs for Tempro and RPG growth assumptions. The BCR (benefit/cost ratio) for the alternative strategy without RUC is 3.4, compared to a corresponding value of 4.0 for the preferred strategy (see Table 5.22). Even on the basis of higher growth assumptions (Tempro, as in table 7.3) the BCR for the alternative strategy only rises to be equal to the preferred strategy under RPG growth assumptions. (We have not tested the preferred strategy with TEMPRO growth assumptions, but this would give rise to a BCR of greater than the 4.0 derived for the RPG growth assumption).
7.9 The preferred strategy therefore has a stronger economic performance than the alternative, even under higher growth scenarios.
7.10 Table 7.5 presents the Appraisal Summary Table for the alternative strategy, highlighting the environmental impacts associated with motorway widening.

THAMES VALLEY MULTI MODAL STUDY Final Report
441 1239 7-4 6352-T.545-pic
Table 7.3 – Transport Economic Efficiency for Alternative Strategy without RUC - Tempro
Impact TOTAL Present Value User Benefits 1998 prices and values (£000s) Personal travel Car Private (Goods) Public transport Other Travel Time 7291986 3814370 798168 2679448 Vehicle operating costs 866404 617579 248825 0 User charges -60962 0 0 -60962 NET IMPACT 8097428 (1) 4431949 1046993 2618487 0
Private Sector Provider Impacts Public transport Other Revenue 565265 565265 Operating costs -819113 (a) -819113 Investment costs -444712 (b) -444712 Grant/subsidy 698561 698561 NET IMPACTS 0 (2) 0 0
Public Sector Provider Impacts Road Infrastructure Private (Goods) Public Transport Other Revenue 0 0 0 0 Operating costs -4080 (c) 0 0 -4080 Investment costs -681581 (d) -587019 -1092 -93470 NET IMPACTS -685662 (3) -587019 -1092 -97551 0
Other Government Impacts Road Infrastructure Private (Goods) Public Transport Other Grant/Subsidy payments -698561 (e) 0 0 -698561 Indirect tax revenues -762644 -524224 -166145 -72275 NET IMPACTS -1461205 (4) -524224 -166145 -770836 0
TOTAL Net Present Value, NPV 5950561 (6)=(1)+(2)+(3)+(4) Present Value of Costs, PVC -1949487 (7)=(a)+(b)+(c)+(d) Present Value of Cost to Government -1384222 (8)=(3)+(e) Benefit/Cost Ratio, BCR 4.1 (9)=((6)-(7))/-(7) Value/Cost to Government Ratio, VCGR 4.3 (10)=(6)/-(8)

THAMES VALLEY MULTI MODAL STUDY Final Report
441 1239 7-5 6352-T.545-pic
Table 7.4 – Transport Economic Efficiency for Alternative Strategy without RUC - RPG
Impact TOTAL Present Value User Benefits 1998 prices and values (£000s) Personal travel Car Private (Goods) Public transport Other Travel Time 6034188 3078954 638585 2316649 Vehicle operating costs 714590 520214 194376 0 User charges -58907 0 0 -58907 NET IMPACT 6689871 (1) 3599169 832961 2257742 Private Sector Provider Impacts Public transport Other Revenue 532204 532204 Operating costs -819113 (a) -819113 Investment costs -444712 (b) -444712 Grant/subsidy 731622 731622 NET IMPACTS 0 (2) 0
Public Sector Provider Impacts Road Infrastructure Private (Goods) Public Transport Other Revenue 0 0 0 0 Operating costs -4080 (c) 0 0 -4080 Investment costs -681581 (d) -587019 -1092 -93470 NET IMPACTS -685662 (3) -587019 -1092 -97551
Other Government Impacts Road Infrastructure Private (Goods) Public Transport Other Grant/Subsidy payments -731622 (e) 0 0 -731622 Indirect tax revenues -642231 -442497 -131690 -68044 NET IMPACTS -1373853 (4) -442497 -131690 -799666
TOTAL Net Present Value, NPV 4630357 (6)=(1)+(2)+(3)+(4) Present Value of Costs, PVC -1949487 (7)=(a)+(b)+(c)+(d) Present Value of Cost to Government -1417284 (8)=(3)+(e) Benefit/Cost Ratio, BCR 3.4 (9)=((6)-(7))/-(7) Value/Cost to Government Ratio, VCGR 3.3 (10)=(6)/-(8)

THAMES VALLEY MULTI MODAL STUDY Final Report
441 1239 7-6 6352-T.545-pic
Table 7.5 - Alternative Strategy (without RUC): Central Government Appraisal Summary Table – for RPG and Tempro planning assumptions
Problems: Congested road network with poor sub-regional public transport. PVC Cost to Gov: -£1417 million (RPG)/ - £1384 (Tempro)
OBJECTIVE SUB-OBJECTIVE QUALITATIVE IMPACTS QUANTITATIVE MEASURE ASSESSMENT
Environment Noise Noise impacts reflect the level and distribution of traffic flow changes. Due to the large changes in traffic needed to produce significant noise benefits, the strategy has minimal noise impacts compared to the reference case in 2031. More of the study area population will be affected by noise than now (base case 2001).
92 Zones winning with RPG assumptions (/93 with Tempro) 37 Zones losing with RPG (/36 with Tempro) If only changes of greater than 1dB(A) are considered 37 zones win and 39 lose (RPG, 24 and 45 for Tempro) and all other zones experience no change.
Neutral - 7120 more people annoyed in 2031 than base with RPG assumptions/ 7300 with Tempro, ) and 200 less annoyed than in reference case with RPG, 170 with Tempro (including possible impacts of noise changes of less than 1dB(A)), Negligible impact if only changes of greater than 1dB(A) are considered
Local Air Quality The strategy achieves modest reductions in transport emissions of PM10 compared with the reference case but causes small increases in nitrogen oxides overall and therefore has a mixed effect on air quality. Public transport schemes within the strategy are especially beneficial in promoting modal shift and reducing traffic and therefore emissions levels but the increased traffic levels encouraged by the widened motorways act to counterbalance this effect to a degree The net change in emissions (in 2016) compared to the reference case for PM10 is 3% (with both RPG and Tempro assumptions) and is therefore modest compared to the improvement achieved compared to the base case (greater than 50%) which will be achieved as a result of cleaner vehicles and improved fuels. Reductions in emissions are experienced in 5 of the 8 AQMAs within the study area with both RPG and Tempro assumptions
Zones (out of 129) winning (RPG/ Tempro) (based on GOMMMS emissions estimate). For NOx compared to Base
128/128 For NOx compared to Ref
89/91 For PM10 compared to Base
128/128 For PM10 compared to Ref
115/114
Overall NOx Emissions (2016) (RPG/ Tempro assumptions):
Compared to Base: -53%/-52%
Compared to Reference 1%/0%
Overall PM10 Emissions (2016) (RPG/ Tempro)
Compared to Base -61%/-60%
Compared to Reference -3%/-3%
Greenhouse Gases The strategy achieves a very modest reduction in transport emissions of carbon dioxide compared to the reference case. Compared to the base case, the strategy only partly offsets the significant increase in carbon dioxide emissions as a result of traffic growth.
. Change in CO2 emissions (2016) (RPG/ Tempro) Compared to Base
20% / 25% Compared to Reference
-1% / -2%
Landscape New infrastructure tends to have a negative effect upon the existing landscape where the development is outside the existing transport corridor. The Thames Crossing proposal is likely to be particularly damaging for the landscape and motorway widening will also have a negative impact if it extends into new landscape areas.
Not applicable Slight adverse, but impacts can be minimised through use of existing infrastructure.
Townscape The majority of strategy elements have no significant impact upon townscape, or effects cannot be determined without detailed design (such as new rail links to Heathrow). On road rapid transit schemes can be damaging if overhead wires are required. Increased traffic on widened motorways through urban areas would also have a negative impact on townscape.
Not applicable Neutral or slight beneficial if good practice in design is adopted and appropriate mitigation is used.
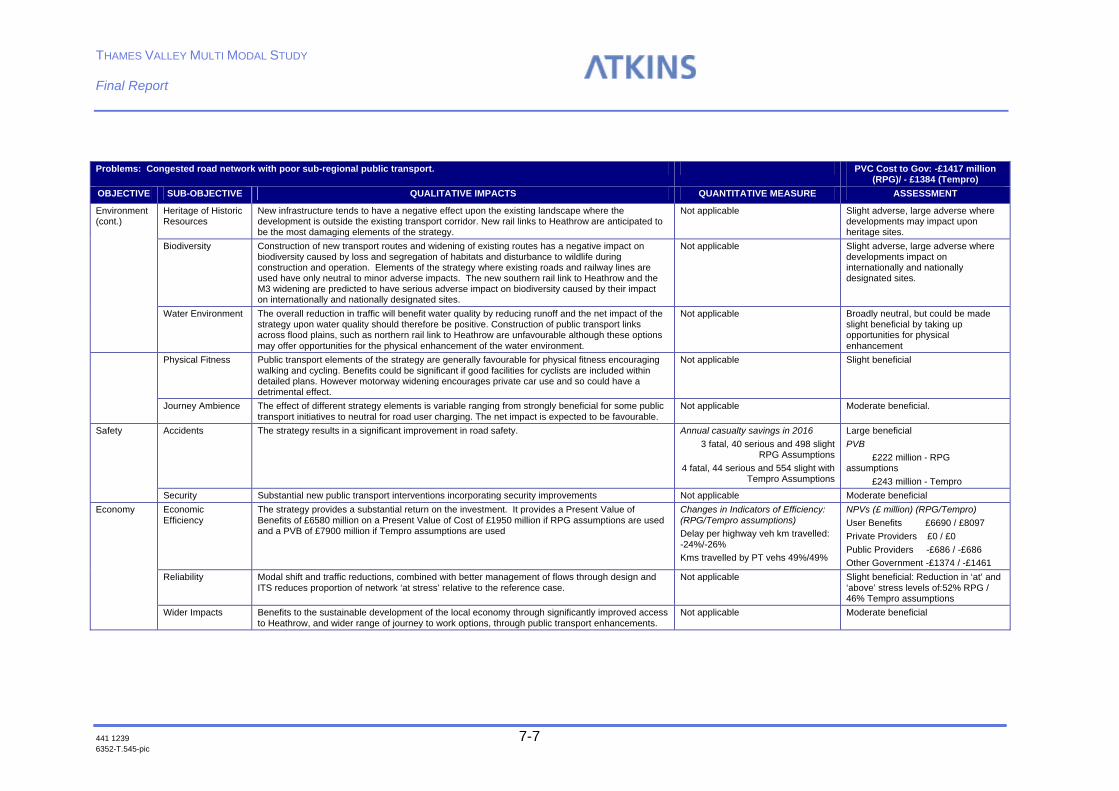
THAMES VALLEY MULTI MODAL STUDY Final Report
441 1239 7-7 6352-T.545-pic
Problems: Congested road network with poor sub-regional public transport. PVC Cost to Gov: -£1417 million
(RPG)/ - £1384 (Tempro)
OBJECTIVE SUB-OBJECTIVE QUALITATIVE IMPACTS QUANTITATIVE MEASURE ASSESSMENT
Environment (cont.)
Heritage of Historic Resources
New infrastructure tends to have a negative effect upon the existing landscape where the development is outside the existing transport corridor. New rail links to Heathrow are anticipated to be the most damaging elements of the strategy.
Not applicable Slight adverse, large adverse where developments may impact upon heritage sites.
Biodiversity Construction of new transport routes and widening of existing routes has a negative impact on biodiversity caused by loss and segregation of habitats and disturbance to wildlife during construction and operation. Elements of the strategy where existing roads and railway lines are used have only neutral to minor adverse impacts. The new southern rail link to Heathrow and the M3 widening are predicted to have serious adverse impact on biodiversity caused by their impact on internationally and nationally designated sites.
Not applicable Slight adverse, large adverse where developments impact on internationally and nationally designated sites.
Water Environment The overall reduction in traffic will benefit water quality by reducing runoff and the net impact of the strategy upon water quality should therefore be positive. Construction of public transport links across flood plains, such as northern rail link to Heathrow are unfavourable although these options may offer opportunities for the physical enhancement of the water environment.
Not applicable Broadly neutral, but could be made slight beneficial by taking up opportunities for physical enhancement
Physical Fitness Public transport elements of the strategy are generally favourable for physical fitness encouraging walking and cycling. Benefits could be significant if good facilities for cyclists are included within detailed plans. However motorway widening encourages private car use and so could have a detrimental effect.
Not applicable Slight beneficial
Journey Ambience The effect of different strategy elements is variable ranging from strongly beneficial for some public transport initiatives to neutral for road user charging. The net impact is expected to be favourable.
Not applicable Moderate beneficial.
Safety Accidents The strategy results in a significant improvement in road safety. Annual casualty savings in 2016 3 fatal, 40 serious and 498 slight
RPG Assumptions 4 fatal, 44 serious and 554 slight with
Tempro Assumptions
Large beneficial PVB £222 million - RPG assumptions £243 million - Tempro
Security Substantial new public transport interventions incorporating security improvements Not applicable Moderate beneficial
Economy Economic Efficiency
The strategy provides a substantial return on the investment. It provides a Present Value of Benefits of £6580 million on a Present Value of Cost of £1950 million if RPG assumptions are used and a PVB of £7900 million if Tempro assumptions are used
Changes in Indicators of Efficiency: (RPG/Tempro assumptions) Delay per highway veh km travelled: -24%/-26% Kms travelled by PT vehs 49%/49%
NPVs (£ million) (RPG/Tempro) User Benefits £6690 / £8097 Private Providers £0 / £0 Public Providers -£686 / -£686 Other Government -£1374 / -£1461
Reliability Modal shift and traffic reductions, combined with better management of flows through design and ITS reduces proportion of network ‘at stress’ relative to the reference case.
Not applicable Slight beneficial: Reduction in ‘at’ and ‘above’ stress levels of:52% RPG / 46% Tempro assumptions
Wider Impacts Benefits to the sustainable development of the local economy through significantly improved access to Heathrow, and wider range of journey to work options, through public transport enhancements.
Not applicable Moderate beneficial

THAMES VALLEY MULTI MODAL STUDY Final Report
441 1239 7-8 6352-T.545-pic
Problems: Congested road network with poor sub-regional public transport. PVC Cost to Gov: -£1417 million
(RPG)/ - £1384 (Tempro)
OBJECTIVE SUB-OBJECTIVE QUALITATIVE IMPACTS QUANTITATIVE MEASURE ASSESSMENT
Accessibility Option Values The new stations and hubs provide another transport option for 36000 people living within 250m, 2% of the study area population.
Not applicable Moderate beneficial
Severance New rail schemes would increase severance slightly, though this could be mitigated (particularly for light rail schemes). 0.2% of the study area population lives within 250m of a new rail link.
Not applicable Neutral
Access to Transport Improvements in the level of access to public transport within the study area results in a slight positive change in accessibility index, however larger benefits will be attainable with improvements at the local level (and in urban areas) to complement the strategy.
Overall accessibility index: 92 Reference Case,
93 Strategy
Neutral
Integration Interchange The strategy will improve interchange between modes Not applicable Slight beneficial
Land Use Policy The strategy is consistent with land-use policies Not applicable Varying between slight and large beneficial for different policy streams.
Other Policies The strategy is broadly consistent with regional and national policies Not applicable Neutral

THAMES VALLEY MULTI MODAL STUDY Final Report
441 1239 7-9 6352-T.545-pic
7.11 The foregoing analysis was undertaken to establish if, under certain circumstances a clear case begins to emerge for an alternative approach, perhaps involving more extensive provision of highway capacity in the form, for instance, of widening of the Motorway network. The intention was then to examine how such a strengthening case for additional highway capacity might be influenced by more intensive application of travel demand management (in particular based upon the more significant impacts on travel demand patterns and levels attainable through land use policies) either in isolation, or in combination with increased levels of public transport provision.
7.12 In the event, the overall case for additional highway widening remains unclear under the range of assumptions tested above, although, with higher growth levels, the economic case strengthens relative to the recommended strategy (although the environmental costs remain). The following sections consider the implications and impacts in the longer terms of other elements of the strategy. Given the outcomes of the tests described above, we have not undertaken further analysis of composite longer term strategies involving, for instance, a combination of new highway capacity, implementation of land use policies, and more public transport. Instead we have focussed upon some of the specific opportunities and impacts with respect to the strategy, firstly, associated with land use planning, and then, enhanced public transport provision.
FUTURE LAND USE POLICY
7.13 The current and likely future policy implications of the TVMMS strategy have been set out in Chapters 4, 5 and 6 of this report.
7.14 Current land use policy has been divided into several themes, and then appraised according to the emerging TVMMS strategy. Our appraisal of existing policy against the strategy for the Thames Valley concluded that it was generally in accordance with current policy, although it was recognised that there would be a requirement for some specific land use policy adjustments in the future. A set of generic policies was provided in Chapter 4 of this report.
7.15 Our policy analysis and review identified that complementary land use policy alongside the transport strategy would have to be sustainable. To do that it must:
♦ Help reduce the need to travel.
♦ Focus development near transport hubs, and to a lesser extent interchanges
♦ Encourage a modal shift to public transport and non motorised forms
♦ Concentrate development in the existing built up area (intensification, higher densities, previously developed land)
♦ Encourage mixed use and high quality design standards
♦ Protect the environment
♦ Encourage growth but not at all costs
7.16 Our interpretation of these key policy strands for the Thames Valley multi modal in response to enhanced public transport strategy, suggests:

THAMES VALLEY MULTI MODAL STUDY Final Report
441 1239 7-10 6352-T.545-pic
♦ Concentrating all development in and around hub locations, and, within hub locations, along spoke arteries as far as is possible.
♦ Promoting mixed use and high density development, particularly close to the interchanges.
♦ Encouraging employment and housing uses in close proximity to each other.
♦ Discouraging commuting. Meeting additional demand for jobs from within i.e. by the provision of a balanced number of houses and associated development.
♦ There may be a case for greenfield development in the event that wider sustainability principles are being met, with regard to significant reductions in travel levels and distances (i.e. reduced net in-commuting to Reading and other hub locations).
7.17 This section begins to explore the detail of these land use effects, and in particular what they mean in terms of the development of the built form in the Thames Valley in 2030; highlighting the major differences. These differences have been measured both by looking at changing transport demand patterns arising from the strategy, but also identifying exactly what the implications of the new land use policy is likely to be on the urban geography of the Thames Valley.
7.18 It should be noted that this approach, while it does incorporate some quantification, is not related to the emerging Structure Planning process in Berkshire, which we understand is well underway and increasingly has member support. This analysis is intended to provide an indication of a spatial interpretation of a complementary land use policy to the Thames Valley Multi Modal study. In this way it is possible to identify likely consequences. It is only a means to an end.
7.19 It is therefore undertaken purely for research purposes. It is not based on detailed consultation with local planning practitioners, and is also not purporting to be accurate. Critically, it is not intended to undermine or hijack the existing Structure Planning process in any way.
A Possible Approach
7.20 There are four stages to a methodology to identify the long term land use implications of the Thames Valley strategy. While these were not tested for this study, other than to inform indicative conclusions, it provides a possible way of inter-linking land use with transport strategy.
Stage 1: Adjusting the forecasts to link in a long term policy friendly scenario
7.21 This stage comprises the following assumptions:
♦ Clarifying the policy themes (see above) appropriate for the Thames Valley strategy
♦ Converting those themes into a series of quantifiable assumptions for interpretative purposes: − Focus more growth in hub areas (town centre hubs rather than out of town
ones) − Divert some growth from rural areas (pull in from rural zones)

THAMES VALLEY MULTI MODAL STUDY Final Report
441 1239 7-11 6352-T.545-pic
− Keep commuting levels static – adopt the same levels as in 1998 in absolute terms- not more people commuting in than in 1998, any more workers to be employed and jobs to be filled indigenously. Therefore there is a requirement for more houses and jobs etc.
7.22 This stage results in both a figure for additional jobs and houses for each hub- derived from both redistribution from rural to urban, and a consequence of static commuting levels over 30 year period. The effect is to significantly increase the hubs over the study time period.
7.23 Certain hubs are treated differently- namely Heathrow, where there is a significant job increase over the thirty year period, but there is not the associated levels of housing and employment space provision on the basis that this is a unique hub where it is not appropriate for major housing and commercial development aside from the airport itself.
Stage 2: Converting figures for new jobs and houses in each hubs into a land take
7.24 The figures for additional jobs and houses for each hub are essentially converted into a land take using a series of sequences. In addition, an interchange area is identified. There are therefore essentially three land take conversion processes taking place to identify the development implications of these increased workers and jobs for hub locations. These are:
♦ To identify a landtake for the workers living in the hub, the total number of workers is converted into a number of dwellings using average house size information, which in turn is converted into a landtake using density and plot ratio assumptions.
♦ To identify a land take for the additional jobs in a hub, the jobs are converted into a land take using density, plot ratio, employment mix, and circulation space assumptions.
♦ A land take required for an improved interchange is based on examples elsewhere- including the specification for a new interchange in Reading. The land take required is underpinned by size assumptions relative to the existing position of each hub in an overall hierarchy. In this scenario, Reading is assumed to be a Tier 1 hub, Bracknell and Slough a Tier 2, and the remaining hubs Tier 3. The exception to this is Heathrow, which is treated separately.
Stage 3: Assessing Capacity in each of the centres
7.25 In order to understand the spatial implications of the larger hubs and the remainder of the areas, a brief capacity assessment is undertaken of each of the hubs. This capacity assessment identifies how much land there currently is within each centre for:
♦ An expanded interchange;
♦ More landtake for more commercial space;
♦ More landtake for housing.
7.26 It is based on current and not future conditions (i.e. not future conditions in 2030). For this reason it can at best be regarded as an underestimate of future development conditions.

THAMES VALLEY MULTI MODAL STUDY Final Report
441 1239 7-12 6352-T.545-pic
Stage 4: Supply: Demand Analysis
7.27 The final stage assesses how far each of the hubs can realistically accommodate the development implications arising from a land use policy strategy concurrent with the Thames Valley transport strategy.
7.28 It is effectively an exercise comparing the outputs of stages 2 and 3. This analysis shows indicative physical land use implications of a Thames Valley land use strategy when combined with a complementary planning policy over the thirty year period.
The Impact of the Land Use Interventions on Future Levels and Patterns of Demand in the Thames Valley
7.29 The main impacts of the land use strategy on transport interventions are:
♦ More focus on hubs with major interchanges within each one. Emphasis is placed on transport by public transport rather than private car based methods.
♦ Maintenance of current levels of commuting activity, with increasing emphasis on people living and working closer together i.e. in the same hub. This will have the effect on reducing the scale and complexity of the flows between different parts of the Thames Valley, particularly the hubs.
♦ Generally hubs become much bigger- more by virtue of the people living and working in them rather than in-commuters. This will place more demand on the spoke network within the centres, and place increased emphasis on fine grained public transport provision and on non-motorised modes. It is essential that an integrated and reliable series of public transport measures evolve according with additional development activity in and around the hub locations. These will extend out to cover any additional (current) greenfield allocations.
♦ There is still growth in some rural areas although much of this is diverted to hub locations. There is still pressure on the spoke and wider network for demand response mechanisms however as these areas will, in the main still grow. It is particularly important to provide for existing out of town developments, as these will continue to be used.
The Impact of the Land Use Interventions on the existing Land Use Geography of the Thames Valley
7.30 The indicative land take and capacity analysis, reveals the following about the existing urban settlement geography of the Thames Valley and the extent to which it is able to accommodate estimated land use consequences of the Thames Valley transport strategy as interpreted in this study:
♦ Several of the hubs aspire to get larger over time, and recognise a requirement to replan and grow within the built up area as a part of that. The main example here is Reading, but there are other examples, including Bracknell and Slough. It is these centres that are potentially best placed to seek to accommodate development consequences of a ‘sustainable’ land use policy complementing the Thames Valley Transport strategy set out in this draft report.
♦ Some centres are more constrained than others, although there are signs that there is already limited development capacity in many of the centres. This

THAMES VALLEY MULTI MODAL STUDY Final Report
441 1239 7-13 6352-T.545-pic
suggests that in the longer term any attempt to fulfil even a significant proportion of the land take requirements generated would result in a redefinition of the development areas of these centres, expanding into significant tranches of greenfield land. An example is Basingstoke where there is an existing shortage of employment land and use of greenfield sites to accommodate a major urban extension. To accommodate additional development above and beyond these, to accommodate any Thames Valley transport strategy consequences, will almost certainly involve incursion onto greenfield sites.
♦ Without exception, none of the Thames Valley hubs have available capacities that meet the potential land take requirements generated in our analysis.
♦ Therefore, one strict implementation of a land use strategy compatible with the Thames Valley MMS strategy and also the thrust of planning policy, is likely to require a radical set of land use decisions- involving decisions to encroach on greenfield sites for example, irrespective of the size and location of the hub. Obviously, the suitability of individual hubs and the extent to which greenfield development is possible will vary from location to location, subject to the presence or otherwise of major national environmental designations (AONBs, SSSIs etc).
♦ It should however be noted that this analysis is only one interpretation of the land use consequences of the Thames Valley Multi Modal Study recommendations; and that additional research would be strongly advised. This analysis may also be interpreted as naïve given the assumption about retaining 1998 commuting levels for all the hub locations as an interpretation of transport guidance to reduce the need to travel. This was to enable some analysis rather than designed to provide a final definitive position. What it does show is that the Thames Valley is very constrained and that existing capacity analysis recognises these constraints.
LONGER TERM PUBLIC TRANSPORT PROVISION
Light Rail in the Thames Valley
7.31 Light rail is preferred to bus as a means of attracting car users. However, it has high capital costs, and it is normally only possible to make a funding case for schemes (under current Central Government rules) where demand and fare-box revenue levels are sufficient to cover operating costs. In most cases this requires the heavy passenger flows associated with key radial routes into major urban centres.
7.32 We have discussed earlier the dissipated nature of travel demand across the Thames Valley. Our analysis suggests that it will be very difficult to make a case for funding for any extensive implementation of light rail across the Thames Valley, at least in the shorter term, and given current funding rules. However, our study looks at a 30 year timeframe. In the longer term, in the context of potential road user charging, and land use strategies geared specifically towards optimising public transport use the case for light rail on some corridors is likely to become stronger. A number of corridors in particular have been identified in this respect:

THAMES VALLEY MULTI MODAL STUDY Final Report
441 1239 7-14 6352-T.545-pic
High Wycombe – Bourne End – Maidenhead.
7.33 There is scope here to use the track-bed of the former High Wycombe to Bourne End heavy rail link. We concur with the findings of previous studies that there is not a strong case now for re-instating a rail link here, and some of the track-bed has been built upon. Table 7.6 provides an overview of key indicators relating to the likely financial and economic case for a scheme assuming a light rail link from High Wycombe to Bourne End, combined with conversion of the current Marlow-Maidenhead line to light rail to provide a continuous system between the towns. Costs are highly indicative and based upon unit rates. This analysis shows that, at 2016, as a self-standing scheme, and in the absence of road user charging, fare-box revenue is unlikely to exceed operating costs, and that wider economic benefits are unlikely to justify the capital expenditure involved.
7.34 Hence, we have recommended shorter-term bus-based improvements between Maidenhead and High Wycombe, following the A404 corridor.
7.35 However, we recognise the longer-term opportunity to attract heavily car-based commuting movements to a new north-south public transport link across the Thames Valley. With the wider implementation of the strategy (and, in particular, road user charging) revenues from increased public transport patronage are likely to close any gap between operating costs and revenues, and revenues from road user charging may assist in covering the funding gap which would exist under current Central Government funding criteria. It is recommended that the relevant local authorities prevent further development along the alignment, so that the route is preserved in the event of the case for re-instatement of public transport route here strengthening in the future.
Table 7.6 – Light rail: High Wycombe – Marlow – Maidenhead
Demand (AM peak period – 3 hour – person trips, 2016, no RUC) 2250
Revenue (£m per annum, 2016, 1998 prices, undiscounted) 2.0
Indicative operating cost (£m p.a.) 2.0
Indicative capital cost (£m, 2001 prices) 100 – 150
Non-user benefit (£m, 2016, 1998 prices, undiscounted) 8.5
User benefit (£m, 2016, 1998 prices, undiscounted) 2.7
Blackwater Valley to Reading
7.36 Again, recent studies have shown a weak case for light rail in the Blackwater Valley area on the basis of current and shorter-term future demands. However, flows arising in the longer-term as part of a wider strategy with road user charging provide a more plausible context for the possible up-grading of bus-based provision to light rail. We have undertaken a broad assessment of the costs and impacts of a light rail system serving the Blackwater Valley, but extending also further northwards to integrate with the mass transit system currently being examined for Reading. It is recommended that a shorter-term bus-based system for the Blackwater Valley should be

THAMES VALLEY MULTI MODAL STUDY Final Report
441 1239 7-15 6352-T.545-pic
implemented in a fashion which is capable of subsequent up-grade to other technologies.
7.37 Runs of the demand forecasting model have been undertaken to assess the broad demand impacts of a light-rail based ‘Thames Valley Mass Transit’ system with an inter-urban system of light rail (following the corridors of the inter-urban bus proposals, and incorporating the High Wycombe/Maidenhead, Reading and Blackwater Valley systems). Such a system has not been subject to a full appraisal; the purpose of the test was to examine how much additional contribution to the objectives of the strategy could potentially be made by a level of public transport provision which goes beyond that assumed within our strategy.
7.38 Table 7.7 shows the scope to attract significant additional demand to public transport through up-graded inter-urban transport provision, particularly in combination with road user charging. In terms of reducing highway demand, impacts are worthwhile, but relatively marginal.
7.39 This analysis has, of necessity, been relatively coarse, but serves to demonstrate that enhanced inter-urban public transport provision in the longer term will be most effective if it continues to be implemented (as with the central strategy) as part of a wider package of measures.
Table 7.7 – Impacts of enhanced inter-urban public transport
Central Strategy (no RUC)
Central strategy – with study area
mass transit (no RUC)
Central strategy – with RUC
Central strategy with mass transit
and RUC
Public transport peak hour demand (person trips, AM peak hour, 2016. ‘000)
35.8 38.4 41.2 44.1
Highway peak hour demand (person trips, AM peak hour, 2016. ‘000)
284 282 272 269
CONCLUSIONS
7.40 Our overall conclusion is that we have seen no reason to question the basic logic, composition and applicability of our strategy when taking a longer term view of the future of the Thames Valley area. Indeed, we believe that beyond the initial 15 year period (and subject to on-going review as the strategy is implemented, and as the area is influenced by a range of factors beyond the remit of this study) that stronger implementation of the key elements of the strategy (such as land use planning and improvements to public transport) are likely to prove the most appropriate means of addressing transport problems and issues as they arise.

THAMES VALLEY MULTI MODAL STUDY Final Report
441 1239 6352-A-T.545
APPENDIX A
Glossary of Abbreviations

THAMES VALLEY MULTI MODAL STUDY Final Report
441 1239 A-1 6352-A-T.545
A. Glossary of Abbreviations
Throughout this report abbreviations are used as follows:
AONB - Area of Outstanding Natural Beauty
AQMA - Air Quality Management Area
AST - Appraisal Summary Table
ATP - Automatic Train Protection
BCR - Benefit Cost Ratio
CGAST - Central Government Appraisal Summary Table
DETR - Department of the Environment, Transport and the Regions
DfT - Department for Transport
DRT - Demand Responsive Transport
DTLR - Department of Transport, Local Government and the Regions
FQP - Freight Quality Partnership
FGW - First Great Western
GOMMMS - Guidance on the Methodology for Multi Modal Studies
GOSE - Government Office for the South East
GWML - Great Western Main Line
HA - Highways Agency
HEX - Heathrow Express
HGV - Heavy Goods Vehicle
HOV - High Occupancy Vehicle
HVS - High Value Service
IDM - Integrated Demand Management
ITS - Intelligent Transport Systems
LAST - Local objectives Appraisal Summary Table
LGV - Light Goods Vehicle
LTP - Local Transport Plan
MMS - Multi Modal Study
ORBIT - Transport Solutions around London – Multi Modal Study
P&R - Park & Ride
PPG - Planning Policy Guidance
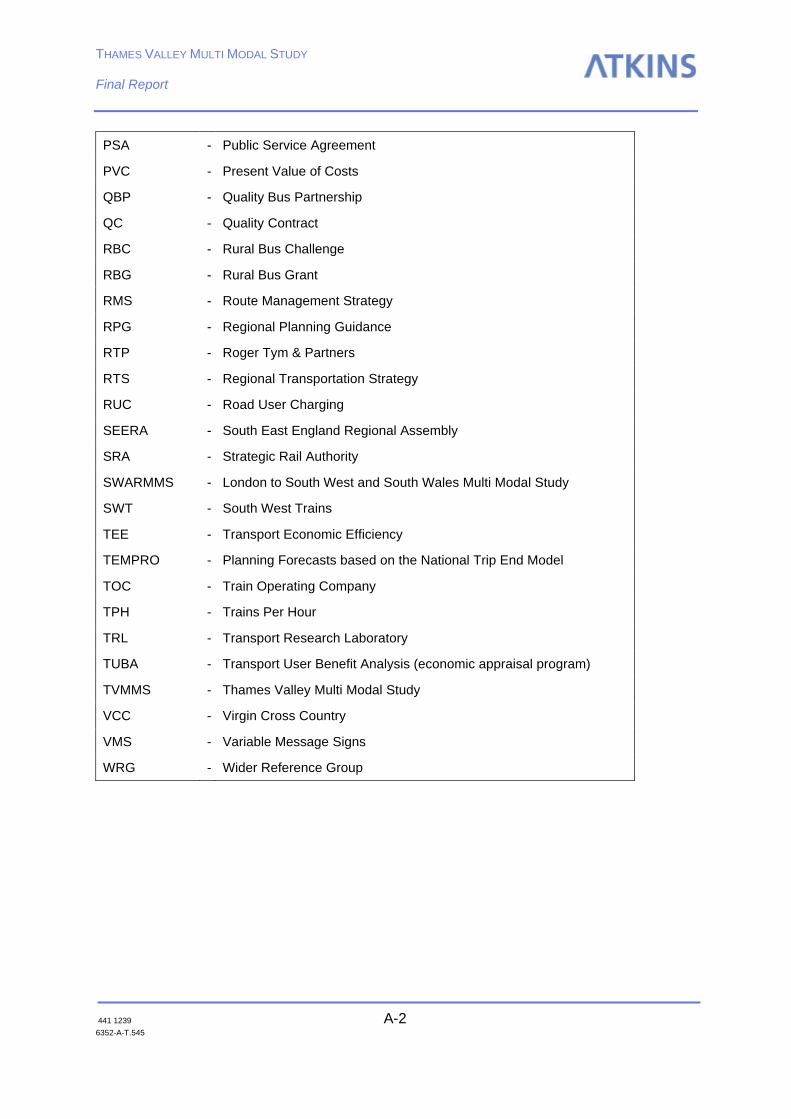
THAMES VALLEY MULTI MODAL STUDY Final Report
441 1239 A-2 6352-A-T.545
PSA - Public Service Agreement
PVC - Present Value of Costs
QBP - Quality Bus Partnership
QC - Quality Contract
RBC - Rural Bus Challenge
RBG - Rural Bus Grant
RMS - Route Management Strategy
RPG - Regional Planning Guidance
RTP - Roger Tym & Partners
RTS - Regional Transportation Strategy
RUC - Road User Charging
SEERA - South East England Regional Assembly
SRA - Strategic Rail Authority
SWARMMS - London to South West and South Wales Multi Modal Study
SWT - South West Trains
TEE - Transport Economic Efficiency
TEMPRO - Planning Forecasts based on the National Trip End Model
TOC - Train Operating Company
TPH - Trains Per Hour
TRL - Transport Research Laboratory
TUBA - Transport User Benefit Analysis (economic appraisal program)
TVMMS - Thames Valley Multi Modal Study
VCC - Virgin Cross Country
VMS - Variable Message Signs
WRG - Wider Reference Group