Thailand Ramindra – At Narong Expressway Construction
19
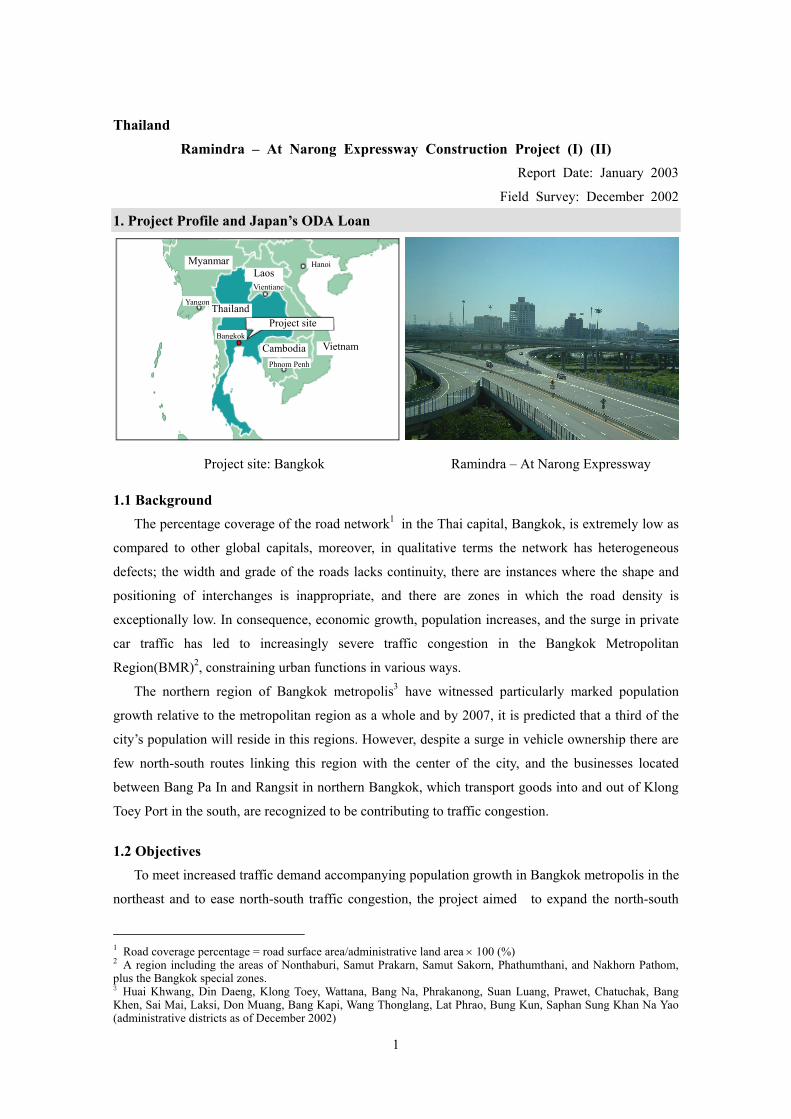
1 Thailand Ramindra – At Narong Expressway Construction Project (I) (II) Report Date: January 2003 Field Survey: December 2002 1. Project Profile and Japan’s ODA Loan Project site: Bangkok Ramindra – At Narong Expressway 1.1 Background The percentage coverage of the road network 1 in the Thai capital, Bangkok, is extremely low as compared to other global capitals, moreover, in qualitative terms the network has heterogeneous defects; the width and grade of the roads lacks continuity, there are instances where the shape and positioning of interchanges is inappropriate, and there are zones in which the road density is exceptionally low. In consequence, economic growth, population increases, and the surge in private car traffic has led to increasingly severe traffic congestion in the Bangkok Metropolitan Region(BMR) 2 , constraining urban functions in various ways. The northern region of Bangkok metropolis 3 have witnessed particularly marked population growth relative to the metropolitan region as a whole and by 2007, it is predicted that a third of the city’s population will reside in this regions. However, despite a surge in vehicle ownership there are few north-south routes linking this region with the center of the city, and the businesses located between Bang Pa In and Rangsit in northern Bangkok, which transport goods into and out of Klong Toey Port in the south, are recognized to be contributing to traffic congestion. 1.2 Objectives To meet increased traffic demand accompanying population growth in Bangkok metropolis in the northeast and to ease north-south traffic congestion, the project aimed to expand the north-south 1 Road coverage percentage = road surface area/administrative land area × 100 (%) 2 A region including the areas of Nonthaburi, Samut Prakarn, Samut Sakorn, Phathumthani, and Nakhorn Pathom, plus the Bangkok special zones. 3 Huai Khwang, Din Daeng, Klong Toey, Wattana, Bang Na, Phrakanong, Suan Luang, Prawet, Chatuchak, Bang Khen, Sai Mai, Laksi, Don Muang, Bang Kapi, Wang Thonglang, Lat Phrao, Bung Kun, Saphan Sung Khan Na Yao (administrative districts as of December 2002) Myanmar Laos Thailand Cambodia Vietnam Hanoi Bangkok Yangon Vientiane Phnom Penh Project site
Transcript of Thailand Ramindra – At Narong Expressway Construction
1
Thailand Ramindra – At Narong Expressway Construction Project (I) (II)
Report Date: January 2003
Field Survey: December 2002
1. Project Profile and Japan’s ODA Loan
Project site: Bangkok Ramindra – At Narong Expressway
1.1 Background The percentage coverage of the road network1 in the Thai capital, Bangkok, is extremely low as
compared to other global capitals, moreover, in qualitative terms the network has heterogeneous
defects; the width and grade of the roads lacks continuity, there are instances where the shape and
positioning of interchanges is inappropriate, and there are zones in which the road density is
exceptionally low. In consequence, economic growth, population increases, and the surge in private
car traffic has led to increasingly severe traffic congestion in the Bangkok Metropolitan
Region(BMR)2, constraining urban functions in various ways.
The northern region of Bangkok metropolis3 have witnessed particularly marked population
growth relative to the metropolitan region as a whole and by 2007, it is predicted that a third of the
city’s population will reside in this regions. However, despite a surge in vehicle ownership there are
few north-south routes linking this region with the center of the city, and the businesses located
between Bang Pa In and Rangsit in northern Bangkok, which transport goods into and out of Klong
Toey Port in the south, are recognized to be contributing to traffic congestion.
1.2 Objectives To meet increased traffic demand accompanying population growth in Bangkok metropolis in the
northeast and to ease north-south traffic congestion, the project aimed to expand the north-south
1 Road coverage percentage = road surface area/administrative land area × 100 (%) 2 A region including the areas of Nonthaburi, Samut Prakarn, Samut Sakorn, Phathumthani, and Nakhorn Pathom, plus the Bangkok special zones. 3 Huai Khwang, Din Daeng, Klong Toey, Wattana, Bang Na, Phrakanong, Suan Luang, Prawet, Chatuchak, Bang Khen, Sai Mai, Laksi, Don Muang, Bang Kapi, Wang Thonglang, Lat Phrao, Bung Kun, Saphan Sung Khan Na Yao (administrative districts as of December 2002)
Myanmar Laos
Thailand
Cambodia Vietnam
Hanoi
Bangkok
Yangon
Vientiane
Phnom Penh
Project site
2
expressway network as far as the northeast region.
1.3 Project Scope The project comprised the construction of a toll-expressway linking central Bangkok and the
northeast of the city that would connect with the First Stage Expressway and the Second Stage
Expressway, forming part of the expressway network. It was implemented in two phases, the first
covering the section between Ramindra and the Rama IX Interchange, the second that between the
Rama IX Interchange and At Narong. The yen loan provided for all foreign currency costs in Phase I,
and all foreign currency costs, all local currency costs for consulting services and part of the civil
engineering works costs in Phase II.
Table 1: Full Project Outline
Item Phase I Phase II (1) Expressway (toll) Section: Ramindra-Rama IX
Interchange Extension: 11.5km No. of lanes: 6
Section: Rama IX Interchange-At Narong Extension: 7.2km No. of lanes: 6
(2) Interchanges 1 2 (3) Slip ramps 4 3 (4) Consulting services Tender evaluation assistance and construction supervision
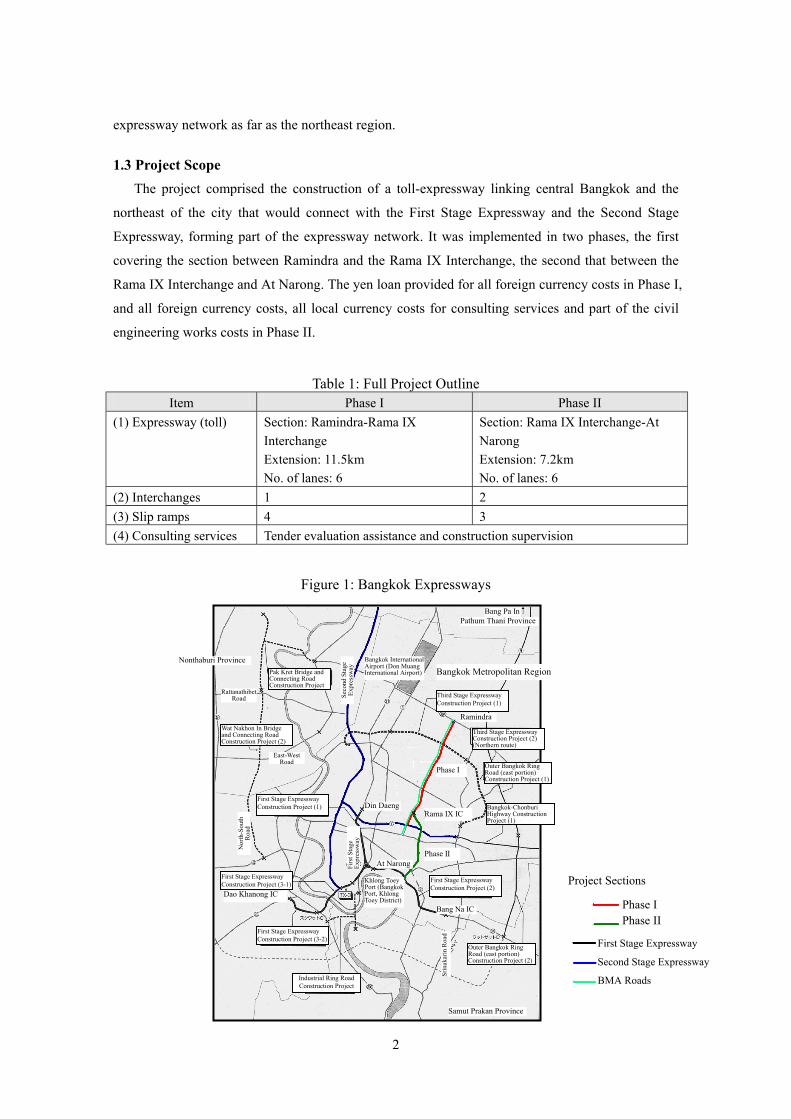
Figure 1: Bangkok Expressways
Project Sections
Phase I Phase II
First Stage Expressway
Second Stage Expressway
BMA Roads
Bangkok Metropolitan Region
Pathum Thani Province Bang Pa In
Samut Prakan Province
Nonthaburi Province
Ramindra
At Narong
Din Daeng Rama IX IC
Bang Na IC
Phase I
Phase II
Khlong Toey Port (Bangkok Port, Khlong Toey District)
Bangkok International Airport (Don Muang International Airport)
Dao Khanong IC
Outer Bangkok Ring Road (east portion) Construction Project (2)
Outer Bangkok Ring Road (east portion) Construction Project (1)
Bangkok-Chonburi Highway Construction Project (1)
Industrial Ring Road Construction Project
Pak Kret Bridge and Connecting Road Construction Project
Wat Nakhon In Bridge and Connecting Road Construction Project (2)
First Stage Expressway Construction Project (1)
First Stage Expressway Construction Project (2)
First Stage Expressway Construction Project (3-1)
First Stage Expressway Construction Project (3-2)
Firs
t Sta
ge
Expr
essw
ay
Seco
nd S
tage
Ex
pres
sway
Third Stage Expressway Construction Project (2) (Northern route)
Third Stage Expressway Construction Project (1)
Nor
th-S
outh
R
oad
East-West Road
Rattanathibet Road
Srin
akar
in R
oad
3
1.4 Borrower/Executing Agency
Expressway and Rapid Transit Authority of Thailand (ETA)
1.5 Outline of Loan Agreement Item Phase I Phase II
Loan Amount Loan Disbursed Amount
14,804 million yen 10,493 million yen
21,850 million yen 15,388 million yen
Exchange of Notes Loan Agreement
August 1991 September 1991
December 1992 January 1993
Terms and Conditions -Interest Rate -Repayment Period (Grace Period) -Procurement
3.0%
25 years (7 years)
General untied Final Disbursement Date January 1998 May 2000
2. Results and Evaluation
2.1 Relevance At appraisal, the Thai government had formulated measures to alleviate traffic congestion and
was prioritizing the road sector as an important means of promoting regional economies and of
contributing to export promotion under the Sixth National Economic and Social Development Plan
(1987-1991), thus the project was relevant in that it was consistent with national policy.
Between 1982 and 1988, the population in the target region grew at an average rate of 5.2% per
annum, which was well above the 1.6% growth rate for the metropolitan region, and average annual
increases in vehicle registration, at 17.2%, were also exceptionally high leading to forecasts for
future traffic congestion. Accordingly, the planned construction, which would expand roads within a
low-density 10km mesh4, was compatible with these growing needs.
Although it was anticipated that the project would meet these needs, it has not fully functioned in
achieving this end, thus at this stage it would be difficult to judge that the plans were highly
relevant. Two reasons may be cited in this connection. In the first instance, Bangkok Metropolitan
Administration (BMA) applied expressway grade5 to the toll-free side road that was constructed
concurrently with and parallel to the section constructed under Phase I of this project, which had a
major affect on the project’s outcome6. In the second instance, the northern end of the section was
not linked to another expressway but to the Ramindra Road, which has a relatively high traffic
4 A region divided into grids at fixed intervals. 5 Planned to have “6 lanes and 1 elevated interchange out of a total 3”, later revised to “2 elevated interchanges”. 6 According to ETA and BMA, problems acquiring land for the potential route (4-4.5km) of the Ekamai-Ramindra Road (a BMA road), which was planned in 1979, resulted in a 1986 Cabinet decision establishing the final route on a 5.5km area (the current position) where land was relatively easy to acquire. With the plans to construct the Ramindra-At Narong expressway along the same route, the Ekamai-Ramindra road was then positioned as a side road. In 1989, instead of the Thai government absorbing the costs of land acquisition, the Cabinet passed a resolution appointing ETA as the executing agency charged with the implementation of everything from land acquisition through construction management, inclusive of the BMA side road. BMA shouldered the construction costs for the side road.
4
density, thus the use of the project road yielded only limited travel time savings7.
With regard to the first reason, had the respective executing agencies sufficiently coordinated
their respective plans, it is believed that the plans for this project could have been modified. With the
second issue, it is perceived that a network, that encompasses the entire metropolitan road system,
has to be established8.
2.2 Efficiency
2.2.1 Project Scope The project scope comprised construction of an 18.7km toll-expressway between Ramindra and
At Narong, construction of interchanges and slip ramps and the provision of consulting services, and
was divided into two phases with both being implemented essentially as per the plans.
2.2.2 Implementation Schedule Phase I appraisal plans (March 1991) envisaged the total implementation schedule (from
consultant selection through Phase II completion) to span 52 months between May 1991 and
September 1995, however, as a result of the Phase II appraisal (January 1993), this was revised to 61
months, with completion scheduled for June 1996.
Consultant selection actually took place in August 1992. Under the initial plans the expressway
was to be opened to traffic upon completion, but the route was actually opened with part of the work
still incomplete in October 1996. This would indicate delays of several months as compared to the
Phase II appraisal plans, however, according to ETA, the delays may be attributed to hold-ups in
consultant selection procedures and the time needed for land acquisition.
Consultants were initially to be selected via direct contracting, however, general competitive
bidding was undertaken with the aim of appointing a contractor with greater technical capacity, and
this necessitated time-consuming preliminary screening. Moreover, revisions to the Act on
Expropriation of Immovable Property caused a surge in land acquisition costs leading to difficulties
in fund procurement, and rendering it necessary to respond to complaints filed by deed holders
against unacceptable levels of compensation.
These factors combined to push back the opening of the expressway by several months and work
was finally completed in April 2000, i.e. an increase of 40 months on the Phase I plans and of 31
months on the Phase II plans. The major delays between the opening of the route to traffic and actual
7 There are plans to build an expressway (9.5km) linking the Ramindraa-Atnarong route with the Eastern Outer Ring Road. A 1997 F/S projected that this extension would increase traffic on the Ramindra-At Narong route to 52,448 vehicles/day (2011) and it was anticipated that the role of the project would increase upon completion of the extension. However, although ETA’s 2002 plans envisage land acquisition to commence in 2007 and for construction to be completed in 2011, priority has in fact been assigned to the Third Stage Expressway, a Mega Project, and the construction start date has yet to be determined. 8 At appraisal, national/provincial roads, local roads, municipal roads, and expressways were respectively under the jurisdiction of the Department of Highways of the Ministry of Transport and Communications, the Public Works Department of the Ministry of Interior, BMA and ETA, and there was no organization or master plan serving to coordinate the activities of the respective bodies. The Office of the Commission for the Management of Land Traffic (OCMLT) was subsequently established in 1992.
5
completion of the work were caused by hold-ups in the construction of the Rama IX Interchange.
These can predominantly be attributed to protracted negotiations with Bangkok Expressway Co., Ltd.
(BECL)9 regarding the defrayal of construction costs for the ramp that was to connect with the
Second Stage Expressway10. The extension (Section D) to the Second Stage Expressway was finally
completed in March 2000, with the link being completed in April of the same year.
2.2.3 Project Cost Under Phase I appraisal plans, total project costs were set at 74,048 million yen (Phase I: 37,971
million yen; Phase II: 36,077 million yen) with the yen loan to cover 28,973 million yen, i.e. all
foreign currency costs or approximately 39.1% (Phase I: 14,804 million yen; Phase II: 14,169
million yen) and the remaining 45,075 million yen to be covered by the Thai budget. However,
changes to the methods of evaluating the land acquisition costs and compensation in June 199111
pushed costs up, with the result that project costs were revised to a total of 98,343 million yen (Phase
I: 46,286 million yen; Phase II: 52,057 million yen) with the yen loan to cover approximately 37.3%
or 36,654 million yen (foreign currency portion: 27,524 million yen; local currency portion: 9,130
million yen) and the remaining 61,689 million yen to be shouldered by the Thai side.
Total project costs actually amounted to 162,851 million yen, with the yen loan covering
approximately 15.3% or 25,853 million yen (Phase I: 10,481 million yen; Phase II: 15,372 million
yen) and 136,998 million yen being defrayed by the Thai side. The yen loan was used to pay all
foreign currency costs during Phases I and II. The huge overrun relative to the Phase II appraisal was
predominantly the result of the surge in land acquisition and compensation costs. These costs
escalated from the 43,634 million yen (8,556 million baht) planned at Phase II appraisal, to 125,037
million yen (24,000 million baht). Moreover, although it was not possible to confirm whether the
portion of costs for the construction of the BMA road had been excluded from the final figure, even
with the BMA portion included the initial projection was for 81,597 million yen (16,000 million
baht), thus there is no question that this was the primary cause of the cost overrun.
As the above demonstrates, given that project implementation was subject to major delays and
the burden of land acquisition costs increased excessively, it would be difficult to aver that the
project had a high overall level of efficiency.
9 BECL is a private company that operates the Second Stage Expressway under the Build Operate Transfer (BOT) system. BECL shoulders the costs of construction and operation and shares any profits with ETA. 10 According to BECL they had no prior knowledge of the plans to connect the road and thus no obligation to defray the cost. Strong calls from ETA resulted in their ultimately shouldering part of the cost of the ramp. In exchange, ETA forfeited its share of the profits from the Second Stage Expressway (Section D). 11 With economic development being accompanied by a surge in land prices in the Bangkok Metropolitan Region, there was a huge gap between the existing ratable value for property taxes, used as the basis for land and compensation calculations, and current market prices, which was hindering land acquisition negotiations. This led to the revision of the Act on Expropriation of Immovable property in 1991 under which current market prices were to be employed as the basis for calculating the value of land to be acquired.
6
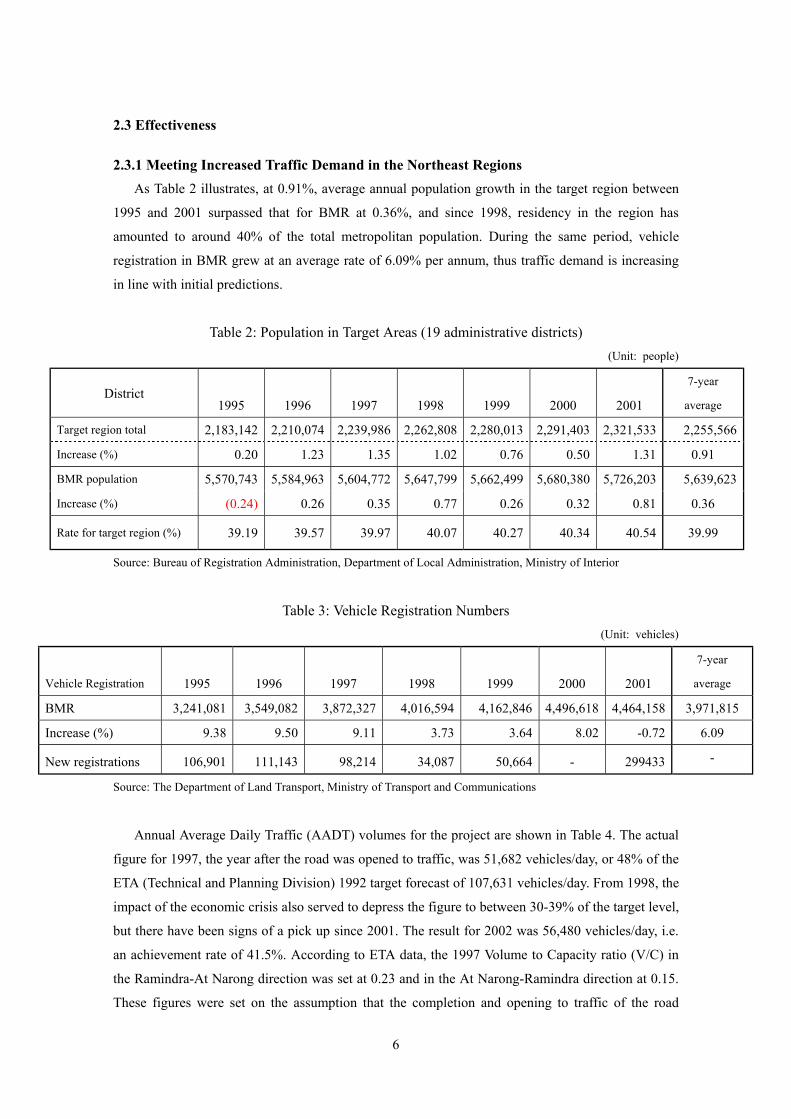
2.3 Effectiveness
2.3.1 Meeting Increased Traffic Demand in the Northeast Regions As Table 2 illustrates, at 0.91%, average annual population growth in the target region between
1995 and 2001 surpassed that for BMR at 0.36%, and since 1998, residency in the region has
amounted to around 40% of the total metropolitan population. During the same period, vehicle
registration in BMR grew at an average rate of 6.09% per annum, thus traffic demand is increasing
in line with initial predictions.
Table 2: Population in Target Areas (19 administrative districts)
(Unit: people)
District 1995 1996 1997 1998 1999 2000 2001
7-year
average
Target region total 2,183,142 2,210,074 2,239,986 2,262,808 2,280,013 2,291,403 2,321,533 2,255,566
Increase (%) 0.20 1.23 1.35 1.02 0.76 0.50 1.31 0.91
BMR population 5,570,743 5,584,963 5,604,772 5,647,799 5,662,499 5,680,380 5,726,203 5,639,623
Increase (%) (0.24) 0.26 0.35 0.77 0.26 0.32 0.81 0.36
Rate for target region (%) 39.19 39.57 39.97 40.07 40.27 40.34 40.54 39.99
Source: Bureau of Registration Administration, Department of Local Administration, Ministry of Interior
Table 3: Vehicle Registration Numbers
(Unit: vehicles)
Vehicle Registration 1995 1996 1997 1998 1999 2000 2001
7-year
average
BMR 3,241,081 3,549,082 3,872,327 4,016,594 4,162,846 4,496,618 4,464,158 3,971,815
Increase (%) 9.38 9.50 9.11 3.73 3.64 8.02 -0.72 6.09
New registrations 106,901 111,143 98,214 34,087 50,664 - 299433 -
Source: The Department of Land Transport, Ministry of Transport and Communications
Annual Average Daily Traffic (AADT) volumes for the project are shown in Table 4. The actual
figure for 1997, the year after the road was opened to traffic, was 51,682 vehicles/day, or 48% of the
ETA (Technical and Planning Division) 1992 target forecast of 107,631 vehicles/day. From 1998, the
impact of the economic crisis also served to depress the figure to between 30-39% of the target level,
but there have been signs of a pick up since 2001. The result for 2002 was 56,480 vehicles/day, i.e.
an achievement rate of 41.5%. According to ETA data, the 1997 Volume to Capacity ratio (V/C) in
the Ramindra-At Narong direction was set at 0.23 and in the At Narong-Ramindra direction at 0.15.
These figures were set on the assumption that the completion and opening to traffic of the road
7
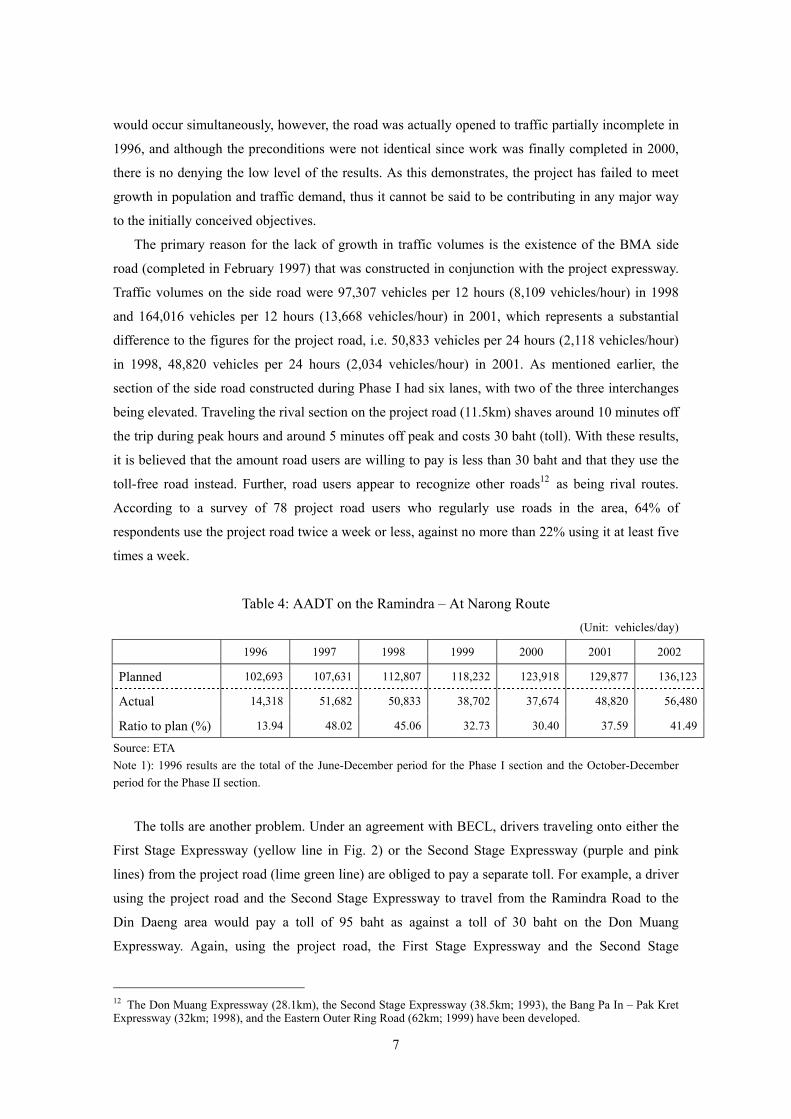
would occur simultaneously, however, the road was actually opened to traffic partially incomplete in
1996, and although the preconditions were not identical since work was finally completed in 2000,
there is no denying the low level of the results. As this demonstrates, the project has failed to meet
growth in population and traffic demand, thus it cannot be said to be contributing in any major way
to the initially conceived objectives.
The primary reason for the lack of growth in traffic volumes is the existence of the BMA side
road (completed in February 1997) that was constructed in conjunction with the project expressway.
Traffic volumes on the side road were 97,307 vehicles per 12 hours (8,109 vehicles/hour) in 1998
and 164,016 vehicles per 12 hours (13,668 vehicles/hour) in 2001, which represents a substantial
difference to the figures for the project road, i.e. 50,833 vehicles per 24 hours (2,118 vehicles/hour)
in 1998, 48,820 vehicles per 24 hours (2,034 vehicles/hour) in 2001. As mentioned earlier, the
section of the side road constructed during Phase I had six lanes, with two of the three interchanges
being elevated. Traveling the rival section on the project road (11.5km) shaves around 10 minutes off
the trip during peak hours and around 5 minutes off peak and costs 30 baht (toll). With these results,
it is believed that the amount road users are willing to pay is less than 30 baht and that they use the
toll-free road instead. Further, road users appear to recognize other roads12 as being rival routes.
According to a survey of 78 project road users who regularly use roads in the area, 64% of
respondents use the project road twice a week or less, against no more than 22% using it at least five
times a week.
Table 4: AADT on the Ramindra – At Narong Route
(Unit: vehicles/day)
1996 1997 1998 1999 2000 2001 2002
Planned 102,693 107,631 112,807 118,232 123,918 129,877 136,123
Actual 14,318 51,682 50,833 38,702 37,674 48,820 56,480
Ratio to plan (%) 13.94 48.02 45.06 32.73 30.40 37.59 41.49
Source: ETA Note 1): 1996 results are the total of the June-December period for the Phase I section and the October-December period for the Phase II section.
The tolls are another problem. Under an agreement with BECL, drivers traveling onto either the
First Stage Expressway (yellow line in Fig. 2) or the Second Stage Expressway (purple and pink
lines) from the project road (lime green line) are obliged to pay a separate toll. For example, a driver
using the project road and the Second Stage Expressway to travel from the Ramindra Road to the
Din Daeng area would pay a toll of 95 baht as against a toll of 30 baht on the Don Muang
Expressway. Again, using the project road, the First Stage Expressway and the Second Stage
12 The Don Muang Expressway (28.1km), the Second Stage Expressway (38.5km; 1993), the Bang Pa In – Pak Kret Expressway (32km; 1998), and the Eastern Outer Ring Road (62km; 1999) have been developed.

8
Expressway to travel between Din Daeng and Bang Na costs 135 baht as compared to 40 baht for
solo use of the First Stage Expressway, i.e. using the project road costs upwards of three times more
on both routes. Moreover, the project road is also more expensive per kilometer at 3 baht, as against
1 baht on the Eastern Outer Ring Road.
Figure 3: Bangkok Expressway Network
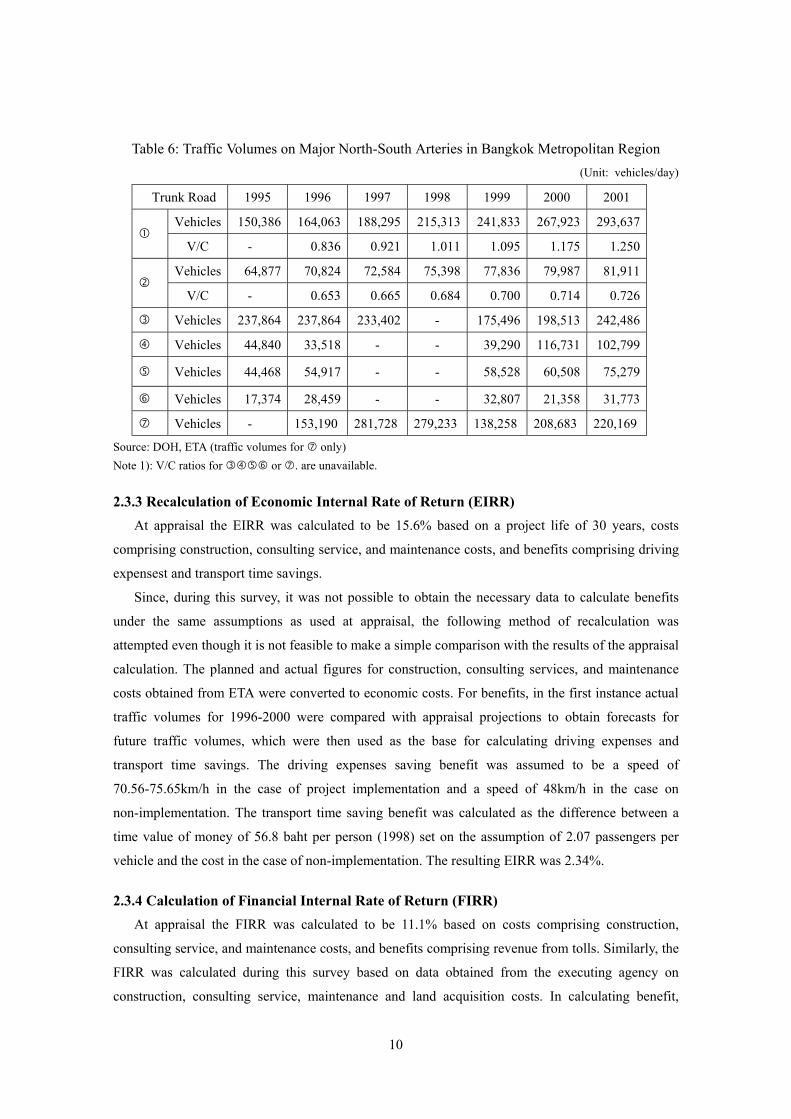
2.3.2 Easing Traffic Congestion on North-South Roads in Bangkok Metropolitan Region Congestion conditions between 1995 and 2001 on the following seven routes of the main traffic
arteries and northeast trunk roads are as shown in Table 6.
Route 1 (Bang Pa In-Rangsit: Bang Pa In-Rangsit Road)
Route 1 (Rangsit-Bangkok: Phahonyothin Road)
Route 31 (Rangsit-Viphavadi: Viphavadi-Rangsit Road)
Route 304 (Ramindra Road)
Route 3202 (Ramindra-Lad Phrao: Sukhaphiban 1 Road)
Route 3278 (Minburi-Lad Phrao: Sukhaphiban 2 Road)
Second Stage Expressway
Since the project road was opened to traffic, overall AADT volumes on the main traffic arteries
( ) have been trending upwards. The V/C ratio between Bang Pa In and Rangsit Road
Don Muang Expressway
Route 31
Route 1
Ramindra Road (Route 304)
Bang Na IC
Din Daeng IC Rama IX IC
At Narong IC
Ramindra – At Narong Route

9
increased from 0.921 in 1997 to 1.250 in 2001, and on the Phahonyothin Road from 0.665 to 0.726;
i.e. traffic conditions are deteriorating on both roads. Given that the Department of Highways (DOH)
considers a V/C ratio in excess of 0.8 to indicate “congestion”, the Bang Pa In-Rangsit Road can be
considered severely congested. Meanwhile, although there has been no serious traffic congestion on
the trunk roads contiguous to the project region ( ), recent development in the region has
reportedly been accompanied by growth in traffic volumes. Specifically, traffic on the Ramindra
Road increased from 39,290 vehicles in 1999 to 116,731 vehicle in 2000, or a year-on-year increase
of 192%.
As the above indicates, congestion on trunk roads in the Bangkok Metropolitan Region has not
been alleviated to the extent initially anticipated, and it is believed that it will be necessary to wait
for the formation of an expressway network before this level of congestion can be eased.
Ramindra – At Narong Route
Bang Pa In-Rangsit Road (Route 1)
Phahonyothin Road (Route 1)
Viphavadi-Rangsit Road (Route 31)
Ramindra Road (Route 304)
Sukhaphiban 1 Road (Route 3202) Sukhaphiban 2 Road (Route 3278)
10
Table 6: Traffic Volumes on Major North-South Arteries in Bangkok Metropolitan Region
(Unit: vehicles/day)
Trunk Road 1995 1996 1997 1998 1999 2000 2001
Vehicles 150,386 164,063 188,295 215,313 241,833 267,923 293,637
V/C - 0.836 0.921 1.011 1.095 1.175 1.250
Vehicles 64,877 70,824 72,584 75,398 77,836 79,987 81,911
V/C - 0.653 0.665 0.684 0.700 0.714 0.726
Vehicles 237,864 237,864 233,402 - 175,496 198,513 242,486
Vehicles 44,840 33,518 - - 39,290 116,731 102,799
Vehicles 44,468 54,917 - - 58,528 60,508 75,279
Vehicles 17,374 28,459 - - 32,807 21,358 31,773
Vehicles - 153,190 281,728 279,233 138,258 208,683 220,169
Source: DOH, ETA (traffic volumes for only) Note 1): V/C ratios for or . are unavailable.
2.3.3 Recalculation of Economic Internal Rate of Return (EIRR) At appraisal the EIRR was calculated to be 15.6% based on a project life of 30 years, costs
comprising construction, consulting service, and maintenance costs, and benefits comprising driving
expensest and transport time savings.
Since, during this survey, it was not possible to obtain the necessary data to calculate benefits
under the same assumptions as used at appraisal, the following method of recalculation was
attempted even though it is not feasible to make a simple comparison with the results of the appraisal
calculation. The planned and actual figures for construction, consulting services, and maintenance
costs obtained from ETA were converted to economic costs. For benefits, in the first instance actual
traffic volumes for 1996-2000 were compared with appraisal projections to obtain forecasts for
future traffic volumes, which were then used as the base for calculating driving expenses and
transport time savings. The driving expenses saving benefit was assumed to be a speed of
70.56-75.65km/h in the case of project implementation and a speed of 48km/h in the case on
non-implementation. The transport time saving benefit was calculated as the difference between a
time value of money of 56.8 baht per person (1998) set on the assumption of 2.07 passengers per
vehicle and the cost in the case of non-implementation. The resulting EIRR was 2.34%.
2.3.4 Calculation of Financial Internal Rate of Return (FIRR) At appraisal the FIRR was calculated to be 11.1% based on costs comprising construction,
consulting service, and maintenance costs, and benefits comprising revenue from tolls. Similarly, the
FIRR was calculated during this survey based on data obtained from the executing agency on
construction, consulting service, maintenance and land acquisition costs. In calculating benefit,

11
actual traffic volumes were used as the basis for calculating future toll revenue on the assumption
that traffic volumes would increase progressively until the road reached capacity. The resulting FIRR
was a minus figure.
2.4 Impact
2.4.1 Promoting Domestic and Export Industries in North and Northeastern Districts of Bangkok Metropolitan Region
Although not expressly anticipated at the time of appraisal, one of the project’s impacts has been
to promote domestic and export industries in north and northeastern districts of the Bangkok
Metropolitan Region. In interviews with export companies located in the Rangsit, Nava Nakorn, and
Bang Pa In Industrial Parks in northern Bangkok, many of those questioned stated that they felt the
project road had played a minor role as a goods transport route for companies in the north of the city,
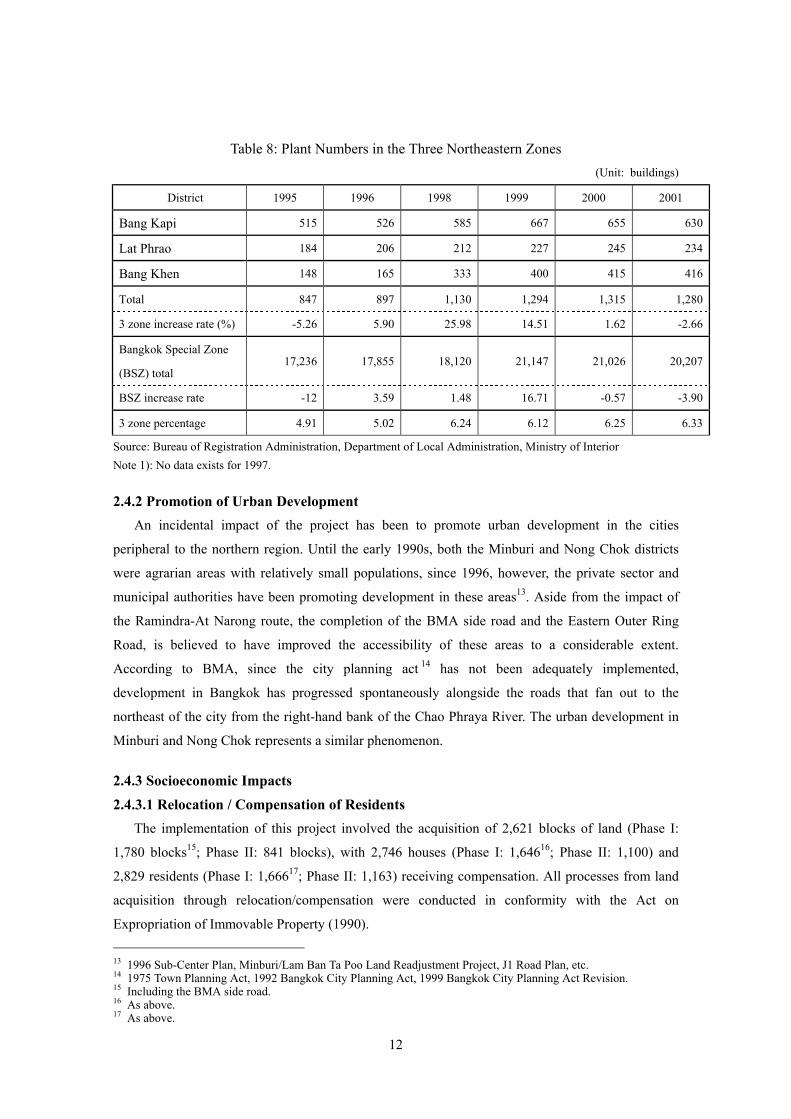
thus the project’s contribution has been limited. However, as Tables 7 and 8 evidence, in the Bang
Khen, Bang Kapi and Lat Phrao areas contiguous to the phase I section incontrovertible changes
have been observed in populations and plant numbers. Nevertheless, given the low goal attainment
rate of the project, it may be said that it has had limited effect on these factors.
Table 7: Populations in the Three Northeastern Zones
(Unit: people)
District 1995 1996 1997 1998 1999 2000 2001
Bang Khen 302,953 311,766 365,321 377,995 386,308 393,591 404,042
Bang Kapi 280,988 284,935 309,788 315,895 320,539 323,694 329,730
Lat Phrao 135,128 138,467 105,158 106,704 107,372 108,125 109,619
3 zone total 719,069 735,168 780,267 800,594 814,219 825,410 843,391
3 zone increase rate (%) - 2.24 6.13 2.61 1.70 1.37 2.18
Increase rate in project
zones 0.20 1.23 1.35 1.02 0.76 0.50 1.31
BMR population 5,570,743 5,584,963 5,604,772 5,647,799 5,662,499 5,680,380 5,726,203
BMR increase rate (0.24) 0.26 0.35 0.77 0.26 0.32 0.81
3 zone percentage 12.91 13.16 13.92 14.18 14.38 14.53 14.73
Source: Bureau of Registration Administration, Department of Local Administration, Ministry of Interior Note 1): The Bang Khen and Bang Kapi zones have been separated since 1998, however, the table was compiled on the basis of pre-1997 administrative districts.
12
Table 8: Plant Numbers in the Three Northeastern Zones (Unit: buildings)
District 1995 1996 1998 1999 2000 2001
Bang Kapi 515 526 585 667 655 630
Lat Phrao 184 206 212 227 245 234
Bang Khen 148 165 333 400 415 416
Total 847 897 1,130 1,294 1,315 1,280
3 zone increase rate (%) -5.26 5.90 25.98 14.51 1.62 -2.66
Bangkok Special Zone
(BSZ) total 17,236 17,855 18,120 21,147 21,026 20,207
BSZ increase rate -12 3.59 1.48 16.71 -0.57 -3.90
3 zone percentage 4.91 5.02 6.24 6.12 6.25 6.33
Source: Bureau of Registration Administration, Department of Local Administration, Ministry of Interior Note 1): No data exists for 1997.
2.4.2 Promotion of Urban Development An incidental impact of the project has been to promote urban development in the cities
peripheral to the northern region. Until the early 1990s, both the Minburi and Nong Chok districts
were agrarian areas with relatively small populations, since 1996, however, the private sector and
municipal authorities have been promoting development in these areas13. Aside from the impact of
the Ramindra-At Narong route, the completion of the BMA side road and the Eastern Outer Ring
Road, is believed to have improved the accessibility of these areas to a considerable extent.
According to BMA, since the city planning act 14 has not been adequately implemented,
development in Bangkok has progressed spontaneously alongside the roads that fan out to the
northeast of the city from the right-hand bank of the Chao Phraya River. The urban development in
Minburi and Nong Chok represents a similar phenomenon.
2.4.3 Socioeconomic Impacts 2.4.3.1 Relocation / Compensation of Residents
The implementation of this project involved the acquisition of 2,621 blocks of land (Phase I:
1,780 blocks15; Phase II: 841 blocks), with 2,746 houses (Phase I: 1,64616; Phase II: 1,100) and
2,829 residents (Phase I: 1,66617; Phase II: 1,163) receiving compensation. All processes from land
acquisition through relocation/compensation were conducted in conformity with the Act on
Expropriation of Immovable Property (1990). 13 1996 Sub-Center Plan, Minburi/Lam Ban Ta Poo Land Readjustment Project, J1 Road Plan, etc. 14 1975 Town Planning Act, 1992 Bangkok City Planning Act, 1999 Bangkok City Planning Act Revision. 15 Including the BMA side road. 16 As above. 17 As above.

13
2.4.3.2 Environmental Impacts Observed data from noise, vibration and air pollution monitoring undertaken at five sites18 are as
shown in Table 9. All figures are below the thresholds stipulated by the Pollution Control
Department of the Ministry of Natural Resources and Environment, and at present any impact on the
environment is limited. In view of the fact that the burden on the environment is expected to increase
with future growth in traffic volumes, however, it is crucial that monitoring continue to be
undertaken conscientiously.
Table 9-1: Ramindra-At Narong Environmental Monitoring Status (noise/vibration)
Noise Vibration Leq(24hr)dBA (mm/scc) Monitoring site
1998 2000 2001 1998 2000 2001
Saunrat School 57.53 55.60 57.00 0.835-2.117 0.889-1.520 0.425-1.720
Tararom Village 58.51 52.40 55.30 0.552-0.641 0.298-0.432 0.345-0.465
Orchid Villa Village 55.90 69.20 69.40 0.432-0.522 1.020-2.030 0.375-0.900
Khong Song Kathiam School 64.48 64.10 63.50 0.552-0.641 0.239-0.701 0.275-0.425
Soi Yu Yen 68.81 69.20 62.20 1.163-1.297 1.020-2.920 0.450-1.550
Threshold 70
Source: ETA
Table 9-2: Ramindra-At Narong Environmental Monitoring Status (air pollution)
Air pollution
TSP 24 hr (mg/m3) NO2 1hr (mg/m3) SO2 1hr (mg/m3) Monitoring site
1998 2000 2001 1998 2000 2001 1998 2000 2001
Saunrat School 0.100 0.095 0.083 0.016 0.018 0.015 0.020 0.012 0.010
Tararom Village 0.083 0.082 0.054 0.016 0.025 0.013 0.019 0.019 0.011
Orchid Villa Village 0.085 0.094 0.074 0.017 0.030 0.023 0.027 0.027 0.009
Khong Song
Kathiam School 0.094 0.127 0.076 0.014 0.040 0.019 0.019 0.019 0.009
Soi Yu Yen 0.156 0.078 0.088 0.024 0.040 0.017 0.025 0.025 0.010
Threshold 0.330 0.320 0.780
Source: ETA
18 The following five schools/residential areas located alongside the Ramindra-At Narong route. Saunrat School, Tararom Village, Orchid Villa Village, Khong Song Kathiam school, Soi Yu Yen
14
2.5 Sustainability The expressway is managed via a system comprising a hub control center and 34 trans-control
units, which are capable of providing round-the-clock emergency response. Pavement, ramps and
toll plazas are all in extremely good condition.
In order to ensure the sustainability of project facility operation and maintenance, it is necessary
to guarantee a minimum of 25 engineers and workers with a standard level of technical ability and to
continue implementing appropriate management and facilities inspections. It is also essential that
sufficient financial capability to support these activities be guaranteed.
2.5.1 Organizational Capability ETA is a public company that was established in November 1972 under the ETA Establishment
Act; it is wholly capitalized by the Thai government.
In line with the October 1, 2002 reorganization of ministries and agencies into one cabinet
office, 19 ministries and 162 offices/agencies, jurisdiction over ETA was changed from the Ministry
of Interior to the Ministry of Transport and Communications. ETA’s mandate is to undertake the
planning, implementation and maintenance of five expressways19 and mass rapid transit systems
outside the Bangkok Metropolitan Region. ETA having unitary control over the toll roads that have
been under DOH jurisdiction to date is currently under planning. As of December 2002, ETA
comprised ten departments and three units, and employed 3,388 personnel.
Expressway management is the responsibility of 165 personnel within the Maintenance
Department, Expressway Maintenance Division. Of these, 19 staff members employed in
Expressway Inspection & Maintenance Section 1 are in charge of the project road. This section is
hoping to have secured the required 25 personnel quota by 2004, however, since ETA has been
adopting policies to curb staff since 1997, it may prove difficult to achieve this goal.
2.5.2 Technical Capacity Maintenance is undertaken systematically using a combination of the inspection/maintenance
information database and the various manuals (inspection, maintenance, repairs, system use)
outlined below.
(1) Where damage is identified as the result of various inspections (routine, normal, special,
emergency), information on the grade of the damage, the need for emergency repair and/or
special inspection, and so forth is entered into a database. Inspection/repair plans are
formulated on the basis of this information, with the plans serving as the base for
maintenance activities.
(2) The manual in use was compiled during a 1994 JICA study20. The manuals contain details
19 Stage I (1981, 1983, 1987), Stage II (1993, 1996, 2000), Ramindra-At Narong (1996), Bang Pa In-Pak Kret (1998,1999), Bang Na-Chon Buri (2000) 20 The study on Inspection and Maintenance Systems for the Expressway in the Kingdom of Thailand (1994)
15
on the various inspection methods and procedures, damage ratings, safety management,
environmental measures and so forth.
(3) Maintenance is undertaken on the basis of the manual compiled during the 2000 JBIC
“Special Assistance for Project Sustainability Study on the Maintenance System for Yen
Loan Facilities (concrete/steel structures).
According to the executing agency, there are no notable technical problems with maintenance.
As mentioned above, not only is maintenance work undertaken systematically, the experience
accumulated during the long years of the First Stage Expressway (1978-1988 Yen Loan Project) is
also a major factor. However, given that training for younger personnel and programs on special
maintenance techniques are not being provided on a periodic basis due to staff shortages, the
maintenance status is considered insufficient from the long-term perspective. To address this, there
are plans to promote participation in external seminars and to invite external lecturers or other
provisional measures.
2.5.3 Financial Status In terms of ETA’s earnings status since project completion, as Table 10 evidences, although the
organization posted ordinary profits of 573 million baht and 340 million baht in 1996 and 1997,
respectively, it has been bleeding red ink in the three year period from 1998 to 2000, with losses of
70 million baht, 4,161 million baht, and 650 million baht, respectively. This is attributed to sagging
profits due to a slowdown in the use of some expressways and an increase in non-operating expenses.
This means interest payments on loans, which are non-operating expenses, have been increasing as a
result of large-scale investments in construction and the currency crisis, and it is also evident that
ETA is crippled by excess liabilities accounting for between 31.9% and 205% of sales. Increases in
fixed assets during the 1990s are covered by long-term borrowings. For example, government and
domestic loans taken out in 2001 respectively amount to some 340 months and 262 months of
earnings, which poses a major burden on the organization’s finances. In terms of this project, 7,136
million yen of the 35,682 million yen construction costs were supplied via an interest-free
government loan, however, the interest payments on the yen loan portion of 21,409 million yen at
3%, and on the domestic loan portion of 7,136 million yen at 11% represent a considerable burden.
By comparison, ETA’s liquidity ratio is low at 20.9% (2001) and has fallen dramatically against its
pre-appraisal level of 193% (1989), and this has seriously diminished its ability to debts repayment.
On the other hand, its debt-equity-ratiohas maintained atat least 19%, which would seem to indicate
the absence of any notable problems. However, this is the result of an injection of 7,867 million baht
in 1996, thus ETA’s financial status cannot be said to be stable. ETA is currently progressing with
Third Stage Expressway construction and Mega Project planning, and it is believed that further
capital injections will be necessary.

16
Table 10: Earnings Statement
(Unit: million Baht)
1996 1997 1998 1999 2000 2001
Operating income (tolls) 1,892.42 2,683.89 2,403.78 2,757.36 3,211.44 3,454.94
Operating expenses 1,475.73 2,245.03 2,444.20 6,847.31 1,699.39 1,953.48
Operating profit 416.69 438.86 -40.42 -4,089.96 1,512.05 1,501.46
Non-operating profit 156.81 -99.09 -29.63 -71.58 -2,162.97 -1,289.86
Non-operating income 156.81 3,107.01 177.90 135.95 145.25 95.13
Interest income 114.70 86.85 14.22 8.47
Govn. subsidy 0 2,970.45
Non-operating expenses 0 3,206.10 207.53 207.53 2,308.22 1,385.00
Total interest payments 603.32 4,281.07 1,448.39 5,653.76 2,308.22 1,385.00
Percentage of operating profit 31.9% 159.5% 60.3% 205.0% 71.9% 40.1%
Ordinary profit 573.50 339.77 -70.05 -4,161.54 -650.92 211.60
Equity ratio 33.2% 19.3% 19.1% 20.6% 22.0% 22.1%
Current ratio 28.6% 21.4% 26.4% 15.6% 26.7% 20.9%
Ratio to Net Sales 22.0% 16.4% -1.7% -148.3% 47.1% 43.5%
Source: ETA
ETA reports that it is currently investigating/implementing various measures aimed at improving
its weak financial structure, including increasing traffic volumes, having consumers shoulder toll
consumption taxes, and introducing a high-speed open system for toll payments which lead to
increasing operating profits , reducing operating expenses by outsourcing, as well as measures to
gain reduction and exemption from interest on government loans. Since the government covers any
deficits in the event that ETA posts losses (Establishment Act, Article 38), ETA’s finances are
working out, however, it is hoped that efforts toward further improvement will be made in order to
ensure the sustainability and future development of this project.
3. Feedback
3.1 Lessons Learned It is essential to identify risks which may affect the effectiveness of the project at the
project planning stage.
The lack of sufficient inter-organization coordination involved in roads construction resulted in
the construction of multiple roads with overlapping goals, which diminished the effectiveness of this
project. It is crucial that all parties involved in the project, including JBIC, undertake
countermeasures which would prevent such risk at the planning stage.
17
3.2 Recommendations Strengthen the function of OCMLT
There is a need to devise efficient plans for future expressways in Bangkok Metropolitan Region
and to formulate policies to prevent the fomentation of futile competition between existing roads,
which can be achieved via the effective functioning of OCMLT, established in 1992 (see footnote on
P.4).
18
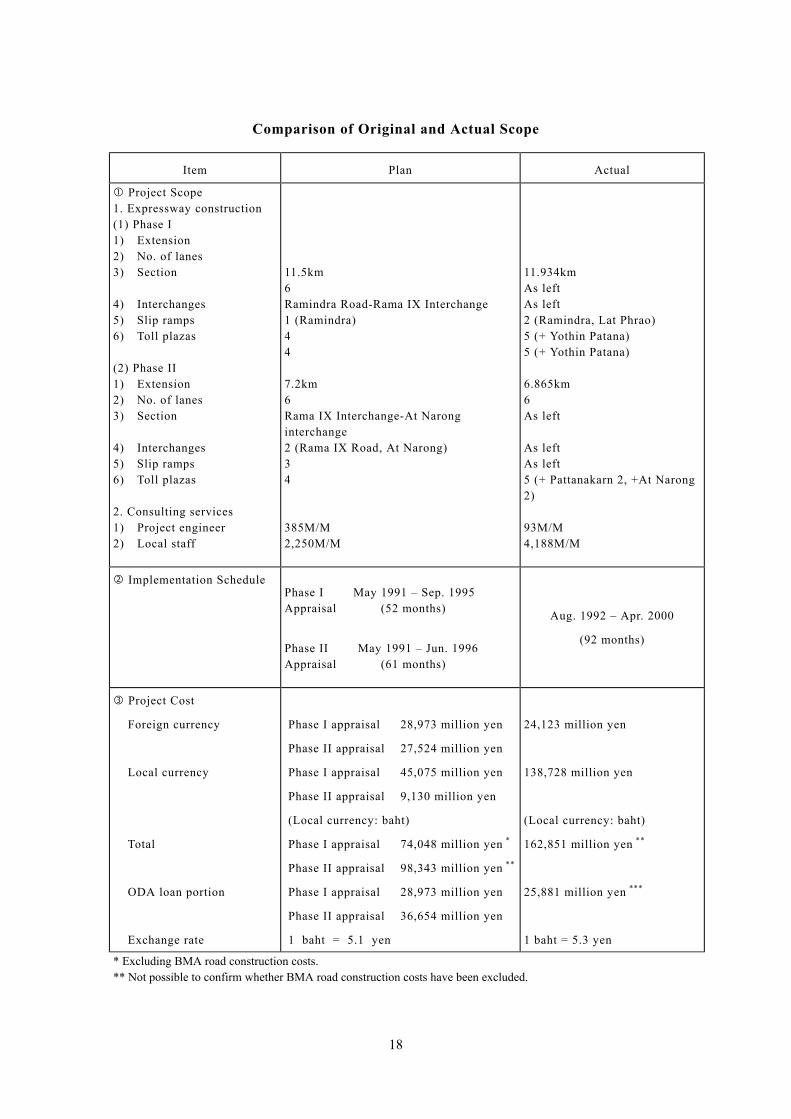
Comparison of Original and Actual Scope
Item Plan Actual
Project Scope 1. Expressway construction (1) Phase I 1) Extension 2) No. of lanes 3) Section 4) Interchanges 5) Slip ramps 6) Toll plazas (2) Phase II 1) Extension 2) No. of lanes 3) Section 4) Interchanges 5) Slip ramps 6) Toll plazas 2. Consulting services 1) Project engineer 2) Local staff
11.5km 6 Ramindra Road-Rama IX Interchange 1 (Ramindra) 4 4 7.2km 6 Rama IX Interchange-At Narong interchange 2 (Rama IX Road, At Narong) 3 4 385M/M 2,250M/M
11.934km As left As left 2 (Ramindra, Lat Phrao) 5 (+ Yothin Patana) 5 (+ Yothin Patana) 6.865km 6 As left As left As left 5 (+ Pattanakarn 2, +At Narong 2) 93M/M 4,188M/M
Implementation Schedule
Phase I May 1991 – Sep. 1995 Appraisal (52 months)
Phase II May 1991 – Jun. 1996 Appraisal (61 months)
Aug. 1992 – Apr. 2000
(92 months)
Project Cost
Foreign currency
Local currency
Total
ODA loan portion
Exchange rate
Phase I appraisal 28,973 million yen
Phase II appraisal 27,524 million yen
Phase I appraisal 45,075 million yen
Phase II appraisal 9,130 million yen
(Local currency: baht)
Phase I appraisal 74,048 million yen *
Phase II appraisal 98,343 million yen **
Phase I appraisal 28,973 million yen
Phase II appraisal 36,654 million yen
1 baht = 5.1 yen
24,123 million yen
138,728 million yen
(Local currency: baht)
162,851 million yen **
25,881 million yen ***
1 baht = 5.3 yen
* Excluding BMA road construction costs. ** Not possible to confirm whether BMA road construction costs have been excluded.
19
Third Party Evaluator’s Opinion on Ramindra-At Narong Expressway Construction Project (I) (II)
Yordphol Tanaboriboon
Professor Asian Institute of Technology
Relevance This project (Ramindra-At Narong Expressway) was anticipated to meet the needs of urban growth resulting from the settlement of new communities in the northeastern part of Bangkok particularly Bangkhen, Lat Phrao and Wang Thong Lang areas. Also, this project was expected to serve as a connecting route to Don Muang Airport, the Northern and Northeastern Regions of the country especially when Vibhavadi Rangsit Highway was flooded. It can be said that this project assisted in meeting the needs of the new communities to certain extent. However, at this early stage, the impact of this project was not evident. This is due to the fact that along this project ‘s corridor, there exists a competitive route, which is Pradit Manutham Road. This new six-lane road was constructed concurrently with and in parallel to this project. Due to its at-grade feature and no control of access, Pradit Manutham Road provides high accessibility to motorists especially those who reside along this road. Thus, initially this road had higher impact on land development as well as community expansion than the Ramindra-At Narong Expressway project. Subsequently, the anticipation of this project to be utilized as a connecting route to Don-Muang Airport as well as to the Northern and Northeastern Regions was not met due to several factors. Firstly, the flooding problem along the Vibhavadi Rangsit has been rectified. Secondly, as previously mentioned that along this project’s corridor there exists Pradit Manutham Road running parallel to this project. There is no substantial difference in travel time between these two routes, but one undenial fact is that this project is a toll road while motorists need not to pay to use Pradit Manutham Road. Thus, motorists prefer to use Pradit Manutham Road rather than this project. Thirdly, even though this project can connect to both First Stage and Second Stage Expressway, the north end of this project is merged into Ramindra Road. Therefore, commuters have to travel through Ramindra Road as a linkage to the northern part of the country. The inconvenience in travelling makes it unattractive to commuters as compared to other routes. Impact One main reason that this project failed to meet the expectation of easing the north-south congestion is that the overall travel feature of this project is unattractive. The unattractive feature is due mainly to the high generalized cost (which include both travel time and toll fee) as the north end of this project ends at Ramindra Road. Motorists who need to travel to northern and northeastern areas not only have to pay the toll fee, but must also travel on Ramidra Road for another 4-6 km, irrespective of motorists traveling through the Laksi Intersection and further to Phahon Yothin Road or going through Minburi area to gain access to the Outer Ring Road. Moreover, even for traveling to the surrounding areas such as Bangkhen and Lat Phrao, motorists still prefer to use Pradit Manutham Road instead of this project because not only Pradit Manutham Road has higher accessibility, but it is also a toll free road. Thus, there is no doubt that traffic volume of Pradit Manutham Road is 4 times higher than this project. Nonetheless, it can be expected that in the future when this project is connected to the Third Stage Expressway and the Outer Ring Road, it may attract more traffic to this project. One obvious note about this project which can be clearly observed is the high impact on land development along this project. The population growth rate, perhaps, could reflect this kind of impact. Certain areas like Bangkhen District had the population growth rate of 2.7% per year while growth rates of 1.8% and 1.3% per year were also noticed in Bangkapi and Lat Phrao Districts, respectively. These growth rates are approximately 3 times higher than the average population growth rate of entire Bangkok area. Presently, the environmental impact of this project was not evident yet. As stipulated by the Pollution Control Department, the observed level of noise, vibration and air quality were still below the threshold limit. These might be due to the low traffic volume and also small number of high-rise buildings to impede wind circulation which is unlike the situation in the inner area of Bangkok.