Thailand Oilseeds and Products Annual 2003 - USDA · Thailand Oilseeds and Products Annual 2003...
28
Foreign Agricultural Service GAIN Report Global Agriculture Information Network Required Report - public distribution Date: 5/29/2003 GAIN Report #TH3062 Thailand Oilseeds and Products Annual 2003 Approved by: Russ Nicely, Acting Agricultural Counselor U.S. Embassy, Bangkok, Thailand Prepared by: Sakchai Preechajarn, Agricultural Specialist Report Highlights: Anticipated growing consumption of soybeans and their products (soymeal and soybean oil) should lead to increased soybean imports as well as relatively high soymeal imports in MY 2003. Palm oil production will also hit a record high in 2003, leading to high export volume. Includes PSD changes: Yes Includes Trade Matrix: Yes Annual Report Bangkok [TH1], TH
Transcript of Thailand Oilseeds and Products Annual 2003 - USDA · Thailand Oilseeds and Products Annual 2003...

Foreign Agricultural Service
GAIN ReportGlobal Agriculture Information Network
Required Report - public distribution Date: 5/29/2003
GAIN Report #TH3062
Thailand
Oilseeds and Products
Annual
2003
Approved by:Russ Nicely, Acting Agricultural CounselorU.S. Embassy, Bangkok, Thailand
Prepared by:Sakchai Preechajarn, Agricultural Specialist
Report Highlights: Anticipated growing consumption of soybeans and their products (soymeal and soybeanoil) should lead to increased soybean imports as well as relatively high soymeal importsin MY 2003. Palm oil production will also hit a record high in 2003, leading to highexport volume.
Includes PSD changes: YesIncludes Trade Matrix: Yes
Annual ReportBangkok [TH1], TH

Executive Summary . . . . . . . . . . . . . . . . . . . . . . . . . . . . . . . . . . . . . . . . . . . . . . . . . . . . . . . . . . . . . . . . . Page 1 of 26
SECTION I: SITUATION AND OUTLOOK . . . . . . . . . . . . . . . . . . . . . . . . . . . . . . . . . . . . . . . . . . . . . Page 2 of 261.1. Oilseeds . . . . . . . . . . . . . . . . . . . . . . . . . . . . . . . . . . . . . . . . . . . . . . . . . . . . . . . . . . . . . . Page 2 of 26
Soybeans . . . . . . . . . . . . . . . . . . . . . . . . . . . . . . . . . . . . . . . . . . . . . . . . . . . . . . . . . . . Page 2 of 261.2. Oil Meal . . . . . . . . . . . . . . . . . . . . . . . . . . . . . . . . . . . . . . . . . . . . . . . . . . . . . . . . . . . . . . Page 3 of 26
Soybean Meal . . . . . . . . . . . . . . . . . . . . . . . . . . . . . . . . . . . . . . . . . . . . . . . . . . . . . . . Page 3 of 26Fish Meal . . . . . . . . . . . . . . . . . . . . . . . . . . . . . . . . . . . . . . . . . . . . . . . . . . . . . . . . . . . Page 4 of 26
1.3. Oil . . . . . . . . . . . . . . . . . . . . . . . . . . . . . . . . . . . . . . . . . . . . . . . . . . . . . . . . . . . . . . . . . . . Page 5 of 26Soybean Oil . . . . . . . . . . . . . . . . . . . . . . . . . . . . . . . . . . . . . . . . . . . . . . . . . . . . . . . . . Page 5 of 26Palm Oil . . . . . . . . . . . . . . . . . . . . . . . . . . . . . . . . . . . . . . . . . . . . . . . . . . . . . . . . . . . . Page 5 of 26
SECTION II: STATISTICAL TABLES . . . . . . . . . . . . . . . . . . . . . . . . . . . . . . . . . . . . . . . . . . . . . . . . . Page 8 of 26Table 1: Thailand’s Production, Supply & Demand Table for Soybeans . . . . . . . . . . . . . . . . . Page 8 of 26Table 2: Farmgate Prices for Soybeans, Mixed Grade . . . . . . . . . . . . . . . . . . . . . . . . . . . . . . . Page 9 of 26Table 3: Thailand’s Soybean Imports . . . . . . . . . . . . . . . . . . . . . . . . . . . . . . . . . . . . . . . . . . . Page 10 of 26Table 4: Thailand’s Soybean Exports . . . . . . . . . . . . . . . . . . . . . . . . . . . . . . . . . . . . . . . . . . Page 11 of 26Table 5: Thailand’s Production, Demand & Supply Table for Soybean Meal . . . . . . . . . . . . Page 12 of 26Table 6: Bangkok Wholesale Prices for Soybean Meal, Derived from Domestic Soybean . . Page 13 of 26Table 7: Thailand’s Soybean Meal Imports . . . . . . . . . . . . . . . . . . . . . . . . . . . . . . . . . . . . . . Page 14 of 26Table 8: Thailand’s Soybean Meal Exports . . . . . . . . . . . . . . . . . . . . . . . . . . . . . . . . . . . . . . Page 15 of 26Table 9: Thailand’s Production, Demand & Supply Table for Fish Meal . . . . . . . . . . . . . . . Page 16 of 26Table 10: Prices for Domestic Fish Meal . . . . . . . . . . . . . . . . . . . . . . . . . . . . . . . . . . . . . . . . Page 17 of 26Table 11: Thailand’s Fish Meal Imports . . . . . . . . . . . . . . . . . . . . . . . . . . . . . . . . . . . . . . . . Page 18 of 26Table 12: Thailand’s Fish Meal Exports . . . . . . . . . . . . . . . . . . . . . . . . . . . . . . . . . . . . . . . . Page 19 of 26Table 13: Thailand’s Production, Demand & Supply Table for Soybean Oil . . . . . . . . . . . . Page 20 of 26Table 14: Thailand’s Soybean Oil Imports . . . . . . . . . . . . . . . . . . . . . . . . . . . . . . . . . . . . . . Page 21 of 26Table 15: Thailand’s Soybean Oil Exports . . . . . . . . . . . . . . . . . . . . . . . . . . . . . . . . . . . . . . Page 22 of 26Table 16: Thailand’s Production, Demand & Supply Table for Palm Oil . . . . . . . . . . . . . . . Page 23 of 26Table 17: Prices for Crude Palm Oil . . . . . . . . . . . . . . . . . . . . . . . . . . . . . . . . . . . . . . . . . . . Page 24 of 26Table 18: Thailand’s Palm Oil Imports . . . . . . . . . . . . . . . . . . . . . . . . . . . . . . . . . . . . . . . . . Page 25 of 26Table 19: Thailand’s Palm Oil Exports . . . . . . . . . . . . . . . . . . . . . . . . . . . . . . . . . . . . . . . . . Page 26 of 26

GAIN Report #TH3062 Page 1 of 26
UNCLASSIFIED Foreign Agricultural Service/USDA
Executive Summary
In MY 2003, domestic soybean production should stagnate. However, a continuedhealthy growth in feed use demand, both in terms of soymeal and direct use of full-fat soyproduct in feed rations, should lead to growing soybean consumption and imports. The U.S.market share of Thai soybean imports should maintain at about a half of total imports in MY2003.
Production of both soymeal and soybean oil should also rise following the increasedbean deliveries to soybean oil crushing plants. Demand for both products are also increasing duemainly to growth in the poultry industry, an anticipated sustainable growth in the Thai economy,and growing exports of canned tuna. However, imports of soymeal should be close to the MY2002 level. The U.S. market share of Thai soymeal imports in MY 2003 should be 12 percent,the same level as that in MY 2002.
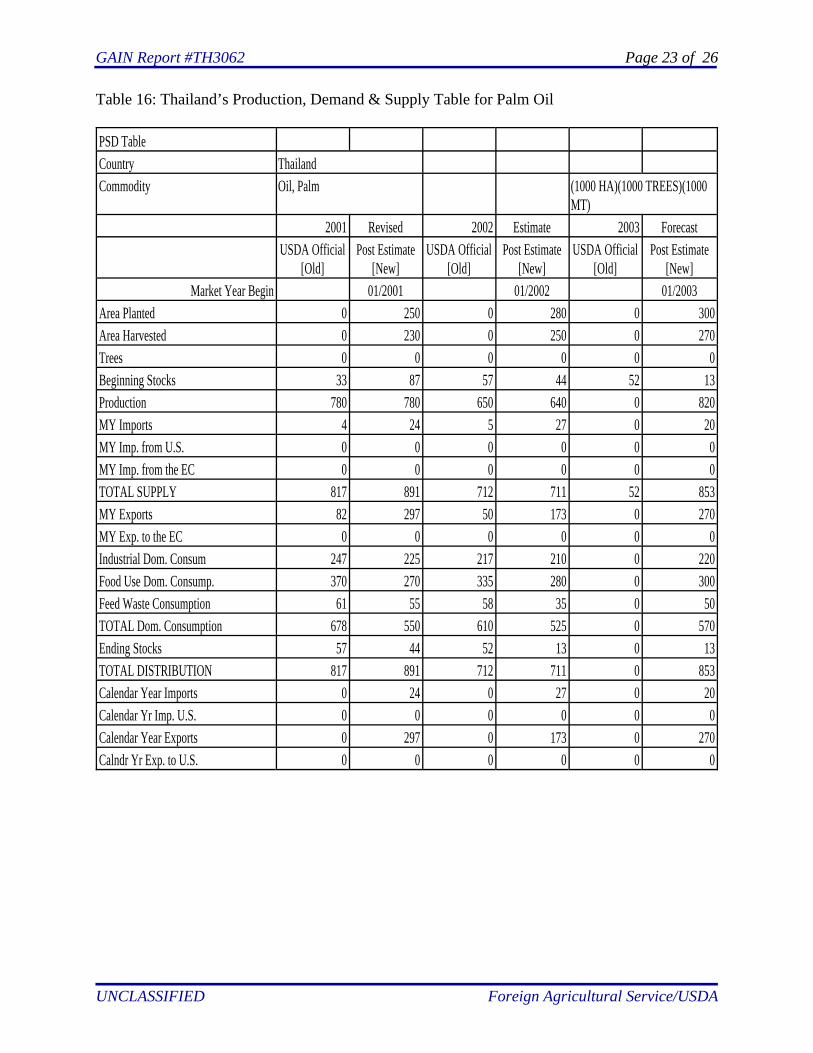
Palm oil production has recovered tremendously in 2003 following excellent climaticconditions and an expansion in the harvested area. While domestic consumption is forecast togrow in 2003, palm oil exports may reach 270,000 tons, up from 173,000 tons in 2002.

GAIN Report #TH3062 Page 2 of 26
UNCLASSIFIED Foreign Agricultural Service/USDA
SECTION I: SITUATION AND OUTLOOK
1.1. Oilseeds
Soybeans
Thailand’s soybean production for the MY 2003/04 crop is forecast to be basicallyunchanged at 250,000 tons, as improved prices for soybean in My 2002/03 should prevent manyfarmers from further switching from their soybean area to other competing crops. Given normalweather conditions, average yields for soybean in MY 2003/04 should be close to the previousseason’s level. Based on a recent field survey and trade source, the MY 2002/03 crop productionhas been revised downward from the earlier estimate of 290,000 tons to 250,000 tons, mainlybecause less attractive prices for soybean induced many growers to substitute soybeans withother crops (such as corn, sugar cane, vegetable, etc.) and a lack of seed availabilities.
Although the government has launched several campaigns to promote soybeanproduction, Thailand’s soybean production, which reached the high record of almost 700,000tons in late 1980's, has gradually declined in the past decade. This decline is attributed to highproduction cost vis-a-vis a lack of price incentives. Average yields of soybean production inThailand has been only 200-230 kgs/rai (about 1.25-1.44 tons/hectare) due to a lack of seedquality improvement and good irrigation. As compared to corn, an alternate crop to soybeans, itsproductivity has increased tremendously from about 400 kgs/rai (2.5 tons/hectare) in the early1990's to currently 600-650 kgs/rai (3.75-4.06 tons/hectare).
Reflecting a continued healthy growth in feed use demand, both in terms of soybeanmeal and direct use of full-fat soy product in feed rations, soybean consumption is forecast togrow further in MY 2003/04 and over the next few years. Meanwhile, the liberalization policyon soybean imports (zero import duty on soybeans since 1996) has kept soy products (mainlysoybean meal and oil) competitive to imported products, which led to overall increased demand. Due to increased demand, Thai Vegetable Oils Co., one of the largest soybean crushers in thecountry, is scheduled to begin its new state-of-art plant by mid 2003, adding another 200-300,000tons to the total current capacity of 2.0 million tons per annum.
In addition to demand for oil crushing, the use of soybeans as food ingredients is alsoanticipated to grow steadily in response to increased awareness of healthy food among the Thaipeople, especially soy milk, and to population growth. Trade sources indicated that soy foodprocessors prefer domestic soybeans to imported soybeans, mainly because of the increasingconcerns over imported GMO soybeans and the favorable taste of products derived from localsoybeans. As demand for food-grade local soybeans is very strong, the wholesale price of Grade-A soybeans, normally sold for food processing, are relatively high, currently 15-16 baht/kg (US$360-380/ton) as opposed to 11-12 baht/kg (approx. US$ 270-290/tons) for soybeans sold forcrushing.
In general, prices for domestic soybeans reflect the combined factors of worldwideprices and guaranteed prices determined by the Government. In 2003, average prices fordomestic soybeans should increase by 8-10 percent over the 2002's level, in line with increased

GAIN Report #TH3062 Page 3 of 26
UNCLASSIFIED Foreign Agricultural Service/USDA
global soybean prices and higher guaranteed prices. Farmgate prices for mixed grade soybeans inthe first 4 months of 2003 (Jan-Apr) were 10.08 baht/kg (US$ 240/ton) as compared to 10.16baht/kg (US$ 241/ton) averaged in 2002.
Anticipated growing demand while a downward trend in domestic production shouldabsolutely lead to continued higher import demand in MY 2003 and over the next few years. It isanticipated that about 1.85 million tons of soybeans will be imported in MY 2003 to meetincreasing demand, up 12 percent over the MY 2002's level.
Trade sources believe that the U.S. market share should maintain at about a half of totalimports in MY 2002 and 2003, due mainly to its quality consistency in protein level and color,plus punctual deliveries. However, increased supply availabilities and improved quality from theSouth American growing area, especially Brazil, according to trade sources, could pose somethreat to the U.S. market share in the future. Because of increased supplies from this part of theworld, U.S. soybeans may be relatively less competitive, especially when supplies from SouthAmerica are marketable in the second half of U.S. marketing year (March-August).
It is likely that the Government will soon terminate its effort to increase domesticproduction as an import substitute, when it realizes the lack of comparative advantage inpromoting domestic production. Soybean growers no longer receive any production supportfrom the Government. However, import policy has been used as the only tool to stabilizedomestic prices for soybeans. While soybeans are subject to the tariff-rate-quota (TRQ) systemthat Thailand committed to the WTO, the Government has opted to liberalize the imports ofsoybeans since 1996, placing no limits on a quota level with a zero import duty. However,eligible soybean importers, under the favorable TRQ, are required to purchase domestic soybeansat determined prices.
In 2003, there has been no change in TRQ administration from the previous years. Thereis no limit to the TRQ quota, under which the import duty is zero. Eligible importers are dividedinto three groups; including soybean oil crushers, feed manufactures, and food processors. Soybean oil crushers are required to buy domestic soybeans at factory no less than 11 baht/kg (or10 baht/kg at farm), while feed manufacturers and food processors must buy at factory at no lessthan 11.50 baht/kg (or 10.50 baht/kg at farm) and 13.50 baht/kg. (or 12.50 at farm), respectively.
1.2. Oil Meal
Soybean Meal
Reflecting an expansion in soybean deliveries for oil crushing (through both domesticproduction and imported soybeans), soybean meal production is forecast to further grow in MY2003/04.
Domestic consumption of soybean meal is also anticipated to increase steadily in MY2002/03 and 2003/04 in line with a likelihood of continued healthy growth in the livestock

GAIN Report #TH3062 Page 4 of 26
UNCLASSIFIED Foreign Agricultural Service/USDA
sector, especially the poultry industry. The poultry industry, of which soybean consumptionaccounts for almost 70 percent of total soybean meal demand, is expected to grow by 10-12percent in 2003 and 2004. Bangkok wholesale prices for soybean meal (derived from domesticsoybeans) have reportedly increased by 10 percent in the first 4 months of 2003 (Jan-Apr) overthe same period in 2002.
Like soybeans, Thailand needs to import soybean meal to meet increasing demand fromthe feed industry. Soybean meal imports in MY 2002/03 are estimated to increase from MY2001/02, but the imports in MY 2003/04 should remain unchanged following increased domesticsoymeal production. However, trade sources indicated that the imports may decline in the nextfew years when all soybean oil crushers will increase their soybean oil production (soybean mealin other words). In general, feed manufacturers prefer domestically produced soymeal toimported soymeal due to the quality superiority. As a result, prices for domestic soybean mealare usually 0.50-1.00 baht/kg (US$ 12-24/tons) higher than imported soybean meal.
The U.S. market share of Thai soybean meal imports has been up and down, dependingon price competitiveness. Less competitive prices against the other supplier countries, mainlyArgentina, Brazil, and India, led to a decrease in U.S. market share from 15% in MY 2001/02 to12% in MY 2002/03. U.S. market share is expected to be close to the MY 2002/03's level.
Like soybeans, the imports of soybean meal are also subject to the WTO’s tariff-rate-quota (TRQ) system. However, in order to meet the demand of feed manufacturers and reducethe production cost of export-oriented poultry industry, the Government has also liberalizedsoymeal imports by expanding the quota to an unlimited level. However, unlike a zero-tariff incase of soybeans, the import duties in recent years are determined at 5 percent.
In 2003 (announced in January 2003), the Royal Thai Cabinet agreed that the importquota for WTO country members is unlimited with a tariff rate of 5 percent, the same as usual. However, eligible importers, mainly groups of feed mills and livestock producers, are required topurchase soybean meal from soybean oil crushers at no less than 9.50 baht/kg (US$ 228/ton) atthe crushers’ factories. In cases where importers want to import soymeal from ASEAN countriesunder the ASEAN Free Trade Area (AFTA), they enjoy 5% tariff rate and are not required to buydomestic soymeal. For imported soymeal that originates from non-WTO country members, thetariff rate will be 6%, plus a surcharge of 2,519 baht/ton (US$ 60/ton).
Fish Meal
Fish meal production is forecast to remain unchanged at 350,000 tons in MY 2003/04, asongoing decreased catches of trash fishes will be equally offset by an increase in raw materialsthat are left over from manufacturing of Surimi and canned tuna.
After a reduction in MY 2002/03 following the dismal performance of shrimp farming,total consumption of fish meal in MY 2003/04 should stagnate at 360,000 tons. However, fishmeal prices are likely to soften in 2003 in line with global prices and lower demand.

GAIN Report #TH3062 Page 5 of 26
UNCLASSIFIED Foreign Agricultural Service/USDA
Following stagnant production and consumption, imports of fish meal should be close tothe MY 2002/03 level, which was the lowest record in recent history . Thai exports of fish mealwill also remain insignificant, about 5,000 tons, in MY 2003/04.
1.3. Oil
Soybean Oil
Soybean oil production is forecast to further increase in MY 2003 and over the next fewyears in line with increased soybean deliveries to crushing plants.
The consumption of soybean oil is also forecast to further grow in MY 2002 and MY2003, due mainly to anticipation of continued sustainable growth in the Thai economy (whichaffects domestic demand for cooking oil) and in exports of canned tuna (that requires soybean oilin canning). As mentioned in last year’s Annual Report, most soybean oil is used for cooking oil,accounting for about 70 percent of total soybean oil consumption. The remainder is for industrialuses, including in both non-food and food industries.
Reflecting increased domestic production and price competitiveness, soybean oil exportsshould continue to increase in 2003 to around 50-55,000 tons. Trade sources reported that themajor buying countries are still limited to such neighboring countries in Asia as Vietnam, HongKong, Indonesia, Singapore, and South Korea, due to Thailand’s advantage in transportationproximity against major competitors. Thailand also imports soybean oil, but in a limited amount,because of the current import policy. Most of the imported soybean oil is chemically modifiedsoybean oil, used for industrial purposes. Total soybean oil imports in 2003 should stagnate at3,000-4,000 tons.
Imports of soybean oil (crude and refined) are subject to the tariff-rate-quota (TRQ)system of the WTO agreement. Additionally, the requirement of an import permit, which mustbe endorsed by the Government, is also used as a tool to limit the imports. In 2003, the TRQ forsoybean oil is amounted to 2,269 tons, subject to 20% tariff rate. The tariff rate for out-of-quotaimports will be 147.6%, prohibitively high.
Palm Oil
Unlike last year, which was badly affected by unfavorable weather conditions,Thailand’s palm oil production is forecast to hit a record high in 2003, following excellentclimatic conditions and an expansion in the harvested area . The weather conditions of theprevious rainy season in 2002 favored the productivity in palm plantations in early 2003, whilethe likelihood of favorable rains in 2003 should boost both average yield of fresh fruit bunch(FFB) production and the average extraction rate of crude palm oil (CPO). Also, there has beenan additional 20-30,000 hectares of harvested area added in 2003, following a substitution of oilpalms for rubber tree plantations in the South in the past recent years.
Thai commercial entities in the palm oil industry, from farmers to palm oil processors,

GAIN Report #TH3062 Page 6 of 26
UNCLASSIFIED Foreign Agricultural Service/USDA
have made great efforts to lower the production costs across the broad. Seed stocks have beenreportedly improved to some degree in recent years through the importation of hybrid seed. Univanich Palm Oil, one of the largest palm oil crushers in Thailand, has provided high qualityhybrid seeds to farmers. Thai farmers are also improving their farming practices by applying proper amounts of fertilizer. Because of the improvements in farming management and moreefficient crushing industries, trade sources believe that Thailand will survive and has thepotential to expand production, although Thailand apparently will begin to reduce import dutieson palm oil to only 5 percent in 2003 under the ASEAN Free Trade Agreement (AFTA)implementation.
Consumption of palm oil is also growing in both food and non-food sectors, as palm oilprices are most competitive against other kinds of vegetable oil. For example, retail prices forrefined palm oil (olein) is currently 25 baht/liter, as compared to 32-33 baht/liter for refinedsoybean oil. Despite the ongoing perception that soybean oil is more healthier than palm oil, ahigh price gap between soybean oil and palm oil induces several consumers, especially low tomiddle income people, to buy palm oil. As a result, the olein palm oil has captured about 60-70% of total cooking oil consumption.
Trade sources estimate that the bulk of Thailand’s palm and palm kernel oil is used inthe food processing industry (cooking oil, 55%; NDCC, 10%; margarine and shortening, 9%;instant noodles, snack food and condensed milk, 15%). About 4 percent is currently used formaking soap and the balance goes to animal feed.
Reflecting the ample crop size of FFB, average prices for FFB should soften from the2002 level. The average FFB prices declined from 4.00-4.25 baht/kg (US$ 95-101/ton) inJanuary 2003 to 1.60-1.70 baht/kg (US$ 38-40/ton) in May 2003. In line with FFB prices, CPOprices also decreased from an averaged 24.71 baht/kg (US$ 588/ton) in January 2003 to about16-17 baht/kg (US$ 380-405/tons) in May 2003.
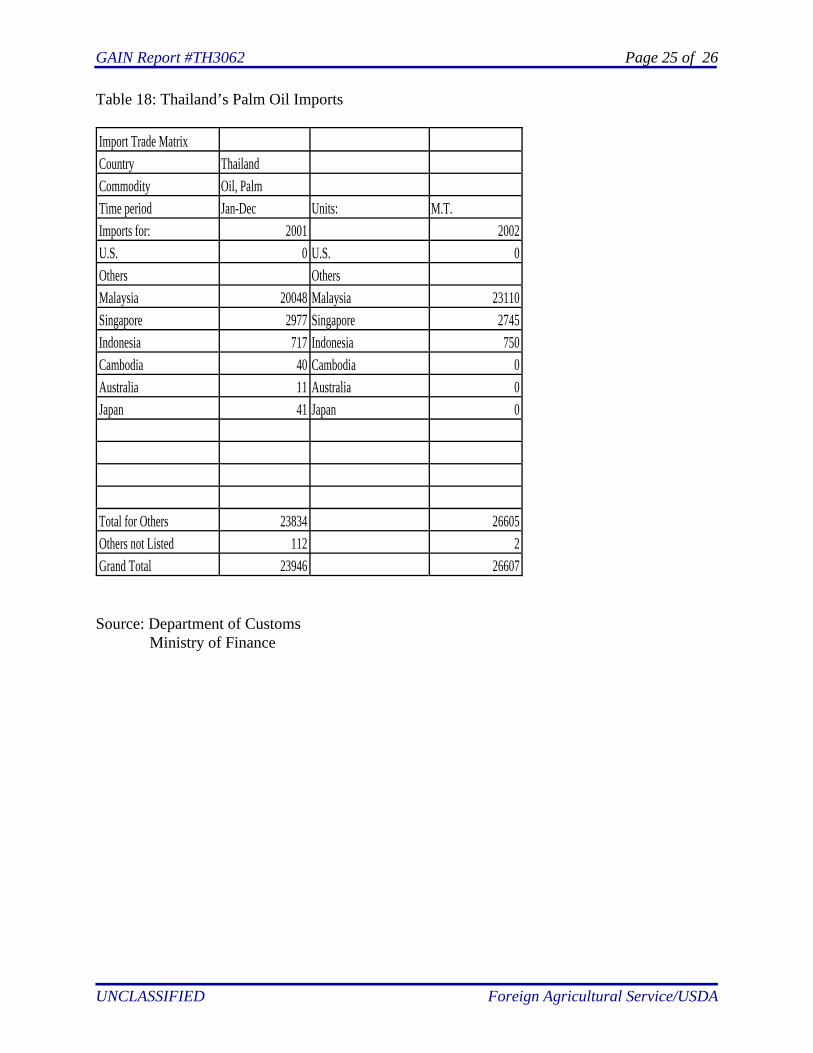
Thailand has increased its exports of palm oil to other Asian countries in recent years. Regular buyers are the ASEAN countries, India, Pakistan, and China. After a decline in 2002following a drop in production, palm oil exports in 2003 may reach 270,000 tons, up from only173,000 tons in 2002. As the palm oil trade is among the commodities which are rigidlycontrolled by the government, legal imports of palm oil should be limited to about 20,000 tons in2003.
There has been no significant change in the government’s production policy since the
last Annual Report. Under its palm and palm oil development plan (2000-2006), the governmenthas targeted increasing average yields for fresh production (from the current 14-15 tonsFFB/hectare to 19 tons FFB/hectare), and also increasing extraction rates (from the current 15-18percent to 19 percent). These targets will be achieved by relocating the palm plantation to theoptimal area and from improvements in planting practices and increased efficiencies in thecrushing and refining process.
Although there have been no price interventions for fresh palm and palm oil in 2003,palm farmers recently voiced their complaints about lower FFB prices to the Government. They
GAIN Report #TH3062 Page 7 of 26
UNCLASSIFIED Foreign Agricultural Service/USDA
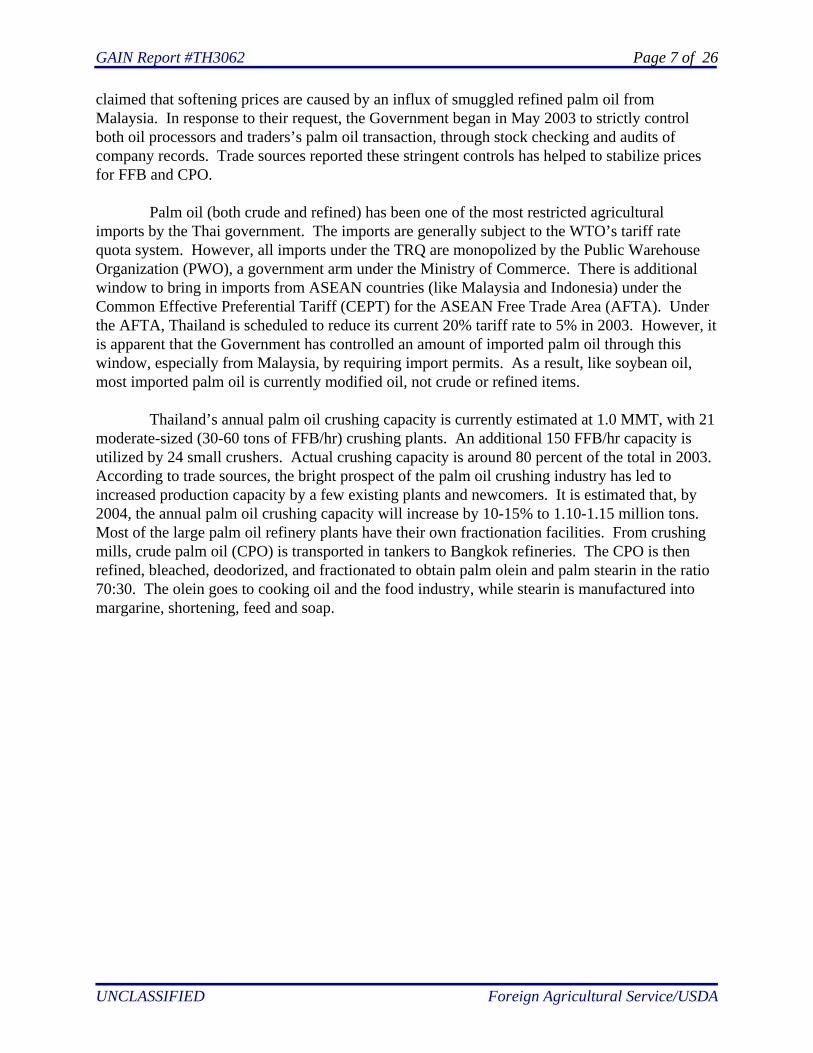
claimed that softening prices are caused by an influx of smuggled refined palm oil fromMalaysia. In response to their request, the Government began in May 2003 to strictly controlboth oil processors and traders’s palm oil transaction, through stock checking and audits ofcompany records. Trade sources reported these stringent controls has helped to stabilize pricesfor FFB and CPO.
Palm oil (both crude and refined) has been one of the most restricted agricultural imports by the Thai government. The imports are generally subject to the WTO’s tariff ratequota system. However, all imports under the TRQ are monopolized by the Public WarehouseOrganization (PWO), a government arm under the Ministry of Commerce. There is additionalwindow to bring in imports from ASEAN countries (like Malaysia and Indonesia) under theCommon Effective Preferential Tariff (CEPT) for the ASEAN Free Trade Area (AFTA). Underthe AFTA, Thailand is scheduled to reduce its current 20% tariff rate to 5% in 2003. However, itis apparent that the Government has controlled an amount of imported palm oil through thiswindow, especially from Malaysia, by requiring import permits. As a result, like soybean oil,most imported palm oil is currently modified oil, not crude or refined items.
Thailand’s annual palm oil crushing capacity is currently estimated at 1.0 MMT, with 21moderate-sized (30-60 tons of FFB/hr) crushing plants. An additional 150 FFB/hr capacity isutilized by 24 small crushers. Actual crushing capacity is around 80 percent of the total in 2003. According to trade sources, the bright prospect of the palm oil crushing industry has led toincreased production capacity by a few existing plants and newcomers. It is estimated that, by2004, the annual palm oil crushing capacity will increase by 10-15% to 1.10-1.15 million tons. Most of the large palm oil refinery plants have their own fractionation facilities. From crushingmills, crude palm oil (CPO) is transported in tankers to Bangkok refineries. The CPO is thenrefined, bleached, deodorized, and fractionated to obtain palm olein and palm stearin in the ratio70:30. The olein goes to cooking oil and the food industry, while stearin is manufactured intomargarine, shortening, feed and soap.
GAIN Report #TH3062 Page 8 of 26
UNCLASSIFIED Foreign Agricultural Service/USDA
SECTION II: STATISTICAL TABLES
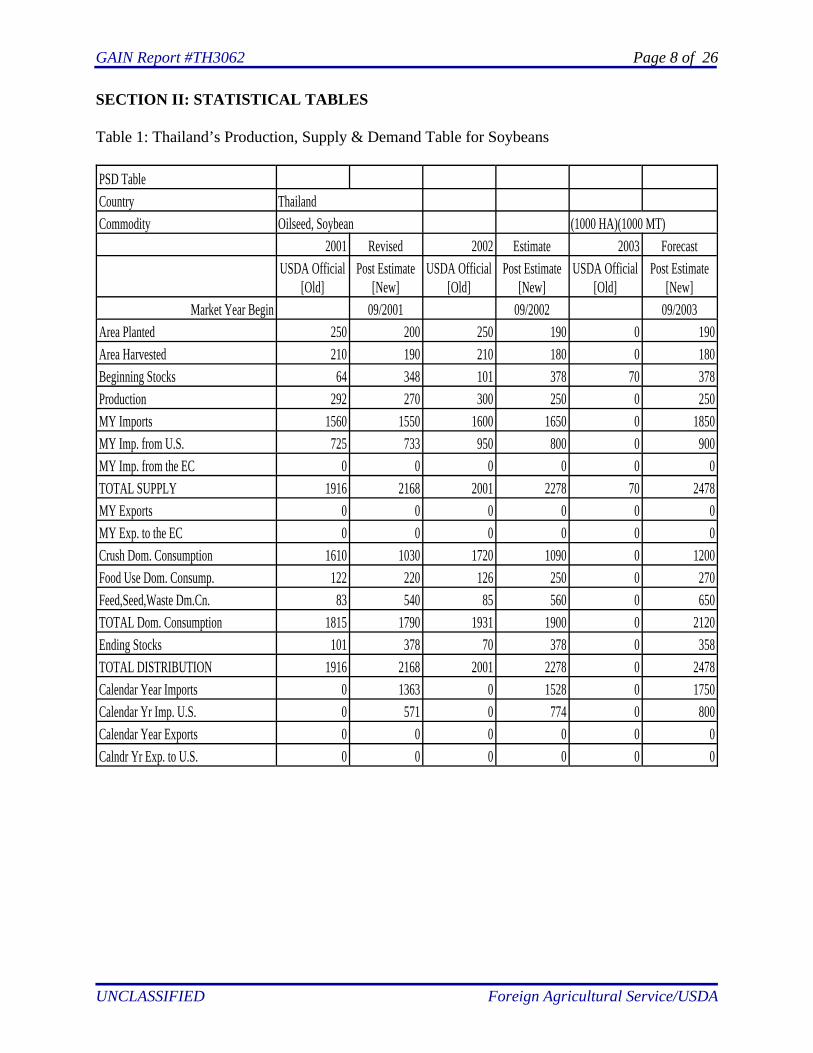
Table 1: Thailand’s Production, Supply & Demand Table for Soybeans
PSD TableCountry ThailandCommodity Oilseed, Soybean (1000 HA)(1000 MT)
2001 Revised 2002 Estimate 2003 ForecastUSDA Official
[Old]Post Estimate
[New]USDA Official
[Old]Post Estimate
[New]USDA Official
[Old]Post Estimate
[New]Market Year Begin 09/2001 09/2002 09/2003
Area Planted 250 200 250 190 0 190Area Harvested 210 190 210 180 0 180Beginning Stocks 64 348 101 378 70 378Production 292 270 300 250 0 250MY Imports 1560 1550 1600 1650 0 1850MY Imp. from U.S. 725 733 950 800 0 900MY Imp. from the EC 0 0 0 0 0 0TOTAL SUPPLY 1916 2168 2001 2278 70 2478MY Exports 0 0 0 0 0 0MY Exp. to the EC 0 0 0 0 0 0Crush Dom. Consumption 1610 1030 1720 1090 0 1200Food Use Dom. Consump. 122 220 126 250 0 270Feed,Seed,Waste Dm.Cn. 83 540 85 560 0 650TOTAL Dom. Consumption 1815 1790 1931 1900 0 2120Ending Stocks 101 378 70 378 0 358TOTAL DISTRIBUTION 1916 2168 2001 2278 0 2478Calendar Year Imports 0 1363 0 1528 0 1750Calendar Yr Imp. U.S. 0 571 0 774 0 800Calendar Year Exports 0 0 0 0 0 0Calndr Yr Exp. to U.S. 0 0 0 0 0 0

GAIN Report #TH3062 Page 9 of 26
UNCLASSIFIED Foreign Agricultural Service/USDA
Table 2: Farmgate Prices for Soybeans, Mixed Grade
Prices TableCountry ThailandCommodity Oilseed, SoybeanPrices in Baht per uom M.T.
Year 2002 2003 % ChangeJan 9480 10360 9.28%Feb 9670 10160 5.07%Mar 10030 10060 0.30%Apr 9870 9740 -1.32%May 10090 n/aJun 11360 n/aJul n/a n/a
Aug 10590 n/aSep 10060 n/aOct 10010 n/aNov 10170 n/aDec 10410 n/a
Exchange Rate 41.69 Local currency/US $
Source: Office of Agricultural EconomicsMinistry of Agriculture and Cooperatives
GAIN Report #TH3062 Page 10 of 26
UNCLASSIFIED Foreign Agricultural Service/USDA
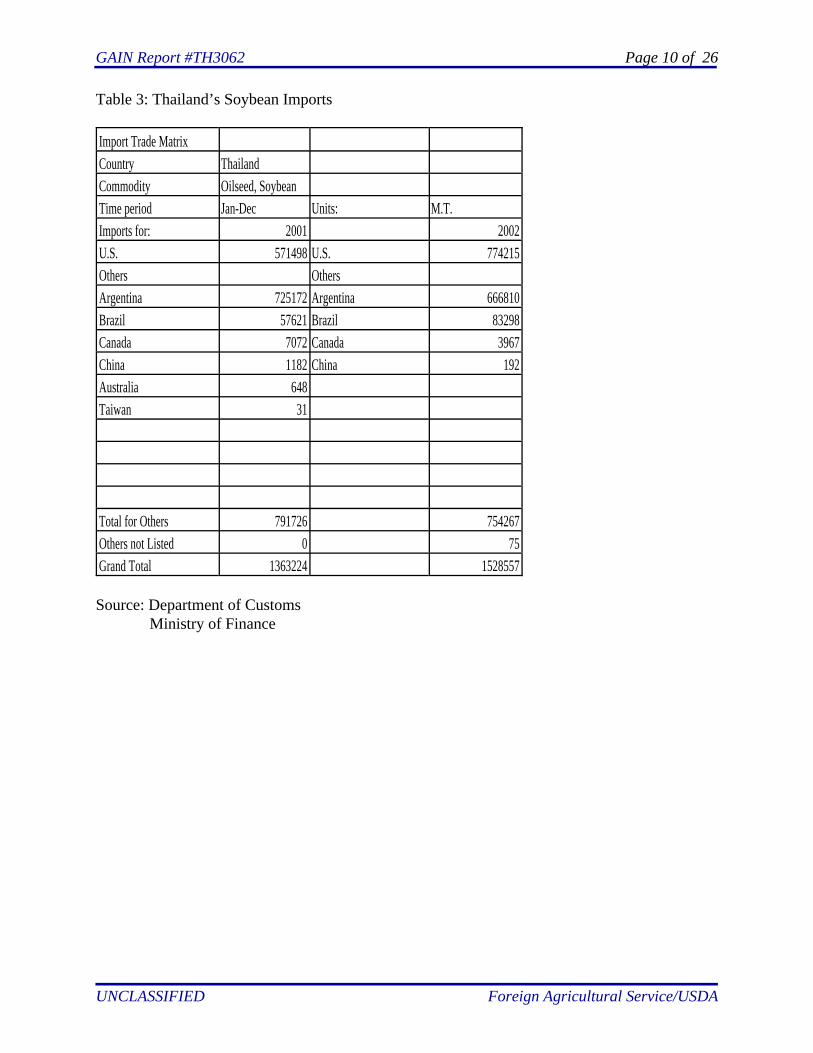
Table 3: Thailand’s Soybean Imports
Import Trade MatrixCountry ThailandCommodity Oilseed, SoybeanTime period Jan-Dec Units: M.T.Imports for: 2001 2002U.S. 571498 U.S. 774215Others OthersArgentina 725172 Argentina 666810Brazil 57621 Brazil 83298Canada 7072 Canada 3967China 1182 China 192Australia 648Taiwan 31
Total for Others 791726 754267Others not Listed 0 75Grand Total 1363224 1528557
Source: Department of CustomsMinistry of Finance

GAIN Report #TH3062 Page 11 of 26
UNCLASSIFIED Foreign Agricultural Service/USDA
Table 4: Thailand’s Soybean Exports
Export Trade MatrixCountry ThailandCommodity Oilseed, SoybeanTime period Jan-Dec Units: M.T.Exports for: 2001 2002U.S. 2 U.S. 9Others OthersSingapore 139 Singapore 91Hong Kong 113 Hong Kong 167Laos 40Japan 23Myanmar 7 Myanmar 229Swizerland 5Germany 1 Germany 4
Cambodia 292Malaysia 26
Total for Others 328 809Others not Listed 5 17Grand Total 335 835
Source: Department of CustomsMinistry of Finance
GAIN Report #TH3062 Page 12 of 26
UNCLASSIFIED Foreign Agricultural Service/USDA
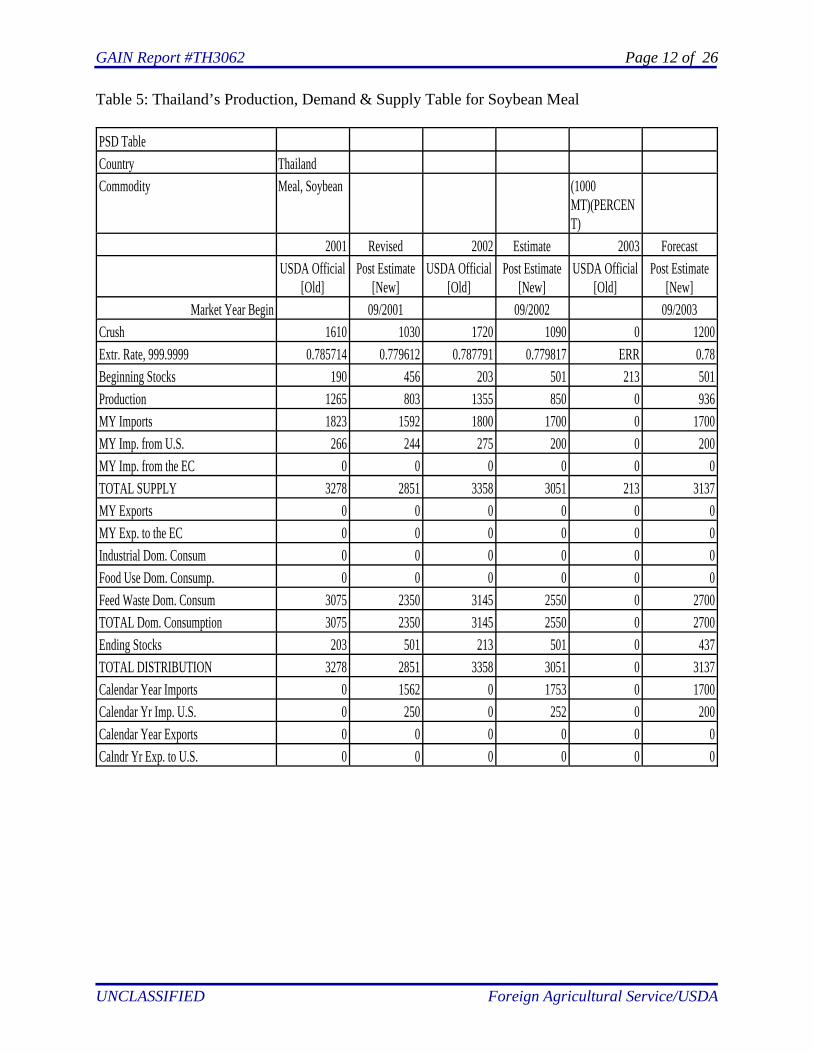
Table 5: Thailand’s Production, Demand & Supply Table for Soybean Meal
PSD TableCountry ThailandCommodity Meal, Soybean (1000
MT)(PERCENT)
2001 Revised 2002 Estimate 2003 ForecastUSDA Official
[Old]Post Estimate
[New]USDA Official
[Old]Post Estimate
[New]USDA Official
[Old]Post Estimate
[New]Market Year Begin 09/2001 09/2002 09/2003
Crush 1610 1030 1720 1090 0 1200Extr. Rate, 999.9999 0.785714 0.779612 0.787791 0.779817 ERR 0.78Beginning Stocks 190 456 203 501 213 501Production 1265 803 1355 850 0 936MY Imports 1823 1592 1800 1700 0 1700MY Imp. from U.S. 266 244 275 200 0 200MY Imp. from the EC 0 0 0 0 0 0TOTAL SUPPLY 3278 2851 3358 3051 213 3137MY Exports 0 0 0 0 0 0MY Exp. to the EC 0 0 0 0 0 0Industrial Dom. Consum 0 0 0 0 0 0Food Use Dom. Consump. 0 0 0 0 0 0Feed Waste Dom. Consum 3075 2350 3145 2550 0 2700TOTAL Dom. Consumption 3075 2350 3145 2550 0 2700Ending Stocks 203 501 213 501 0 437TOTAL DISTRIBUTION 3278 2851 3358 3051 0 3137Calendar Year Imports 0 1562 0 1753 0 1700Calendar Yr Imp. U.S. 0 250 0 252 0 200Calendar Year Exports 0 0 0 0 0 0Calndr Yr Exp. to U.S. 0 0 0 0 0 0
GAIN Report #TH3062 Page 13 of 26
UNCLASSIFIED Foreign Agricultural Service/USDA
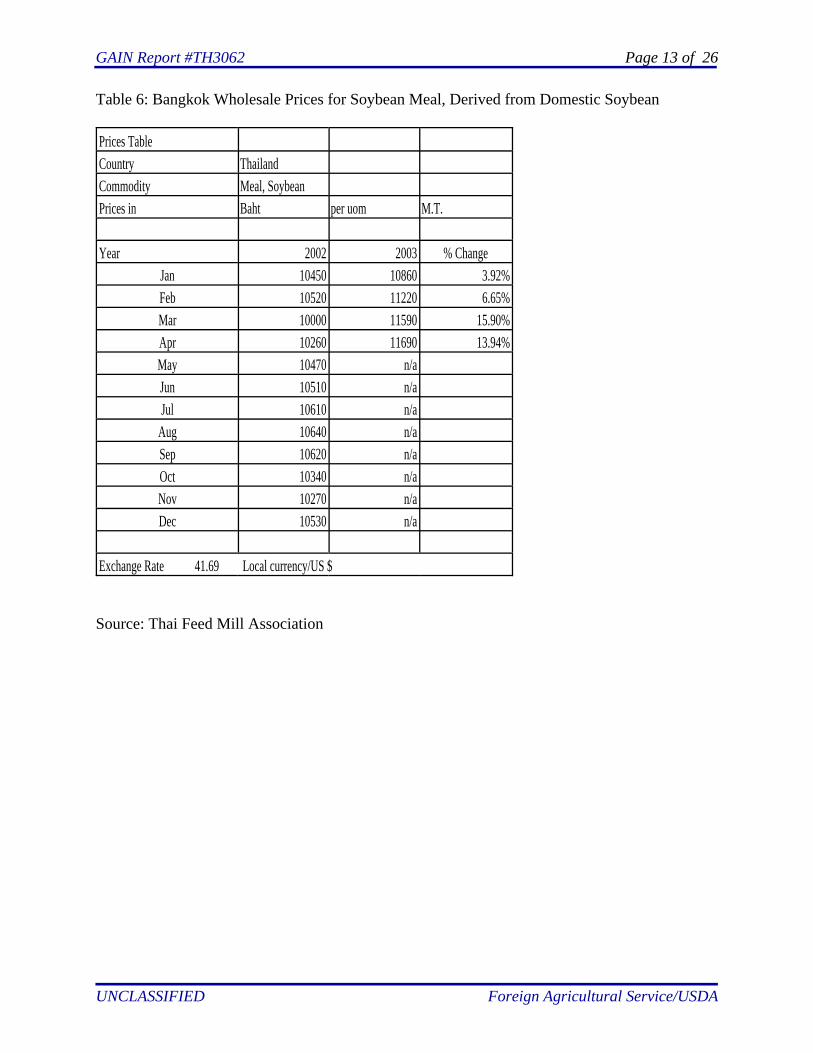
Table 6: Bangkok Wholesale Prices for Soybean Meal, Derived from Domestic Soybean
Prices TableCountry ThailandCommodity Meal, SoybeanPrices in Baht per uom M.T.
Year 2002 2003 % ChangeJan 10450 10860 3.92%Feb 10520 11220 6.65%Mar 10000 11590 15.90%Apr 10260 11690 13.94%May 10470 n/aJun 10510 n/aJul 10610 n/a
Aug 10640 n/aSep 10620 n/aOct 10340 n/aNov 10270 n/aDec 10530 n/a
Exchange Rate 41.69 Local currency/US $
Source: Thai Feed Mill Association

GAIN Report #TH3062 Page 14 of 26
UNCLASSIFIED Foreign Agricultural Service/USDA
Table 7: Thailand’s Soybean Meal Imports
Import Trade MatrixCountry ThailandCommodity Meal, SoybeanTime period Jan-Dec Units: M.T.Imports for: 2001 2002U.S. 249617 U.S. 251564Others OthersArgentina 803742 Argentina 769352Brazil 267569 Brazil 441265India 240364 India 195645Malaysia 338 Malaysia 39
China 92645Taiwan 540
Total for Others 1312013 1499486Others not Listed 0 1800Grand Total 1561630 1752850
Source: Department of CustomsMinistry of Finance
GAIN Report #TH3062 Page 15 of 26
UNCLASSIFIED Foreign Agricultural Service/USDA
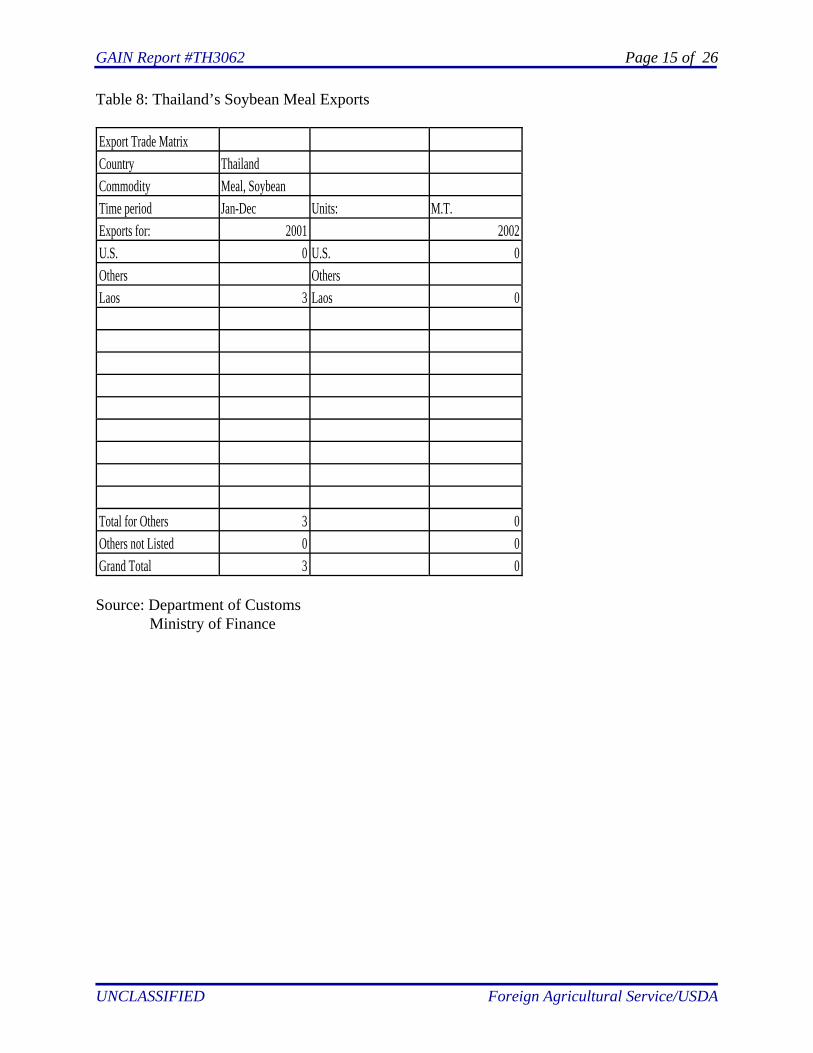
Table 8: Thailand’s Soybean Meal Exports
Export Trade MatrixCountry ThailandCommodity Meal, SoybeanTime period Jan-Dec Units: M.T.Exports for: 2001 2002U.S. 0 U.S. 0Others OthersLaos 3 Laos 0
Total for Others 3 0Others not Listed 0 0Grand Total 3 0
Source: Department of CustomsMinistry of Finance

GAIN Report #TH3062 Page 16 of 26
UNCLASSIFIED Foreign Agricultural Service/USDA
Table 9: Thailand’s Production, Demand & Supply Table for Fish Meal
PSD TableCountry ThailandCommodity Meal, Fish (1000 MT)(PERCENT)
2001 Revised 2002 Estimate 2003 ForecastUSDA Official
[Old]Post Estimate
[New]USDA Official
[Old]Post Estimate
[New]USDA Official
[Old]Post Estimate
[New]Market Year Begin 01/2002 01/2003 01/2004
Catch For Reduction 0 0 0 0 0 0Extr. Rate, 999.9999 ERR ERR ERR ERR ERR ERRBeginning Stocks 0 0 0 0 0 0Production 380 380 370 350 0 350MY Imports 37 33 75 17 0 15MY Imp. from U.S. 0 1 0 0 0 0MY Imp. from the EC 0 5 0 0 0 0TOTAL SUPPLY 417 413 445 367 0 365MY Exports 22 19 8 5 0 5MY Exp. to the EC 0 0 0 0 0 0Industrial Dom. Consum 0 0 0 0 0 0Food Use Dom. Consump. 0 0 0 0 0 0Feed Waste Dom. Consum 395 394 437 362 0 360TOTAL Dom. Consumption 395 394 437 362 0 360Ending Stocks 0 0 0 0 0 0TOTAL DISTRIBUTION 417 413 445 367 0 365Calendar Year Imports 0 92 0 18 0 15Calendar Yr Imp. U.S. 0 0 0 0 0 0Calendar Year Exports 0 5 0 19 0 5Calndr Yr Exp. to U.S. 0 0 0 0 0 0

GAIN Report #TH3062 Page 17 of 26
UNCLASSIFIED Foreign Agricultural Service/USDA
Table 10: Prices for Domestic Fish Meal
Prices TableCountry ThailandCommodity Meal, FishPrices in Baht per uom M.T.
Year 2002 2003 % ChangeJan 20500 17540 -14.44%Feb 22480 20130 -10.45%Mar 22510 19900 -11.59%Apr 21610 19900 -7.91%May 20130 n/aJun 19830 n/aJul 19730 n/a
Aug 20520 n/aSep 21860 n/aOct 18870 n/aNov 18020 n/aDec 17500 n/a
Exchange Rate 41.69 Local currency/US $
Source: Thai Feed Mill Association

GAIN Report #TH3062 Page 18 of 26
UNCLASSIFIED Foreign Agricultural Service/USDA
Table 11: Thailand’s Fish Meal Imports
Import Trade MatrixCountry ThailandCommodity Meal, FishTime period Jan-Dec Units: M.T.Imports for: 2001 2002U.S. 1 U.S. 0Others OthersArgentina 0 Argentina 106Chile 3288 Chile 615Denmark 5180 Denmark 2661Japan 1320 Japan 1075Myanmar 755 Myanmar 547Peru 80426 Peru 8748S. Korea 576 S. Korea 2386Taiwan 71 Taiwan 18Malaysia 360 Malaysia 1440
Total for Others 91976 17596Others not Listed 296 321Grand Total 92273 17917
Source: Department of CustomsMinistry of Finance

GAIN Report #TH3062 Page 19 of 26
UNCLASSIFIED Foreign Agricultural Service/USDA
Table 12: Thailand’s Fish Meal Exports
Export Trade MatrixCountry ThailandCommodity Meal, FishTime period Jan-Dec Units:Exports for: 2001 2002U.S. 50 U.S. 0Others Others 0China 0 China 440Indonesia 594 Indonesia 1053India 207 India 4463Japan 36 Japan 267Laos 232 Laos 286Malaysia 562 Malaysia 192Philippines 860 Philippines 7655Singapore 2 Singapore 711Taiwan 2973 Taiwan 3903
Total for Others 24436 18970Others not Listed 649 163Grand Total 25135 19133
Source: Department of CustomsMinistry of Finance

GAIN Report #TH3062 Page 20 of 26
UNCLASSIFIED Foreign Agricultural Service/USDA
Table 13: Thailand’s Production, Demand & Supply Table for Soybean Oil
PSD TableCountry ThailandCommodity Oil, Soybean (1000
MT)(PERCENT)
2001 Revised 2002 Estimate 2003 ForecastUSDA Official
[Old]Post Estimate
[New]USDA Official
[Old]Post Estimate
[New]USDA Official
[Old]Post Estimate
[New]Market Year Begin 09/2001 09/2002 09/2003
Crush 1610 1030 1720 1090 0 1200Extr. Rate, 999.9999 0.179503 0.169903 0.17907 0.169725 ERR 0.17Beginning Stocks 17 10 21 14 23 30Production 289 175 308 185 0 204MY Imports 3 5 3 5 0 5MY Imp. from U.S. 0 1 0 1 0 1MY Imp. from the EC 0 0 0 0 0 0TOTAL SUPPLY 309 190 332 204 23 239MY Exports 41 51 38 40 0 55MY Exp. to the EC 0 0 0 0 0 0Industrial Dom. Consum 12 50 14 54 0 60Food Use Dom. Consump. 235 75 257 80 0 85Feed Waste Dom. Consum 0 0 0 0 0 0TOTAL Dom. Consumption 247 125 271 134 0 145Ending Stocks 21 14 23 30 0 39TOTAL DISTRIBUTION 309 190 332 204 0 239Calendar Year Imports 0 3 4 5 0 5Calendar Yr Imp. U.S. 0 1 1 1 0 1Calendar Year Exports 0 51 55 37 0 60Calndr Yr Exp. to U.S. 0 0 0 0 0 0

GAIN Report #TH3062 Page 21 of 26
UNCLASSIFIED Foreign Agricultural Service/USDA
Table 14: Thailand’s Soybean Oil Imports
Import Trade MatrixCountry ThailandCommodity Oil, SoybeanTime period Jan-Dec Units: M.T.Imports for: 2001 2002U.S. 652 U.S. 585Others OthersTaiwan 1283 Taiwan 1584S. Korea 864 S. Korea 1264N. Korea 240 N. Korea 496Germany 161 Germany 180U.K. 112 U.K. 19Kenya 48S. Africa 32Singapore 24 Singapore 432
Pakistan 64
Total for Others 2764 4039Others not Listed 8 82Grand Total 3424 4706
Source: Department of CustomsMinistry of Finance

GAIN Report #TH3062 Page 22 of 26
UNCLASSIFIED Foreign Agricultural Service/USDA
Table 15: Thailand’s Soybean Oil Exports
Export Trade MatrixCountry ThailandCommodity Oil, SoybeanTime period Jan-Dec Units: M.T.Exports for: 2001 2002U.S. 250 U.S. 191Others OthersVietnam 24984 Indonesia 7168Hong Kong 17552 S. Korea 852Korea 3100 Singapore 1065India 3000 Hong Kong 2043Myanmar 670 Japan 340Singapore 425 Laos 434Laos 311 Myanmar 303Cambodia 310 Vietnam 22900China 161 Philippines 1520
China 317Total for Others 50513 36942Others not Listed 49 43Grand Total 50812 37176
Source: Department of CustomsMinistry of Finance
GAIN Report #TH3062 Page 23 of 26
UNCLASSIFIED Foreign Agricultural Service/USDA
Table 16: Thailand’s Production, Demand & Supply Table for Palm Oil
PSD TableCountry ThailandCommodity Oil, Palm (1000 HA)(1000 TREES)(1000
MT)2001 Revised 2002 Estimate 2003 Forecast
USDA Official[Old]
Post Estimate[New]
USDA Official[Old]
Post Estimate[New]
USDA Official[Old]
Post Estimate[New]
Market Year Begin 01/2001 01/2002 01/2003Area Planted 0 250 0 280 0 300Area Harvested 0 230 0 250 0 270Trees 0 0 0 0 0 0Beginning Stocks 33 87 57 44 52 13Production 780 780 650 640 0 820MY Imports 4 24 5 27 0 20MY Imp. from U.S. 0 0 0 0 0 0MY Imp. from the EC 0 0 0 0 0 0TOTAL SUPPLY 817 891 712 711 52 853MY Exports 82 297 50 173 0 270MY Exp. to the EC 0 0 0 0 0 0Industrial Dom. Consum 247 225 217 210 0 220Food Use Dom. Consump. 370 270 335 280 0 300Feed Waste Consumption 61 55 58 35 0 50TOTAL Dom. Consumption 678 550 610 525 0 570Ending Stocks 57 44 52 13 0 13TOTAL DISTRIBUTION 817 891 712 711 0 853Calendar Year Imports 0 24 0 27 0 20Calendar Yr Imp. U.S. 0 0 0 0 0 0Calendar Year Exports 0 297 0 173 0 270Calndr Yr Exp. to U.S. 0 0 0 0 0 0

GAIN Report #TH3062 Page 24 of 26
UNCLASSIFIED Foreign Agricultural Service/USDA
Table 17: Prices for Crude Palm Oil
Prices TableCountry ThailandCommodity Oil, PalmPrices in Baht per uom M.T.
Year 2002 2003 % ChangeJan 14780 24710 67.19%Feb 14210 18420 29.63%Mar 14540 15730 8.18%Apr 14650 15560 6.21%May 14460 n/aJun 15810 n/aJul 14920 n/a
Aug 16110 n/aSep 15620 n/aOct 16320 n/aNov 22040 n/aDec 27640 n/a
Exchange Rate: 41.69 Local currency/US $
Source: The Provincial Internal Trade Office, Kra-biDepartment of Internal Trade
GAIN Report #TH3062 Page 25 of 26
UNCLASSIFIED Foreign Agricultural Service/USDA
Table 18: Thailand’s Palm Oil Imports
Import Trade MatrixCountry ThailandCommodity Oil, PalmTime period Jan-Dec Units: M.T.Imports for: 2001 2002U.S. 0 U.S. 0Others OthersMalaysia 20048 Malaysia 23110Singapore 2977 Singapore 2745Indonesia 717 Indonesia 750Cambodia 40 Cambodia 0Australia 11 Australia 0Japan 41 Japan 0
Total for Others 23834 26605Others not Listed 112 2Grand Total 23946 26607
Source: Department of CustomsMinistry of Finance

GAIN Report #TH3062 Page 26 of 26
UNCLASSIFIED Foreign Agricultural Service/USDA
Table 19: Thailand’s Palm Oil Exports
Export Trade MatrixCountry ThailandCommodity Oil, PalmTime period Jan-Dec Units: M.T.Exports for: 2001 2002U.S. 1 U.S. 0Others OthersChina 16569 China 32286Iraq 9400 Iraq 18310India 23759 India 887Japan 0 Japan 1105Laos 2001 Laos 2094Malaysia 179597 Malaysia 79245Indonesia 15464 Singapore 1403Cambodia 3226 Cambodia 1689Myanmar 26955 Myanmar 29110Vietnam 3519 Vietnam 4592Total for Others 280490 170721Others not Listed 16941 3091Grand Total 297432 173812
Source: Department of CustomsMinistry of Finance