th HIL LTD ISIN… · HIL, part of the USD 1.8 billion diversified CK Birla Group has acquired...
14
Document code: FOTL_200820183_1 Copyright © 2016 Firstobject Technologies Ltd. All rights reserved HIL LTD Result Update (PARENT BASIS): Q1 FY19 CMP: 2191.30 AUG 20 th , 2018 Overweight ISIN: INE557A01011 Index Details SYNOPSIS HIL Limited is the flagship company of the C K Birla Group, which is a growing US$1.8 billion conglomerate with diversified interests. Revenue for the quarter rose by 9.91% and stood at Rs. 4962.20 mn as against Rs. 4514.60 mn, when compared with the prior year period. During Q1 FY19, EBIDTA is Rs. 888.00 mn as against Rs. 668.80 mn in the corresponding period of the previous year. During Q1 FY19, Profit before tax stood at Rs. 778.60 mn from Rs. 555.50 mn in Q1 FY18, up by 40.16%. During Q1 FY19, net profit stood at Rs. 520.40 mn against Rs. 368.70 mn in the corresponding quarter ending of previous year, an increase of 41.14%. EPS of the company stood at Rs. 69.48 a share during the quarter, as against Rs. 49.23 per share over previous year period. HIL, part of the USD 1.8 billion diversified CK Birla Group has acquired Parador Holdings GmbH, a Germany based leading manufacturer of premium quality flooring solutions for ~ €82.8 million. HIL launched “Charminar Fortune –non-asbestos, green roofing” solution aimed at growing the market and Commenced commercial production at Kondapalli Plant, Andhra Pradesh with a capacity of 33,600 MT PA. Roofing Solutions registered a revenue growth of 2% for Q1 FY19 at Rs. 3520.00 mn as against Rs. 3451.60 mn in the corresponding previous year. Building Solutions Revenues of the company rose by 25% at Rs. 1164.70 mn in Q1 FY19 as compared to Rs. 934.40 mn in the Q1 FY18. Net Sales and PAT of the company are expected to grow at a CAGR of 13% and 32% over 2017 to 2020E, respectively. Sector Cement & Cement Products BSE Code 509675 Face Value 10.00 52wk. High / Low (Rs.) 2448.00/1091.00 Volume (2wk. Avg.) 3829 Market Cap (Rs. in mn.) 16412.84 Annual Estimated Results(A*: Actual / E*: Estimated) Years (Rs. in mn) FY18A FY19E FY20E Net Sales 13250.50 15635.59 18137.28 EBITDA 1706.80 2030.68 2358.83 Net Profit 807.50 1017.54 1212.12 EPS 107.81 135.85 161.83 P/E 20.33 16.13 13.54 Shareholding Pattern (%) As on June 2018 As on Mar 2018 Promoter 40.99 40.99 Public 59.01 59.01 Others -- -- 1 Year Comparative Graph HIL LTD S&P BSE SENSEX PEER GROUPS CMP MARKET CAP EPS(TTM) P/E (X)(TTM) P/BV(X) DIVIDEND Company Name (Rs.) Rs. in mn. (Rs.) Ratio Ratio (%) HIL Ltd 2191.30 16412.84 128.06 17.11 2.90 225.00 J. K. Cement Ltd 786.50 55169.10 44.60 17.69 2.57 100.00 Visaka Industries Ltd 600.00 9528.60 46.56 12.89 .14 70.00 Indian Hume Pipe Co. Ltd 273.40 13245.50 13.04 20.97 2.92 170.00
Transcript of th HIL LTD ISIN… · HIL, part of the USD 1.8 billion diversified CK Birla Group has acquired...

Document code: FOTL_200820183_1 Copyright © 2016 Firstobject Technologies Ltd. All rights reserved
HIL LTDResult Update (PARENT BASIS): Q1 FY19
CMP: 2191.30 AUG 20th, 2018
Overweight ISIN:INE557A01011
Index Details SYNOPSISHIL Limited is the flagship company of the C KBirla Group, which is a growing US$1.8 billionconglomerate with diversified interests.Revenue for the quarter rose by 9.91% and stood atRs. 4962.20 mn as against Rs. 4514.60 mn, whencompared with the prior year period.During Q1 FY19, EBIDTA is Rs. 888.00 mn asagainst Rs. 668.80 mn in the corresponding periodof the previous year.During Q1 FY19, Profit before tax stood at Rs.778.60 mn from Rs. 555.50 mn in Q1 FY18, up by40.16%.During Q1 FY19, net profit stood at Rs. 520.40 mnagainst Rs. 368.70 mn in the corresponding quarterending of previous year, an increase of 41.14%.EPS of the company stood at Rs. 69.48 a shareduring the quarter, as against Rs. 49.23 per shareover previous year period.HIL, part of the USD 1.8 billion diversified CKBirla Group has acquired Parador Holdings GmbH,a Germany based leading manufacturer of premiumquality flooring solutions for ~ €82.8 million.HIL launched “Charminar Fortune –non-asbestos,green roofing” solution aimed at growing themarket and Commenced commercial production atKondapalli Plant, Andhra Pradesh with a capacityof 33,600 MT PA.Roofing Solutions registered a revenue growth of2% for Q1 FY19 at Rs. 3520.00 mn as against Rs.3451.60 mn in the corresponding previous year.Building Solutions Revenues of the company roseby 25% at Rs. 1164.70 mn in Q1 FY19 ascompared to Rs. 934.40 mn in the Q1 FY18.Net Sales and PAT of the company are expected togrow at a CAGR of 13% and 32% over 2017 to2020E, respectively.
Sector Cement & Cement ProductsBSE Code 509675Face Value 10.0052wk. High / Low (Rs.) 2448.00/1091.00Volume (2wk. Avg.) 3829Market Cap (Rs. in mn.) 16412.84
Annual Estimated Results(A*: Actual / E*: Estimated)Years (Rs. in mn) FY18A FY19E FY20ENet Sales 13250.50 15635.59 18137.28EBITDA 1706.80 2030.68 2358.83Net Profit 807.50 1017.54 1212.12EPS 107.81 135.85 161.83P/E 20.33 16.13 13.54
Shareholding Pattern (%)
As on June 2018 As on Mar 2018
Promoter 40.99 40.99
Public 59.01 59.01
Others -- --
1 Year Comparative Graph
HIL LTD S&P BSE SENSEX
PEER GROUPS CMP MARKET CAP EPS(TTM) P/E (X)(TTM) P/BV(X) DIVIDEND
Company Name (Rs.) Rs. in mn. (Rs.) Ratio Ratio (%)HIL Ltd 2191.30 16412.84 128.06 17.11 2.90 225.00J. K. Cement Ltd 786.50 55169.10 44.60 17.69 2.57 100.00Visaka Industries Ltd 600.00 9528.60 46.56 12.89 .14 70.00
Indian Hume Pipe Co. Ltd 273.40 13245.50 13.04 20.97 2.92 170.00

Document code: FOTL_200820183_1 Copyright © 2016 Firstobject Technologies Ltd. All rights reserved
QUARTERLY HIGHLIGHTS (PARENT BASIS)
Results updates- Q1 FY19,
(Rs. in millions) June-18 June-17 % Change
Revenue 4962.20 4514.60 9.91%
Net Profit 520.40 368.70 41.14%
EPS 69.48 49.23 41.14%
EBIDTA 888.00 668.80 32.78%
The company’s net profit stood at Rs. 520.40 million as against Rs. 368.70 million in the corresponding quarter ending of
previous year, up by 41.14%. Revenue for the quarter stood at Rs. 4962.20 million from Rs. 4514.60 million, when
compared with the prior year period, up by 9.91%. Reported earnings per share of the company stood at Rs. 69.48 a share
during the quarter, as against Rs. 49.23 per share over previous year period. Profit before interest, depreciation and tax is
Rs. 888.00 million as against Rs. 668.80 million in the corresponding period of the previous year, up by 32.78%.
Break up of Expenditure
Break up ofExpenditure
Value in Rs. Million
Q1 FY19 Q1 FY18 %Change
Cost of MaterialsConsumed 2015.20 1635.80 23%
Purchase of Stock-in-Trade 108.80 80.60 35%
Excise Duty 0.00 464.40 --
Employee benefitsExpenses 303.70 250.10 21%
Depreciation /Amortization 100.60 105.70 -5%
Other Expenditure 1403.40 893.70 57%
Document code: FOTL_200820183_1 Copyright © 2016 Firstobject Technologies Ltd. All rights reserved
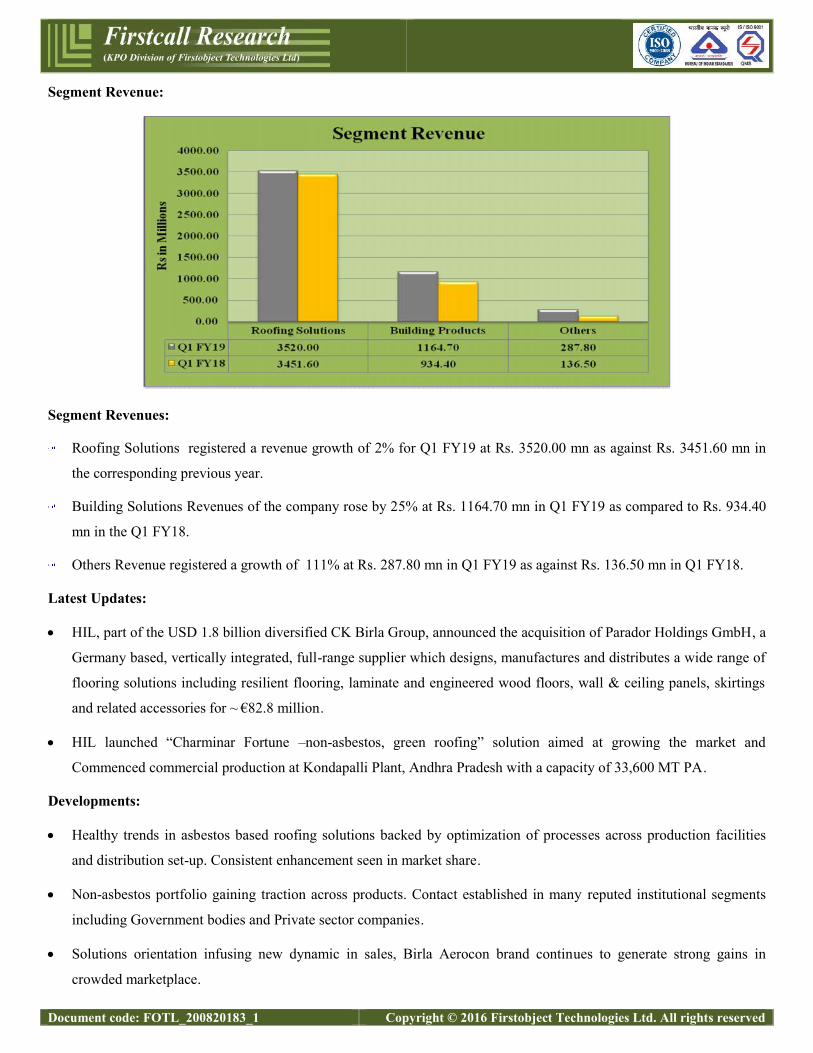
Segment Revenue:
Segment Revenues:
Roofing Solutions registered a revenue growth of 2% for Q1 FY19 at Rs. 3520.00 mn as against Rs. 3451.60 mn in
the corresponding previous year.
Building Solutions Revenues of the company rose by 25% at Rs. 1164.70 mn in Q1 FY19 as compared to Rs. 934.40
mn in the Q1 FY18.
Others Revenue registered a growth of 111% at Rs. 287.80 mn in Q1 FY19 as against Rs. 136.50 mn in Q1 FY18.
Latest Updates:
HIL, part of the USD 1.8 billion diversified CK Birla Group, announced the acquisition of Parador Holdings GmbH, a
Germany based, vertically integrated, full-range supplier which designs, manufactures and distributes a wide range of
flooring solutions including resilient flooring, laminate and engineered wood floors, wall & ceiling panels, skirtings
and related accessories for ~ €82.8 million.
HIL launched “Charminar Fortune –non-asbestos, green roofing” solution aimed at growing the market and
Commenced commercial production at Kondapalli Plant, Andhra Pradesh with a capacity of 33,600 MT PA.
Developments:
Healthy trends in asbestos based roofing solutions backed by optimization of processes across production facilities
and distribution set-up. Consistent enhancement seen in market share.
Non-asbestos portfolio gaining traction across products. Contact established in many reputed institutional segments
including Government bodies and Private sector companies.
Solutions orientation infusing new dynamic in sales, Birla Aerocon brand continues to generate strong gains in
crowded marketplace.
Document code: FOTL_200820183_1 Copyright © 2016 Firstobject Technologies Ltd. All rights reserved
Developing profile in piping business through enhanced range of offering. Capability augmentation across Faridabad,
Golan and Chennai in SWR to strengthen market play .
Outlook:
1. Growth from leadership roofing business through optimised distribution and stronger marketing
2. Investment in creating opportunities for growth in Pipes & Fittings by way of capacity expansion
3. Focus on driving non-roofing portfolio comprising Building Solutions
4. Launched advanced research based non-asbestos roofing solutions to harness existing business strengths and capture
emergent growth opportunities - focus on institutional customers
5. To become one stop shop for all Building Solutions
COMPANY PROFILE
Founded in 1946 and having completed 70 glorious years HIL Limited is an integral part of a burgeoning marketplace. It
is the flagship company of the C K Birla Group, which is a growing US$1.8 billion conglomerate with diversified
interests. With over 20,000 employees, 24 manufacturing facilities and numerous patents and awards, the Group’s
businesses operate in five continents.
Today, HIL is the acknowledged leader in the Building Material space in India. HIL has been honored with the title of
“Asia’s Most Trusted Building Material Company for 2016 by IBC INFOMEDIA. HIL also holds the Super Brand title
and ranks amongst the top 20% of all other Super Brands across all categories in India.
HIL manufactures a comprehensive range of products. Its Charminar brand is an established market leader in roofing
solutions. HYSIL, an industrial thermal insulation is used in a range of applications in energy intensive industries. Birla
Aerocon, provides Green Building Solutions that includes Dry Walling, Wet Walling and Plumbing solution. These are
easy to install, energy efficient along with being superior in quality.
HIL has surged ahead with a deep commitment to re-greening the world: it has adopted a unique “five way green”
philosophy to ensure that products and processes are environmentally friendly from end-to-end. Over 30% of energy
needs are met from renewable sources. The company sources green raw materials with a low carbon footprint and
processes them using green manufacturing that produces least effluents, byproducts and emissions.

Document code: FOTL_200820183_1 Copyright © 2016 Firstobject Technologies Ltd. All rights reserved
FINANCIAL HIGHLIGHT (PARENT BASIS) (A*- Actual, E* -Estimations & Rs. In Millions)
Balance Sheet as of March 31, 2017 -2020EFY17A FY18A FY19E FY20E
ASSETS1) Non-Current Assets
a) Property, Plant and Equipment 4631.40 4497.20 4722.06 4958.16b) Capital Work in Progress 68.60 490.30 612.88 753.84c) Investment Property 215.30 210.10 220.61 233.84d) Other Intangible Assets 230.30 212.90 223.55 232.49e) Financial Assets
i) Investments 17.70 3.70 4.63 5.55ii) Trade Receivables 0.90 0.90 1.04 1.14iii) Loans 76.90 88.00 98.56 108.42iv) Others 1.80 18.00 22.50 26.55
f) Non-Current Tax Assets (Net) 51.20 51.20 53.76 55.91g) Other Non – Current Assets 54.80 154.60 193.25 231.90Sub - Total Non- Current Assets 5348.90 5726.90 6152.82 6607.79
2) Current Assetsa) Inventories 2062.00 1850.60 1998.65 2138.55b) Financial assets
i) Investments 180.60 1205.90 1543.55 1944.88ii) Trade Receivables 863.70 996.60 1126.16 1261.30iii) Cash and Cash equivalents 90.70 109.40 129.09 148.46iv) Other Balances with Banks 9.00 28.40 35.50 43.67v) Other Financial Assets 10.90 7.80 6.63 5.97
c) Other Current Assets 238.70 261.30 279.59 293.57Sub - Total Current Assets 3455.60 4460.00 5119.17 5836.38
Total Assets (1+2) 8804.50 10186.90 11271.99 12444.18EQUITY AND LIABILITIES1) EQUITY
a) Equity Share Capital 74.90 74.90 74.90 74.90b) Other Equity 4960.30 5586.40 6603.94 7816.06
Total Equity 5035.20 5661.30 6678.84 7890.962) Non Current Liabilities
a) Financial Liabilitiesi) Borrowings 589.70 664.70 697.94 725.85
b) Provisions 47.40 58.80 67.62 74.38c) Deferred Tax Liabilities (Net) 453.80 395.30 460.27 506.30d) Other Non Current Liabilities 0.00 45.00 47.25 49.14Sub - Total Non Current Liabilities 1090.90 1163.80 1273.08 1355.67
3) Current Liabilitiesa) Financial Liabilities
i) Borrowings 21.00 0.00 0.00 0.00ii) Trade Payables 1368.80 1963.00 1884.48 1715.44iii) Other Financial Liabilities 700.70 608.60 566.00 537.70
b) Other Current Liabilities 528.50 571.40 605.68 635.97c) Provisions 23.70 94.50 120.96 151.20d) Current Tax Liabilities (Net) 35.70 124.30 142.95 157.24Sub - Total Current Liabilities 2678.40 3361.80 3320.07 3197.55
Total Equity and Liabilities (1+2+3) 8804.50 10186.90 11271.98 12444.17

Document code: FOTL_200820183_1 Copyright © 2016 Firstobject Technologies Ltd. All rights reserved
Annual Profit & Loss Statement for the period of 2017 to 2020E
Value(Rs.in.mn) FY17A FY18A FY19E FY20E
Description 12m 12m 12m 12mNet Sales 12454.20 13250.50 15635.59 18137.28Other Income 225.50 236.40 248.22 273.04
Total Income 12679.70 13486.90 15883.81 18410.33
Expenditure -11414.50 -11780.10 -13853.13 -16051.50
Operating Profit 1265.20 1706.80 2030.68 2358.83Interest -51.80 -38.70 -36.77 -33.09
Gross profit 1213.40 1668.10 1993.91 2325.74
Depreciation -409.50 -469.00 -492.45 -522.00
Exceptional Items -68.80 0.00 0.00 0.00
Profit Before Tax 735.10 1199.10 1501.46 1803.74
Tax -188.90 -391.60 -483.92 -591.63
Net Profit 546.20 807.50 1017.54 1212.12Equity capital 74.90 74.90 74.90 74.90
Reserves 496.00 5586.40 6603.94 7816.06
Face value 10.00 10.00 10.00 10.00
EPS 72.92 107.81 135.85 161.83
Quarterly Profit & Loss Statement for the period of 31st Dec, 2017 to 30th Sep, 2018E
Value(Rs.in.mn) 31-Dec-17 31-Mar-18 30-June-18 30-Sep-18E
Description 3m 3m 3m 3mNet sales 2819.80 3351.50 4962.20 3225.43
Other income 27.70 84.00 50.20 65.26
Total Income 2847.50 3435.50 5012.40 3290.69
Expenditure -2543.10 -3019.40 -4124.40 -2938.37
Operating profit 304.40 416.10 888.00 352.32
Interest -9.30 -13.10 -8.80 -9.50
Gross profit 295.10 403.00 879.20 342.82
Depreciation -100.20 -103.20 -100.60 -106.64
Profit Before Tax 194.90 299.80 778.60 236.18
Tax -52.10 -98.10 -258.20 -76.33
Net Profit 142.80 201.70 520.40 159.85
Equity capital 74.90 74.90 74.90 74.90
Face value 10.00 10.00 10.00 10.00
EPS 19.07 26.93 69.48 21.34

Document code: FOTL_200820183_1 Copyright © 2016 Firstobject Technologies Ltd. All rights reserved
Ratio Analysis
Particulars FY17A FY18A FY19E FY20E
EPS (Rs.) 72.92 107.81 135.85 161.83EBITDA Margin (%) 10.16% 12.88% 12.99% 13.01%PBT Margin (%) 5.90% 9.05% 9.60% 9.94%PAT Margin (%) 4.39% 6.09% 6.51% 6.68%P/E Ratio (x) 30.05 20.33 16.13 13.54ROE (%) 95.67% 14.26% 15.24% 15.36%ROCE (%) 72.42% 19.57% 20.85% 21.32%Debt Equity Ratio 1.07 0.12 0.10 0.09EV/EBITDA (x) 13.23 9.22 7.58 6.36Book Value (Rs.) 76.22 755.85 891.70 1053.53P/BV 28.75 2.90 2.46 2.08
Charts

Document code: FOTL_200820183_1 Copyright © 2016 Firstobject Technologies Ltd. All rights reserved
OUTLOOK AND CONCLUSION
At the current market price of Rs. 2191.30, the stock P/E ratio is at 16.13 x FY19E and 13.54 x FY20E respectively.
Earning per share (EPS) of the company for the earnings for FY19E and FY20E is seen at Rs. 135.85 and Rs. 161.83
respectively.
Net Sales and PAT of the company are expected to grow at a CAGR of 13% and 32% over 2017 to 2020E
respectively.
On the basis of EV/EBITDA, the stock trades at 7.58 x for FY19E and 6.36 x for FY20E.
Price to Book Value of the stock is expected to be at 2.46 x and 2.08 x for FY19E and FY20E respectively.
Hence, we say that, we are Overweight in this particular scrip for Medium to Long term investment.
INDUSTRY OVERVIEW
Real Estate Industry Overview
The real estate industry is the second-largest generator of direct employment, the first being agriculture. It has a larger
multiplier effect, as it affects more than 250 ancillary sectors. The real estate prices have undergone a rough journey but
they have stabilized henceforth. In larger cities, the market for Indian real estate looks very bullish for the next five years.
The demonetisation base effect posed a real challenge for the real estate market in 2017. The sales volume went down by
62% from the peak of 2011. It recorded a seven-year low sales volume with 7% decline as against 2016. Bangalore
registered a drop of 34%, while Mumbai and NCR markets dipped by 19% and 21%. Hyderabad recorded the lowest rate
of home launches in a decade. There was a decline in the weighted average prices by an average of 3% across cities, with
Pune registering the highest drop of 7%, followed by Mumbai at 5%.

Document code: FOTL_200820183_1 Copyright © 2016 Firstobject Technologies Ltd. All rights reserved
The effects of demonetization on the residential real estate market are gradually waning as housing sales across the top
eight property markets for the third quarter of FY18 have surged to 51701 apartments, with a 28% increase over the last
year. However, the total sales for the second half of 2017 across key markets like the Mumbai Metropolitan Region,
National Capital Region, Bangalore, Pune, Chennai and Hyderabad fell by 2% compared to the last year, to 107316 units.
It implies that although the effects of demonetisation are dwindling, the market hasn’t entirely revived.
Residential Real Estate:
Construction during the first three months slowed down because of demonetization of last fiscal year but picked up in the
second quarter. The residential sales saw a healthy growth during the second quarter of FY18, boosted by affordable
housing. The Goods & Services Act is also expected to have a major impact on their business by bringing in more
transparency into the sector. The residential market may not witness a sparkling revival in 2018, but it’s expected that the
recovery and growth from here onward will be well-grounded and backed by stronger market fundamentals than ever
before.
Commercial Real Estate:
Supply of premium office space fell nearly 50% in the first half of this year across eight major cities, as compared to the
same period last year, which is why all markets are experiencing a slowdown. The highest decline was witnessed by
Mumbai at 72%, followed by Pune at 45% and Bangalore at 23% in the first half of 2017-18. Nevertheless, the demand
and supply is likely to regain its pace as the geo-political tensions and economic upheavals across the globe are expected
to stabilize.
Outlook:
Real Estate industry is expected to grow at 5-6 % CAGR between FY 2017-20 Cement consumption is expected to grow
by 5.0-5.5 percent in FY18 on the back of increased spends on roads and railways, push towards affordable housing by
central Government and materialisation of pent-up demand.
Initiatives by the Government and others:
Real Estate Act:
The Real Estate (Regulation and Development) Act, 2016 was approved by the President on March 25, 2016, makes the
registration of all projects obligatory with a clear deadline, instills confidence in buyers by empowering them to cancel
booking and get refunds and calls for penal action for non-delivery etc. The implementation of RERA had adversely
impacted new launches in last 6 months, as the industry still deals with the lasting effects of demonetization.
Smart City Project:
The Smart Cities Mission was launched by Honorable Prime Minister Narendra Modi in 2015 with a total budget of
98000 Crores. Through this initiative, the Government has a mission to develop 100 cities all over the country by making
them sustainable and citizen-friendly. The central and the state governments would be aiding the cities financially
between 2017 and 2022, so that the results start to show from 2022.

Document code: FOTL_200820183_1 Copyright © 2016 Firstobject Technologies Ltd. All rights reserved
As a result, this Smart City Project is a huge opportunity for the real estate companies. On June 22, 2017, Union Minister
Venkaiah Naidu announced the names of 30 more cities which were to be added to the list of smart cities, thus making it a
total of 90 cities till now.
Building Material Industry:
The building material industry is always changing. It is fragmented with a huge number of unorganized players
responding only to local demand, so that they can avoid large transportation costs. The unorganized segment has a high
market share of about 50% to 70% in the building materials sector. In the past five years the building material industry
grew at a CAGR of 12%. The different segments of the industry are Cement, Structural Steel, Bricks, Paints, Plumbing,
PVC, Ceramic tiles, Plywood, Laminates and Lighting.
After the implementation of GST, the building material players across various sub-segments registered a substantial
decline in volumes due to destocking by trade channel in June. However, the new tax regime will help in consolidation of
market and build transparency at each stage, thereby supporting the organized sector.
With slower capacity additions and revival in demand, capacity utilizations are expected to increase in FY19. The
building material industry is also expected to experience a rise in demand as from both new and old projects in India. The
building material industry has an abundance of growth potential which is expected to continue into 2018-19. With the
market unfolding and expanding in the recent years, this industry will continue to make its presence known. Also, the
building materials industry will get a boost with Government focusing on infrastructure development, rural electrification
as well as housing and roads.
Roofing Industry:
The growth in the construction industry is currently one of the main drivers of the roofing industry. Moreover, the
growing and consistent development in the rural economy is further boosting the demand for this market. Out of 21 Crore
houses in rural area, about 54% of the houses are not built properly The significant deficit of well-constructed cemented
houses offers an extremely good opportunity of sustained growth of both new age construction practices and building
products.
Loan waiver:
So far, three major states-Uttar Pradesh (UP), Punjab and Maharashtra-have announced large-scale farm debt waivers.
The cumulative debt relief announced by the three states amounts to around H77000 Crore or 0.5% of India’s 2016-17
GDP. This initiative of the Government would help the farmers to divert their income from paying heavy interest to build
pucca houses.
Minimum support prices (MSP):
Following consecutive years of low crop prices which led to farmer protests in several states, Government on budget day
announced that they will fix minimum support prices (MSP) at 50% over costs; ceding to a major demand of farmer
organizations. To help farmers receive better prices for their harvest, the budget also promised to create an “institutional

Document code: FOTL_200820183_1 Copyright © 2016 Firstobject Technologies Ltd. All rights reserved
mechanism” which will forecast future prices and demand, develop policies for use of futures and options, expand use of
warehouse depository systems and take decisions relating to exports and imports. This will help the poor farmers to
improve their standard of living and the demand for convenient roofing product would increase.
Credit linked subsidy scheme (CLSS):
CLSS comes under the Pradhan Mantri Awas Yojana (PMAY) - Housing for All (Urban) by 2022 scheme and is for the
beneficiaries of Economically Weaker Section (EWS), Low Income Group (LIG) and Middle Income Group (MIG). On
November 17, 2017, the Government has increased the carpet size for the MIG-I and MIG-II from 90 square meters to
120 square meters and 110 square meters to 150 square meters respectively. The Government’s decision to provide
interest subvention of 3% and 4% for loans of up to H12 lac and H9 lac, respectively under the Pradhan Mantri Awas
Yojana is expected to boost low-income housing in peripheral areas of urban localities across the country. In rural areas a
3% subvention will be given on loans of up to H2 lac to build and expand existing houses. The Central Government has
also decided to increase the number of homes to be built in rural areas under the Pradhan Mantri Awas Yojana by 33%.
Fibre cement sheet market overview:
Fibre Cement Sheets is an oligopoly market with the top four players collectively controlling two-third of the market.
There are 17 players in this industry with about 63 manufacturing units.
Cement fibre sheets, being predominantly used in rural market, has its fortunes closely linked with the rural economy.
Branding and distribution reach are key parameters in the business.
The fibre cement sheets industry is cyclical in nature, with March and June quarters being the best quarters for the
industry historically. The September and December quarter are weak quarters for the sector.
The overall roofing industry was valued at Rs 42000 Crore in 2017-18 and is expected to grow at 6%-8% depending on
GDP growth, rural incomes and abundant monsoons. The reduction in GST rate for roofing products from 28% to 18%
has made cement asbestos sheets price competitive as compared to metal sheets which are still at their pre-GST level of
18%. In India, almost 60% of rural population use thatched roof/tiles for their shelters. Thatched roofs need regular
replacement and tiled roofs need continued maintenance. Therefore, whenever the economic conditions improve, the first
choice of the rural poor is to replace the roof over their head with the affordable and relatively durable products i.e.
cement asbestos sheets.
Outlook:
With a revenue growth rate of 14% the Company, through its efficiency and experience, has bounced back to growth path
after a gap of 2 years. HIL will continue to make a focused investment in branding in coming years. With a move to
streamline the company’s operations and make it more efficient, company has aggressively reduced its working capital
significantly from 17% in FY 16 to 4% of sales in FY 18 which is the lowest ever working capital in its history.

Document code: FOTL_200820183_1 Copyright © 2016 Firstobject Technologies Ltd. All rights reserved
Disclosure Section
The information and opinions in Firstcall Research was prepared by our analysts and it does not constitute an offer orsolicitation for the purchase or sale of any financial instrument including any companies scrips or this is not an officialconfirmation of any transaction. The information contained herein is from publicly available secondary sources and dataor other secondary sources believed to be reliable but we do not represent that it is accurate or complete and it should notbe relied on as such. Firstcall Research or any of its affiliates shall not be in any way responsible for any loss or damagethat may arise to any person from any inadvertent error in the information contained in this report. Firstcall Research and/or its affiliates and/or employees will not be liable for the recipients’ investment decision based on this document.
Analyst Certification
The following analysts hereby state that their views about the companies and sectors are on best effort basis to the best oftheir knowledge. Unless otherwise stated, the individuals listed on the cover page of this report are research analysts. Theanalyst qualifications, sectors covered and their exposure if any are tabulated hereunder:
Name of the Analyst Qualifications SectorsCovered
Exposure/Interest tocompany/sector UnderCoverage in the CurrentReport
Dr.C.V.S.L. KameswariM.Sc, PGDCA,M.B.A,Ph.D (Finance)
Pharma &Diversified No Interest/ Exposure
U. Janaki Rao M.B.A CapitalGoods No Interest/ Exposure
B. Anil Kumar M.B.A Auto, IT &FMCG No Interest/ Exposure
M. Vijay M.B.A Diversified No Interest/ ExposureV. Harini Priya M.B.A Diversified No Interest/ ExposureB. Srikanth M.B.A Diversified No Interest/ Exposure
Important Disclosures on Subject Companies
In the next 3 months, neither Firstcall Research nor the Entity expects to receive or intends to seek compensation for anyservices from the company under the current analytical research coverage. Within the last 12 months, Firstcall Researchhas not received any compensation for its products and services from the company under the current coverage. Within thelast 12 months, Firstcall Research has not provided or is providing any services to, or has any client relationship with, thecompany under current research coverage.
Within the last 12 months, Firstcall Research has neither provided or is providing any services to and/or in the past has notentered into an agreement to provide services or does not have a client relationship with the company under the researchcoverage.
Certain disclosures listed above are also for compliance with applicable regulations in various jurisdictions. FirstcallResearch does not assign ratings of Buy, Hold or Sell to the stocks we cover. Overweight, Equal-weight, No-Weight andUnderweight are not the equivalent of buy, hold and sell. Investors should carefully read the definitions of all weightsused in Firstcall Research. In addition, since Firstcall Research contains more complete information concerning theanalyst's views, investors should carefully read Firstcall Research, in its entirety, and not infer the contents from theweightages assigned alone. In any case, weightages (or research) should not be used or relied upon as investment advice.

Document code: FOTL_200820183_1 Copyright © 2016 Firstobject Technologies Ltd. All rights reserved
An investor's decision to buy or sell should depend on individual circumstances (such as the investor's own discretion, hisability of understanding the dynamics, existing holdings) and other considerations.
Analyst Stock Weights
Overweight (O): The stock's total return is expected to exceed the average total return of the analyst's industry (orindustry team's) coverage universe, on a risk-adjusted basis, over the next 12-18 months.
Equal-weight (E): The stock's total return is expected to be in line with the average total return of the analyst's industry(or industry team's) coverage universe, on a risk-adjusted basis, over the next 12-18 months.
No-weight (NR): Currently the analyst does not have adequate conviction about the stock's total return relative to theaverage total return of the analyst's industry (or industry team's) coverage universe, on a risk-adjusted basis, over the next12-18 months.
Underweight (U): The stock's total return is expected to be below the average total return of the analyst's industry (orindustry team's) coverage universe, on a risk-adjusted basis, over the next 12-18 months.
Unless otherwise specified, the weights included in Firstcall Research does not indicate any price targets. The statisticalsummaries of Firstcall Research will only indicate the direction of the industry perception of the analyst and theinterpretations of analysts should be seen as statistical summaries of financial data of the companies with perceivedindustry direction in terms of weights.
Firstcall Research may not be distributed to the public media or quoted or used by the public media without the expresswritten consent of Firstcall Research. The reports of Firstcall Research are for Information purposes only and is not to beconstrued as a recommendation or a solicitation to trade in any securities/instruments. Firstcall Research is not abrokerage and does not execute transactions for clients in the securities/instruments.
Firstcall Research - Overall StatementS. No Particulars Remarks1 Comments on general trends in the securities market Full Compliance in Place2 Discussion is broad based and also broad based indices Full Compliance in Place3 Commentaries on economic, political or market conditions Full Compliance in Place4
Periodic reports or other communications not for public appearanceFull Compliance in Place
5 The reports are statistical summaries of financial data of the companies as and whereapplicable
Full Compliance in Place
6 Analysis relating to the sector concerned Full Compliance in Place7 No material is for public appearance Full Compliance in Place8 We are no intermediaries for anyone and neither our entity nor our analysts have any
interests in the reportsFull Compliance in Place
9 Our reports are password protected and contain all the required applicabledisclosures
Full Compliance in Place
10 Analysts as per the policy of the company are not entitled to take positions either fortrading or long term in the analytical view that they form as a part of their work
Full Compliance in Place
11 No conflict of interest and analysts are expected to maintain strict adherence to thecompany rules and regulations.
Full Compliance in Place

Document code: FOTL_200820183_1 Copyright © 2016 Firstobject Technologies Ltd. All rights reserved
12As a matter of policy no analyst will be allowed to do personal trading or deal andeven if they do so they have to disclose the same to the company and take priorapproval of the company
Full Compliance in Place
13Our entity or any analyst shall not provide any promise or assurance of any favorableoutcome based on their reports on industry, company or sector or group
Full Compliance in Place
14 Researchers maintain arms length/ Chinese wall distance from other employees ofthe entity
Full Compliance in Place
15No analyst will be allowed to cover or do any research where he has financial interest
Full Compliance in Place
16 Our entity does not do any reports upon receiving any compensation from anycompany
Full Compliance in Place
Firstcall Research Provides
Industry Research on all the Sectors and Equity Research on Major Companiesforming part of Listed and Unlisted Segments
For Further Details Contact:Mobile No: 09959010555
E-mail: [email protected]@firstcallresearch.comwww.firstcallresearch.com