Tfceank IPOR ipfiP Tfoort - Defense Technical Information ... · polytone and multivalued...
50
Tfceank ipfiP Tfoort IPOR WO NEW APPROACHES TO FACTOR ANALYSIS ANNUAL TECHNICAL REPORT JUNE, 1953 INTERNATIONAL PUBLIC OPINION RESEARCH, INC. KViiikt STATE BUILDING. NEW YORK CITY
Transcript of Tfceank IPOR ipfiP Tfoort - Defense Technical Information ... · polytone and multivalued...

Tfceank ipfiP Tfoort IPOR WO NEW APPROACHES TO FACTOR ANALYSIS
ANNUAL TECHNICAL REPORT
JUNE, 1953
INTERNATIONAL PUBLIC OPINION RESEARCH, INC.
KViiikt STATE BUILDING. NEW YORK CITY

TWO NEW APPROACHES TO FACTOR ANALYSIS
Prepared for:
Office of Naval Research
By
iHtermatiomal Public Opinioa Research, lac. &
Israel Institute ef Applied Social Research
Juae, 1#3

I
c
X
ANNUAL TECHNICAL REPORT
Contract No. Nonr - 731(00)
TWO NEW APPROACHES TO FACTOR ANALTSIS
This project has been concerned during the past year with elaborating and empirically testing some new approaches to the problem of factor analysis. Three kinds of content have been studied:
(a) mental ability tests
(b) personality schedules and ratings
(c) attitude questionnaires
With respect to contents of types (a) and (b) above, table* of product- moment correlations were culled from those published in the scientific literature. Many of these had already been subjected to older types of factor analyses (usually in the sense of Thurstone). The work of the project was to analyze (or re-analyze) these data according to the new approach called that of the radge.
With respect to the attitudinal data (c) above, all the available tabula- tions from all the researches of the Israel Institute of Applied Social Research were scrutinized, and those that seemed most appropriate on certain a priori grounds (to be described below) were selected for an intensive new type of analysis. These tabulations were unpublished, and indeed are of the type that are rarely published — even in the most extended reports — by research organizations, since they are so bulky and deal with what are usually considered too minute detailsc
The basic attitudinal tabulations needed are the complete scatterg.-am of one scale against another, with around ten distinct ranks (scores or intervals) for each scale separately. A further requirement is that the total sample be large enough so that each rank have an average of not much less than on* hundred cases. A further and crucial desideratum is that each scale separately be unidimensional in the scalogram sense, so that it have psychologically meaningful principal components. It is the polytone and multivalued relationship among attitudes — as theoretically- generated when they have a principal component in common — that was studied empirically in this part of the projectc
A major technical difference here between the new factor theories, then, is that the radex was studied only with respect to variables whose mutual regressions were supposedly linear (hence univalued and monotone), and where in particular product-moment correlations were sufficient parameters.
"IFOR, Inc.

This type of relationship .seems to hold among scores.on current mental tests. -In contrast, a-fundamental point of departure our project makes with respect to attitude data is thafit rejects the hypothesis of linearity ~ or more, generally of Kosotcmicity-and single-valuedness. In effect, our project's findings.support clinical psychologists' objections to the use of conventional statistical techniques in trying to study the structure of attitudes, or to find out what attitudes have in common. Our empirical results verify that in many cases pclytone and multivalued regression systems hold between two different scalable attitudes... This has been predicted by the sealogram theory, and is how amply verified empirically (for the first time) in tb* present project. Complete seattergrams are needed for this purposej_correlation coef- ficient* and the 3ike are often worse than useless (they are U3ually close te=2ero), i^?r-they aistract -attention from the more fundamental aspects of multivaluedness.
The beginnings of^she-theC'ry_of the ^^dej: .j»?J> 4aye3#p:ed by the project leader, Louis GutSfiian,^^^ the special cases of the _sii«|3|jtjj3^^ presented orally by him in a lecture tour of leadiiig J&erican. •universities in the spring of I°5>1. vS^{^^.:^^b^M?^^i^^3!^:4^^^^L examples of simplexes were a-wailable thert^ and only c-ne ^{somewMt dubious) empirical example of a eiremmplex.
The present ONR project began actual work in January, 1°52, and has steadily discovered example after example of well-tested simplexes and circumplexe*. Hie term radex was invented in the__middle of the project in order to help concretize the full outline that was emerging from the work.
Halfway through the project, the Director had occasion to write a rather detailed exposition of both the theory and empirical verification of radex theory. This was neminaliy"tp be.only a written version of his previous oral lectures in tile United States., \ In fact, it is an almost completely new, and rgreatly expanded, presentatias, tjased on the em- pirical materials already completed to that time by the present project. This monograph of overTlOO manuscript pages will appear in the fall of 1953 in a volume edited by Paul"IT. Lazarsfeld, entitled Mathematical Thinking in the Social Science!,, and will constitute the" first scientific publication resulting from this project.. Some extensions of the theory presented there are already necessary,-as will be indicated in the present report.
The multivalued relaticnships^JSffiGng attitudes require an entirely new departure in computing techniques. No existing methods of determining regressions are appropriate, since they all assume single-valuedness in at least one direction. Over half of the project, in this direction, was spent in trying to perfect the theory and practice of computing. After laborious explorations into numerous blind alleys, two standard and complementary computing procedure* emerged. Neither by itself is

4' sufficient for all occasions. It seems that it can be argued on theoretical (purely mathematical) grounds that no one computing system will succeed under any and all circumstances. The pair of procedures ve hare developed are quite workable in practice, and seem quite safe, especially when one is used to check the other. One is called the technique of quantilea,and the other of latent vectors. They tackle the problem in an entirely dif- ferent manner from each other.
The second of the computing procedures requires latent vectors (and [| roots) of certain matrices. Our matrices are of larger order than those
usually handled by physicists and others who do similar computing work in practice on matrices. Existing numerical procedures even for this standard problem of physicists and mathematicians proved too laborious for our data. An excessive amount of labor and tine was needed to get even the simplest numerical answer for only one of our cross-tabulated attitudes. The Project Director was able finally to develop new procedures for computing latent roots and vectors which seem far more rapid than any as yet available* These will be published in the Annals of Mathematical Statistice in a paper by Louis Guttraan entitled: "New Direct and Iterative Techniques for Computing Latent Vectors and/or Boots'1. This will be the second scientific publication resulting from this proiect. While this particular paper has no direct sociological or psychological content, its results were essential for effective furtherance of an Important development of the attitudlnal part of the project.
The ONR may find it useful to call attention of this paper on latent *~ vectors and roots not only to those associated with the Human Relations
Branch, but also to other branches — especially in physics, chemistry, applied mathematics, and computing — where the same type of numerical problem arises and where the new computing procedures of our paper may prove helpful.
In the next part of this report, we shall summarize the year's findings rfith respect to the radex approach to factor analysis. The following part will similarly summarize the year's findings with resoect to inter- attitude relationships. The three Appendices state, respectively, the original purpose of the project, the personnel employed, and the break* down of costs for the entire year.
Much of the data analyzed in this project lend themselves already to be written up in formal fashion for scientific publication. A serlej of articles is being planned for submission to the scientific literature. The problem is also being weighed whether to write a full-length mono- graph on the radez, to complement that already in press. This will depend in part en one extension of the project to a second year. The first year has made quite clear the fact that further fundamental progress in this direction of factor analysis requires assembling original data designed directly to test the radex theory. Data published in the literature have now been used to the extent they can be for this purpose, but they a^e not fully adequate for the complete picture, giving cxily parts a bit at a time.
(- IPOR, Inc.

In an extension tc * »econd year, it would be highly desirable to reas- semble a comprehensive battery of mental test-, according to the streaa<* lining made possible by redex theory, and adadMster it to large samples of different age groups. This would enable a full and direct test of radex theory as a whoi*, instead of simplsxes and cireumplsxes separately as in the past year's work, and simultaneously provide the parsimoneeus batteries for practical prediction use according to the powerful predictive properties of the radex structure*
Results of the Project with Respect
to the Radex
1. Perhaps the most important finding of the project is that it provides ample empirical evidence, on the basis of materials assembled by other investigators with other purposes in mind* that the radex approach t* factor analysis is appropriate for many fields of mental testing, and some aspects of personality assessment* It gives a picture of the ftmc^ ilonal nature of the interrelationships among different abilities &3T' traits, in a Manner not mad® possible by previous approaches.
The conventicmsl multiple cession factor approaches of Thurstone, Bnrt, and others usually posit that a relatively small number of common-factors can explain the observed intercerrelatidns of test data. From the statistical techniques used to estimate these hypothesized common-factors, it is clear that they are (in the limit) but arithmetic averages of the observed tests (cf„ Louis Guttmaa, "Multiple Group Methods for Cesmen- Factor Analysiss Their Basis, Computation, and Interpretation," Psyeheaetrlka, June, V)$2,Y\ i209-222), In these theories, just.as the tests are hypothesized to be weighted sums of the factors, just so are the factors essentially weighted sums of the tests. Therefore, in a sense, the common-factors of these theories are on the same level as the tests.
It is not customary in science to "explain" phenomena by means of phenom- ena on the same level, but an explanation on a lower level is sought* Thus, "water" is explained, by "hydrogen" and "oxygen", but neither of the latter elements is a function in turn of the compound "water"»
In radex theory, it is not hypothesized that a small number of common- factors exists that can be determined as averages of teats« Instead, it assumes indefinitely many (for convenience, even continuation of) common-factors to operate in a test battery, which under certain car— cjmstanceS give rise to orderly arrangements among test inter-cerrela- tions. These orderly arrangements are observable without any specific theory as to the nature of the conmon-factors, and without any calcula- tions aimed at "locating" the coMsoa-i'actors,
-U- SC lac.

s
c
c:
The general theory of the radex has been described in the monograph re- sulting largely from this project (Louis Guttman, "A New Approach to Factor Analysis? The Radex," in Paul F. Lazarsfeld, Mathematical Thinking in the Social Sciences, in press), with special emphasis on two particu- Tarly simple order system*t the simplex and the circuraplex.
One of the surprises of the project's results is the relatively large number of approximate simp]exes and circumplexes found in the existing scientific literature. The simple order patterns to be found in their data have been overlooked apparently by all previous investigators.
2. A corollary of the finding that many empirical data do conform te radex theory is that future testing programs can be made more efficient for prediction purposes and at the same time more economical. Smaller' batteries of tests can be designed according to the observed order pat- terns, and yield better predictions than existing non-order, d batteries. To achieve this goal, of course, requires research outside the scope of the first year's work of this project, but the work completed to date is empirical evidence that the goal is very approachable.
3o A brief description of radex theory is given by the following quota- tion from the monograph in press:
•A set of variables whose intercorrelations conform to the general order pattern prescribed by the new theory will be called a radex. This is a word designed to indicate a 'radical expansion of complexity'.
Two distinct notions are involved in a radex. One is that of a difference in kind between tests, and the other is that of a difference in degree. Each of these notions will give rise to a separate concept of order among tests, sc that a radex is ultimately at least a doubly-ordered system. In this monograph, we shall treat only the simplest case of the radex which can be completely portrayed by a simple, two-dimensional dia- gram. The empirical evidence thus far — as I shall exhibit shortly — shows that mental test data can be surprisingly well accounted for by such a diagram.
"Within all tests of the same kind, say of numerical ability, differences will be in degree. We shall see that addition, subtraction, multiplication, and division differ among themselves largely in the degree of their complexity. Such a set of variables will be called a simplex. It possesses a simple order of complexity. The tests can be arranged in a simple rank order from least complex to most complex,
-5- _ tFOR, Inc."

r a» "Correspondingly, all tests of the same degree of com-
plexity vill differ among themselves only in the kind of ability they define. We shall postulate a law of order here too, but one which is not from least to •most* in ary sense. It 5s an order which has no be- ginning and no end, namely, a circular order, A set of variables obeying such a law will be called a circumplex, to designate a 'circular order of complexity*. Our empirical data will testify that different abilities such as verbal, numerical, reasoning, etc. do tend to have such an order among themselves.
"In the more general case, tests can differ among them- selves simultaneously both in degree and in kind of complexity, and the general structure hero is the radex. Thus, within a radex, one can usually isolate simplexes by keeping the content of the abilities con- stant and by varying the degree of complexity; and one can also usually isolate circumplexes by keeping degree of complexity constant and then varying the context.
"In practice, in this present first effort, ve must begin without knowledge of the ultimate map of the radex. So ve begin by studying separately defined universes of content and see if each is an approximate simplex. Then
( by selecting one test from each universe, we see if a drctnplex emerges. This monograph is devoted to giving examples of this procedure. On a later occasion, when some current empirical work on the radex is completed, I expect to present a fairly detailed radex map of certain human abilities.
"A powerful feature of a simplex structure is its immediate use for prediction purposes. The same holds for a circum- plex structure, as well as for the mcrs general radex. This feature seems largely lacking in previous theories of factor analysis. Radex theory opens a clear path to better predictions with less tests."
U. The practical procedure used in this project to test a given set of data to see if they form a simplex is illustrated by the following example. This example is also a highly practical one for shoving how to get bettor predictions — and with less work — than are being obtained at present from an internationally popular current test battery.
Radex theory has recently interested the Psychological Testing Unit ef the Israel Defence Army. At the December, 1952, annual national meetings of the Israel Psychological Association, Mr. K. Reuben Gabriel reported the following results from the Unit's data. Raven's Progressive Matrices
I - 6 - fltaR, Inc".

c
Test,, consisting of five subtests, was administered to 830 male and female recruits to the Israel Army. The correlations among the subtests were found to be in the following Table 1;
Table 1
Correlations Auong the Five Subtests of
Raven's Progressive Matrices
For 830 Male and Female Recruits to the
Israel Defence Army
Subtest A B c D E
A 1.00 .57 .53 .1*7 .32
B .57 1,00 .6U .5U .35
C .53 .6U 1.00 .66 .39
D .U7 .51 .66 1.00 <52
E .32 .35 c39 62 1,00
These correlations show the typical order pattern of the simplex. The largest correlations are next to the main diagonal, and taper off towards the northeast and southwest corners of the Table. Such tapering alone, however, is not sufficient to prove the existence of a simplex. The next step is to compute the metric inverse of the correlation matrix in Table 1, shown in Table 2.
- 7 - IPOR, Inc.

I»bl« 2
The Inverse Correlation Martrix of
That in Table 1
Subtest A B G D i
A 1.62 "OPE -03li -ol9 -c09
B -c57 1*97 -*75 -026 -o09
C -*3U -o>75 2C26 -o89 -.05
D -.1? -.26' -c89 2S11 -.56
E -.09 =^09 -Oo5 -M 1«38
In the perfect simplex, the inverted correlation matrix must always show positive numbers (greater than unity) in the main diagonal, negative numbers in each diagonal adjacent tc the main one, and zeros everywhere else* In practice, one expects only quasi-siaiplexes and not perfect ones. In practice, then, in place of zeros in all cells that are two or •ore steps removed from the main diagonal, one should expect a rapid tapering off toward zerc This is what Table 2 showse • o
The third step in studying the structI;JTS of the data is to compute the multiple regression weights for predicting each variate from the remain- ing ones in the set, with results as shown in Table 3o
IPOR, Inc8

c
:•
Table 3
Multiple Regression Weights for Predicting Each Subtsst
in Table 1 from the Four Remaining One»
Subtest Subtest Predictor
Multiple Correlation Coefficient Criterion A B C D E
A - .35 .21 .12 .05 .619
B .29 - .38 .13 „oU .700
C .15 .33 - .39 .02 .7U7
D .09 .12 .U2 - .28 .725
E .06 .06 .oU .1*3 - .526
The entries of Table 3 are obtained from the corresponding ones of Table 2 merely by dividing each entry of Table 2 by the main difgonal element of the same row» and reversing the algebraic sign. The main diagonal of Table 3 is left blank, since a variable is not used to predict itself. The multiple correlation coefficient for the .tth variable is computed by the formula:
where dj i» the Ah diagonal element of Table 2 (or of the inverse matrix), and the results nave been recorded in the last column of Table 3.
Table 3 shows directly the economy inherent in the predictive powere of a simplex. In a perfect simplex, all regressions weight* would be zere except for two variatest the one immediately preceding the variate te be predicted and the one immediately following this variate. Four (or more) preuictors are no better than the best two, and the best two are always the closest neighbors to the variate ia question. For example, subtest C is essentially as predictable from only B and D as it is from A, B, D, and E all together.
Perhaps more striking is the fact that sutteat E is as predictable from D alone aa from A, B, C, and D all together. An end test in a simplex cam have but one best neighbor instead of two, and its simple correlation with this neighbor must be essentially equal to its multiple correlation on all the remaining variables in the 3impiex. Subtest S here correlates
- 9 - IPOR, Inc.

.$2 with its best neighbor D, according to Table 1. Jt has substantial and significant correlations with the renaming three subtests, but the latter add nothing to the multiple regression (last line of Table 3) in addition to Dj the multiple correlation iii .526. which does not differ significantly from the simple correlation ,$?.. Similarly-; the first sub- test A correlates .57 with its closest, neighbor B, and has a multiple correlation of only .619 (TVole 3) on B, C, D, and K combined.
If the simplex contained a million variate- and not just five, the same parsimonious regressions would hold. Its two clcsest neighbors alone will give essentially as good a prediction of a particular member of the simplex as will all the million (minus the criterion) combined.
The same parsimony will tend to hold true with respect to predicting a criterion outside the simplex. Barring certain exceptional circumstances, an outside criterion will usually tend to have its regression weights on the variates of a simplex fellow the same law of neighboring, sines thsas weights also depend largely on the inverse of the simplex correlation matrix as well as on the correlations of the criterion with the simplex variates separately.
Uae The conclusions of the Israel Defence Army, therefore, are that for most efficient use, the Raven's subtests should be scored and used separ- ately. If their total score should be used instead, this must necessarily correlate very highly with the ;oiddle subtest C, and in general will pre- dict no criterion better than will subtest C alone. That is, if only a single all-purpose score must be used, subtest C alone is in general just as good as the total score on all five subtests, and of course, is just one-fifth as difficult to administer. Time and money can be saved by using only subtest C in practice, with no essential loss of predictability, if only one overall score is to be obtained from the five subtestj.
(That the sum or average of the variates of a simplex must correlate highly with one of the variates of intermediate order is a general theorem. The Israel Army did not make this calculation, but from Tabls 1 it can bs computed that the correlation of subtest. C with the total is .83. The simple correlations of subtest C with outside criteria can be expected to resemble even more closely those of the total score with the selfsame criteria than this .83 might indicate by itself, for the pattern of almost- ssro entries in Table 2 also militates to bring about such a similarity.)
l*b. A second conclusion is that, while subtest C by itself is as good in general for predictive purposes as is the sum of all five subtests, never- theless for particular purposes one or two of the other subtests may be even better than either C or the total scor*. For example, if a criterion requires a low level of complexity of the ability studied by these tests, then it will correlate highest with subtest. A, and will h ave successively decreasing correlations with the remaxning subtests. This can be checked empirically fo~ any given criterion. Then subtest A alone will yield
- 10 - IPOR, Inc.

r
0
2
essentially the same correlation with the criterion as will the multiple regression on all five subtests, and this is in general a higher correla- tion than can be given by the total score on all subtests. Similarly, some other rriterion may require a d-gree of complexity between subtests D and E. Then the multiple on these two tests alone will be as efficient as on all five tests, and better than the total score. Thus less testing, using the one or two most appropriate subtests, can yield better results than using all five subtests and merely adding up the five scores.
The Raven's Test is a very popular one, being used widely throughout the world but much of its predictive power has been wasted in the past by not recognizing and making use of its simplex character.
5. In the existing literature, numerous tables of intercorrelations among many kinds of variables are reported. Many of these are not to b* hypothesized to form simplexes or circumplexes or any other simple order system because of the hodge-podge nature of their content. Our project first had to examine many lists of variables which had been intercorr*- lated by other investigators, to judge whether enough variables could be selected from each given published set which would deal with essentially the sane kind of abilities.
It was found thst for the purposes of simplex analysis, three varieties of abilities were sufficiently tested in a systematic manner so as to enable us to rework published results. These three varieties ares verbal, numerical, and visual. Eight different simplexes are listed below for verbal abilities, some of them overlapping somewhat and other* going off into quite different tangents. Six simplexes are reported belew for numerical abilities, again some overlapping and others not* Eight simplexes of visual abilities are also reported, some overlapping and others net.
In the field of personality rating, we have selected four simplexes to be exhibited in this report, one based on the Rorsrhich ink blots, and the three others on types of ratings by observers.
The 26 simplexes are listed here according to source reference, the number in parentheses following each test rating being the number of the test or rating in the original reference. Each simplex listed here had the inverse matrix and multiple regressions weights calculated, as described for the example of the Raven's Test above, and the numerical results do not depart substantially from that specified by simplex theory. A far larger number of attempted examples is not reported her*. Apart from im- perfections in the tests themselvss (that they may not be scales, for instance), a cause for aberrations from an expected simplex structure is a wandering off into neighboring but different kinds of content. This could not be explored well with the available data, except for certaim circumplexes which will be reported .-•<-, below.
IPOR, Inc.

r
AFFHSCIKATIi SIMPLEXES
I. Abilities
A. Verbal Ability
1) Source: C. C. Brigham, A Study of Error, College Entrance Examinations Board, New lork, i.532
The tests in the simplex order of complexity:
a - Spelling (A)
b - Punctuation (C)
c - Grammar (B)
d - Vocabulary (D)
e - Literature (E)
f - Foreign Literature (H)
2) Source? L. L. Thurstone, Factorial Studies of Intelligence, Psychometric Monographs 2~ Univ. Chicago Press, 19Iil
The tests in the simplex order of complexity;
Parts of words (open ended questions)%
a - Prefixes (U2)
b - Suffixes (5U)
c - First Letters (2l)
d - First and Last Letters (23)
e - Four Letter Words (2b)
Understanding single words
a - Same or Opposite (5l)
b - Vocabulary (U?)
c - Completion (10)
d - Association (6)
e - Synonyms (55) - 12 -
TWR, Inc.
L_
i.
c;
r
Simplexes (Continned)
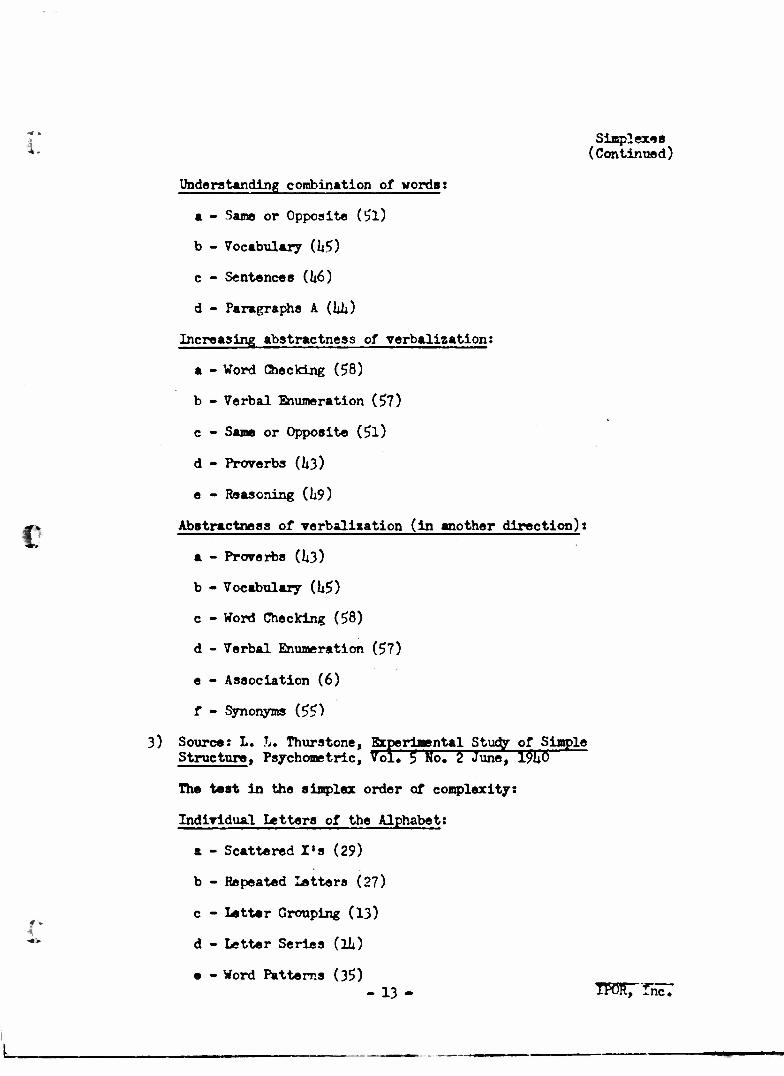
Understanding combination of wordst
a - Same or Opposite (£l)
b - Vocabulary (U5)
c - Sentences (I46)
d - Paragraphs A (Uli)
Increasing abstractness of verbalization;
a - Word Checking (58)
b - Verbal Enumeration (57)
c - Same or Opposite (5l)
d - Proverbs (1*3)
e - Reasoning (1x9)
Abstractness of verbalisation (in another direction)?
a - Proverbs (U3)
b - Vocabulary (li!>)
c - Word Checking (£8)
d - Verbal Enumeration ($7)
e - Association (6)
f - Synonyms (5$)
3) Source: L. L. Thurstone, Bxperlaental Study of Simple Structure, Psychometric, Vol. 5 No. 2 June, 19U0
The test in the simplex order of complexity:
Individual Letters of the Alphabet:
a - Scattered X's (29)
b - Repeated Letters (27)
c - Letter Grouping (13)
d - Letter Series (Uk)
• - Word Patterns (3?) - 13 - IPOR, IncT

F Simplex©a
2* (Continued)
Letters to thoughtat
a - Letter Grouping (13)
b - Letter Series (Hi)
c - Word Petterns (3$)
d - Prorerbs (22)
e - Same or Opposites (28)
f - Completion {$)
B. Numerical Ability
1) Source: L. L. Thurstcne, Primary Mental Abilities, Psychometric Monographs No. 1, Univ. Chicago Press, 1938
The tests in the simplex order of complexity:
a - Addition (31)
i, b - Substraction (32)
c - Multiplication (33)
d - Division (3U)
e - Arithmetical Reasoning (39)
f - Numerical Judgment (38)
2) Source: L. L. Thurstone, Factorial Studies of Intelligence, Psychometric Monographs 2. Unir. Chicago Press, 19U1
The tests in the simplex order of complexity:
a - Number Patters (38)
b - Identical Numbers (30)
c - Multiplication (37)
d - Addition (3)
e - Arithmetic (5)
a IPOR, Inc.

t:
Simplex© a (Continued)
3) Sources L. L. Thurstone, Experimental Study of Simla Structure, Paychometrika Vol. 5. No. 2 June^ ^yliO *p. 163)
The teata in the simplex order of complexity:
a - Addition (i)
b - Multiplication (18)
c - Arithmetic (3)
d - Number Series (20)
e - Squares (31)
U) Sources P. J. Olckera, "A Factorial Study of Arithmetical Ability," Journal of Social Research, Pretoria, South Africa Vol. 2. No. 1 June, 1951
The testa in the simplex order of complexity:
From Table 7, page 1*:
a - Dot Counting (6)
b - Multiplication (3)
c - Subtraction (2)
d - Diriaion (U)
From Table U, page 9*
a - Four Rule* A (1)
b - Four Rules C (6)
c - Fractions (1*)
d • Number Series (U)
e - Problems (10)
From Table 7, page lb:
a - Four Rules A (3)
b - Three Digit Addition (12)
c - Four Rulea B (8)
d - Fractione (6)
e - Arithmetic (21) . 15 - IPOR, Inc.

Simplexes (Continued)
C. Visual Abilities
1) Source: L. L. Thurstone, Factorial Studies of Intelligence, Psychometric Monographs 2. tfniv. Chicago Press, 19U1
The tests in the simplex order of complexity!
a - Dot counting I. (lii)
b - Dot counting III. (16)
c - Dot counting II. (1$)
d - Pursuit (Uh)
e - Maies I. (35)
f - Mazes II. (36)
2) Sources A. Lubin and A* Summerfield, "A square root method of selecting a minimum set of variables in multiple regression," Psychometrika, Vol. 16. No. U. Dec. 1951
The tests in the simplex order of complexity:
a - Stenquist Picture I. (3)
b - Minnesota Assembly (U)
c - Minnesota Spatial Relations (l)
d - Paper Form Boards (2)
e - Interest Blank (5)
3) Source* L. L. Thurstone, Primary Mental Abilities, Psychometric Monographs Ho. 1. uhiv. Chicago Press, 1938
The tests in the simplex order of complexity:
First Sets
a - Lozenges A (19)
b - Surface Development (23)
c - Pursuit (27)
d - Areas (29)
e - Hands (53)
IPOR, Inc.
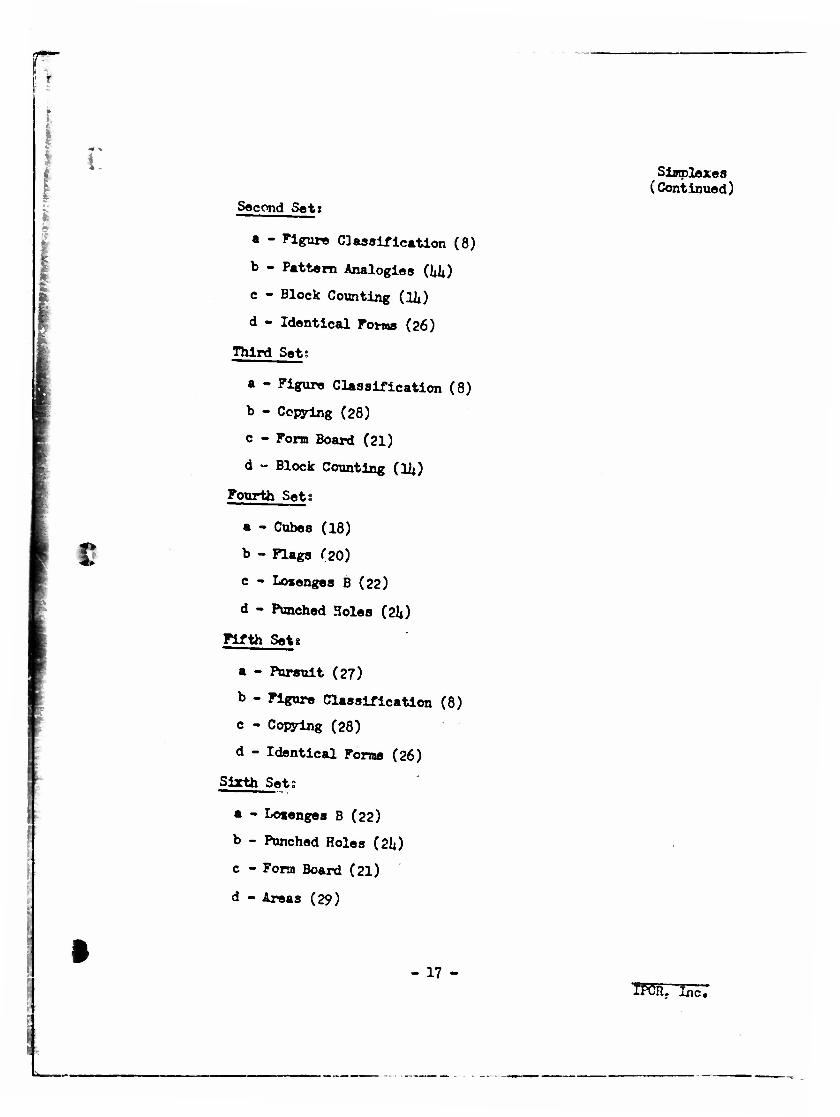
Second Set*
* - Figure Classification (8)
b - Pattern Analogiea (Uh)
c - Block Counting (U*)
d - Identical Forms (26)
Third Set;
a - Figure Classification (8)
b - Copying (28)
c - Form Board (21)
d - Block Counting (U*)
Fourth Sets
* - Cubes (18)
b - Flags f20)
c - Losenges B (22)
d - Punched Holes (2lj)
Fifth Sets
a - Pursuit (27)
b - Figure Classification (8)
c - Copying (28)
d - Identical Forms (26)
Sixth Sets
a - Losenges B (22)
b - Punched Holes (2I4)
c - Form Board (21)
d - Areas (29)
- 17 -
Simplsxes (Continued)
TMR. In'cT

Simplexes (Continued)
II. Personality Traits
1) Scarce: L. L. Thurstone. A Factorial Study of Perception, Univ. Chicago Press, 19lui
The five Rorschach scores in their simplex order of complexity:
a - Weight Color
b - Perceptual Organisation
c - Movement
d - Total Responses
e - Total Tims
2) Source: VT. M. O'Neil, The Construction of a Staff Report Form," Occupational Psychology, Vol. XXVI. No. 3. July, 1952
The ratings in their simplex order of complexity:
a - Accuracy
b - Speed
c - Application
d - Personality
3) Sources The OSS Assessment Staff, Assessment of Msn, Bsinhart Co., New Tork, 19l*8
the Social Relations Ratings in simplex order of complexity (from Table 62, page 520)i
a - Brook
b - Assigned Leadership
c - Interview
d - Discussion
The Energy and Initiative Ratings in simplex order of complexity • Table 5$, page 51?)» If
a - Obstacle
b - Brook
c - Assigned Leadership
d - Debate
e - Discussion - 18 •• IPOR, Inc.

6. Prom the above list of simplexee, it will be clear that some of the original conjecture* of the monograph in press on the radex must already be take* into account. For instance, the firet example discovered of a •Implex since the beginning of radex theory vac of certain verbal ability teats. The nine tests and their intercorrelations were taken from the Thur8tomeo• Factorial Studies of Intelligence, The inverse matrix did shov sonewhat aberrant tapering to zero. Closer examination has now broken this set up into parts that go with other subsets sf tssts into various different — albeit intercorrelated — simplexes in the above list. This part of the radex structure, therefore, by itself indicates that the initial two-dimensional radex of the monograph already is in- adequate to portray the intricacies of the functional relationships. Higher dimensional radexes must be used to portray all the tests simul- taneously. This is further verified by the fact that a drcumplex was found among certain verbal tests alone, as will be reported below in dis- cussing findings on the circumplex.
It is difficult to make a deeper psychological analysis of the structure ef verbal abilities here, because the most Interesting data to compare are from different studies and hence do not have their intercorrelations available. It is sufficient to summarise at this stage that there are several possible different, albeit overlapping, chains of increasing complexity for verbal understanding, as from "Same or Opposite" te "Paragraphs", "Word checking" to "Reasoning" and "Proverbs" to "Synonyms". Similarly, there are several different pathways ef Increasing complexity from parts of words to complete thoughts, as from "Letter grouping" to "Completion" and "Spelling" to "Foreign Literature".
Numerical abilities generally follow the expected path of complexity from addition through division. However, an important point emerges. Addition is more complex than multiplication in one simplex, where six two-digit numbers were to be added while a two-digit number was to be multiplied by only a ene-dlglt number. Complexity here then depends on the sheer number of digits as well as on the nature of the operations*
The visual ability simplexes are usually quite different from each other in the types of tests involved, but generally show that what looks more complicated in existing tests dees require more complex behavior. Also, as might be expected, visualizing solids is more complex than plane figures, than linear ones. Different possible chains of complexity are possible here too, involving some of the same tests, as "Lozenges" and "Punched Holes".
7* It was not expected that personality traits would in general form ordered systems of the same kind as do mental abilities. A major reason for this is the growing pile of evidence at the Israel Institute of Applied Social Research that polytonicity and multlveluedness very fre- quently characterise the regression systems of such data. However,, in .tome cases linear least squares regressions may hold, and hence a radex
- 19 - IFOR, Inc.

In the present sense may be possible. On the other hand, the appearance of such a simple regression system nay be an artifact of the scoring system used, or of ignoring basic features of the phenomena being studied.
In any event, certain Rorscbach scores used in a study by Thurstone vere found to form an approximate simplex, as listed above. Of. the many ratings intercorrelated by the OSS staff, two subsets provided clear simplexes. Many others seem to be fairly approximate simplexes, but the samples were often too small to be reliable, and not enough additional variables were present to study aberrations.
8. One of the most gratifying results of the project is the verification of the existence of a basic circular ordering for certain abilities that differ in kind and not Just in degree of complexity. The circle is, of course, divisible into many segments, or one ability shades into the next gradually, but the following gross landmarks may serve for purposes of orientation. The circle may be regarded as going from verbal abilities, through numerical abilities, then visual, then abstract thinking, and then back to verbal. This is illustrated by the following table of correlations.
Table 1*
An Approximate Clrcumplex ef Various Abilities for
710 Chicago Schoolchildren*
i a • .
Test Association Incomplete Multiplies- Dot ABC Direc- Words tion Patterns tions
(6) (32) (37) (17) (1) (12)
.1*1*6 .321
1. .388
.388 1.
.313 .396
.208 .325
.330 .328
• Data from L. L. Thurstone, Factorial Studies of Intelligence, Psychometric Monographs 2. Univ. Chicago Press. 191*1.
(6) 1.
(32) .1*1*6
(37) .321
(17) .213
(1) .231*
(12) .14*2
.213 .231* ,hh2
.313 .208 .330
.396 .325 .328
1. .352 .21*7
.352 1. .31*7
.21*7 .31*7 1.
- 20 - I»R, IncT

3 The in-Terse correlation matrix was computed from Table h, and then the multiple regression weights were obtained for predicting each test from all the remaining ones, as shown in Table 5.
Table 5
Multiple Regression Weights for Predicting
Each Test in Table h from All the Rest
O
Predictor Multiple
Correlation Coefficients
Criterion Associa- tion
(6)
Incom- plete Words (32)
Multi- plica- tion (37)
Dot Patterns
(17)
ABC
(1)
Direc- tions
(12)
(6) — .30 .10 -.01 .ou .30 .553
(32) .31 — .20 .15 -.02 .09 .510
(37) .10 .21 — .23 .Hi .n .531*
(17) -.01 .16 .2$ — .23 .OU .U86
(1) .01 -.02 .15 .23 — .23 .U65
(12) .31 .10 .11 .03 .21 — .533
The circular order existing among the tests in Table h is reflected by the cyclic rise and fall of the correlation coefficients in each row (column). In contrast to the prerious case of the simplex, the "last" test in Table It is an immediate neighbor of the "first" one. Which test is called "first" is arbitrary in a drcunplex, since the tests differ in kind and not in degree. The circular order is more precisely established by Table 5. In » perfect circumplex, all regression weights must be aero for any test not an immediate neighbor of the one being predicted. In an imperfect or quaai-elrcumplex non-neighbors should tend to have zero or relatively small weights. Thus, in Table 5, "Association" is about as predictable from only its two immediate neighbors, "Incomplete Words" and "Direction", as it Is when the three remaining tests are added as predictors.
- 21 - IPO*, Inc.

Although different tests were involved, the sane circle of verbalfnumericai- viaual-reascning-verbal was found for the sane children as of Table k when greater complexity was involved on the average in each test* The two cir- cunplexes plotted together give already a rough radex with tests differing in kind as well as in degree in the sane picture. Another battery of Thurstone's administered to a different group of children reveals the same kind of circle. The Bellevue-Wechsler battery also reveals the sane circle for two different age groups of adults.
The well-tested circunplexes of this project are as in the following list.
- 22 - 1P0R, Inc.

APPROPRIATE CIRCUMFLEXES
Each set is arranged in circumplex order. It is, of course, arbitrary which test is listed first in the set} another choice would mean merely a cyclic rearrangement of the given 1' "ting.
I. Abilities
1) Sources L. L. Thurstone. Factorial Studies of Intelligence, Psychometric Monographs 2. Univ. Chicago Press, 19U1
Several Different Abilities (one level of complexity):
a - Association (6)
b - Incomplete Words (32)
c - Multiplication (3k)
d - Dot Patterns (1U)
e - ABC
f - Directions
Several Different Abilities (another level of complexity);
a - Digit Span (11)
b - Arithmetic (5)
c - Geometrical Forms (28)
d - Identical Pictures (31)
e - Picture Naming (ltl)
f - Rhyming Words (50)
Different Verbal Abilities:
a - Rhyming Words ($0)
b - Completion (10)
c - Association (6)
u - First Letters (2i*)
- 23 - YPOR, Inc.

Circumplexes (Continued)
2) Sources D. Wechsler, The Measurement of Adult Intelligence, Third Edition, Baltimore, 19UU
For Adults, Agea 20-3U (page 223):
a - Digit Span (3)
b - Arithmetic (h)
c - Block Designs (7)
d - Picture Completion (6)
e - Comprehension (1)
For Adults, Ages 35-U9 (page 2210 »
a - Digit Span (9)
b - Arithmetic (U)
c - Block Designs (U)
d - Picture Completion (6)
e - Comprehension (l)
3) Sources L. L. Thurstone, Primary Mental Abilities, Psychometric Monographs, No* 1, Univ. Chicago Press, 1938
Several Different Abilities (one level of complexity);
a - Division (3U)
b - Pursuit (27)
c - Block Counting (17)
d - Mechanical Movement (25)
e - False Premises (1*2)
f - Theme ($2)
g - Sound Grouping (55)
- 2lj - IWR, Inc.,
v

c
f> Circumflexes 4* (Continued)
Several Different Abilities (another level of complexity)t
<i - Number-Number (!i8)
b - Addition (31)
c - Pursuit (27)
d - Block Counting (17)
e - Completion (11)
f - Word Number (16)
Different Verbal Abilitiesi
a - Pattern Analogies (hh)
b - Code Words (hi)
c - Verbal Analogies (kl)
d - Controlled Association (9)
e - Completion (11)
Different Verbal Abilities (a circle overlapping the previous one)«
a - Pattern Analogies (hh)
b - Code Words (1*3)
c - Verbal Analogies (hi)
d - Reasoning (IjO)
e - False Premises (li2)
h) Sources L. L. Thurstone, "Experimental Study of Simple Structure," Psychoraetrika, Vol. 5. No. 2. June, 19U0, (page 163)
A Clrcumplex formed by omitting the least complex numerical ability (addition) from a short simplex, and adding a test (number patterns) that closes a circlet
a - Multiplication (3J8)
b - Arithmetic (3)
c - Number Series (20)
d - Squares (31)
e - Number Patterns (19) - 25 - IP0R7 Inc*.

Circumplexes (Continued)
5) Source: P. J. Olckers, "A Factorial Study of Arithmetical Ability," Journal of Social Research, Pretoria, South Africa Vol. 2. No. 1. June, 1951, Table h (page 9)
a - Four Rules A (l)
b - Four Rules B (U)
c - Fractions (7)
d - Change (8)
e - Number Series (11)
6) Source: Clyde Coombs, "A Factorial Study of Numerical Ability," Psychometrika, Vol. 6. No. 3. June, 1951, Table 3
a - Figures (26)
b - Siae Comparison (15)
c - A B (U)
d - A B C (5)
e - Forms (6)
f - Marks (30)
7) Sources G. H. Thomson, An Analysis of Performance Test Scores for a Representative Group of Scottiah Children, Univ. of London Press, 19G0"
a - Binet 1. Q.
b - Kohs Block Design
c - Cube Construction
d - Red Riding Hood
e - Healy Picture Completion
V -26- I»ft, Inc.

-«> Circumplexes £ (Continued)
8) Sourcet Ch. H. Goodman, "A Factorial Analysis of Thrustone's Sixteen Primary Mental Abilities," Pschometrika, Vol. 8, No. 3. September, 19U3
(
c - Number Series (15)
b - Cards (7)
c - Identical Forms (1)
d - Verbal Enumeration (2)
e - Same or Opposite (6)
f - Completion (5)
II. Personality Traits
1) Source* F. T. Tyler, "A Factorial Analysis of Fifteen MHPI Scales," Journal of Consulting Psychology, Vol. 15. No. 6. December, 1951
First Set:
a - Psychopathic Deviate
b - Schizophrenic
c - Prejudice
d - Social Introversion
e - Depression
f - Hypochondriasis
Second Set:
a - Masculinity - Feminity
b - Status
c - Dominance
d - Paranoia
e - Hysteria
f - Responsibility
g - Hypomani* - 27 -
tPCR, Inc.

Clrcumpiexes (Continued)
2) Source: W. M. O'Neil, "The Construction of a Staff Report Form," Occupational Psychology, Vol. XXVII. No. 3. July, 1952
a - Mental Alert (6)
b - Knowledge (7)
c - Accuracy (l)
d - Speed (2)
e - Applications (3)
3) Source: Ann Roes "Psychological Tests of Research Scientists" Journal of Consulting Psychology, Vol. 1$. No, 6. Table 3, December, 1951
a - Verbal, number tried
b - Spatial, number tried
c - Mathematical, number tried
d - Rorschach
e - TAT length
h) Source: The OSS Assessment Staff, Assessment of Men, Reinhart Co., New York, 19U8
The Leadership Ratings (from Table 63, page 521):
a - Interview
b - Brook
c - Discussion
d - Debate
e - Ratings by Associates
The Propaganda Skills halir.gs (fro© Table 67, page 52h):
a - 0 W I
b - Manchuria
c - Interview
d - Discus^on t
- 26 - mmrmm _ iPOR. Inc.
r

9. As the above list shows, a circumpxex was found within certain verbal abilities alons, as well as within certain numerical abilities alone and within certain visual abili+ies alone. This proves the possible existence of a continuum of circularly ordered abilities within each kind* as well as a general circular- ordering bet*.-?en the kinds. For this reason, one of the purposes of the project — to provide a simple two-dimensional radex map of all the abilities simultaneously — could not be carried oute A far more comprehensive new testing program, directly aimed at this problem, is needed to provide the basic correlation matrix 'necessary, and a two- dimensional map will certainly not be adequate, although a three-dimensional sphere may prove to be.
This failure, however, doss not negate the practicality of the present findings. Better predictions can be obtained from the sets of \.-sts as is, and with less work, by "capitalising on their circumplex properties alone (regardless of their ultimate place in a more complex radex) than by current usages
1Q» With respect to personality traits, it may be interesting to find in oui" list of circumplexes two.sets of variables from the Minnesota Multiphasie Personality Inventory. Certain personnel ratings also have been found to form circumplexes, as listed above. As remarked in con- junction with our simplexes, this may be due in part to the scoring techniques, siace-multi-valued and pelyfconic relations may be more typical of such data.*
Results of the Project with Respect te
Multivalued and Polytone Attitudinal Interrelations
1, Data from three field studies of the Israel Institute of~ Applied Social Research were found somewhat appropriate for the new kind of analysis developed in this project for multivalued and poiytone relations. Ideal data for this purpose proved difficult to find, since the underlying theory was developed after the completion of some large surveys conducted by the Institute, and no new studies had been made to the time of this project which could be used for this methodological end. Nevertheless our results are sufficiently positive to substantiate the major hypothesis. The future will undoubtedly reveal neater data for further verification, since we now have learned more of what is nesdsd for MOV% elsareut results.
2»: A typical table (in many respects) for this, project is shown below as Table 6.
- 29 - __ IPOR7"E*C7

Table 6
O
s
Frequency CroM Tabulation of Two Scalable Attitudes
Hypothesised to Have Monotonely Related InvolutioBa
Rank OB "Mixed Rank OB "Moroccans as Neighbors" Rousing" 1 2 3-U 5 6 7 8 ? Total
0 1 2 56 1 U5 9 111*
1 u 3 79 2 2 75 11 176
2 1 8 2 150 u U 105 10 281*
3 u u* 1 73 3 7 126 13 214
h 1 3 7U 6 6 67 10 167
5 1 1 2 2li a 2 26 U 6U
6 1 2 3 105 ii 3 56 15 196
7-8 1 3 U6 3 8 73 19 153
9-10 h 6 1 UO 5 10 57 30 153
Total 17 U0 12 6U7 39 U2 630 121 15U8
The horiseatal rarlable is ranks en a quasi-scale of attitude toward liv- ing together with Meraccaas 1B a housing project. The vertical variable is ranks OB a seals of attitude toward living in a "mixed" housing project- that is, one containing immigrants from various countries of origin — but not specifying the countries. The analysis of the table is based OB the following considerations.
- 30 - IPOR, Inc.

Fig-ire 1
Theoretical Relationship of the Involution
(Fourth Principal Component) of a Scalable
Attitude With that Attitude
Involution
0 Attitude
The psychological theory of principal components of scales has be«j developed elsewhere (cf. Louis Outtman, "The Principal Comwnent* of Scalable Attitudes," in Paul F. Lazarsfeld editor, Mathematical Thlmdng in the Social Sciences, in press). According to this the involution", or fourth principal coaponent of a scale like attitude toward Moroccans should plausibly be a scale ons "Is the respondent actively reviewing his position on this problem or not?" Since the data on hand were assembled before the psychological theory of +he fourth principal component was clear, a scale directly ainsd at the Involution of "attitude toward Moroccans as neighbors" was not included. Had such an involution scale been available, it a/iouid h*ve yielded ideally a perfect curvilinear regression on the attitude toward Moroccans of the type shown in Figure 1.
Now, suppose that a second attitude had exactly thi s same involution for its own fourth principal component. In aucn a case, we niu?1; have the striking type of joint relationship between ti»e two attitudes illustrated by Figuri 2,
V - 31 - IPOR. Inc.

giggre 2
Theoretical Relationship Between
Two Different Scalable Attitudes
Having the Same Involution
Second Attittde
First Attitude
JJn both figures 1 and 2, we have drawn the regres^on curves as symmetric cal about the zero point (as defined by the inlJsiisity'et^second principal component) and also as polygon rather than with smooth bends. This is only for convenience here, and does not of course represent the general cass.3
The novel feature of Figure 2 is that it shows each attitude to be in general a multivalued function of the other. To each value of one atti- tude, there corresponds in general more than one ideal value of the other. This is a result of the polytone regression of the comon involution on each attitude separately, as in Figure !•_ In Figure 1, the attitude con- tinuum can be broken up into four segments in each «? which there is a monotone relation of the involution"te the attitude, the direction or sign of the relationship alternating from segment to segment. The same would be true of the corresponding figure for the same attitui©. In «ross- tabulating the two attitudes to get Figure S, it must be that each monotone
- 32 IFtiR, Inc.

segment of the second attitude must allow the full polytone relationship to appear with respect to the first attitude. This is shown in the top segment, cut off by the first inserted broken line, in Figure 2. The next segment must allow the^same bending?* but with reversed direction^, etcc The same holds if we regard in turn monotone segments of the first attitude and how they relate to the second0
Now, it is not hypothesized-that the two empirical attitudes in Table 6 above have the same involution. To the contrary." Instead, it is hypothe~ sized that the two involutions have a monotone_ relationship wxth each other in each direction. The more a respondent is actively reviewing his position on Moroccans as neighbors, the r~re —> on the average ~ he is reviewing his position on mixed housing in general £ and vice versa,, If this be tru«$ Table-6 should resemble Figure 2,-but with random error — indeed considerable error. Cur calculations tend to-verify ~thise
3o The quaatile^fcechniqae^^^illustrated -^for-Tables 6. ^consist s simply of computing for each column or C2ude_scale-rankg as-many position values as rows along^ the percentHe metric of the vertical scale, and then doing the analogonjr computing for each row. For example,, the row for ranks 9-10 in Table 6 has a marginal total of 1$3 out of' the grand total of lSk&9
or 9.8/S. This means this rank covers the percentile from 0 to 9.8, with midpoint at it. 9. In each rank column separately^ therefore the y.8 per- centile is sought, and then interpolated into the percentil© metric of the marginal total,rand again the midpoint taken. Thus the 9.8 percentile from the bottom ©f colum 9 ©f theHahle is «09JB IT 30 ©f th« way up the
,^^121 row 9=10, or .39 of the interval from zero to jrfv of the marginal total.
The midpoint of this is pl©tted as in-Figure 3«
Each column has as many quantiles as there are rows, and the corresoond- ing ones are connected by straight lines. If there were complete statis- tical independence, the lines would all be perfectly straight- and horizontal. If there were a monotone regression of the vert.5 1 scale on the horizontal one, the lines would all tend to slope in one direction^ say from the south- west to the^ northeast corner of the picture0
But we see a polytone pattern revealed by Figure 3, roughly as hypothesized.
Computing the quantiles in the analogous manner,- but for each row of Table 6 leads to the picture in Figure lu Again a polytone pattern is revealed.
IPOR, Inc.

Figure 3
The Quantiles for Each Column of Table 6
In the Percentile Metric of the Row Marginal Totals
4(3 Zl
t - 32» - IPCR, Inc.

i
Figure U
The Quantiles for Each Row of Table 6
In the Percentile Metric of trie Column Marginal Totals
O
IPOR, Inc.

U* The drawbacks of tne quantile procedure a~e quite evident her*, ea well as its virtues„ Beth Figure 3 and Figure k should resemble Figure 2, taking error iafce account* There are at least twe sources ef error0 One is that the (hypothesised) relationships between the tee involution* is not perfectj albeit monotonej there is regression error hypothesised in both directions. The other is the usual one of having only approxi- ir.ate scales to begin with and not perfect one« with some resultant ^unreliability of seals ranks*.
The quantile computations can introduce a third source of error, namely the arbitrariness of the observed rank interval, or of the observed cutting points along the two scales„ Even if the first two sources of error were not present, this third source could still distort the quantile pictures, The third source creates disturbance whenever a bending poiat of the coidaon principal component — as in Figure 1 — dees sot coincide exactly with an observed cutting point point of a scale„ This results in a scale rank or interval which straddles a bending point and hence does not permit a monotone relation between scale and component within this internal,
In Table 6, it appears that substantial straddling may ba- occurring, leading to distorted results in regions where bending points may belong. More than three bends definitely occur in some levels of the quantilesj this can be explained by such straddling alone„ That the curves in Figure 3 (or Figure k) do not clearly alternate in direction in four different regions, as in Figure 2, can also be explained by this strad- dling, especially if one or two of the monotone regions as in Figure 2 have small marginal frequencies. They would then be dwarfed in the com- puting by their neighboring sections and appear almost .at to exist*,
j&nfourth source of error is the usual one due to size of sample» This is effective especially in rows (columns) with the smallest marginpl totals* when the first two types of error are also present, This is also in evidence in Figures 3 and h->
5* The latent vector technique of analysis avoids some of the drawbacks of the quantile technique by not being entirely dependent on fluctuations of the data within small local regions of a table such as Table 6, It analyzes the table as an interdependent whole, and not each part (row or column) separately and then interrelating the parts * Its general logic is as follows:
Given a table of joint frequencies between two variates X and Y» Let pjjj be the proportion in row j and coiurcn k of the table. Let the row
and column marginals be^, respectively?
and let N be the fcotal number of cases in the Tables
N «£ p. .: p , n ££ P„
IVOR, Inc*
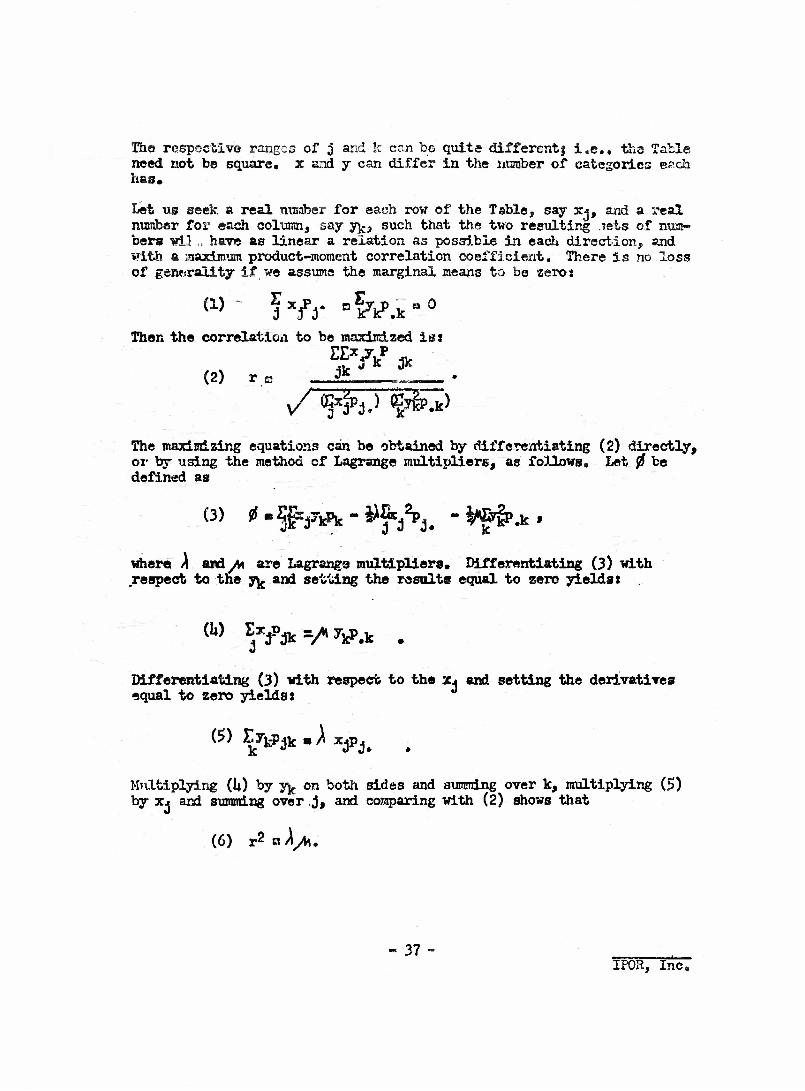
The respective ranges of j and lc ccn be quite different $ i.e., the Table need not be square, x and y can differ in the number of categories each has.
Let us seek a real number for each row of the Table, say Xj, and a i-eal number for each column, say y^, such that the two resulting >sts of num- bers wil „ have as linear a relation as possible in each direction, and %«ith a maximum product-moment correlation coefficient. There is no loss of generality if we assume the marginal means to be zeros
(1> ~ **?y ^kP.k-0
Then the correlation to be maximized is:
(2) re J!E
E£ Y/ *
The maximizing equations can be obtained by differentiating (2) directly, oi" by using the method cf Lagrange multipliers, as follows. Let 0 be defined as
(3) «* - ?i=3-*Pfc ~ ^J^j. -*£fr*.
where A and^ are Lagrange multipliers. Differentiating (3) with respect to the y^ and setting the results equal to zero yieldsi
(U) s^pjkVykP.k .
Differentiating (3) with respect to the XJ and setting the derivatives equal to zero yieldsI
(5) Lj&p . ^ Xpim .
Multiplying (U) by y^ on both sides and summing over k, multiplying (5») by XJ and summing over J, and comparing with (2) shows that
(6) r2 a/l^to.
IPOR, Inc.

The equations (&) aadt (£) «re ef the S»SB. sftnr*i*f. the:/equation* s>f internal consistency of scale analysis (cf ,.,!L©u£s Gjgttwoi, "The Qnaatificstiea of * Claw of Attributes,5* i» Paul Hers** et al., The Rg^otion of Personal Adjustment, SeqislSt&Mnm Eesesrcn Councilor ^ii3>.j although the context is quite different. As in the case ef scale analysis, equations (U) and (5) lead not to one solution but te a series of solutions, called principal, components or latent vectors cf tsae certain matrices but for which in general there is but eae best "one. The »* jor latest root fyfi is usually unique and provides the desired jaaxisnn r% and associated with it are the maximizing X| and y^ or elements of the major latent vectors*
Equations (I|) and (5V can be solved by iterations, passing from a trial x to a.trial, y and back again according to these equations, or else by first computing the matrix A with typical element a., defined by
(?) ajk«id#5s
Thea the desired vector -x « t,x^ x*> •«•.) is a latent vector of A corresponding te root r^, or in matrio notation,
(8) xa - r2x.
It is equaiioa (8) we used in practice in this project, with the new iterative technique referred toabove* The first trial x must be chosen to have a zero meame
Once a solution-x s? (xi xg—•»•»•) has been arrived-at, the corresponding solution y *{y.|y**...) can be obtained directly from equation (u) (the constant of proportioriality yn being arbitrary then, and can be chosen to be ^Af • 1)»
6© For our problem, the subscripts j and k have a definite meaning. They represent actual rank orders on two scales. If the maximizing x.* and y^ maintain the same rank order, then we are justified in stating that the two scales have a monotone regression each on the other. If the Xj change rank order but the y^ stay put, then x is a polytone function of y» Conversely, if the yk change rank order but the Xj stay pub as fir as their ranks gof then the y sc~ls is a polytone i'uncoion of the x scale. If rank orders change both within the x^ and the yv, then we have a multivalued and polytone relationship in both directions of which Figure 2 above is an example.
33 - IKlTTnc.

is as illssrfcrai&es @-f acfeail rss&Us* -jsasider a* aajer latest* Yect@r» far Table 6. Jter the ett£K sslssssj this y^ art («$> t® %a us^iirasy saaataat «f ^f*p«rfei^e3i.tyr aad ..paraded eff t« tee digits) a* ia Tebla 7.
T able 7
Rslatieaa ®f It* Kajer le&e&t ¥eeter ELeaeafcs
te the Sails -BaRks- sf "Fareasaaa as neighbors*
of Tabia 6
Seals raak 1 2 ^«3»TLL 5 6 7 8 f
1
Tester falow 12 6 -7 -6 -*2 2 21
Pletfciag the seoead rotr of fable 7, a* a fuactioa ef &he first, as la Figure f balowj ahaws hew the rank* of the Teeter reives ehaage frea those of tha original acalo* aad la the aaaaar predicted by atur hype- thesi* of -tea foerth prlaetoal soapeaoat* Aceerdiag to fable 7 aad Figure 5, ^at tha ssaia of^wMorseeaaarae ga&ghboro* hag.aeatia. Qgaaoa llaaarlj- aitfe the other scale is -ills' gib jgrslistls£s Of tha attiivde 'systea toward "Mbreeeaasj" it is th* e^^^iTIIroltt&ifts tfcrt ia aost elaesly related to the attitude sysiss ef *?«3»3 Hc-asias^ «sd aot tha direct eeataat ef the attitude*
Oar data shew tha eaa* thiag la the ©ppealW dlrectlca* !*?»• eight r*«g, ef £gfcl* 6# the x* .era. («p to aa sfMtrery aaliiplfisg eassissk- aad rauaded off t* tee^digits) as ia fable 8,
Table, S
Belatiea ef Its Major Latas% Yeefcer-EleasKte
te tfcs Ss&le leaks of "Mixed Eawaiag15
Of i el!i« 9
Soal* rssft
Vector tal^e
0=1
-5
1 3
IS
V 9
15 29
* 3* *

c Except for a slight aberration at rank $, the rearrangement of ranks by the rector is again according to our hypothesis of monotonely related fourth principal coaponer.ts between the two scales. This is shorn graphically in Figure 6*
Figure f>
The Polygon of the Data of Table 7
-IO-t
-jr..
Latent
Vector
Value
O
I Z J-4 -T 6 7 9
Rank of "Attitude Toward Moroccans as Neighbors"
- 1*0 -
u !»....,.•

Figure 6
The Polygon of the Data of Table 8
Latest
Vector
7alue
_/».-
~S..
o.
to-
ts •
to..
30.. >-/ Z 3 4 * €7-8
Rank em "Attitude Toward Mixed Housing*
9-10
Table* 7 and 8, therefore, imply that the fourth principal components of the eealea are menotonely related to each other, and that the relationship ia Table 6 between the scales themselves must be multivalued, of the nature depleted by Figure 2,
t -ia- IPCTi, lac.
• " •

t
7* The latest Teeter technique has it* drawbacks aa veil. We hare stressed that a picture like ia Figure 2 nay occur if our hypothesis la correct. However, it need act always occur, e/en though the hypothesis ia correct. Part.* of the picture maj DO Kissing, or hare zero frequencies. As exasple of thia is shews in Table ?s It may be hypothesized that "Attitude toward Moroccans aa Neighbor*" should hare its inrelutioa taonotonely related te "Attitude toward Tesetdtes aa Neighbor*," and this dees sea* te be true* E*v*?erf aa Table"9 shows, the full possibilities of sxltiTaluedseee de aet empirically occur.
Table 9
Cross-Tabulation ef "Moroccans aa Naighbera"
with Taasnites aa Neighbors"
, if-
Bask as Tsassitss" Bask as "Msrocoase*
1 23 h 5 6 7 8 9
1 25
2 1 61 1
3 3 6
. k U
3» 753
6 23 22
7 12 39
8 139 63U
9 23 8 2h 9h
Many aspects ef the ieattergras of Table 9 are largely spurious* aad that ia why the Table leeks se seat* The scales es "Moroccans* asd "Tesenites" are set ef the usual type, but were each derived is large part frost two essentially epes ended questions. Hence the relatiTe lack ef error Is the Table. Is particular, the lack of spread is either direction
-U2- IPOB> Ise.
i -u, m ,. _ _
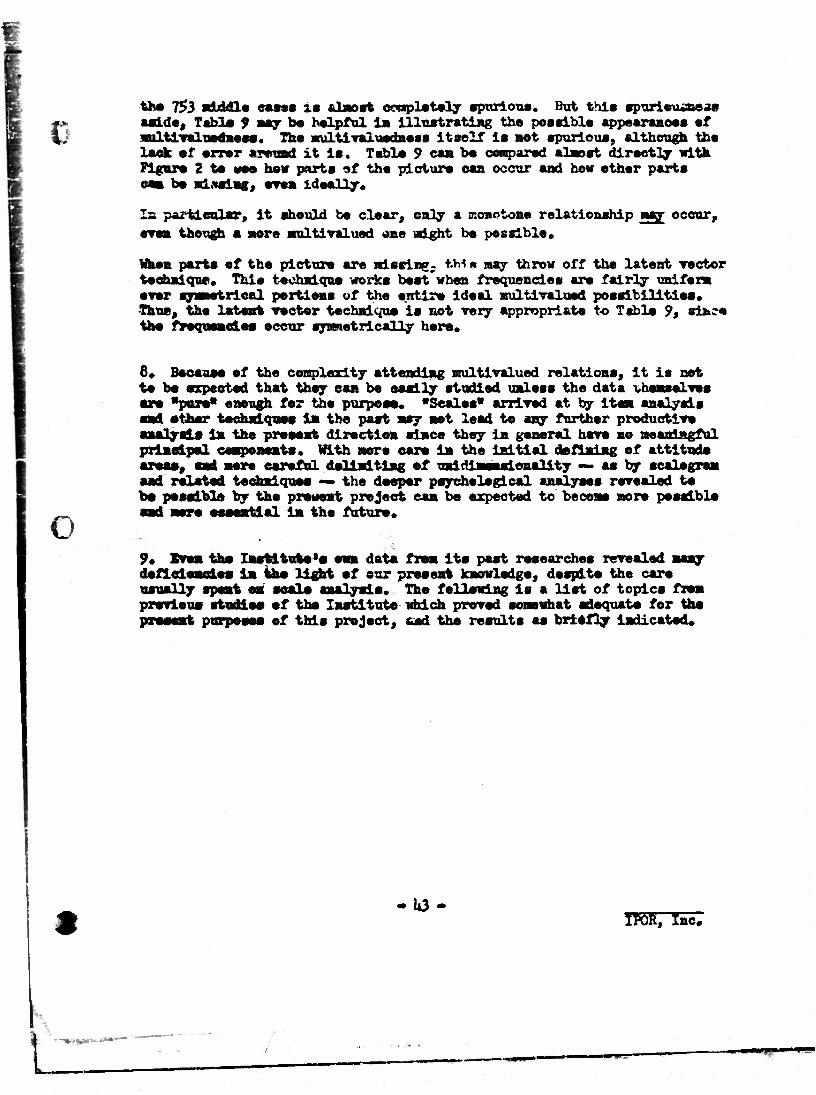
c ths 753 middle cases is almost completely spurioue, But this spurieuinsi* •aide, Tabls 9 **y be helpful 1B illustrating the possible appearances ef multivslnedness. The miltivalusdnes* itself is set spurious, although the leak ef error *r»und it is. Table 9 can be compared almost directly with Figure 2 is *ee hev parts ef the picture earn occur and how ether parts
be B&asiBg, ores Ideally.
Is -p*i iicular, it should be clear, ealy a monotone relationship may occur, though s sore Multivalued one sight be possible*
O
when parts ef the picture are missing; t.M « nay throw off the latent vector technique* Thie technique works best when frequencies are fairly uniform ever sjanstrlcal portions of the entire ideal multivalued possitill ties, •Thus, the latent vector technique is not very appropriate to Tabls 9, since the frequencies occur symmetrically here*
8* Because ef the complexity attending nultivalued relations, it is net to be expected that they can be easily studied unless the data vhenselves are "pure* enough for the purpose. "Scales* arrived at by item analysis and ether techniques in the past nay net lead to any further productive analysis In the present direction since they in general have no meaningful principal components, with more care in the initial defining ef attitude areas, and mere careful delimiting ef unidimensionality — as by scalegram and related techniquss — the deeper psychological analyses revealed to be possible by the present project can be expected to become more possible
essential in ths future.
9* Even ths Institute1* own data fran its past researches revealed deficiencies in the light ef our present knowledge, despite the care usually spent on scale analysis. The following is a list of topics from previous studies ef the Institute which proved somewhat adequate for ths present purposes sf this project, and the results as briefly indicated*
• 1*3- IFOR, Inc.
I I - -%»%•»•

ANNOTATED LIST OF CROSS-TABULATIONS
"l OF ATTITDDE SCALES
(Analysis by latent vectors srid/or quantile* f."-t the study of polytonicity and multivaluedness)
Study AJ Foatiirar Plans of Soldiers Before Diacfaarge
•Sample: 2173 soldiers, a cross-aectiort of the Defence Army of Israel.
Sealss Cross-tabulated: Each of the content scales below refers to a particular alternative postwar plan, and all have the sane third prin- cipal component (or closure) in common. The closure was related to each content separately, and each content was related, to every other content. >
The scales:
(a) Closure (definiteness of choice among the various alternatives)
Attitudes toward the following respective alternatives!
f\ (b) Permanent military service
(c) Government job
(d) Police
(e) Urban cooperative enterprise
(f) Independent business
(g) Occupational training
(h) Return to previous job
(i) Further schooling
(j) Agricultural settlement
Overall Results; Both quantlies and latent vectors verified In general the polytonicity and wultivaluednesc predicted by the hypothesis that the closure was en—ion to all the contents. Sens aLnor discrepancies may be due to Imperfection of scales and/or sampling error.
$J POft, Inc.
L •-*»» •*-*• •* —

Study B» Social Aspects of Hogging Project*
Saaple i 1881 woaen 1A a asnple of all new housing derelopnents in Israel.
Seals* Crosa-tabnlatoda Saeh of the content scales bole* was crose- labulated with erery other. The involutions of each «Q1 sees to be aouotcjoely interrelated.
The scales ii Attitudes toward?
(a) Rlxed housing
(b) Oeneral neighboring
(e) Tesonites as neighbors
(d) Moroccans as neighbor*
3%ndy Ct Opinion Surrey
Sample > 21a 7 adults over 18 years of sw, a cross- section of all Isra-rl residents (aicrt Arabs).
1. Attitudes towards equal rights for wosnn and nUitary serrlee f< wenea.
rolotim in ew direction, bxxt *n>**"*'»tly pclytone In the other.
?• Attitudes towards salary larel for Knestret eenbers and salary level for gevernusnt officials.
and unlTalued in c&* direction, bat other direction has inAtetiea that awtitudwa toward sals.rlos of govenussnt officials aay relate yonotonsly to the fourth principal coa- ponent of salary fcr Knesset BBsfoorso
V - h$ - ''' INK, EMU

AFfSHDIC X
QrJUti&al Biafceisa.'t *? the
T&e probl^ia af facepr'analysis -inatK|a8 an important ©ae? both for the fields of psychttisetdeics and -of attitude j#searsho ^Ssen a battery of .". aental tests is used,, it is "essential to; tee* its structure 1c order to sake the best use of the battery0 Sina.3/&rly9 it is lapertant to knew ths structure of -She iaWrrelatiansMps, of- systeas sf av&taates ,im-«rdey to comprehend asd. to be able to predict'iwtosan behavior* The Israel Institute of Applied Social Bsseareh has had to face the preblea. of factor analysis in both of these fields9 that of testing and that of attitude research* It found that a hew approach to the problem is possible which pay help resolve tne various. conflicting theories and to unify the preeissh opposing aeneols «ftheughto
the new approach is that of order factors Instead of just eoaaoa factors^ All preceding theories are eeaearaed only with hypciha&ss about QgjjjjBn factorse This turned out to be but a special—-indeed, degenerate—'Casa of order f actors o When the degeneracy is removed trough the cone apt of a full order, «$» two basic kinds of factor patterns eaergev which we call the simplex &xift eircsapXe-t^ respectively o lbs combination of these two patterns is a full, possible explanation of the workings of the cortex for mental tests and also seteas appropriate for aany attitude problems* When
•iSw-aAspl^^^amplex str&etnws i» IMW st is its entirelyj, it is then seen that the present.six or seven different approaches to factor a&elysia have each been wxaaiaing but one part of the e3«phant» the major poist oe each school of thought is found to be ©erre©t9 althcugh inceapleto*
'Ei-eliainary analyses of SOBS published tables of intercorrelaticms of mental tests show that they do apprssdaate the Binpiex~ci;«^mplex theory,, The proposed project is to develop acre exact computing procedures for the siaplex-circuaplex approach^ and to make mere extensive analyses of data already to be found in the literature and already in she files ef the Israel Institute«
As pas.4* of this project, we shall go over existing materials in order to he better prepared for designing a deeper and sore fundasental project of gathering new data in the quantities »»d design seeded fully to estab- lish the simplex-oireuaplax theoryo Br, Louis (Hrttoaa, the Scientific Director of the Israel Institute, who.initiated the new approach, has already developed the necessary 1 indaaental aatkewr-tlcso
1*6 »

I
APPSTOH n •i
Pr»cagel Swplcye4 TvUj n ii-ftft
Project Qgriag the Year
Principal Investigator? Kbpo C« Wilsoa
Project Mggetgra Lcolts Guttaan
Statlaticlaa, Research Analyst*, and Asalataat Statistician**
Rnth Ludvig Moshe Sandberg Judith Tannenbant Taacov Wolf Hordechai Rosenthal
Clerical Personnels .1
C Siacha Brudno •Simon Florsheia Enrin Hcr.ig Reuben Fischer Hachel Levi Tova Harl Laya Beitchman Rachel Haginguite
- 1?7
V
.-« • - *-* i
9 awe as:

APPENDIX III
Bmgtategg ef Actual Costs of the ftrejset
OM supervising project director (1/U M*e) $ 1,500.CO
One statiatician (l.A ») 1,200,8C
One assistant statistician (full tla) fc#087.2C
One assistant statistician (fall tiaa) 3,687.20
Clerical 1,393.60
Supplies,, typing, stencilling, ete» 1,098.70
Use change of three Merchant electric calculators 825*00
New York costs*
Two research analysts (part tint) $ 965
Three clerical people (part time) 55$
Hiacellsneoua U0
1,560.00
Total actual costs $15,31*2.50
Amount Approved by OTH according to original budget estiamte 13,325.00
Difference* % 2,027,50
The difference is due largely to the rise in the coat-of -liTing index.
-1*6- IMft, Xne,