
TFC Annual Report - Textron Financial · 2 Textron Financial Corporation (“Textron Financial”)...
46
2 0 0 2 A N N U A L R E P O R T
Transcript of TFC Annual Report - Textron Financial · 2 Textron Financial Corporation (“Textron Financial”)...

2 0 0 2 A N N U A L R E P O R T
82383cover.qx4 3/25/03 11:27 AM Page 1

Investor InquiriesTextron Financial Corporation
Treasury Department
40 Westminster Street
P.O. Box 6687
Providence, Rhode Island
02940-6687
(401) 621-4200
Company Publications andGeneral InformationTo receive a copy, without
charge, of Textron Financial
Corporation’s SEC filings or
Annual Report, please call
(401) 621-4200 or direct written
correspondence to the Treasury
Department at the address
specified above. For more
information regarding Textron
Financial and its businesses,
or an electronic copy of this
Annual Report, visit our
worldwide website at
www.textronfinancial.com.
Table of Contents1 Financial Highlights
2 About the Company
3 From the Chairman
10 Selected Financial Data
11 Management’s Discussion and Analysis of FinancialCondition and Results of Operations
19 Report of Independent Auditors
20 Consolidated Statements of Income
21 Consolidated Balance Sheets
22 Consolidated Statements of Cash Flows
23 Consolidated Statements of Changes in Shareholder’s Equity
24 Notes to ConsolidatedFinancial Statements
41 Directors and Corporate Officers
42 Business Directory
43 Contact Information
Textron Financial Corporation
82383cover.qx4 3/25/03 11:27 AM Page 2

Other17%
Asset-Based Lending
6%
Structured Capital
7%
Resort Finance
15%
Golf Finance
15%
Distribution Finance
19%
Aircraft Finance
21%
1
Annual Report 2002
Managed FinanceReceivablesDecember 28, 2002
Increase/(Dollars in thousands) 2002 2001 (Decrease)
For the year
Finance receivable additions $ 9,262,616 $ 7,614,226 22%
Total revenues 630,236 709,236 (11%)
Income before income taxes, distributions on preferred securitiesand cumulative effect of change in accounting principle 119,153 192,445 (38%)
Net income 60,306 120,571 (50%)
At year-end
Total managed and serviced finance receivables $ 9,395,778 $ 9,349,096 1%
Total managed finance receivables 8,388,926 7,967,659 5%
Total owned finance receivables 5,755,650 5,635,634 2%
Textron-related managed finance receivables 23.4% 25.8%
Allowance for losses on receivables 166,510 143,756
Shareholder’s equity 1,020,817 1,009,355
Commercial paper back-up facilities 1,600,000 1,600,000
Total commercial paper coverage 1.8:1 2.6:1
Debt to tangible shareholder’s equity 5.7:1 5.7:1
Ratios
Return on average assets 1.1% 1.9%
Return on average equity 7.6% 12.7%
Selling and administrative expenses to average managed and serviced finance receivables 1.8% 1.8%
Nonperforming assets to finance assets 3.3% 2.1%
Allowance for losses on receivables to nonaccrual loans 92% 126%
Financial Highlights
82383text.qx4 3/25/03 12:46 PM Page 1

2
Textron FinancialCorporation(“Textron Financial”)is a diversifiedcommercial financecompany with coreoperations in aircraft
finance, asset-based lending, distribution finance,golf finance, resort finance, and structured capital.Within these core operations, Textron Financialprovides financing programs for productsmanufactured by Textron Inc. Ancillary fee-basedservices include transaction syndication, equipmentappraisal and disposition, and portfolio servicing.
Textron Financial’s primary lending and leasingactivities consist of revolving credit facilities andterm financing in North American commercialmarkets. Textron Financial also provides financingfor Textron products outside of North America,principally Bell helicopters and Cessna aircraft.
Textron Financial employs 1,180 people in 21offices throughout North America. Significantoperations centers are located in Little Rock,Arkansas; Toronto, Canada; East Hartford,Connecticut; Alpharetta, Georgia; Wichita, Kansas;Williamstown, Massachusetts; Minneapolis,Minnesota; Columbus, Ohio; Portland, Oregon;King of Prussia, Pennsylvania; and Providence,Rhode Island, also the location of the Company’sheadquarters. Visit the Company’s Web site atwww.textronfinancial.com.
Textron Financial is a subsidiary of Textron Inc.(NYSE: TXT), an $11 billion multi-industrycompany with more than 49,000 employees in 40countries. The company leverages its globalnetwork of businesses to provide customers withinnovative solutions and services in industries suchas aircraft, fastening systems, industrial productsand components, and finance. Textron is knownaround the world for its powerful brands such asBell Helicopter, Cessna Aircraft, Kautex,Lycoming, E-Z-GO and Greenlee, among others.More information is available at www.textron.com.
Textron Financial Corporation
Textron Financial HeadquartersProvidence, Rhode Island
82383text.qx4 3/25/03 12:46 PM Page 2

3
Annual Report 2002
From the Chairman2002 was among the most challenging years in the forty-yearhistory of Textron Financial. After twenty-three consecutiveyears of earnings growth, it was very disappointing to seeour impressive record interrupted. There are a number offactors that contributed to our 2002 results.
The last several years witnessed rapid growth within Textron Financial, straining our infrastructure and diverting management attention from our core operations. We found ourselves stretched across too many businesses, and involved in operations that were no longer providing adequate returns. By mid-2001, it was clear that we had to refocus our efforts.
As we began to redefine our future direction, a slowingU.S. economy and disruptive world events had a negativeimpact on the performance of our loan portfolios. Andalthough well within industry norms, our non-performingassets, delinquencies, and charge-offs reached cyclicalhighs. However, these events have only temporarilyslowed our efforts to execute our strategy ofconcentrating on our core businesses.
Textron Financial remains a strong company, bolstered by our disciplined treasurymanagement, conservative credit culture, and seasoned executive management team. Wehave aggressively refocused on our core operations in aircraft finance, asset-based lending,distribution finance, golf finance, resort finance, and structured capital. We have realignedthese businesses in new groups that simplify our organizational structure and optimizeoperational efficiencies. We have strengthened reserves, and we have increased staffing incollections and asset remediation to ensure that portfolio quality remains sound. Significantprogress has also been made in liquidating non-core businesses, which have accounted for a disproportionate share of our non-performing assets, delinquencies, and charge-offs.
To create a more efficient organization, we are molding Textron Financial into a Six Sigmacompany. Progress made toward this goal has exceeded expectations, and Six Sigma willtouch every aspect of our business in 2003.
Finally, we will target talent development and improved diversity within our employeeranks. It is through our employees that we will be more efficient, increase customersatisfaction, and generate solid growth in our core businesses. With a sound businessstrategy and a talented workforce, we look forward to the beginning of a new period ofsuccessive annual earnings gains.
On behalf of the Executive Committee, I wish to thank all of our employees for their hardwork and dedication, our customers for choosing Textron Financial, our investors for theircontinued commitment, and our parent company for its steadfast support.
Stephen A. GiliottiChairman and Chief Executive Officer
82383text.qx4 3/25/03 12:46 PM Page 3

4
Textron Financial Corporation
1962Textron Financial begins
servicing the financial needsof Bell Helicopter and
E-Z-GO customers.
ince the Company’s inception four decades ago, Textron Financial has relied on a
solid foundation of disciplined credit risk management, strong market knowledge, and
unwavering customer service to support market leading positions and consistent growth
in managed receivables. These attributes have helped Textron Financial thrive in
turbulent commercial lending markets over these last forty years.
S
82383text.qx4 3/25/03 12:47 PM Page 4

5
Annual Report 2002
1971Textron Financialbegins inventory
financing for majormanufacturers of
snowmobiles.
1978Financing is offered
for turf careproducts with
Textron’s acquisitionof Jacobsen.
Having begun in 1962 with sales financing programs
for customers of Textron’s Bell Helicopter and E-Z-GO
golf car businesses, Textron Financial continues to
provide innovative services for customers of
Textron’s products. With the addition of Cessna
Finance Corporation in conjunction with Textron
Inc.’s acquisition of Cessna Aircraft in 1992, a
leadership position in the general aviation lending
market was solidified. Our finance teams originated
$1.2 billion in new financing in 2002 to support the
sale of Textron products to its customers.
Whether they are young companies trying to grow in
a challenging market or mature businesses expanding
into new markets, we remain focused on serving the
needs of our customers. In 1971, we made our first
entry into floorplan financing in order to serve the
product distribution needs of Textron’s businesses.
This early distribution finance success helped E-Z-GO
become the market leader in golf cars and ignited
new growth opportunities for Textron Financial as we
transferred our floorplan expertise to other industries
with similar product distribution requirements.
“ In 1971, we made our first entry into floorplan
financing in order to serve the product distribution
needs of Textron’s businesses.”
82383text.qx4 3/25/03 12:47 PM Page 5

6
1990Textron Financialestablishes the Golf
Division andTimeshare Division.
s Textron Financial celebrates forty years of service in commercial finance,
we reflect on our milestone achievements and the lessons that we have learned
along the way. In 1990, Textron Financial leveraged its knowledge of the golf business,
extending its financing services beyond golf equipment to mortgage financing
for golf course operators across the country.
Textron Financial Corporation
1998Textron Financial offers
accounts receivable financingand asset-based lending
services to the transportationand temporary staffing
industries.
A
82383text.qx4 3/25/03 12:47 PM Page 6

7
Annual Report 2002
1999Timeshare Finance’s
managed receivables passthe $1 billion mark.
2001Several of Textron Financial’s
executives are recognized in the August 2001 issue ofGolf Inc. as the 5th most
powerful people in thegolfing industry.
“Forty years has taught us that a talented base of employees is only
one vital ingredient in a successful enterprise.”
Today, the Golf Finance Division is a testament
to the deep market knowledge that Textron
Financial offers its customers. This golf industry
expertise was publicly recognized in August of
2001, when Golf Inc. identified Textron Financial’s
golf finance team as the fifth most powerful force
in the golf industry.
Yet forty years has taught us that a talented base
of employees is only one vital ingredient in a
successful enterprise. We realize that employees
must be supported by agile back office services,
allowing them to respond swiftly to customer
needs. This mindset enabled our company to
tackle the liquidity crisis plaguing the timeshare
industry last year. In March 2002, with the creative
and energetic support of our Capital Markets and
Accounting groups, the Timeshare Finance Division
introduced a revolutionary multi-developer
financing conduit for smaller developers.
82383text.qx4 3/25/03 12:47 PM Page 7

8
Textron Financial Corporation
oday, Textron Financial’s Asset-Based Lending Group (ABL) consists of four lending
teams: Business Credit, Growth Capital, Finance Company Services, and Transportation
and Staffing Receivables Financing. With one common back-office platform servicing
these asset-based lending and factoring products, the ABL Group has significantly
reduced funding time and improved customer service.
T
2002The industry’s first
multi-developer conduit isintroduced by Timeshare
Finance and is recognizedwith the Textron Chairman’s
Award for Innovation.
82383text.qx4 3/25/03 12:47 PM Page 8

9
Annual Report 2002
“Our intense desire to listen to our customers and
our willingness to change processes will position
Textron Financial to reach even greater heights.”
Textron Financial’s focus on core markets, where
we utilize superior industry knowledge and quality
customer service to create competitive advantage,
has propelled our growth and ensured our success
over our forty years of existence. Market expertise
and back office excellence are of limited value,
however, unless we integrate within our daily
activities the power of customer knowledge. Our
intense desire to listen to our customers and our
willingness to change processes will position
Textron Financial to reach even greater heights. In
response to customer feedback, we have launched
several initiatives to decrease loan cycle time,
improve billing procedures, and provide
convenient online services. As we look towards
the future, we will continue to be ever mindful
of the greatest insight of all: talking to customers
is not enough – listening and adapting are the
ingredients for sustained success.
2002Textron Financial providesworking capital to assist
financing needs of U.S. businesses.
2002Textron Financial’s
Customer Care Center opens.
82383text.qx4 3/25/03 12:48 PM Page 9
10
Textron Financial Corporation
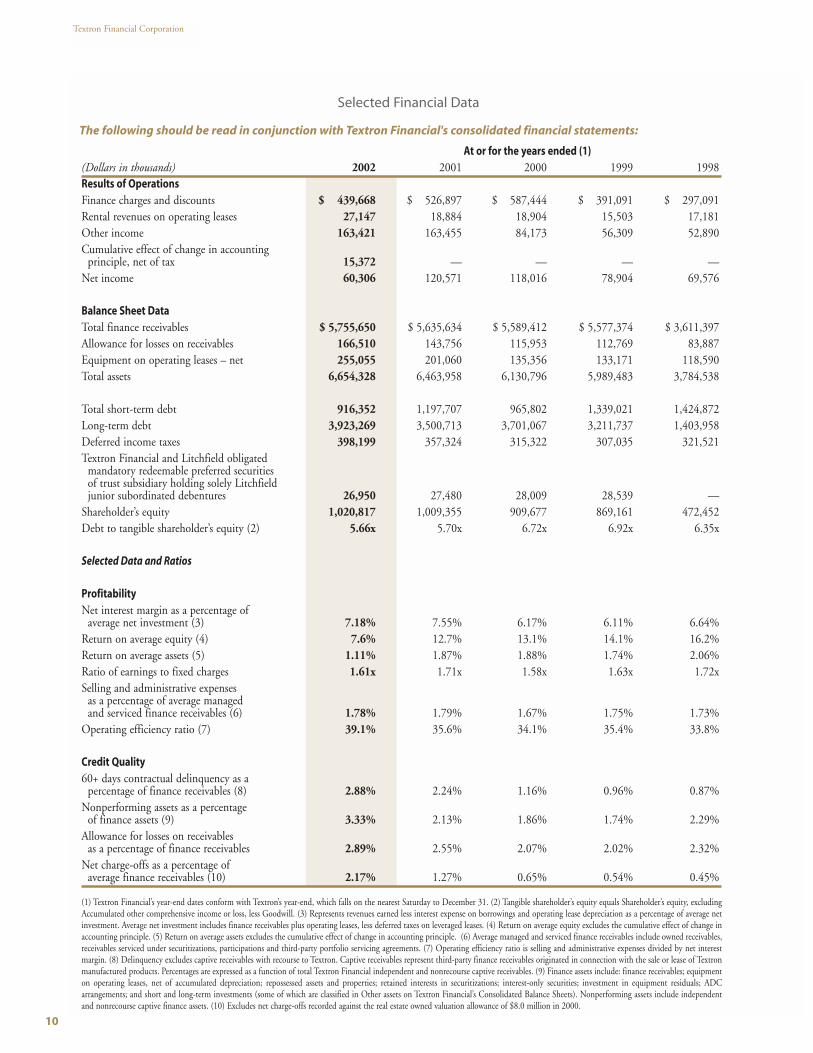
At or for the years ended (1)(Dollars in thousands) 2002 2001 2000 1999 1998Results of OperationsFinance charges and discounts $ 439,668 $ 526,897 $ 587,444 $ 391,091 $ 297,091Rental revenues on operating leases 27,147 18,884 18,904 15,503 17,181Other income 163,421 163,455 84,173 56,309 52,890Cumulative effect of change in accounting
principle, net of tax 15,372 — — — — Net income 60,306 120,571 118,016 78,904 69,576
Balance Sheet DataTotal finance receivables $ 5,755,650 $ 5,635,634 $ 5,589,412 $ 5,577,374 $ 3,611,397Allowance for losses on receivables 166,510 143,756 115,953 112,769 83,887Equipment on operating leases – net 255,055 201,060 135,356 133,171 118,590Total assets 6,654,328 6,463,958 6,130,796 5,989,483 3,784,538
Total short-term debt 916,352 1,197,707 965,802 1,339,021 1,424,872Long-term debt 3,923,269 3,500,713 3,701,067 3,211,737 1,403,958Deferred income taxes 398,199 357,324 315,322 307,035 321,521Textron Financial and Litchfield obligated
mandatory redeemable preferred securitiesof trust subsidiary holding solely Litchfieldjunior subordinated debentures 26,950 27,480 28,009 28,539 —
Shareholder’s equity 1,020,817 1,009,355 909,677 869,161 472,452Debt to tangible shareholder’s equity (2) 5.66x 5.70x 6.72x 6.92x 6.35x
Selected Data and Ratios
ProfitabilityNet interest margin as a percentage of
average net investment (3) 7.18% 7.55% 6.17% 6.11% 6.64%Return on average equity (4) 7.6% 12.7% 13.1% 14.1% 16.2%Return on average assets (5) 1.11% 1.87% 1.88% 1.74% 2.06%Ratio of earnings to fixed charges 1.61x 1.71x 1.58x 1.63x 1.72xSelling and administrative expenses
as a percentage of average managedand serviced finance receivables (6) 1.78% 1.79% 1.67% 1.75% 1.73%
Operating efficiency ratio (7) 39.1% 35.6% 34.1% 35.4% 33.8%
Credit Quality60+ days contractual delinquency as a
percentage of finance receivables (8) 2.88% 2.24% 1.16% 0.96% 0.87%Nonperforming assets as a percentage
of finance assets (9) 3.33% 2.13% 1.86% 1.74% 2.29%Allowance for losses on receivables
as a percentage of finance receivables 2.89% 2.55% 2.07% 2.02% 2.32%Net charge-offs as a percentage of
average finance receivables (10) 2.17% 1.27% 0.65% 0.54% 0.45%
(1) Textron Financial’s year-end dates conform with Textron’s year-end, which falls on the nearest Saturday to December 31. (2) Tangible shareholder’s equity equals Shareholder’s equity, excludingAccumulated other comprehensive income or loss, less Goodwill. (3) Represents revenues earned less interest expense on borrowings and operating lease depreciation as a percentage of average netinvestment. Average net investment includes finance receivables plus operating leases, less deferred taxes on leveraged leases. (4) Return on average equity excludes the cumulative effect of change inaccounting principle. (5) Return on average assets excludes the cumulative effect of change in accounting principle. (6) Average managed and serviced finance receivables include owned receivables, receivables serviced under securitizations, participations and third-party portfolio servicing agreements. (7) Operating efficiency ratio is selling and administrative expenses divided by net interestmargin. (8) Delinquency excludes captive receivables with recourse to Textron. Captive receivables represent third-party finance receivables originated in connection with the sale or lease of Textron manufactured products. Percentages are expressed as a function of total Textron Financial independent and nonrecourse captive receivables. (9) Finance assets include: finance receivables; equipmenton operating leases, net of accumulated depreciation; repossessed assets and properties; retained interests in securitizations; interest-only securities; investment in equipment residuals; ADC arrangements; and short and long-term investments (some of which are classified in Other assets on Textron Financial’s Consolidated Balance Sheets). Nonperforming assets include independentand nonrecourse captive finance assets. (10) Excludes net charge-offs recorded against the real estate owned valuation allowance of $8.0 million in 2000.
Selected Financial Data
The following should be read in conjunction with Textron Financial's consolidated financial statements:
82383text.qx4 3/25/03 12:48 PM Page 10
Annual Report 2002
11
FINANCIAL CONDITION
Liquidity and Capital Resources
Textron Financial Corporation (Textron Financial) uses a broad base of
financial resources for its liquidity and capital needs. Cash is provided
from operations and several sources of borrowings, including the
issuance of commercial paper and other short-term debt, sales of medi-
um and long-term debt in the U.S. and foreign public and private mar-
kets and junior subordinated borrowings under a $100 million line of
credit with Textron Inc. (Textron). For liquidity purposes, Textron
Financial has a policy of maintaining sufficient unused lines of credit
to support its outstanding commercial paper. Textron Financial has
bank lines of credit of $1.5 billion, of which $500 million expires in
2003 and $1.0 billion expires in 2006. The $500 million facility
includes a one-year term out option, effectively extending its expiration
into 2004. None of these lines of credit were used at December 28,
2002, or December 29, 2001. Textron Financial also maintains a C$50
million committed Canadian facility under which it can borrow an
additional C$50 million on an uncommitted basis. At December 28,
2002, Textron Financial has fully used the committed portion of the
facility in addition to borrowing C$1 million under the uncommitted
portion of the facility. Textron Financial also has a $25 million multi-
currency facility, of which $14 million remains unused at year-end
2002. Both the Canadian and multi-currency facilities expire in 2003.
Lines of credit, including the $100 million line of credit with Textron,
not reserved as support for commercial paper or utilized for letters of
credit were $716 million at December 28, 2002, compared to $977
million at December 29, 2001. The decrease in the unreserved portion
of the lines of credit is mostly attributable to the pay down and termi-
nation of a short-term revolving note agreement with Textron.
Under a shelf registration statement filed with the Securities and
Exchange Commission, Textron Financial may issue public debt secu-
rities in one or more offerings up to a total maximum offering of $3.0
billion. Under this facility, Textron Financial issued $1.9 billion of
term notes during 2002, primarily in U.S. and Canadian markets,
that mature in 2003 through 2009. The proceeds from these issuances
were used to refinance maturing commercial paper and long-term
debt at par. At December 28, 2002, Textron Financial had $1.1 bil-
lion available under this facility.
Through private issuances in 2002, Textron Financial also
entered into $170 million of variable rate notes maturing in 2004.
At December 28, 2002, Textron Financial had principal
payments due on long-term debt of $1,069 million in 2003, $1,407
million in 2004, $199 million in 2005, $25 million in 2006, $726
million in 2007 and $497 million in 2009.
At December 28, 2002, Textron Financial had unused commit-
ments to fund new and existing customers under $1.5 billion of com-
mitted revolving lines of credit and $1.0 billion of uncommitted
revolving lines of credit. Since many of the agreements will not be used
to the extent committed or will expire unused, the total commitment
amount does not necessarily represent future cash requirements.
As a result of a sale of an equipment portfolio in 2001, Textron
Financial retained a contingent recourse liability that had a balance of $17
million at December 28, 2002. In the event Textron Financial’s credit rat-
ing drops below a low BBB, it is required to pledge related equipment resid-
uals of $9 million with a letter of credit up to $8 million.
Securitizations are an important source of funding ($892 million
in 2002), and represent a significant portion of Textron Financial’s rev-
enues and income before income taxes and distributions on preferred
securities (3.8% and 20.0%, respectively, in 2002, excluding the revolv-
ing conduits). During the year, Textron Financial received net proceeds
from the securitization of $299 million of Aircraft Finance receivables,
$185 million of small business finance receivables (on a revolving basis),
$150 million of Distribution Finance receivables (on a revolving basis),
$131 million of Resort Finance receivables and $127 million of golf
equipment receivables. These securitizations provided Textron Financial
with an alternate source of liquidity. Textron Financial used the proceeds
from the securitizations to retire commercial paper. Cash collections on
current and prior period securitization gains were $43 million in 2002,
$27 million in 2001 and $3 million in 2000.
In connection with the outstanding $229 million revolving
securitization of small business finance receivables, Textron Financial
is obligated to repurchase a certain class of loans if Textron Financial’s
credit rating drops below BBB. Such loans amounted to $41 million
at December 28, 2002. Textron Financial has no other repurchase
obligations in connection with any other securitization transactions.
Textron Financial anticipates that it will enter into additional securi-
tization transactions in 2003.
At December 28, 2002, Textron Financial’s credit ratings were as
follows: Standard & Poor’s (A- long-term, A2 short-term), Moody’s
Investors Service (A3 long-term, P2 short-term) and Fitch (A long-
term, F1 short-term).
During the second half of 2001, Textron Financial’s commercial
paper and long-term debt credit ratings were downgraded from a P1
Management’s Discussion and Analysis of Financial Condition and Results of Operations
82383fin.qx4 3/25/03 1:00 PM Page 11

Textron Financial Corporation
12
to P2 and A-2 to A-3, respectively, by Moody’s Investors Service and
the Company was placed on Negative Outlook by all three ratings
agencies. The economic environment and its potential impact on the
financial performance of the Company’s finance receivable portfolios
were listed as contributing factors. While the actions of the rating agen-
cies caused the Company’s cost of capital to increase, it did not result
in any loss of access to capital. Textron Financial did not experience any
commercial paper or long-term debt credit rating downgrades in 2002.
Further downgrades in Textron Financial’s ratings could increase bor-
rowing spreads or limit its access to the commercial paper, securitiza-
tion and long-term debt markets. In addition, Textron Financial’s $1.5
billion revolving bank line of credit agreements contain certain finan-
cial covenants that Textron Financial needs to comply with to maintain
its ability to borrow under the facilities. Textron Financial was in full
compliance with such covenants at December 28, 2002.
Textron Financial believes that it has adequate credit facilities
and access to credit markets to meet its long-term financing needs.
Cash flows provided by operations were $233 million in 2002,
compared to $282 million in 2001. The decrease was primarily due to
the timing of payments of accrued interest and other liabilities, par-
tially offset by a decrease in noncash gains on securitizations. Cash
flows from operations were $282 million in 2001, compared to $163
million in 2000. The 2001 increase was primarily due to a 31%
increase in net income before depreciation and amortization and pro-
vision for losses, as well as increases due to the timing of payments of
income taxes and accrued interest and other liabilities, partially offset
by increases in noncash gains on securitizations and other assets.
Cash flows used in investing activities in 2002 and 2001 were
funded from the collection of receivables, the syndication and securi-
tization of receivables and through the issuance of debt. The decrease
in proceeds from receivable sales, including securitizations, reflects
lower aggregate sales from small-ticket equipment finance and lower
securitization activity in Distribution Finance as well as the franchise,
golf equipment and aircraft portfolios. This decrease was partially off-
set by proceeds from the sale of certain media and franchise portfolios
of $120 million and $106 million, respectively.
In 2002, the $417 million increase in long-term debt was most-
ly offset by the $281 million decrease in short-term debt. The $136
million net increase in short and long-term debt as well as the $111
million increase in nonrecourse debt also provided a portion of the
cash used in investing activities. In 2001, the $232 million increase in
short-term debt was mostly offset by the $200 million decrease in
long-term debt. The $32 million net increase in short and long-term
debt combined with the $75 million increase in nonrecourse debt
provided a portion of the cash used in investing activities.
Because the finance business involves the purchase and carrying
of receivables, a relatively high ratio of borrowings to net worth is cus-
tomary. Debt as a percentage of total capitalization was 83% at
December 28, 2002, compared to 82% at the end of 2001. Textron
Financial’s ratio of earnings to fixed charges was 1.61x in 2002 (1.71x
in 2001 and 1.58x in 2000). Commercial paper and Other short-
term debt as a percentage of total debt was 19% at December 28,
2002, compared to 25% at the end of 2001. Textron Financial has a
policy of matching the duration of its assets with its debt. Changes in
short and long-term debt are directly related to the duration of
Textron Financial’s assets and liabilities.
In 2002, Textron Financial declared and paid dividends to
Textron of $62.0 million, compared to dividends declared and paid of
$51.1 million in 2001. The increase in 2002 was due to excess capi-
tal that resulted from slower than anticipated receivable growth and
the return to Textron of capital associated with the sale of a finance
receivable portfolio. Textron contributed capital of $9.0 million to
Textron Financial in 2002, which consisted of Textron’s dividend on
the preferred stock of Textron Funding Corporation. The 2001 capi-
tal contribution of $49.0 million was primarily to support the acqui-
sition of a small business lending portfolio in June of 2001.
Finance Assets
Textron Financial’s financing activities are confined almost exclusive-
ly to secured lending and leasing to commercial markets.
Management believes that the portfolio avoids excessive concentra-
tion of risk through diversification across geographic regions, indus-
tries and types of collateral, and among borrowers.
Total finance assets, which includes finance receivables,
equipment on operating leases – net of accumulated depreciation,
repossessed assets and properties, retained interests in securitizations,
interest-only securities, investment in equipment residuals, ADC
arrangements, and short and long-term investments (some of which
are classified in Other assets on Textron Financial’s Consolidated
Balance Sheets), were $6.5 billion at December 28, 2002, up 3.6%
from $6.3 billion at December 29, 2001. The increase in finance
assets was mostly due to Distribution Finance ($345 million), net of
a revolving securitization conduit, and Golf Finance ($128 million),
partially offset by a decrease in small business finance ($117 million),
Management’s Discussion and Analysis of Financial Condition and Results of Operations
82383fin.qx4 3/25/03 1:00 PM Page 12

Annual Report 2002
13
primarily reflecting the establishment of a revolving securitization
conduit, and the continued liquidation of portfolios within the Other
segment ($117 million). The finance assets of the Aircraft Finance
and Resort Finance segments grew $272 million and $136 million
before consideration of the net change in finance assets from securiti-
zations of $304 million and $104 million, respectively. The growth in
the Distribution Finance segment was largely the result of portfolio
acquisitions of $338 million along with moderate organic growth.
The increase in the Golf Finance segment was mostly due to organic
growth in the golf equipment portfolio.
Nonperforming Assets
Nonperforming assets, which includes independent and nonrecourse
captive finance assets, as a percentage of finance assets increased to 3.33%
($218 million) at December 28, 2002, from 2.13% ($134 million) at
December 29, 2001. The $84 million increase in nonperforming assets
at December 28, 2002, compared to December 29, 2001, was due to
increases in the Resort Finance ($35 million), Aircraft Finance ($21 mil-
lion), Golf Finance ($8 million), Distribution Finance ($7 million) and
Other ($14 million) segments, partially offset by a decrease in the Asset-
Based Lending segment ($1 million). The increase in the Other segment
primarily includes media finance ($17 million) and franchise finance
($12 million), offset by decreases in other liquidating portfolios ($15 mil-
lion). The Other segment represents 22% of owned receivables and 38%
of nonperforming assets. The Company believes that nonperforming
assets will generally be in the range of 2-4% of finance assets depending
on economic conditions. The Company expects modest improvements
in portfolio quality as it liquidates portfolios included in the Other seg-
ment. However, a prolonged economic downturn could have a negative
effect on the Company’s overall portfolio quality.
Interest Rate Sensitivity
Textron Financial’s mix of fixed and floating rate debt is continuous-
ly monitored by management and is adjusted, as necessary, based on
evaluations of internal and external factors.
Management’s strategy of matching interest-sensitive assets with
interest-sensitive liabilities limits Textron Financial’s risk to changes in
interest rates, and includes entering into interest rate exchange agree-
ments. At December 28, 2002, interest-sensitive assets in excess of
interest-sensitive liabilities were $629 million, net of $1.4 billion of
interest rate exchange agreements on long-term debt and $219 mil-
lion of interest rate exchange agreements on finance receivables.
Interest-sensitive assets in excess of interest-sensitive liabilities were
$410 million at December 29, 2001, net of $370 million of interest
rate exchange agreements on long-term debt and $97 million of inter-
est rate exchange agreements on finance receivables. The increase in
interest rate exchange agreements was directly related to the conver-
sion of fixed rate debt to variable rate debt at the time of issuance.
Textron Financial’s net position does not reflect a change in manage-
ment’s match funding strategy.
Management believes that its asset/liability management policy
provides adequate protection against interest rate risks. Increases in
interest rates, however, could have an adverse effect on interest margin.
Variable rate receivables are generally tied to changes in the prime rate
offered by major U.S. banks or LIBOR. Changes in short-term bor-
rowing costs generally precede changes in variable rate receivable yields.
Textron Financial assesses its exposure to interest rate changes using an
analysis that measures the potential loss in net income, over a twelve-
month period, resulting from a hypothetical change in interest rates of
100 basis points across all maturities occurring at the outset of the meas-
urement period (sometimes referred to as a “shock test”). Textron
Financial also assumes in its analysis that prospective receivable addi-
tions will be match funded, existing portfolios will not prepay and all
other relevant factors will remain constant. This shock test model, when
applied to Textron Financial’s asset and liability position at December
28, 2002 and December 29, 2001, indicates that an increase in interest
rates of 100 basis points would have a beneficial impact on Textron
Financial’s net income and cash flows for the following twelve-month
periods, whereas a decrease in interest rates of 100 basis points reduces
Textron Financial’s net income and cash flow by $3.6 million and $2.1
million, respectively, for the following twelve-month periods.
Financial Risk Management
Textron Financial’s results are affected by changes in U.S. and, to a
lesser extent, foreign interest rates. As part of managing this risk,
Textron Financial enters into interest rate exchange agreements.
Textron Financial’s objective of entering into such agreements is not
to speculate for profit, but generally to convert variable rate debt into
fixed rate debt and vice versa. The overall objective of Textron
Financial’s interest rate risk management is to achieve a prudent bal-
ance between floating and fixed rate debt. These agreements do not
involve a high degree of complexity or risk. Textron Financial does not
trade in interest rate exchange agreements or enter into leveraged
interest rate exchange agreements.
Management’s Discussion and Analysis of Financial Condition and Results of Operations
82383fin.qx4 3/25/03 1:00 PM Page 13

Textron Financial Corporation
14
The net effect of these interest rate exchange agreements
decreased interest expense by $19.6 million and $1.2 million in 2002
and 2001, respectively, and was insignificant in 2000.
Textron Financial manages its foreign currency exposure by fund-
ing most foreign currency denominated assets with liabilities in the same
currency. The Company may enter into foreign currency exchange agree-
ments to convert foreign currency denominated assets and liabilities into
functional currency denominated assets and liabilities. In addition, as
part of managing its foreign currency exposure, Textron Financial may
enter into foreign currency forward exchange contracts. The objective of
such agreements is to manage any remaining exposure to changes in cur-
rency rates. The notional amounts of outstanding foreign currency for-
ward exchange contracts in 2002 and 2001 were nominal.
CRITICAL ACCOUNTING POLICIES
Allowance for Losses on Receivables
Management evaluates its allowance for losses on receivables based on
a combination of factors. For its homogeneous loan pools, Textron
Financial examines current delinquencies, the characteristics of the
existing accounts, historical loss experience, the value of the underlying
collateral and general economic conditions and trends. Textron
Financial estimates losses will range from 0.5% to 5.6% of finance
receivables depending on the specific homogeneous loan pool. The
range of estimated losses is consistent with prior periods. For larger bal-
ance commercial loans, Textron Financial considers borrower specific
information, industry trends and estimated discounted cash flows, as
well as the factors described above for homogeneous loan pools.
Provisions for losses on finance receivables are charged to
income, in amounts sufficient to maintain the allowance for losses on
receivables at a level considered adequate to cover losses in the exist-
ing finance receivable portfolio, based on management’s evaluation
and analysis of this portfolio.
Finance receivables are charged off when they are deemed uncol-
lectable. Finance receivables are written down to the fair value (less
estimated costs to sell) of the related collateral at the earlier of the date
the collateral is repossessed or when no payment has been received for
six months, unless management deems the receivable collectible.
Goodwill and Other Intangible Assets
Upon adoption of SFAS No. 142, “Goodwill and Other Intangible
Assets”, on December 30, 2001, Textron Financial recorded an after-tax
transitional impairment charge of $15.4 million as discussed in Note 8
to the consolidated financial statements. This new accounting standard
requires companies to evaluate goodwill and other intangible assets for
impairment on an annual basis. Textron Financial evaluates the recov-
erability of goodwill and other intangible assets annually in the fourth
quarter, or more frequently if events or changes in circumstances, such
as declines in interest margin or cash flows or material adverse changes
in the business climate, indicate that the carrying value of an asset might
be impaired. Textron Financial completed its annual impairment test in
the fourth quarter of 2002 using the estimates from its long-term strate-
gic plan. No adjustment was required to the carrying value of goodwill
or other intangible assets based on the analysis performed.
Goodwill is considered to be impaired when the net book value of
a reporting unit exceeds its estimated fair value. Fair values are primari-
ly established using a discounted cash flow methodology. The determi-
nation of discounted cash flows is based on the businesses’ strategic
plans and long-range planning forecasts. The assumptions relative to
interest margin, operating expenses and provision for losses included in
the plans are management’s best estimates based on current and fore-
casted market conditions. If different assumptions were used in these
plans, the related undiscounted cash flows used in measuring impair-
ment could be different potentially resulting in an impairment charge.
Securitized Transactions
Securitized transactions involve the sale of finance receivables to qual-
ified special purpose trusts. Textron Financial may retain an interest in
the assets sold in the form of interest-only securities, subordinated cer-
tificates, cash reserve accounts and servicing rights and obligations.
The Company’s retained interests are subordinate to other investors’
interests in the securitizations. Gain or loss on the sale of the loans or
leases depends in part on the previous carrying amount of the finan-
cial assets involved in the transfer, allocated between the assets sold
and the retained interests based on their relative fair values at the date
of transfer. Retained interests are recorded at fair value as a component
of Other assets on Textron Financial’s Consolidated Balance Sheets.
The Company estimates fair values based on the present value of
future cash flows expected under management’s best estimates of key
assumptions - credit losses, prepayment speeds, forward interest rate
yield curves and discount rates commensurate with the risks involved.
Textron Financial reviews the fair values of the retained interests
quarterly using updated assumptions and compares such amounts with
the carrying value of the retained interests. When the carrying value
Management’s Discussion and Analysis of Financial Condition and Results of Operations
82383fin.qx4 3/25/03 1:00 PM Page 14

Annual Report 2002
15
exceeds the fair value of the retained interests, the Company determines
whether the decline in fair value is other than temporary. When the
Company determines the value of the decline is other than temporary, it
writes down the retained interests to fair value with a corresponding
charge to income. When a change in fair value of the Company’s
retained interests is deemed temporary, the Company records a corre-
sponding credit or charge to Other comprehensive income for any unre-
alized gains or losses. Based on the sensitivity analysis, as described in
Note 6 to the consolidated financial statements, a 20% adverse change
in either the prepayment speed, expected credit losses or the residual cash
flows discount rate would not result in a material charge to income.
Textron Financial does not provide legal recourse to third-party
investors that purchase interests in Textron Financial’s securitizations
beyond the credit enhancement inherent in the retained interest-only
securities, subordinated certificates and cash reserve accounts.
RESULTS OF OPERATIONS 2002 VS. 2001
Revenues
Revenues for the twelve months ended December 28, 2002,
decreased by $79.0 million or 11.1% reflecting lower yields on
finance receivables, partially offset by higher operating lease revenue.
Finance charges and discounts decreased by $87.2 million or 16.6%
reflecting a decrease in portfolio yield ($95.3 million) to 7.73% from
9.40% in 2001, slightly offset by higher finance charges and discounts
($8.1 million) due to a higher level of average finance receivables. The
lower yields in 2002, as compared to the corresponding period in
2001, reflect a decrease in the interest rate environment primarily due
to reductions in the prime rate. Operating lease revenue increased due
to higher average operating lease assets. Other income of $163.4 mil-
lion was unchanged from the prior year, with higher securitization
gains ($11.4 million), reflecting higher revolving conduit activity, and
higher servicing income ($9.5 million) and investment income ($4.0
million), primarily offset by lower prepayment gains ($14.9 million)
and syndication income ($7.8 million).
Interest Expense
Interest expense for the twelve months ended December 28, 2002,
decreased by $75.0 million or 28.0%, primarily as the result of a
decrease in the average borrowing rate for the period from 5.48% to
3.82%, attributable to a lower interest rate environment, partially off-
set by 3.5% higher average debt outstanding.
Interest Margin
Interest margin decreased $9.9 million or 37 basis points (7.18% ver-
sus 7.55%) for the twelve months ended December 28, 2002, as com-
pared to the corresponding period in 2001. The decrease was prima-
rily due to higher relative borrowing costs ($12.8 million), partially
offset by higher average finance receivables. Despite a lower interest
rate environment, corporate borrowing rates increased as compared to
major borrowing indices, such as three-month LIBOR and U.S.
Treasury rates. This increase had a negative effect on interest margin,
net of receivable pricing increases.
Operating Expenses
Selling and administrative expenses for the twelve months of 2002
increased by $9.2 million, compared to the corresponding period in 2001.
The increase primarily reflects higher legal and collection expense ($15.6
million) and growth in managed and serviced finance receivables ($5.7
million), offset by a reduction in goodwill amortization of $12.1 million
(reflecting the change in accounting). Selling and administrative expenses
as a percentage of average managed and serviced finance receivables
decreased slightly as compared to the prior year (1.78% versus 1.79% for
the twelve months of 2002 and 2001, respectively).
Provision for Losses
The provision for losses of $138.5 million was $56.9 million higher
than the corresponding period in 2001 due to higher net charge-offs
and the strengthening of the allowance for losses on receivables. Net
charge-offs were $127.9 million during 2002, compared to $74.4
million in 2001. The higher net charge-offs reflect increases primari-
ly in the Other segment ($47.1 million), including syndicated bank
loans ($23.1 million), principally related to the telecommunications
industry, small business finance ($12.9 million) and other liquidating
portfolios ($11.1 million), primarily small-ticket equipment finance.
Other changes include increases in the Aircraft Finance ($5.8 million)
and Distribution Finance ($4.5 million) segments, offset by a decrease
in the Asset-Based Lending segment ($6.8 million).
The allowance for losses on receivables increased to $167 million
at December 28, 2002, compared to $144 million at December 29,
2001. The allowance for losses on receivables as a percentage of total
finance receivables was 2.9% at December 28, 2002, compared to 2.6%
at December 29, 2001 (3.1% in 2002 and 2.8% in 2001, excluding
captive receivables with recourse to Textron). The allowance for losses
on receivables as a percentage of nonaccrual loans was 92% at
Management’s Discussion and Analysis of Financial Condition and Results of Operations
82383fin.qx4 3/25/03 1:00 PM Page 15

Textron Financial Corporation
16
Management’s Discussion and Analysis of Financial Condition and Results of Operations
December 28, 2002, compared to 126% at December 29, 2001. The
decrease in the percentage represents an increase in nonaccrual finance
receivables at December 28, 2002, supported by strong collateral values.
Although management believes it has made adequate provision
for anticipated losses, realization of these assets remains subject to
uncertainties. Subsequent evaluations of nonperforming assets, in
light of factors then prevailing, including economic conditions, may
require additional increases in the allowance for losses for such assets.
Operating Results by Segment
Segment income below represents income before special charges,
income taxes, distributions on preferred securities and cumulative
effect of change in accounting principle.
Distribution Finance income increased $6.9 million reflecting
higher interest margin ($23.0 million), offset by higher operating
expenses ($13.5 million) and higher provision for losses ($2.6 mil-
lion). The higher interest margin was principally due to higher fee
income ($14.2 million, principally revolving securitization income),
higher pricing and higher average finance assets ($40 million).
Resort Finance income increased $1.4 million reflecting higher
interest margin ($5.1 million) and lower operating expenses ($3.7
million), partially offset by higher provision for losses ($7.4 million).
The increase in interest margin reflects pricing increases and higher
average finance assets ($55 million).
Aircraft Finance income decreased by $27.0 million largely
reflecting lower interest margin ($14.4 million), despite $168 million
of higher average finance assets, in addition to a write-down of
retained interests in securitized assets ($11.0 million) reflecting lower
expected realization on defaulted assets. Also contributing to lower
income was higher provision for losses ($6.4 million), partially offset
by lower operating expenses ($4.8 million). The lower interest margin
is due to competitive pressures inhibiting the ability to pass on high-
er borrowing costs related to an increase in interest rate spreads to
benchmark borrowing rates (such as U.S. Treasury rates and LIBOR).
Golf Finance income increased $0.9 million reflecting higher
interest margin ($6.2 million) principally due to higher average
finance assets ($155 million). This increase in interest margin was par-
tially offset by higher operating expenses ($3.6 million) and higher
provision for losses ($1.7 million).
Asset-Based Lending income decreased $10.2 million reflecting
higher provision for loan losses ($9.0 million) and lower interest mar-
gin ($3.5 million) due to lower finance receivable pricing on lower
average finance assets ($18 million), partially offset by a decrease in
operating expenses ($2.3 million).
Structured Capital income decreased $9.2 million, reflecting
lower interest margin ($13.5 million), largely due to a nonrecurring
prepayment gain of $14.3 million in 2001, partially offset by lower
provision for losses ($4.4 million).
Other segment income decreased $38.8 million reflecting higher
provision for losses ($34.2 million), primarily due to higher net charge-
offs in syndicated bank loans ($23.1 million), principally related to the
telecommunication industry, small business finance ($12.9 million)
and other liquidating portfolios ($11.1 million), primarily small-ticket
equipment finance. The decrease also reflects higher operating expens-
es ($2.8 million) and lower interest margin ($1.8 million).
Income Before Cumulative Effect of Change in
Accounting Principle
Income before cumulative effect of change in accounting principle of
$75.7 million was $44.9 million or 37.2% lower than the correspon-
ding period in 2001. The decrease principally reflects a higher provi-
sion for losses ($56.9 million), lower interest margin ($9.9 million)
and higher operating expenses ($9.2 million), offset by lower special
charges ($2.7 million) and a lower effective tax rate. Income before
cumulative effect of change in accounting principle excluding amor-
tization of goodwill was $75.7 million and $131.8 million for 2002
and 2001, respectively.
RESULTS OF OPERATIONS 2001 VS. 2000
Revenues
Revenues for the twelve months ended December 29, 2001, increased
by $18.7 million or 2.7% reflecting increased other income, partially
offset by lower yields on finance receivables. Finance charges and dis-
counts decreased by $60.5 million or 10.3% reflecting a decrease in
portfolio yield ($65.9 million) to 9.40% from 10.59% in 2000, par-
tially offset by higher finance charges and discounts ($5.4 million)
due to a higher level of average finance receivables. The lower yields
reflect a decrease in the interest rate environment in 2001, compared
to the corresponding period in 2000. The increase in other income
($79.3 million) is due mostly to higher securitization gains ($20.7
million), prepayment gains ($16.3 million), servicing fees ($11.7 mil-
lion), syndication income ($11.0 million) and investment income
($10.5 million). The increase in prepayment gains was principally due
82383fin.qx4 3/25/03 1:00 PM Page 16

Annual Report 2002
17
Management’s Discussion and Analysis of Financial Condition and Results of Operations
to a nonrecurring prepayment gain of $14.3 million in 2001.
Operating lease revenue decreased slightly despite a small increase in
average operating lease assets.
Interest Expense
Interest expense for the twelve months ended December 29, 2001,
decreased by $63.5 million or 19.1%, primarily as the result of a
decrease in the average borrowing rate for the period from 6.89% to
5.48%, attributable to a lower interest rate environment, partially off-
set by slightly higher average debt outstanding.
Interest Margin
Interest margin increased $82.8 million or 138 basis points (7.55%
versus 6.17%) for the twelve months ended December 29, 2001, as
compared to the corresponding period in 2000. The increase was pri-
marily due to higher securitization gains, prepayment gains, servicing
income, syndication income and investment income.
Operating Expenses
Selling and administrative expenses for the twelve months of 2001
increased by $34.7 million, compared to the corresponding period in
2000. Selling and administrative expenses as a percentage of average
managed and serviced finance receivables increased to 1.79% for the
twelve months of 2001 from 1.67% for the corresponding period in
2000, principally reflecting higher expenses related to new business
initiatives ($16.2 million), growth in managed and serviced finance
receivables ($14.0 million) and higher legal and collection expenses
($4.5 million).
Provision for Losses
The provision for losses of $81.7 million was $45.0 million higher than
the corresponding period in 2000. Net charge-offs were $74.4 million
during 2001, compared to $45.8 million in 2000, which included an
$8.0 million charge-off to the real estate owned valuation allowance.
The increase in the provision for losses primarily reflects the softening
of the economy and the resulting increase in net charge-offs, primarily
in the small business finance ($13.2 million) and other liquidating port-
folios ($16.9 million), primarily small-ticket equipment finance.
The allowance for losses on receivables increased to $144 million
at December 29, 2001, compared to $116 million at December 30,
2000. The allowance for losses on receivables as a percentage of total
finance receivables was 2.6% at December 29, 2001, compared to
2.1% at December 30, 2000 (2.8% in 2001 and 2.4% in 2000,
excluding captive receivables with recourse to Textron). The allowance
for losses on receivables as a percentage of nonaccrual loans was 126%
at December 29, 2001, compared to 114% at December 30, 2000.
Operating Results by Segment
Segment income below represents income before special charges,
income taxes, distributions on preferred securities and cumulative
effect of change in accounting principle.
Distribution Finance income increased $3.9 million reflecting
higher interest margin ($22.5 million), primarily due to higher other
income of $27.8 million, principally revolving securitization income,
partially offset by higher operating expenses ($11.5 million) and higher
provision for losses ($7.1 million). The increase in operating expenses
reflects the 30% growth in managed and serviced finance receivables.
Resort Finance income decreased $5.1 million principally
reflecting higher operating expenses ($3.9 million) and higher provi-
sion for losses ($0.9 million). Interest margin largely remained
unchanged from prior year. The increase in operating expenses reflects
the 23% growth in managed and serviced finance receivables.
Aircraft Finance income decreased by $15.6 million reflecting
lower interest margin ($9.0 million), mostly due to lower average
finance assets ($192 million), higher provision for losses ($6.1 mil-
lion) and slightly higher operating expenses ($0.5 million).
Golf Finance income decreased $7.7 million reflecting lower
interest margin ($3.7 million), higher provision for loan losses ($2.2
million) and higher operating expenses ($1.8 million). The lower
interest margin primarily reflects lower finance receivable pricing and
lower average finance assets of $21 million.
Asset-Based Lending income increased $20.4 million due to
lower provision for losses ($11.8 million), higher interest margin
($10.4 million), partially offset by higher operating expenses ($1.8
million). The increase in interest margin is primarily due to higher
finance receivable pricing ($5.9 million) and higher other income
($5.4 million), partially offset by lower volume.
Structured Capital income increased $13.6 million reflecting
higher interest margin ($16.3 million), primarily due to a nonrecur-
ring prepayment gain of $14.3 million, partially offset by higher pro-
vision for losses ($2.1 million).
Other segment income decreased $6.4 million reflecting higher
provision for losses ($38.4 million), higher operating expenses ($14.7
million), offset by higher interest margin ($46.7 million). These
82383fin.qx4 3/25/03 1:00 PM Page 17
Textron Financial Corporation Annual Report 2002
18
Management’s Discussion and Analysis of Financial Condition and Results of Operations
increases were largely due to the acquisition of a small business port-
folio in the second quarter of 2001. The increase in loss provision was
also due to increases in net charge-offs in other liquidating portfolios
($16.9 million), primarily small-ticket equipment finance.
Special Charges
To enhance its competitiveness and profitability, Textron Financial
committed to a plan to restructure its vendor finance and existing
small business finance operations, in the second quarter and its air-
craft finance and machine tool finance operations in the third quar-
ter. As a result, Textron Financial recognized charges of $2.7 million
for the year ended December 29, 2001, terminated 155 employees
and closed two facilities. The restructuring charges related to employ-
ee terminations include the cost of severance related benefits based on
established policies and practices. As of December 29, 2001, Textron
Financial paid severance related benefits and other expenses of $1.8
million that were charged against the restructuring reserve, leaving a
balance in the reserve of $0.9 million. Textron Financial paid the
remaining restructuring costs in 2002.
Income Before Cumulative Effect of Change in
Accounting Principle
Income before cumulative effect of change in accounting principle for
the twelve months of 2001 of $120.6 million was $2.6 million or
2.2% higher than the corresponding period in 2000. The favorable
results were due to higher average finance assets, higher fee income
($79.3 million) and a lower effective tax rate, partially offset by high-
er selling and administrative expenses ($34.7 million), a higher loss
provision ($45.0 million) and special charges ($2.7 million). Income
before cumulative effect of change in accounting principle excluding
amortization of goodwill was $131.8 million and $129.0 million for
2001 and 2000, respectively.
NEW ACCOUNTING PRONOUNCEMENTS
In November 2002, the FASB issued Interpretation No. 45,
“Guarantor’s Accounting and Disclosure Requirements for
Guarantees, Including Indirect Guarantees of Indebtedness of
Others” (FIN 45). Along with new disclosure requirements, FIN 45
requires guarantors to recognize, at the inception of certain guaran-
tees, a liability for the fair value of the obligation undertaken in issu-
ing the guarantee. This differs from the current practice to record a
liability only when a loss is probable and reasonably estimable. The
recognition and measurement provisions of FIN 45 are applicable on
a prospective basis to guarantees issued or modified after December
31, 2002. The adoption of FIN 45 is not expected to have a material
effect on Textron Financial’s results of operations or financial position.
Textron Financial has adopted the disclosure provisions as of
December 28, 2002.
In January 2003, the FASB issued Interpretation No. 46,
“Consolidation of Variable Interest Entities, an Interpretation of ARB
No. 51” (FIN 46). FIN 46 requires certain variable interest entities to
be consolidated by the primary beneficiary of the entity if the equity
investors in the entity do not have the characteristics of a controlling
financial interest or do not have sufficient equity at risk for the entity
to finance its activities without additional subordinated financial sup-
port from other parties. FIN 46 is effective for all new variable inter-
est entities created or acquired after January 31, 2003. For variable
interest entities created or acquired prior to February 1, 2003, the
provisions of FIN 46 must be applied for the first interim or annual
period beginning after June 15, 2003. Management is currently
evaluating the impact of the adoption of FIN 46 and does not
anticipate that it will have a material effect on Textron Financial’s
results of operations or financial position.
FORWARD-LOOKING INFORMATION
Certain statements in this Annual Report and other oral and written
statements made by Textron Financial from time to time are forward-
looking statements, including those that discuss strategies, goals, outlook
or other nonhistorical matters; or project revenues, income, returns or
other financial measures. These forward-looking statements are subject to
risks and uncertainties that may cause actual results to differ materially
from those contained in the statements, including the following: (a)
changes in worldwide economic and political conditions that impact
interest and foreign exchange rates; (b) the occurrence of further down-
turns in customer markets to which Textron products are sold or supplied
and financed or where Textron Financial offers financing; (c) the abili-
ty to control costs and successful implementation of various cost reduction
programs; (d) the ability to maintain portfolio credit quality; (e) Textron
Financial’s access to debt financing at competitive rates; (f ) access to
equity in the form of retained earnings and capital contributions from
Textron; and (g) uncertainty in estimating contingent liabilities and
establishing reserves tailored to address such contingencies.
82383fin.qx4 3/25/03 1:01 PM Page 18
19
The Board of Directors Textron Financial Corporation
We have audited the accompanying consolidated balance sheets of Textron Financial Corporation as of December 28,
2002 and December 29, 2001, and the related consolidated statements of income, cash flows, and changes in share-
holder’s equity for each of the three years in the period ended December 28, 2002. These financial statements are the
responsibility of the Company’s management. Our responsibility is to express an opinion on these financial state-
ments based on our audits.
We conducted our audits in accordance with auditing standards generally accepted in the United States. Those
standards require that we plan and perform the audit to obtain reasonable assurance about whether the financial state-
ments are free of material misstatement. An audit includes examining, on a test basis, evidence supporting the
amounts and disclosures in the financial statements. An audit also includes assessing the accounting principles used
and significant estimates made by management, as well as evaluating the overall financial statement presentation. We
believe that our audits provide a reasonable basis for our opinion.
In our opinion, the financial statements referred to above present fairly, in all material respects, the consolidated
financial position of Textron Financial Corporation at December 28, 2002 and December 29, 2001, and the consoli-
dated results of its operations and its cash flows for each of the three years in the period ended December 28, 2002, in
conformity with accounting principles generally accepted in the United States.
As discussed in Note 1 to the consolidated financial statements, in 2001 the Company adopted SFAS No. 133
“Accounting for Derivative Instruments and Hedging Activities.”
As discussed in Note 8 to the consolidated financial statements, in 2002 the Company adopted SFAS No. 142,
“Goodwill and Other Intangible Assets” and the remaining provisions of SFAS No. 141, “Business Combinations.”
Boston, Massachusetts
January 23, 2003
Report of Independent Auditors
82383fin.qx4 3/25/03 1:01 PM Page 19

Textron Financial Corporation
20
(In thousands) 2002 2001 2000RevenuesFinance charges and discounts $ 439,668 $ 526,897 $ 587,444Rental revenues on operating leases 27,147 18,884 18,904Other income 163,421 163,455 84,173
630,236 709,236 690,521ExpensesInterest 193,325 268,358 331,865Selling and administrative 165,414 156,207 121,534Provision for losses 138,542 81,679 36,704Depreciation of equipment on operating leases 13,802 7,861 8,422Special charges — 2,686 —
511,083 516,791 498,525Income before income taxes, distributions on preferred securitiesand cumulative effect of change in accounting principle 119,153 192,445 191,996Income taxes 41,997 70,439 72,585Distributions on preferred securities (net of tax benefits of $762, $810 and $837, respectively) 1,478 1,435 1,395Income before cumulative effect of change in accounting principle 75,678 120,571 118,016Cumulative effect of change in accounting principle (net of tax benefit of $8,278) 15,372 — — Net income $ 60,306 $ 120,571 $ 118,016See notes to consolidated financial statements.
For each of the three years in the period ended December 28, 2002
Consolidated Statements of Income
82383fin.qx4 3/25/03 1:01 PM Page 20

Annual Report 2002
21
December 28, December 29,
(Dollars in thousands) 2002 2001
Assets
Cash and equivalents $ 21,287 $ 18,489
Finance receivables, net of unearned income:
Installment contracts 1,827,797 2,047,088
Revolving loans 1,366,064 1,578,922
Golf course and resort mortgages 962,459 811,951
Distribution finance receivables 792,323 474,391
Leveraged leases 460,163 404,423
Finance leases 346,844 318,859
Total finance receivables 5,755,650 5,635,634
Allowance for losses on receivables (166,510) (143,756)
Finance receivables – net 5,589,140 5,491,878
Equipment on operating leases – net 255,055 201,060
Goodwill 180,843 203,564
Other assets 608,003 548,967
Total assets $ 6,654,328 $ 6,463,958
Liabilities and shareholder’s equity
Liabilities
Accrued interest and other liabilities $ 345,270 $ 341,394
Amounts due to Textron Inc. 23,471 29,985
Deferred income taxes 398,199 357,324
Note payable to Textron Inc. — 510,000
Other debt 4,839,621 4,188,420
Total liabilities 5,606,561 5,427,123
Textron Financial and Litchfield obligated mandatory redeemable preferredsecurities of trust subsidiary holding solely Litchfield junior subordinated debentures 26,950 27,480
Shareholder’s equity
Common stock, $100 par value
(4,000 shares authorized; 2,500 shares issued and outstanding) 250 250
Capital surplus 573,676 573,676
Investment in parent company preferred stock (25,000) (25,000)
Accumulated other comprehensive loss (14,637) (18,793)
Retained earnings 486,528 479,222
Total shareholder’s equity 1,020,817 1,009,355
Total liabilities and shareholder’s equity $ 6,654,328 $ 6,463,958
See notes to consolidated financial statements.
Consolidated Balance Sheets
82383fin.qx4 3/25/03 1:01 PM Page 21

Textron Financial Corporation
22
For each of the three years in the period ended December 28, 2002
(In thousands) 2002 2001 2000
Cash flows from operating activities:
Net income before cumulative effect of change in accounting principle $ 75,678 $ 120,571 $ 118,016
Adjustments to reconcile net income to
net cash provided by operating activities:
Provision for losses 138,542 81,679 36,704
Deferred income tax provision 57,533 46,335 16,109
Depreciation 27,790 19,326 16,507
Amortization 10,190 21,828 15,265
Leveraged lease noncash earnings (3,178) — —
Noncash gains on securitizations (28,150) (42,799) (22,053)
(Decrease) increase in accrued interest and other liabilities (33,665) 46,752 (23,799)
Gain on sale of real estate owned — — (1,875)
Other (11,806) (11,301) 7,845
Net cash provided by operating activities 232,934 282,391 162,719
Cash flows from investing activities:
Finance receivables originated or purchased (9,262,616) (7,614,226) (7,032,392)
Finance receivables repaid 7,739,093 5,750,364 5,233,584
Proceeds from receivable sales, including securitizations 1,150,884 2,018,689 1,555,790
Acquisitions, net of cash acquired — (387,594) —
Purchase of assets for operating leases (105,873) (85,444) (50,326)
Proceeds from disposition of operating leases and other assets 53,848 13,014 40,519
Other capital expenditures (17,115) (17,506) (14,406)
Proceeds from real estate owned 7,325 183 8,593
Other investments 17,131 (62,581) (3,356)
Net cash used in investing activities (417,323) (385,101) (261,994)
Cash flows from financing activities:
Proceeds from issuance of long-term debt 2,022,384 896,872 1,287,450
Principal payments on long-term debt (1,605,000) (1,097,226) (798,120)
Net increase (decrease) in commercial paper 249,145 (332,560) (48,388)
Net (decrease) increase in other short-term debt (530,500) 564,465 (324,831)
Proceeds from issuance of nonrecourse debt 169,692 276,118 200,989
Principal payments on nonrecourse debt (58,362) (200,855) (153,139)
Net (decrease) increase in amounts due to Textron Inc. (6,514) 9,987 1,933
Capital contributions from Textron Inc. 9,010 49,010 4,504
Dividends paid to Textron Inc. (62,010) (51,110) (82,004)
Net cash provided by financing activities 187,845 114,701 88,394
Effect of exchange rate changes on cash (658) — —
Net increase (decrease) in cash 2,798 11,991 (10,881)
Cash and equivalents at beginning of year 18,489 6,498 17,379
Cash and equivalents at end of year $ 21,287 $ 18,489 $ 6,498
See notes to consolidated financial statements.
Consolidated Statements of Cash Flows
82383fin.qx4 3/25/03 1:01 PM Page 22
Annual Report 2002
23
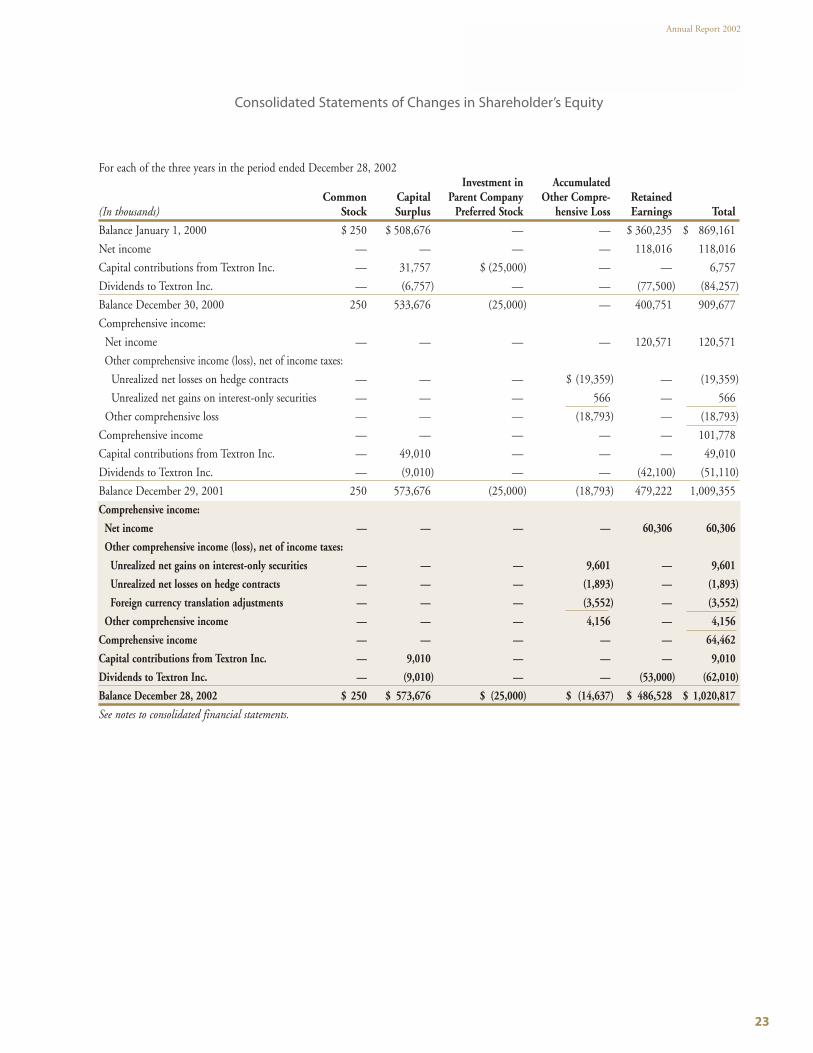
Consolidated Statements of Changes in Shareholder’s Equity
For each of the three years in the period ended December 28, 2002Investment in Accumulated
Common Capital Parent Company Other Compre- Retained(In thousands) Stock Surplus Preferred Stock hensive Loss Earnings Total
Balance January 1, 2000 $ 250 $ 508,676 — — $ 360,235 $ 869,161
Net income — — — — 118,016 118,016
Capital contributions from Textron Inc. — 31,757 $ (25,000) — — 6,757
Dividends to Textron Inc. — (6,757) — — (77,500) (84,257)
Balance December 30, 2000 250 533,676 (25,000) — 400,751 909,677
Comprehensive income:
Net income — — — — 120,571 120,571
Other comprehensive income (loss), net of income taxes:
Unrealized net losses on hedge contracts — — — $ (19,359) — (19,359)
Unrealized net gains on interest-only securities — — — 566 — 566
Other comprehensive loss — — — (18,793) — (18,793)
Comprehensive income — — — — — 101,778
Capital contributions from Textron Inc. — 49,010 — — — 49,010
Dividends to Textron Inc. — (9,010) — — (42,100) (51,110)
Balance December 29, 2001 250 573,676 (25,000) (18,793) 479,222 1,009,355
Comprehensive income:
Net income — — — — 60,306 60,306
Other comprehensive income (loss), net of income taxes:
Unrealized net gains on interest-only securities — — — 9,601 — 9,601
Unrealized net losses on hedge contracts — — — (1,893) — (1,893)
Foreign currency translation adjustments — — — (3,552) — (3,552)
Other comprehensive income — — — 4,156 — 4,156
Comprehensive income — — — — — 64,462
Capital contributions from Textron Inc. — 9,010 — — — 9,010
Dividends to Textron Inc. — (9,010) — — (53,000) (62,010)
Balance December 28, 2002 $ 250 $ 573,676 $ (25,000) $ (14,637) $ 486,528 $ 1,020,817
See notes to consolidated financial statements.
82383fin.qx4 3/25/03 1:01 PM Page 23
Textron Financial Corporation
24
Notes to Consolidated Financial Statements
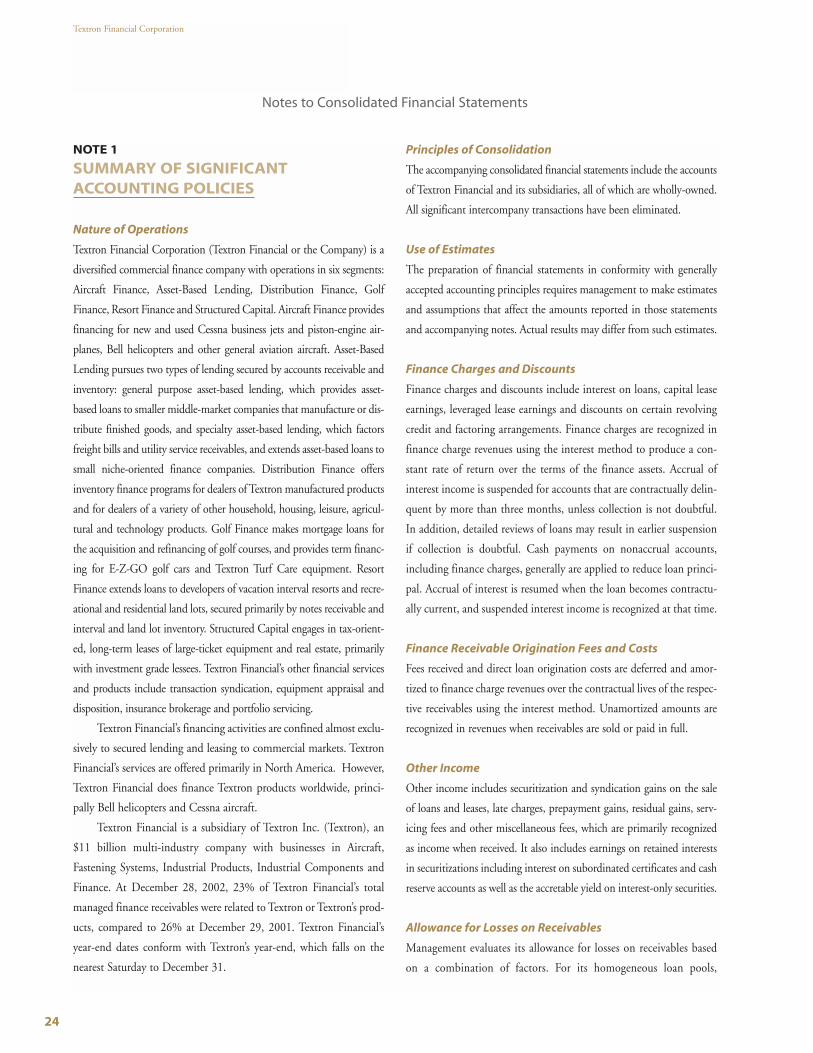
NOTE 1
SUMMARY OF SIGNIFICANTACCOUNTING POLICIES
Nature of Operations
Textron Financial Corporation (Textron Financial or the Company) is a
diversified commercial finance company with operations in six segments:
Aircraft Finance, Asset-Based Lending, Distribution Finance, Golf
Finance, Resort Finance and Structured Capital. Aircraft Finance provides
financing for new and used Cessna business jets and piston-engine air-
planes, Bell helicopters and other general aviation aircraft. Asset-Based
Lending pursues two types of lending secured by accounts receivable and
inventory: general purpose asset-based lending, which provides asset-
based loans to smaller middle-market companies that manufacture or dis-
tribute finished goods, and specialty asset-based lending, which factors
freight bills and utility service receivables, and extends asset-based loans to
small niche-oriented finance companies. Distribution Finance offers
inventory finance programs for dealers of Textron manufactured products
and for dealers of a variety of other household, housing, leisure, agricul-
tural and technology products. Golf Finance makes mortgage loans for
the acquisition and refinancing of golf courses, and provides term financ-
ing for E-Z-GO golf cars and Textron Turf Care equipment. Resort
Finance extends loans to developers of vacation interval resorts and recre-
ational and residential land lots, secured primarily by notes receivable and
interval and land lot inventory. Structured Capital engages in tax-orient-
ed, long-term leases of large-ticket equipment and real estate, primarily
with investment grade lessees. Textron Financial’s other financial services
and products include transaction syndication, equipment appraisal and
disposition, insurance brokerage and portfolio servicing.
Textron Financial’s financing activities are confined almost exclu-
sively to secured lending and leasing to commercial markets. Textron
Financial’s services are offered primarily in North America. However,
Textron Financial does finance Textron products worldwide, princi-
pally Bell helicopters and Cessna aircraft.
Textron Financial is a subsidiary of Textron Inc. (Textron), an
$11 billion multi-industry company with businesses in Aircraft,
Fastening Systems, Industrial Products, Industrial Components and
Finance. At December 28, 2002, 23% of Textron Financial’s total
managed finance receivables were related to Textron or Textron’s prod-
ucts, compared to 26% at December 29, 2001. Textron Financial’s
year-end dates conform with Textron’s year-end, which falls on the
nearest Saturday to December 31.
Principles of Consolidation
The accompanying consolidated financial statements include the accounts
of Textron Financial and its subsidiaries, all of which are wholly-owned.
All significant intercompany transactions have been eliminated.
Use of Estimates
The preparation of financial statements in conformity with generally
accepted accounting principles requires management to make estimates
and assumptions that affect the amounts reported in those statements
and accompanying notes. Actual results may differ from such estimates.
Finance Charges and Discounts
Finance charges and discounts include interest on loans, capital lease
earnings, leveraged lease earnings and discounts on certain revolving
credit and factoring arrangements. Finance charges are recognized in
finance charge revenues using the interest method to produce a con-
stant rate of return over the terms of the finance assets. Accrual of
interest income is suspended for accounts that are contractually delin-
quent by more than three months, unless collection is not doubtful.
In addition, detailed reviews of loans may result in earlier suspension
if collection is doubtful. Cash payments on nonaccrual accounts,
including finance charges, generally are applied to reduce loan princi-
pal. Accrual of interest is resumed when the loan becomes contractu-
ally current, and suspended interest income is recognized at that time.
Finance Receivable Origination Fees and Costs
Fees received and direct loan origination costs are deferred and amor-
tized to finance charge revenues over the contractual lives of the respec-
tive receivables using the interest method. Unamortized amounts are
recognized in revenues when receivables are sold or paid in full.
Other Income
Other income includes securitization and syndication gains on the sale
of loans and leases, late charges, prepayment gains, residual gains, serv-
icing fees and other miscellaneous fees, which are primarily recognized
as income when received. It also includes earnings on retained interests
in securitizations including interest on subordinated certificates and cash
reserve accounts as well as the accretable yield on interest-only securities.
Allowance for Losses on Receivables
Management evaluates its allowance for losses on receivables based
on a combination of factors. For its homogeneous loan pools,
82383fin.qx4 3/25/03 1:01 PM Page 24

Annual Report 2002
25
Notes to Consolidated Financial Statements
Textron Financial examines current delinquencies, the characteris-
tics of the existing accounts, historical loss experience, the value of
the underlying collateral and general economic conditions and
trends. Textron Financial estimates losses will range from 0.5% to
5.6% of finance receivables depending on the specific homogeneous
loan pool. The range of estimated losses is consistent with prior peri-
ods. For larger balance commercial loans, Textron Financial consid-
ers borrower specific information, industry trends and estimated
discounted cash flows, as well as the factors described above for
homogeneous loan pools.
Provisions for losses on finance receivables are charged to
income, in amounts sufficient to maintain the allowance for losses on
receivables at a level considered adequate to cover losses in the exist-
ing finance receivable portfolio, based on management’s evaluation
and analysis of this portfolio.
Finance receivables are charged off when they are deemed uncol-
lectible. Finance receivables are written down to the fair value (less esti-
mated costs to sell) of the related collateral at the earlier of the date the
collateral is repossessed or when no payment has been received for six
months, unless management deems the receivable collectible.
Loan Impairment
Textron Financial periodically evaluates finance receivables, excluding
homogeneous loan portfolios and finance leases, for impairment. A
loan is considered impaired when it is probable that the Company will
be unable to collect all amounts due according to the contractual
terms of the loan agreement. Impairment is measured by comparing
the fair value of a loan to its carrying amount. Fair value is based on
the present value of expected future cash flows discounted at the loan’s
effective interest rate, the loan’s observable market price or, if the loan
is collateral dependent, at the fair value of the collateral. If the fair
value of the loan is less than its carrying amount, the Company estab-
lishes a reserve based on this difference. This evaluation is inherently
subjective, as it requires estimates, including the amount and timing
of future cash flows expected to be received on impaired loans, that
may differ from actual results.
Equipment on Operating Leases
Income from operating leases is recognized in equal amounts over the
lease terms. The costs of such assets are capitalized and depreciated to
estimated residual values using the straight-line method over the esti-
mated useful life of the asset or the lease term.
Goodwill and Other Intangible Assets
Management evaluates the recoverability of goodwill and other intan-
gibles annually, or more frequently if events or changes in circum-
stances, such as declines in interest margin, earnings or cash flows or
material adverse changes in the business climate, indicate that the car-
rying value of an asset might be impaired. Goodwill is considered to
be impaired when the net book value of a reporting unit exceeds its
estimated fair value. Fair values are primarily established using a dis-
counted cash flow methodology. The determination of discounted
cash flow is based on the businesses’ strategic plans and long-range
planning forecasts.
Pension Benefits and Postretirement Benefits
Other than Pensions
Textron Financial participates in Textron’s defined contribution and
defined benefit pension plans. The cost of the defined contribution
plan amounted to approximately $2.1 million, $1.9 million and $1.5
million in 2002, 2001 and 2000, respectively. The cost of the defined
benefit pension plan amounted to approximately $4.7 million, $3.4
million and $2.7 million in 2002, 2001 and 2000, respectively.
Defined benefits under salaried plans are based on salary and years of
service. Textron’s funding policy is consistent with federal law and reg-
ulations. Pension plan assets consist principally of corporate and gov-
ernment bonds and common stocks. Accrued pension expense is
included in Accrued interest and other liabilities on Textron
Financial’s Consolidated Balance Sheets.
Income Taxes
Textron Financial’s revenues and expenses are included in Textron’s
consolidated tax return. Current tax expense is based on allocated fed-
eral tax charges and benefits on the basis of statutory U.S. tax rates
applied to the Company’s taxable income or loss included in Textron’s
consolidated returns.
Deferred income taxes are recognized for temporary differences
between the financial reporting basis and income tax basis of assets and
liabilities, based on enacted tax rates expected to be in effect when such
amounts are expected to be realized or settled.
Securitized Transactions
Securitized transactions involve the sale of finance receivables to qual-
ified special purpose trusts. Textron Financial may retain an interest in
the assets sold in the form of interest-only securities, subordinated
82383fin.qx4 3/25/03 1:01 PM Page 25

Textron Financial Corporation
26
Notes to Consolidated Financial Statements
certificates, cash reserve accounts and servicing rights and obligations.
The Company’s retained interests are subordinate to other investors’
interests in the securitizations. Gain or loss on the sale of the loans or
leases depends in part on the previous carrying amount of the financial
assets involved in the transfer, allocated between the assets sold and the
retained interests based on their relative fair values at the date of trans-
fer. Retained interests are recorded at fair value as a component of
Other assets on Textron Financial’s Consolidated Balance Sheets. The
Company estimates fair values based on the present value of future
cash flows expected under management’s best estimates of key assump-
tions – credit losses, prepayment speeds, forward interest rate yield
curves and discount rates commensurate with the risks involved.
Textron Financial reviews the fair values of the retained interests
quarterly using updated assumptions and compares such amounts
with the carrying value of the retained interests. When the carrying
value exceeds the fair value of the retained interests, the Company
determines whether the decline in fair value is other than temporary.
When the Company determines the value of the decline is other than
temporary, it writes down the retained interests to fair value with a
corresponding charge to income. When a change in fair value of the
Company’s retained interests is deemed temporary, the Company
records a corresponding credit or charge to Other comprehensive
income for any unrealized gains or losses.
Textron Financial does not provide legal recourse to third-party
investors that purchase interests in Textron Financial’s securitizations
beyond the credit enhancement inherent in the retained interest-only
securities, subordinated certificates and cash reserve accounts.
Derivative Financial Instruments
Textron Financial has entered into various interest rate and foreign
exchange agreements to mitigate its exposure to changes in interest and
foreign exchange rates. Effective December 31, 2000, the Company
adopted Statement of Financial Accounting Standards No. 133,
“Accounting for Derivative Instruments and Hedging Activities”
(SFAS No. 133), as amended. In accordance with SFAS No. 133, the
Company records all derivative financial instruments on its balance
sheet at fair value and recognizes changes in fair values in current earn-
ings unless the derivatives qualify as hedges of future cash flows. For
derivatives qualifying as hedges of future cash flows, the Company
records the effective portion of the change in fair value as a component
of Other comprehensive income in the periods the hedged transaction
affects earnings. In accordance with SFAS No. 133, the Company
recorded a cumulative transition adjustment to decrease Other com-
prehensive income by approximately $11.6 million, net of taxes, to
recognize the fair value of cash flow hedges as of the date of adoption.
Textron Financial recognizes the net interest differential on
interest rate exchange agreements, including premiums paid or
received, as adjustments to finance income or interest expense to cor-
respond with the hedged positions. In the event of an early termina-
tion of a derivative financial instrument, the Company defers the gain
or loss in Other comprehensive income until it recognizes the hedged
transaction in earnings.
While these exchange agreements expose Textron Financial to cred-
it losses in the event of nonperformance by the counterparties to the
agreements, the Company does not expect any such nonperformance.
The Company minimizes the risk of nonperformance by entering into
contracts with financially sound counterparties having long-term bond
ratings of no less than middle A, by continuously monitoring such cred-
it ratings and by limiting its exposure with any one financial institution.
Textron Financial had minimal exposure to loss from nonperformance
by the counterparties to these agreements at the end of 2002.
Fair Value of Financial Instruments
Fair values of financial instruments are based upon estimates at a spe-
cific point in time using available market information and appropri-
ate valuation methodologies. These estimates are subjective in nature
and involve uncertainties and significant judgment in the interpreta-
tion of current market data. Therefore, the fair values presented are
not necessarily indicative of amounts Textron Financial could realize
or settle currently.
Cash and Equivalents
Cash and equivalents consist of cash in banks and overnight interest-
bearing deposits in banks.
Reclassifications
Certain prior year amounts have been reclassified to conform with the
current year presentation.
New Accounting Pronouncements
In November 2002, the FASB issued Interpretation No. 45,
“Guarantor’s Accounting and Disclosure Requirements for
Guarantees, Including Indirect Guarantees of Indebtedness of
Others” (FIN 45). Along with new disclosure requirements, FIN 45
82383fin.qx4 3/25/03 1:01 PM Page 26

Annual Report 2002
27
requires guarantors to recognize, at the inception of certain guaran-
tees, a liability for the fair value of the obligation undertaken in issu-
ing the guarantee. This differs from the current practice to record a
liability only when a loss is probable and reasonably estimable. The
recognition and measurement provisions of FIN 45 are applicable on
a prospective basis to guarantees issued or modified after December
31, 2002. The adoption of FIN 45 is not expected to have a material
effect on Textron Financial’s results of operations or financial position.
Textron Financial has adopted the disclosure provisions as of
December 28, 2002.
In January 2003, the FASB issued Interpretation No. 46,
“Consolidation of Variable Interest Entities, an Interpretation of ARB
No. 51” (FIN 46). FIN 46 requires certain variable interest entities to
be consolidated by the primary beneficiary of the entity if the equity
investors in the entity do not have the characteristics of a controlling
financial interest or do not have sufficient equity at risk for the entity
to finance its activities without additional subordinated financial sup-
port from other parties. FIN 46 is effective for all new variable inter-
est entities created or acquired after January 31, 2003. For variable
interest entities created or acquired prior to February 1, 2003, the
provisions of FIN 46 must be applied for the first interim or annual
period beginning after June 15, 2003. Management is currently eval-
uating the impact of the adoption of FIN 46 and does not anticipate
that it will have a material effect on Textron Financial’s results of oper-
ations or financial position.
NOTE 2
OTHER INCOME
The Other component of Other income includes custodial fees, com-
mitment fees, residual gains, insurance fees and other miscellaneous
fees, which are primarily recognized as income when received.
NOTE 3
SPECIAL CHARGES
To enhance its competitiveness and profitability, the Company com-
mitted to a plan to restructure its vendor finance, existing small busi-
ness finance, aircraft finance and machine tool finance operations
during 2001. As a result, the Company recognized charges of $2.7
million for the year ended December 29, 2001.
As a result of the restructuring program, the Company ter-
minated 155 employees and closed two facilities. The restructur-
ing charges related to employee terminations included the cost of
severance related benefits based on established policies and prac-
tices. As of December 29, 2001, the Company had paid severance
related benefits and other expenses of $1.8 million, which were
charged against the restructuring reserve, leaving a balance in the
reserve of $0.9 million. The Company paid the remaining
restructuring costs in 2002.
NOTE 4
RELATIONSHIP WITH TEXTRON INC.
Textron Financial is a wholly-owned subsidiary of Textron and derives
a portion of its business from financing the sale and lease of products
manufactured and sold by Textron. Textron Financial recognized
finance charge revenues from Textron and affiliates (net of payments
or reimbursements for interest charged at more or less than market
rates on Textron manufactured products) of $9.4 million in 2002,
$4.0 million in 2001 and $11.6 million in 2000, and operating lease
revenues of $21.0 million in 2002, $10.9 million in 2001 and $10.9
million in 2000. In 2002, 2001 and 2000, Textron Financial paid
Textron $1.1 billion, $1.3 billion and $1.4 billion, respectively, relat-
ing to the sale of manufactured products to third parties that were
financed by the Company. In addition, the Company paid Textron
$104.3 million, $62.1 million and $50.3 million, respectively, for the
purchase of operating lease equipment.
Textron Financial and Textron are parties to several agreements,
collectively referred to as operating agreements, which govern many
areas of the Textron Financial-Textron relationship. Under operating
agreements with Textron, Textron Financial has recourse to Textron
with respect to certain finance receivables and operating leases.
Finance receivables of $526.7 million at December 28, 2002, and
$648.1 million at December 29, 2001, and operating leases of $122.3
million at December 28, 2002, and $90.6 million at December 29,
(In thousands) 2002 2001 2000
Securitization gains $ 54,203 $ 42,799 $ 22,053
Servicing fees 26,338 16,798 5,080
Investment income 20,097 16,119 5,650
Syndication income 17,699 25,500 14,533
Prepayment gains 10,747 25,665 9,324
Late charges 9,316 10,069 7,681
Other 25,021 26,505 19,852
Total other income $ 163,421 $ 163,455 $ 84,173
Notes to Consolidated Financial Statements
82383fin.qx4 3/25/03 1:01 PM Page 27

Textron Financial Corporation
28
Finance receivables often are repaid or refinanced prior to contrac-
tual maturity. Accordingly, the above tabulation should not be
regarded as a forecast of future cash collections. The ratio of cash
collections (net of finance charges) to average net receivables,
excluding distribution finance receivables and revolving loans, was
approximately 54% in 2002 and 65% in 2001. During 2002 and
2001, cash collections of finance receivables (excluding proceeds
from receivable sales or securitizations) were $7.7 billion and $5.8
billion, respectively.
Installment contracts and finance leases have initial terms gener-
ally ranging from one to twenty years. Installment contracts and
finance leases are secured by the financed equipment and, in some
instances, by the personal guarantee of the principals or recourse
arrangements with the originating vendor. Finance leases include
residual values expected to be realized at contractual maturity.
Revolving loans generally have terms of one to five years, and at
times convert to term loans that contractually amortize over an average
term of four years. Revolving loans consist of loans secured by trade
receivables, inventory, plant and equipment, pools of vacation interval
resort notes receivable, pools of residential and recreational land loans
and the underlying real property.
Golf course mortgages have initial terms generally ranging from
five to seven years with amortization periods from 15 to 25 years.
Resort mortgages generally represent construction and inventory
loans with terms up to two years. Golf course and resort mortgages are
secured by real property and are generally limited to 75% or less of the
Notes to Consolidated Financial Statements
NOTE 5
FINANCE RECEIVABLES
Contractual Maturities
The contractual maturities of finance receivables outstanding at December 28, 2002, were as follows: (See chart below)
(In thousands) 2003 2004 2005 2006 2007 Thereafter Total
Installment contracts $ 274,660 $ 233,578 $ 187,137 $ 165,859 $ 213,218 $ 753,345 $ 1,827,797
Revolving loans 446,989 207,758 114,589 233,338 172,067 191,323 1,366,064
Golf course and resort mortgages 55,196 117,173 231,825 144,381 243,547 170,337 962,459
Distribution finance receivables 491,178 188,109 51,095 27,693 28,581 5,667 792,323
Leveraged leases (16,181) (18,794) 21,706 4,322 7,305 461,805 460,163
Finance leases 29,534 54,431 39,575 16,500 3,540 203,264 346,844
Total finance receivables $ 1,281,376 $ 782,255 $ 645,927 $ 592,093 $ 668,258 $ 1,785,741 $ 5,755,650
2001, were subject to recourse to Textron or due from Textron. In
addition, Textron Financial had recourse to Textron on subordinated
certificates of $59.2 million and $55.8 million at year-end 2002 and
2001, respectively, and on cash reserve accounts of $10.4 million and
$13.9 million at year-end 2002 and 2001, respectively. Both the sub-
ordinated certificates and the cash reserve accounts are retained inter-
ests related to receivable securitizations.
Under the operating agreements between Textron and Textron
Financial, Textron has made available to Textron Financial a $100
million line of credit for junior subordinated borrowings at the prime
interest rate (4.25% at December 28, 2002). Textron Financial had
no borrowings under this line at December 28, 2002. In addition,
Textron has agreed to lend Textron Financial, interest-free, an amount
not to exceed the deferred income tax liability of Textron attributable
to the manufacturing profit deferred for tax purposes on products
manufactured by Textron and financed by Textron Financial. The
Company had borrowings from Textron of $23.7 million at
December 28, 2002 ($20.9 million at December 29, 2001) under this
arrangement. These borrowings are reflected in Amounts due to
Textron Inc. on Textron Financial’s Consolidated Balance Sheets.
Textron has also agreed to cause Textron Financial’s pretax income
available for fixed charges to be no less than 125% of its fixed charges
and its consolidated Shareholder’s equity to be no less than $200 mil-
lion. No related payments were required for 2002, 2001 or 2000.
The Company had an income tax payable of $9.1 million at
December 28, 2002, and an income tax receivable of $3.8 million at
December 29, 2001. These accounts are settled as Textron manages its
consolidated federal tax position.
82383fin.qx4 3/25/03 1:01 PM Page 28

Annual Report 2002
29
Notes to Consolidated Financial Statements
property’s appraised market value at loan origination. Golf course
mortgages, totaling $639.1 million, consist of loans with an average
balance of $4.9 million and an average remaining contractual maturi-
ty of four years. Resort mortgages, totaling $323.4 million, consist of
loans with an average balance of $3.8 million and an average remain-
ing contractual maturity of two years.
Distribution finance receivables generally mature within one
year. Distribution finance receivables are secured by the inventory of
the financed distributor or dealer and, in some programs, by recourse
arrangements with the originating manufacturer. Revolving loans and
Distribution finance receivables are cyclical and result in cash
turnover that is several times larger than contractual maturities. In
2002, such cash turnover was 6.7 times contractual maturities.
Leveraged leases are secured by the ownership of the leased equip-
ment and real property. Leveraged leases reflect contractual maturities
net of contractual nonrecourse debt payments and include residual val-
ues expected to be realized at contractual maturity. Leveraged leases
have initial terms up to approximately 30 years.
Textron Financial’s finance receivables are diversified across geo-
graphic region, borrower industry and type of collateral. Textron
Financial’s geographic concentrations (as measured by managed finance
receivables) at December 28, 2002, were as follows: Southeast 27%; Far
West 15%; Southwest 13%; Mideast 10%; Great Lakes 9%; New
England 4%; Rocky Mountains 4%; other domestic 5%; South America
4%; and other international 9%. Textron Financial’s most significant col-
lateral concentration was general aviation aircraft, which accounted for
21% of managed finance receivables (15% of owned receivables) at
December 28, 2002. The Company has industry concentrations in the
golf and vacation interval industries, which each account for 15% of
managed finance receivables, respectively, at December 28, 2002.
Leveraged Leases
Approximately 42% of Textron Financial’s investment in leveraged
leases is collateralized by real estate.
The components of income from leveraged leases were as follows:
Finance Leases
Minimum lease payments due under finance leases for each of the
next five years and the aggregate amounts due thereafter are as follows:
$60.4 million in 2003, $54.2 million in 2004, $30.3 million in 2005,
$19.4 million in 2006, $10.5 million in 2007 and $165.3 million
thereafter.
Loan Impairment
The Company had $181.6 million of nonaccrual finance receivables
at December 28, 2002, compared to $113.8 million at December 29,
2001. Nonaccrual finance receivables resulted in Textron Financial’s
revenues being reduced by approximately $15.9 million, $10.4 mil-
lion and $8.6 million for 2002, 2001 and 2000, respectively. No
interest income was recognized using the cash basis method.
Excluding homogeneous loan portfolios and finance leases, the
Company had impaired loans of $122.1 million and $53.9 million at
December 28, 2002 and December 29, 2001, respectively. Impaired
loans with identified reserve requirements were $109.9 million at
December 28, 2002, compared to $53.9 million at December 29,
2001. The allowance for losses on receivables related to impaired loans
with identified reserve requirements was $32.7 million and $10.9 mil-
lion at December 28, 2002 and December 29, 2001, respectively. The
average recorded investment in impaired loans during 2002 was $96.7
million, compared to $51.1 million in 2001.
Captive finance receivables with recourse that were 90 days or
more delinquent amounted to 19.3%, 16.0% and 12.6% of captive
finance receivables with recourse for the years ended 2002, 2001 and
2000, respectively. Revenues recognized on these delinquent accounts
were approximately $7.4 million, $9.5 million and $10.1 million for
the years ended 2002, 2001 and 2000, respectively.
(In thousands) 2002 2001
Total minimum lease payments receivable $ 340,113 $ 215,526
Estimated residual values of leased equipment 190,074 187,626
530,187 403,152
Unearned income (183,343) (84,293)
Net investment in finance leases $ 346,844 $ 318,859
(In thousands) 2002 2001 2000
Income recognized $ 29,491 $ 25,586 $ 21,973
Income tax expense (10,027) (9,237) (8,240)
Income from leveraged leases $ 19,464 $ 16,349 $ 13,733
(In thousands) 2002 2001
Rental receivable $ 1,401,832 $ 1,180,292
Nonrecourse debt (1,017,290) (905,960)
Estimated residual values of leased assets 398,773 401,745
Less unearned income (323,152) (271,654)
Investment in leveraged leases 460,163 404,423
Deferred income taxes (327,523) (258,385)
Net investment in leveraged leases $ 132,640 $ 146,038
82383fin.qx4 3/25/03 1:01 PM Page 29
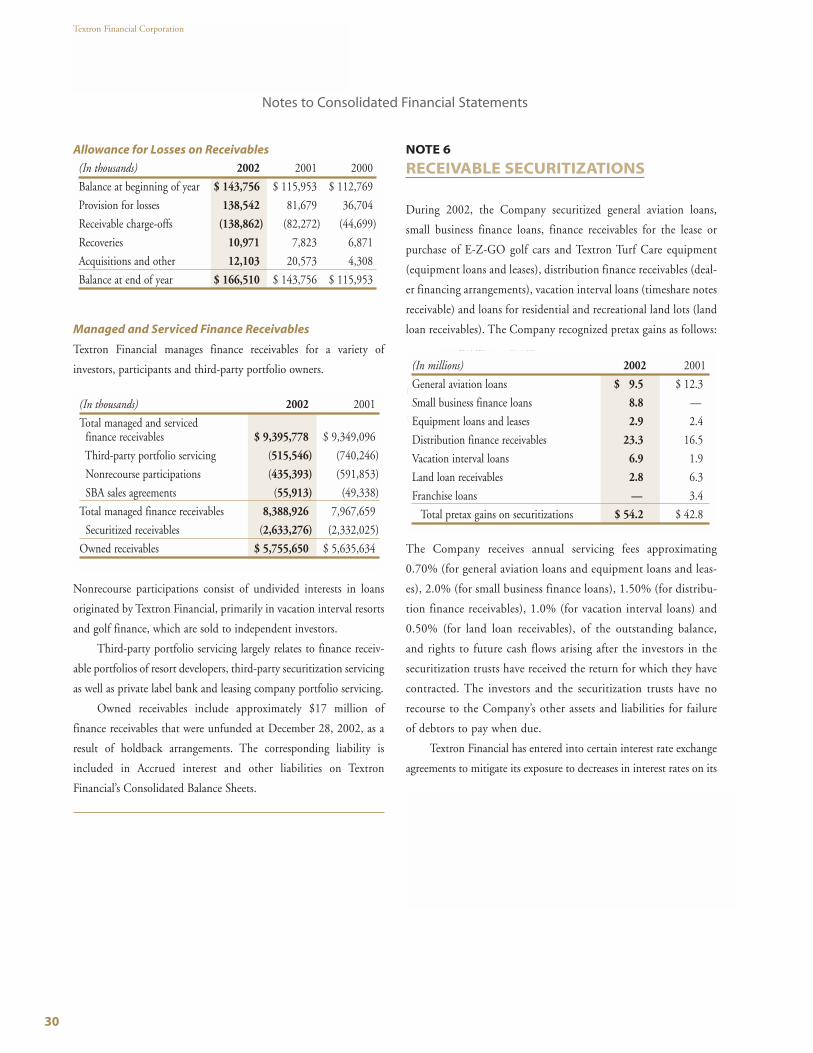
Textron Financial Corporation
30
Notes to Consolidated Financial Statements
Allowance for Losses on Receivables
Managed and Serviced Finance Receivables
Textron Financial manages finance receivables for a variety of
investors, participants and third-party portfolio owners.
Nonrecourse participations consist of undivided interests in loans
originated by Textron Financial, primarily in vacation interval resorts
and golf finance, which are sold to independent investors.
Third-party portfolio servicing largely relates to finance receiv-
able portfolios of resort developers, third-party securitization servicing
as well as private label bank and leasing company portfolio servicing.
Owned receivables include approximately $17 million of
finance receivables that were unfunded at December 28, 2002, as a
result of holdback arrangements. The corresponding liability is
included in Accrued interest and other liabilities on Textron
Financial’s Consolidated Balance Sheets.
NOTE 6
RECEIVABLE SECURITIZATIONS
During 2002, the Company securitized general aviation loans,
small business finance loans, finance receivables for the lease or
purchase of E-Z-GO golf cars and Textron Turf Care equipment
(equipment loans and leases), distribution finance receivables (deal-
er financing arrangements), vacation interval loans (timeshare notes
receivable) and loans for residential and recreational land lots (land
loan receivables). The Company recognized pretax gains as follows:
The Company receives annual servicing fees approximating
0.70% (for general aviation loans and equipment loans and leas-
es), 2.0% (for small business finance loans), 1.50% (for distribu-
tion finance receivables), 1.0% (for vacation interval loans) and
0.50% (for land loan receivables), of the outstanding balance,
and rights to future cash flows arising after the investors in the
securitization trusts have received the return for which they have
contracted. The investors and the securitization trusts have no
recourse to the Company’s other assets and liabilities for failure
of debtors to pay when due.
Textron Financial has entered into certain interest rate exchange
agreements to mitigate its exposure to decreases in interest rates on its
8.73% 8.72%
BOR $11,767 $19,450
5.34% 5.44%
(In millions) 2002 2001
General aviation loans $ 9.5 $ 12.3
Small business finance loans 8.8 —
Equipment loans and leases 2.9 2.4
Distribution finance receivables 23.3 16.5
Vacation interval loans 6.9 1.9
Land loan receivables 2.8 6.3
Franchise loans — 3.4
Total pretax gains on securitizations $ 54.2 $ 42.8
(In thousands) 2002 2001
Total managed and servicedfinance receivables $ 9,395,778 $ 9,349,096
Third-party portfolio servicing (515,546) (740,246)
Nonrecourse participations (435,393) (591,853)
SBA sales agreements (55,913) (49,338)
Total managed finance receivables 8,388,926 7,967,659
Securitized receivables (2,633,276) (2,332,025)
Owned receivables $ 5,755,650 $ 5,635,634
(In thousands) 2002 2001 2000
Balance at beginning of year $ 143,756 $ 115,953 $ 112,769
Provision for losses 138,542 81,679 36,704
Receivable charge-offs (138,862) (82,272) (44,699)
Recoveries 10,971 7,823 6,871
Acquisitions and other 12,103 20,573 4,308
Balance at end of year $ 166,510 $ 143,756 $ 115,953
82383fin.qx4 3/25/03 1:01 PM Page 30

At December 28, 2002, key economic assumptions and the sen-
sitivity of the current fair value of residual cash flows to immediate
10% and 20% adverse changes in those assumptions are as follows:
(See chart below)
Annual Report 2002
31
interest-only securities. For more information regarding Textron
Financial’s interest rate exchange agreements, see Note 11 to the con-
solidated financial statements.
Key economic assumptions used in measuring the retained inter-
ests at the date of securitization resulting from securitizations com-
pleted during 2002 were as follows: (See chart below)
General Aviation Small Business Equipment Loans Distribution Finance Vacation Land LoanAircraft Loans Loans and Leases Receivables Interval Loans Receivables
Prepayment speed (annual rate) 23.0% 6.6% 7.5% — 20.7% 20.0%
Weighted average life (in years) 4.1 1.6 2.2 0.3 3.5 5.0
Expected credit losses (annual rate) 0.8% 4.5% 0.8% 0.3% 1.0% 1.5%
Residual cash flows discount rate 4.7% 11.5% 7.4% 5.8% 7.3% 11.2%
General Aviation Small Business Equipment Loans Distribution Finance Vacation Land Loan(Dollars in millions) Aircraft Loans Loans and Leases Receivables Interval Loans Receivables
Carrying amount of retained interestsin securitizations – net $ 89.0 $ 58.0 $ 46.5 $ 89.2 $ 12.9 $ 27.1
Weighted average life (in years) 3.2 1.6 1.8 0.3 5.1 5.3
Prepayment speed (annual rate) 21.8% 6.6% 7.0% — 15.0% 20.0%
10% adverse change $ (2.5) $ (0.1) $ (0.2) — $ (0.8) $ (1.9)
20% adverse change (4.4) (0.3) (0.4) — (1.5) (3.3)
Expected credit losses (annual rate) 0.4% 4.5% 0.2% 0.3% 0.5% 1.5%
10% adverse change $ (0.1) $ (0.2) — — — $ (0.2)
20% adverse change (0.3) (0.4) — — $ (0.1) (0.5)
Residual cash flows discount rate 6.6% 11.5% 7.4% 5.8% 10.0% 9.2%
10% adverse change $ (1.3) $ (1.3) $ (0.7) $ (0.3) $ (0.3) $ (0.9)
20% adverse change (2.5) (2.4) (1.3) (0.6) (0.5) (1.7)
Notes to Consolidated Financial Statements
These sensitivities are hypothetical and should be used with cau-
tion. As the figures indicate, changes in fair value based on a 10%
variation in assumptions generally cannot be extrapolated because the
relationship of the change in assumption to the change in fair value
may not be linear. Also, in this table, the effect of a variation in a par-
ticular assumption on the fair value of the retained interest is calcu-
lated without changing any other assumption, in reality, changes in
one factor may result in another that may magnify or counteract the
sensitivities losses, such as increases in market interest rates may result
in lower prepayments and increased credit losses.
Static pool losses are calculated by summing the actual and pro-
jected future credit losses and dividing them by the original balance
of each pool of assets. At December 28, 2002, total expected losses
for securitizations occurring in 2002 were 1.07% for general aviation
loans, 6.16% for small business finance loans, 0.16% for equipment
loans and leases, 0.16% for distribution finance receivables, 1.20%
for vacation interval loans and 3.17% for land loan receivables.
Total expected losses for securitizations occurring in 2001 were
0.47% for general aviation aircraft loans, 0.20% for equipment loans
and leases, 1.30% for franchise loans, 0.25% for distribution finance
receivables, 2.18% for vacation interval loans and 4.17% for land loan
receivables.
The table below summarizes certain cash flows received from
and (paid to) securitization trusts during the years ended December
28, 2002 and December 29, 2001, respectively.
n millions) 2001 2000
(In millions) 2002 2001
Proceeds from securitizations $ 892.2 $ 1,296.8
Servicing fees received 23.9 14.9
Cash flows received on retained interests 112.0 38.2
82383fin.qx4 3/25/03 1:01 PM Page 31

Textron Financial Corporation
32
Notes to Consolidated Financial Statements
NOTE 7
EQUIPMENT ON OPERATING LEASES
Initial lease terms of equipment on operating leases range from one to ten
years. Future minimum rentals at December 28, 2002, are $25.8 million in
2003, $17.0 million in 2004, $15.2 million in 2005, $13.2 million in
2006, $9.4 million in 2007 and $18.3 million thereafter.
NOTE 8
GOODWILL
On December 30, 2001, Textron Financial adopted SFAS No. 142,
“Goodwill and Other Intangible Assets,” which requires companies to
stop amortizing goodwill and certain intangible assets with indefinite
useful lives, and requires an annual review for impairment. Upon
adoption, Textron Financial discontinued the amortization of good-
will. Goodwill amortization expense was $11.2 million and $11.0
million for 2001 and 2000, respectively, net of income taxes.
Under SFAS No. 142, Textron Financial was required to test all exist-
ing goodwill for impairment as of December 30, 2001, on a “reporting
unit” basis. The reporting unit represents the operating segment unless, at
businesses one level below that operating segment (a “component”), dis-
crete financial information is prepared that is reviewed by segment man-
agement, in which case such component is the reporting unit. In certain
instances, components of an operating segment have been aggregated and
deemed a single reporting unit based on similar economic characteristics
of the components. Goodwill is considered to be impaired when the net
book value of a reporting unit exceeds its estimated fair value. Fair values
were established using a discounted cash flow methodology.
As a result of this impairment review of goodwill, Textron
Financial recorded an after-tax transitional impairment charge of
$15.4 million ($23.7 million, pre-tax), which is reported in the cap-
tion “Cumulative effect of change in accounting principle.” The
charge relates to the Franchise Finance division within the Other seg-
ment and is primarily the result of decreasing loan volumes and an
unfavorable securitization market. No impairment charge was appro-
priate for this reporting unit under the previous goodwill impairment
accounting standard, which was based on undiscounted cash flows.
Textron Financial also adopted the remaining provisions of SFAS
No. 141, “Business Combinations,” on December 30, 2001. For good-
will and intangible assets reported in connection with acquisitions made
prior to July 1, 2001, these provisions broaden the criteria for recording
intangible assets separate from goodwill and require that certain intangi-
(In thousands) 2002 2001
Equipment on operating leases, at cost:
Aircraft $ 258,337 $ 201,250
Golf cars 34,563 30,864
Accumulated depreciation:
Aircraft and golf cars (37,845) (31,054)
Equipment on operating leases – net $ 255,055 $ 201,060
Total Principal Aggregate Contract Net CreditAmount of Value 60 Days or 60+ Days Average Net Credit Losses
(In millions) Loans and Leases More Past Due Delinquency Balances Losses Annual Rate
Type of Finance Receivable At December 28, 2002 Year-ended December 28, 2002
General aviation aircraft loans $ 1,738.8 $ 47.5 2.7% $ 1,771.7 $ 25.0 1.4%
Small business finance loans 440.6 10.6 2.4% 424.4 26.1 6.1%
Equipment loans and leases 587.8 29.9 5.1% 593.3 1.8 0.3%
Distribution finance receivables 1,500.5 32.5 2.2% 1,277.4 8.2 0.6%
Vacation interval loans 961.4 3.0 0.3% 905.8 1.0 0.1%
Land loan receivables 285.2 9.5 3.3% 249.4 1.4 0.6%
Total loans held and securitized $ 5,514.3 $ 133.0 $ 5,222.0 $ 63.5
Consisting of:
Loans held in portfolio $ 2,881.0 $ 54.7
Loans securitized 2,633.3 78.3
Total loans held and securitized $ 5,514.3 $ 133.0
Historical loss and delinquency amounts for Textron Financial’s
loans held and securitized for the year ended December 28, 2002,
were as follows: (See chart below)
82383fin.qx4 3/25/03 1:01 PM Page 32

Annual Report 2002
33
Notes to Consolidated Financial Statements
ble assets that do not meet the new criteria, such as workforce, be reclas-
sified into goodwill. Upon adoption of these provisions, intangible assets
totaling $0.9 million were reclassified into goodwill within the Resort
Finance segment.
Goodwill totaled $110.0 million in the Resort Finance segment,
$40.6 million in the Asset-Based Lending segment, $16.6 million in
the Aircraft Finance segment and $13.6 million in the Other segment
at December 28, 2002.
The impact on net income of discontinuing the amortization of
goodwill is presented below:
NOTE 9
OTHER ASSETS
The Investment in equipment residuals represents the remaining
equipment residual values associated principally with Textron golf and
turf equipment lease payments that were securitized in 2002, 2001
and 2000.
The cost of fixed assets is being depreciated using the straight-line
method based on the estimated useful lives of the assets.
NOTE 10
DEBT AND CREDIT FACILITIES
Textron Financial has bank lines of credit of $1.5 billion, of which $500
million expires in 2003 and $1.0 billion expires in 2006. Textron
Financial’s lines of credit, including the $100 million line of credit with
Textron, not reserved as support for commercial paper or utilized for let-
ters of credit at December 28, 2002, were $716 million. The Company
also maintains a C$50 million committed Canadian facility under which
it can borrow an additional C$50 million on an uncommitted basis. At
December 28, 2002, the Company has fully used the committed por-
tion of the facility in addition to borrowing C$1 million under the
uncommitted portion of the facility. Textron Financial also has a $25
million multi-currency facility, of which $14 million remains unused at
year-end 2002. Both the Canadian and multi-currency facilities expire in
2003. Textron Financial generally pays fees in support of these lines.
Through its subsidiary, Textron Financial Canada Funding Corp.
(Textron Canada Funding), the Company periodically issues debt secu-
rities. Textron Financial owns 100% of the common stock of Textron
Canada Funding. Textron Canada Funding is a financing subsidiary of
Textron Financial with no operations, revenues or cash flows other than
those related to the issuance, administration and repayment of debt secu-
rities that are fully and unconditionally guaranteed by Textron Financial.
The weighted average interest rates on short-term borrowings,
before consideration of the effect of interest rate exchange agreements
at year-end were as follows:
2002 2001 2000
Commercial paper 1.68% 2.37% 6.66%
Other short-term debt 2.98% 2.41% 7.13%
(In thousands) 2002 2001
Short-term debt:
Commercial paper $ 872,397 $ 623,252
Other short-term debt 43,955 64,455
Note payable to Textron Inc. — 510,000
Total short-term debt 916,352 1,197,707
Long-term debt:
5.65% - 5.95% notes; due 2003 to 2007 1,152,682 399,503
6.00% - 6.84% notes; due 2003 to 2009 595,836 31,637
7.13% - 7.37% notes; due 2003 to 2007 837,545 1,081,223
Variable rate notes due 2003 to 2007 1,337,206 1,988,350
Total long-term debt 3,923,269 3,500,713
Total debt $ 4,839,621 $ 4,698,420
(In thousands) 2002 2001
Retained interests in securitizations $ 257,147 $ 178,599
Investment in equipment residuals 115,394 112,804
Interest-only securities 92,798 78,939
Fixed assets – net 50,196 44,680
Repossessed assets and properties 36,234 23,235
Other long-term investments 24,104 24,723
Short-term investments — 63,819
Other 32,130 22,168
Total other assets $ 608,003 $ 548,967
(In thousands) 2002 2001 2000
Income before cumulative effect of change in accounting principle $ 75,678 $ 120,571 $ 118,016
Add back: amortization, net of taxes — 11,217 11,012
Adjusted net income before cumulative effect of change in accounting principle 75,678 131,788 129,028
Cumulative effect of change in accounting principle, net of taxes 15,372 — —
Adjusted net income $ 60,306 $ 131,788 $ 129,028
82383fin.qx4 3/25/03 1:01 PM Page 33

Textron Financial Corporation
34
Notes to Consolidated Financial Statements
The corresponding weighted average interest rates on these bor-
rowings during the last three years were 2.07% in 2002, 4.12% in
2001 and 6.44% in 2000. Weighted average interest rates have been
determined by relating interest costs for each year to the daily average
dollar amounts outstanding.
Interest on Textron Financial’s variable rate notes is predomi-
nately tied to the three-month LIBOR for U.S. Dollar deposits. The
weighted average interest rate on these notes was 2.16% at December
28, 2002, 2.41% at December 29, 2001, and 6.96% at December 30,
2000. The corresponding weighted average interest rates on these
notes during the last three years were 2.58% in 2002, 4.89% in 2001
and 6.93% in 2000.
Securitizations are an important source of liquidity for Textron
Financial and involve the periodic transfer of finance receivables to
qualified special purpose trusts. At December 28, 2002, and
December 29, 2001, the amount of debt related to these securitization
trusts was $2.3 billion and $2.1 billion, respectively.
The amount of net assets available for dividends and other pay-
ments to Textron is restricted by the terms of the Company’s lending
agreements. At December 28, 2002, $448.5 million of net assets were
available to be transferred to Textron under the most restrictive
covenant. The lending agreements contain various restrictive provi-
sions regarding additional debt (not to exceed 800% of consolidated
net worth and qualifying subordinated obligations), minimum net
worth ($200 million), the creation of liens and the maintenance of a
fixed charges coverage ratio (no less than 125%).
Required principal payments on long-term debt outstanding at
December 28, 2002, are $1,068.9 million in 2003, $1,407.3 million
in 2004, $199.0 million in 2005, $25.0 million in 2006, $725.6 mil-
lion in 2007 and $497.0 million in 2009.
Cash payments made by Textron Financial for interest were $195.6
million in 2002, $281.5 million in 2001 and $324.7 million in 2000.
NOTE 11
DERIVATIVE FINANCIAL INSTRUMENTS
Textron Financial has entered into interest rate exchange agreements
to mitigate its exposure to interest rate changes by converting certain
of its fixed rate receivables and debt issues to floating rates. The agree-
ments require the Company to make periodic fixed rate payments in
exchange for floating rate receipts and vice versa based on specified
notional amounts. During 2002, Textron Financial also entered into a
foreign currency exchange agreement to convert a ¥6.0 billion fixed
rate note to a $44.8 million variable rate note. The agreement requires
the Company to make U.S. Dollar payments based on LIBOR in
exchange for fixed receipts of Yen at specified notional amounts. The
Company has designated these agreements fair value hedges. The
Company does not hold or issue derivative financial instruments for
trading or speculative purposes. At December 28, 2002, the Company
had interest rate exchange agreements with a fair value of $43 million
designated as fair value hedges, compared to a liability of $6 million
at December 29, 2001.
Textron Financial has also entered into interest rate exchange,
cap and floor agreements to mitigate its exposure on interest-only
securities resulting from securitizations. The exchange agreements
require the Company to make periodic variable rate payments in
exchange for periodic fixed rate receipts and vice versa based on spec-
ified notional amounts. The interest rate cap and floor agreements
require the Company to make periodic variable rate payments based
on specified notional amounts if interest rates exceed or fall below
specified rates. The Company has designated these agreements cash
flow hedges.
During 2002, the Company also entered into foreign currency
exchange agreements to convert $107.0 million of variable rate notes
receivable to C$170.0 million of fixed rate notes receivable to manage
foreign currency exposure by matching these notes receivable to
Canadian denominated debt. The agreements require the Company
to make U.S. Dollar payments based on LIBOR in exchange for fixed
receipts of Canadian Dollars at specified notional amounts. The
Company has designated these agreements cash flow hedges.
Textron Financial has not incurred or recognized any gains or
losses in earnings as the result of the ineffectiveness or the exclusion
from its assessment of hedge effectiveness of its fair value or cash
flow hedges.
Assuming no changes in interest rates, the Company expects
$9.1 million of net deferred losses to be reclassified to earnings over
the next year to offset interest payments made or received. In addition,
the Company expects approximately $1.9 million, net of income
taxes, to be reclassified to earnings as a result of the amortization of
deferred losses related to discontinued hedges.
82383fin.qx4 3/25/03 1:01 PM Page 34

Annual Report 2002
35
Notes to Consolidated Financial Statements
Fair Value Hedges(Dollars in thousands) 2002 2001Interest rate exchange agreements designated against fixed rate receivables:
Notional principal $ 219,357 $ 96,909Weighted average remaining term 12.1 years 12.0 yearsFixed weighted average interest rate 5.87% 8.14%Variable weighted average interest rate 1.93% 3.10%
Interest rate exchange agreements designated against fixed rate debt:Notional principal $ 1,240,000 $ 370,000Weighted average remaining term 5.1 years 0.6 yearsVariable weighted average interest rate 2.10% 1.88%Fixed weighted average interest rate 5.09% 4.08%
Foreign currency and interest rate exchange agreement designated against foreign debt:Notional principal $ 44,810 —Weighted average remaining term 0.2 years —Fixed weighted average interest rate — OID — —Variable weighted average interest rate — LIBOR 2.40% —
Foreign currency and interest rate basis exchange agreement designated against foreign debt:Notional principal $ 32,500 $ 32,500Weighted average remaining term 0.9 years 1.9 yearsVariable weighted average interest rate — BA-CDOR 3.60% 3.12%Variable weighted average interest rate — LIBOR 2.05% 2.75%
Cash Flow Hedges(Dollars in thousands)Foreign currency and interest rate exchange agreements designated against variable rate receivables:
Notional principal $ 106,979 — Weighted average remaining term 2.1 years — Variable weighted average interest rate 3.03% — Fixed weighted average interest rate 5.95% —
Interest rate basis exchange agreement:Notional principal $ 20,000 — Weighted average remaining term 4.9 years — Variable weighted average interest rate — Prime 2.90% — Variable weighted average interest rate — U.S. Treasury Bill 3.11% —
LIBOR based interest rate exchange agreements designated against variable rate interest-only securities:Notional principal $ 406,644 $ 370,970Weighted average remaining term 5.1 years 6.5 yearsVariable weighted average interest rate 2.09% 2.57%Fixed weighted average interest rate 4.79% 5.71%
Prime based interest rate exchange agreements designated against variable rate interest-only securities:Notional principal $ 76,577 $ 111,735Weighted average remaining term 15.9 years 16.7 yearsVariable weighted average interest rate 4.43% 5.16%Fixed weighted average interest rate 9.07% 9.00%
One-month LIBOR based interest rate cap agreements designated against variable rate interest-only securities:
Notional principal tied to the one-month LIBOR $ 389,167 $ 337,274Weighted average cap rate 5.43% 6.35%
Prime rate based interest rate floor agreements designated against variable rate interest-only securities:Notional principal tied to the prime rate $ 129,124 $ 148,420Weighted average floor rate 8.75% 8.73%
Six-month LIBOR based interest rate floor agreements designated against variable rate interest-only securities:
Notional principal tied to the six-month LIBOR — $ 11,767Weighted average floor rate — 5.34%
The derivative financial instruments are summarized as follows:
82383fin.qx4 3/25/03 1:01 PM Page 35

Textron Financial Corporation
36
Notes to Consolidated Financial Statements
NOTE 12
TEXTRON FINANCIAL AND LITCHFIELDOBLIGATED MANDATORY REDEEMABLEPREFERRED SECURITIES OF TRUSTSUBSIDIARY HOLDING SOLELY LITCHFIELDJUNIOR SUBORDINATED DEBENTURES
Prior to Textron Financial’s acquisition of Litchfield on November 3,
1999, a trust, sponsored and wholly-owned by Litchfield, issued to
the public $26.2 million of mandatory redeemable preferred securities
(Preferred Securities). The trust subsequently invested in $26.2 mil-
lion aggregate principal amount of Litchfield 10% Series A Junior
Subordinated Debentures (Series A Debentures), due 2029. The
Series A Debentures are the sole asset of the trust. The amounts due
to the trust under the Series A Debentures and the related income
statement amounts have been eliminated in Textron Financial’s con-
solidated financial statements.
The Preferred Securities were recorded by Textron Financial at
the fair value of $28.6 million as of the acquisition date and the fair
value adjustment is being amortized through June 2004.
The Preferred Securities accrue and pay cash distributions quar-
terly at a rate of 10% per annum. The trust’s obligations under the
Preferred Securities are fully and unconditionally guaranteed by
Litchfield, including, without limitation, all obligations arising under
the Declaration Trust, the Trust Preferred Securities, the Indenture,
the Debentures and the ancillary agreements entered into in connec-
tion with the foregoing. The trust will redeem all of the outstanding
Preferred Securities when the Series A Debentures are paid at maturi-
ty on June 30, 2029, or otherwise become due. Litchfield will have
the right to redeem 100% of the principal plus accrued and unpaid
interest on or after June 30, 2004.
As a result of the acquisition, Textron Financial has agreed to
make payments to the holders of the Preferred Securities, when due,
to the extent not paid by or on behalf of the trust or the subsidiary.
NOTE 13
INVESTMENT IN PARENT COMPANY PREFERRED STOCK
On April 12, 2000, Textron made a $25 million noncash capital con-
tribution to Textron Financial consisting of all of the outstanding
shares of Textron Funding Corporation (Textron Funding), a related
corporate holding company. Textron Funding’s only asset is 1,522
shares of Textron Inc. Series D cumulative preferred stock, bearing an
annual dividend yield of 5.92%. The preferred stock, which has a face
value of $152.2 million, is carried at its original cost of $25 million
and is presented in a manner similar to treasury stock for financial
reporting purposes. Dividends on the preferred stock are treated as
additional capital contributions from Textron.
NOTE 14
ACCUMULATED OTHERCOMPREHENSIVE LOSS
There were no items of Other comprehensive income during 2000.
(In thousands) 2002 2001
Beginning of year $ (18,793) —Transition adjustment due to change in
accounting for derivative instruments and hedging activities, net of income tax benefit of $6,948 — $ (11,580)
Net deferred loss on hedge contracts, net of income tax benefits of $2,519 and $6,395, respectively (4,198) (10,659)
Foreign currency translation adjustments (3,552) —
Amortization of deferred loss on terminatedhedge contracts, net of income taxes of $1,383 and $1,728, respectively 2,305 2,880
Net deferred gain on interest-only securities, net of income taxes of $5,761 and $340, respectively 9,601 566
End of year $ (14,637) $ (18,793)
82383fin.qx4 3/25/03 1:01 PM Page 36

Annual Report 2002
37
Notes to Consolidated Financial Statements
NOTE 15
INCOME TAXES
Income before income taxes, distributions on preferred securities and
cumulative effect of change in accounting principle is as follows:
The components of income taxes were as follows:
Cash (received) paid for income taxes was ($30.8) million in 2002,
$15.8 million in 2001 and $77.2 million in 2000.
The federal statutory income tax rate was reconciled to the effective
income tax rate as follows:
The components of Textron Financial’s deferred tax assets and liabilities
were as follows:
At December 28, 2002, Textron Financial had state net operating
loss carryforwards of approximately $383 million available to offset
future state taxable income. The state net operating loss carryfor-
wards will expire in years 2003 through 2021. The valuation
allowance reported above represents the tax effect of certain state
net operating loss carryforwards. Textron Financial is unable to con-
clude that “more likely than not” it will realize the benefit from such
carryforwards.
(In thousands) 2002 2001
Deferred tax assets:
Allowance for losses $ 40,344 $ 34,755
State net operating losses 12,448 10,294
Deferred origination fees 5,154 6,308
Nonaccrual loans 5,455 3,383
Other 43,856 30,589
Total deferred tax assets 107,257 85,329
Less: valuation allowance (5,071) (4,626)
Net deferred tax assets 102,186 80,703
Deferred tax liabilities:
Leveraged leases 318,880 279,979
Finance leases 114,645 86,167
Equipment on operating leases 32,871 34,957
Other 33,989 36,924
Total deferred tax liabilities 500,385 438,027
Net deferred tax liabilities $ 398,199 $ 357,324
2002 2001 2000
Federal statutory income tax rate 35.0% 35.0% 35.0%
State income taxes 3.0 1.6 2.1
Tax exempt interest (0.7) (0.3) (0.3)
Foreign tax rate differential (2.0) (0.5) (0.1)
Goodwill — 1.7 1.7
Other, net — (0.9) (0.6)
Effective income tax rate 35.3% 36.6% 37.8%
(In thousands) 2002 2001 2000
Current:
Federal $ (26,177) $ 26,752 $ 51,666
State 10,005 2,321 3,732
Foreign 636 702 1,078
Total current income taxes (15,536) 29,775 56,476
Deferred:
Federal 64,957 37,423 16,152
State (5,848) 3,241 (43)
Foreign (1,576) — —
Total deferred income taxes 57,533 40,664 16,109
Total income taxes $ 41,997 $ 70,439 $ 72,585
(In thousands) 2002 2001 2000
United States $ 121,248 $ 191,556 $ 189,705
Foreign (2,095) 889 2,291
Total $ 119,153 $ 192,445 $ 191,996
82383fin.qx4 3/25/03 1:01 PM Page 37

Textron Financial Corporation
38
NOTE 16
FAIR VALUE OF FINANCIAL INSTRUMENTS
The following methods and assumptions were used in estimating the
fair value of Textron Financial’s financial instruments:
Finance Receivables
The estimated fair values of fixed rate installment contracts, revolv-
ing loans, golf course and resort mortgages and distribution finance
receivables were estimated based on discounted cash flow analyses
using interest rates currently being offered for similar loans to bor-
rowers of similar credit quality. The estimated fair values of all vari-
able rate receivables approximated the net carrying value of such
receivables. The estimated fair values of nonperforming loans were
based on independent appraisals, discounted cash flow analyses
using risk adjusted interest rates or Textron Financial valuations
based on the fair value of the related collateral. The fair values, net
of carrying amounts of Textron Financial’s leveraged leases, finance
leases and operating leases ($460.2 million, $346.8 million and
$255.1 million, respectively, at December 28, 2002, and $404.4
million, $318.9 million and $201.1 million, respectively, at
December 29, 2001), are specifically excluded from this disclosure
under generally accepted accounting principles. As a result, a signif-
icant portion of the assets which are included in the Company’s asset
and liability management strategy are excluded from this fair value
disclosure.
Debt, Interest Rate Exchange Agreements, Foreign
Currency Forward Exchange Contracts and Foreign
Currency Exchange Agreements
The estimated fair value of fixed rate debt and variable rate long-term
notes was determined by either independent investment bankers or dis-
counted cash flow analyses using interest rates for similar debt with
maturities similar to the remaining terms of the existing debt. The fair
values of short-term borrowings supported by credit facilities approxi-
mated their carrying values. The estimated fair values of interest rate
exchange agreements, foreign currency forward exchange contracts and
foreign currency exchange agreements were determined by independent
investment bankers and represent the estimated amounts that Textron
Financial would be required to pay to (or collect from) a third party to
assume Textron Financial’s obligations under the agreements.
The carrying values and estimated fair values of Textron
Financial’s financial instruments for which it is practicable to calculate
a fair value are as follows: (See chart below)
Notes to Consolidated Financial Statements
2002 2002 2001 2001Carrying Estimated Carrying Estimated
(In thousands) Value Fair Value Value Fair ValueAssets:Installment contracts $ 1,849,071 $ 1,837,206 $ 2,055,407 $ 2,025,030Interest rate exchange agreements on
installment contracts (21,274) (21,274) (8,319) (8,319)Revolving loans 1,366,064 1,350,646 1,578,922 1,576,250Golf course and resort mortgages 962,459 968,580 811,951 811,834Distribution finance receivables 792,323 786,835 474,391 470,531Retained interests in securitizations 349,945 349,945 257,538 257,538Short-term investments — — 63,819 63,819Investments in equity partnerships 9,810 9,810 10,937 10,937Allowance for losses on receivables (161,067) — (125,261) —
$ 5,147,331 $ 5,281,748 $ 5,119,385 $ 5,207,620Liabilities:Total short-term debt $ 916,352 $ 916,352 $ 1,197,707 $ 1,197,707Variable rate long-term notes 1,337,206 1,309,401 1,992,113 1,958,005Variable rate long-term notes related derivatives (67,039) (67,039) (3,763) (3,763)Fixed rate long-term debt 2,586,063 2,709,483 1,512,363 1,566,268Amounts due to Textron Inc. 23,471 21,157 20,928 17,679Retained interests in securitizations 23,108 23,108 22,739 22,739Foreign currency forward exchange contracts (24) (24) 258 258
$ 4,819,137 $ 4,912,438 $ 4,742,345 $ 4,758,893
82383fin.qx4 3/25/03 1:01 PM Page 38

Annual Report 2002
39
NOTE 17
COMMITMENTS
Textron Financial generally enters into various revolving lines of
credit, letters of credit and loan commitments in response to the
financing needs of its customers. The revolving lines of credit include
both committed and uncommitted facilities. Included in the com-
mitted facilities are $501 million of commitments where funding is
dependent on compliance with customary financial covenants.
Advances under the remaining $969 million of committed facilities
are dependent on both compliance with customary financial
covenants and the availability of eligible collateral. Advances under
the uncommitted facilities of $998 million are generally at Textron
Financial’s discretion and the Company has the right to reduce or
cancel these lines at any time. Letters of credit are conditional com-
mitments issued by the Company to guarantee the performance of a
borrower or an affiliate to a third party. Loan commitments represent
agreements to fund eligible costs of assets generally within one year.
Generally, interest rates on all of these commitments are not set until
amounts are funded. Therefore, Textron Financial is not exposed to
interest rate changes.
These financial instruments generate fees and involve, to varying
degrees, elements of credit risk in excess of amounts recognized in the
Consolidated Balance Sheets. Since many of the agreements are
expected to expire unused, the total commitment amount does not
necessarily represent future cash requirements. The credit risk
involved in issuing these instruments is essentially the same as that
involved in extending loans to borrowers and the credit quality and
collateral policies for controlling this risk are similar to those involved
in the Company’s normal lending transactions.
The contractual amounts of the Company’s outstanding com-
mitments to extend credit at December 28, 2002, are shown below:
Textron Financial’s offices are occupied under noncancelable operating
leases expiring on various dates through 2009. Rental expense was $7.6
million in 2002 ($6.4 million in 2001 and $5.4 million in 2000). Future
minimum rental commitments for all noncancelable operating leases in
effect at December 28, 2002, approximated $6.2 million for 2003, $4.5
million for 2004, $3.1 million for 2005, $2.0 million for 2006 and $1.4
million for 2007. Of these amounts, $1.7 million in 2003 and $0.5 mil-
lion in 2004 are payable to Textron and its subsidiaries.
NOTE 18
CONTINGENCIES
There are pending or threatened lawsuits and other proceedings
against Textron Financial and its subsidiaries. Some of these suits and
proceedings seek compensatory, treble or punitive damages in sub-
stantial amounts. These suits and proceedings are being defended by,
or contested on behalf of, Textron Financial and its subsidiaries. On
the basis of information presently available, Textron Financial believes
any such liability would not have a material effect on Textron
Financial’s financial position or results of operations.
NOTE 19
FINANCIAL INFORMATION ABOUT INDUSTRY SEGMENTS
During the third quarter of 2002, the Company made a strategic deci-
sion to realign its business units into six operating segments based on
the markets serviced and the products offered: Aircraft Finance, Asset-
Based Lending, Distribution Finance, Golf Finance, Resort Finance
and Structured Capital. In addition, the Company maintains an
Other segment that includes franchise finance (loans primarily to
operators of restaurants and convenience store/gas outlets), media
finance (working capital, acquisition and debt refinancing of broad-
cast, publishing and other media operators) and small business
finance (unsecured lines of credit and term financing). This segment
also includes liquidating portfolios related to a strategic realignment
of the Company’s businesses and product lines in 2001.
As a result of these segment changes, the financial information
for the years 2001 and 2000 have been recast reflecting the realign-
ment of the segments. (See chart on next page)
(In millions)
Commitments to extend credit:
Committed revolving lines of credit $ 1,470
Uncommitted revolving lines of credit 998
Loans 64
Other letters of credit 45
Standby letters of credit 12
Notes to Consolidated Financial Statements
82383fin.qx4 3/25/03 1:01 PM Page 39

Textron Financial Corporation
40
NOTE 20
QUARTERLY FINANCIAL DATA (UNAUDITED)
First Quarter Second Quarter Third Quarter Fourth Quarter
(In thousands) 2002 2001 2002 2001 2002 2001 2002 2001
Revenues $ 144,076 $ 170,702 $ 149,022 $ 163,986 $ 156,343 $ 177,886 $ 180,795 $ 196,662
Expenses 121,194 124,667 119,837 124,372 136,577 130,619 133,475 137,133
Cumulative effect of change in accounting principle, net of tax benefit 15,372 — — — — — — —
Net income (1,196) 28,426 18,536 24,434 12,278 29,911 30,688 37,800
(In thousands) 2002 2001 2000 Revenues
Distribution Finance $ 103,470 16% $ 89,807 13% $ 84,862 12%Resort Finance 95,760 15% 106,072 15% 117,884 17%Aircraft Finance 93,469 15% 124,643 18% 161,172 23%Golf Finance 72,387 12% 67,751 9% 82,797 12%Asset-Based Lending 62,408 10% 75,798 11% 75,744 11%Structured Capital 38,195 6% 42,519 6% 24,015 4%Other 164,547 26% 202,646 28% 144,047 21%
Total revenues $ 630,236 100% $ 709,236 100% $ 690,521 100%Income (loss) before special charges, income taxes, distributions
on preferred securities and cumulative effect of change inaccounting principle (1)(2)
Distribution Finance $ 39,734 $ 32,849 $ 28,995Resort Finance 42,783 41,378 46,454Aircraft Finance 7,772 34,821 50,386Golf Finance 22,161 21,214 28,873Asset-Based Lending 13,811 24,019 3,633Structured Capital 19,869 29,029 15,385Other (26,977) 11,821 18,270
Total income before special charges, income taxes, distributionson preferred securities and cumulative effect of change inaccounting principle $ 119,153 $ 195,131 $ 191,996
Special Charges — (2,686) — Total income before income taxes, distributions on preferred
securities and cumulative effect of change in accounting principle $ 119,153 $ 192,445 $ 191,996 Finance assets (3)
Aircraft Finance $ 1,216,144 $ 1,248,305 $ 1,088,811Resort Finance 1,052,734 1,021,034 855,855Golf Finance 964,271 836,421 741,142Distribution Finance 841,118 495,809 860,253Structured Capital 581,207 565,047 371,022Asset-Based Lending 521,067 548,093 630,537Other 1,359,841 1,593,524 1,420,006
Total finance assets $ 6,536,382 $ 6,308,233 $ 5,967,626
(1) Interest expense is allocated to each segment in proportion to its net investment in finance assets. Net investment in finance assets includes deferred income taxes, security depositsand other specifically identified liabilities. The interest allocated matches, to the extent possible, variable rate debt with variable rate finance assets and fixed rate debt with fixed ratefinance assets. (2) Indirect expenses are allocated to each segment based on the use of such resources. Most allocations are based on the segment’s proportion of net investment in financeassets, headcount, number of transactions, computer resources and senior management time. (3) Finance assets include: finance receivables; equipment on operating leases, net of accumulated depreciation; repossessed assets and properties; retained interests in securitizations; interest-only securities; investment in equipment residuals; ADC arrangements; and shortand long-term investments (some of which are classified in Other assets on Textron Financial’s Consolidated Balance Sheets).
Notes to Consolidated Financial Statements
82383fin.qx4 3/25/03 1:01 PM Page 40
Annual Report 2002
41
BOARD OF DIRECTORS
Ted R. FrenchExecutive Vice President and Chief Financial Officer,Textron Inc.
Mary F. LovejoyVice President and Treasurer, Textron Inc.
Stephen A. GiliottiChairman and Chief Executive Officer, Textron Financial Corporation
PRINCIPAL CORPORATE OFFICERS
Stephen A. GiliottiChairman and Chief Executive Officer
Buell J. Carter, Jr.President and Chief Operating Officer
Thomas J. CullenExecutive Vice President and Chief Financial Officer
O. Lewis HumphreyExecutive Vice President and Chief Credit Officer
Steven B. JaffeeExecutive Vice President, Mergers and Acquisitions
Elizabeth C. PerkinsExecutive Vice President, General Counsel
Robert M. PowersExecutive Vice President, Human Resources
John W. Mayers, Jr.Executive Vice President, Operations/Textron Six Sigma
David A. RaspalloExecutive Vice President and Chief Information Officer
Jerry W. BrittonGroup President, Distribution Finance Group
John F. CareyGroup President, Services Group and Chief Marketing Officer
Peter N. JamesGroup President, Captive Finance Group
Richard H. MitterlingGroup President, Specialty Finance Group
J. David RetallickGroup President, Asset-Based Lending Group
David WisenPresident and Managing Director, Capital Markets Group
OTHER CORPORATE OFFICERS
William J. Clegg IIISenior Vice President and Assistant General Counsel
Frank R. FiccaManaging Director, Capital Markets Group
Brian F. LynnSenior Vice President and Treasurer
Eric SalanderSenior Vice President, Finance
Kathleen A. SmithSenior Vice President, Tax
David E. WilderSenior Vice President, Information Systems
Norma J. ConleyVice President, Human Resources
David M. DowlingVice President and Corporate Controller
Barry L. ElfstromVice President, Financial Analysis
Paul F. GreenVice President and Senior Corporate Counsel
Albert J. HarnoisVice President, Business Process Assurance and Control
Margaret R. Hayes-CoteVice President and Senior Corporate Counsel
Thomas H. KaiserVice President and Assistant General Counsel
Cheryl M. KileyVice President, Human Resources
Frank J. LallyVice President, Financial Systems Integration
Larry K. LassisterVice President, Learning and Development
Linda S. MericanVice President and Senior Corporate Counsel
Claudia A. MojkowskiVice President, Human Resources
William E. PittsVice President, Strategic Planning
Sharon E. SelkVice President and Senior Corporate Counsel
Adele J. SuddesVice President, Marketing
Directors and Corporate Officers
82383fin.qx4 3/25/03 1:01 PM Page 41

Textron Financial Corporation Annual Report 2002
42
Business Directory
WORLD HEADQUARTERS
Textron Financial Corporation40 Westminster StreetProvidence, RI 02903401-621-4200www.textronfinancial.com
CORE OPERATIONS
Aircraft FinanceLeon F. Metzinger, President
220 West Douglas, Suite 300Wichita, KS 67202866-232-5626
Asset-Based Lending J. David Retallick, Group President
Mark D. Quinlan, Group Senior Vice President
Business CreditChristopher A. Gouskos, Division President
Finance Company ServicesRichard C. Rudek, Division President
Growth CapitalRichard C. Rudek, Division President
Transportation and Staffing Receivables FinancingReed Howard, Senior Vice President
4949 SW Meadows Road, Suite 500Lake Oswego, OR 97035503-675-5700
Distribution FinanceJerry W. Britton, Group President
Diversified ProductsClifton B. Bolstad, Senior Vice President
Large TicketThomas J. Low, Division President
Private BrandsDaniel G. Radley, Senior Vice President
Technology FinanceJohn C. Reed, Division President
11575 Great Oaks Way, Suite 210Alpharetta, GA 30022770-360-9600
Golf FinanceGolf and Turf FinancePeter N. James, Group President
Golf Course FinanceRichard H. Mitterling, Group President
Ramon J. Munoz, Division President
11575 Great Oaks Way, Suite 210Alpharetta, GA 30022770-360-9600
Resort Finance Richard H. Mitterling, Group President
Land Finance CompanyJames A. Yearwood, President
Timeshare FinanceNicholas L. Mecca, Division President
333 East River Drive, Suite 104East Hartford, CT 06108860-282-7776
Structured CapitalR. Rodney Weaver, Division President
40 Westminster StreetProvidence, RI 02903401-621-4200
ServicesCapital MarketsDavid Wisen, President
Frank R. Ficca, Managing Director
40 Westminster StreetProvidence, RI 02903401-621-4200
General ServicesJohn F. Carey, Group President
Asset Control, LLCTBS Insurance Agency Services, Inc.Textron Business Services, Inc.John F. Craven, President
Textron Financial Canada LimitedChristopher J. Sadler, President
40 Westminster Street Providence, RI 02903401-621-4200
OTHER OPERATIONS
Steven B. Jaffee, Executive Vice President
Franchise FinanceMedia FinanceSmall Business DirectDouglas K. Bland, Division President
130 East Chestnut Street, Suite 400Columbus, OH 43215614-229-7979
82383fin.qx4 3/25/03 1:01 PM Page 42

Investor InquiriesTextron Financial Corporation
Treasury Department
40 Westminster Street
P.O. Box 6687
Providence, Rhode Island
02940-6687
(401) 621-4200
Company Publications andGeneral InformationTo receive a copy, without
charge, of Textron Financial
Corporation’s SEC filings or
Annual Report, please call
(401) 621-4200 or direct written
correspondence to the Treasury
Department at the address
specified above. For more
information regarding Textron
Financial and its businesses,
or an electronic copy of this
Annual Report, visit our
worldwide website at
www.textronfinancial.com.
Table of Contents1 Financial Highlights
2 About the Company
3 From the Chairman
10 Selected Financial Data
11 Management’s Discussion and Analysis of FinancialCondition and Results of Operations
19 Report of Independent Auditors
20 Consolidated Statements of Income
21 Consolidated Balance Sheets
22 Consolidated Statements of Cash Flows
23 Consolidated Statements of Changes in Shareholder’s Equity
24 Notes to ConsolidatedFinancial Statements
41 Directors and Corporate Officers
42 Business Directory
43 Contact Information
Textron Financial Corporation
82383cover.qx4 3/25/03 11:27 AM Page 2

2 0 0 2 A N N U A L R E P O R T
82383cover.qx4 3/25/03 11:27 AM Page 1


![RIWKHIXOOH PDJD]LQH 9LVLWWKHZHEVLWHWRUHTXHVW … Jul18_C6... · Beechcraft, Cessna, Kautex, Jacobsen, Textron Airborne Solutions, Textron Aviation Defense, Textron Financial, Textron](https://static.fdocuments.net/doc/165x107/5ead87980101867d772b7b4c/riwkhixooh-pdjdlqh-9lvlwwkhzhevlwhwruhtxhvw-jul18c6-beechcraft-cessna-kautex.jpg)