Texas and Lubbock: Demographic Characteristics and Trends
37
Texas and Lubbock: Demographic Characteristics and Trends Lubbock Chamber of Commerce December 13, 2011 Lubbock, TX
Transcript of Texas and Lubbock: Demographic Characteristics and Trends

Texas and Lubbock: Demographic Characteristics
and Trends
Lubbock Chamber of Commerce
December 13, 2011Lubbock, TX

2000Population*
2010Population*
NumericalChange
2000-2010
PercentChange
2000-2010United States 281,421,906 308,745,538 27,323,632 9.7%Texas 20,851,820 25,145,561 4,293,741 20.6%California 33,871,648 37,253,956 3,382,308 10.0%Florida 15,982,378 18,801,310 2,818,932 17.6%Georgia 8,186,453 9,687,653 1,501,200 18.3%
North Carolina 8,049,313 9,535,483 1,486,170 18.5%
Arizona 5,130,632 6,392,017 1,261,385 24.6%
15.7% of numerical change in U.S.
Note: Population values are decennial census counts for April 1, 2000 and April 1, 2010.Source: U.S. Census Bureau. 2000 and 2010 Census Counts.
Growing States, 2000‐2010

Percent ChangeDue to
Year* PopulationNumerical
ChangeNatural
IncreaseNet
MigrationPercentChange
NaturalIncrease
NetMigration
1950 7,711,194 -- -- -- -- -- --1960 9,579,677 1,868,483 1,754,652 113,831 24.2 93.91 6.091970 11,196,730 1,617,053 1,402,683 214,370 16.9 86.74 13.261980 14,229,191 3,032,461 1,260,794 1,771,667 27.1 41.58 58.421990 16,986,510 2,757,319 1,815,670 941,649 19.9 65.85 34.152000 20,851,820 3,865,310 1,919,281 1,946,029 22.8 49.65 50.352009 24,782,302 3,930,484 2,124,124 1,781,785 18.8 54.04 45.33
*All values for the decennial dates are for the indicated census year. Values for 2009 are for July 1 as estimated by the U.S. Census Bureau.
Note: Residual values are not presented in this table.Source: Derived from U.S. Census Bureau Estimates for dates indicated by the Texas State Data Center.
Total Population and Components of Population Change in Texas, 1950‐2009

U.S. Gross Domestic Product, 1970‐2010
4

Population Change in Lubbock MSA, 1980‐2010
County 1980 1990 2000 2010
Crosby 8,859 7,304 7,072 6,059
Lubbock 211,651 222,636 242,628 278,831
Total 220,510 229,940 249,700 284,890
Source: U.S. Census Bureau. 1980 ‐ 2010 Census Counts.
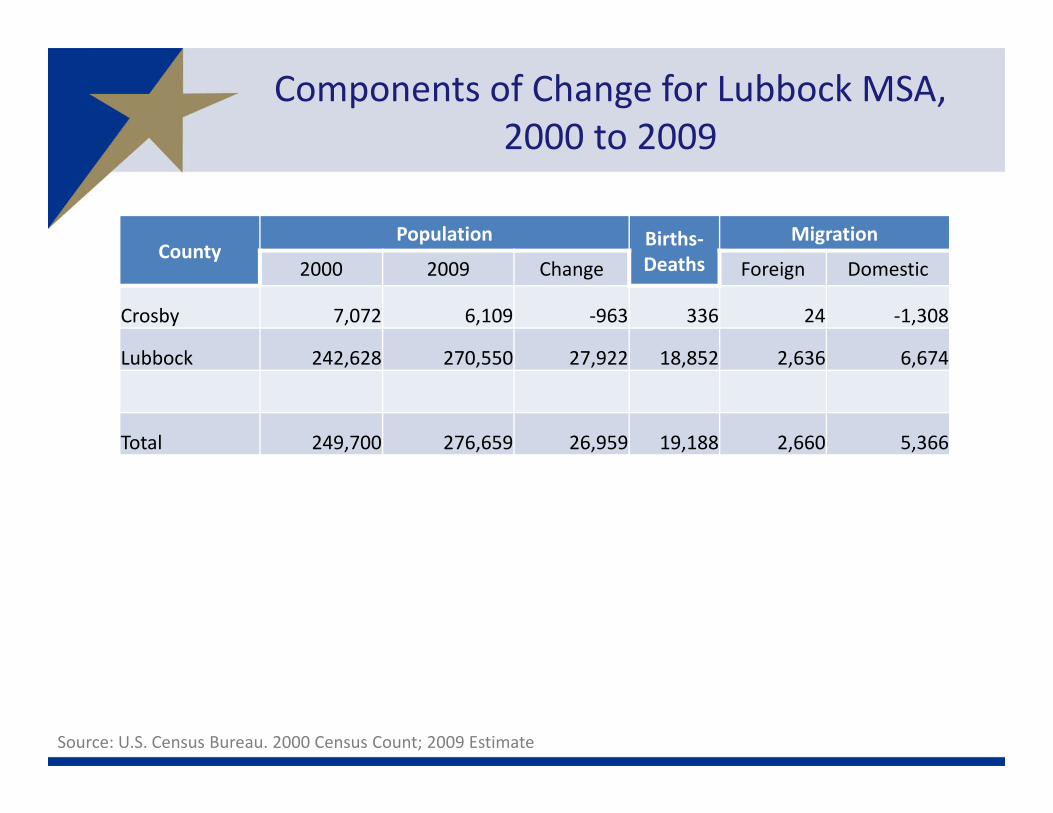
Components of Change for Lubbock MSA,2000 to 2009
CountyPopulation Births‐
DeathsMigration
2000 2009 Change Foreign Domestic
Crosby 7,072 6,109 ‐963 336 24 ‐1,308
Lubbock 242,628 270,550 27,922 18,852 2,636 6,674
Total 249,700 276,659 26,959 19,188 2,660 5,366
Source: U.S. Census Bureau. 2000 Census Count; 2009 Estimate
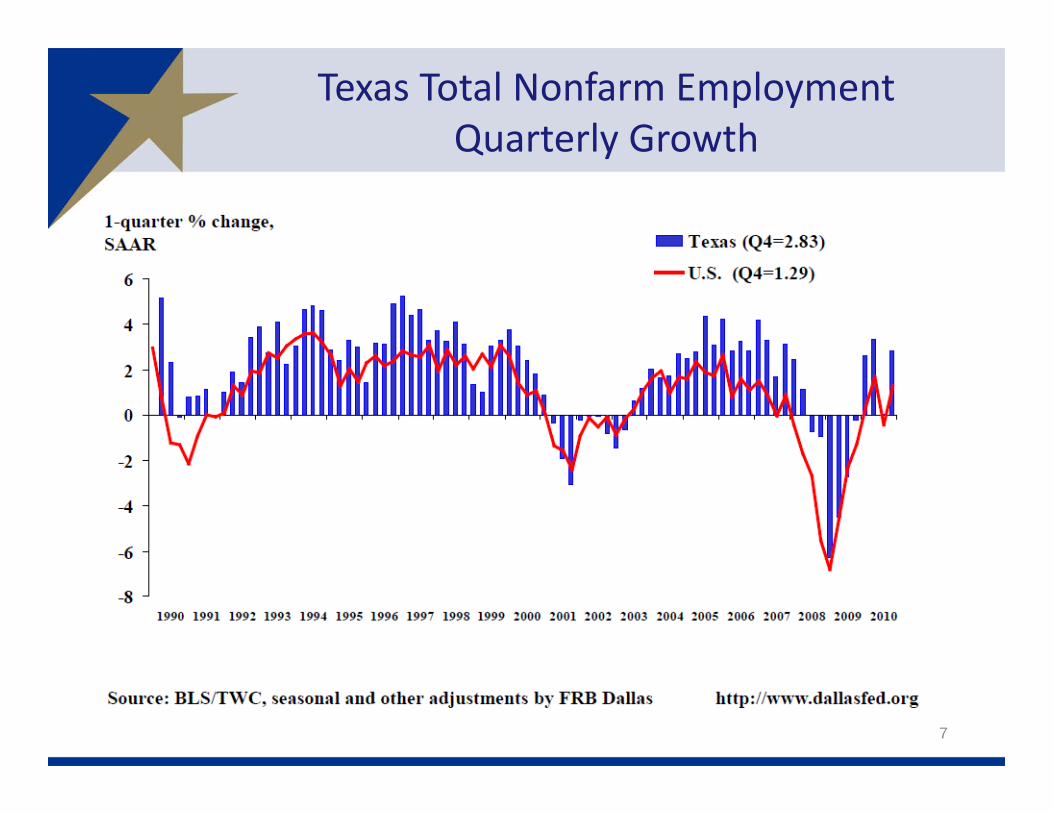
Texas Total Nonfarm EmploymentQuarterly Growth
7

Texas and U.S. Unemployment Rate
8

Texas Residential Permits and Mortgage Rate, 1990‐2010
9

0
50,000
100,000
150,000
200,000
250,000
2000 to2001
2001 to2002
2002 to2003
2003 to2004
2004 to2005
2005 to2006
2006 to2007
2007 to2008
2008 to2009
InternationalState-to-State
Source: U.S. Census Bureau. 2009 Population Estimates.
Estimated Annual Net Migration to Texas, 2000‐2009

Percent of Migrants to Texas by Race and Ethnicity, 2000‐2009
44%24%
33%
28%50% 40%
23%8% 15%
5%18% 12%
0%10%20%30%40%50%60%70%80%90%100%
Net domesticmigration
Internationalmigration
Total
OtherBlackHispanicWhite
67% of all migrants
(848,702 migrants ) (933,083 migrants)
52% of all migrants were international
Sources: Percentages of domestic and international migrants by race and ethnicity derived from the 2006‐2008 American Community Survey. Total numbers of domestic and international migrants between 2000‐2009 are from Table 4. Cumulative Estimates of the Components of Resident Population Change for the United States, Regions, States, and Puerto Rico: April 1, 2000 to July 1, 2009, U.S. Census Bureau.

States with Largest Estimated Unauthorized Immigrant Populations, 2010
12
State Estimate (thousands) Range
California 2,550 (2,350 - 2,750) Texas 1,650 (1,450 - 1,850) Florida 825 (725 - 950)
New York 625 (525 - 725) New Jersey 550 (425 - 650)
Illinois 525 (425 - 625) Georgia 425 (300 - 550) Arizona 400 (275 - 500)
Source: Pew Hispanic Center estimates based on residual methodology applied to March Supplements to the Current Population Survey (February 1, 2011).

Estimated Domestic Migration (2000‐2008) as a Percentage of 2000 Population by County
Source: Population Division, U.S. Census Bureau, March 19, 2009. Map produced by the Texas State Data Center.
-20 to -45%
-19 to -10%
-9 to -5%
-4 to 0%
1 to 5 %
6 to 20%
21 to 30%
31 to 65%
13

Legend0-1%
1-2.5%
2.5-3.5%
3.5-5%
5-10%
Estimated International Migration (2000‐2008) as a Percentage of 2000 Population by County
Source: Population Division, U.S. Census Bureau, March 19, 2009. Map produced by the Texas State Data Center. 14

Texas Racial and Ethnic Composition, 2000 and 2010
NH White53%
NH Black11%
NH Other4%
Hispanic or Latino32%
2000
NH White45%
NH Black11%
NH Other6%
Hispanic or Latino38%
2010
Source: U.S. Census Bureau. 2000 and 2010 Census Counts.
200,000 150,000 100,000 50,000 0 50,000 100,000 150,000 200,000Under 1 year
5 years
10 years
15 years
20 years
25 years
30 years
35 years
40 years
45 years
50 years
55 years
60 years
65 years
70 years
75 years
80 years
85 years
90 years
95 years
100 to 104 years
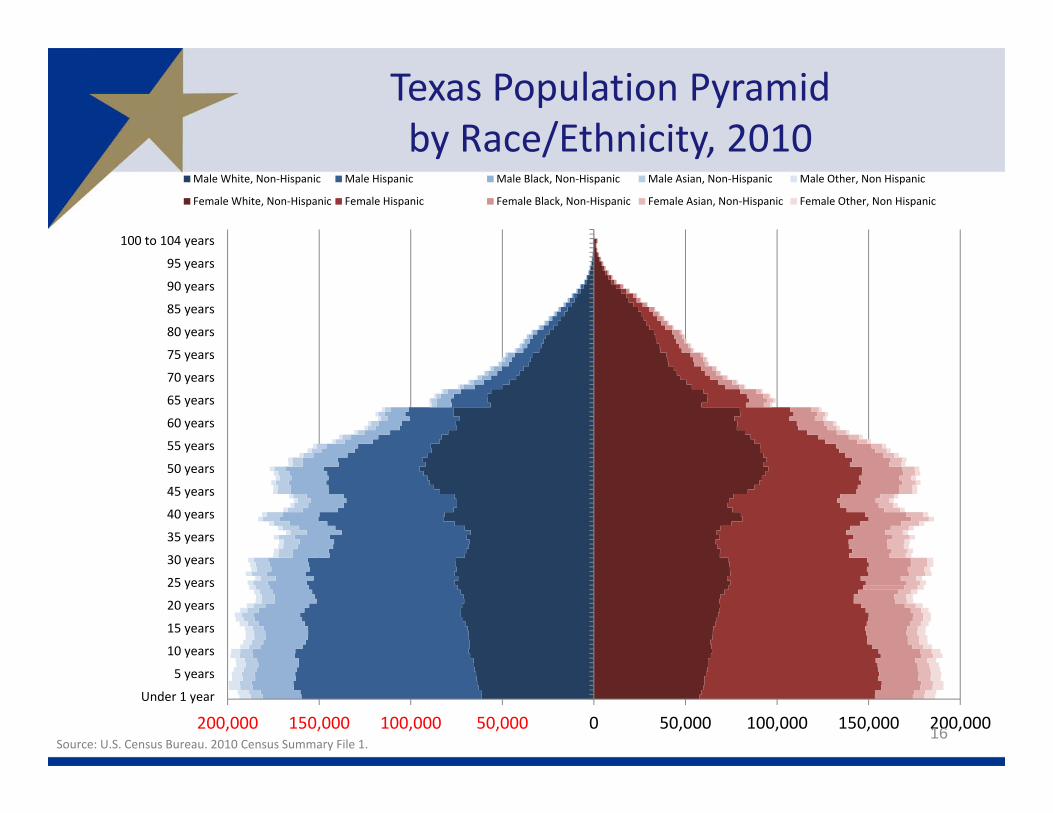
Male White, Non‐Hispanic Male Hispanic Male Black, Non‐Hispanic Male Asian, Non‐Hispanic Male Other, Non Hispanic
Female White, Non‐Hispanic Female Hispanic Female Black, Non‐Hispanic Female Asian, Non‐Hispanic Female Other, Non Hispanic
16
Texas Population Pyramid by Race/Ethnicity, 2010
Source: U.S. Census Bureau. 2010 Census Summary File 1.

200,000 150,000 100,000 50,000 0 50,000 100,000 150,000 200,000Under 1 year
5 years
10 years
15 years
20 years
25 years
30 years
35 years
40 years
45 years
50 years
55 years
60 years
65 years
70 years
75 years
80 years
85 years
90 years
95 years
100 to 104 years
Male White, Non‐Hispanic Female White, Non‐Hispanic
17
Texas Population Pyramid by Race/Ethnicity, 2010
Source: U.S. Census Bureau. 2010 Census Summary File 1.

200,000 150,000 100,000 50,000 0 50,000 100,000 150,000 200,000Under 1 year
5 years
10 years
15 years
20 years
25 years
30 years
35 years
40 years
45 years
50 years
55 years
60 years
65 years
70 years
75 years
80 years
85 years
90 years
95 years
100 to 104 years
Male Hispanic Male Black, Non‐Hispanic Male Asian, Non‐Hispanic Male Other, Non Hispanic
Female Hispanic Female Black, Non‐Hispanic Female Asian, Non‐Hispanic Female Other, Non Hispanic
18
Texas Population Pyramid by Race/Ethnicity, 2010
Source: U.S. Census Bureau. 2010 Census Summary File 1.

5000 4000 3000 2000 1000 0 1000 2000 3000 4000 5000 1 year
6 years
11 years
16 years
21 years
26 years
31 years
36 years
41 years
46 years
51 years
56 years
61 years
66 years
71 years
76 years
81 years
86 years
91 years
96 years
105 to 109 years
Male Female
19
Population Pyramid , Lubbock County, 2010
Source: U.S. Census Bureau. 2010 Census Summary File 1.
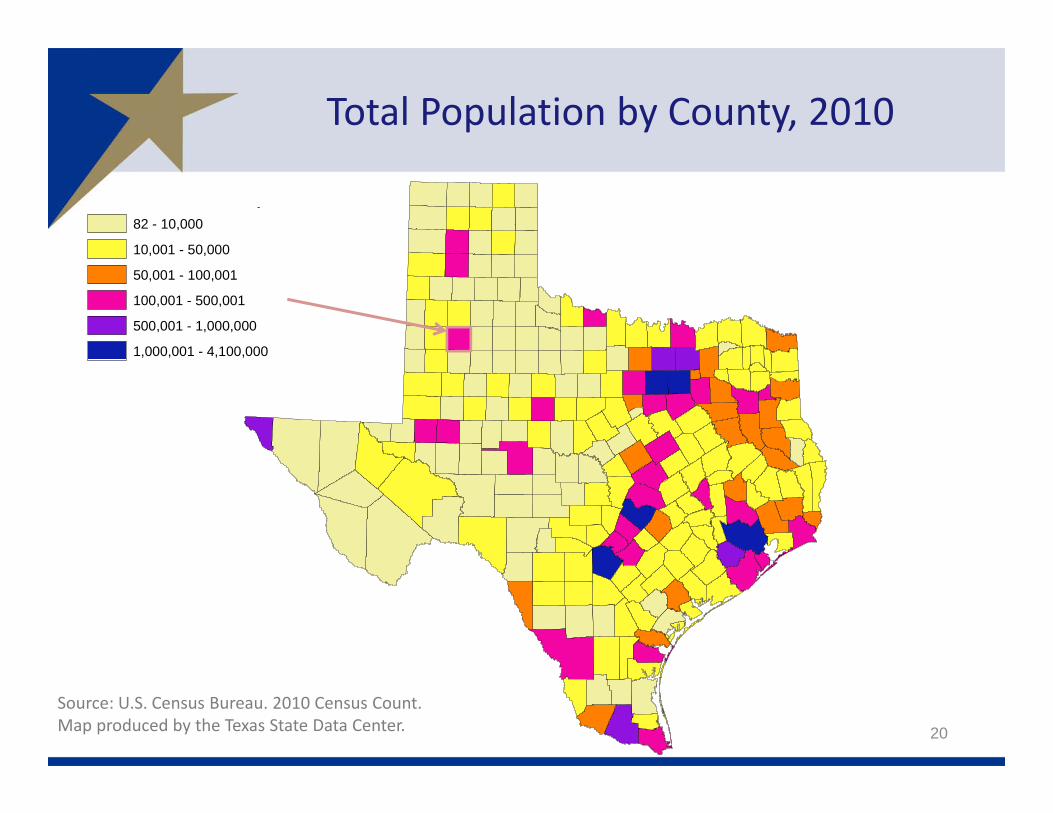
Total Population by County, 2010
20
Source: U.S. Census Bureau. 2010 Census Count.Map produced by the Texas State Data Center.
p82 - 10,000
10,001 - 50,000
50,001 - 100,001
100,001 - 500,001
500,001 - 1,000,000
1,000,001 - 4,100,000

Numeric Change of Total Population by County, 2000‐2010
21
Source: U.S. Census Bureau. 2000 and 2010 Census Counts.Map produced by the Texas State Data Center.
-3,200 - 0
1 - 10,000
10,001 - 50,000
50,001 - 100,000
100,001 - 700,000

Percent Change of Total Population by County, 2000‐2010
22
Population increase for Texas was 20.6%during this period.
Source: U.S. Census Bureau. 2000 and 2010 Census Counts.Map produced by the Texas State Data Center.
-20%-0%
1%-10%
10.1-25%
25.1%-50%
50.1%-82%

Numeric Change in Hispanic Populationby County, 2000‐2010
23
-1,200 - 0
1 - 1,000
1,001 - 5,000
5,001 - 15,000
15,001 - 25,000
25,001 - 56,000
Source: U.S. Census Bureau. 2000 and 2010 Census Counts.Map produced by the Texas State Data Center.

Percent of Population That Is Foreign Born by County, 2005‐2009
0-5%
5-10%
10-15%
15-25%
25-35%
Source: U.S. Census Bureau. American Community Survey, 5‐Year Sample 2005‐2009.
Map produced by the Texas State Data Center.

Housing Characteristics, Texas and Selected Counties, 2010
25
Percent Vacant Housing Units
Owner‐occupied Housing Units
Average Household Size of Owner‐Occupied Units
Texas 9.4 63.8 2.87
Brazos 6.5 45.6 2.8
Lubbock 8 59.2 2.67
Midland 11.1 69.6 2.84
Nueces 10.3 61.3 2.91
Randall 4.7 70.3 2.65
Smith 8.4 69.7 2.67
Taylor 9.2 61.6 2.62
Wichita 9.1 62.3 2.56
Source: U.S. Census Bureau. 2010 Census Summary File 1.

Percent of the Civilian Labor Force Employed
26
Webb
Harris
Bell
Ellis
Bexar
Hidalgo
Brazoria
Ector
Travis
Smith
Potter
Collin
Taylor
Dallas Parker
Denton
El Paso
Tarrant
Hays
Randall
Grayson
Midland
Lubbock
Jefferson
Williamson
McLennan
Nueces
Cameron
Fort Bend
Wichita
Johnson
Montgomery Brazos
Guadalupe
Gregg
Galveston Galveston
49-55%
55.1-60%
60.1-62.5%
62.6-65%
65.1-70.5%
Source: U.S. Census Bureau. American Community Survey, 3‐Year Sample 2008‐2010.
Map produced by the Texas State Data Center.

Percent of People with Health Insurance Over the Last 12 Months
27
Webb
Harris
Bell
Ellis
Bexar
Hidalgo
Brazoria
Ector
Travis
Smith
Potter
Collin
Taylor
Dallas Parker
Denton
El Paso
Tarrant
Hays
Randall
Grayson
Midland
Lubbock
Jefferson
Williamson
McLennan
Nueces
Cameron
Fort Bend
Wichita
Johnson
Montgomery Brazos
Guadalupe
Gregg
Galveston Galveston
63-65%
65.1-70%
70.1-75%
75.1-80%
80.1-85.6%
Source: U.S. Census Bureau. American Community Survey, 3‐Year Sample 2008‐2010.
Map produced by the Texas State Data Center.

$18,000-30,000
$ 30,000-35,000
$ 35,000-40,000
$40,000-50,000
$ 50,000-76,000
Median Household Income by County, 2005‐2009
Source: U.S. Census Bureau. American Community Survey, 5‐Year Sample 2005‐2009.
Map produced by the Texas State Data Center.

Percent of Families Whose Income was Below Poverty in the Last 12 months
29
Webb
Harris
Bell
Ellis
Bexar
Hidalgo
Brazoria
Ector
Travis
Smith
Potter
Collin
Taylor
Dallas Parker
Denton
El Paso
Tarrant
Hays
Randall
Grayson
Midland
Lubbock
Jefferson
Williamson
McLennan
Nueces
Cameron
Fort Bend
Wichita
Johnson
Montgomery Brazos
Guadalupe
Gregg
Galveston Galveston
4.6-5%
5.1-10%
10.1-15%
15.1.20%
20.1-30.5%
Source: U.S. Census Bureau. American Community Survey, 3‐Year Sample 2008‐2010.
Map produced by the Texas State Data Center.

Race/Ethnic Composition by Education Level in the Labor Force (aged 25 years and more), Texas, 2009
19%
6%
71%
3%
30
67%
8%
15%
9%
Source: Derived from 2009 American Community Survey 1‐Year Estimates by the Office of the State Demographer.Less Than High School
College and Greater

Projected Percent of Labor Force by Educational Attainment in Texas, 2000 and 2040
Source: Texas State Data Center. 2008 Population Projections, 1.0 Migration Scenario.
18.8
29.0 28.7
18.2
5.3
30.128.7
23.9
12.9
4.4
0.0
5.0
10.0
15.0
20.0
25.0
30.0
35.0
No High School Diploma High School Graduate Some College Bachelor's Degree Graduate/ProfessionalDegree
Percen
t
2000 2040

0%
10%
20%
30%
40%
50%
60%
70%
2000
2002
2004
2006
2008
2010
2012
2014
2016
2018
2020
2022
2024
2026
2028
2030
2032
2034
2036
2038
2040
AngloBlackHispanicOther
Source: Texas State Data Center. 2008 Population Projections, 2000‐2007 Migration Scenario. 32
Projected Racial and Ethnic Population Percentages for Texas, 2000‐2040
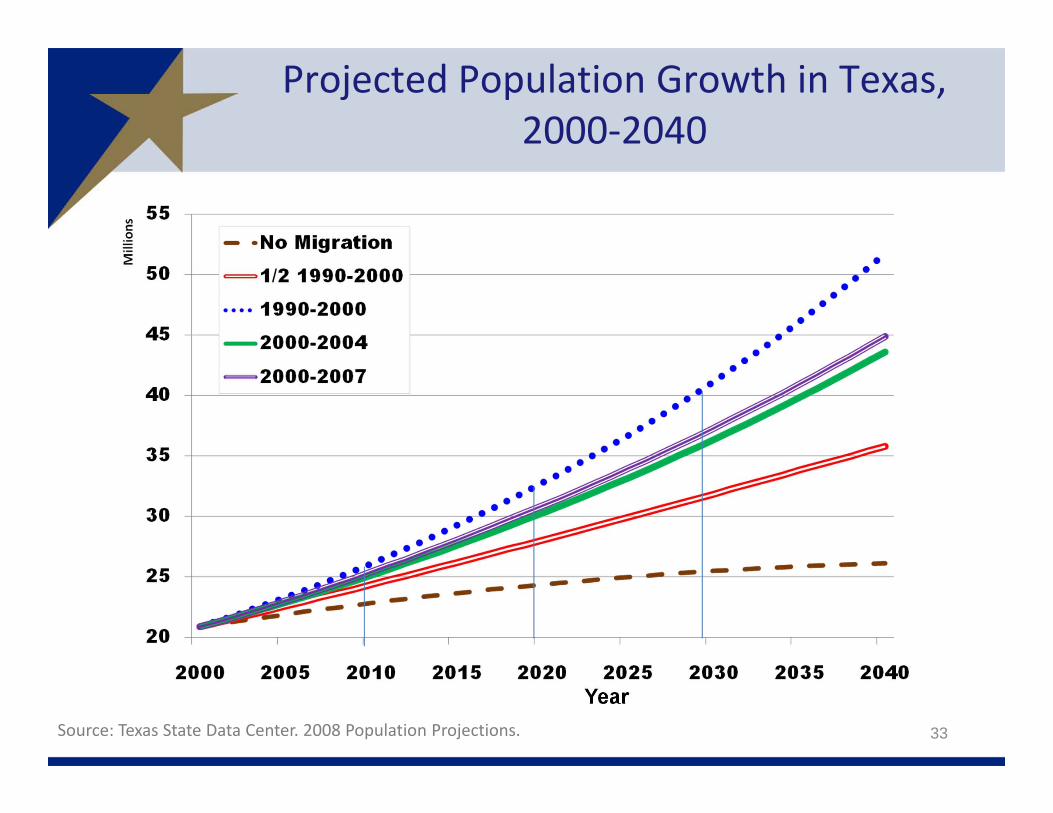
Source: Texas State Data Center. 2008 Population Projections.
Year
Projected Population Growth in Texas, 2000‐2040
33

36 - 1000
1001 - 10000
10001 - 50000
50001 - 100000
100001 - 500000
500001 - 1000000
1000001 - 8000000
Projected Population by Texas Counties, 2040
Source: Texas State Data Center. Vintage 2008 Population Projections,2000‐2007 Migration Scenario.
Map produced by the Texas State Data Center.

Percent Projected Change of Total Population in Texas Counties, 2008‐2040
35

36
Demographics & Destiny

Contact
Lloyd Potter, Ph.D.Office: (512) 463‐8390 or (210) 458‐6530Email: [email protected]: http://osd.state.tx.us