TESTING THE MATCHING CAPABILITIES OF MEGVII’S FACE++ ...
44
TESTING THE MATCHING CAPABILITIES OF MEGVII’S FACE++ FACIAL RECOGNITION USING AGE-PROGRESSED AND REAL-LIFE IMAGES by Emily Brown A Research Project Submitted to the Forensic Science Forensic Research Committee George Mason University in Partial Fulfillment of The Requirements for the Degree of Master of Science Forensic Science Primary Research Advisor Joe Mullins Adjunct Professor George Mason University Secondary Research Advisor N/A GMU Graduate Research Coordinator Dr. Joseph A. DiZinno Assistant Professor GMU Forensic Science Program Spring Semester 2020 George Mason University Fairfax, VA
Transcript of TESTING THE MATCHING CAPABILITIES OF MEGVII’S FACE++ ...

TESTING THE MATCHING CAPABILITIES OF MEGVII’S FACE++ FACIAL RECOGNITION USING AGE-PROGRESSED AND REAL-LIFE IMAGES
by
Emily Brown
A Research Project Submitted to the
Forensic Science Forensic Research Committee George Mason University in Partial Fulfillment of
The Requirements for the Degree of
Master of Science Forensic Science
Primary Research Advisor
Joe Mullins Adjunct Professor
George Mason University
Secondary Research Advisor N/A
GMU Graduate Research Coordinator
Dr. Joseph A. DiZinno Assistant Professor
GMU Forensic Science Program
Spring Semester 2020 George Mason University Fairfax, VA

1
Table of Contents
List of Tables ………………………………………………………………………………..... 2
List of Figures ………………………………………………………….……………...……... 3
Definitions ……………………………………………………………………….….……...… 4
Abstract ………………………………………………………………………………………. 5
Introduction ………………………………………………………………………….……….. 6
Objectives ………………………………………………………………………….………..... 7
Importance of Research …………...……………………………………………….………..... 7
Background Information …………...……………………………………………….…..…….. 8
Previous Research ………..………...……………………………………………….…..….... 13
Experimental Design ………..………...………………………………………….……..….... 15
Methods & Materials ………..………...………………………………………………..….... 16
Data Analysis & Interpretation …...…...………………………………………………..….... 25
Results & Discussion …...…...……………………………………………………...…..….... 38
Conclusion …...…...………………………………………………………...…………..….... 39
References …...…...………………………………………………………...…………..…..... 41

2
List of Tables
Table Page
Table 1: T-test for mean confidence score by age group 25
Table 2: Matches and non-matches by age group 27
Table 3: T-test to determine mean age for matches and non-matches 28
Table 4: Regression analysis for age when missing 29
Table 5: Regression analysis for age when missing and gender (female) 29
Table 6: Regression analysis for age when missing, gender (female), and 30 White, Black, and Hispanic ethnicities Table 7: Regression analysis for age when missing, gender (female), and 31 White, Hispanic, and Other ethnicities Table 8: Regression analysis for age when missing, gender (female), and 31 Black, Hispanic, and Other ethnicities Table 9: Images matched by age progression 32 Table 10: Regression analysis of gap age 35 Table 11: Regression analysis of gap age and gender (female) 36 Table 12: Regression analysis of gap age, gender (female), and White, 36 Black, and Other ethnicities Table 13: Regression analysis of gap age, gender (female), and White, 37 Hispanic, and Other ethnicities Table 14: Regression analysis of gap age, gender (female), and Black, 37 Hispanic, and Other ethnicities

3
List of Figures
Figure Page
Figure 1: NCMEC Forensic Artist completing an age progression 10
Figure 2: Facial Recognition Template Process 12
Figure 3: Example of images from NCMEC missing child poster 17
Figure 4: Images from NamUs database 18
Figure 5: Process flow of image collection and storage 19
Figure 6: Images in Visual Studio Code 19
Figure 7: URLs of Detect API and FaceSet AddFace API 20
Figure 8: Python code used to create FaceSet 20
Figure 9: Results of images added to FaceSet 21 Figure 10: List of FaceSet images in Excel spreadsheet 22
Figure 11: Python code used for real-life images in searches 23
Figure 12: Search process diagram 23
Figure 13: List of top 5 matches 24
Figure 14: View of final data table 24
Figure 15: Histogram of confidence scores for matches 26
Figure 16: Histogram of confidence scores for matches in older age group 26
Figure 17: Histogram of confidence scores for matches in younger age group 27
Figure 18: Breakdown of matches by age progression group 33
Figure 19: Breakdown of matches by age progression for older and younger groups 34
4
Definitions
Artificial Intelligence (AI) The simulation, development, and programming of human intelligence in machines to perform tasks related to the human mind such as speech recognition and decision-making.
Algorithm A series of steps to be followed in order to complete a task or calculation.
AP Age progression API Application Platform Interface – an interface
between parts of a computer; set of protocols or definitions describing how software applications must interact with one another.
Confidence Score The score given to indicate the similarity between two faces; the higher, the greater the chance that the face belongs to the same person; generated as a numerical value out of 100.
FaceSet Gallery of images to be searched against; all images in the FaceSet are assigned a unique face token.
Identification (1:N matching) Facial recognition use case where a biometric sample, such as an image, is searched against a database or gallery of images to generate a candidate list of potential matches. 1:N stands for one-to-many.
Python Programming language used to write code. Python coding was used to connect to and interact with Face++ APIs.
Verification (1:1 matching) Facial recognition use case where a biometric sample, such as an image, is compared to a previously stored biometric template (image) in order to verify and authenticate a person’s identity.
Visual Studio Code Software editor used to store, write, and execute code.
5
Abstract
The National Center for Missing & Exploited Children (NCMEC) assisted law
enforcement with over 29,000 missing children cases in 2019 and has completed more than
6,800 age-progressed images in its history of working on long-term missing children cases.
There is currently little research on the topic of age progressions and their impact on facial
recognition algorithms specifically when comparing real-life images and digitally produced age-
progressed images of the same individuals. The goal of this study was to determine if a facial
recognition algorithm could accurately match and generate a missing child’s age-progressed
image in a list of top 5 candidates when using the child’s real-life image as the probe image for
the search. Another goal of this research was to determine if there were any differences in the
likelihood of matching based on the age of the missing child and the age variation between the
child’s real-life image and his or her respective age-progressed images.
The age-progressed and real-life images of 347 children who went missing between the
ages of 1 to 20 were included in the study. A gallery of images (called a FaceSet) was created
and included the age-progressed images of all 347 missing children. The missing children’s real-
life images were searched against the FaceSet using Face++’s Search API and the top 5 matches
for each person were generated. Every child was categorized as being in the ‘older’ group (>=13
– 20 years old) or ‘younger’ group (<13 years old) based on the age the child was when he or she
went missing. The results of the study showed that the confidence scores of matches are higher
for older children and there is a greater likelihood of matching for older children. The results of
the study also demonstrated that the age-progressed images closest in age to the age of the
missing child have a greater chance of being matched as compared to the age-progressed images
with more age variation.

6
Introduction
The use of facial recognition has increased significantly over the past decade and only
continues to be utilized by law enforcement for identification purposes and criminal
investigations. As the technology evolves and is used for multiple purposes by law enforcement,
it is essential to conduct research by testing the matching capabilities of facial recognition
algorithms in ways that could benefit law enforcement. One potential use case for law
enforcement and area of research that needs to be further studied is age progression and how
aging can impact the matching capabilities of a facial recognition algorithm. Testing an
algorithm by comparing real-life images and digitally produced age-progressed images is a
specific method that has not been greatly researched and has generated the following questions
which will be addressed in this research:
1. Can Face++ detect an age-progressed image and accurately match it with the same
child’s real-life image?
2. Will the confidence scores of matches be higher for older children (ages >=13 – 20)?
3. Will there be a difference in Face++’s ability to match images based on the age of the
missing child (and real-life image) when he or she went missing?
4. Will there be a difference in Face++’s ability to match images based on the age
variation between real-life and age-progressed images?
Based off of these questions, three hypotheses were formed and are listed below.
1. The older the child is at the age of missing, the greater the confidence score will be
when there is a match between the child’s real-life image and age-progressed image.
2. The older the child is at the age of missing, the more likely there will be a match
between the child’s real-life and age-progressed image(s).

7
3. The closer in age the age-progressed image is to the age of the child when he or she
went missing (less age variation), the greater the likelihood there will be a match.
Objectives
Based off of the questions and hypotheses, there were four main objectives to be determined
through this research.
1. Determine if conducting searches with age-progressed images would be useful for law
enforcement to use as investigative leads and help solve long-term missing children
cases.
2. Determine if Megvii’s Face++ facial recognition algorithm can accurately match a
real-life image and an age-progressed image of the same child.
3. Determine if there is any difference in confidence scores and the likelihood of
matching for older (>=13-20 years) versus younger (<13 years) children.
4. Determine if there is a greater likelihood of matching a child’s real-life image and age-
progressed image(s) when the age-progressed image(s) are closer in age to the child at the
time he or she went missing (less age variation).
Importance of Research
There has not been a lot of research completed using age-progressed images to test the
accuracy and matching capabilities of a facial recognition algorithm. There has been research
completed which looks at the impacts of aging on algorithms for verification (1:1 matching) and
identification (1:N matching), but the majority of these studies used real-life photos of the same
people over time. There has not been any research completed to test the 1:N matching

8
capabilities of a facial recognition algorithm using digitally produced age-progressed images
completed by Forensic Artists. Testing facial recognition algorithms with age-progressed and
real-life images could greatly benefit law enforcement and investigators in long-term missing
children cases especially with the increase in the use of facial recognition by law enforcement.
Some of the specific types of long-term missing children cases that this research could help with
are family abductions, kidnappings, and runaways. Additionally, this research could assist with
the identification of previously unidentified children and could serve as investigative leads in
cases. It could also provide insights into an algorithm’s ability to detect changes in an
individual’s face over time and determine how much aging affects performance accuracy. If an
age-progressed image can be linked to a missing child using facial recognition then it could help
save lives and bring long-term missing children back to their families.
Background Information
Age Progression
The digital age progression of a person’s face is a combination of art, science,
anthropology, and technology. Synthetic age-progressed images can be created in two ways –
Forensic Artists can sketch and draw them either digitally or they can be produced by software
and algorithms. Over the past few years, there has more interest in the automation of age
progression and researchers have used multiple methods and modeling techniques to age
progress facial images using technology. Researchers at the University of Bradford conducted a
study using an active appearance model (AAM) and sparse partial least squares regression model
(sPLS) to age progress Ben Needham’s face, who is a child that went missing at age 21 months
on the Greek Island, Kos (Bukar &Ugail 2017). Another group of researchers at Michigan State

9
University used the approach of a Generative Adversarial Network (GAN) to age progress facial
images and they used this method to study the accuracy and durability of people’s faces as they
age. For law enforcement purposes, age progressions are usually created by Forensic Artists
because the artists are able to take other factors into account such as a person’s genetics, family
history, diseases, and environment. Some of the most widespread and well-known age-
progressed images are those created by the National Center for Missing & Exploited Children
(NCMEC).
Age progressions (or age-progressed images) were first created at NCMEC when the
Forensic Imaging Unit was formed in 1989 and they were completed in black and white by slow,
proprietary software. An age-progressed image is essentially a digital image of a missing person
that is used to show what the person may look like at a specific age and at the time the image is
created. Advancements in technology over the past 30 years have been instrumental in improving
the quality of the images and the speed at which they are completed. NCMEC Forensic Artists
have used Adobe Photoshop to complete all age progressions for years now and the images are in
color, are extremely detailed and realistic, and can be completed in about one day.
Age progressions at NCMEC are only completed for long-term missing children cases
and will only be created once a child has been missing for at least two years. The main reason for
the two-year limit is because children’s faces change so much especially when they are very
young so Forensic artists need to be able to account for the drastic changes in facial features once
the original images have become outdated. The age-progressed images are then updated every
two years for missing children under the age of 18 and every five years once they are over the
age of 18. In the images, artists try to keep the expression and pose the same as the original real-
life picture of the missing child and if there is something unique about the child, such as missing

10
teeth, the artist will showcase the unique feature. When creating an age progression, Forensic
artists will reference photos of the missing child’s family members to help with aging effects on
the face and they will take genetics, diseases, and other biological or environmental factors into
account when creating the image. For example, if a child goes missing at age 7 and has been
missing for two years, the artist would ideally want to see pictures of both parents at age 7 and at
age 9. There is some subjectivity that goes into an age progression, such as the individual’s
hairstyle, but for the most part, artists try to keep facial features consistent and accurate as the
child ages. The figure below shows a NCMEC Forensic artist completing an age progression
using Adobe Photoshop. The artist uses pictures of the missing child’s family members as
reference and to assist with the age progression.
Figure 1: NCMEC Forensic Artist completing an age progression Image retrieved from https://www.fbi.gov/video-repository/asha-charlotte-ncmec-013120a.mp4/view
Once an age progression is completed, NCMEC will send the image to law enforcement
agencies and it will become available to the public. The image will also appear on the poster for
the missing child which can be located online in the long-term missing children section of the

11
NCMEC website. If a child has more than one age-progressed image as part of his or her case,
the most recent age-progressed image is the one that will appear on the poster. NCMEC Forensic
artists usually only create age progressions for children and teenagers who are 18 years old and
younger at the time they go missing, but there are some cases where age progressions have been
completed for individuals who went missing at ages 18 – 22 years old.
Facial Recognition
The use of facial recognition has increased drastically over the past decade by companies,
law enforcement, homeland security, social media, and businesses. From unlocking an iPhone to
attending a large concert, facial recognition use is widespread and over the last few years, has
been more frequently utilized by law enforcement for criminal investigations. The primary uses
of facial recognition are for verification (one-to-one matching), identification (one-to-many
matching), and screening. Verification (1:1 matching) is when a biometric sample, such as a
photo, is compared to a previously stored biometric template in order to verify an individual’s
identity. Identification (1:N matching) is when a biometric sample, such as a photo, is compared
to a gallery of biometric samples (photos) and a candidate list of top matches is generated to help
identify the individual. Once the list of matches is produced, a human examiner visually reviews
all matches and makes the final determination. Screening is used to confirm that a person is not
on a list of identified individuals, such as terrorists on a watchlist. Law enforcement’s primary
use of facial recognition is identifying suspects through identification (1:N matching) where a
mugshot or an image of the suspect from the crime scene is compared to a large database of
previously enrolled images, such as a database with driver’s licenses and passport images. It is
primarily for this reason that identification (1:N matching) was used in this study since it is much

12
more likely that law enforcement would use one image and search it against a database of images
to generate matches in a missing person’s case.
For the 1:N matching process, a biometric template is created when a person first enrolls
a biometric sample, such as a photo, and features of the sample are extracted to create a
numerical representation of the sample. This numerical representation (or template) is then added
to the database along with all of the other previously enrolled templates and is used when any
photos are searched against the database. All of the previously enrolled images in a database for
example, would have templates that the probe (or input) photos would be compared to in order to
establish a person’s identity. Some of the distinct features that a facial recognition algorithm
extracts for comparisons are the distance between a person’s eyes and the location of the nose
and mouth. It is from these facial features that the system creates a template or numerical
representation of the person’s face. Below is an example of the process where a person’s face is
converted into a numerical template.
Figure 2: Facial Recognition Template Process Image retrieved from https://www.eff.org/pages/face-recognition

13
There are multiple facial recognition algorithms that have been tested by the National
Institute of Standards and Technology (NIST) for accuracy as part of the Face Recognition
Vendor Test (FRVT) and one of these algorithms, Face++, is a product of the Chinese
technology company, Megvii. Face++ uses APIs to conduct facial recognition and the APIs
perform tasks such as detecting a person’s face in an image, searching for a person’s face in a
gallery of images, and comparing two facial images. Face++ was used as the facial recognition
algorithm in this research based on its ability to conduct identification (1:N) matching, utilization
of APIs, and proven accuracy testing by NIST.
Previous Research
Over the past few years, there has been significant research looking at the effects of aging
on facial recognition algorithms. In the 2018 NIST “Ongoing Face Recognition Vendor Test
(FRVT) Part 2: Identification”, researchers studied the performance of multiple facial
recognition algorithms and how they were impacted by certain factors, such as aging. For the
study, they enrolled the images of 3.1 million adults and then conducted a search with 10.3
million more recent images of the same adults, which had an age difference of up to 18 years
when compared to the original images (Grother, Ngan, & Hanaoka 2018). They found that aging
over time causes the accuracy of the algorithms to decrease and led to more errors. This suggests
that changes in facial appearance due to aging can impact similarity or confidence scores, which
can then affect the likelihood of the correct images appearing as matches.
“The Impact of Age Related Variables on Facial Comparisons with Images of Children:
Algorithm and Practitioner Performance” was a study that compared images of children to those
of adults and tested how algorithms and practitioners performed (with the algorithm performance

14
being of greater relevance to this study). In one part of the study, six algorithms were tested for
accuracy when comparing images of children to images of adults and in another part of the
study, images of the same children were compared at various ages with different age variations
between images. The researcher found that when using images of children for comparisons,
algorithm performance was lower for all algorithms. The false match rate and the false non-
match rate were higher for images of children across all algorithms. Additionally, the researcher
found that when there was greater age variation between images, the algorithm performance was
lower. The results of the study suggest that algorithms are less accurate when comparing images
of children to image of adults and when there is greater age variation between images, which is
information that was very pertinent to how this research was conducted.
The 2014 NIST Face Recognition Vendor Test (FRVT) looked at aging as a factor that
impacts algorithm performance. To test the accuracy of an algorithm as a person ages, the
researchers created seven different age groups starting with ‘baby’ (ages 0 – 3 years) and going
up to ‘Older’ (ages 55 – 101 years). They created these groups based on the ages where there are
similarities among facial features and where there is agreement that facial changes take place and
are the most drastic. The study found that algorithm performance accuracy was higher for the
older groups and lower for younger groups. For example, the baby group (ages 0 – 3 years) had a
false negative identification rate (FNIR) of 0.7 whereas the older group (ages 55 – 101) had a
FNIR of 0.008. FNIR is when a biometric sample, such as an image, is enrolled in the system but
the correct identity is not returned as a match. The results of the baby group suggest that it is
very difficult to properly identify infants and young toddlers because their identifications were
incorrect more often than they were correct (FNIR greater than 50%). The younger groups also
had a higher false positive identification rate (FPIR) where their images were more frequently

15
incorrectly matched when they did not have prior enrollments. These results indicate how it is
more difficult to recognize and differentiate infants and young toddlers as compared to adults.
Both this study and the previously mentioned research on algorithm performance with children
demonstrate how facial recognition algorithms are overall not as accurate with children’s faces
as compared to the faces of adults especially in terms of performance. The results from all of
these studies were taken into account when formulating the questions and hypotheses for this
research especially when looking at differences between younger and older children as well as
the age variation between images.
Experimental Design
This study was designed for identification (1:N matching) so that each image could be
compared to a database (or gallery) of images. A total of 347 children who went missing
between the ages of 1 to 20 years old were included in the study. Every missing child had at least
two age-progressed images that were included in the FaceSet (database of images to be searched
against); missing children with only one age-progressed image were not included in the study.
The reason for this was so that comparisons could be made for matches with multiple age-
progressed images to see if there are differences in the likelihood of matching based on the age
variation between images.
All of the age-progressed images used in this study were created by Forensic Artists at
NCMEC. There were two age groups that were created based on the ages of the children when
they went missing – individuals were either in the ‘younger’ group which represented children
less than 13 years old at time of missing or the ‘older’ group which represented children greater

16
than or equal to 13 years old at time of missing. Out of the 347 missing children, 212 were in the
older age group and 135 were in the younger age group; 240 were female and 107 were male.
In order to use Face++ APIs for facial recognition, some coding needed to be completed
for this research and it was done using the programming language, Python. All of the code was
written, executed, and stored in Visual Studio Code, which is a code editor. There were three
Face++ APIs that were used: the ‘Detect’ API was used first to detect a face in each image. The
‘AddFace’ API was used to add each image to the FaceSet and lastly, the ‘Search’ API was used
to search each real-life image against the FaceSet. Once the program ran, the results could be
viewed in Visual Studio Code as well as an Excel file that included all matches and non-matches
and their confidence scores.
Methods & Materials
All of the images used in this study were frontal-facing images and were collected from
the NCMEC missing children’s database and the National Missing and Unidentified Persons
System (NamUs) missing persons’ database. Both databases were used because the NamUs
missing persons’ database usually had more than one NCMEC age progression for each person
involved in the study. The NCMEC Long Term Missing & Unidentified Child Map was also
used to track missing individuals. All images are publicly available and approval to use them for
this study was granted by NCMEC.
The first step in the study was to collect all of the images from the databases and store
them in one place. The two figures below show examples of real-life and age-progressed images
used in this study. In figure 3, the image on the left side of the poster is the real-life image of the

17
missing girl and the image on the right side is her most recent age-progressed image. Names
have been blurred to maintain confidentiality.
Figure 3: Example of images from NCMEC missing child poster
In figure 4, the individual’s real-life image is on the left, and the two age progressions at
different ages are in the middle and on the right.

18
Figure 4: Images from NamUs Database
Since NCMEC tries to get the most recent real-life facial images of children for the
missing posters posted online, an assumption going into the study was that the age of the child at
the time he or she went missing was the same age as the child’s real-life image on his or her
missing poster. For example, the person in figure 4 went missing at age 17 so the age assigned to
his real-life image on the left was 17. All of the age progressions had an age assigned which was
the age the missing child would have been at the time the artist created the image. Once all of the
images were collected and stored in folders in iPhoto, they were then exported to folders on the
desktop so that their file paths could be accessed in Visual Studio Code. Below is a diagram
showing the flow of images from each application.

19
Figure 5: Process flow of image collection and storage
Once the images were added to the folders, the images and their file paths could be accessed in
Visual Studio Code and the FaceSet could be created. The figure below shows a list some of the
images that were used in Visual Studio Code.
Figure 6: Images in Visual Studio Code
The FaceSet had to be created first so that the real-life images could be searched against it. Both
the ‘Detect’ API and the ‘FaceSet AddFace’ API were used to create the FaceSet and the URLs
for both APIs can be seen in the figure below.

20
Figure 7: URLs of Detect API and FaceSet AddFace API
After pointing to specific URLs, the images that needed to be added to the FaceSet were written
out in the code. Below is an example of what the code looked like in order to add an image to the
FaceSet. The first line of code was to identify the person by name for tracking purposes and the
second line of code provided the image path where the image could be found and retrieved.
Figure 8: Python code used to create FaceSet *Note: Name and file path were blurred to maintain confidentiality.

21
The FaceSet included a total of 978 images – 872 age-progressed images from the 347 missing
children that were part of the study and 106 additional real-life images of missing people who
were not part of the study.
Once the code was written, the program ran and detected the faces in the images and then
added the images to the FaceSet. Below is an example of what the output looked like once the
program was executed and faces were added to the FaceSet. The results are in white under
‘Terminal’ and provide information for each image added to the FaceSet.
Figure 9: Results of images added to FaceSet
In addition to the results under ‘Terminal’, every image added to the FaceSet was tracked in an
Excel spreadsheet that included the image name in Column A and its associated token ID in
Column B. Figure 10 below provides a view of the FaceSet Excel file.

22
Figure 10: List of FaceSet images in Excel spreadsheet *Note: Image names in Column A were blurred to maintain confidentiality.
After all 978 images were added to the FaceSet, searches against the FaceSet could begin.
The 347 missing children who were included in the study each had one real-life image
that was searched against the FaceSet to produce a candidate list of the top 5 matches, ranked by
confidence score. The real-life images that were searched against the FaceSet were considered
the probe or ‘input’ images. The figure below shows how the code was written in Visual Studio
Code and how each real-life photo was represented by two lines of code – one line with the name
of the individual and the second line with the file path of the image.

23
Figure 11: Python code used for real-life images in searches *Note: Names and file paths have been blurred to maintain confidentiality.
Once the code was executed, each individual real-life photo was searched against the FaceSet
using the Search API. The figure below is an example of the search process with results for one
of the children from the figure above. The real-life image of this person was searched against the
FaceSet and the results with the top 5 matches are below. For this case, all three of the girl’s age
progressions appeared in the top 5 matches and were actually ranked 1st, 2nd, and 3rd.
Figure 12: Search process diagram

24
Figure 12 is a visual representation of the results that were generated in Excel and can be seen in
figure 13. The Excel file contained the name of the person, the person’s top 5 matches ranked by
confidence score, and the token ID that was assigned to each image from the FaceSet. Below are
the actual results in Excel from the person in the search process diagram above and her top 5
matches with the confidence scores.
Figure 13: List of top 5 matches *Note: Name and FaceSet image names have been blurred to maintain confidentiality.
A final data file was created to track each person in the study and whether or not the
person had any matches. A column was created in this file to track a match with a 1 and a non-
match with a 0. The file included additional information for each individual such as gender,
ethnicity, the age of the child when he or she went missing, and the age of the person in the age-
progressed image. Below is a screenshot of the final data file.
Figure 14: View of final data file

25
Data Analysis and Interpretation
Once the data was updated in the final Excel file, the spreadsheet was uploaded into
STATA so that the statistical analysis could be completed. For Hypothesis 1, a t-test was
conducted because the confidence scores of two age groups (the older and younger groups) were
being compared and a t-test would show what the mean confidence score was for each group.
The results of the t-test are below.
*Hypothesis 1: The older a child is at the age of missing, the higher the confidence score will be
when there is a match between the child’s real-life image and age-progressed image.
Table 1: T-test for mean confidence score by age group
As shown in the table above, the mean confidence score of the older age group was
72.24% and the younger group was 47.22% so the difference was 25.02%. The difference in the
mean scores shows that Hypothesis 1 is supported. The p-value is <0.05 so the results are
statistically significant at 5% and the Null hypothesis (the means for both groups being similar)
could be rejected. The three tables below show the distribution of confidence scores for all
matches and the distribution of scores by each age group. The scores of 0 represent non-matches
since non-matches did not generate a confidence score.

26
Figure 15: Histogram of confidence scores for matches
Figure 16: Histogram of confidence scores for matches in older age group

27
Figure 17: Histogram of confidence scores for matches in younger age group
*Hypothesis 2: The older the child is at the age of missing, the more likely there will be a match
between the child’s real-life and age-progressed image(s).
For hypothesis 2, an analysis was completed to determine the number of matches for the
older and younger age groups. The table below provides an overview of the number of matches,
the number of non-matches, and percentage of matches by both age groups. The higher
percentage of matches in the older group compared to the lower percentage of matches in the
younger group supports hypothesis 2.
AgeGrouping Total Match NoMatch %Match
Older 309 275 34 89.00%
Younger 158 91 67 57.59%
Total 467 366 101 78.37%
Table 2: Matches and non-matches by age group

28
A t-test was conducted to determine the average age at the time of missing for matches and non-
matches and the results are below. Group 0 represents non-matches and Group 1 represents
matches.
Table 3: T-test to determine mean age for matches and non-matches
The results of the t-test show that the mean missing age for non-matches was 8.79 years and the
mean age for matches was 13.60 years, which are results that also support hypothesis 2.
In addition to the t-test, a regression analysis was conducted for hypothesis 2 in order to
see if there was a greater probability of matching for children who went missing at older ages as
compared to younger ages and to be able to analyze other variables, such as gender and ethnicity.
The linear probability model used was y = b0 + b1x1 + …+ which would be represented as
Matched (0/1) = b0 + b1*(Age when missing). This model was used to calculate the probability
of matches based on the ages the children were when went missing.

29
Table 4: Regression analysis for age when missing
The results of the regression analysis show that the p-value is very small so the null hypothesis
of b1=0 was rejected. The data shows that when a missing child’s age is one year older, the
probability of matching is 0.0336 percentage points higher. The results suggest a statistically
significant positive correlation between missing age and the probability of matching so as the
child’s age at the time of missing increases, the probability of matching increases. Adding gender
as an additional factor to the linear probability model produced the following results.
Table 5: Regression analysis for age when missing and gender (female)
In the interpretation of the coefficient for age when missing, the coefficient is statistically
significant at 1% and the data again suggests a positive correlation between matching age and

30
probability of matching. When the missing person’s age is one year older, the probability of
matching images is 0.034 percentage points higher. In the interpretation of the coefficient for
gender (female), the coefficient is statistically significant at 10% and the results of -0.064
suggest that if the missing child is female then the probability of matching decreases by 0.064
percentage points. This means that when missing age is held constant, a girl is less likely to be
matched than a boy. These results are consistent with real life because as girls get older, they are
more likely to have extra changes in facial appearance with make-up or accessories, which could
impact matching capabilities between images. The three tables below add in ethnicity as an
additional factor to the regression analysis.
Table 6: Regression analysis for age when missing, gender (female), and White, Black, and Hispanic ethnicities

31
Table 7: Regression analysis for age when missing, gender (female), and White, Hispanic, and Other ethnicities
Note: ‘Other’ includes American Indian, Asian, Biracial, and Pacific Islander
Table 8: Regression analysis based on age when missing, gender (female), and Black, Hispanic, and Other ethnicities
Note: ‘Other’ includes American Indian, Asian, Biracial, and Pacific Islander
When adding in ethnicity as a factor, the results from the three tables above all show a
statistically significant positive correlation between missing age and probability of matching,
which is similar to the previous regression analyses for hypothesis 2. In terms of gender, the data
does not have statistical significance for females in these three regression analyses. For ethnicity,

32
the p-values and t-stat in tables 6 and 7 show that there is a statistically significant negative
correlation between being matched and being of White ethnicity when compared to children of
Other (table 6) or Black (table 7) ethnicities. This means that a child who is White is 0.233
percentage points less likely to be matched as compared to Other individuals (table 6) and 0.107
percentage points less likely to be matched as compared to Black individuals (table 7). Table 8
suggests a statistically significant positive correlation between probability of being matched and
being of Black ethnicity or as a part of the Other ethnicity when compared to Whites. This is
consistent with tables 6 and 7 and demonstrates how a missing child who is of the ‘Other’ or
Black ethnicity is more likely to be matched when compared to White children.
*Hypothesis 3: The closer in age the age-progressed image is to the age of the child when he or
she went missing (less age variation), the greater the likelihood there will be a match.
Out of the 347 missing children who were searched in this study, there were 246 children
who matched with one or more than one of their age progressions creating a total of 366
matches. There were 101 children that did not match with any of their age progressions, which
created a total of 101 non-matches. Below is a breakdown of the 1st, 2nd, 3rd, and 4th age
progressions and the number of matches they generated.
Matched 1stAP 2ndAP 3rdAP 4thAP
NumberofImagesMatched 199 132 31 4
TotalAvailable 347 347 114 14
Matched%(Numberofimages/Total
Available)57.35% 38.04% 27.19% 28.57%
Table 9: Images matched by age progression

33
The “1st” age progression group refers to the age progression that was closest in age to
the missing child, the “2nd” age progression group refers to the age progression second closest in
age, and so on up until the 4th age progression group. The “1st” age progression was not
necessarily the very first age progression that was ever created of the missing child – it was just
the age-progressed image closest in age to the missing child when he or she went missing that
could be found in one of the databases (same for the 2nd, 3rd, and 4th). Since every child in the
study had at least two age-progressed images, both the 1st and 2nd age progressions each had a
total of 347. The 3rd and 4th age progressions were lower in count because fewer children had
more than two age progressions. It is evident from Table 9 that the 1st age progressions generated
the highest number and highest percentage of matches, which supports hypothesis 3.
The pie chart below shows the percentage breakdown by age progression based off of the
366 total matches. The data shows that the 1st age progressions have the highest percentage
(54.37%) of matches out of all age progressions, which also supports hypothesis 3.
Figure 18: Breakdown of matches by age progression group
54.37% 36.07%
8.47% 1.09%
Breakdown of Matches
1st Age Progression
2nd Age Progression
3rd Age Progression
4th Age Progression

34
In terms of age groups, the chart below shows the breakdown of age progressions by age group.
The fact that the younger group has an even higher percentage of matches for the 1st age
progresion as compared to the older group shows how much aging can impact a younger child’s
face. For the younger group, 60.4% of matches were with the first age progressions and for the
older group, 52.4% were matches with the first age progressions. The decrease in percentage is a
lot more from the 1st to the 2nd age-progressed image for the younger group which shows how
much of an impact a couple of extra years can make in an age progression.
Figure 19: Breakdown of matches by age progression for older and younger groups
A regression analysis using the linear probability model was also completed for
hypothesis 3 to determine the likelihood of matching based on the age variance between the
children’s real-life and age-progressed images. The equation used was Matched (0/1) = b0 +
PercentageofMatchedAPbyAgeGroup

35
b1*GapAge where 0 represented non-matches and 1 represented matches. ‘GapAge’ was a
calculation created in STATA and it was the difference between the age of the age-progressed
image and the age of the child when he or she went missing (Age AP image – Age when
missing). For example, if the age a child went missing was age 10 and the age of one of the age-
progressed images that matched was 14 then the gap age between the two images would be 4.
Table 10: Regression analysis of gap age
The results of the regression analysis from the table above show that the Null hypothesis of Ho:
b1=0 can be rejected with the p-value = 0.0001. The results suggest that there is a statistically
significant negative correlation between gap age and the probability of matching which means
that the closer in age the age-progressed image is to the age of the child at the time he or she
went missing (less age variation), the greater the probability is that their images will match.
Using this model, an assumption was made that for people who did not have a match, it took in
infinite amount of time for them to get matched so their gap age was set to 100 instead of 0. This
was a large number in comparison to the actual range of gap ages for matches, which was 2 to 43
years. The regression analysis for hypothesis 3 was used to include a couple of other factors such
as gender and ethnicity. The table below shows the results for gap age and gender (female).

36
Table 11: Regression analysis of gap age and gender (female)
The results of the negative coefficient, p-value, and t-stat suggest that there is a statistically
significant negative correlation between gap age and the probability of matching. For females,
the data suggests a statistically significant positive correlation between females and the
probability of matching. This means that in relation to gap age and keeping the gap age constant,
girls are more likely to be matched than boys. In addition to gender, the regression analysis using
the linear probability model was run for ethnicity.
Table 12: Regression analysis of gap age, gender (female), and White, Black, and Other ethnicities
37
Note: ‘Other’ includes American Indian, Asian, Biracial, and Pacific Islander
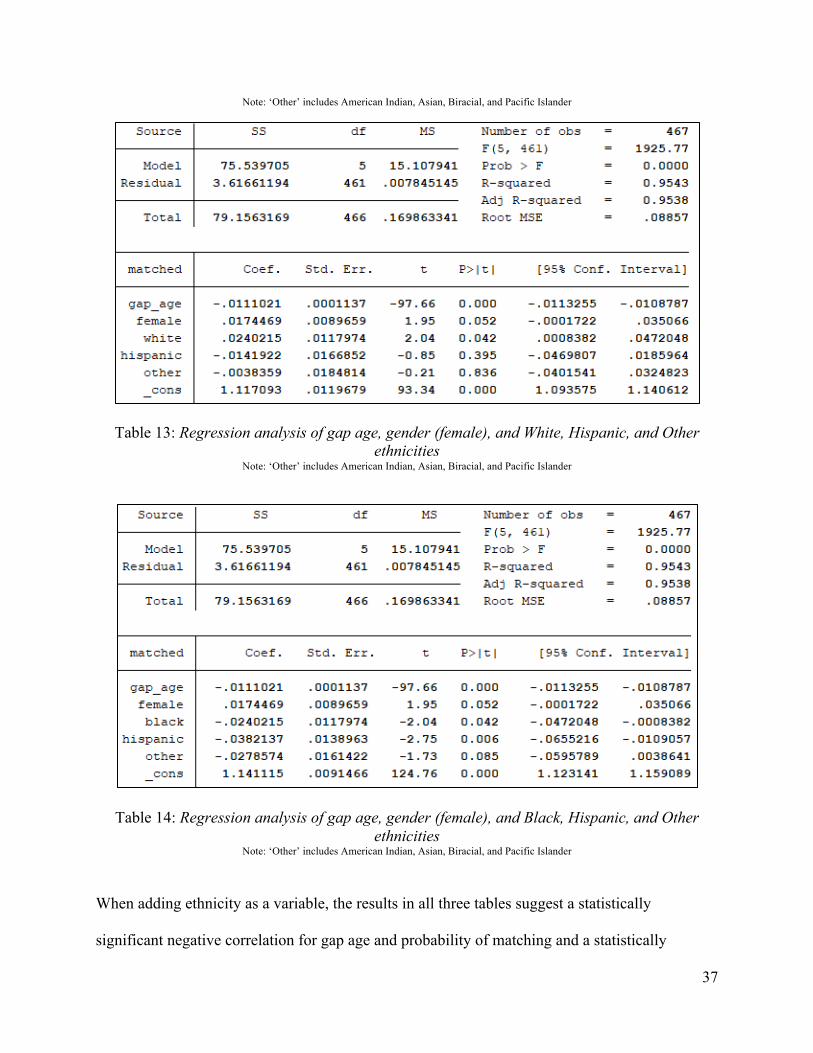
Table 13: Regression analysis of gap age, gender (female), and White, Hispanic, and Other ethnicities
Note: ‘Other’ includes American Indian, Asian, Biracial, and Pacific Islander
Table 14: Regression analysis of gap age, gender (female), and Black, Hispanic, and Other ethnicities
Note: ‘Other’ includes American Indian, Asian, Biracial, and Pacific Islander
When adding ethnicity as a variable, the results in all three tables suggest a statistically
significant negative correlation for gap age and probability of matching and a statistically

38
significant positive correlation for females and probability of matching at a significance level of
10%. The data in tables 12 and 13 suggest a statistically significant positive correlation between
missing children who are White and probability of being matched when compared to children
who are of Hispanic (table 12) and Black (table 13) ethnicities. In table 12, the coefficient for
White individuals suggests that the probability of matching is 0.038 percentages points higher
than Hispanic children. The coefficient White children in table 13 suggests that the probability of
matching is 0.024 percentage points higher than Black children. The results depicted in table 14
suggest a statistically significant negative correlation for Hispanic and Black ethnicities meaning
that the probability of matching either ethnicity is less than Whites – 0.038 percentage points less
for Hispanic individuals and 0.024 less for Black individuals. These results support the data in
tables 12 and 13.
Results & Discussion
The results from this research demonstrate that Face++ can accurately detect and match
digitally produced age-progressed images to real-life images. The results suggest that children
who go missing at older ages will have higher confidence scores and a greater likelihood of
matching their real-life and an age-progressed image(s). The results of this study also
demonstrate that age-progressed images closer in age to the age of the missing child and his or
her real-life image (less age variance) will have a greater likelihood of being matched.
Additionally, the age progression that is closest in age to the missing individual has the greatest
likelihood of matching for both older children and especially for younger children. The best
chance of matching for young children would be with the age progression that is completed two

39
years after the child went missing, which makes sense because a child’s face can change a lot
within a span of two or more years.
Conclusion
The results of this study could benefit law enforcement and investigators in long-term
missing children cases by knowing that the likelihood of matching real-life and age-progressed
images increases for children who go missing at older ages. That is not to say that there will not
be matches with younger children since children in the ‘younger’ age group of this study
generated 91 out of 158 matches (57%), but there is a greater likelihood of matching as the age
of the missing child increases. It is beneficial for investigators to know that a child’s first or
second age progression will have a greater chance of matching especially the first age
progression for younger children. In terms of limitations of this study, one limitation was the
inability to train the Face++ facial recognition algorithm with images of toddlers and young
children. In general, facial recognition algorithms are trained with adult faces so if there had
been the possibility to train the algorithm with younger faces prior to collecting data then there
might have been different results and the algorithm may have been able to match images of
younger children more accurately. Another limitation was for some cases, the very first, original
age progressions were not available in the databases or the ages of the age progressions were not
listed so there may have been images that would have been closer in age to the missing children
that were not used in the study.
One future direction related to this research is for long-term missing children who have
been found, such as Jaycee Dugard. The missing child’s age-progressed images could be
compared to more recent photos of them once they were found to see how accurately a facial

40
recognition algorithm could match them. Another future direction could be through the use of
digital images from facial reconstructions in order to identify previously unidentified and
deceased individuals. These images could be searched against a database of real-life images with
photos from driver’s licenses and passports to see if there are any matches. In addition to
digitally created facial reconstructions, facial images created through DNA phenotyping could
also be searched against a database of images in order to identify an individual. Another future
direction would be to use the same experimental design of this study and test multiple different
facial recognition algorithms to see which algorithm generates the most accurate scores and
matches. Lastly, age regression is another relevant area of research so age-progressed or older
real-life images could be compared to a database with younger, real-life images of the same
people. It would essentially be the inverse of this study’s design and could test an algorithm’s
ability to properly identify the participants at younger ages.

41
References
Bukar, A., & Ugail, H. (2017). Facial Age Synthesis Using Sparse Partial Least Squares (The
Case of Ben Needham). Journal of Forensic Sciences, 62(5), 1205-1212. DOI:
10.1111/1556-4029.
Deb, D., Best-Rowden, L., & Jain, A. (2017). Face Recognition Performance under Aging, IEEE
Conference on Computer Vision and Pattern Recognition Workshops (CVPRW),
Honolulu, 2017. IEEE. DOI: 10.1109/CVPRW.2017.82.
Grother, P., & Ngan, M., & Hanaoka, K. (2018). Ongoing Face Recognition Vendor Test
(FRVT) Part 2: Identification. NIST Interagency/Internal Report (NISTIR) – 8238. DOI:
10.6028/NIST.IR.8238.
Grother, P., & Ngan, M., & Hanaoka, K. (2014). Face Recognition Vendor Test (FRVT). NIST
Interagency/Internal Report 8009. DOI: 10.6028/NIST.IR.8009.
Lampinen, J., Erickson, W., Frowd, C., & Mahoney, G. (2016). Estimating the Appearance of
the Missing: Forensic Age Progression in the Search for Missing Persons. Handbook of
Missing Persons, 251-269. Retrieved from https://link.springer.com/chapter/10.1007/978-
3-319-40199-7_17.
Lanitis, A., & Tsapatsoulis, N. (2016). On the analysis of factors influencing the performance of
facial age progression, 4th International Conference on Biometrics & Forensics (IWBF),
Limassol, Cyprus, 2016. IEEE. DOI: 10.1109/IWBF.2016.7449697.
Michalski, D. (2018). The Impact of Age Related Variables on Facial Comparisons with Images
of Children: Algorithm and Practitioner Performance. University of Adelaide Research
Theses. DOI: 10.4225/55/5ab4385633544.

42
Michalski, D., Yiu, S.Y., & Malec, C. (2018). The Impact of Age and Threshold Variation on
Facial Recognition Algorithm Performance using Images of Children, International
Conference on Biometrics (ICB), Gold Coast, Australia, 2018. IEEE. DOI:
10.1109/ICB2018.2018.00041
National Center for Missing & Exploited Children – Key Facts. (2020). Retrieved from
http://www.missingkids.com/footer/media/keyfacts.
National Center for Missing & Exploited Children – Search for Missing Children. (2020).
Retrieved from http://www.missingkids.com/gethelpnow/search.
NCMEC’s Long Term Missing & Unidentified Child Map. Retrieved from
http://ncmec.maps.arcgis.com/apps/webappviewer/index.html?id=504833a14fcb42198d6
7a2c53fcbc96e.
NamUs Missing Persons Search. Retrieved from http://namus.gov/MissingPersons/Search
Face Verification Across Age Progression. IEEE Transactions on Image Processing, 15(11),
3349-3361. DOI: 10.1109/tip.2006.881993.
Ramanathan, N., & Chellappa, R. (2006). Face Verification Across Age Progression. IEEE
Transactions on Image Processing, 15(11), 3349-3361. DOI: 10.1109/tip.2006.881993.
Ricanek, K., Bhardwaj, S., & Sodomsky, M. (2015). A Review of Face Recognition against
Longitudinal Child Faces. BIOSIG 2015, p. 15 – 26. Retrieved from
https://pdfs.semanticscholar.org/fd64/27c8fa27cdce5ac5559d583bad8f13adb23e.pdf?_ga
=2.20627064.1903907657.1561266771-1434130124.1561266771.
Best-Rowden, L., & Jain, A. (2015). A Longitudinal Study of Automatic Face Recognition,
International Conference on Biometrics (ICB), Phuket, Thailand, 2015. IEEE. DOI:
10.1109/ICB.2015.7139087.

43
Wan, Q., & Panetta, K. (2016). A facial recognition system for matching computerized
composite sketches to facial photos using human visual system algorithms, IEEE
Symposium on Technologies for Homeland Security (HST), Boston, 2016. IEEE. DOI:
10.1109/THS.2016.7568945.
Yang, H., Huang, D., Wang, Y., & Jain, A. (2017). Learning Face Age Progression: A Pyramid
Architecture of GANs, IEEE/CVF Conference on Computer Vision and Pattern
Recognition (CVPR), Salt Lake City, 2018. IEEE. DOI: 10.1109/CVPR.2018.00011.