Testing SensoGraph, a geometric approach for fast sensory ...
21
Testing SensoGraph, a geometric approach for fast sensory evaluation David Orden 1 ,Encarnaci´onFern´andez-Fern´ andez 2 , Jos´ e M. Rodr´ ıguez-Nogales 3 , and Josefina Vila-Crespo 4 1 Departamento de F´ ısica y Matem´aticas, Universidad de Alcal´a, Spain. [email protected] 2 ´ Area de Tecnolog´ ıa de Alimentos, E.T.S. de Ingenier´ ıas Agrarias, Universidad de Valladolid, Spain.. [email protected], [email protected], [email protected] Abstract This paper introduces SensoGraph, a novel approach for fast sensory evalu- ation using two-dimensional geometric techniques. In the tasting sessions, the assessors follow their own criteria to place samples on a tablecloth, according to the similarity between samples. In order to analyse the data collected, first a geometric clustering is performed to each tablecloth, extracting connections between the samples. Then, these connections are used to construct a global similarity matrix. Finally, a graph drawing algorithm is used to obtain a 2D consensus graphic, which reflects the global opinion of the panel by (1) posi- tioning closer those samples that have been globally perceived as similar and (2) showing the strength of the connections between samples. The proposal is validated by performing four tasting sessions, with three types of panels tasting different wines, and by developing a new software to implement the proposed techniques. The results obtained show that the graphics provide sim- ilar positionings of the samples as the consensus maps obtained by multiple factor analysis (MFA), further providing extra information about connections between samples, not present in any previous method. The main conclusion is that the use of geometric techniques provides information complementary to MFA, and of a different type. Finally, the method proposed is computationally able to manage a significantly larger number of assessors than MFA, which can be useful for the comparison of pictures by a huge number of consumers, via the Internet. Keywords: Sensory analysis, Wines, Projective Mapping, Multidimensional Scaling, Geometric graphs. This work has received funding from the European Union’s Horizon 2020 re- search and innovation programme under the Marie Sklodowska-Curie grant agreement No 734922. 1 arXiv:1809.06911v1 [cs.CG] 16 Sep 2018
Transcript of Testing SensoGraph, a geometric approach for fast sensory ...
Testing SensoGraph a geometric approach for fast
sensory evaluation
David Orden 1 Encarnacion Fernandez-Fernandez 2 Jose MRodrıguez-Nogales 3 and Josefina Vila-Crespo 4
1Departamento de Fısica y Matematicas Universidad de Alcala Spaindavidordenuahes
2Area de Tecnologıa de Alimentos ETS de Ingenierıas AgrariasUniversidad de Valladolid Spain effernaniafuvaes
rjosemiafuvaes jvilapatuvaes
Abstract
This paper introduces SensoGraph a novel approach for fast sensory evalu-ation using two-dimensional geometric techniques In the tasting sessions theassessors follow their own criteria to place samples on a tablecloth accordingto the similarity between samples In order to analyse the data collected firsta geometric clustering is performed to each tablecloth extracting connectionsbetween the samples Then these connections are used to construct a globalsimilarity matrix Finally a graph drawing algorithm is used to obtain a 2Dconsensus graphic which reflects the global opinion of the panel by (1) posi-tioning closer those samples that have been globally perceived as similar and(2) showing the strength of the connections between samples The proposalis validated by performing four tasting sessions with three types of panelstasting different wines and by developing a new software to implement theproposed techniques The results obtained show that the graphics provide sim-ilar positionings of the samples as the consensus maps obtained by multiplefactor analysis (MFA) further providing extra information about connectionsbetween samples not present in any previous method The main conclusionis that the use of geometric techniques provides information complementary toMFA and of a different type Finally the method proposed is computationallyable to manage a significantly larger number of assessors than MFA which canbe useful for the comparison of pictures by a huge number of consumers viathe Internet
Keywords Sensory analysis Wines Projective Mapping MultidimensionalScaling Geometric graphs
This work has received funding from the European Unionrsquos Horizon 2020 re-search and innovation programme under the Marie Sk lodowska-Curie grantagreement No 734922
1
arX
iv1
809
0691
1v1
[cs
CG
] 1
6 Se
p 20
18
1 Introduction and related work
The aim of this work is to introduce and evaluate SensoGraph a novel approachfor the analysis of sensory data using geometric techniques which deal with basicobjects in 2D like points circles and segments (Gabriel and Sokal 1969 Kamadaand Kawai 1989) A data collection following the methodology introduced by Risviket al (1994) for Projective Mapping is combined with a data analysis using geometricMultidimensional Scaling A consensus graphic is obtained showing not only apositioning of the samples but also connections between samples and the force(strength) of these connections This aims to be helpful in order to calibrate thesignificance of the positions on the graphic and to reflect the relations betweengroups Moreover the use of geometric techniques aims to help avoiding possiblemisuses of statistical techniques The proposed method is validated by performingfour sessions with three types of panels tasting different wines
Sensory profiling is among the most important and widely used tools in sensoryand consumer science (Lawless and Heymann 2010) both in academia and indus-tries (Varela and Ares 2012) In these two fields descriptive analysis has usefullylinked product characteristics and consumer perception (Varela and Ares 2012 Vi-dal et al 2014) Descriptive panels allow due to their expertise to obtain verydetailed robust consistent and reproducible results (Moussaoui and Varela 2010)However creating and maintaining a well-trained calibrated sensory panel can be-come too long and costly For academic research because of dealing with occasionalprojects or scarce funding (Lawless and Heymann 2010 Murray et al 2001 Varelaand Ares 2012) For companies because of reasons like funding limits or difficultyto enrol assessors in a panel during a long time
Thus several alternative methods have arisen in the last years (Varela and Ares2012) aiming to provide a fast sensory positioning of a set of products by assessorswho are not necessarily trained Skipping the need to train the panellists allows toelude the need of waiting a long time before obtaining results as well as the needof agreeing on particular attributes which may become difficult when working withexperts like wine professionals or chefs (Hopfer and Heymann 2013) Introducedby Risvik et al (1994 1997) Projective Mapping asks the assessors to position thepresented samples on a two-dimensional space usually a blank sheet of paper astablecloth following their own criteria The more similar they perceive two sam-ples the closer they should position them and vice versa (Perrin et al 2008)In those seminal works the data were analysed by generalized procrustes analysis(GPA) (Gower 1975) and principal component analysis (PCA) (Gabriel 1971) us-ing the RV coefficient (Escoufier and Robert 1979) to compare the method withconventional profiling
More recently Pages (2003 2005) proposed the use of multiple factor analysis(MFA) (Escofier and Pages 1994) for data analysis coining the name Napping RcopyTypically a two-dimensional graphic is obtained where proximity of two samplesindicates that the panel has globally perceived them to be similar
The goal of these statistical methods is always to get an average configuration
2
of products called consensus graphic so it is crucial to assess its stability Thus inorder to know whether two products are perceived as significantly different from asensory point of view the positions on the map given by these statistical methodsshould include a confidence area eg confidence ellipses (Cadoret and Husson2013)
Projective Mapping has been successfully used with many different kinds ofproducts among which the application to wine stands out (Piombino et al 2004Ballester et al 2005 Pages 2005 Perrin et al 2008 Perrin and Pages 2009 Becue-Bertaut and Le 2011 Ross et al 2012 Hopfer and Heymann 2013 Torri et al2013 Vidal et al 2014) Other examples of beverages analysed by these meth-ods are beers (Chollet and Valentin 2001 Abdi et al 2007 Lelievre et al 20082009 Reinbach et al 2014) citrus juices (Nestrud and Lawless 2008) drinkingwaters (Falahee and MacRae 1995 1997 Teillet et al 2010) high alcohol prod-ucts (Louw et al 2013) hot beverages (Moussaoui and Varela 2010) lemon icedteas (Veinand et al 2011) powdered juices (Ares et al 2011) or smoothies (Pageset al 2010) The book by Varela and Ares (2014) details more products to whichconsumer based descriptive methodologies have been applied
Until now all the methodologies proposed for fast sensory evaluation have usedstatistical techniques to perform the data analysis This paper introduces and eval-uates a novel approach a combination of geometric techniques to obtain a differentkind of consensus graphic here named SensoGraph The outcome is a graph rep-resentation which combines a positioning of the samples together with connectionsrepresenting the strength of the relations between them Such a kind of representa-tion is becoming more and more usual nowadays among other reasons because ofallowing dynamic data visualization (Beck et al 2017) being helpful for big datavisualization (Baumann et al 2016 Conover et al 2011 Junghanns et al 2015)and providing apparent graphics suitable for mass media (The Electome and TheLaboratory for Social Machines at the MIT Media Lab 2016) and the analysis ofsports (Buldu et al 2018)
2 Material and methods
21 Data collection
In order to validate this proposal a total of four tasting sessions using ProjectiveMapping (Risvik et al 1994 Pages 2005) have been performed with three typesof panels tasting different wines
(A) Panel trained in Quantitative Descriptive Analysis (QDA) A panel trainedin QDA of wine composed of eleven assessors tasted eight different red wines in onesession all of them elaborated at the winery of the School of Agricultural Engineeringof the University of Valladolid in Palencia (Spain) Four of the wines were fromcv Cabernet Sauvignon and the other four from cv Tempranillo all of them fromthe same vintage This panel was selected and trained using ISO 8586 (2012)
(B) Panel receiving one training session in Projective Mapping Another panel
3
composed of twelve assessors with experience in wine tasting performed two sessionsof Projective Mapping a first session without any experience in the method and arepetition The same eight red wines were used both for the training and for the finaltest all of them elaborated at the winery of the School of Agricultural Engineeringof the University of Valladolid in Palencia (Spain) using cv Tempranillo from Toroappellation (Spain) and the same vintage These eight wines were different fromthose tasted by the previous panel This panel was composed by students of theEnology degree at the University of Valladolid who had studied three academicyears of Enology including a course in Sensory Analysis
(C) Panel of habitual wine consumers tasting commercial wines A final panelcomposed of twenty-four habitual consumers of wine performed one session of Pro-jective Mapping They tasted nine commercial wines one of them duplicated Sevenof the wines used only one variety Three of them were cv Mencıa three more werecv Tempranillo (one of them from Toro appellation Spain) and another one wascv Monastrell The other two wines were a blend of varieties The duplicated wineused mainly cv Cabernet Franc together with cv Merlot Garnacha and Monas-trell The other wine was mainly cv Tempranillo blended with cv Garnacha andGraciano
For all the sessions the number of samples followed the recommendations of Valentinet al (2016) The samples were simultaneously presented to each assessor The pan-ellists were requested to position the wine samples on an A2 paper (60 times 40 cm)in such a way that two wine samples were to be placed close to each other if theyseemed sensorially similar and that two wines were to be distant from one another ifthey seemed sensorially different All of this according to the assessorrsquos own criteriafor what close or far mean
In all the sessions the samples were served as 25 mL aliquots in standardisedwineglasses (ISO 3591 1977) which were coded with 3-digit numbers and all thesamples were presented simultaneously using a randomized complete block designThe serving temperature was 14plusmn1C All these sensory evaluations were carriedout at the Sensory Science Laboratory of the School of Agricultural Engineeringat the University of Valladolid Palencia (Spain) in individual booths designed inaccordance with ISO 8589 (2007)
22 Data analysis
The x- and y-coordinates of each sample on the paper were measured from the left-bottom corner of the sheet These data were then stored in a table with S rows onefor each sample and 2A columns with A being the number of assessors
221 Statistical techniques
On one hand these data were analysed by statistical techniques with MFA asproposed by Pages (2005) using the R language (R Development Core Team 2007)and the FactoMineR package (Le et al 2008) MFA has become a common choice forthe analysis of Projective Mapping data (Varela and Ares 2014) and it has been
4
proved to be equal or better than other models like individual differences scaling(INDSCAL) for estimating the consensus configuration (Naeligs et al 2017) Finallyconfidence ellipses were constructed using truncated total bootstrapping (Cadoretand Husson 2013) with SensoMineR package (Le and Husson 2008)
222 Geometric techniques
On the other hand in order to analyse the data by geometric techniques we havedeveloped and applied the following method
Step 1 Geometric clustering (Capoyleas et al 1991) allows to group data usingbasic operations from two-dimensional geometry like drawing circles or segmentsWith the goal of analyzing each tablecloth to connections between the samples andafter exploring a large number of alternatives (de Miguel et al 2013) the Gabrielgraph (Gabriel and Sokal 1969) was chosen because of its good behavior and itsclustering abilities having been widely checked (Matula and Sokal 1980 Urquhart1982 Choo et al 2007)
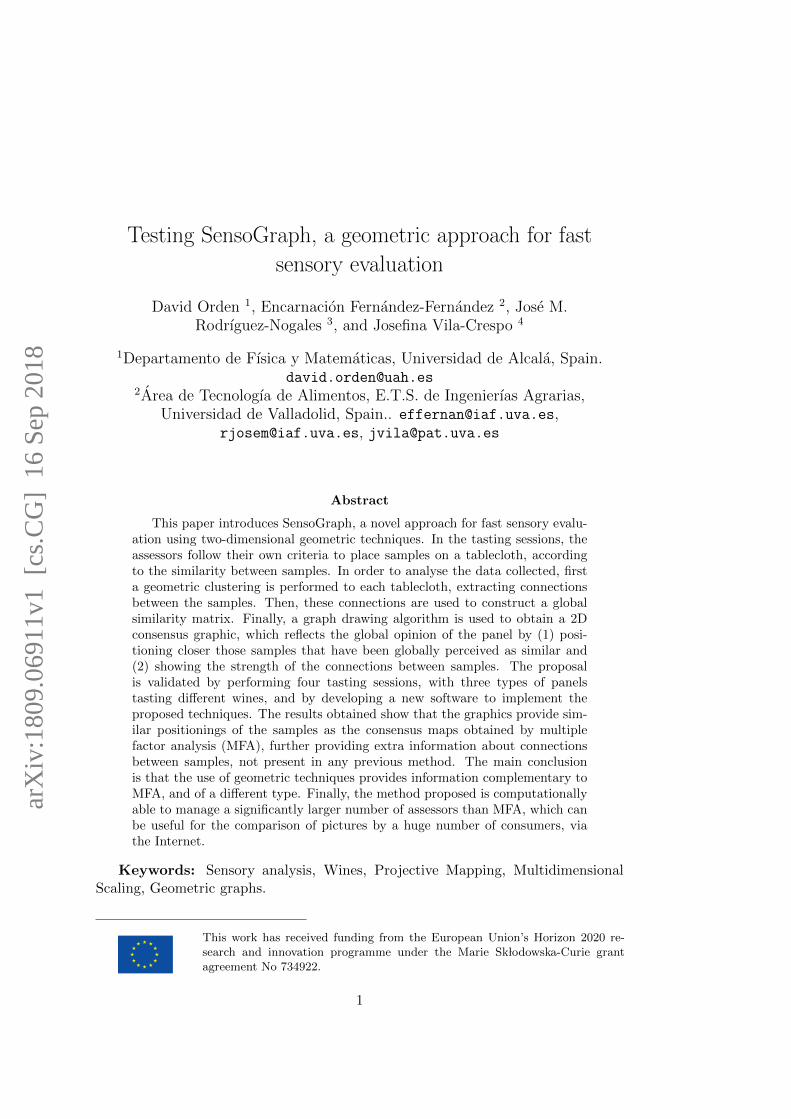
For the construction of the Gabriel graph two samples PQ get connected if andonly if there is no other sample inside the closed disk having the straight segmentP minus Q as diameter Figure 1 shows how to construct a Gabriel graph Figure 2shows another example with four tablecloths (first row) and their correspondingGabriel graphs (second row)
12
34
56
7
12
34
56
7
Figure 1 Left Tablecloth positioning seven samples Right Construction of theassociated Gabriel graph
Recall that the assessors position the samples on the tablecloth without a com-mon metric criterion according to their own understanding of close and far For anexample look at the two leftmost tablecloths in the top row of Figure 2 The square1-2-3-4 shows different distances in the two tablecloths with samples 1-2 being muchcloser in the second picture than in the first one However at a glance we would saythat both tablecloths provide similar information namely a group 1-2-3-4 togetherwith the samples 5-6-7 getting further from that group
This is the kind of information extracted by the Gabriel graph which therefore
5
leads to the same graph for those two cases See the two leftmost pictures of thesecond row in Figure 2 which both show the same connections
Step 2 A global similarity matrix (Abdi et al 2007) was constructed Eachentry of the matrix stores for a pair of samples PQ how many tablecloths show aconnection P minusQ after the clustering step (eg entry 1 2 will equal the number oftablecloths in which the samples 1 and 2 are connected) Figure 2 illustrates (thirdrow left) the global similarity matrix from four tablecloths for which the clusteringGabriel graph has already been constructed (second row)
1
2
34
5
6
7
bull 3 2 4 2 0 2
3 bull 3 1 1 0 0
2 3 bull 4 1 0 1
4 1 4 bull 1 1 0
2 1 1 1 bull 3 0
0 0 0 1 3 bull 4
2 0 1 0 0 4 bull
Number of
connections
uarr
1Samplesdarr
2 3 4 5 6 7
1
rarr
23
45
6
7
12
34
567
7
6
5
1
3
24
1
2
3
4
5
6
776
5
13
24
12
34
567
7
6
5
1
3
24
1
2
3
4
5
6
776
5
13
24
Step 1Tablecloths fromprojective mapping
Step 2Geometric clusteringfrom Gabriel Graph
Step 3Global similarity matrix
Step 4Graph layout (SensoGraph)from Kamada-Kawai algorithm
Figure 2 First row Four hypothetical tablecloths from Projective Mapping Secondrow Geometric clustering obtained by the Gabriel Graph Third row left Globalsimilarity matrix For an example entry 1 2 has value 3 because the samples 1and 2 are connected in 3 of the tablecloths in the second row Third row right TheSensoGraph resulting graphic where distances between samples represent the globalsimilarity perceived Two clear groups 1-2-3-4 and 5-6-7 appear consistently withthe tablecloths on top In addition connections between samples can be checkedwith the connection forces being represented by thickness and opacity For an exam-ple the edge 1 minus 2 having force 3 is thicker and more opaque than the edge 2 minus 5whose force is 1 but thinner and more transparent than the edge 1 minus 4 of force 4
This global similarity matrix can alternatively be seen as encoding a graph inwhich entry i j stores the weight of the connection between vertices i and j
Step 3 A graph drawing algorithm (Eades et al 2010) was applied to the graphencoded by the global similarity matrix Graph drawing algorithms have been usedin social and behavioral sciences as a geometric alternative (DeJordy et al 2007)
6
to non-metric multidimensional scaling (Chollet et al 2014) Among the differentkinds of graph drawing algorithms the particular class of force-directed drawingalgorithms (Fruchterman and Reingold 1991 Hu 2005) has been the one chosenbecause of providing good results and being easy to understand
In this class of algorithms each entry PQ of the global similarity matrix modelsthe force of a spring which connects P minus Q and pulls those samples together withthat prescribed force The particular algorithm chosen has been the Kamada-Kawaialgorithm where the resulting system of forces is let to evolve until an equilibriumposition of the samples is reached Technical details can be checked at the paperby Kamada and Kawai (1989) but for a better understanding of this third stepthe reader can imagine that the samples are (1) pinned at arbitrary positions on atable (2) joined by springs with the forces specified in the matrix and (3) finallyunpinned all at the same time so that they evolve to an equilibrium position
Figure 2 shows a graphical sketch of these three steps The equilibrium posi-tion reached provides a consensus graphic here named SensoGraph which reflectsthe global opinion of the panel by positioning closer those samples that have beenglobally perceived as similar In addition the graphic shows the connections andrepresents their forces by the thickness and opacity of the corresponding segments(the actual values of the forces being attached as a matrix) This information al-lows to know how similar or different two products have been perceived playing therole of the confidence areas used by other methods in the literature (Cadoret andHusson 2013)
23 Software
In order to perform the three steps detailed above a new software was implementedFor convenience Microsoft Visual Studio together with the programming languageC were used to create an executable file for Windows which allows to visuallyopen the data spreadsheet and click a button to obtain the consensus graphic Thisallows to start using the software with a negligible learning curve
The implementation of Step 1 above followed a standard scheme for the construc-tion of the Gabriel graph (Gabriel and Sokal 1969) computing first the Delaunaytriangulation (de Berg et al 2008) and then traversing its edges to check whichof them fulfill the Gabriel graph defining condition (that there is no other sampleinside the closed disk having that edge as diameter as stated in Step 1) Note thatthis is an exact algorithm and hence there are no parameters to be chosen
Implementing Step 2 was straightforward just needing to run through the Gabrielgraphs obtained updating the counters for the appearances of each edge and stor-ing the results as a matrix Finally for Step 3 the algorithm in the seminal paperby Kamada and Kawai (1989) was used This algorithm does need the followingchoices of parameters The desirable length L of an edge in the outcome for whichthe diameter of the tablecloths was used as suggested in Eq (3) in the referenceA constant K = 100 used to define the strengths of the springs as in Eq (4) inthe reference which determines how strongly the edges tend to the desirable length
7
Finally a maximum number C = 1000 of iterations and a threshold ε = 01 werechosen for the stopping condition of the algorithm All these choices are ratherstandard since our tests did not show huge variability among different choices
A video showing the software in use has been broadcast (Orden 2018) andreaders interested in the software can contact the corresponding author Moreoverthe implementation of a Python version and an R package are projected for thefuture
3 Results and discussion
31 Results and discussion by tasting session
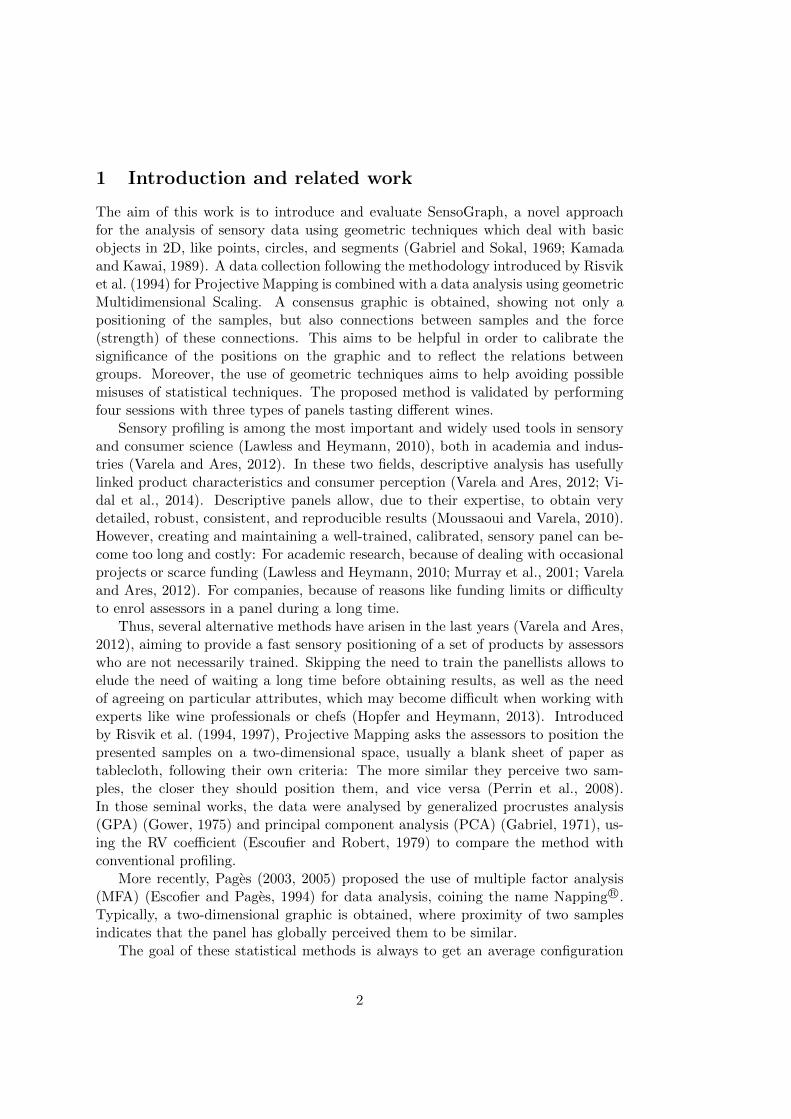
(A) Panel trained in Quantitative Descriptive Analysis (QDA)The data obtained by performing Projective Mapping with the panel trained inQDA of wine were processed both by MFA (Fig 3 left) and by SensoGraph (Fig 3right) For MFA the first two dimensions accounted for 6653 of the explainedvariance
Figure 3 Results for a first panel trained in QDA composed by eleven assessorsLeft MFA Right SensoGraph and gradient for the percentage of tablecloths inwhich each connection arises
At first glance the positionings provided by MFA and SensoGraph look similarGoing into details both graphics show a clear group 2-3-4 the corresponding ellipsesin MFA superimpose meaning that the assessors did not perceived a significantdifference among these three samples while in SensoGraph connections among 2-3-4 have arisen in between 55 and 64 of the tablecloths (May the reader beinterested in checking the actual numbers these are shown in Table 1)
In addition the graphic from MFA suggests a group 5-6-8 with non-emptyintersection for their ellipses and a further group 6-7 This connection 6-7 hasappeared in the 55 of the tablecloths in SensoGraph Further in SensoGraph the
8
connections in the group 5-6-8 have appeared in percentages from 27 to 45 ofthe tablecloths On the contrary the group 5-7-8 is more apparent its connectionshaving arisen in between the 36 and the 55 of the tablecloths
This is because the geometric clustering has joined the sample 5 to the sample 7in more tablecloths 55 than to the sample 6 only 27 It is interesting to notethat this is compatible with the confidence ellipses of samples 5 6 and 7 in theMFA graphic
(B) Panel receiving one training session in Projective MappingWith the aim of studying how the experience in the Projective Mapping method-ology affects the results MFA and SensoGraph were used to process both the dataobtained from a first Projective Mapping session with panellists having experiencein tasting wines Figure 4 and the data the same panel generated in a second ses-sion Figure 5 For MFA the first two dimensions accounted respectively for 5454(Fig 4 left) and 6148 (Fig 5 left) of the explained variance reflecting the effectof the experience achieved For this panel the comparison between MFA and Sen-soGraph positionings shows a higher coincidence when the percentage of explainedvariance is higher ie in the second session
Figure 4 Results for a panel without experience in the method composed by twelveassessors Left MFA Right SensoGraph and gradient for the percentage of table-cloths in which each connection arises
The graphics in Figure 4 are difficult to analyse even for a trained eye sinceneither MFA nor SensoGraph show clear groups The MFA plot shows the ellipsesof samples 2-3-4-5-7 superimposed while all of the ellipses of the remaining samples1 6 and 8 do in turn superimpose with some of the ellipses in the previous groupIn SensoGraph such a group of samples 2-3-4-5-7 appears indeed at the lower-right corner with connections ranging from the 8 of tablecloths joining 3-4 tothe 58 joining 4-7 Interestingly enough SensoGraph allows to distinguish thebehavior of sample 7 which turns out to be strongly connected to samples 2 34 and 5 in between the 42 and the 58 of the tablecloths from the behavior of
9
sample 4 which is poorly connected with samples 2 and 3 since these connectionsarise respectively only at the 25 and the 8 of the tablecloths
The situation for the repetition session is shown in Figure 5 where the samegroups 2-3-5-8 and 4-6-7 are apparent for MFA (left) and SensoGraph (right) withsample 1 clearly isolated In MFA the corresponding confidence ellipses do actuallyintersect while in SensoGraph connections in the group 2-3-5-8 have appeared inbetween the 33 and the 58 of the tablecloths and those in the group 4-6-7 rangebetween the 42 and the 58 Here it is interesting to note that sample 1 is betterconnected to the group 4-6-7 these connections appearing in between 25 and 42of the tablecloths than to the group 2-3-5-8 in between 8 and 33 (See Table 2for the global similarity matrices)
Figure 5 Results for a second session with the panel in Fig 4 Left MFA RightSensoGraph and gradient for the percentage of tablecloths in which each connectionarises
(C) Panel of habitual wine consumers tasting commercial wines
Again the data were analyzed by MFA and SensoGraph see Figure 6 For MFAthe first two dimensions accounted for 5062 The positionings provided by betweenMFA and SensoGraph are similar with samples 1-2 and 10 clearly separated fromthe others This sample 10 used only cv Monastrell and the samples 1-2 correspondto wines elaborated with only cv Tempranillo It is interesting to observe that thepairs of samples 1-2 and 5-7 are quite similar in the MFA map both according tothe distances d(1 2) and d(5 7) between the two samples and according to theircorresponding ellipses However the pair 5-7 appears farther apart in SensoGraphas can be checked at the global similarity matrix (Table 3) where the connection 1-2arises in an 88 of the tablecloths while the connection 5-7 arises in the 50 of themThis is consistent with samples 1-2 being elaborated with only cv Tempranillo whilesamples 5-7 differ in the grape variety one of them using only cv Mencıa and the
10
other being a blend of cv Tempranillo Garnacha and Graciano
12
3
4
5
6
7
8
9
10
10
20
30
40
50
60
70
80
90
100
Figure 6 Results for a panel composed by twenty-four habitual wine consumerstasting commercial wines Left MFA Right SensoGraph and gradient for thepercentage of tablecloths in which each connection arises
32 General discussion
As a summary of these four experiments it can be observed that the positioningsprovided by SensoGraph are similar to those obtained by MFA
Furthermore the more trained is the panel the more clear and similar are thegroups in the graphics given by SensoGraph and MFA This is consistent with thebehavior previously observed for statistical techniques since Liu et al (2016) re-ported that for Projective Mapping conducting training on either the method orthe product leads to more robust results Actually observing the percentages of ex-plained variance leads to the conclusion that the higher the total inertia the moresimilar are the positionings for MFA and SensoGraph
Note that for Step 3 it would be possible to use the Kamada-Kawai energy (Gansneret al 2004) which is indeed analogous to the stress introduced by Kruskal (1964ab)as an index of how well the graph drawing algorithm has drawn the data in the globalsimilarity matrix However this would miss the effect of the geometric clustering inStep 1 for which an index of fit is not available
In addition it is interesting that the graphic for the SensoGraph method intro-duced in this paper does not provide only the positions for the samples but also agraphical representation of the forces of connections as well as a global similaritymatrix These connections and forces provide a better understanding of the inter-actions between groups as already checked in different research fields (Beck et al2017 Conover et al 2011 Junghanns et al 2015) Further these connections andforces help to calibrate the significance of the positioning (Cadoret and Husson
11
2013) with the help of the global similarity matricesFor an example they allow to contrast the distances in the map with the infor-
mation of the tablecloths as discussed in the last panel above It is also interestingthat for the matrix in Table 1 there is only one entry which is 0 while for those inTables 2 and 3 there are no zero entries This means that almost all samples havebeen connected at least once Moreover the connections appearing in the maximumnumber of tablecloths do so respectively in 58 64 and 88 of the tableclothsThese two observations show a large amount of individual variation in the datawhich deserves further study
Finally concerning the usability of the SensoGraph method on one hand theProjective Mapping methodology for data collection has already distinguished asnatural and intuitive for the assessors (Ares et al 2011 Varela and Ares 2012Carrillo et al 2012) On the other hand the geometric techniques used for dataanalysis have been explained using basic geometric objects in 2D aiming to bereadily understood by researchers without any previous experience in the method
33 Computational efficiency
Furthermore all the geometric techniques used in this work are known to be ex-tremely efficient from a computational point of view (Cardinal et al 2009) In thefollowing the efficiency of the previous methods is analysed using the standard bigO notation from algorithmic complexity May the reader be unfamiliar with thisnotion a good reference is eg the book by Arora and Barak (2009) For the sakeof an easier reading a simplified explanation is also provided after the analysis
First the time complexity of SensoGraph is in O(AS log(S) + AS + S2) beingS the number of samples and A the number of assessors as before Each summandcomes from each of the three steps detailed in Subsection 222 as follows From thefirst step the computation for each of the A tablecloths of the Delaunay triangula-tion (de Berg et al 2008) of S samples in O(S logS) together with checking whichof them does actually fulfill the condition to appear in the Gabriel graph From thesecond step counting the number of appearances of each of the O(S) edges over theA tablecloths From the third step the algorithm by Kamada and Kawai (1989)takes O(S2) per each of the constant number of iterations stated in Subsection 23
With the number S of samples bounded in the order of tens it is the numberof assessors which can grow to the order of hundreds (Varela and Ares 2014) orbeyond Hence the complexity is dominated by the number A of assessors andtherefore the time complexity of SensoGraph is in O(A) ie linear in the numberof assessors On the contrary the time complexity of MFA is in O(A3) ie cubicin the number of assessors since it needs two rounds of PCA (Abdi et al 2013)whose time complexity is cubic (Feng et al 2000)
An explanation in short of these two complexities is the following Multiplyingthe number of assessors by a factor X the number of operations needed by Senso-Graph gets multiplied by X as well while the one needed by MFA gets multipliedby X3 For an example duplicating the number of assessors (ie X = 2) the
12
number of operations needed by SensoGraph gets duplicated as well while that ofMFA gets multiplied by 23 For another example if the number of assessors getsmultiplied by 10 so does the number of operations needed by SensoGraph whilethe number of operations needed by MFA gets multiplied by 103 The differencebetween these two growing rates is small for a number of assessors around 100 butapparent already for 200 and crucial when intending to work with a larger numberof assessors see Figure 7
Figure 7 Left Number of operations needed for a number of assessors up to 500Right Factor by which the number of operations gets multiplied when increasingby a factor the number of assessors (independently of the actual number of assessorsconsidered)
Working with a greater number of assessors is likely to become more relevantsince sensory analysis moves towards the use of untrained consumers to evaluateproducts (Valentin et al 2016) Thanks to its linear time complexity SensoGraphwould be able to handle even millions of tablecloths (de Berg et al 2008) and thisopens an interesting door towards massive sensory analysis using the Internet tocollect large datasets (Beck et al 2017 Conover et al 2011 Junghanns et al 2015)This feature can be particularly suitable for the comparison of pictures like eg theone performed by Mielby et al (2014) The use of photographs as surrogates ofsamples has been suggested by Maughan et al (2016) after proper validation of thephotographs
4 Conclusions
The main conclusion is that the use of geometric techniques can be an interestingcomplement to the use of statistics SensoGraph does not aim to substitute the useof statistics for the analysis of Projective Mapping data but to provide an additionalpoint of view for an enriched vision
The results obtained by SensoGraph are comparable to those given by the con-sensus maps obtained by MFA further providing information about the connections
13
between samples This extra information not provided by any of the previousmethods in the literature helps to a better understanding of the relations insideand between groups
In addition we obtain a global similarity matrix storing the information abouthow many tablecloths show a connection between two samples This is useful forinstance when in the MFA map the distance d(P1 Q1) between a pair of sam-ples P1 Q1 is very similar to the distance d(P2 Q2) between a different pair ofsamples P2 Q2 Comparing the two entries in the global similarity matrix allows tocheck whether the connections P1 minus Q1 and P2 minus Q2 do actually arise in a similarnumber of tablecloths or not
Finally the time complexity of SensoGraph is significantly lower than thatof MFA This allows to efficiently manage a number of tablecloths several ordersof magnitude above the one handled by MFA This feature is of particular interestprovided the increasing importance of consumers for the evaluation of existing andnew products opening a door to the analysis of massive sensory data A good ex-ample is the comparison of pictures as surrogates of samples via the Internet by ahuge amount of assessors
5 Acknowledgements
The authors want to gratefully thank professor Ferran Hurtado in memoriam forsuggesting that proximity graphs could be used for the analysis of tablecloths Theyalso want to thank David N de Miguel and Lucas Fox for implementing in a softwarethe methods used We are thankful for the very helpful comments and input fromtwo anonymous reviewers
All the authors have been supported by the University of Alcala grant CCGP2017-EXP015 In addition David Orden has been partially supported by MINECOProjects MTM2014-54207 and MTM2017-83750-P as well as by H2020-MSCA-RISEproject 734922 - CONNECT
Tables
bull 4 3 1 6 3 1 2
4 bull 7 6 1 0 4 4
3 7 bull 7 2 2 3 4
1 6 7 bull 4 7 3 1
6 1 2 4 bull 3 6 5
3 0 2 7 3 bull 6 4
1 4 3 3 6 6 bull 4
2 4 4 1 5 4 4 bull
Table 1 Global similarity matrix for Figure 3
14
bull 2 3 5 6 3 2 4
2 bull 5 3 2 4 6 3
3 5 bull 1 5 5 6 5
5 3 1 bull 6 3 7 5
6 2 5 6 bull 2 5 2
3 4 5 3 2 bull 3 3
2 6 6 7 5 3 bull 3
4 3 5 5 2 3 3 bull
bull 3 1 5 3 4 3 4
3 bull 5 5 7 4 6 4
1 5 bull 5 7 1 3 6
5 5 5 bull 1 5 7 1
3 7 7 1 bull 2 4 7
4 4 1 5 2 bull 7 5
3 6 3 7 4 7 bull 1
4 4 6 1 7 5 1 bull
Table 2 Global similarity matrices for Figures 4 (top) and 5 (bottom)
bull 21 6 6 8 5 7 4 11 3
21 bull 5 2 4 8 7 4 5 4
6 5 bull 10 9 9 8 10 10 9
6 2 10 bull 9 9 9 10 7 6
8 4 9 9 bull 10 12 10 11 7
5 8 9 9 10 bull 8 7 7 4
7 7 8 9 12 8 bull 8 7 2
4 4 10 10 10 7 8 bull 10 8
11 5 10 7 11 7 7 10 bull 8
3 4 9 6 7 4 2 8 8 bull
Table 3 Global similarity matrix for Figure 6
References
Abdi H Valentin D Chollet S and Chrea C (2007) Analyzing assessors andproducts in sorting tasks DISTATIS theory and applications Food Quality andPreference 18(4)627ndash640
Abdi H Williams L J and Valentin D (2013) Multiple factor analysis princi-pal component analysis for multitable and multiblock data sets Wiley Interdis-ciplinary reviews Computational statistics 5(2)149ndash179
Ares G Varela P Rado G and Gimenez A (2011) Are consumer profilingtechniques equivalent for some product categories The case of orange-flavouredpowdered drinks International Journal of Food Science amp Technology 46(8)1600ndash1608
15
Arora S and Barak B (2009) Computational complexity a modern approachCambridge University Press
Ballester J Dacremont C Le Fur Y and Etievant P (2005) The role ofolfaction in the elaboration and use of the chardonnay wine concept Food Qualityand Preference 16(4)351ndash359
Baumann A Fabian B Lessmann S and Holzberg L (2016) Twitter and thepolitical landscape - a graph analysis of German politicians In ECIS page 132
Beck F Burch M Diehl S and Weiskopf D (2017) A taxonomy and surveyof dynamic graph visualization In Computer Graphics Forum volume 36 pages133ndash159 Wiley Online Library
Becue-Bertaut M and Le S (2011) Analysis of multilingual labeled sorting tasksApplication to a cross-cultural study in wine industry Journal of Sensory Studies26(5)299ndash310
Buldu J Busquets J Martınez J Herrera-Diestra J Echegoyen I GaleanoJ Simas T and Luque J (2018) Using network science to analyze footballpassing networks dynamics space time and the multilayer nature of the gamePreprint arXiv180700534
Cadoret M and Husson F (2013) Construction and evaluation of confidenceellipses applied at sensory data Food Quality and Preference 28(1)106ndash115
Capoyleas V Rote G and Woeginger G (1991) Geometric clusterings Journalof Algorithms 12(2)341ndash356
Cardinal J Collette S and Langerman S (2009) Empty region graphs Com-putational Geometry 42(3)183ndash195
Carrillo E Varela P and Fiszman S (2012) Packaging information as a modu-lator of consumersrsquo perception of enriched and reduced-calorie biscuits in tastingand non-tasting tests Food Quality and Preference 25(2)105ndash115
Chollet S and Valentin D (2001) Impact of training on beer flavor perceptionand description Are trained and untrained subjects really different Journal ofSensory Studies 16(6)601ndash618
Chollet S Valentin D and Abdi H (2014) Free sorting task In Novel Techniquesin Sensory Characterization and Consumer Profiling chapter 8 pages 214ndash215CRC Press
Choo J Jiamthapthaksin R Chen C-s Celepcikay O U Giusti C and EickC F (2007) MOSAIC A proximity graph approach for agglomerative cluster-ing In International Conference on Data Warehousing and Knowledge Discoverypages 231ndash240 Springer
16
Conover M D Goncalves B Ratkiewicz J Flammini A and Menczer F(2011) Predicting the political alignment of Twitter users In Privacy Secu-rity Risk and Trust (PASSAT) and 2011 IEEE Third Inernational Conferenceon Social Computing (SocialCom) 2011 IEEE Third International Conferenceon pages 192ndash199 IEEE
de Berg M Cheong O van Kreveld M and Overmars M (2008) ComputationalGeometry Algorithms and Applications Springer-Verlag Berlin Heidelberg
de Miguel D N Orden D Fernandez-Fernandez E Vila-Crespo J andRodrıguez-Nogales J M (2013) SensoGraph Using proximity graphs for sensoryanalysis In Dıaz-Banez J M Garijo D Marquez A and Urrutia J editorsProceedings of the XV Spanish Meeting on Computational Geometry pages 69ndash72
DeJordy R Borgatti S P Roussin C and Halgin D S (2007) Visualizingproximity data Field Methods 19(3)239ndash263
Eades P Gutwenger C Hong S-H and Mutzel P (2010) Graph drawingalgorithms In Atallah M J and Blanton M editors Algorithms and Theoryof Computation Handbook chapter 6 pages 61ndash627 CRC Press Boca RatonFlorida
Escofier B and Pages J (1994) Multiple factor analysis (AFMULT package)Computational Statistics amp Data Analysis 18(1)121ndash140
Escoufier Y and Robert P (1979) Choosing variables and metrics by optimizingthe RV-coefficient In Rustagi J editor Optimising Methods in Statistics pages205ndash219 Academic Press
Falahee M and MacRae A (1995) Consumer appraisal of drinking water multi-dimensional scaling analysis Food Quality and Preference 6(4)327ndash332
Falahee M and MacRae A (1997) Perceptual variation among drinking watersThe reliability of sorting and ranking data for multidimensional scaling FoodQuality and Preference 8(5-6)389ndash394
Feng G-C Yuen P C and Dai D-Q (2000) Human face recognition using PCAon wavelet subband Journal of electronic imaging 9(2)226ndash234
Fruchterman T M and Reingold E M (1991) Graph drawing by force-directedplacement Software Practice and Experience 21(11)1129ndash1164
Gabriel K R (1971) The biplot graphic display of matrices with application toprincipal component analysis Biometrika 58(3)453ndash467
Gabriel K R and Sokal R R (1969) A new statistical approach to geographicvariation analysis Systematic Biology 18(3)259ndash278
17
Gansner E R Koren Y and North S (2004) Graph drawing by stress majoriza-tion In International Symposium on Graph Drawing pages 239ndash250 Springer
Gower J C (1975) Generalized procrustes analysis Psychometrika 40(1)33ndash51
Hopfer H and Heymann H (2013) A summary of projective mappingobservationsndashthe effect of replicates and shape and individual performance mea-surements Food Quality and Preference 28(1)164ndash181
Hu Y (2005) Efficient high-quality force-directed graph drawing MathematicaJournal 10(1)37ndash71
ISO 3591 (1977) Sensory analysis ndash Apparatus ndash Wine-tasting glass ISO 3591International Standardization Office Geneva Switzerland
ISO 8586 (2012) Sensory analysis ndash General guidelines for the selection trainingand monitoring of selected assessors and expert sensory assessors ISO 8586International Standardization Office Geneva Switzerland
ISO 8589 (2007) Sensory analysis ndash General guidance for the design of test roomsISO 8589 International Standardization Office Geneva Switzerland
Junghanns M Petermann A Gomez K and Rahm E (2015) GradoopScalable graph data management and analytics with hadoop arXiv preprintarXiv150600548
Kamada T and Kawai S (1989) An algorithm for drawing general undirectedgraphs Information Processing Letters 31(1)7ndash15
Kruskal J B (1964a) Multidimensional scaling by optimizing goodness of fit to anonmetric hypothesis Psychometrika 29(1)1ndash27
Kruskal J B (1964b) Nonmetric multidimensional scaling a numerical methodPsychometrika 29(2)115ndash129
Lawless H T and Heymann H (2010) Sensory evaluation of food Principles andpractices Springer Science amp Business Media
Le S and Husson F (2008) SensoMineR A package for sensory data analysisJournal of Sensory Studies 23(1)14ndash25
Le S Josse J and Husson F (2008) FactoMineR an R package for multivariateanalysis Journal of Statistical Software 25(1)1ndash18
Lelievre M Chollet S Abdi H and Valentin D (2008) What is the validityof the sorting task for describing beers A study using trained and untrainedassessors Food Quality and Preference 19(8)697ndash703
18
Lelievre M Chollet S Abdi H and Valentin D (2009) Beer-trained anduntrained assessors rely more on vision than on taste when they categorize beersChemosensory perception 2(3)143ndash153
Liu J Groslashnbeck M S Di Monaco R Giacalone D and Bredie W L (2016)Performance of Flash Profile and Napping with and without training for describingsmall sensory differences in a model wine Food Quality and Preference 4841ndash49
Louw L Malherbe S Naes T Lambrechts M van Rensburg P and NieuwoudtH (2013) Validation of two Napping Rcopy techniques as rapid sensory screening toolsfor high alcohol products Food Quality and Preference 30(2)192ndash201
Matula D W and Sokal R R (1980) Properties of Gabriel graphs relevant to ge-ographic variation research and the clustering of points in the plane GeographicalAnalysis 12(3)205ndash222
Maughan C Chambers IV E and Godwin S (2016) A procedure for validat-ing the use of photographs as surrogates for samples in sensory measurement ofappearance An example with color of cooked turkey patties Journal of SensoryStudies 31(6)507ndash513
Mielby L H Hopfer H Jensen S Thybo A K and Heymann H (2014)Comparison of descriptive analysis projective mapping and sorting performed onpictures of fruit and vegetable mixes Food quality and preference 3586ndash94
Moussaoui K A and Varela P (2010) Exploring consumer product profilingtechniques and their linkage to a quantitative descriptive analysis Food Qualityand Preference 21(8)1088ndash1099
Murray J Delahunty C and Baxter I (2001) Descriptive sensory analysis pastpresent and future Food Research International 34(6)461ndash471
Naeligs T Berget I Liland K H Ares G and Varela P (2017) Estimatingand interpreting more than two consensus components in projective mappingINDSCAL vs multiple factor analysis (MFA) Food Quality and Preference 5845ndash60
Nestrud M A and Lawless H T (2008) Perceptual mapping of citrus juices usingprojective mapping and profiling data from culinary professionals and consumersFood Quality and Preference 19(4)431ndash438
Orden D (2018) SensoGraph software for sensory data analysis httpsyoutubetsL0z8DWl9I Accessed 2018-05-30
Pages J (2003) Direct collection of sensory distances Application to the evaluationof ten white wines of the Loire Valley Sciences des Aliments 23679ndash688
19
Pages J (2005) Collection and analysis of perceived product inter-distances usingmultiple factor analysis Application to the study of 10 white wines from the LoireValley Food Quality and Preference 16(7)642ndash649
Pages J Cadoret M and Le S (2010) The sorted napping A new holisticapproach in sensory evaluation Journal of Sensory Studies 25(5)637ndash658
Perrin L and Pages J (2009) Construction of a product space from the Ultra-flashprofiling method application to ten red wines from the Loire Valley Journal ofSensory Studies 24(3)372ndash395
Perrin L Symoneaux R Maıtre I Asselin C Jourjon F and Pages J (2008)Comparison of three sensory methods for use with the Napping Rcopy procedure Caseof ten wines from Loire valley Food Quality and Preference 19(1)1ndash11
Piombino P Nicklaus S Le Fur Y Moio L and Le Quere J-L (2004) Selec-tion of products presenting given flavor characteristics An application to wineAmerican Journal of Enology and Viticulture 55(1)27ndash34
R Development Core Team (2007) R A language and environment for statisticalcomputing Available at http www R-project org
Reinbach H C Giacalone D Ribeiro L M Bredie W L and Froslashst M B(2014) Comparison of three sensory profiling methods based on consumer percep-tion CATA CATA with intensity and Napping Rcopy Food Quality and Preference32160ndash166
Risvik E McEwan J A Colwill J S Rogers R and Lyon D H (1994)Projective mapping A tool for sensory analysis and consumer research FoodQuality and Preference 5(4)263ndash269
Risvik E McEwan J A and Roslashdbotten M (1997) Evaluation of sensory profilingand projective mapping data Food Quality and Preference 8(1)63ndash71
Ross C F Weller K M and Alldredge J R (2012) Impact of serving temper-ature on sensory properties of red wine as evaluated using projective mapping bya trained panel Journal of Sensory Studies 27(6)463ndash470
Teillet E Schlich P Urbano C Cordelle S and Guichard E (2010) Sensorymethodologies and the taste of water Food Quality and Preference 21(8)967ndash976
The Electome and The Laboratory for Social Machines at the MIT Me-dia Lab (2016) Clinton and Trump supporters live in their own Twitterworlds httpsvice-prod-news-assetss3amazonawscomuploads2016
12TwitterData1-01png Accessed 2018-01-12
Torri L Dinnella C Recchia A Naes T Tuorila H and Monteleone E (2013)Projective Mapping for interpreting wine aroma differences as perceived by naıveand experienced assessors Food Quality and Preference 29(1)6ndash15
20
Urquhart R (1982) Graph theoretical clustering based on limited neighbourhoodsets Pattern recognition 15(3)173ndash187
Valentin D Cholet S Nestrud M and Abdi H (2016) Projective mappingand sorting tasks In Hort J Kemp S and Hollowood T editors DescriptiveAnalysis in Sensory Evaluation pages 1ndash19 Wiley-Blackwell
Varela P and Ares G (2012) Sensory profiling the blurred line between sensoryand consumer science A review of novel methods for product characterizationFood Research International 48(2)893ndash908
Varela P and Ares G (2014) Novel techniques in sensory characterization andconsumer profiling CRC Press
Veinand B Godefroy C Adam C and Delarue J (2011) Highlight of importantproduct characteristics for consumers Comparison of three sensory descriptivemethods performed by consumers Food Quality and Preference 22(5)474ndash485
Vidal L Cadena R S Antunez L Gimenez A Varela P and Ares G (2014)Stability of sample configurations from projective mapping How many consumersare necessary Food Quality and Preference 3479ndash87
21
- 1 Introduction and related work
- 2 Material and methods
-
- 21 Data collection
- 22 Data analysis
-
- 221 Statistical techniques
- 222 Geometric techniques
-
- 23 Software
-
- 3 Results and discussion
-
- 31 Results and discussion by tasting session
- 32 General discussion
- 33 Computational efficiency
-
- 4 Conclusions
- 5 Acknowledgements
-
1 Introduction and related work
The aim of this work is to introduce and evaluate SensoGraph a novel approachfor the analysis of sensory data using geometric techniques which deal with basicobjects in 2D like points circles and segments (Gabriel and Sokal 1969 Kamadaand Kawai 1989) A data collection following the methodology introduced by Risviket al (1994) for Projective Mapping is combined with a data analysis using geometricMultidimensional Scaling A consensus graphic is obtained showing not only apositioning of the samples but also connections between samples and the force(strength) of these connections This aims to be helpful in order to calibrate thesignificance of the positions on the graphic and to reflect the relations betweengroups Moreover the use of geometric techniques aims to help avoiding possiblemisuses of statistical techniques The proposed method is validated by performingfour sessions with three types of panels tasting different wines
Sensory profiling is among the most important and widely used tools in sensoryand consumer science (Lawless and Heymann 2010) both in academia and indus-tries (Varela and Ares 2012) In these two fields descriptive analysis has usefullylinked product characteristics and consumer perception (Varela and Ares 2012 Vi-dal et al 2014) Descriptive panels allow due to their expertise to obtain verydetailed robust consistent and reproducible results (Moussaoui and Varela 2010)However creating and maintaining a well-trained calibrated sensory panel can be-come too long and costly For academic research because of dealing with occasionalprojects or scarce funding (Lawless and Heymann 2010 Murray et al 2001 Varelaand Ares 2012) For companies because of reasons like funding limits or difficultyto enrol assessors in a panel during a long time
Thus several alternative methods have arisen in the last years (Varela and Ares2012) aiming to provide a fast sensory positioning of a set of products by assessorswho are not necessarily trained Skipping the need to train the panellists allows toelude the need of waiting a long time before obtaining results as well as the needof agreeing on particular attributes which may become difficult when working withexperts like wine professionals or chefs (Hopfer and Heymann 2013) Introducedby Risvik et al (1994 1997) Projective Mapping asks the assessors to position thepresented samples on a two-dimensional space usually a blank sheet of paper astablecloth following their own criteria The more similar they perceive two sam-ples the closer they should position them and vice versa (Perrin et al 2008)In those seminal works the data were analysed by generalized procrustes analysis(GPA) (Gower 1975) and principal component analysis (PCA) (Gabriel 1971) us-ing the RV coefficient (Escoufier and Robert 1979) to compare the method withconventional profiling
More recently Pages (2003 2005) proposed the use of multiple factor analysis(MFA) (Escofier and Pages 1994) for data analysis coining the name Napping RcopyTypically a two-dimensional graphic is obtained where proximity of two samplesindicates that the panel has globally perceived them to be similar
The goal of these statistical methods is always to get an average configuration
2
of products called consensus graphic so it is crucial to assess its stability Thus inorder to know whether two products are perceived as significantly different from asensory point of view the positions on the map given by these statistical methodsshould include a confidence area eg confidence ellipses (Cadoret and Husson2013)
Projective Mapping has been successfully used with many different kinds ofproducts among which the application to wine stands out (Piombino et al 2004Ballester et al 2005 Pages 2005 Perrin et al 2008 Perrin and Pages 2009 Becue-Bertaut and Le 2011 Ross et al 2012 Hopfer and Heymann 2013 Torri et al2013 Vidal et al 2014) Other examples of beverages analysed by these meth-ods are beers (Chollet and Valentin 2001 Abdi et al 2007 Lelievre et al 20082009 Reinbach et al 2014) citrus juices (Nestrud and Lawless 2008) drinkingwaters (Falahee and MacRae 1995 1997 Teillet et al 2010) high alcohol prod-ucts (Louw et al 2013) hot beverages (Moussaoui and Varela 2010) lemon icedteas (Veinand et al 2011) powdered juices (Ares et al 2011) or smoothies (Pageset al 2010) The book by Varela and Ares (2014) details more products to whichconsumer based descriptive methodologies have been applied
Until now all the methodologies proposed for fast sensory evaluation have usedstatistical techniques to perform the data analysis This paper introduces and eval-uates a novel approach a combination of geometric techniques to obtain a differentkind of consensus graphic here named SensoGraph The outcome is a graph rep-resentation which combines a positioning of the samples together with connectionsrepresenting the strength of the relations between them Such a kind of representa-tion is becoming more and more usual nowadays among other reasons because ofallowing dynamic data visualization (Beck et al 2017) being helpful for big datavisualization (Baumann et al 2016 Conover et al 2011 Junghanns et al 2015)and providing apparent graphics suitable for mass media (The Electome and TheLaboratory for Social Machines at the MIT Media Lab 2016) and the analysis ofsports (Buldu et al 2018)
2 Material and methods
21 Data collection
In order to validate this proposal a total of four tasting sessions using ProjectiveMapping (Risvik et al 1994 Pages 2005) have been performed with three typesof panels tasting different wines
(A) Panel trained in Quantitative Descriptive Analysis (QDA) A panel trainedin QDA of wine composed of eleven assessors tasted eight different red wines in onesession all of them elaborated at the winery of the School of Agricultural Engineeringof the University of Valladolid in Palencia (Spain) Four of the wines were fromcv Cabernet Sauvignon and the other four from cv Tempranillo all of them fromthe same vintage This panel was selected and trained using ISO 8586 (2012)
(B) Panel receiving one training session in Projective Mapping Another panel
3
composed of twelve assessors with experience in wine tasting performed two sessionsof Projective Mapping a first session without any experience in the method and arepetition The same eight red wines were used both for the training and for the finaltest all of them elaborated at the winery of the School of Agricultural Engineeringof the University of Valladolid in Palencia (Spain) using cv Tempranillo from Toroappellation (Spain) and the same vintage These eight wines were different fromthose tasted by the previous panel This panel was composed by students of theEnology degree at the University of Valladolid who had studied three academicyears of Enology including a course in Sensory Analysis
(C) Panel of habitual wine consumers tasting commercial wines A final panelcomposed of twenty-four habitual consumers of wine performed one session of Pro-jective Mapping They tasted nine commercial wines one of them duplicated Sevenof the wines used only one variety Three of them were cv Mencıa three more werecv Tempranillo (one of them from Toro appellation Spain) and another one wascv Monastrell The other two wines were a blend of varieties The duplicated wineused mainly cv Cabernet Franc together with cv Merlot Garnacha and Monas-trell The other wine was mainly cv Tempranillo blended with cv Garnacha andGraciano
For all the sessions the number of samples followed the recommendations of Valentinet al (2016) The samples were simultaneously presented to each assessor The pan-ellists were requested to position the wine samples on an A2 paper (60 times 40 cm)in such a way that two wine samples were to be placed close to each other if theyseemed sensorially similar and that two wines were to be distant from one another ifthey seemed sensorially different All of this according to the assessorrsquos own criteriafor what close or far mean
In all the sessions the samples were served as 25 mL aliquots in standardisedwineglasses (ISO 3591 1977) which were coded with 3-digit numbers and all thesamples were presented simultaneously using a randomized complete block designThe serving temperature was 14plusmn1C All these sensory evaluations were carriedout at the Sensory Science Laboratory of the School of Agricultural Engineeringat the University of Valladolid Palencia (Spain) in individual booths designed inaccordance with ISO 8589 (2007)
22 Data analysis
The x- and y-coordinates of each sample on the paper were measured from the left-bottom corner of the sheet These data were then stored in a table with S rows onefor each sample and 2A columns with A being the number of assessors
221 Statistical techniques
On one hand these data were analysed by statistical techniques with MFA asproposed by Pages (2005) using the R language (R Development Core Team 2007)and the FactoMineR package (Le et al 2008) MFA has become a common choice forthe analysis of Projective Mapping data (Varela and Ares 2014) and it has been
4
proved to be equal or better than other models like individual differences scaling(INDSCAL) for estimating the consensus configuration (Naeligs et al 2017) Finallyconfidence ellipses were constructed using truncated total bootstrapping (Cadoretand Husson 2013) with SensoMineR package (Le and Husson 2008)
222 Geometric techniques
On the other hand in order to analyse the data by geometric techniques we havedeveloped and applied the following method
Step 1 Geometric clustering (Capoyleas et al 1991) allows to group data usingbasic operations from two-dimensional geometry like drawing circles or segmentsWith the goal of analyzing each tablecloth to connections between the samples andafter exploring a large number of alternatives (de Miguel et al 2013) the Gabrielgraph (Gabriel and Sokal 1969) was chosen because of its good behavior and itsclustering abilities having been widely checked (Matula and Sokal 1980 Urquhart1982 Choo et al 2007)
For the construction of the Gabriel graph two samples PQ get connected if andonly if there is no other sample inside the closed disk having the straight segmentP minus Q as diameter Figure 1 shows how to construct a Gabriel graph Figure 2shows another example with four tablecloths (first row) and their correspondingGabriel graphs (second row)
12
34
56
7
12
34
56
7
Figure 1 Left Tablecloth positioning seven samples Right Construction of theassociated Gabriel graph
Recall that the assessors position the samples on the tablecloth without a com-mon metric criterion according to their own understanding of close and far For anexample look at the two leftmost tablecloths in the top row of Figure 2 The square1-2-3-4 shows different distances in the two tablecloths with samples 1-2 being muchcloser in the second picture than in the first one However at a glance we would saythat both tablecloths provide similar information namely a group 1-2-3-4 togetherwith the samples 5-6-7 getting further from that group
This is the kind of information extracted by the Gabriel graph which therefore
5
leads to the same graph for those two cases See the two leftmost pictures of thesecond row in Figure 2 which both show the same connections
Step 2 A global similarity matrix (Abdi et al 2007) was constructed Eachentry of the matrix stores for a pair of samples PQ how many tablecloths show aconnection P minusQ after the clustering step (eg entry 1 2 will equal the number oftablecloths in which the samples 1 and 2 are connected) Figure 2 illustrates (thirdrow left) the global similarity matrix from four tablecloths for which the clusteringGabriel graph has already been constructed (second row)
1
2
34
5
6
7
bull 3 2 4 2 0 2
3 bull 3 1 1 0 0
2 3 bull 4 1 0 1
4 1 4 bull 1 1 0
2 1 1 1 bull 3 0
0 0 0 1 3 bull 4
2 0 1 0 0 4 bull
Number of
connections
uarr
1Samplesdarr
2 3 4 5 6 7
1
rarr
23
45
6
7
12
34
567
7
6
5
1
3
24
1
2
3
4
5
6
776
5
13
24
12
34
567
7
6
5
1
3
24
1
2
3
4
5
6
776
5
13
24
Step 1Tablecloths fromprojective mapping
Step 2Geometric clusteringfrom Gabriel Graph
Step 3Global similarity matrix
Step 4Graph layout (SensoGraph)from Kamada-Kawai algorithm
Figure 2 First row Four hypothetical tablecloths from Projective Mapping Secondrow Geometric clustering obtained by the Gabriel Graph Third row left Globalsimilarity matrix For an example entry 1 2 has value 3 because the samples 1and 2 are connected in 3 of the tablecloths in the second row Third row right TheSensoGraph resulting graphic where distances between samples represent the globalsimilarity perceived Two clear groups 1-2-3-4 and 5-6-7 appear consistently withthe tablecloths on top In addition connections between samples can be checkedwith the connection forces being represented by thickness and opacity For an exam-ple the edge 1 minus 2 having force 3 is thicker and more opaque than the edge 2 minus 5whose force is 1 but thinner and more transparent than the edge 1 minus 4 of force 4
This global similarity matrix can alternatively be seen as encoding a graph inwhich entry i j stores the weight of the connection between vertices i and j
Step 3 A graph drawing algorithm (Eades et al 2010) was applied to the graphencoded by the global similarity matrix Graph drawing algorithms have been usedin social and behavioral sciences as a geometric alternative (DeJordy et al 2007)
6
to non-metric multidimensional scaling (Chollet et al 2014) Among the differentkinds of graph drawing algorithms the particular class of force-directed drawingalgorithms (Fruchterman and Reingold 1991 Hu 2005) has been the one chosenbecause of providing good results and being easy to understand
In this class of algorithms each entry PQ of the global similarity matrix modelsthe force of a spring which connects P minus Q and pulls those samples together withthat prescribed force The particular algorithm chosen has been the Kamada-Kawaialgorithm where the resulting system of forces is let to evolve until an equilibriumposition of the samples is reached Technical details can be checked at the paperby Kamada and Kawai (1989) but for a better understanding of this third stepthe reader can imagine that the samples are (1) pinned at arbitrary positions on atable (2) joined by springs with the forces specified in the matrix and (3) finallyunpinned all at the same time so that they evolve to an equilibrium position
Figure 2 shows a graphical sketch of these three steps The equilibrium posi-tion reached provides a consensus graphic here named SensoGraph which reflectsthe global opinion of the panel by positioning closer those samples that have beenglobally perceived as similar In addition the graphic shows the connections andrepresents their forces by the thickness and opacity of the corresponding segments(the actual values of the forces being attached as a matrix) This information al-lows to know how similar or different two products have been perceived playing therole of the confidence areas used by other methods in the literature (Cadoret andHusson 2013)
23 Software
In order to perform the three steps detailed above a new software was implementedFor convenience Microsoft Visual Studio together with the programming languageC were used to create an executable file for Windows which allows to visuallyopen the data spreadsheet and click a button to obtain the consensus graphic Thisallows to start using the software with a negligible learning curve
The implementation of Step 1 above followed a standard scheme for the construc-tion of the Gabriel graph (Gabriel and Sokal 1969) computing first the Delaunaytriangulation (de Berg et al 2008) and then traversing its edges to check whichof them fulfill the Gabriel graph defining condition (that there is no other sampleinside the closed disk having that edge as diameter as stated in Step 1) Note thatthis is an exact algorithm and hence there are no parameters to be chosen
Implementing Step 2 was straightforward just needing to run through the Gabrielgraphs obtained updating the counters for the appearances of each edge and stor-ing the results as a matrix Finally for Step 3 the algorithm in the seminal paperby Kamada and Kawai (1989) was used This algorithm does need the followingchoices of parameters The desirable length L of an edge in the outcome for whichthe diameter of the tablecloths was used as suggested in Eq (3) in the referenceA constant K = 100 used to define the strengths of the springs as in Eq (4) inthe reference which determines how strongly the edges tend to the desirable length
7
Finally a maximum number C = 1000 of iterations and a threshold ε = 01 werechosen for the stopping condition of the algorithm All these choices are ratherstandard since our tests did not show huge variability among different choices
A video showing the software in use has been broadcast (Orden 2018) andreaders interested in the software can contact the corresponding author Moreoverthe implementation of a Python version and an R package are projected for thefuture
3 Results and discussion
31 Results and discussion by tasting session
(A) Panel trained in Quantitative Descriptive Analysis (QDA)The data obtained by performing Projective Mapping with the panel trained inQDA of wine were processed both by MFA (Fig 3 left) and by SensoGraph (Fig 3right) For MFA the first two dimensions accounted for 6653 of the explainedvariance
Figure 3 Results for a first panel trained in QDA composed by eleven assessorsLeft MFA Right SensoGraph and gradient for the percentage of tablecloths inwhich each connection arises
At first glance the positionings provided by MFA and SensoGraph look similarGoing into details both graphics show a clear group 2-3-4 the corresponding ellipsesin MFA superimpose meaning that the assessors did not perceived a significantdifference among these three samples while in SensoGraph connections among 2-3-4 have arisen in between 55 and 64 of the tablecloths (May the reader beinterested in checking the actual numbers these are shown in Table 1)
In addition the graphic from MFA suggests a group 5-6-8 with non-emptyintersection for their ellipses and a further group 6-7 This connection 6-7 hasappeared in the 55 of the tablecloths in SensoGraph Further in SensoGraph the
8
connections in the group 5-6-8 have appeared in percentages from 27 to 45 ofthe tablecloths On the contrary the group 5-7-8 is more apparent its connectionshaving arisen in between the 36 and the 55 of the tablecloths
This is because the geometric clustering has joined the sample 5 to the sample 7in more tablecloths 55 than to the sample 6 only 27 It is interesting to notethat this is compatible with the confidence ellipses of samples 5 6 and 7 in theMFA graphic
(B) Panel receiving one training session in Projective MappingWith the aim of studying how the experience in the Projective Mapping method-ology affects the results MFA and SensoGraph were used to process both the dataobtained from a first Projective Mapping session with panellists having experiencein tasting wines Figure 4 and the data the same panel generated in a second ses-sion Figure 5 For MFA the first two dimensions accounted respectively for 5454(Fig 4 left) and 6148 (Fig 5 left) of the explained variance reflecting the effectof the experience achieved For this panel the comparison between MFA and Sen-soGraph positionings shows a higher coincidence when the percentage of explainedvariance is higher ie in the second session
Figure 4 Results for a panel without experience in the method composed by twelveassessors Left MFA Right SensoGraph and gradient for the percentage of table-cloths in which each connection arises
The graphics in Figure 4 are difficult to analyse even for a trained eye sinceneither MFA nor SensoGraph show clear groups The MFA plot shows the ellipsesof samples 2-3-4-5-7 superimposed while all of the ellipses of the remaining samples1 6 and 8 do in turn superimpose with some of the ellipses in the previous groupIn SensoGraph such a group of samples 2-3-4-5-7 appears indeed at the lower-right corner with connections ranging from the 8 of tablecloths joining 3-4 tothe 58 joining 4-7 Interestingly enough SensoGraph allows to distinguish thebehavior of sample 7 which turns out to be strongly connected to samples 2 34 and 5 in between the 42 and the 58 of the tablecloths from the behavior of
9
sample 4 which is poorly connected with samples 2 and 3 since these connectionsarise respectively only at the 25 and the 8 of the tablecloths
The situation for the repetition session is shown in Figure 5 where the samegroups 2-3-5-8 and 4-6-7 are apparent for MFA (left) and SensoGraph (right) withsample 1 clearly isolated In MFA the corresponding confidence ellipses do actuallyintersect while in SensoGraph connections in the group 2-3-5-8 have appeared inbetween the 33 and the 58 of the tablecloths and those in the group 4-6-7 rangebetween the 42 and the 58 Here it is interesting to note that sample 1 is betterconnected to the group 4-6-7 these connections appearing in between 25 and 42of the tablecloths than to the group 2-3-5-8 in between 8 and 33 (See Table 2for the global similarity matrices)
Figure 5 Results for a second session with the panel in Fig 4 Left MFA RightSensoGraph and gradient for the percentage of tablecloths in which each connectionarises
(C) Panel of habitual wine consumers tasting commercial wines
Again the data were analyzed by MFA and SensoGraph see Figure 6 For MFAthe first two dimensions accounted for 5062 The positionings provided by betweenMFA and SensoGraph are similar with samples 1-2 and 10 clearly separated fromthe others This sample 10 used only cv Monastrell and the samples 1-2 correspondto wines elaborated with only cv Tempranillo It is interesting to observe that thepairs of samples 1-2 and 5-7 are quite similar in the MFA map both according tothe distances d(1 2) and d(5 7) between the two samples and according to theircorresponding ellipses However the pair 5-7 appears farther apart in SensoGraphas can be checked at the global similarity matrix (Table 3) where the connection 1-2arises in an 88 of the tablecloths while the connection 5-7 arises in the 50 of themThis is consistent with samples 1-2 being elaborated with only cv Tempranillo whilesamples 5-7 differ in the grape variety one of them using only cv Mencıa and the
10
other being a blend of cv Tempranillo Garnacha and Graciano
12
3
4
5
6
7
8
9
10
10
20
30
40
50
60
70
80
90
100
Figure 6 Results for a panel composed by twenty-four habitual wine consumerstasting commercial wines Left MFA Right SensoGraph and gradient for thepercentage of tablecloths in which each connection arises
32 General discussion
As a summary of these four experiments it can be observed that the positioningsprovided by SensoGraph are similar to those obtained by MFA
Furthermore the more trained is the panel the more clear and similar are thegroups in the graphics given by SensoGraph and MFA This is consistent with thebehavior previously observed for statistical techniques since Liu et al (2016) re-ported that for Projective Mapping conducting training on either the method orthe product leads to more robust results Actually observing the percentages of ex-plained variance leads to the conclusion that the higher the total inertia the moresimilar are the positionings for MFA and SensoGraph
Note that for Step 3 it would be possible to use the Kamada-Kawai energy (Gansneret al 2004) which is indeed analogous to the stress introduced by Kruskal (1964ab)as an index of how well the graph drawing algorithm has drawn the data in the globalsimilarity matrix However this would miss the effect of the geometric clustering inStep 1 for which an index of fit is not available
In addition it is interesting that the graphic for the SensoGraph method intro-duced in this paper does not provide only the positions for the samples but also agraphical representation of the forces of connections as well as a global similaritymatrix These connections and forces provide a better understanding of the inter-actions between groups as already checked in different research fields (Beck et al2017 Conover et al 2011 Junghanns et al 2015) Further these connections andforces help to calibrate the significance of the positioning (Cadoret and Husson
11
2013) with the help of the global similarity matricesFor an example they allow to contrast the distances in the map with the infor-
mation of the tablecloths as discussed in the last panel above It is also interestingthat for the matrix in Table 1 there is only one entry which is 0 while for those inTables 2 and 3 there are no zero entries This means that almost all samples havebeen connected at least once Moreover the connections appearing in the maximumnumber of tablecloths do so respectively in 58 64 and 88 of the tableclothsThese two observations show a large amount of individual variation in the datawhich deserves further study
Finally concerning the usability of the SensoGraph method on one hand theProjective Mapping methodology for data collection has already distinguished asnatural and intuitive for the assessors (Ares et al 2011 Varela and Ares 2012Carrillo et al 2012) On the other hand the geometric techniques used for dataanalysis have been explained using basic geometric objects in 2D aiming to bereadily understood by researchers without any previous experience in the method
33 Computational efficiency
Furthermore all the geometric techniques used in this work are known to be ex-tremely efficient from a computational point of view (Cardinal et al 2009) In thefollowing the efficiency of the previous methods is analysed using the standard bigO notation from algorithmic complexity May the reader be unfamiliar with thisnotion a good reference is eg the book by Arora and Barak (2009) For the sakeof an easier reading a simplified explanation is also provided after the analysis
First the time complexity of SensoGraph is in O(AS log(S) + AS + S2) beingS the number of samples and A the number of assessors as before Each summandcomes from each of the three steps detailed in Subsection 222 as follows From thefirst step the computation for each of the A tablecloths of the Delaunay triangula-tion (de Berg et al 2008) of S samples in O(S logS) together with checking whichof them does actually fulfill the condition to appear in the Gabriel graph From thesecond step counting the number of appearances of each of the O(S) edges over theA tablecloths From the third step the algorithm by Kamada and Kawai (1989)takes O(S2) per each of the constant number of iterations stated in Subsection 23
With the number S of samples bounded in the order of tens it is the numberof assessors which can grow to the order of hundreds (Varela and Ares 2014) orbeyond Hence the complexity is dominated by the number A of assessors andtherefore the time complexity of SensoGraph is in O(A) ie linear in the numberof assessors On the contrary the time complexity of MFA is in O(A3) ie cubicin the number of assessors since it needs two rounds of PCA (Abdi et al 2013)whose time complexity is cubic (Feng et al 2000)
An explanation in short of these two complexities is the following Multiplyingthe number of assessors by a factor X the number of operations needed by Senso-Graph gets multiplied by X as well while the one needed by MFA gets multipliedby X3 For an example duplicating the number of assessors (ie X = 2) the
12
number of operations needed by SensoGraph gets duplicated as well while that ofMFA gets multiplied by 23 For another example if the number of assessors getsmultiplied by 10 so does the number of operations needed by SensoGraph whilethe number of operations needed by MFA gets multiplied by 103 The differencebetween these two growing rates is small for a number of assessors around 100 butapparent already for 200 and crucial when intending to work with a larger numberof assessors see Figure 7
Figure 7 Left Number of operations needed for a number of assessors up to 500Right Factor by which the number of operations gets multiplied when increasingby a factor the number of assessors (independently of the actual number of assessorsconsidered)
Working with a greater number of assessors is likely to become more relevantsince sensory analysis moves towards the use of untrained consumers to evaluateproducts (Valentin et al 2016) Thanks to its linear time complexity SensoGraphwould be able to handle even millions of tablecloths (de Berg et al 2008) and thisopens an interesting door towards massive sensory analysis using the Internet tocollect large datasets (Beck et al 2017 Conover et al 2011 Junghanns et al 2015)This feature can be particularly suitable for the comparison of pictures like eg theone performed by Mielby et al (2014) The use of photographs as surrogates ofsamples has been suggested by Maughan et al (2016) after proper validation of thephotographs
4 Conclusions
The main conclusion is that the use of geometric techniques can be an interestingcomplement to the use of statistics SensoGraph does not aim to substitute the useof statistics for the analysis of Projective Mapping data but to provide an additionalpoint of view for an enriched vision
The results obtained by SensoGraph are comparable to those given by the con-sensus maps obtained by MFA further providing information about the connections
13
between samples This extra information not provided by any of the previousmethods in the literature helps to a better understanding of the relations insideand between groups
In addition we obtain a global similarity matrix storing the information abouthow many tablecloths show a connection between two samples This is useful forinstance when in the MFA map the distance d(P1 Q1) between a pair of sam-ples P1 Q1 is very similar to the distance d(P2 Q2) between a different pair ofsamples P2 Q2 Comparing the two entries in the global similarity matrix allows tocheck whether the connections P1 minus Q1 and P2 minus Q2 do actually arise in a similarnumber of tablecloths or not
Finally the time complexity of SensoGraph is significantly lower than thatof MFA This allows to efficiently manage a number of tablecloths several ordersof magnitude above the one handled by MFA This feature is of particular interestprovided the increasing importance of consumers for the evaluation of existing andnew products opening a door to the analysis of massive sensory data A good ex-ample is the comparison of pictures as surrogates of samples via the Internet by ahuge amount of assessors
5 Acknowledgements
The authors want to gratefully thank professor Ferran Hurtado in memoriam forsuggesting that proximity graphs could be used for the analysis of tablecloths Theyalso want to thank David N de Miguel and Lucas Fox for implementing in a softwarethe methods used We are thankful for the very helpful comments and input fromtwo anonymous reviewers
All the authors have been supported by the University of Alcala grant CCGP2017-EXP015 In addition David Orden has been partially supported by MINECOProjects MTM2014-54207 and MTM2017-83750-P as well as by H2020-MSCA-RISEproject 734922 - CONNECT
Tables
bull 4 3 1 6 3 1 2
4 bull 7 6 1 0 4 4
3 7 bull 7 2 2 3 4
1 6 7 bull 4 7 3 1
6 1 2 4 bull 3 6 5
3 0 2 7 3 bull 6 4
1 4 3 3 6 6 bull 4
2 4 4 1 5 4 4 bull
Table 1 Global similarity matrix for Figure 3
14
bull 2 3 5 6 3 2 4
2 bull 5 3 2 4 6 3
3 5 bull 1 5 5 6 5
5 3 1 bull 6 3 7 5
6 2 5 6 bull 2 5 2
3 4 5 3 2 bull 3 3
2 6 6 7 5 3 bull 3
4 3 5 5 2 3 3 bull
bull 3 1 5 3 4 3 4
3 bull 5 5 7 4 6 4
1 5 bull 5 7 1 3 6
5 5 5 bull 1 5 7 1
3 7 7 1 bull 2 4 7
4 4 1 5 2 bull 7 5
3 6 3 7 4 7 bull 1
4 4 6 1 7 5 1 bull
Table 2 Global similarity matrices for Figures 4 (top) and 5 (bottom)
bull 21 6 6 8 5 7 4 11 3
21 bull 5 2 4 8 7 4 5 4
6 5 bull 10 9 9 8 10 10 9
6 2 10 bull 9 9 9 10 7 6
8 4 9 9 bull 10 12 10 11 7
5 8 9 9 10 bull 8 7 7 4
7 7 8 9 12 8 bull 8 7 2
4 4 10 10 10 7 8 bull 10 8
11 5 10 7 11 7 7 10 bull 8
3 4 9 6 7 4 2 8 8 bull
Table 3 Global similarity matrix for Figure 6
References
Abdi H Valentin D Chollet S and Chrea C (2007) Analyzing assessors andproducts in sorting tasks DISTATIS theory and applications Food Quality andPreference 18(4)627ndash640
Abdi H Williams L J and Valentin D (2013) Multiple factor analysis princi-pal component analysis for multitable and multiblock data sets Wiley Interdis-ciplinary reviews Computational statistics 5(2)149ndash179
Ares G Varela P Rado G and Gimenez A (2011) Are consumer profilingtechniques equivalent for some product categories The case of orange-flavouredpowdered drinks International Journal of Food Science amp Technology 46(8)1600ndash1608
15
Arora S and Barak B (2009) Computational complexity a modern approachCambridge University Press
Ballester J Dacremont C Le Fur Y and Etievant P (2005) The role ofolfaction in the elaboration and use of the chardonnay wine concept Food Qualityand Preference 16(4)351ndash359
Baumann A Fabian B Lessmann S and Holzberg L (2016) Twitter and thepolitical landscape - a graph analysis of German politicians In ECIS page 132
Beck F Burch M Diehl S and Weiskopf D (2017) A taxonomy and surveyof dynamic graph visualization In Computer Graphics Forum volume 36 pages133ndash159 Wiley Online Library
Becue-Bertaut M and Le S (2011) Analysis of multilingual labeled sorting tasksApplication to a cross-cultural study in wine industry Journal of Sensory Studies26(5)299ndash310
Buldu J Busquets J Martınez J Herrera-Diestra J Echegoyen I GaleanoJ Simas T and Luque J (2018) Using network science to analyze footballpassing networks dynamics space time and the multilayer nature of the gamePreprint arXiv180700534
Cadoret M and Husson F (2013) Construction and evaluation of confidenceellipses applied at sensory data Food Quality and Preference 28(1)106ndash115
Capoyleas V Rote G and Woeginger G (1991) Geometric clusterings Journalof Algorithms 12(2)341ndash356
Cardinal J Collette S and Langerman S (2009) Empty region graphs Com-putational Geometry 42(3)183ndash195
Carrillo E Varela P and Fiszman S (2012) Packaging information as a modu-lator of consumersrsquo perception of enriched and reduced-calorie biscuits in tastingand non-tasting tests Food Quality and Preference 25(2)105ndash115
Chollet S and Valentin D (2001) Impact of training on beer flavor perceptionand description Are trained and untrained subjects really different Journal ofSensory Studies 16(6)601ndash618
Chollet S Valentin D and Abdi H (2014) Free sorting task In Novel Techniquesin Sensory Characterization and Consumer Profiling chapter 8 pages 214ndash215CRC Press
Choo J Jiamthapthaksin R Chen C-s Celepcikay O U Giusti C and EickC F (2007) MOSAIC A proximity graph approach for agglomerative cluster-ing In International Conference on Data Warehousing and Knowledge Discoverypages 231ndash240 Springer
16
Conover M D Goncalves B Ratkiewicz J Flammini A and Menczer F(2011) Predicting the political alignment of Twitter users In Privacy Secu-rity Risk and Trust (PASSAT) and 2011 IEEE Third Inernational Conferenceon Social Computing (SocialCom) 2011 IEEE Third International Conferenceon pages 192ndash199 IEEE
de Berg M Cheong O van Kreveld M and Overmars M (2008) ComputationalGeometry Algorithms and Applications Springer-Verlag Berlin Heidelberg
de Miguel D N Orden D Fernandez-Fernandez E Vila-Crespo J andRodrıguez-Nogales J M (2013) SensoGraph Using proximity graphs for sensoryanalysis In Dıaz-Banez J M Garijo D Marquez A and Urrutia J editorsProceedings of the XV Spanish Meeting on Computational Geometry pages 69ndash72
DeJordy R Borgatti S P Roussin C and Halgin D S (2007) Visualizingproximity data Field Methods 19(3)239ndash263
Eades P Gutwenger C Hong S-H and Mutzel P (2010) Graph drawingalgorithms In Atallah M J and Blanton M editors Algorithms and Theoryof Computation Handbook chapter 6 pages 61ndash627 CRC Press Boca RatonFlorida
Escofier B and Pages J (1994) Multiple factor analysis (AFMULT package)Computational Statistics amp Data Analysis 18(1)121ndash140
Escoufier Y and Robert P (1979) Choosing variables and metrics by optimizingthe RV-coefficient In Rustagi J editor Optimising Methods in Statistics pages205ndash219 Academic Press
Falahee M and MacRae A (1995) Consumer appraisal of drinking water multi-dimensional scaling analysis Food Quality and Preference 6(4)327ndash332
Falahee M and MacRae A (1997) Perceptual variation among drinking watersThe reliability of sorting and ranking data for multidimensional scaling FoodQuality and Preference 8(5-6)389ndash394
Feng G-C Yuen P C and Dai D-Q (2000) Human face recognition using PCAon wavelet subband Journal of electronic imaging 9(2)226ndash234
Fruchterman T M and Reingold E M (1991) Graph drawing by force-directedplacement Software Practice and Experience 21(11)1129ndash1164
Gabriel K R (1971) The biplot graphic display of matrices with application toprincipal component analysis Biometrika 58(3)453ndash467
Gabriel K R and Sokal R R (1969) A new statistical approach to geographicvariation analysis Systematic Biology 18(3)259ndash278
17
Gansner E R Koren Y and North S (2004) Graph drawing by stress majoriza-tion In International Symposium on Graph Drawing pages 239ndash250 Springer
Gower J C (1975) Generalized procrustes analysis Psychometrika 40(1)33ndash51
Hopfer H and Heymann H (2013) A summary of projective mappingobservationsndashthe effect of replicates and shape and individual performance mea-surements Food Quality and Preference 28(1)164ndash181
Hu Y (2005) Efficient high-quality force-directed graph drawing MathematicaJournal 10(1)37ndash71
ISO 3591 (1977) Sensory analysis ndash Apparatus ndash Wine-tasting glass ISO 3591International Standardization Office Geneva Switzerland
ISO 8586 (2012) Sensory analysis ndash General guidelines for the selection trainingand monitoring of selected assessors and expert sensory assessors ISO 8586International Standardization Office Geneva Switzerland
ISO 8589 (2007) Sensory analysis ndash General guidance for the design of test roomsISO 8589 International Standardization Office Geneva Switzerland
Junghanns M Petermann A Gomez K and Rahm E (2015) GradoopScalable graph data management and analytics with hadoop arXiv preprintarXiv150600548
Kamada T and Kawai S (1989) An algorithm for drawing general undirectedgraphs Information Processing Letters 31(1)7ndash15
Kruskal J B (1964a) Multidimensional scaling by optimizing goodness of fit to anonmetric hypothesis Psychometrika 29(1)1ndash27
Kruskal J B (1964b) Nonmetric multidimensional scaling a numerical methodPsychometrika 29(2)115ndash129
Lawless H T and Heymann H (2010) Sensory evaluation of food Principles andpractices Springer Science amp Business Media
Le S and Husson F (2008) SensoMineR A package for sensory data analysisJournal of Sensory Studies 23(1)14ndash25
Le S Josse J and Husson F (2008) FactoMineR an R package for multivariateanalysis Journal of Statistical Software 25(1)1ndash18
Lelievre M Chollet S Abdi H and Valentin D (2008) What is the validityof the sorting task for describing beers A study using trained and untrainedassessors Food Quality and Preference 19(8)697ndash703
18
Lelievre M Chollet S Abdi H and Valentin D (2009) Beer-trained anduntrained assessors rely more on vision than on taste when they categorize beersChemosensory perception 2(3)143ndash153
Liu J Groslashnbeck M S Di Monaco R Giacalone D and Bredie W L (2016)Performance of Flash Profile and Napping with and without training for describingsmall sensory differences in a model wine Food Quality and Preference 4841ndash49
Louw L Malherbe S Naes T Lambrechts M van Rensburg P and NieuwoudtH (2013) Validation of two Napping Rcopy techniques as rapid sensory screening toolsfor high alcohol products Food Quality and Preference 30(2)192ndash201
Matula D W and Sokal R R (1980) Properties of Gabriel graphs relevant to ge-ographic variation research and the clustering of points in the plane GeographicalAnalysis 12(3)205ndash222
Maughan C Chambers IV E and Godwin S (2016) A procedure for validat-ing the use of photographs as surrogates for samples in sensory measurement ofappearance An example with color of cooked turkey patties Journal of SensoryStudies 31(6)507ndash513
Mielby L H Hopfer H Jensen S Thybo A K and Heymann H (2014)Comparison of descriptive analysis projective mapping and sorting performed onpictures of fruit and vegetable mixes Food quality and preference 3586ndash94
Moussaoui K A and Varela P (2010) Exploring consumer product profilingtechniques and their linkage to a quantitative descriptive analysis Food Qualityand Preference 21(8)1088ndash1099
Murray J Delahunty C and Baxter I (2001) Descriptive sensory analysis pastpresent and future Food Research International 34(6)461ndash471
Naeligs T Berget I Liland K H Ares G and Varela P (2017) Estimatingand interpreting more than two consensus components in projective mappingINDSCAL vs multiple factor analysis (MFA) Food Quality and Preference 5845ndash60
Nestrud M A and Lawless H T (2008) Perceptual mapping of citrus juices usingprojective mapping and profiling data from culinary professionals and consumersFood Quality and Preference 19(4)431ndash438
Orden D (2018) SensoGraph software for sensory data analysis httpsyoutubetsL0z8DWl9I Accessed 2018-05-30
Pages J (2003) Direct collection of sensory distances Application to the evaluationof ten white wines of the Loire Valley Sciences des Aliments 23679ndash688
19
Pages J (2005) Collection and analysis of perceived product inter-distances usingmultiple factor analysis Application to the study of 10 white wines from the LoireValley Food Quality and Preference 16(7)642ndash649
Pages J Cadoret M and Le S (2010) The sorted napping A new holisticapproach in sensory evaluation Journal of Sensory Studies 25(5)637ndash658
Perrin L and Pages J (2009) Construction of a product space from the Ultra-flashprofiling method application to ten red wines from the Loire Valley Journal ofSensory Studies 24(3)372ndash395
Perrin L Symoneaux R Maıtre I Asselin C Jourjon F and Pages J (2008)Comparison of three sensory methods for use with the Napping Rcopy procedure Caseof ten wines from Loire valley Food Quality and Preference 19(1)1ndash11
Piombino P Nicklaus S Le Fur Y Moio L and Le Quere J-L (2004) Selec-tion of products presenting given flavor characteristics An application to wineAmerican Journal of Enology and Viticulture 55(1)27ndash34
R Development Core Team (2007) R A language and environment for statisticalcomputing Available at http www R-project org
Reinbach H C Giacalone D Ribeiro L M Bredie W L and Froslashst M B(2014) Comparison of three sensory profiling methods based on consumer percep-tion CATA CATA with intensity and Napping Rcopy Food Quality and Preference32160ndash166
Risvik E McEwan J A Colwill J S Rogers R and Lyon D H (1994)Projective mapping A tool for sensory analysis and consumer research FoodQuality and Preference 5(4)263ndash269
Risvik E McEwan J A and Roslashdbotten M (1997) Evaluation of sensory profilingand projective mapping data Food Quality and Preference 8(1)63ndash71
Ross C F Weller K M and Alldredge J R (2012) Impact of serving temper-ature on sensory properties of red wine as evaluated using projective mapping bya trained panel Journal of Sensory Studies 27(6)463ndash470
Teillet E Schlich P Urbano C Cordelle S and Guichard E (2010) Sensorymethodologies and the taste of water Food Quality and Preference 21(8)967ndash976
The Electome and The Laboratory for Social Machines at the MIT Me-dia Lab (2016) Clinton and Trump supporters live in their own Twitterworlds httpsvice-prod-news-assetss3amazonawscomuploads2016
12TwitterData1-01png Accessed 2018-01-12
Torri L Dinnella C Recchia A Naes T Tuorila H and Monteleone E (2013)Projective Mapping for interpreting wine aroma differences as perceived by naıveand experienced assessors Food Quality and Preference 29(1)6ndash15
20
Urquhart R (1982) Graph theoretical clustering based on limited neighbourhoodsets Pattern recognition 15(3)173ndash187
Valentin D Cholet S Nestrud M and Abdi H (2016) Projective mappingand sorting tasks In Hort J Kemp S and Hollowood T editors DescriptiveAnalysis in Sensory Evaluation pages 1ndash19 Wiley-Blackwell
Varela P and Ares G (2012) Sensory profiling the blurred line between sensoryand consumer science A review of novel methods for product characterizationFood Research International 48(2)893ndash908
Varela P and Ares G (2014) Novel techniques in sensory characterization andconsumer profiling CRC Press
Veinand B Godefroy C Adam C and Delarue J (2011) Highlight of importantproduct characteristics for consumers Comparison of three sensory descriptivemethods performed by consumers Food Quality and Preference 22(5)474ndash485
Vidal L Cadena R S Antunez L Gimenez A Varela P and Ares G (2014)Stability of sample configurations from projective mapping How many consumersare necessary Food Quality and Preference 3479ndash87
21
- 1 Introduction and related work
- 2 Material and methods
-
- 21 Data collection
- 22 Data analysis
-
- 221 Statistical techniques
- 222 Geometric techniques
-
- 23 Software
-
- 3 Results and discussion
-
- 31 Results and discussion by tasting session
- 32 General discussion
- 33 Computational efficiency
-
- 4 Conclusions
- 5 Acknowledgements
-
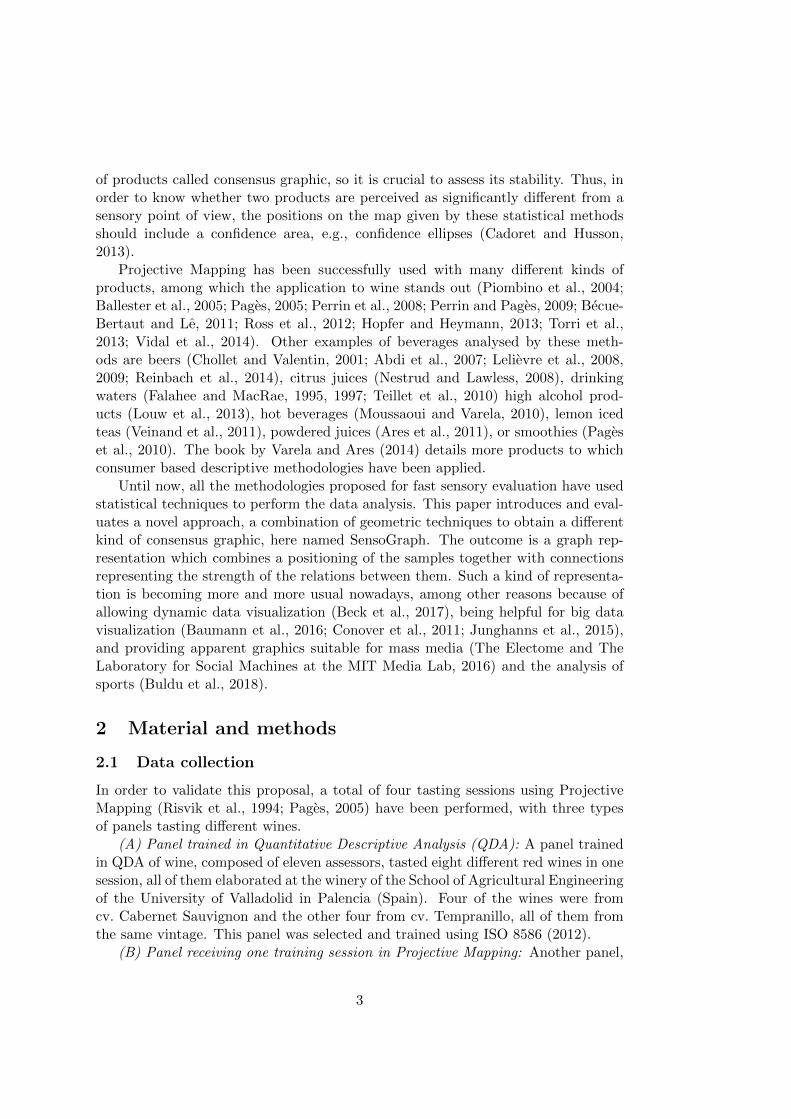
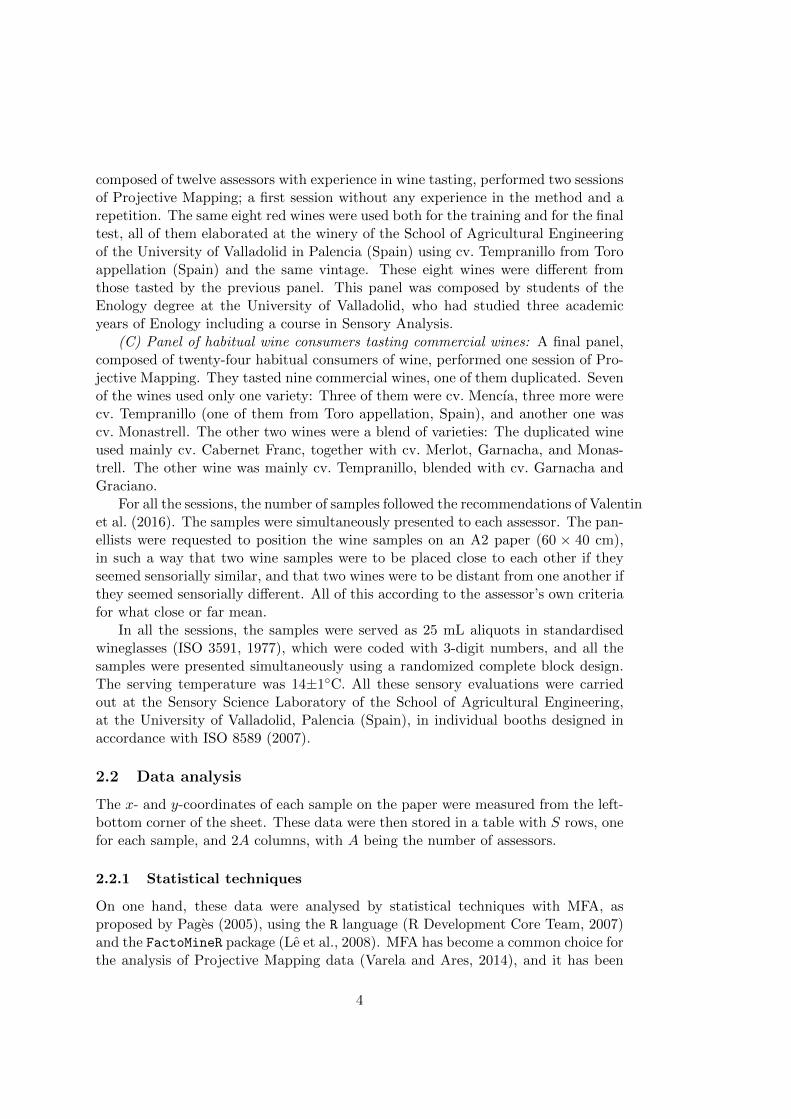
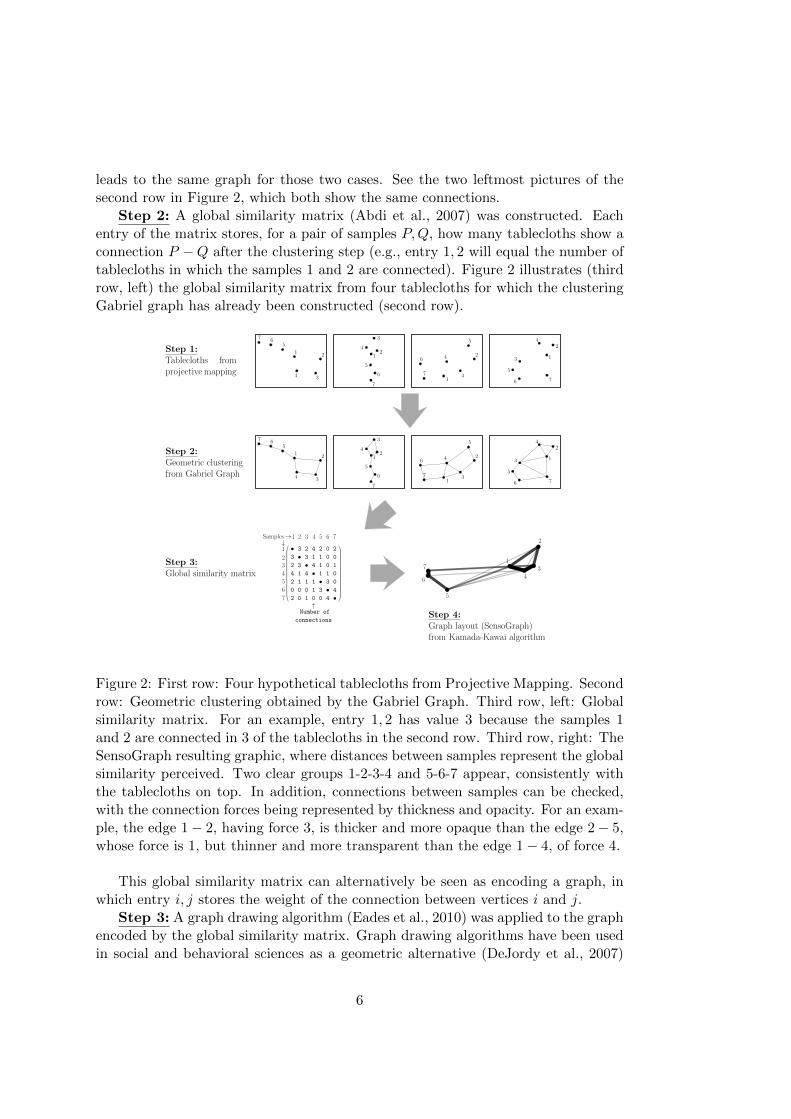
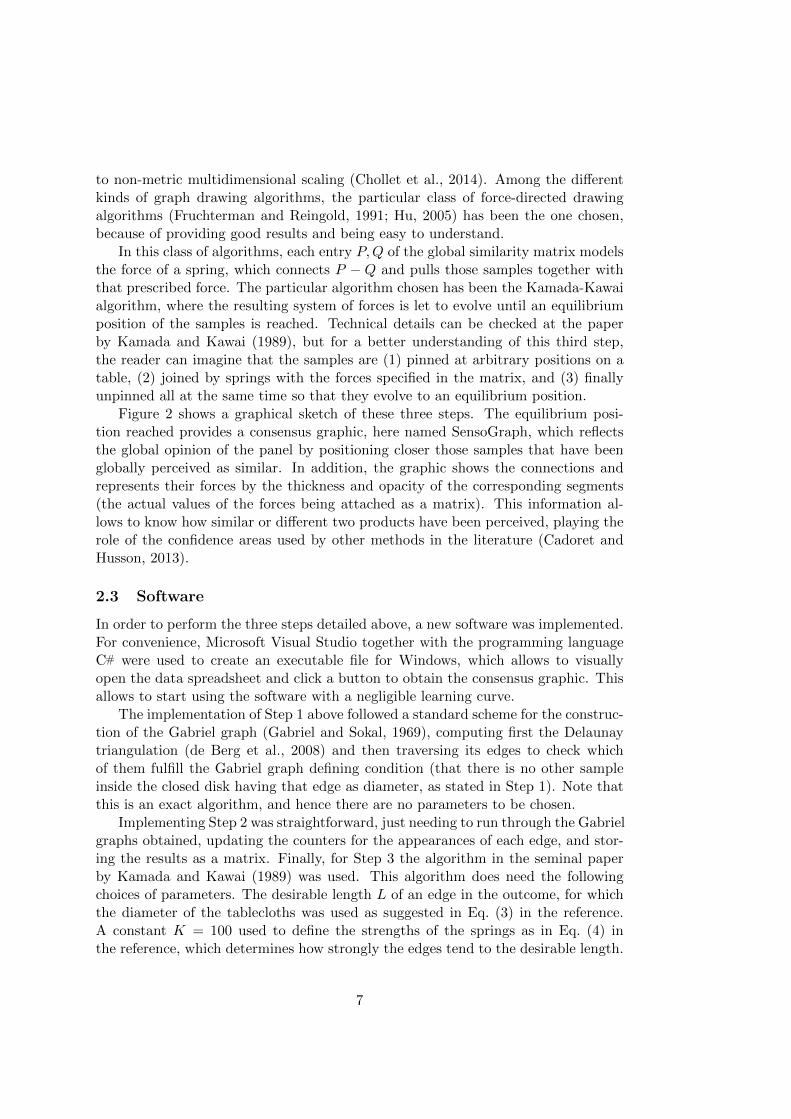
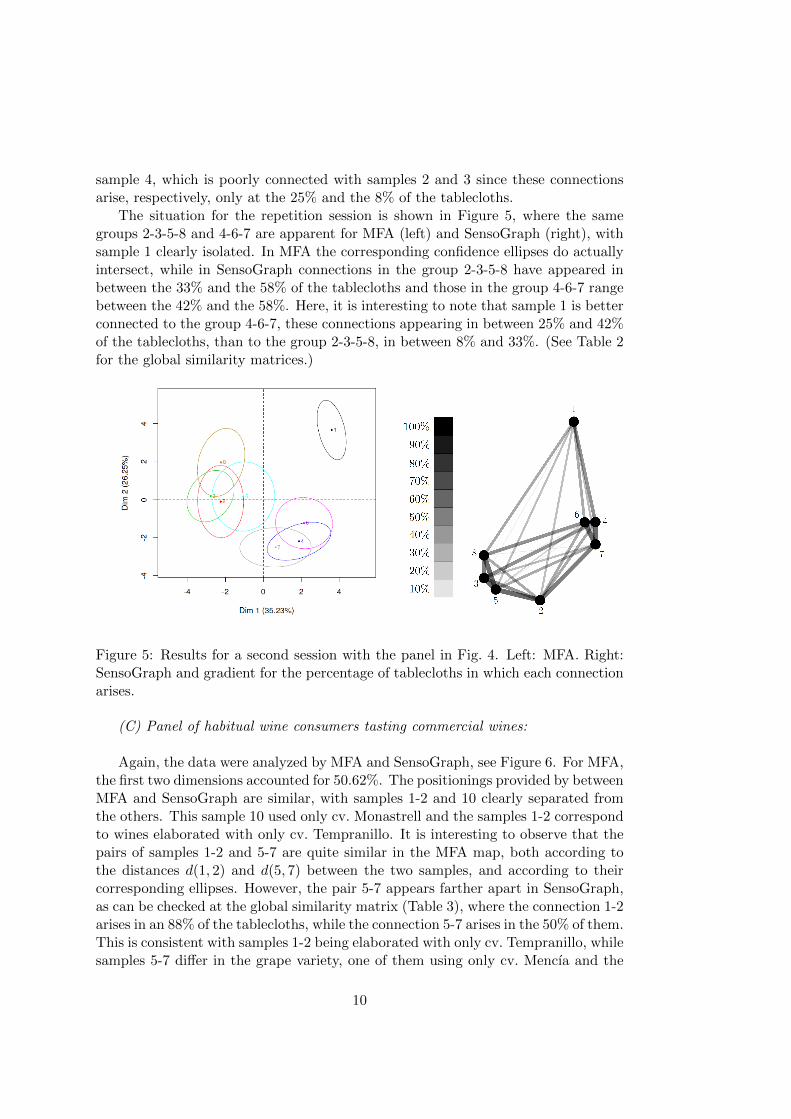
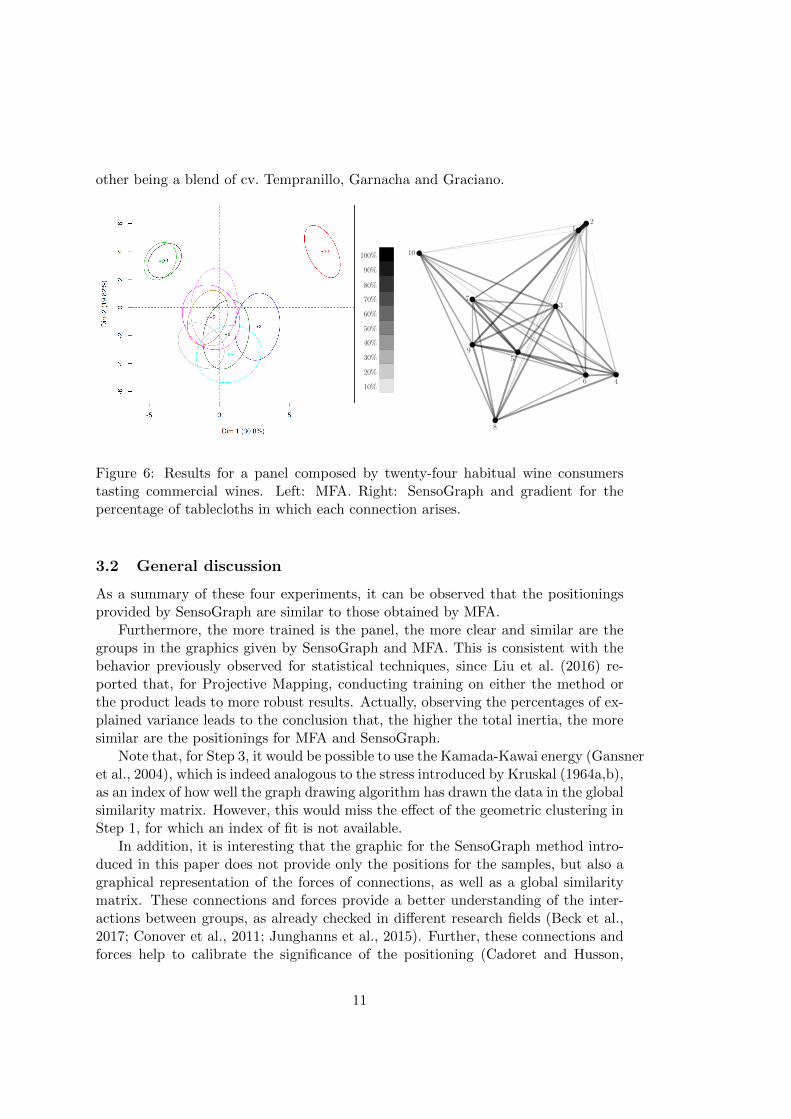
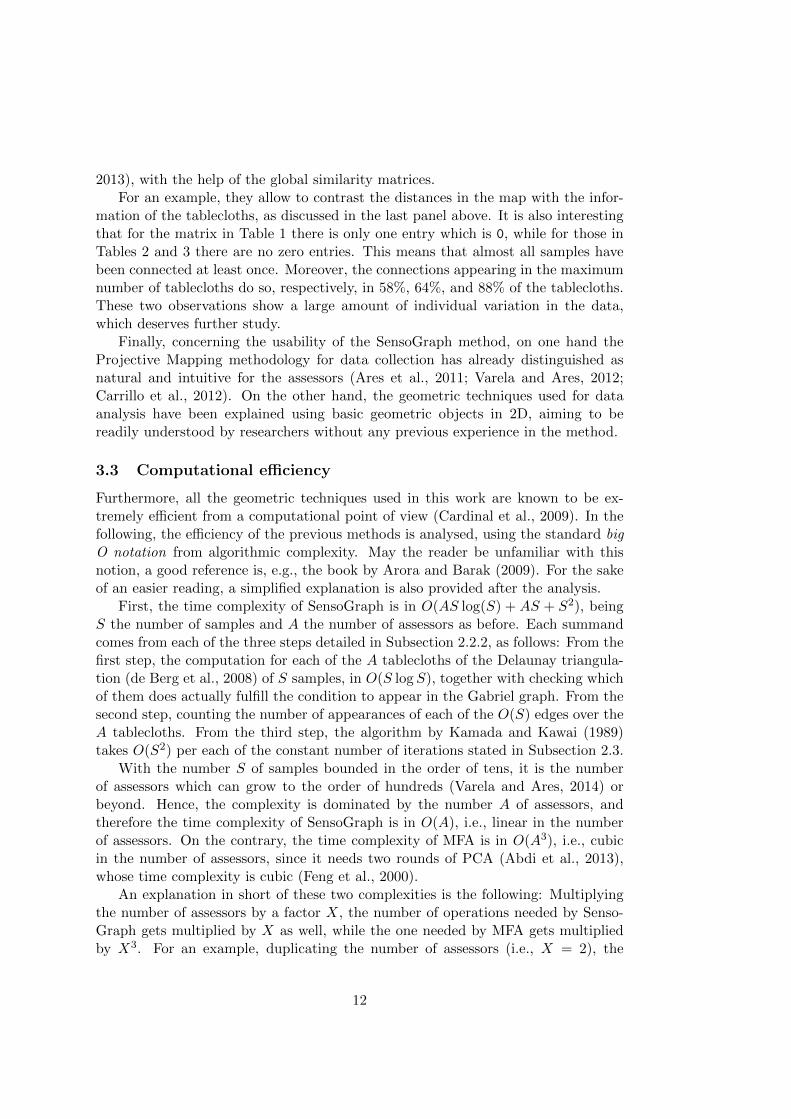
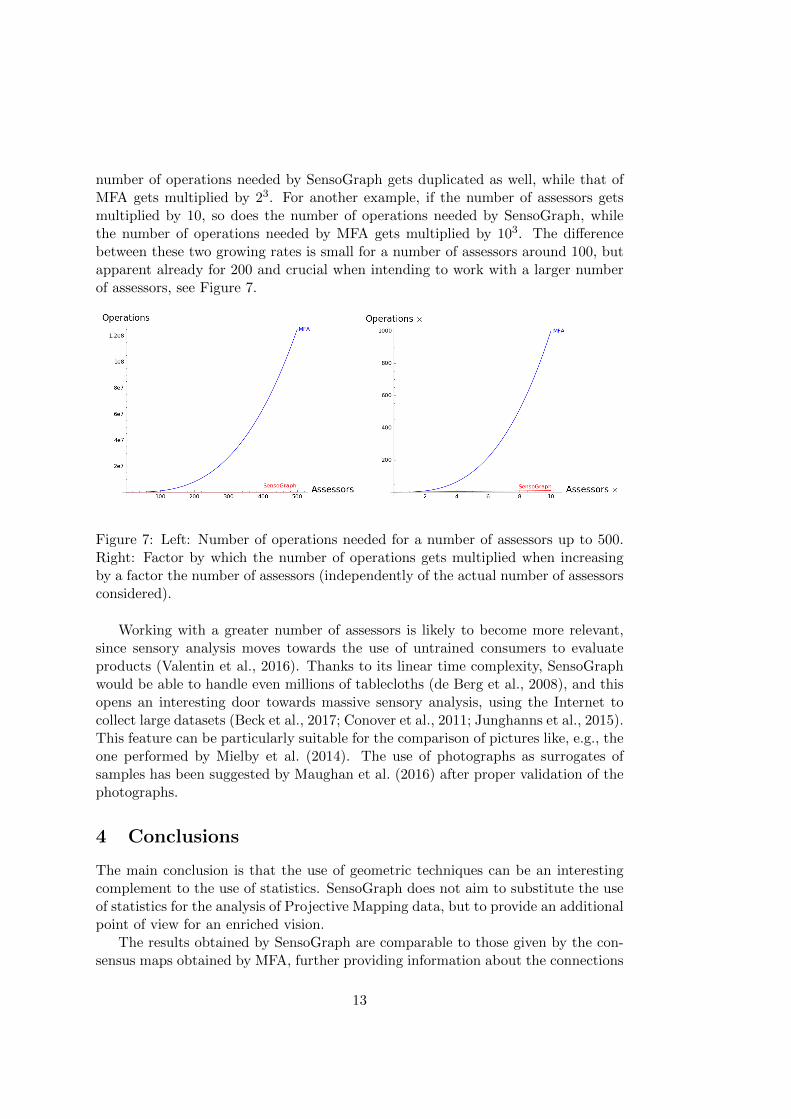
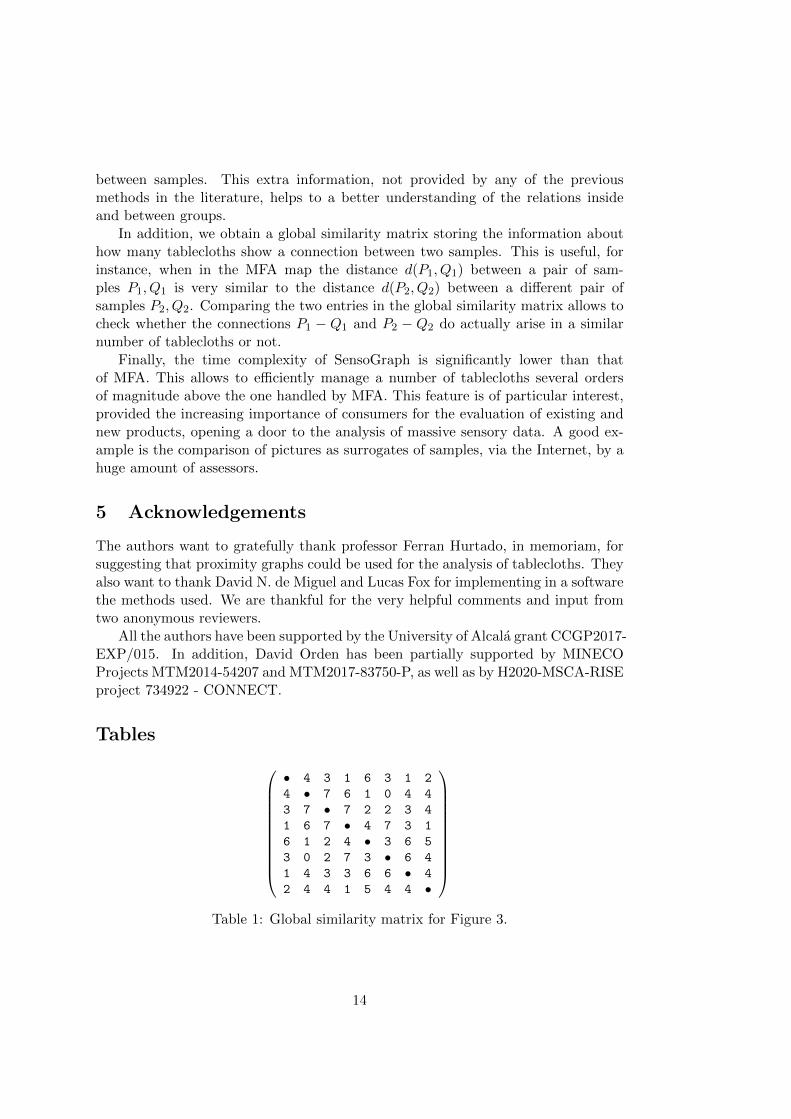
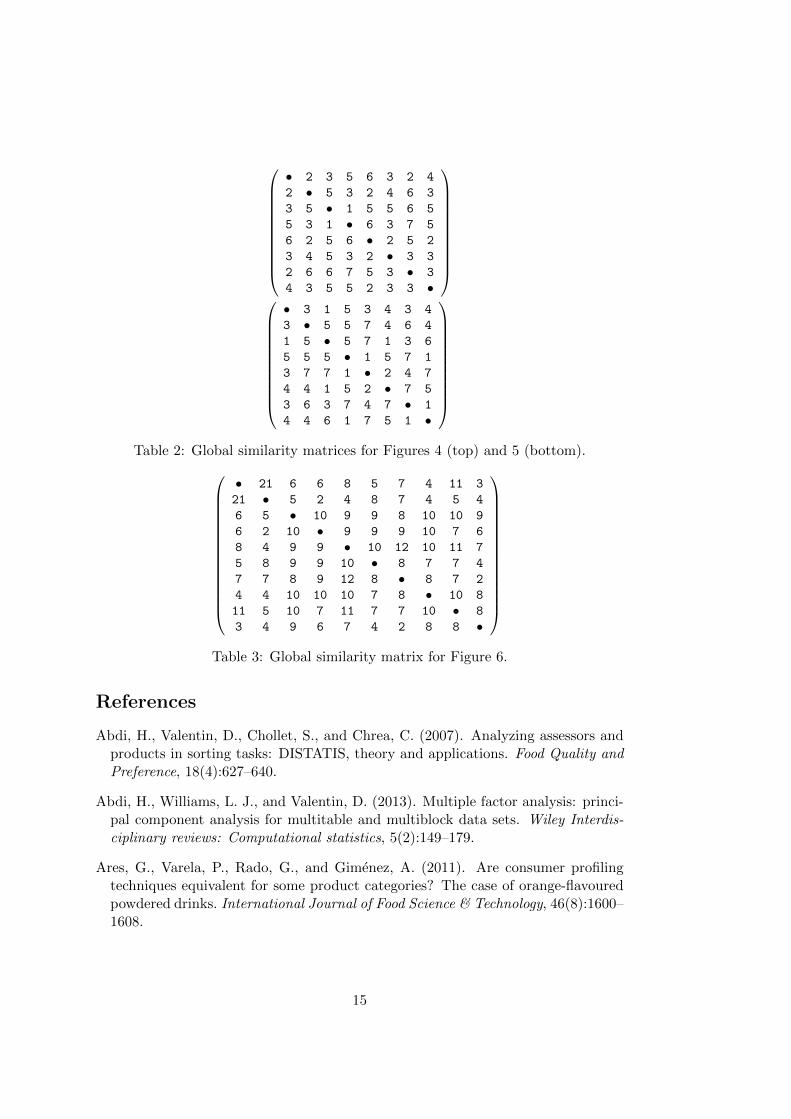
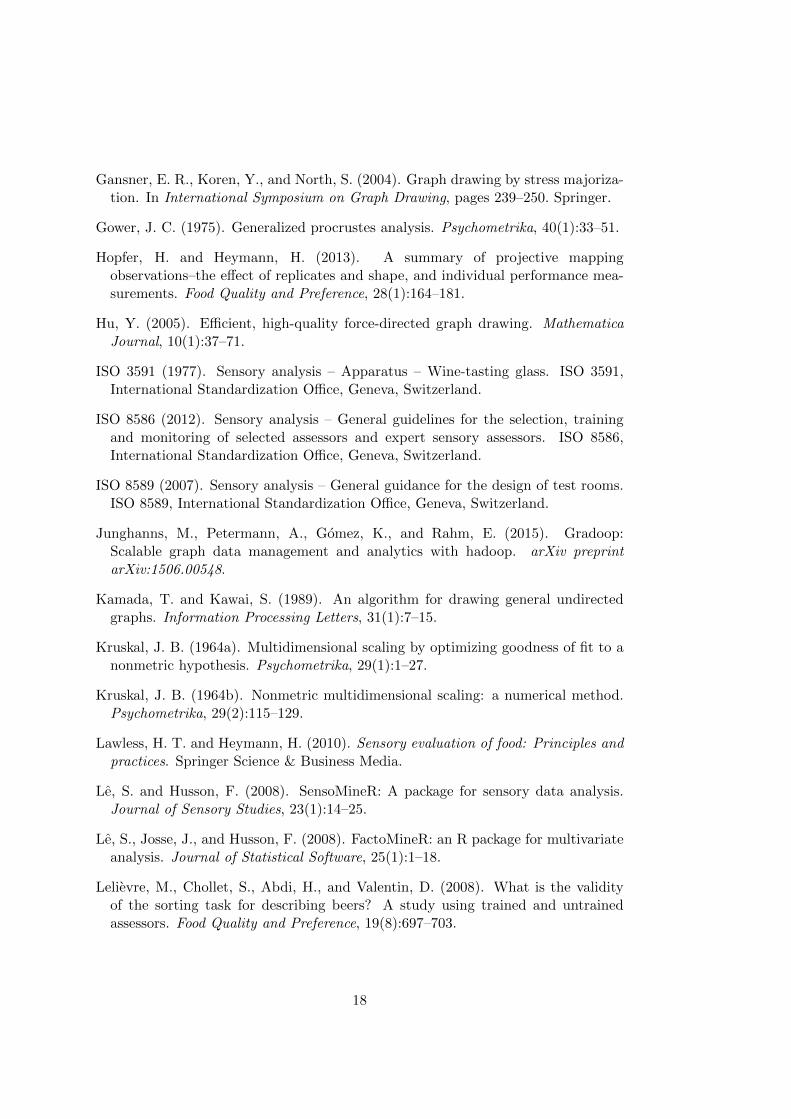