Testing and Upcoming Implementation of the 20km RUC Stan Benjamin NOAA / FSL [email protected]...
34
Testing and Upcoming Implementation of the 20km RUC Stan Benjamin NOAA / FSL [email protected] 303-497-6387 http://ruc.fsl.noaa.gov Georg Grell Steve Weygandt Tracy Lorraine Smith Tanya Smirnova Barry Schwartz Dongsoo Kim Dezso Devenyi Kevin Brundage John M. Brown Geoff Manikin – NCEP/EM Ralph Petersen – NCEP/E NCEP Production Suite Review 11 December 01 – updated 15 Feb 0
-
Upload
rudolf-harmon -
Category
Documents
-
view
214 -
download
1
Transcript of Testing and Upcoming Implementation of the 20km RUC Stan Benjamin NOAA / FSL [email protected]...

Testing and Upcoming Implementation of the 20km RUC
Stan BenjaminNOAA / [email protected] 303-497-6387http://ruc.fsl.noaa.gov
Georg GrellSteve WeygandtTracy Lorraine SmithTanya SmirnovaBarry Schwartz Dongsoo KimDezso DevenyiKevin BrundageJohn M. BrownGeoff Manikin – NCEP/EMCRalph Petersen – NCEP/EMC
NCEP Production Suite Review11 December 01 – updated 15 Feb 02

2
Key goals for 20km RUC• Focus on improving RUC performance for
• QPF, especially for convective precipitation• Surface forecasts• Cloud/icing 3-d fields
• Take advantage of increased computer power40 km / 40 levels 20 km / 50 levels
• Improved physical parameterizations (cumulus,explicit cloud, land-surface), vertical advection
• Improved analysis in native coordinate, cloud analysis

3
RUC20 Testing Since May 2001
Ongoing real-time 1-h cycle at FSL and NCEP Retrospective period tests – full 1-h cycle
Feb 2001 at NCEP and FSL July 2001 at NCEP May 2000 at FSL
Examination of verification against precipitation, radar surface observations rawinsonde observations
Web page products – daily look at maps For both RUC20/40 analyses and forecasts

4
RUC20 Implementation schedule
CAFTI information items- March, Sept, Nov 2001, Feb 2002
Complete retrospective tests Feb 2001 – cold season - complete July 2001 – warm season – almost complete
Real-time tests – late Feb - March 2002 CAFTI approval – late March 2002 Operational implementation – 9 April 2002

5
Subset of full domain
20km RUC 40km RUC
Model terrain elevation

6
Subset of full domain
20km RUC 40km RUC
Model terrain elevation

7
40km RUC40 levels
20km RUC50 levels
10 new levels7 – upper levels – 330 – 500 K3 – lower levels – 270 – 290 K
RUC native coordinate levels
W-E vertical cross-section - Pacific – w. coast6h fcsts valid 0000 UTC 24 Feb 2001
800 1600 2400 3200

8
Current Operations – RUC40 RUC20
Resolution 40 km, 40levels 20 km, 50 levelsAnalysis Optimal interpolation on Modified OI technique on generalized
on generalized surfaces surfaces, hydrometeor analysis w/ GOES…, use raw instead of interp. obs
Assimilation Intermittent 1-h cycle Intermittent 1-h cycleStable clouds Mixed-phase cloud microphysics MM5), New version of MM5/RUC / precipitation explicit fcst of cloud water, rain water, microphysics (FSL and NCAR),
snow, ice, graupel, much shorter microphysics time step, no. concentration of ice particles less graupel, more supercooled liq water
Sub-grid-scale Grell (1993) New Grell scheme w/ ensemble cloud, precipitation shallow convection, detrainment of
cloud water to microphysics Turbulence Burk-Thompson explicit TKE scheme Modified Burk-ThompsonRadiation MM5 LW/SW scheme, f(hydrometeors) MM5 scheme with fix to SW lag error
Land-sfc processes 6-level soil/veg model (Smirnova, Improved soil model, 2-layer snow model, 1997, 2000) w/ frozen soil, 1-layer snow improved cold season processes,
improved diurnal cycleSfc conditions Daily RTG_SST (same as Eta), High-res USGS land-use, CONUS soil type,
daily NESDIS snow/ice (same as Eta), albedo0.14 monthly NDVI veg frac (same as Eta), cycled soil moisture/temp, snow depth/temp
Lat boundary conds Eta model initialized every 12h Eta model initialized every 6h
Rapid Update Cycle – Present and Next Version

9
Key RUC20 Modifications Since May 2001
- Forecast model- revisions to Grell ensemble convective parameterization- use of GOES cloud-data to prompt convective initiation- revised vertical advection / hybrid isentropic-sigma coordinate movement
Prompted by PC Spring Program evaluation, model stability- Analysis
- 3dVAR found to give slightly poorer wind forecast for 3h period (not at 12h)- Decision made to introduce OI analysis within 3dVAR framework, defer 3dVAR analysis implementation for ~3 months after RUC20 impl.Prompted by FAA use of RUC for Free Flight

Data Type ~Number Freq.Rawinsonde (inc. special obs) 80 /12hNOAA 405 MHz profilers 31 / 1hBoundary-layer (915 MHz) profilers ~24 / 1h * VAD winds (WSR-88D radars) 110-130 / 1h Aircraft (ACARS) (V,temp) 1400-4500 / 1hSurface/METAR - land (V,psfc,T,Td) 1500-1700 / 1hBuoy 100-150 / 1hGOES precipitable water 1500-3000 / 1hGOES cloud drift winds 1000-2500 / 1hGOES cloud-top pressure ~40km res / 1hSSM/I precipitable water 1000-4000 / 6hGPS precipitable water ~80 / 1h * Ship reports 10s / 3hReconnaissance dropwinsonde a few / variable
Data for 20-km RUC at NCEP New for 20km RUC at NCEP
Availability pending

11
Improved use of obs in RUC20 analysis
• More accurate forward models-- simulate observations from background forecast as closely as possible• 2m T/q, 10m winds from METARs, buoys• Use of background grid-point with matching land-use for coastal stations instead of bilinear interpolation to ob location• Account for elevation differences (model vs. ob) for precipitable water• Better handling for near-surface raob structure
• Lapse rate effects – top-down, bottom-up checks- improves analysis boundary-layer temp structure
12
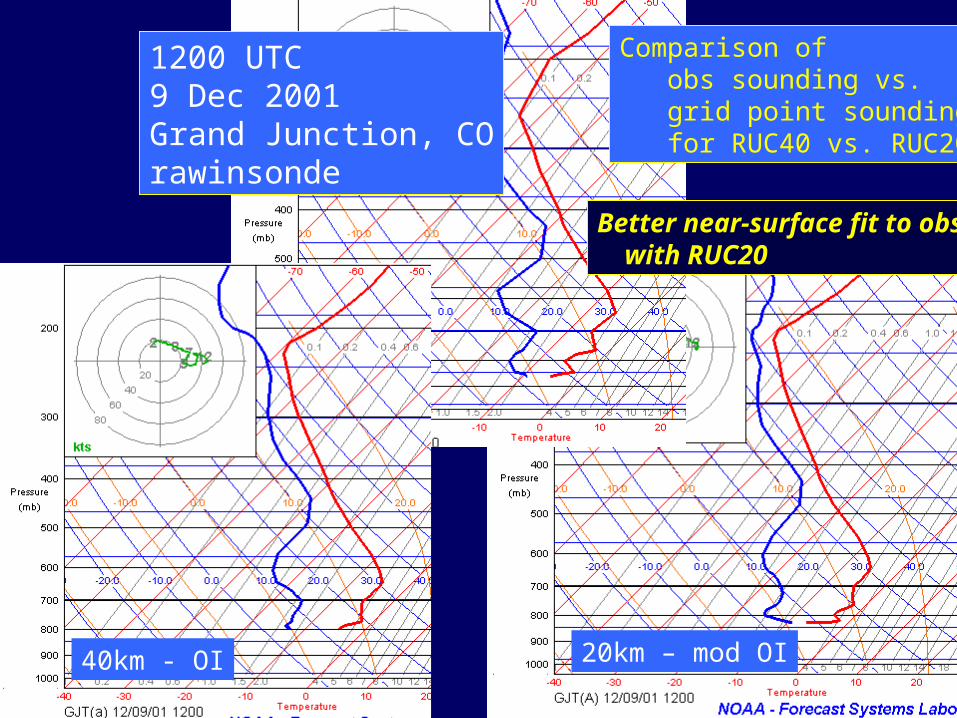
obs
20km – mod OI
1200 UTC9 Dec 2001Grand Junction, COrawinsonde
Comparison of obs sounding vs. grid point soundings for RUC40 vs. RUC20
Better near-surface fit to obs with RUC20
40km - OI

13
Initial RUC cloud analysis technique
• Combines • GOES/NESDIS cloud-top pressure (sounder single field-of-view)• RUC 1-h hydrometeor fcst (cloud water, ice, snow/rain/graupel) as first guess
• Performs cloud clearing and cloud building
• Rederives cloud-top pressure using RUC 1-h fcst sounding / skin temp if NESDIS original value is > 620 mb
Goal – Improve RUC precipitation, cloud, icing forecasts

14
Processes in RUC/MM5 microphysics (Reisner, Rasmusssen, Bruintjes, 1998, QJRMS)

15
VerificationCloud-top pressurebased on NESDIS product
Effect of GOES data on 3-h RUC cloud-top fcsts
Valid 1200 UTC 9 Dec 2001
3h 20km RUC cloud-top fcstw/ GOES cloud assimilation
3h 40km RUC cloud-top fcstNo GOES cloud assimilation

16
3h 20km RUC cloud-top fcstw/ GOES cloud assimilation
VerificationCloud-top pressurebased on NESDIS product
Cloud-top forecast verification - correlation coefficient between forecast and NESDIS cloud-top product- much improved cloud forecasts even at 12h28 Sept – 2 Oct 2001
40km RUC 20km RUC w/ cloud analysis

17
Key changes in 20km RUC forecast model for QPF
• 20km/50 level resolution – resolved precipitationimproved – grid volumes are now ~5 times smaller
• Cloud microphysics time step much smaller -- 10 2 min
• Revised hybrid coordinate definition, verticalregridding for all variables
• Bug fixes in interface between Grell scheme and rest of model
• New ensemble cumulus parameterization – Grell• Revised version of MM5/RUC microphysics

18
Purpose – Improve near-surface,precipitation, cloud forecasts
Ongoing cycle of soil moisture,soil temp, snow cover/depth/temp)
RUC Land-surfaceProcess Parameterization
New in 20km- change in thermal conductivity – better diurnal cycle- frozen soil physics, 2-layer snow model, high resolution land-use, soil type data
40km
20km

19
Changes to MM5/RUC microphysics with 20km RUC
SW-NE vertical cross-section across WA /Olympic Peninsula into BC and Alberta - 12h forecast valid 0300z 5 January 2001
40km operational RUC at NCEP
20km test RUC w/ microphysics fixes
Bug fixesChanges for formation of ice and graupel - result – less “ice friendly”Change in time step from 10 min to 2 min
Result:• Improved precip type • More realistic supercooled liquid water

20
RUC 2m temp (oC) bias verified against METARS ( 01152-01205 )
-3
-2
-1
0
1
2
3
0 300 600 900 1200 1500 1800 2100
RUC surface temperature biasverified against metars (01152-02205)
RUC20RUC40
bia
s (f
- o
)
cycle (UTC)
analysis
-3
-2
-1
0
1
2
3
0 300 600 900 1200 1500 1800 2100
RUC surface temperature biasverified against metars (01152-01205)
RUC20RUC40
bia
s (f
- o
)
cyle (UTC)
3-h fcsts
-3
-2
-1
0
1
2
3
0 300 600 900 1200 1500 1800 2100
surface temperature bias verificationagainst metars (01152-01205)
RUC20RUC40
bia
s( f
- o
)
cycle (UTC)
6-h fcsts
-3
-2
-1
0
1
2
3
0 300 600 900 1200 1500 1800 2100
RUC surface temperature bias verifiedagainst metars (01152-01205)
RUC20RUC40
bia
s (f
- o
)
cycle (UTC)
12-h fcsts
Analysis 3h fcsts
6h fcsts 12 fcsts
Much reduced diurnal sfc temp bias with RUC20

21
RUC surface wind forecastverificationvs. METARs
RUC20/40
west of 105ºW east of 105ºW

22
METARs – 22z 7 Dec 01RUC20 sfc wind – 2h fcst – valid 22z
LAX

23
RUC20 sfc wind – 12h fcst – valid 06z 8 Dec 01Divergence - image
ConvConv Div
Div

24RUC20 divergence – imageRUC20 sfc wind – 12h fcst – valid 06z 8 Dec 01RUC20 model terrain
• SFO
• MRY

25
RUC20 divergence – imageRUC40 divergence – isopleths (40km data)
• DEN
• LBF

260
0.2
0.4
0.6
0.8
1
1.2
0 0.5 1 1.5 2
Bias - precipitation forecasts - RUC 40 vs. RUC 20(20 March - April 2001)
RUC 40 - biasRUC 20 - bias
Bia
s
threshold - in
0
0.05
0.1
0.15
0.2
0.25
0.3
0.35
0.4
0 0.5 1 1.5 2
24h precipitation verification - RUC 40 vs. RUC 20 - vs. NCEP 24h precipitation analysis
(20 March - 15 April 2001)
RUC 40 - etsRUC 20 - ets
Eq
uita
ble
thr
eat
sco
re
threshold - in
Precipitation verificationRUC40 vs. RUC 2020 March – 15 April 2001
Clear superiority of 20km RUC, especially for heavier precipitation events

27
Precipitation verificationRUC40 vs. RUC 20
12 Nov – 3 December 2001
Eq. Threat score
Bias

2812h fcst – init 09z 8 Dec 01Precip for 3h period – 18-21z
RUC40 vs. RUC20 precipitation
RUC20
RUC40
2000z METARs
WSI radar – 2015z

29
24h precipitation40km RUC vs. 20km RUC24h period ending 12z 25 Sept 2001
(Two 12h fcsts summed)
NCEP/CPC24h precipanalysis20km RUC40km RUC

30
Visibility diagnosis40km RUC vs. 20km RUC12z 30 January 200220km RUC
40km RUC
Observedvisibilityanalysis

31
20km vs. 40km RUC wind forecasts- verification against raobs
3h, 12h forecasts – 25 Nov – 6 Dec 2001
RMS differences 20km 40km
RUC20 –Slightly better or equal 3h wind forecasts
Consistently improved 12h wind forecasts

32
20km vs. 40km RUC temp / RH forecasts- verification against raobs
12h forecasts – 25 Nov – 6 Dec 200120km 40km
RUC20 – Slightly better or equal 3h forecastsConsistently improved 12h forecasts

33
More on RUC20• Same products/fields as for RUC40 (RUC2)• 40km look-alike grids
– Native (bgrb)– 25-mb isobaric and 86 2-d grids (pgrb)– 25 2-d variables (sgrb)
• BUFR sounding output identical to Eta– Current – separate monolithic files for each output time only– New – station files with all output times - ‘monolithic’ file w/ all stations, output times
• RUC20 forum for questions (under RUC web site)• Backup for RUC20 at FSL (similar to current RUC40)
RUC web site - http://ruc.fsl.noaa.gov - 20km test RUC products
34
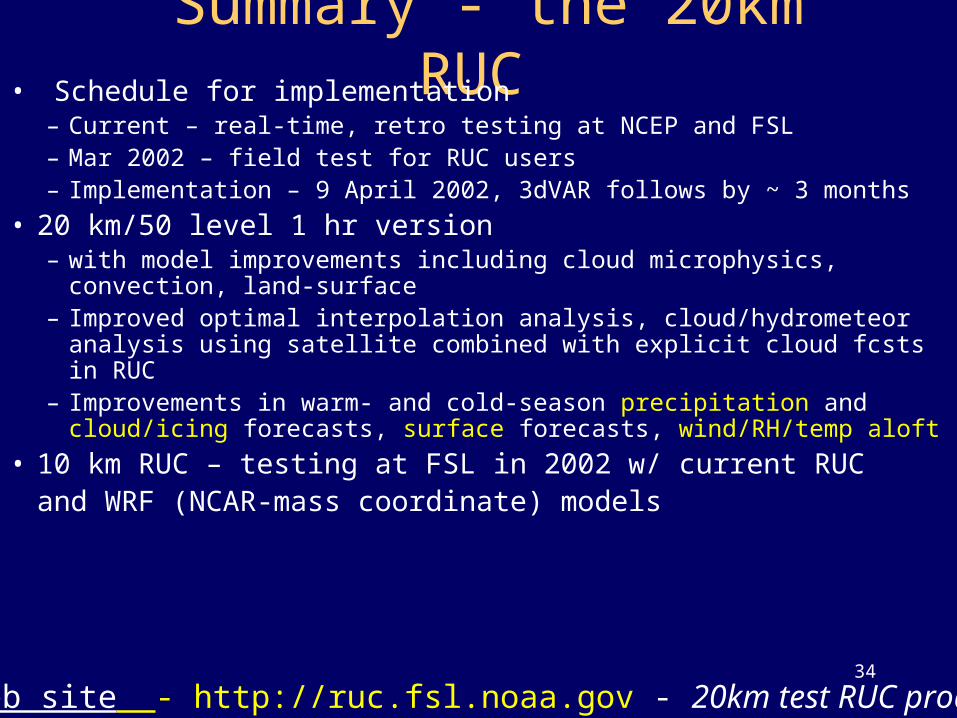
Summary - the 20km RUC• Schedule for implementation
– Current – real-time, retro testing at NCEP and FSL– Mar 2002 – field test for RUC users– Implementation – 9 April 2002, 3dVAR follows by ~ 3 months
• 20 km/50 level 1 hr version– with model improvements including cloud microphysics, convection, land-
surface– Improved optimal interpolation analysis, cloud/hydrometeor analysis using
satellite combined with explicit cloud fcsts in RUC– Improvements in warm- and cold-season precipitation and cloud/icing
forecasts, surface forecasts, wind/RH/temp aloft
• 10 km RUC – testing at FSL in 2002 w/ current RUCand WRF (NCAR-mass coordinate) models
RUC web site - http://ruc.fsl.noaa.gov - 20km test RUC products