Testing and Modeling of Two Rockfall...
12
TRANSPORTA TJON RESEARCH RECORD 1504 Testing and Modeling of Two Rockfall Barriers GEORGE HEARN, ROBERT K. BARRETT, AND H. HENRIE HENSON Testing, evaluation, and analysis of two types of rockfall barriers are reported. Rockfall barriers are designed to withstand impacts by falling boulders and are used to protect roadways and structures. Among sev- eral types of barriers in use by transportation departments, two designs-a flexible cable-fence barrier and a freestanding mechanically stabilized earth (MSE) barrier-have been developed by the Colorado Department of Transportation in a program of prototype testing and dynamic analysis. In tests, full-size prototype barriers were subject to impacts by boulders falling freely down a natural slope. The velocity and kinetic energy of the rockfall and the performance of the barrier are basic findings of tests. Simulation of test impacts in dynamic analysis provides information about the load demand on components of barriers. Test data are used to calibrate analytical procedures. Three prototype cable fences have been tested. The fences have proven rockfall capaci- ties up to 129 .kJ (95,000 ft-lb) and can halt boulders as heavy as 2,950 kg (6,500 lb). Three prototype MSE barriers have been tested. One pro- totype was repaired after initial testing and then retested to examine the performance of repairs. MSE barriers offer rockfall capacities in excess of 1,360 kJ (l 06 ft-lb) and have been observed to halt boulders as heavy as 13,700 kg (30,100 lb). Rockfall has been defined as the rapid movement, by rolling, slid- ing, and leaping, of one or a few boulders down a slope (J). Once freed from its position on a slope, a boulder acquires significant kinetic energy as it t;avels, and it can have a long runout beyond the slope (2). Rockfall hazards exist along many highways. The sever- ity of rockfall hazard is a function of the frequency of rockfall events as well as traffic levels, sight distances, and traffic speeds. Several state transportation departments employ hazard rating prac- tices that recognize both the geotechnical and operational charac- teristics of a site (3-5). Rockfall hazard can be mitigated by barriers such as ditches, walls, fences, and other means (6). Rockfall barriers are suitable where (a) boulders are of moderate size, (b) source material consists of many individual cobbles, (c) boulders and blocks are distributed over a wide area, (d) boulders are expected to fall individually, and (e) a barrier can be periodically cleared of debris. Barriers are the method of mitigation when the disturbance of a slope must be kept to a minimum, as is the case with scenic or environ- mentally sensitive sites. There are two categories of rockfall barriers: slope features such as berms and catch ditches (7) and barrier structures such as fences and walls. Barriers must be of adequate size and must be designed G. Hearn, Department of Civil, Environmental, and Architectural Engineer- ing, University of Colorado, Boulder, Colo. 80309. R.K. Barrett, Colorado Department of Transportation, Denver, Colo. 80222. H.H. Henson, Parsons DeLeuw, Denver, Colo. 80290. for strength. Impacts by boulders are severe events and exert high forces on barrier components. The commonly used measure of rockfall barrier capacity is the kinetic energy of falling boulders. The design of barriers for a hazard site employs data on kinetic ener- gies and bounding heights of boulders and a computation of forces on components, using explicit dynamic analysis. Bounding heights and kinetic energies of falling boulders at a site can be determined in computer simulations (8,9). The rockfall capacity of barriers is established in tests of proto- types. Tests have been reported for rockfall attenuators (JO), steel mesh fences (J 1), cable net fences (J 2, 13), and mechanically stabi- lized earth (MSE) barriers (14,15). Rockfall capacities of barriers range from 41 kJ (30,000 ft-lb) for steel mesh fences, to 700 kJ (500,000 ft-lb) for cable net systems, to more than 1,360 kJ (106 ft- lb) for MSE barriers. Tests demonstrate the rockfall capacity of a barrier in terms of a maximum kinetic energy of boulders and often as a limit on maximum boulder size or weight. Methods for the dynamic analysis of rockfall barriers have been developed. Analysis of impact response of cable fences is reported by Hearn (J 1). Analysis of a rockfall attenuator is reported by Mus- toe and Huttlemaire (16). The use of dynamic analysis in the devel- opment of new designs for cable fences is reported by Hearn (J 7). The rockfall capacities of new cable fences were subsequently demonstrated in prototype tests reported in this paper. Preliminary results of a discrete element analysis of impact response of MSE walls are also reported in this paper, and the results are compared with data from prototype tests conducted by the Colorado Depart- ment of Transportation in 1990 and 1993 (14,15). PROTOTYPE TESTING OF ROCKFALL BARRIERS The method of prototype testing is straightforward. A boulder of known weight and size is released at the top of a slope and is allowed to hit a barrier at the bottom of the slope. The impact con- ditions are stated in terms of boulder speed and kinetic energy, and the performance of the barrier is evaluated in terms of its success in stopping the boulder and in terms of the damage sustained. Prototype tests approximate the real service conditions of rock- fall barriers. Prototypes are full-size barriers. Boulders fall freely down a natural slope. Boulder path and speed are not constrained, though the severity of the rockfall event is bounded approximately by the size of the boulder. All prototypes are tested with repeated impacts. Boulders are cleared after each impact, but prototypes are left unrepaired unless disabled. Boulder weight, speed, bounding height at impact, kinetic energy, and the location of the impact on the barrier characterize each test. Each test yields a determination of whether the kinetic energy is within or beyond the capacity of the barrier.
Transcript of Testing and Modeling of Two Rockfall...

TRANSPORTA TJON RESEARCH RECORD 1504
Testing and Modeling of Two Rockfall Barriers
GEORGE HEARN, ROBERT K. BARRETT, AND H. HENRIE HENSON
Testing, evaluation, and analysis of two types of rockfall barriers are reported. Rockfall barriers are designed to withstand impacts by falling boulders and are used to protect roadways and structures. Among several types of barriers in use by transportation departments, two designs-a flexible cable-fence barrier and a freestanding mechanically stabilized earth (MSE) barrier-have been developed by the Colorado Department of Transportation in a program of prototype testing and dynamic analysis. In tests, full-size prototype barriers were subject to impacts by boulders falling freely down a natural slope. The velocity and kinetic energy of the rockfall and the performance of the barrier are basic findings of tests. Simulation of test impacts in dynamic analysis provides information about the load demand on components of barriers. Test data are used to calibrate analytical procedures. Three prototype cable fences have been tested. The fences have proven rockfall capacities up to 129 .kJ (95,000 ft-lb) and can halt boulders as heavy as 2,950 kg (6,500 lb). Three prototype MSE barriers have been tested. One prototype was repaired after initial testing and then retested to examine the performance of repairs. MSE barriers offer rockfall capacities in excess of 1,360 kJ (l 06 ft-lb) and have been observed to halt boulders as heavy as 13,700 kg (30,100 lb).
Rockfall has been defined as the rapid movement, by rolling, sliding, and leaping, of one or a few boulders down a slope (J). Once freed from its position on a slope, a boulder acquires significant kinetic energy as it t;avels, and it can have a long runout beyond the slope (2). Rockfall hazards exist along many highways. The severity of rockfall hazard is a function of the frequency of rockfall events as well as traffic levels, sight distances, and traffic speeds. Several state transportation departments employ hazard rating practices that recognize both the geotechnical and operational characteristics of a site (3-5).
Rockfall hazard can be mitigated by barriers such as ditches, walls, fences, and other means (6). Rockfall barriers are suitable where (a) boulders are of moderate size, (b) source material consists of many individual cobbles, (c) boulders and blocks are distributed over a wide area, (d) boulders are expected to fall individually, and (e) a barrier can be periodically cleared of debris. Barriers are the pref~rred method of mitigation when the disturbance of a slope must be kept to a minimum, as is the case with scenic or environmentally sensitive sites.
There are two categories of rockfall barriers: slope features such as berms and catch ditches (7) and barrier structures such as fences and walls. Barriers must be of adequate size and must be designed
G. Hearn, Department of Civil, Environmental, and Architectural Engineering, University of Colorado, Boulder, Colo. 80309. R.K. Barrett, Colorado Department of Transportation, Denver, Colo. 80222. H.H. Henson, Parsons DeLeuw, Denver, Colo. 80290.
for strength. Impacts by boulders are severe events and exert high forces on barrier components. The commonly used measure of rockfall barrier capacity is the kinetic energy of falling boulders. The design of barriers for a hazard site employs data on kinetic energies and bounding heights of boulders and a computation of forces on components, using explicit dynamic analysis. Bounding heights and kinetic energies of falling boulders at a site can be determined in computer simulations (8,9).
The rockfall capacity of barriers is established in tests of prototypes. Tests have been reported for rockfall attenuators (JO), steel mesh fences (J 1), cable net fences (J 2, 13), and mechanically stabilized earth (MSE) barriers (14,15). Rockfall capacities of barriers range from 41 kJ (30,000 ft-lb) for steel mesh fences, to 700 kJ (500,000 ft-lb) for cable net systems, to more than 1,360 kJ (106 ftlb) for MSE barriers. Tests demonstrate the rockfall capacity of a barrier in terms of a maximum kinetic energy of boulders and often as a limit on maximum boulder size or weight.
Methods for the dynamic analysis of rockfall barriers have been developed. Analysis of impact response of cable fences is reported by Hearn (J 1). Analysis of a rockfall attenuator is reported by Mustoe and Huttlemaire (16). The use of dynamic analysis in the development of new designs for cable fences is reported by Hearn (J 7). The rockfall capacities of new cable fences were subsequently demonstrated in prototype tests reported in this paper. Preliminary results of a discrete element analysis of impact response of MSE walls are also reported in this paper, and the results are compared with data from prototype tests conducted by the Colorado Department of Transportation in 1990 and 1993 (14,15).
PROTOTYPE TESTING OF ROCKFALL BARRIERS
The method of prototype testing is straightforward. A boulder of known weight and size is released at the top of a slope and is allowed to hit a barrier at the bottom of the slope. The impact conditions are stated in terms of boulder speed and kinetic energy, and the performance of the barrier is evaluated in terms of its success in stopping the boulder and in terms of the damage sustained.
Prototype tests approximate the real service conditions of rockfall barriers. Prototypes are full-size barriers. Boulders fall freely down a natural slope. Boulder path and speed are not constrained, though the severity of the rockfall event is bounded approximately by the size of the boulder. All prototypes are tested with repeated impacts. Boulders are cleared after each impact, but prototypes are left unrepaired unless disabled. Boulder weight, speed, bounding height at impact, kinetic energy, and the location of the impact on the barrier characterize each test. Each test yields a determination of whether the kinetic energy is within or beyond the capacity of the barrier.
2 TRANSPORTATION RESEARCH RECORD 1504
TABLE 1 Range of Boulder Weights and Speeds in Tests of Prototype Barriers
No.of
Tests
Flexpost Fence
Prototype I 11
Gabion Mesh Prototype 15
Cable Net Prototype 10
Mechanically Stabilized Earth Barrier
Prototype 6x10 11
Repaired 6x10 8
Prototype 8x12 9
Tests of prototype barriers were executed at a slope near Rifle, Colo. The slope has a difference in elevation of 82 m (270 ft) from the point of release of boulders to the location of barriers. The slope has a nearly constant grade of 66 percent. Boulders travel about 153 m (500 ft) from release to impact. The surface of the slope is sandy, with isolated rock ledges, some cobbles, widely spaced small brush, and little grass. There are no trees in the boulder path. A level construction site for barriers has been prepared at the bottom of the slope, but otherwise the slope has not been modified. Boulders run down a natural, undisturbed slope.
Boulders that have been used in tests range in mass from 120 to 13,700 kg (260 to 30,100 lb). Boulder speeds at impact have been as high as 19 m/sec (62 ft/sec), and kinetic energy of translational velocity have been as high as 1,420 kJ (1,044,000 ft-lb). Speeds and weights of boulders in tests are summarized in Table 1.
FLEXPOST FENCE ROCKFALL BARRIER
The flexpost fence rockfall barrier is constructed of flexible steel posts that support steel cables and steel mesh (Figure I). Flexposts are constructed of two sections of steel pipe; the upper section is the visible post, and the lower section is the foundation. The two sections are joined by a group of 19 seven-wire steel strands that are grouted into both pipe sections. Between the two sections, a height of 0.5 m ( 1.5 ft) of the group of strands is exposed. This exposed height forms a leaf spring, which makes flexposts capable of large elastic rotations about their bases. Posts can be bent to touch the ground and will rebound to a vertical position when released. Flexible posts make this barrier very compliant and therefore very strong. Its strength stems from the tensile strength of its cables and steel mesh. Flexpost fences are flat; all cables lie in a single plane. No stays or other components are out of plane.
Tests of three prototypes 3.10 m (10 ft) tall were conducted in 1990 on the slope at Rifle. These prototypes led to a standard design of a flexpost fence using a gabion mesh and rated at 41 kJ (30,000 ft-lb) rockfall capacity (18). This design has been used in more than 2 dozen installations along Interstate 70 in Glenwood Canyon. The 1990 tests provided the data for verifying an explicit dynamic analysis program for flexible barriers (11). A fourth prototype using cable
Boulder
Weight, kg Velocity, m/s Kin. Energy, kJ
Min Max Min Max Min Max
270 2,134 6.9 14.5 6 225
118 2,742 3.3 15.3 4 179
590 4,077 3.8 19.2 6 747
200 8,354 3.7 19.5 8 1,391
1,952 12,213 6.1 16.8 51 1,416
3,768 13,665 4.9 18.3 44 1,410
nets was tested in 1993. Tests of the prototype verified the predicted capacity of the 129 kJ (95,000 ft-lb) design.
Data from tests of prototype fences is presented in two sets: the 1990 prototype for 41-kJ (30,000-ft-lb) gabion mesh fences and the 1993 prototype for 129-kJ (95,000-ft-lb) cable net fences. The gabion mesh flexpost can halt boulders as heavy as 1,630 kg (3,600 lb). The cable net flexpost fence has a rockfall capacity of 129 kJ (95,000 ft-lb) and can halt boulders as heavy as 2,950 kg (6,500 lb).
Tests of Gabion Mesh Fences
Three prototype flexpost fences using gabion mesh were tested in 1990. Boulder impacts ranged in weight from 118 kg (260 lb) to 2,740 kg (6,040 lb) at velocities from 3.3 m/sec (10.9 ft/sec) to 15.3 m/sec (50 ft/sec) and translational kinetic energies as high as 225 kJ (166,000 ft-lb). Prototype tests are summarized in Tables 2 and 3.
Prototype tests were carried into a range of rockfall kinetic energies sufficient to damage the fence. In tests of gabion mesh prototypes, failures of the mesh, splices in the mesh, stay cables, and top cables were observed. In addition, a direct impact bent one flex post, though the function of the post was not impaired. Two boulders rolling along the ground at slow speeds passed under the fence but halted a few feet beyond the fence.
Prototype gabion mesh fences halted all boulders with translational kinetic energies below 40 kJ (29,700 ft-lb). The prototypes did not stop boulders at energies of 80 kJ (58,700 ft-:lb) and 179 kJ (132,000 ft-lb). Both impacts damaged the fence. Boulder weights and speeds are plotted in Figure 2, and the impacts are identified as being within or beyond the capacity of the fence. Also plotted in Figure 2 is a constant kinetic energy curve at 41 kJ (30,000 ft-lb). The 41 kJ (30,000 ft-lb) curve excludes all damaging impacts, and on the basis of these prototype tests, the 41 kJ (30,000 ft-lb) limit is the rockfall capacity for this gabion mesh fence.
Tests of Cable Net Fences
A prototype flexpost fence using cable nets 20 x 20 x 20 cm (8 x 8 x 16 in.) was tested in 1993. Impacts included boulders that weighed

Heam etal. 3
~ 7/16• Top Cable ~ Mesh, Single Layer
Flexpost --~
1/4" cables --<--U------~?----------+1~~~~· strands --:~~~~~~~~~~~~m,11111
10.5 ft
"'---- 5/16• Stay Cables ~
L 7/16• Bottom Cable
16 Ft 16 Ft
Flexpost Fence with Gabion Mesh
~ 112• Top Cable
x 'r-.. I/' l7'-...._
I" v ~ Flexpost
'" /I/
"" v 'f'...v ,,v "'"
10.5 ft.
v "' l/v "'t--.... ,v I"-... _v
~ "'--1/2• Stay Cables ,,,... !'-... ,,,
Strands ., r L 2 x 112• Bottom Cabl:" ,. ., .r·
16 Ft 16 Ft
Flexpost Fence with Cable Net
FIGURE 1 Flexpost fences.
from 590 kg (1,300 lb) to 4,080 kg (8,980 lb) and boulder translational velocities that ranged from 3.8 m/sec (12.6 ft/sec) to 19.2 m/sec (62.9 ft/sec). Translational kinetic energy was as high as 747 kJ (551,000 ft-lb). The prototype halted a boulder with a translational kinetic energy of 369 kJ (272,000 ft-lb), but the impact ruptured one of the stay cables. The prototype halted a boulder at a translational kinetic energy of 119 kJ (88,000 ft-lb) without damage. The prototype also stopped a boulder at an energy of 103 kJ (76,000 ft-lb) and suffered only minor damage; a crimp splice in a cable net opened. The prototype was severely damaged by a boulder with a translational kinetic energy of 748 kJ (552,000 ft-lb). Tests are summarized in Table 3. Flexpost fences using cable nets are rated at a rockfall capacity of 129 kJ (95,000 ft-lb). Boulder weights and speeds from prototype tests are plotted in Figure 2.
Dynamic Analysis of Flexpost Fences
The response of flex post fences to boulder impacts are simulated in an explicit dynamic analysis. Analysis provides data on forces on components and allows a simulation of impact conditions not observed in prototype tests. This is useful because tests of proto-
types provide a limited set of data despite a substan~ial effort. In addition, analysis can be used to study new fence designs. This process of simulation, design, and subsequent verification of rockfall capacity was followed in the development of the 129-kJ (95,000-ft-lb) cable net fence.
The analysis response of fences to boulder impact employs an iterative, time-marching technique. In each time step, a new equilibrium position for the fence is sought-one that is consistent with the contact forces imposed by the boulder and with the current position and velocities of fence components. The boulder is a discrete element in the analysis. Geometric interference of the boulder with the fence is used to compute a set of normal and tangential contact forces. Details of the analysis are provided in Hearn and Akkaraju (19).
The position of the contact zone within the fence changes as the impact progresses. For analysis, a dense grid of nodes is used in the fence model in the vicinity of the impact of the boulder. The dense grid facilitates the computation of contact forces and accommodates the migration of the contact zone during impact.
Impact response is nonlinear. Cables and mesh in a fence are initially slack. Impact by a boulder drives these components to high tensions and imposes large changes in fence geometry. As the

TABLE2 Comparision of Tests and Analysis of Flexpost Fence Gabion Mesh Prototype
41 kJ Gabion Mesh Fences
Boulder Boulder Trans. Lin. Outcomes Test No. Mass Velocity Kin. En. Mom. Prototype Dynamic
kg m/s kJ kg-m/s Testing Analysis
1 116 8.0 3.7 925 Boulder stopped. No damage. All components within breaking strength.
2 2742 11.4 179.0 31,363 Boulder not stopped. Mesh rupture. Mesh at 4 times breaking strength. Top and bottom cables at 1.4 & 1.9 times breaking strength
3 272 10.2 14.0 2,767 Boulder passed through rend in mesh. All components within breaking strength.
4 631 4.0 4.9 2,502 Boulder rolled under fence. No damage. All components within breaking strength. Analysis shows escape of boulder under the fence.
5 361 10.8 21.0 3,897 Boulder stopped. No damage. All components within breaking strength.
6 686 15.3 79.6 10,454 Boulder not stopped. Mesh rupture. Mesh at 1.4 times breaking strength.
7 268 10.8 15.6 2,892 Boulder stopped. No damage. All components within breaking strength.
8 735 4.6 7.8 3,387 Boulder rolled under fence. No damage. All components within breaking strength. Analysis shows escape of boulder under the fence.
9 617 11.4 40.3 7,062 Boulder stopped. No damage. All components within breaking strength.
10 361 13.4 32.l 4,822 Boulder stopped. No damage. All components within breaking strength.
11 138 10.2 7.1 1,406 Boulder stopped. Post bent. All components within breaking strength.
12 581 10.2 29.8 5,902 Boulder stopped. No damage. Mesh at 1.4 times breaking strength.
13 341 8.7 12.9 2,970 Boulder stopped. No damage. All components within breaking strength.
14 1634 6.5 34.7 10,668 Boulder stopped. Remained in fence. Mesh at 1.1 times breaking strength.
TABLE 3 Comparison of Tests and Analysis of Flexpost Fence Cable Net Prototype
129 kJ Cable Net Fence
Boulder Boulder Trans. Lin. Outcomes Test No. Mass Velocity Kin. En. Mom. Prototype Dynamic
kg m/s kJ kg-m/s Testing Analysis
15 590 5.1 7.6 3,006 Boulder stopped. No damage. All components within breaking strength.
16 790 6.3 15.5 4,939 Boulder stopped. No damage. All components within breaking strength.
17 844 3.8 6.2 3,245 Boulder stopped. No damage. All components within breaking strength.
18 840 12.4 65.0 10,452 Boulder stopped. No damage. All components within breaking strength.
19 790 16.2 103.1 12,770 Boulder stopped. Crimp splice in net All components within breaking strength. pulled open.
20 1,875 15.3 218.3 28,651 Boulder rolled over fence at post. Top cable at 1.2 times breaking strength. Bottom cable at 1.3 times breaking strength.
21 2,111 18.7 368.8 39,535 Boulder stopped. Stay cable broken. Stay cable at 1.1 times breaking strength. Top and bottom cable also beyond breaking strength.
22 2,974 9.0 119.3 26,665 Boulder stopped. No damage. All components within breaking strength.
23 4,050 13.9 389.2 56,199 Boulder rolled over fence at post. Top, bottom and stay cables overstressed.
24 4,077 19.2 748.5 78,214 Boulder not stopped. Top cable broken. Top cable at 3.4 times breaking strength. Bottom and stay cables also overstressed. Net not overstressed.

Gabion Mesh Fence
25
20 • Boulder Stopped
11 Boulder not Stopped or Fence r./)
........ Damaged s
II - 41 kJ Energy Limit i- 15 ·o 0
Q3 > • ... . " -~ 10 • II • ~ • 0 co •
5 • ~Mass Limit
0 500 1000 1500 2000 2500 3000 3500 4000 4500
Boulder Mass, kg
FIGURE 2 Test impacts and energy limits for ftexpost fences.
bO ~
i-·o 0
Q3 > ...
Cl> "C ~ 0
co
25
20
15
10
5
Cable Net Fence
•
!SI Boulder Stopped
• Boulder not Stopped or Fence Damaged
- 129 kJ Energy Limit
<E---- Mass Limit
0 +-~~-+-~~--+~~--i~~~+-~~-1-~~-1-~~--+~~~~~---1
0 500 1000 1500 2000 2500 3000 3500 4000 4500
Boulder Mass, kg
6 TRANSPORTATION RESEARCH RECORD 1504
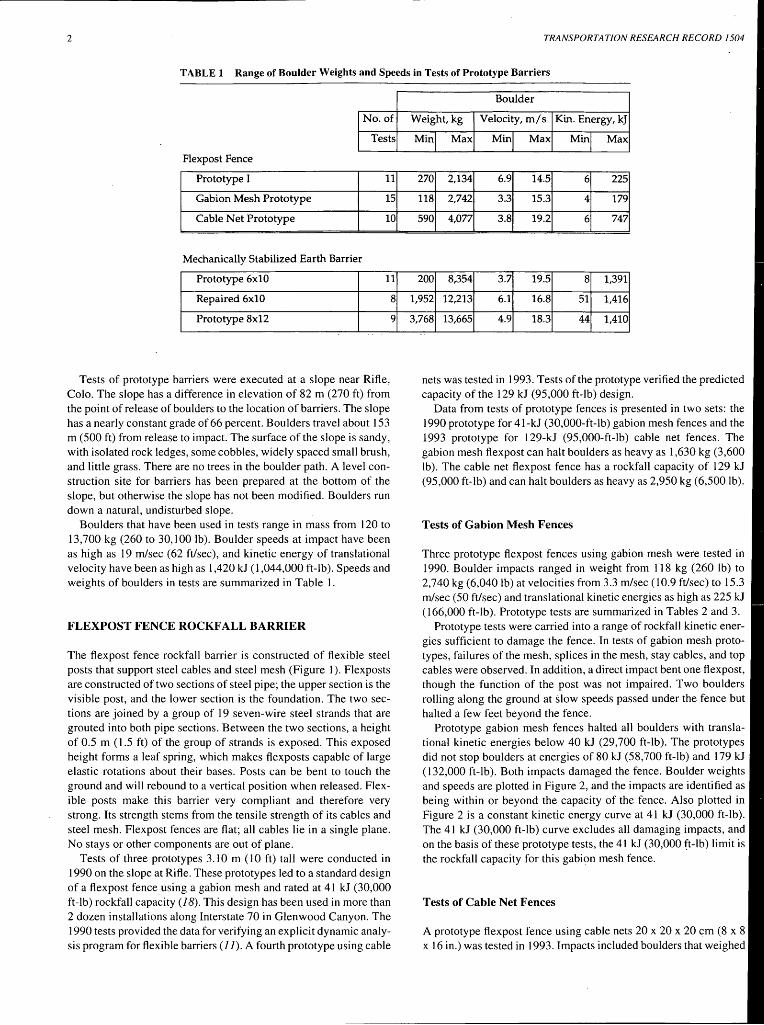
FIGURE 3 Deformed shapes of ftexpost fence after 54-kJ impact (images at .01 sec).
impact progresses, the boulder is slowed, but momentum of the posts carries the fence forward, allowing regions of the fence to slacken. The analysis must be able to accommodate large changes in contact forces, evolution of the position of the contact between the fence and the boulder, large changes in fence geometry, and the occurrence of slack regions of the fence with nonzero velocity.
Dynamic analysis yields time histories of the following: contact forces, the position and velocity of the boulder, forces on compo-
nents of the fence, and the deformed geometry of the fence. Typical deformed geometries obtained in analysis are shown in Figures 3 and 4. Figure 3 shows a side view of a gabion mesh fence under impact by a 908-kg (2,000-lb) boulder with a translational velocity at impact of 11 m/sec (36 ft/sec). Beginning at the upper left, the 19 images show the deformed shape of the fence at 0.1-sec intervals. The boulder first pushes the mesh forward and then pulls posts forward. At 0.7 sec (the eighth image), cables and mesh are pulled taut
FIGURE 4 Deformed shapes of ftexpost fence after 54-kJ impact (images at 0.2 sec).

TRANSPORTATION RESEARCH BOARD National Research Council
Transportation Research Circular 456
ERRATA TRB Publications
(January 1997)
The original list of task force members in the Foreword includes names other than members of the task force. The list should read as follows:
Members of the task force included Salvatore J. Bellomo [now deceased], Jerry Gluck, Herbert S. Levinson, Vergil G. Stover, and Gail Yazersky-Ritzer.
Transportation Research Record 1483
pages 97 through 101
Figures 4-6 are incorrectly labeled in the volume. The correct arrangement is shown here on pages 2-5.
''ftqn~pQrtation Research Record 1504 1
pages 1, 7, 8 ! 1In the abstract and on pages 7 and 8, the conversion for J,360 kJ should be 106 ft-lh/
1
Hearn et al.
and the boulder is stopped. The release of cable tension forces ejects the boulder from the fence. The images span a period of only 1.8 sec. The recovery of posts is slower, even though, as demonstrated in the last images, the fence has begun to return to an upright position. Note also that the boulder bounces on the ground twice; once at 0. 7 sec and again at 1.6 sec. The combined effects of tension in the fence fabric and deflection of the posts leads the boulder to impacts with the ground surface, and these impacts dissipate the boulder's kinetic energy. Figure 4 shows a general view of the fence for the same boulder impact. These five images present fence geometry at 0.2-sec intervals. The view is from above and in front of the fence.
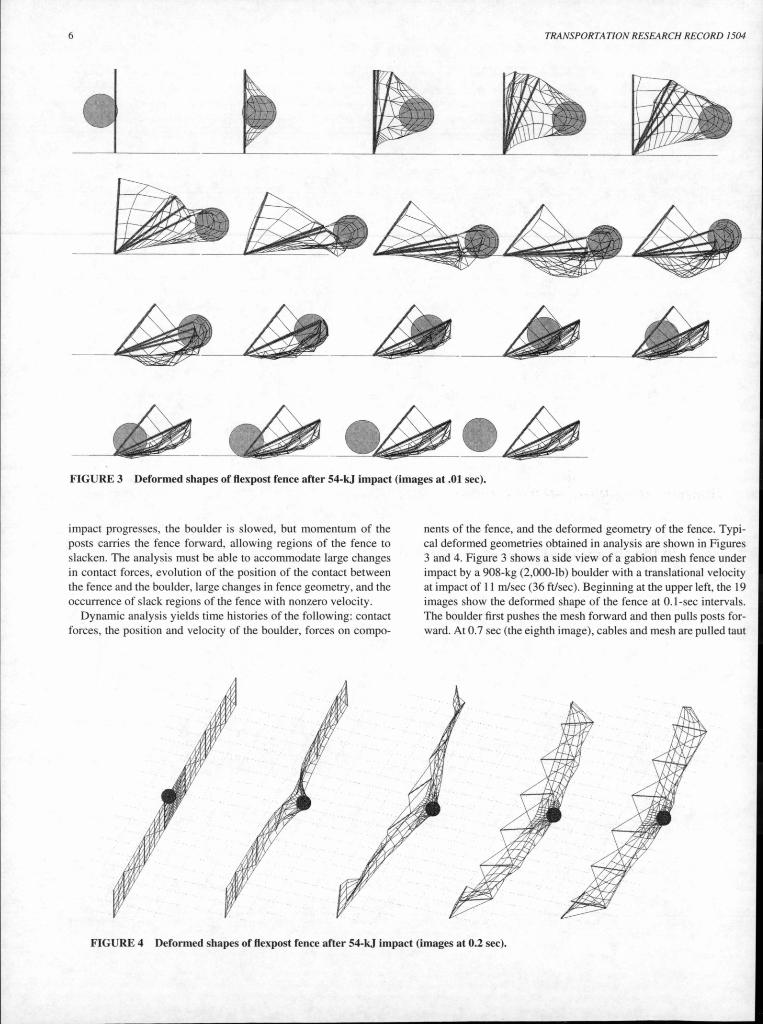
Figure 5 shows a simulation of Test No. 8 for the gabion mesh prototype. In the test, the boulder escaped the fence by rolling under it. The analysis correctly simulates this behavior. The boulder, which had been bouncing as it reached the fence, slips under the bottom of the mesh. The images show the impact at 0.1-sec intervals.
Results of dynamic analysis are verified against prototype tests through comparisons of deformed geometries and the disposition of the boulder and through a comparison of peak forces in components with breaking strength and observed damage in tests. In Tables 2 and 3, observations on damage to components from tests and from analysis are listed in the two columns labeled "Outcomes." Analyses used the same weight, speed, and position of impact of boulders that were observed in prototype tests. For all impacts that produced damage in a prototype, the analysis indicates an overstress condition. No damaging impacts are missed or omitted.
In all but one case, an overstress condition in analysis of an impact corresponds to observed failure of at least one component of a prototype. The exception is Test No. 14 for a gabion mesh prototype. Dynamic analysis indicates that the mesh is at 1.1 times its breaking strength for this impact. The mesh did not break in the test, though it did deform.
Overall, analysis results agree with the performance of prototype flexpost fences. The analysis identifies impacts that can be damaging to fences and yields data on forces on components. Such data are needed for fence design. The analysis confirms the 41-kJ (30,000-ft-lb) and 129-kJ (95,000-ft-lb) energy limits for gabion mesh and cable net fences, respectively.
FIGURE 5 Simulated boulder escape in Test No. 9.
MECHANICALLY STABILIZED EARTH ROCKFALL BARRIERS
7
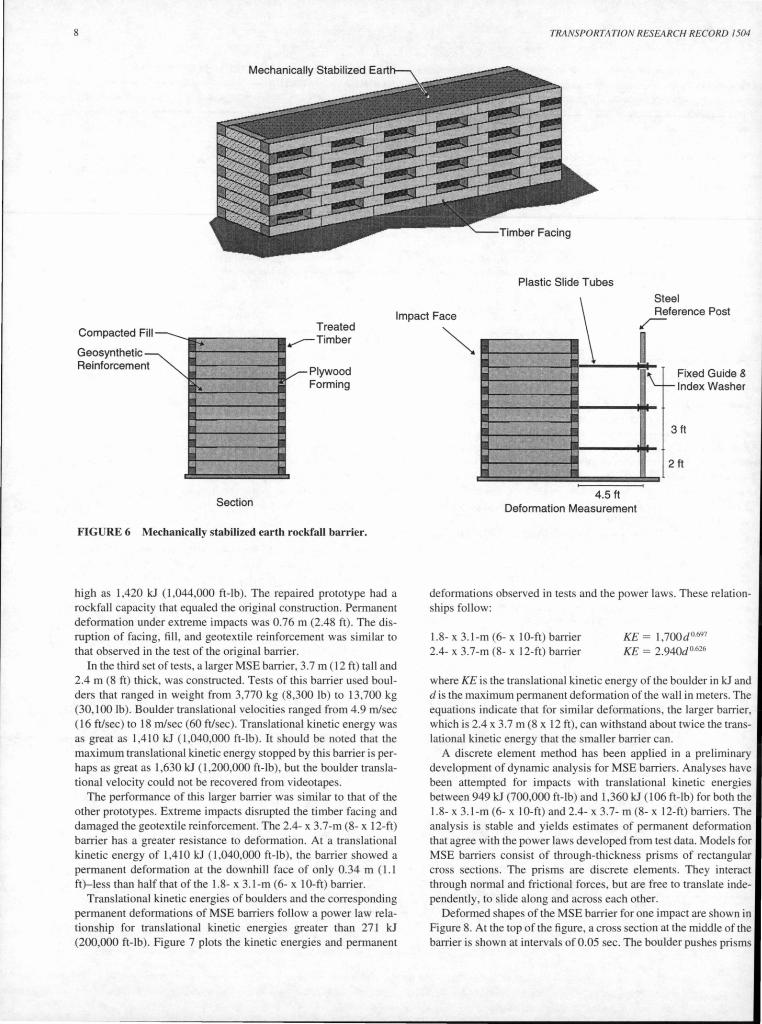
Very high rockfall capacities _are offered by MSEs. The Colorado Department of Transportation's design for MSE rockfall barriers uses a granular fill and non woven geotextile reinforcement in a freestanding, wrapped face wall (Figure 6). MSE rockfall barriers have halted boulders weighing as much as 13, 700 kg (30, 100 lb) with translational kinetic energies in excess of 1,360 kJ (106 ft-lb). In 29 impacts of three prototypes, no boulder has breached an MSE rockfall barrier.
Permanent deformations of prototypes are measured after each impact in tests. A series of 19 steel reference posts spaced at 1.2 m (4 ft) are installed on the downhill face of prototypes (Figure 6, lower right). Three sliding tubes are supported by each post and are placed with their tips imbedded in the face of the barrier. Deformations of the wall push the slide tubes forward, and this movement is recorded.
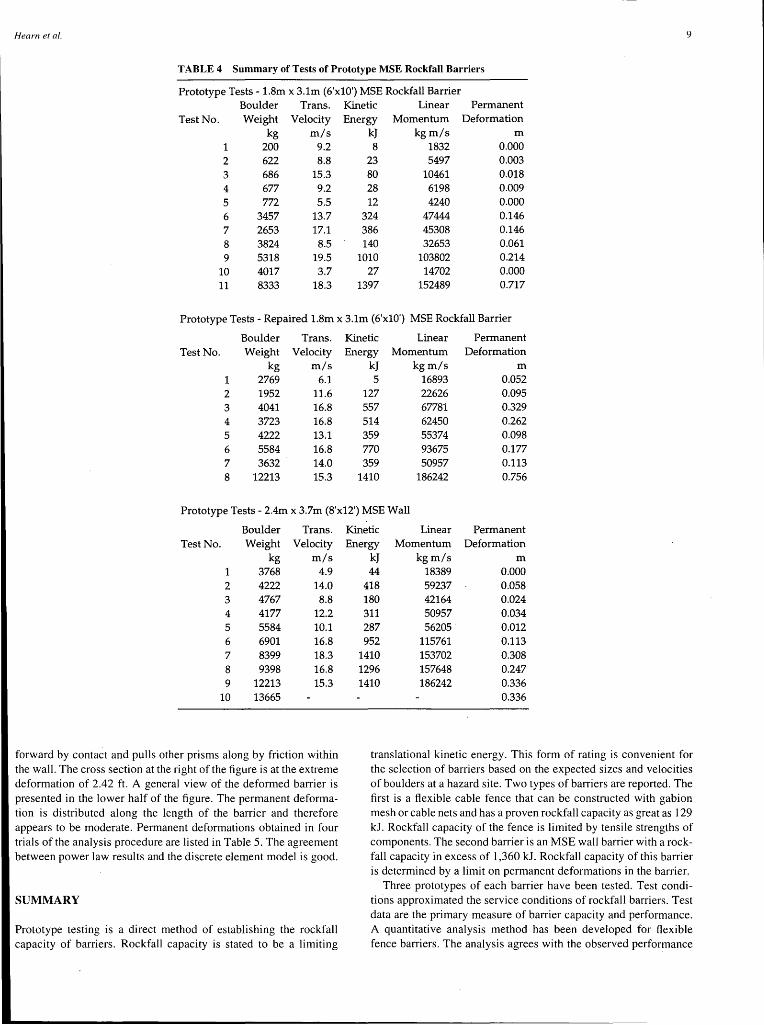
Three prototypes have been tested. The first was a barrier 1.8 m (6 ft) thick, 3.1 m (10 ft) tall, and 27.5 m (90 ft) long. This prototype underwent 11 impacts by boulders ranging in weight from 200 kg ( 440 lb) to 8,330 kg (18,400 lb). Boulder speeds ranged from 3.7 m/sec ( 12 ft/sec) to 20 m/sec (64 ft/sec), and translational kinetic energy was as great as 1,400 kJ (1,030,000 ft-lb). Rockfall tests left this barrier with permanent deformations of 0.76 m (2.5 ft) on the downhill face. The most severe impact damaged timber facing, ripped geotextile reinforcements locally and allowed some of the fill to spill out. Damage occurred almost entirely on the impact (uphill) face of the barrier. The downhill face showed large, permanent deformations and some dislocation of timbers, but no rupture of geotextile and no loss of fill. Impacts and permanent deformations of the 1.8- x 3.1-m (6- x 10-ft) prototype are summarized in Table 4.
The 1.8- x 3.1-m (6- x 10-ft) prototype was repaired and retested. Approximately 11 lineal meters (36 ft) of the barrier were reconstructed. The repairs restored the 1.8- x 3.1-m (6- x 10-ft) prototype to its original configuration. The repaired prototype was tested. In these tests, boulder weights ranged from 1,950 kg ( 4,300 lb) to 12,200 kg (26,900 lb). Boulder speeds ranged from 6.1 m/sec (20 ft/sec) to 17 m/sec (55 ft/sec). Translational kinetic energy was as
8 TRANSPORTATION RESEARCH RECORD I 504
Mechanically Stabilized Eart
Timber Facing
Plastic Slide Tubes
Impact Face \ Steel Reference Post ~
Geosynthetic Reinforcement
Section
Plywood Forming
FIGURE 6 Mechanically stabilized earth rockfall barrier.
high as 1,420 kJ (1,044,000 ft-lb). The repaired prototype had a rockfall capacity that equaled the original construction. Permanent deformation under extreme impacts was 0.76 m (2.48 ft) . The disruption of facing, fill, and geotextile reinforcement was similar to that observed in the test of the original barrier.
In the third set of tests, a larger MSE barrier, 3.7 m (12 ft) tall and 2.4 m (8 ft) thick, was constructed. Tests of this barrier used boulders that ranged in weight from 3,770 kg (8,300 lb) to 13,700 kg (30,100 lb). Boulder translational velocities ranged from 4.9 m/sec (16 ft/sec) to 18 m/sec (60 ft/sec). Translational kinetic energy was as great as 1,410 kJ (1,040,000 ft-lb). It should be noted that the maximum translational kinetic energy stopped by this barrier is perhaps as great as 1,630 kJ (1 ,200,000 ft-lb), but the boulder translational velocity could not be recovered from videotape .
The performance of this larger barrier was similar to that of the other prototypes. Extreme impacts disrupted the timber facing and damaged the geotextile reinforcement. The 2.4- x 3.7-m (8- x 12-ft) barrier ha a greater resistance to deformation. At a translational kinetic energy of 1,410 kJ (1 ,040,000 ft-lb), the barrier showed a permanent deformation at the downhill face of only 0.34 m ( 1.1 ft)-less than half that of the 1.8- x 3.1-m (6- x 10-ft) barrier.
Translational kinetic energies of boulders and the corresponding permanent deformation of MSE barriers follow a power law relationship for translational kinetic energies greater than 271 kJ (200,000 ft-lb). Figure 7 plots the kinetic energies and permanent
I I
I
I
• I
I
I
I
I
• I
I I
I ,.
I
• I
I
4.5ft Deformation Measurement
I I I\_
,_
~
3
2
Fixed Guide 8 Index Washer
ft
ft
deformations observed in tests and the power laws. These relationships follow:
1.8- x 3.1-m (6- x 10-ft) barrier 2.4- x 3.7-m (8- x 12-ft) barrier
KE= l,700d 0.697
KE= 2.940d 0·626
where KE is the translational kinetic energy of the boulder in kJ and dis the maximum permanent deformation of the wall in meters. The equations indicate that for similar deformations, the larger barrier, which is 2.4 x 3.7 m (8 x 12 ft), can withstand about twice the translational kinetic energy that the smaller barrier can.
A discrete element method ha been applied in a preliminary development of dynamic analysis for MSE barriers. Analyses have been attempted for impacts with translational kinetic energies between 949 kJ (700,000 ft-lb) and 1,360 kJ (106 ft-lb) for both the 1.8- x 3.1-m (6- x 10-ft) and 2.4- x 3.7- m (8- x 12-ft) barriers. The analy i i stable and yields estimates of permanent deformation that agree with the power laws developed from test data. Models for MSE barriers consist of through-thicknes prisms of rectangular cross sections. The prisms are discrete elements. They interact through normal and frictional forces , but are free to tran late independently, to slide along and across each other.
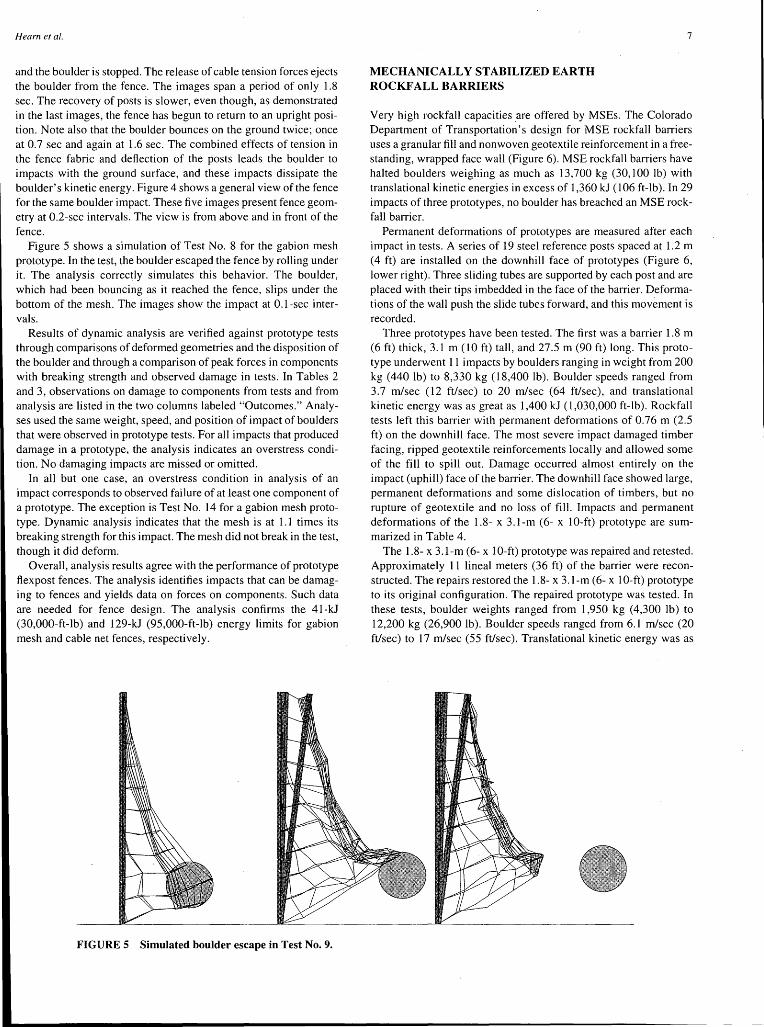
Deformed shapes of the MSE barrier for one impact are shown in Figure 8. At the top of the figure, a cro s section at the middle of the barrier is shown at intervals of 0.05 sec. The boulder pushes prisms
---
Hearn eta/. 9
TABLE4 Summary of Tests of Prototype MSE Rockfall Barriers
Prototype Tests - l.8m x 3.lm (6'x10') MSE Rockfall Barrier Boulder Trans. Kinetic Linear Permanent
Test No. Weight Velocity Energy Momentum Deformation kg m/s kJ kgm/s m
1 200 9.2 8 1832 0.000 2 622 8.8 23 5497 0.003 3 686 15.3 80 10461 O.Q18
4 677 9.2 28 6198 0.009 5 772 5.5 12 4240 0.000 6 3457 13.7 324 47444 0.146 7 2653 17.1 386 45308 0.146 8 3824 8.5 140 32653 0.061 9 5318 19.5 1010 103802 0.214
10 4017 3.7 27 14702 0.000 11 8333 18.3 1397 152489 0.717
Prototype Tests - Repaired l.8m x 3.lm (6'x10') MSE Rockfall Barrier
Boulder Trans. Kinetic Linear Permanent Test No. Weight Velocity Energy Momentum Deformation
kg m/s kJ kgm/s m 1 2769 6.1 5 16893 0.052 2 1952 11.6 127 22626 0.095 3 4041 16.8 557 67781 0.329 4 3723 16.8 514 62450 0.262 5 4222 13.1 359 55374 0.098 6 5584 16.8 770 93675 0.177 7 3632 14.0 359 50957 0.113 8 12213 15.3 1410 186242 0.756
Prototype Tests - 2.4m x 3.7m (8'x12') MSE Wall
Boulder Trans. Test No. Weight Velocity
kg m/s 1 3768 4.9 2 4222 14.0 3 4767 8.8 4 4177 12.2 5 5584 10.1 6 6901 16.8 7 8399 18.3 8 9398 16.8 9 12213 15.3
10 13665
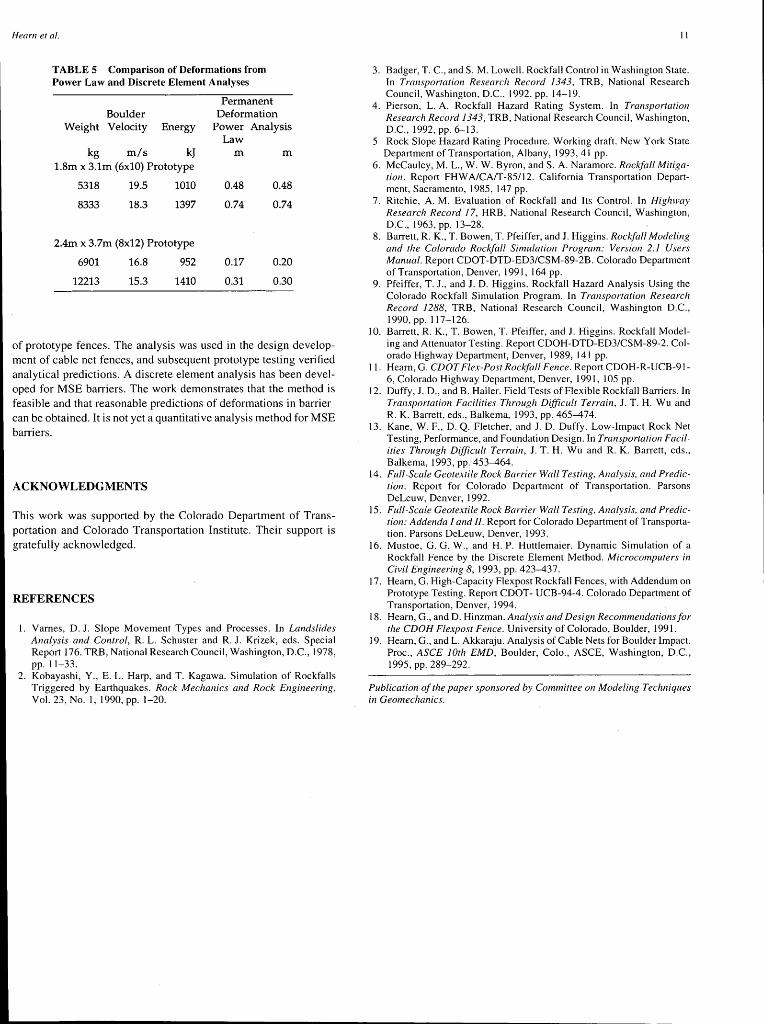
forward by contact and pulls other prisms along by friction within the wall. The cross section at the right of the figure is at the extreme deformation of 2.42 ft. A general view of the deformed barrier is presented in the lower half of the figure. The permanent deformation is distributed along the length of the barrier and therefore appears to be moderate. Permanent deformations obtained in four trials of the analysis procedure are listed in Table 5. The agreement between power law results and the discrete element model is good.
SUMMARY
Prototype testing is a direct method of establishing the rockfall capacity of barriers. Rockfall capacity is stated to be a limiting
Kinetic Linear Permanent Energy Momentum Deformation
kJ kgm/s m 44 18389 0.000
418 59237 0.058 180 42164 0.024 311 50957 0.034 287 56205. 0.012 952 115761 0.113
1410 153702 0.308 1296 157648 0.247 1410 186242 0.336
0.336
translational kinetic energy. This form of rating is convenient for the selection of barriers based on the expected sizes and velocities of boulders at a hazard site. Two types of barriers are reported. The first is a flexible cable fence that can be constructed with gabion mesh or cable nets and has a proven rockfall capacity as great as 129 kJ. Rockfall capacity of the fence is limited by tensile strengths of components. The second barrier is an MSE wall barrier with a rockfall capacity in excess of 1,360 kJ. Rockfall capacity of this barrier is determined by a limit on permanent deformations in the barrier.
Three prototypes of each barrier have been tested. Test conditions approximated the service conditions of rockfall barriers. Test data are the primary measure of barrier capacity and performance. A quantitative analysis method has been developed for flexible fence barriers. The analysis agrees with the observed performance

0.9
0.8
0.7 •
= 0.6 c::' 0 ·.:: fU e 0.5 0 -Q>
0
Computedd
~x 3 lm Barrie'
• l.8m x 3.lm Barrier
• 2.4m x 3.7m Barrier .... 0.4 c:: Q>
; e 0.3 Q>
• ~ •
0.2 • Computedd
0.1 2.4m x 3.7m Barrier
0
0 200 400 600 800 1000 1200 1400 1600
Kinetic Energy, kJ
FIGURE7 Test impacts and power law relationships for MSE rockfall barriers.
FIGURE 8 Deformed shapes of MSE rockfall barrier after 1,400-kJ impact (images at 0.05 sec).
Hearn et al.
TABLE 5 Comparison of Deformations from Power Law and Discrete Element Analyses
Boulder Weight Velocity Energy
kg m/s kJ l.8m x 3.lm (6x10) Prototype
5318 19.5 1010
8333 18.3 1397
2.4m x 3.7m (8x12) Prototype
6901 16.8 952
12213 15.3 1410
Permanent Deformation
Power Law
m
0.48
0.74
0.17
0.31
Analysis
m
0.48
0.74
0.20
0.30
of prototype fences. The analysis was used in the design development of cable net fences, and subsequent prototype testing verified analytical predictions. A discrete element analysis has been developed for MSE barriers. The work demonstrates that the method is feasible and that reasonable predictions of deformations in barrier can be obtained. It is not yet a quantitative analysis method for MSE barriers.
ACKNOWLEDGMENTS
This work was supported by the Colorado Department of Transportation and Colorado Transportation Institute. Their support is gratefully acknowledged.
REFERENCES
1. Varnes, D. J. Slope Movement Types and Processes. In Landslides Analysis and Control, R. L. Schuster and R. J. Krizek, eds. Special Report 176. TRB, National Research Council, Washington, D.C., 1978, pp. 11-33.
2. Kobayashi, Y., E. L. Harp, and T. Kagawa. Simulation of Rockfalls Triggered by Earthquakes. Rock Mechanics and Rock Engineering, Vol. 23, No. 1, 1990, pp. 1-20.
II
3. Badger, T. C., and S. M. Lowell. Rockfall Control in Washington State. In Transportation Research Record 1343, TRB, National Research Council, Washington, D.C., 1992, pp. 14-19.
4. Pierson, L. A. Rockfall Hazard Rating System. In Transportation Research Record 1343, TRB, National Research Council, Washington, D.C., 1992, pp. 6-13.
5 Rock Slope Hazard Rating Procedure. Working draft. New York State Department of Transportation, Albany, 1993, 41 pp.
6. McCauley, M. L., W.W. Byron, and S. A. Naramore. Rockfall Mitigation. Report FHWA/CAff-85112. California Transportation Department, Sacramento, 1985, 147 pp.
7. Ritchie, A. M. Evaluation of Rockfall and Its Control. In Highway Research Record 17, HRB, National Research Council, Washington, D.C., 1963, pp. 13-28.
8. Barrett, R. K., T. Bowen, T. Pfeiffer, and J. Higgins. Rockfall Modeling and the Colorado Rockfall Simulation Program: Version 2.1 Users Manual. Report CDOT-DTD-ED3/CSM-89-2B. Colorado Department of Transportation, Denver, 1991, 164 pp.
9. Pfeiffer, T. J., and J. D. Higgins. Rockfall Hazard Analysis Using the Colorado Rockfall Simulation Program. In Transportation Research Record 1288, TRB, National Research Council, Washington D.C., 1990, pp. 117-126.
10. Barrett, R. K., T. Bowen, T. Pfeiffer, and J. Higgins. Rockfall Modeling and Attenuator Testing. Report CDOH-DTD-ED3/CSM-89-2. Colorado Highway Department, Denver, 1989, 14 l pp.
11. Hearn, G. CDOT Flex-Post Rockfall Fence. Report CDOH-R-UCB-91-6, Colorado Highway Department, Denver, 1991, 105 pp.
12. Duffy, J. D., and B. Haller. Field Tests of Flexible Rockfall Barriers. In Transportation Facilities Through Difficult Terrain, J. T. H. Wu and R. K. Barrett, eds., Balkema, 1993, pp. 465-474.
13. Kane, W. F., D. Q. Fletcher, and J. D. Duffy. Low-Impact Rock Net Testing, Performance, and Foundation Design. In Transportation Facilities Through Difficult Terrain, J. T. H. Wu and R. K. Barrett, eds., Balkema, 1993, pp. 453-464.
14. Full-Scale Geotextile Rock Barrier Wall Testing, Analysis, and Prediction. Report for Colorado Department of Transportation. Parsons DeLeuw, Denver, 1992.
15. Full-Scale Geotextile Rock Barrier Wall Testing, Analysis, and Prediction: Addenda 1 and JI. Report for Colorado Department of Transportation. Parsons DeLeuw, Denver, 1993.
16. Mustoe, G. G. W., and H.P. Huttlemaier. Dynamic Simulation of a Rockfall Fence by the Discrete Element Method. Microcomputers in Civil Engineering 8, 1993, pp. 423-437.
17. Hearn, G. High-Capacity Flexpost Rockfall Fences, with Addendum on Prototype Testing. Report CDOT- UCB-94-4. Colorado Department of Transportation, Denver, 1994.
18. Hearn, G., and D. Hinzman. Analysis and Design Recommendations for the CDOH Flexpost Fence. University of Colorado, Boulder, 1991.
19. Hearn, G., and L. Akkaraju. Analysis of Cable Nets for Boulder Impact. Proc., ASCE 10th EMD, Boulder, Colo., ASCE, Washington, D.C., 1995,pp. 289-292.
Publication of the paper sponsored by Committee on Modeling Techniques in Geomechanics.