Testing and CFD Study of Airius Destratification Fans BSRIA Limited Old Bracknell Lane West,...
15
www.bsria.co.uk BSRIA Limited Old Bracknell Lane West, Bracknell, Berkshire RG12 7AH UK T: +44 (0)1344 465600 F: +44 (0)1344 465626 E: [email protected] W: www.bsria.co.uk This report must not be reproduced except in full without the written approval of an executive director of BSRIA. It is only intended to be used within the context described in the text. Report Testing and CFD Study of Airius Destratification Fans Report 50454/1 February 2007 Carried out for: Airius Europe Ltd Arena Nimrod way Ferndown BH21 7SH Compiled by: John Bryan Mark Roper Quality Approved: GREG KING BSc MSc M.InstR GROUP MANAGER McroClimate, Test
Transcript of Testing and CFD Study of Airius Destratification Fans BSRIA Limited Old Bracknell Lane West,...

www.bsria.co.uk
BSRIA Limited Old Bracknell Lane West, Bracknell, Berkshire RG12 7AH UK
T: +44 (0)1344 465600 F: +44 (0)1344 465626E: [email protected] W: www.bsria.co.uk
This report must not be reproduced except in full without the written approval of an executive director of BSRIA. It is only intended to be used within the context described in the text.
Report
Testing and CFD Study of Airius Destratification Fans Report 50454/1 February 2007 Carried out for: Airius Europe Ltd Arena Nimrod way Ferndown BH21 7SH Compiled by: John Bryan Mark Roper Quality Approved: GREG KING BSc MSc M.InstR GROUP MANAGER McroClimate, Test

TESTING AND CFD STUDY OF AIRIUS DESTRATIFICATION FANS CONTENTS
© BSRIA Report 50454/1 1
CONTENTS 1 INTRODUCTION............................................................................................................................. 2 2 AIR FLOW MEASUREMENT ........................................................................................................ 3 3 AIR JET MEASUREMENTS ........................................................................................................... 5
3.1 Test method ............................................................................................................................... 5 4 CFD MODEL SETUP....................................................................................................................... 6
4.1 Laboratory (Shed type building)................................................................................................ 6 4.2 Retail outlet ............................................................................................................................... 7
5 CFD RESULTS................................................................................................................................. 8 5.1 Laboratory (shed type building) ................................................................................................ 8 5.2 Retail Outlet............................................................................................................................. 12
6 DISCUSSION OF RESULTS ......................................................................................................... 13 BSRIA PRODUCTS AND SERVICES ................................................................................................ 14
FIGURES Figure 1 Airflow test arrangement ................................................................................................. 3 Figure 2 Airius 10, flow vs pressure chart ..................................................................................... 4 Figure 3 Airius 25, flow vs pressure chart ..................................................................................... 4 Figure 4 Measured airspeeds (left) and calculated air speeds (right) ............................................. 5 Figure 5 Modelled geometry .......................................................................................................... 6 Figure 6 Modelled geometry .......................................................................................................... 7 Figure 7 Temperature contours along centreline............................................................................ 8 Figure 8 Temperature contours with three fans installed ............................................................... 8 Figure 9 Temperature contours with four fans installed ................................................................ 9 Figure 10 Zone with temperatures above 20°C (no fans) ................................................................ 10 Figure 11 Zone with temperatures above 20°C (with three fans) .................................................... 10 Figure 12 Zone with temperatures above 20°C (with four fans)...................................................... 10 Figure 13 Zone with temperatures above 21°C (no fans) ................................................................ 11 Figure 14 Zone with temperatures above 21°C (with three fans) .................................................... 11 Figure 15 Zone with temperatures above 21°C (with four fans)...................................................... 11 Figure 16 Temperature contours (no fans) ....................................................................................... 12 Figure 17 Temperature contours (with fans) .................................................................................... 12
TESTING AND CFD STUDY OF AIRIUS DESTRATIFICATION FANS INTRODUCTION
© BSRIA Report 50454/1 2
1 INTRODUCTION
Airius Europe distributes a range of novel destratification fans. These fans are thought to be unique in that the fan is enclosed in a casing, which incorporates guide vanes and a nozzle so that the air is thrown in a narrower jet. This report presents the results of tests carried out on the model 10 and model 25 fan as well as computer simulations of the fans in operation. The test work firstly involved measuring the flowrate through the fans, so that these could be accurately set in the CFD models. The flowrates were measured in accordance with ISO 5801, in a Type A configuration (free inlet and outlet). The jet of air from the fans were then measured to ensure the throw from the fans was correctly represented in the CFD simulations. These measurements are beneficial since the geometry of the nozzle and the presence or absence of swirl can influence the jet spread.
TESTING AND CFD STUDY OF AIRIUS DESTRATIFICATION FANS VOLUME FLOW MEASUREMENT
© BSRIA Report 50454/1 3
2 VOLUME FLOW MEASUREMENT
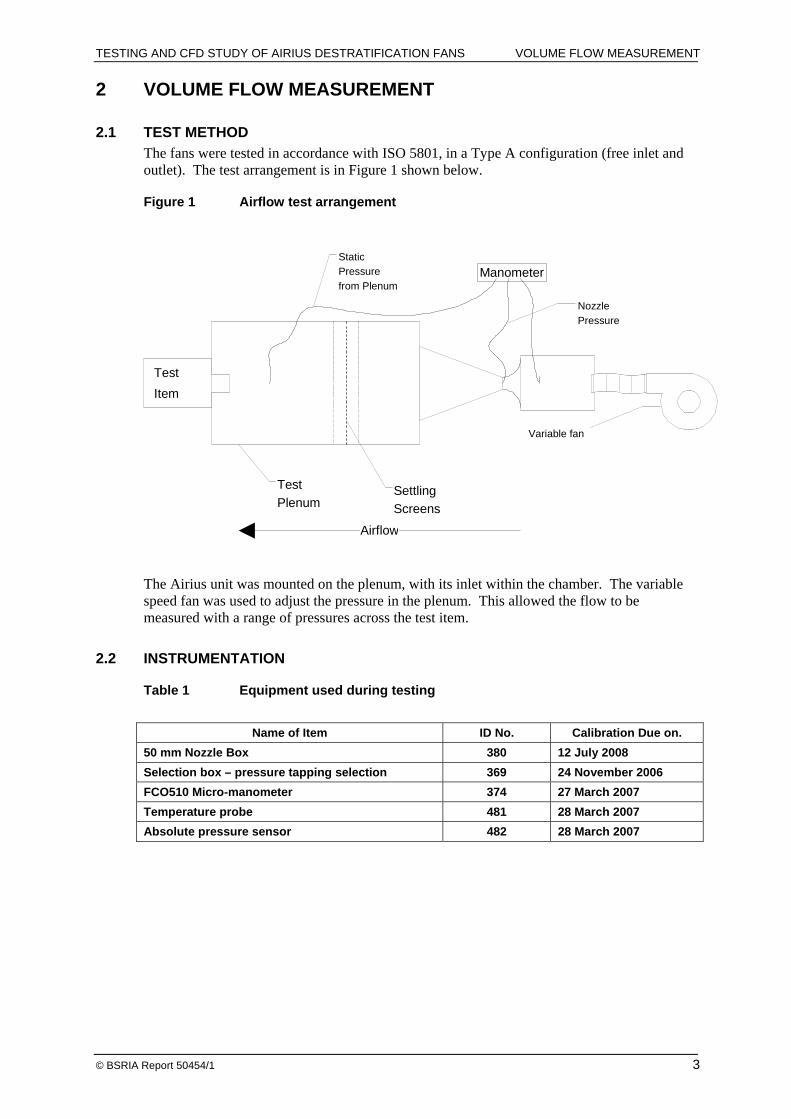
2.1 TEST METHOD The fans were tested in accordance with ISO 5801, in a Type A configuration (free inlet and outlet). The test arrangement is in Figure 1 shown below.
Figure 1 Airflow test arrangement
Manometer
SettlingScreens
Test Plenum
Airflow
StaticPressurefrom Plenum
Pressure
Test Item
Nozzle
Variable fan
The Airius unit was mounted on the plenum, with its inlet within the chamber. The variable speed fan was used to adjust the pressure in the plenum. This allowed the flow to be measured with a range of pressures across the test item.
2.2 INSTRUMENTATION
Table 1 Equipment used during testing
Name of Item ID No. Calibration Due on.
50 mm Nozzle Box 380 12 July 2008 Selection box – pressure tapping selection 369 24 November 2006 FCO510 Micro-manometer 374 27 March 2007 Temperature probe 481 28 March 2007 Absolute pressure sensor 482 28 March 2007
TESTING AND CFD STUDY OF AIRIUS DESTRATIFICATION FANS VOLUME FLOW MEASUREMENT
© BSRIA Report 50454/1 4
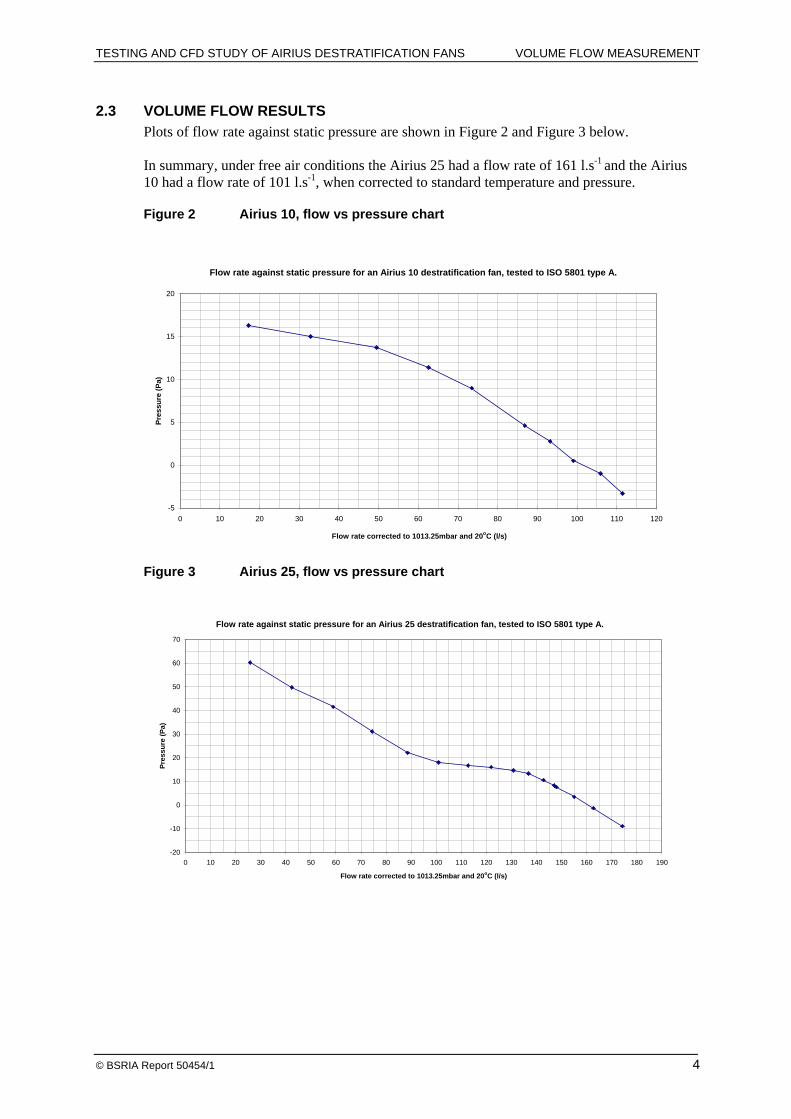
2.3 VOLUME FLOW RESULTS Plots of flow rate against static pressure are shown in Figure 2 and Figure 3 below. In summary, under free air conditions the Airius 25 had a flow rate of 161 l.s-1 and the Airius 10 had a flow rate of 101 l.s-1, when corrected to standard temperature and pressure.
Figure 2 Airius 10, flow vs pressure chart
Figure 3 Airius 25, flow vs pressure chart
Flow rate against static pressure for an Airius 10 destratification fan, tested to ISO 5801 type A.
-5
0
5
10
15
20
0 10 20 30 40 50 60 70 80 90 100 110 120
Flow rate corrected to 1013.25mbar and 20oC (l/s)
Pres
sure
(Pa)
Flow rate against static pressure for an Airius 25 destratification fan, tested to ISO 5801 type A.
-20
-10
0
10
20
30
40
50
60
70
0 10 20 30 40 50 60 70 80 90 100 110 120 130 140 150 160 170 180 190
Flow rate corrected to 1013.25mbar and 20oC (l/s)
Pres
sure
(Pa)
TESTING AND CFD STUDY OF AIRIUS DESTRATIFICATION FANS AIR JET MEASUREMENTS
© BSRIA Report 50454/1 5
3 AIR JET MEASUREMENTS
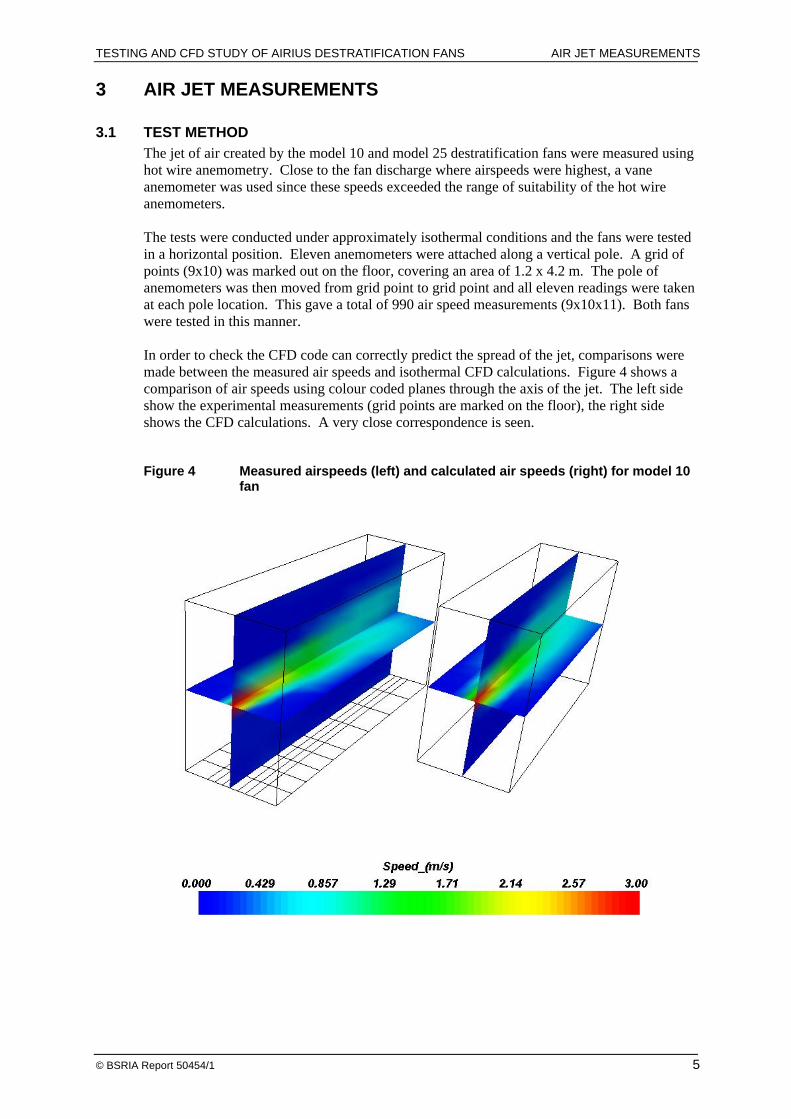
3.1 TEST METHOD The jet of air created by the model 10 and model 25 destratification fans were measured using hot wire anemometry. Close to the fan discharge where airspeeds were highest, a vane anemometer was used since these speeds exceeded the range of suitability of the hot wire anemometers. The tests were conducted under approximately isothermal conditions and the fans were tested in a horizontal position. Eleven anemometers were attached along a vertical pole. A grid of points (9x10) was marked out on the floor, covering an area of 1.2 x 4.2 m. The pole of anemometers was then moved from grid point to grid point and all eleven readings were taken at each pole location. This gave a total of 990 air speed measurements (9x10x11). Both fans were tested in this manner. In order to check the CFD code can correctly predict the spread of the jet, comparisons were made between the measured air speeds and isothermal CFD calculations. Figure 4 shows a comparison of air speeds using colour coded planes through the axis of the jet. The left side show the experimental measurements (grid points are marked on the floor), the right side shows the CFD calculations. A very close correspondence is seen.
Figure 4 Measured airspeeds (left) and calculated air speeds (right) for model 10 fan

TESTING AND CFD STUDY OF AIRIUS DESTRATIFICATION FANS CFD MODEL SETUP
© BSRIA Report 50454/1 6
4 CFD MODEL SETUP
The flovent CFD code was used to simulate airflows and temperatures three-dimensionally in the example buildings. Steady state results are presented (ie temperatures and airflow patterns after sufficient time for all values to stabilise to constant values).
4.1 LABORATORY (SHED TYPE BUILDING) The geometry of the building used to test the model 25 fan is shown in Figure 5. The building is loosely based on one of the BSRIA test laboratories. Floor plan dimensions are 10m x 30m and fan height is 7.5 m. Various test rigs are distributed around the space. One side of the building is glazed at high level. Fabric losses are based on an outdoor temperature of 2°C and U values of the structure set to coincide with Part L of the 2002 building regulations. To further help the space to stratify a 1.5 cm gap is modelled under the loading door and a similar open area is assumed at high level. By including these openings in the model, cold air tends to flow under the door and contribute to the stratification. Lighting is assumed to amount to 20 W/m2. This is implemented as 20 heated blocks at ceiling level, each one releasing 300 W. An oil-fired heater provides further heating. This is assumed to supply 60 l.s-1 of air at 80°C. In actuality the heater provides a much greater flow at a lower temperature, but this creates a strong jet that helps to mix the air and reduce stratification. The objective of this work was to investigate the ability of the Airius fans to destratify the space, so the modelled building was deliberately set to encourage stratification. When simulating the influence of the fans, three, model 25 fans, were arranged along the centre line of the building. Hence a floor area of 100 m2 per fan, is tested. A further simulation was then carried out with four fans (hence 75 m2 per fan)
Figure 5 Modelled geometry

TESTING AND CFD STUDY OF AIRIUS DESTRATIFICATION FANS CFD MODEL SETUP
© BSRIA Report 50454/1 7
4.2 RETAIL OUTLET The building selected to test the model 10 fan, was one corner of a retail outlet. The geometry is shown in Figure 6. An area 10 x 10 m is modelled, with a ceiling height of 3 m. In order to limit the model to a floor plate of 10 m x 10 m, airflows between the modelled region and the rest of the store are prevented (ie the corner is partitioned off from the rest of the store for modelling purposes). Lighting is modelled using nine heated blocks distributed along the ceiling, each one releasing 133 W. This gives a lighting load of 12 W/m2. To encourage stratification an outdoor temperature of 2°C is modelled and full height glazing is set along both external walls. U values of the building are set to correspond with the requirements of Part L of the 2002 building regulations. To heat the space, air at 24°C is supplied through four ceiling mounted diffusers. Two extract diffusers remove air from the space. The supply diffusers are of a four way throw type and supply 160 l.s-1each (extracts therefore remove 320 l.s-1). This results in an air change rate of 7.7 ACH.
Figure 6 Modelled geometry

TESTING AND CFD STUDY OF AIRIUS DESTRATIFICATION FANS CFD RESULTS
© BSRIA Report 50454/1 8
5 CFD RESULTS
5.1 LABORATORY (SHED TYPE BUILDING) In Figure 7 temperature contours are plotted. A colour coded vertical plane through the building shows how temperatures vary with location. The colours relate to temperatures as indicated in the legend. Cold air leaks under the door and spreads along the floor, creating a large region under 17°C. A stratified temperature distribution is predicted with warm air floating towards the roof. Figure 8 shows the corresponding result with the three fans operating. Since the contour plane passes through the fans, the warm jets can be seen projecting downwards. At the opposite side of the building from the door, destratification is almost complete. Close to the door, the steady flow of air into the building maintains a cold spot at ground level, but the improvement is obvious.
Figure 7 Temperature contours along centreline
Figure 8 Temperature contours with three fans installed

TESTING AND CFD STUDY OF AIRIUS DESTRATIFICATION FANS CFD RESULTS
© BSRIA Report 50454/1 9
Figure 9 below shows the same building with four fans operating. A further improvement over figure 8 is seen; with an even more uniform temperature distribution.
Figure 9 Temperature contours with four fans installed

TESTING AND CFD STUDY OF AIRIUS DESTRATIFICATION FANS CFD RESULTS
© BSRIA Report 50454/1 10
In Figure 10 the region with temperatures above 20°C is marked in green. This warm air is seen to float towards the top of the space and most of the occupied area is less than 20°C. The corresponding picture with three fans operating is shown in Figure 11. The layer of warm air, floating above occupants is reduced. Some of the columns of warm air from the fans are seen pouring down onto the floor. In figure 12 the scenario with four fans operating is shown. The blanket of warm air floating above the heads of the occupants is further reduced and the columns of warm air from the fans are clearly seen. The plume of warm air from the heater is also clearly visible.
Figure 10 Zone with temperatures above 20°C (no fans)
Figure 11 Zone with temperatures above 20°C (with three fans)
Figure 12 Zone with temperatures above 20°C (with four fans)
TESTING AND CFD STUDY OF AIRIUS DESTRATIFICATION FANS CFD RESULTS
© BSRIA Report 50454/1 11
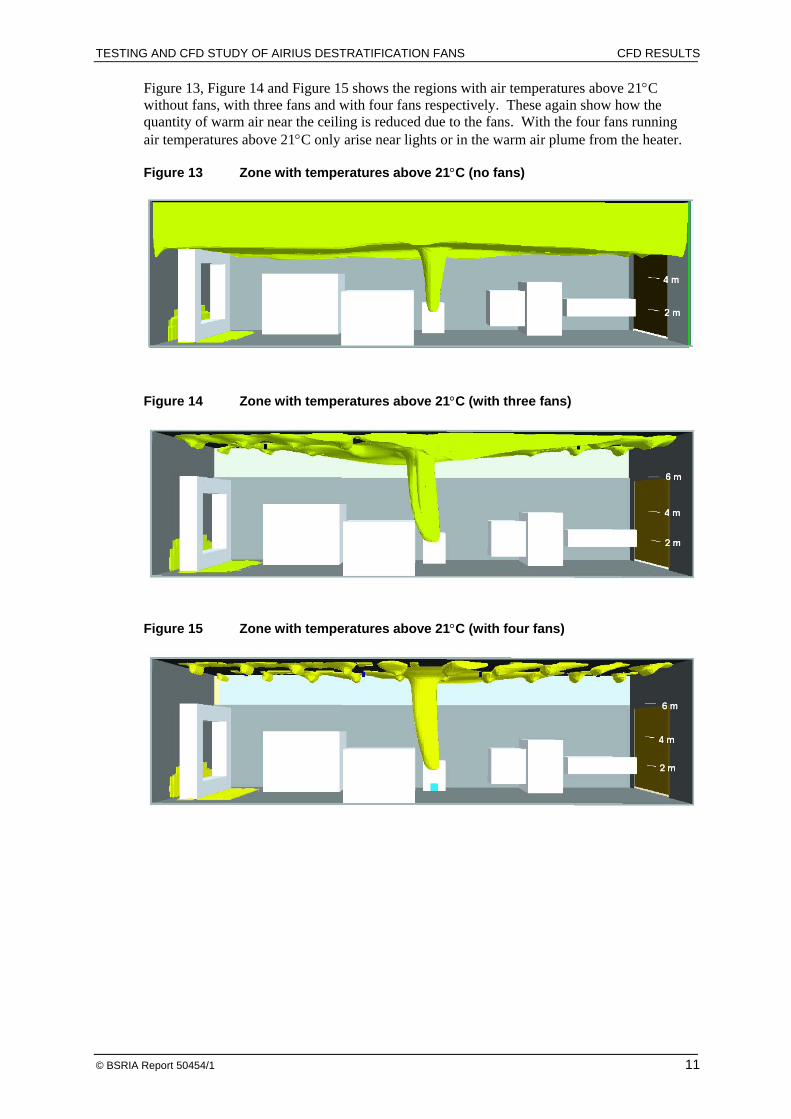
Figure 13, Figure 14 and Figure 15 shows the regions with air temperatures above 21°C without fans, with three fans and with four fans respectively. These again show how the quantity of warm air near the ceiling is reduced due to the fans. With the four fans running air temperatures above 21°C only arise near lights or in the warm air plume from the heater.
Figure 13 Zone with temperatures above 21°C (no fans)
Figure 14 Zone with temperatures above 21°C (with three fans)
Figure 15 Zone with temperatures above 21°C (with four fans)
TESTING AND CFD STUDY OF AIRIUS DESTRATIFICATION FANS CFD RESULTS
© BSRIA Report 50454/1 12
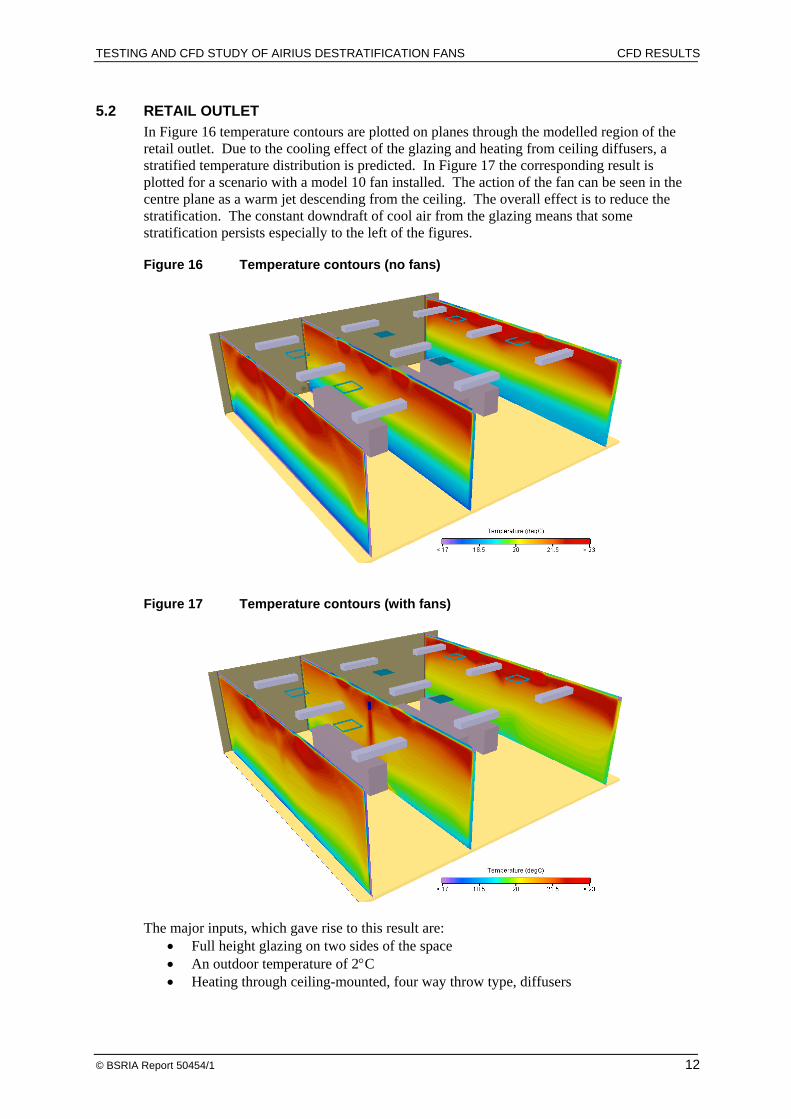
5.2 RETAIL OUTLET In Figure 16 temperature contours are plotted on planes through the modelled region of the retail outlet. Due to the cooling effect of the glazing and heating from ceiling diffusers, a stratified temperature distribution is predicted. In Figure 17 the corresponding result is plotted for a scenario with a model 10 fan installed. The action of the fan can be seen in the centre plane as a warm jet descending from the ceiling. The overall effect is to reduce the stratification. The constant downdraft of cool air from the glazing means that some stratification persists especially to the left of the figures.
Figure 16 Temperature contours (no fans)
Figure 17 Temperature contours (with fans)
The major inputs, which gave rise to this result are:
• Full height glazing on two sides of the space • An outdoor temperature of 2°C • Heating through ceiling-mounted, four way throw type, diffusers

TESTING AND CFD STUDY OF AIRIUS DESTRATIFICATION FANS DISCUSSION OF RESULTS
© BSRIA Report 50454/1 13
6 DISCUSSION OF RESULTS
Tests in accordance with ISO 5801 were conducted to determine the flowrates for the two Airius destratification fans. A flowrate of 101 l.s-1 was measured for the model 10 destratification fan and a flowrate of 161 l.s-1 was measured for the model 25 fan. Air speed measurements were made across a grid of points in front of both fans to examine the spread of the jet and to ensure the CFD software could accurately represent this, in simulations of room airflow. A narrow jet was observed from these measurements, possibly because the fan incorporated vanes apparently designed to remove swirl. A good correlation was observed between CFD simulations and measurements of air speed. A CFD model of a shed type building was used to examine the performance of the model 25 fan. Stratification in the test building was ensured by a combination of low outdoor temperatures, leakage under the loading door and heating via a low velocity air supply. The initial model without fans showed a stratification of 17.0 - 22.6 °C between floor and roof at the centre point of the building. With four fans operating, this stratification reduced to 19.8 – 21.6 °C at the centre point of the building. The extent to which stratification is reduced is dependant on the location. The best improvements are seen near the back wall of the laboratory, well away from the influence of the leaking door. The result is also dependant on the height at which the temperatures are read. This comparison is based on an ankle level measurement and ceiling level measurement. A CFD model of one corner of a retail outlet was used to examine the performance of the model 10 fan. Stratification in the test building was ensured by a combination of low outdoor temperatures, full height glazing on the external walls and heating from ceiling mounted diffusers. With no fan fitted a stratification of 18.3 – 22.2 °C was observed in the centre of the space. With the fan operating a stratification of 19.1 – 21.7 °C was observed. As for the previous example, the influence of the fan varied throughout the space. Improvements were greatest furthest away from the influence of the cold glazing. As in the previous example the result is dependant on the height of the temperature measurements as well as the position in the room. Less stratification would be apparent if these temperatures were quoted at waist height instead of ankle height.
BSRIA products and services
BSRIA is a consultancy, test and research organisation helping construction and building services companies to become more efficient and effective. Our 128-strong team of building services experts can provide the best solutions to the most searching problems ensuring complete confidentiality and individual service at all times.
Working with BSRIA gives you confidence in design, added value in manufacture, competitive advantage in marketing and strategy, profitable construction, effective commissioning and accurate measurement, and efficient building operation and maintenance.
BSRIA membership enables organisations to demonstrate that they are leading the industry through innovation and best practice.
Across all activities
Design Construct Operate Manufacture Management & Marketing
Instrument solutions Hire Calibration Sales On site services Training
Information IBSEDEX – building services abstracts
Enquiry service Library Push information (2006)
Publications Hard copy On line
Training Specialist topics: Whole life costing Introduction to building services
Variable speed pumping
Facilitation and workshops Relationships Partnering workshops Team building
Secretariat support BSETG Co-Construct Constructing Excellence
Technical authoring
Committee facilitation and support
Research management
Expert witness work
Design quality and process guidance
Design validation Physical modelling Thermal modelling CFD BREEAM assessments
Proof of performance testing Standard & bespoke tests
(see list under manufacture)
Whole life costing Life cycle analysis Consultancy in: Air tightness Cooling of IT rooms
Sustainability Grey water Water conservation Renewables Control strategies
Specialist enclosure testing Museum display cabinets
Site productivity improvement Measurement Lessons learned database
Modular training, feedback and toolbox talks
Pocket project handbooks
Management KPIs Publications Consultancy and mentoring
Training
Approval inspections Thermal imaging of fabric Raised floor leakage test
Building envelope leakage test (for Part L)
Roof inspections Fire stop testing Offsite fabrication Proof of performance and installability
(see also design)
Strategic Services Maintenance strategy Business focussed maintenance schedules
Building management systems
Procurement advice O&M benchmarking Health and safety audit
Energy efficiency assessments Building MOTs Energy audits Control system surveys
Water and air quality
Internal environment monitoring Comfort measurement Sick building syndrome assessment
Indoor air quality Pollution monitoring
Plant and system investigations Troubleshooting Performance checks Maintenance tasks
Site surveys and condition monitoring Plant condition surveys Vibration and sound Non-destructive testing Magnetic field Thermal imaging
(failures - electrical plant, damp, underfloor heating, chilled ceilings)
Ultrasonic pipe work testing
Power quality Electrical surveys Magnetic field survey Lighting level and control survey
For due diligence and legal compliance
Testing and certification to recognised standards Air cleaners Air filters Air handling units Air heaters Atomising oil nozzles Axial fans Blockwork porosity Boilers Chilled ceilings Chillers Coolers and condensers Displacement ventilation Ductwork Expansion vessels Fan coils Fire valves Flue lining systems Fume cupboards Louvres Metal flues, chimneys, fittings and terminals
Radiators Refrigeration equipment Smoke and fume extraction fans
Testing thermal performance, emissions, EMC, MTBF, noise
Testing to client requirements
Energy labelling
Product failure analysis
Standards development Writing Evaluating Publishing
Design of test facilities
Support for new product development
Business strategy Strategic planning Bespoke assignments, or one day consultancies
Procurement advice Bid support Business Performance Forum
Supply chain management
Partnering workshops
Marketing strategy - confidential studies on:
Market entry Acquisition New product development
Technical appraisal Distributions and pricing strategy
Market research - size and structure of markets Heating, air conditioning, plumbing and sanitaryware, controls, renewables, structured cabling, FM and contracting Confidential studies Published reports Global studies annually In depth studies
Statistics clubs
Attitudinal studies
Customer research Customer satisfaction Product acceptability Understanding clients’ needs
Market research techniques used: Focus groups Personal interview Desk research Telephone, fax and web surveys
Questionnaire design