TEST REPORT Covering the DYNAMIC FREQUENCY SELECTION...
22
File: R78277 Page 1 of 22 TEST REPORT Covering the DYNAMIC FREQUENCY SELECTION (DFS) REQUIREMENTS OF FCC Part 15 Subpart E (UNII) Summit Data Communications Inc SDC-MSD30AG UPN: 6616A-SDCMSD30AG FCCID: TWG-SDCMSD30AG COMPANY: Summit Data Communications Inc 526 South Main Street Suite 805 Akron, OH, 44311 TEST SITE: Elliott Laboratories 684 W. Maude Ave Sunnyvale, CA 94085 REPORT DATE: April 12, 2010 FINAL TEST DATE: February 8-9, 2010 TEST ENGINEER: Mehran Birgani AUTHORIZED SIGNATORY: ______________________________ Mark Hill Staff Engineer Elliott Laboratories is accredited by the A2LA, certificate number 2016-01, to perform the test(s) listed in this report. This report shall not be reproduced, except in its entirety, without the written approval of Elliott Laboratories 2016-01
Transcript of TEST REPORT Covering the DYNAMIC FREQUENCY SELECTION...

File: R78277 Page 1 of 22
TEST REPORT
Covering the DYNAMIC FREQUENCY SELECTION (DFS)
REQUIREMENTS OF
FCC Part 15 Subpart E (UNII)
Summit Data Communications Inc
SDC-MSD30AG UPN: 6616A-SDCMSD30AG FCCID: TWG-SDCMSD30AG COMPANY: Summit Data Communications Inc 526 South Main Street Suite 805 Akron, OH, 44311 TEST SITE: Elliott Laboratories 684 W. Maude Ave Sunnyvale, CA 94085 REPORT DATE: April 12, 2010 FINAL TEST DATE: February 8-9, 2010 TEST ENGINEER: Mehran Birgani AUTHORIZED SIGNATORY: ______________________________ Mark Hill Staff Engineer
Elliott Laboratories is accredited by the A2LA, certificate number 2016-01, to perform the test(s) listed in this report. This report shall not be reproduced, except in its entirety, without the written approval of Elliott Laboratories
2016-01

Elliott Laboratories -- EMC Department Test Report Report Date: April 12, 2010
File: R78277 Page 2 of 22
REVISION HISTORY Rev # Date Comments Modified By
- April 12, 2010 First Release -

Elliott Laboratories -- EMC Department Test Report Report Date: April 12, 2010
File: R78277 Page 3 of 22
TABLE OF CONTENTS COVER PAGE.............................................................................................................................................................1 REVISION HISTORY................................................................................................................................................2 TABLE OF CONTENTS ............................................................................................................................................3 LIST OF TABLES.......................................................................................................................................................3 LIST OF FIGURES.....................................................................................................................................................4 SCOPE..........................................................................................................................................................................5 OBJECTIVE................................................................................................................................................................5 STATEMENT OF COMPLIANCE...........................................................................................................................5 DEVIATIONS FROM THE STANDARD ................................................................................................................5 EQUIPMENT UNDER TEST (EUT) DETAILS......................................................................................................6
GENERAL................................................................................................................................................................6 ENCLOSURE...........................................................................................................................................................6 MODIFICATIONS...................................................................................................................................................6 SUPPORT EQUIPMENT.........................................................................................................................................7 EUT INTERFACE PORTS ......................................................................................................................................7 EUT OPERATION...................................................................................................................................................7
RADAR WAVEFORMS.............................................................................................................................................8 TEST RESULTS..........................................................................................................................................................9
TEST RESULTS SUMMARY – FCC PART 15, CLIENT DEVICE .......................................................................9 MEASUREMENT UNCERTAINTIES....................................................................................................................9
DFS TEST METHODS.............................................................................................................................................10 RADIATED TEST METHOD ...............................................................................................................................10
DFS MEASUREMENT INSTRUMENTATION....................................................................................................12 RADAR GENERATION SYSTEM .......................................................................................................................12 CHANNEL MONITORING SYSTEM..................................................................................................................13
DFS MEASUREMENT METHODS .......................................................................................................................14 DFS – CHANNEL CLOSING TRANSMISSION TIME AND CHANNEL MOVE TIME ..................................14 DFS – CHANNEL NON-OCCUPANCY AND VERIFICATION OF PASSIVE SCANNING............................14 DFS CHANNEL AVAILABILITY CHECK TIME...............................................................................................14 TRANSMIT POWER CONTROL (TPC) ..............................................................................................................14
SAMPLE CALCULATIONS ...................................................................................................................................15 DETECTION PROBABILITY / SUCCESS RATE ...............................................................................................15 THRESHOLD LEVEL ...........................................................................................................................................15
APPENDIX A TEST EQUIPMENT CALIBRATION DATA..............................................................................16 APPENDIX B TEST DATA TABLES AND PLOTS FOR CHANNEL CLOSING ...........................................17
FCC PART 15 SUBPART E CHANNEL CLOSING MEASUREMENTS .................................................................17 APPENDIX C TEST CONFIGURATION PHOTOGRAPHS..............................................................................22
LIST OF TABLES Table 1 FCC Short Pulse Radar Test Waveforms .......................................................................... 8 Table 2 FCC Long Pulse Radar Test Waveforms........................................................................... 8 Table 3 FCC Frequency Hopping Radar Test Waveforms............................................................. 8 Table 4 FCC Part 15 Subpart E Client Device Test Result Summary............................................ 9 Table 5 FCC Part 15 Subpart E Channel Closing Test Results .................................................... 17

Elliott Laboratories -- EMC Department Test Report Report Date: April 12, 2010
File: R78277 Page 4 of 22
LIST OF FIGURES
Figure 1 Test Configuration for radiated Measurement Method.................................................. 10 Figure 2 Channel Closing Time and Channel Move Time – 40 second plot................................ 18 Figure 3 Close-Up of Transmissions Occurring More Than 200ms After The End of Radar...... 19 Figure 4 Radar Channel Non-Occupancy Plot ............................................................................. 20 Figure 5 Radar Channel Non-Occupancy Plot (Passive Scan) ..................................................... 21

Elliott Laboratories -- EMC Department Test Report Report Date: April 12, 2010
File: R78277 Page 5 of 22
SCOPE The Federal Communications Commission and the European Telecommunications Standards Institute (ETSI) publish standards regarding ElectroMagnetic Compatibility and Radio spectrum Matters for radio-communications devices. Tests have been performed on the Summit Data Communications Inc. SDC-MSD30AG in accordance with these standards.
Test data has been taken pursuant to the relevant DFS requirements of the following standard(s):
• FCC Part 15 Subpart E Unlicensed National Information Infrastructure (U-NII) Devices
Tests were performed in accordance with these standards together with the current published versions of the basic standards referenced therein as outlined in Elliott Laboratories test procedures.
The test results recorded herein are based on a single type test of the Summit Data Communications Inc SDC-MSD30AG and therefore apply only to the tested sample. The sample was selected and prepared by Jerry Pohmurski of Summit Data Communications Inc.
OBJECTIVE
The objective of the manufacturer is to comply with the standards identified in the previous section. In order to demonstrate compliance, the manufacturer or a contracted laboratory makes measurements and takes the necessary steps to ensure that the equipment complies with the appropriate technical standards. Compliance with some DFS features is covered through a manufacturer statement or through observation of the device.
STATEMENT OF COMPLIANCE The tested sample of Summit Data Communications Inc SDC-MSD30AG complied with the DFS requirements of:
FCC Part 15.407(h)(2)
Maintenance of compliance is the responsibility of the manufacturer. Any modifications to the product should be assessed to determine their potential impact on the compliance status of the device with respect to the standards detailed in this test report.
DEVIATIONS FROM THE STANDARD The following deviations were made from the test methods and requirements covered by the scope of this report:
As the typical host system for this product is unable to play the FCC movie file specified in FCC 06-96, an alternate method of exercising the EUT was used. This method was approved by the FCC, see Appendix F.

Elliott Laboratories -- EMC Department Test Report Report Date: April 12, 2010
File: R78277 Page 6 of 22
EQUIPMENT UNDER TEST (EUT) DETAILS
GENERAL
The Summit Data Communications Inc SDC-MSD30AG is an 802.11a/g wireless LAN radio module, which is designed to send and receive wireless data communication. Normally, the EUT would be installed in a mobile device during operation. The EUT was, therefore, placed in this position during emissions testing to simulate the end user environment. The electrical rating of the EUT is 3.3V.
The sample was received on February 8, 2010 and tested on February 8-9, 2010. The EUT consisted of the following component(s):
Manufacturer Model Description Serial Number Summit Data
Communications SDC-MSD30AG 802.11 abg Compact
Flash Adapter with Antenna Connectors
00000002C
The manufacturer declared values for the EUT operational characteristics that affect DFS are as follows:
Operating Modes (5250 – 5350 MHz, 5470 – 5725 MHz) Client Device (no In Service Monitoring, no Ad-Hoc mode)
Antenna Gains / EIRP (5250 – 5350 MHz, 5470 – 5725 MHz)
5250 – 5350 MHz 5470 – 5725 MHzLowest Antenna Gain (dBi) 3.5 3.5 Highest Antenna Gain (dBi) 6.5 6.5 Output Power (dBm) 10.3 10.5
Channel Protocol
IP Based ENCLOSURE
The EUT does not have an enclosure as it is designed to be installed within the enclosure of a host computer or system. It measures approximately 4.3 cm wide by 5.5 cm deep by 0.5 cm high.
MODIFICATIONS
The EUT did not require modifications during testing in order to comply with the requirements of the standard(s) referenced in this test report.

Elliott Laboratories -- EMC Department Test Report Report Date: April 12, 2010
File: R78277 Page 7 of 22
SUPPORT EQUIPMENT
The following equipment was used as local support equipment for testing:
Manufacturer Model Description Serial Number FCC ID Cisco Systems Air-AP 1252G-AK9 Access Point FTX1209906U AIR-RM1252G
HP iPAQ PDA 2CK5510K22 X11-21264 Dell Inspiron 8600 Laptop - DoC
Airlink Airlink 101 Router 030008256167 RRK-AR430W
The italicized device was the master device.
EUT INTERFACE PORTS
The I/O cabling configuration during testing was as follows:
Cable(s) Port Connected To Description Shielded or Unshielded Length (m)
None - - - - EUT OPERATION
The EUT was operating with the following software. The software is secured by binary encryption to prevent the user from disabling the DFS function.
Client Device: 3.00.50
During the channel move tests the system was configured with a FTP file transfer of the FCC video file from the master device (sourced by the PC connected to the master device via an Ethernet interface) to the client device.
The transferred file was the “FCC” test file and the client device was using an FTP as a FCC approved alternate method, required by FCC Part 15 Subpart E.

Elliott Laboratories -- EMC Department Test Report Report Date: April 12, 2010
File: R78277 Page 8 of 22
RADAR WAVEFORMS
Table 1 FCC Short Pulse Radar Test Waveforms
Radar Type Pulse Width (µsec)
PRI (µsec)
Pulses / burst
Minimum Detection
Percentage
Minimum Number of
Trials 1 1 1428 18 60% 30 2 1-5 150-230 23-29 60% 30 3 6-10 200-500 16-18 60% 30 4 11-20 200-500 12-16 60% 30
Aggregate (Radar Types 1-4) 80% 120
Table 2 FCC Long Pulse Radar Test Waveforms
Radar Type
Pulse Width (µsec)
Chirp Width (MHz)
PRI (µsec)
Pulses / burst
Number of Bursts
Minimum Detection Percentage
Minimum Number of
Trials 5 50-100 5-20 1000-2000 1-3 8-20 80% 30
Table 3 FCC Frequency Hopping Radar Test Waveforms
Radar Type
Pulse Width (µsec)
PRI (µsec)
Pulses / hop
Hopping Rate
(kHz)
Hopping Sequence Length (msec)
Minimum Detection Percentage
Minimum Number of
Trials
6 1 333 9 0.333 300 70% 30

Elliott Laboratories -- EMC Department Test Report Report Date: April 12, 2010
File: R78277 Page 9 of 22
TEST RESULTS
TEST RESULTS SUMMARY – FCC Part 15, CLIENT DEVICE
Table 4 FCC Part 15 Subpart E Client Device Test Result Summary
Description Radar Type
Radar Frequency
Measured Value Requirement Test Data Status
Channel closing transmission time Type 1 5280MHz 1.5 ms <60 ms Appendix B Complied
Channel move time Type 1 5280MHz 1.7 s <10 s Appendix B Complied
Non-occupancy period - associated
Type 1 5280MHz > 30 minutes > 30 minutes Appendix B Complied
Passive Scanning N/A N/A Refer to manufacturer attestation Notes: 1) Tests were performed using the radiated test method. 2) Channel availability check, detection threshold and non-occupancy period are not applicable to client
devices. MEASUREMENT UNCERTAINTIES
ISO/IEC 17025 requires that an estimate of the measurement uncertainties associated with the emissions test results be included in the report. The measurement uncertainties given below are based on a 95% confidence level, with a coverage factor (k=2) and were calculated in accordance with UKAS document LAB 34.
Measurement Measurement Unit Expanded Uncertainty
Timing (Channel move time, aggregate transmission time)
ms Timing resolution +/- 0.24%
Timing (non occupancy period) seconds 5 seconds
DFS Threshold (radiated) dBm 1.6 DFS Threshold (conducted) dBm 1.2

Elliott Laboratories -- EMC Department Test Report Report Date: April 12, 2010
File: R78277 Page 10 of 22
DFS TEST METHODS
RADIATED TEST METHOD
The combination of master and slave devices is located in an anechoic chamber. The simulated radar waveform is transmitted from a directional horn antenna (typically an EMCO 3115) toward the unit performing the radar detection (radar detection device, RDD). Every effort is made to ensure that the main beam of the EUT’s antenna is aligned with the radar-generating antenna.
Figure 1 Test Configuration for radiated Measurement Method
~3m
Radar Generation System
Traffic Monitoring System
Anechoic Chamber Master Device
MonitoringAntenna
Radar Antenna

Elliott Laboratories -- EMC Department Test Report Report Date: April 12, 2010
File: R78277 Page 11 of 22
The signal level of the simulated waveform is set to a reference level equal to the threshold level (plus 1dB if testing against FCC requirements). Lower levels may also be applied on request of the manufacturer. The level reported is the level at the RDD antenna and so it is not corrected for the RDD’s antenna gain. The RDD is configured with the lowest gain antenna assembly intended for use with the device.
The signal level is verified by measuring the CW signal level from the radar generation system using a reference antenna of gain G (dBi). The radar signal level is calculated from the measured level, R (dBm), and any cable loss, L (dB), between the reference antenna and the measuring instrument:
Applied level (dBm) = R – GREF + L
If both master and client devices have radar detection capability then the device not under test is positioned with absorbing material between its antenna and the radar generating antenna, and the radar level at the non RDD is verified to be at least 20dB below the threshold level to ensure that any responses are due to the RDD detecting radar.
The antenna connected to the channel monitoring subsystem is positioned to allow both master and client transmissions to be observed, with the level of the EUT’s transmissions between 6 and 10dB higher than those from the other device.
The combination of master and slave devices is located in an anechoic chamber. The simulated radar waveform is coupled into the unit performing the radar detection (radar detection device, RDD) via couplers and attenuators.
The signal level of the simulated waveform is set to a reference level equal to the threshold level (plus 1dB if testing against FCC requirements). Lower levels may also be applied on request of the manufacturer.
The signal level is verified by measuring the CW signal level at the coupling point to the RDD antenna port. The radar signal level is calculated from the measured level, R (dBm) and the lowest gain antenna assembly intended for use with the RDD, GRDD (dBi):
Applied level (dBm) = R - GRDD
If both master and client devices have radar detection capability then the radar level at the non RDD is verified to be at least 20dB below the threshold level to ensure that any responses are due to the RDD detecting radar.
The antenna connected to the channel monitoring subsystem is positioned to allow both master and client transmissions to be observed, with the level of the EUT’s transmissions between 6 and 10dB higher than those from the other device.

Elliott Laboratories -- EMC Department Test Report Report Date: April 12, 2010
File: R78277 Page 12 of 22
DFS MEASUREMENT INSTRUMENTATION
RADAR GENERATION SYSTEM
An Agilent PSG is used as the radar-generating source. The integral arbitrary waveform generators are programmed using Agilent’s “Pulse Building” software and Elliott custom software to produce the required waveforms, with the capability to produce both un-modulated and modulated (FM Chirp) pulses. Where there are multiple values for a specific radar parameter then the software selects a value at random and, for FCC tests, the software verifies that the resulting waveform is truly unique.
With the exception of the hopping waveforms required by the FCC’s rules (see below), the radar generator is set to a single frequency within the radar detection bandwidth of the EUT. The frequency is varied from trial to trial by stepping in 5MHz steps.
Frequency hopping radar waveforms are simulated using a time domain model. A randomly hopping sequence algorithm (which uses each channel in the hopping radar’s range once in a hopping sequence) generates a hop sequence. A segment of the first 100 elements of the hop sequence are then examined to determine if it contains one or more frequencies within the radar detection bandwidth of the EUT. If it does not then the first element of the segment is discarded and the next frequency in the sequence is added. The process repeats until a valid segment is produced. The radar system is then programmed to produce bursts at time slots coincident with the frequencies within the segment that fall in the detection bandwidth. The frequency of the generator is stepped in 1 MHz increments across the EUT’s detection range.
The radar signal level is verified during testing using a CW signal with the AGC function switched on. Correction factors to account for the fact that pulses are generated with the AGC functions switched off are measured annually and an offset is used to account for this in the software.
The generator output is connected to the coupling port of the conducted set-up or to the radar-generating antenna.

Elliott Laboratories -- EMC Department Test Report Report Date: April 12, 2010
File: R78277 Page 13 of 22
CHANNEL MONITORING SYSTEM
Channel monitoring is achieved using a spectrum analyzer and digital storage oscilloscope. The analyzer is configured in a zero-span mode, center frequency set to the radar waveform’s frequency or the center frequency of the EUT’s operating channel. The IF output of the analyzer is connected to one input of the oscilloscope.
A signal generator output is set to send either the modulating signal directly or a pulse gate with an output pulse co-incident with each radar pulse. This output is connected to a second input on the oscilloscope and the oscilloscope displays both the channel traffic (via the if input) and the radar pulses on its display.
For in service monitoring tests the analyzer sweep time is set to > 20 seconds and the oscilloscope is configured with a data record length of 10 seconds for the short duration and frequency hopping waveforms, 20 seconds for the long duration waveforms. Both instruments are set for a single acquisition sequence. The analyzer is triggered 500ms before the start of the waveform and the oscilloscope is triggered directly by the modulating pulse train. Timing measurements for aggregate channel transmission time and channel move time are made from the oscilloscope data, with the end of the waveform clearly identified by the pulse train on one trace. The analyzer trace data is used to confirm that the last transmission occurred within the 10-second record of the oscilloscope. If necessary the record length of the oscilloscope is expanded to capture the last transmission on the channel prior to the channel move.
Channel availability check time timing plots are made using the analyzer. The analyzer is triggered at start of the EUT’s channel availability check and used to verify that the EUT does not transmit when radar is applied during the check time.
The analyzer detector and oscilloscope sampling mode is set to peak detect for all plots.

Elliott Laboratories -- EMC Department Test Report Report Date: April 12, 2010
File: R78277 Page 14 of 22
DFS MEASUREMENT METHODS
DFS – CHANNEL CLOSING TRANSMISSION TIME AND CHANNEL MOVE TIME
Channel clearing and closing times are measured by applying a burst of radar with the device configured to change channel and by observing the channel for transmissions. The time between the end of the applied radar waveform and the final transmission on the channel is the channel move time.
The aggregate transmission closing time is measured in one of two ways:
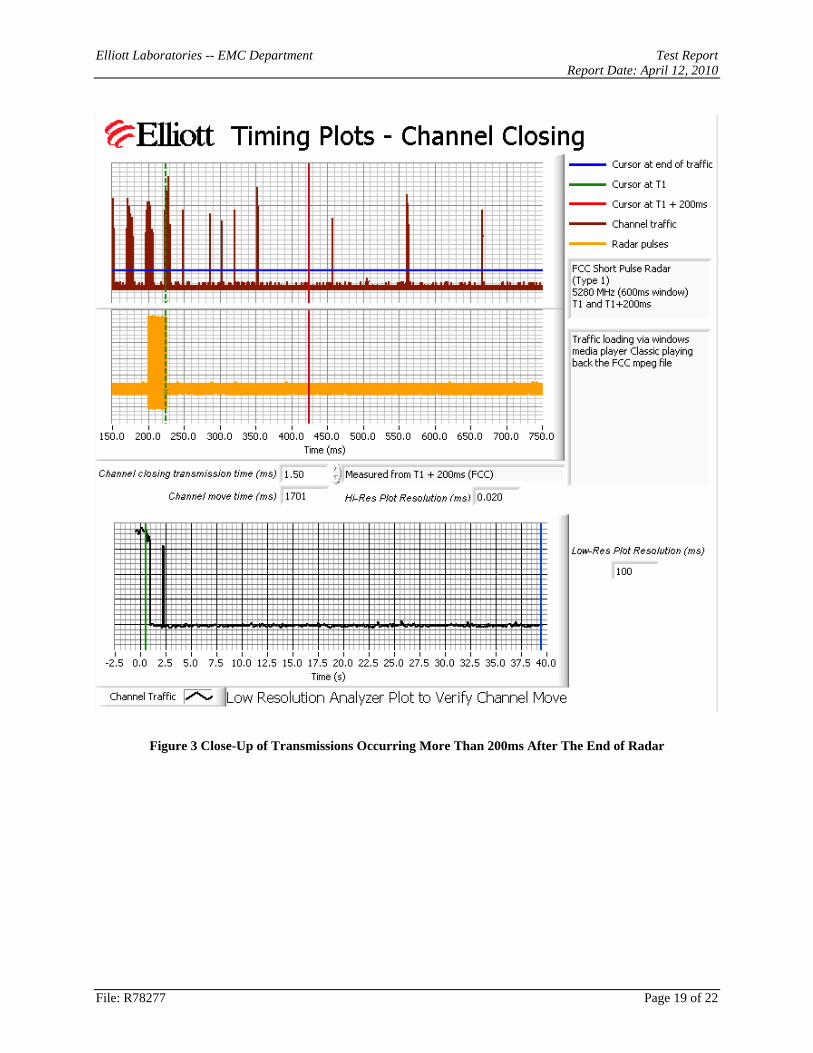
FCC – the total time of all individual transmissions from the EUT that are observed starting 200ms at the end of the last radar pulse in the waveform. This value is required to be less than 60ms.
DFS – CHANNEL NON-OCCUPANCY AND VERIFICATION OF PASSIVE SCANNING
The channel that was in use prior to radar detection by the master is additionally monitored for 30 minutes to ensure no transmissions on the vacated channel over the required non-occupancy period. This is achieved by tuning the spectrum analyzer to the vacated channel in zero-span mode and connecting the IF output to an oscilloscope. The oscilloscope is triggered by the radar pulse and set to provide a single sweep (in peak detect mode) that lasts for at least 30 minutes after the end of the channel move time.
For devices with a client-mode that are being evaluated against FCC rules the manufacturer must supply an attestation letter stating that the client device does not employ any active scanning techniques (i.e. does not transmit in the DFS bands without authorization from a Master device).
DFS CHANNEL AVAILABILITY CHECK TIME
It is preferred that the EUT report when it starts the radar channel availability check. If the EUT does not report the start of the check time, then the time to start transmitting on a channel after switching the device on is measured to approximate the time from power-on to the end of the channel availability check. The start of the channel availability check is assumed to be 60 seconds prior to the first transmission on the channel.
To evaluate the channel availability check, a single burst of one radar type is applied within the first 2 seconds of the start of the channel availability check and it is verified that the device does not use the channel by continuing to monitor the channel for a period of at least 60 seconds. The test is repeated by applying a burst of radar in the last 2 seconds (i.e. between 58 and 60 seconds after the start of CAC) of the channel availability check.
TRANSMIT POWER CONTROL (TPC)
Compliance with the transmit power control requirements for devices is demonstrated through measurements showing multiple power levels and manufacturer statements explaining how the power control is implemented.

Elliott Laboratories -- EMC Department Test Report Report Date: April 12, 2010
File: R78277 Page 15 of 22
SAMPLE CALCULATIONS
DETECTION PROBABILITY / SUCCESS RATE
The detection probability, or success rate, for any one radar waveform equals the number of successful trials divided by the total number of trials for that waveform.
THRESHOLD LEVEL
The threshold level is the level of the simulated radar waveform at the EUT’s antenna. If the test is performed in a conducted fashion then the level at the rf input equals the level at the antenna plus the gain of the antenna assembly, in dBi. The gain of the antenna assembly equals the gain of the antenna minus the loss of the cabling between the rf input and the antenna. The lowest gain value for all antenna assemblies intended for use with the device is used when making this calculation.
If the test is performed using the radiated method then the threshold level is the level at the antenna.

Elliott Laboratories -- EMC Department Test Report Report Date: April 12, 2010
File: R78277 Page 16 of 22
Appendix A Test Equipment Calibration Data
Manufacturer Description Model # Asset # Cal Due Hewlett Packard Spectrum Analyzer 8595EM 780 5-Jan-11 Tektronix Digital Oscilloscope TDS 5052B 2118 28-Sep-10 Agilent Technologies PSG Vector Signal Generator E8267C 1877 15-Mar-10 EMCO 1-18GHz Horn Antenna 3115 487 15-Jul-10 ETS Lindgren 1-18GHz Horn Antenna 3117 1662 11-Apr-10

Elliott Laboratories -- EMC Department Test Report Report Date: April 12, 2010
File: R78277 Page 17 of 22
Appendix B Test Data Tables and Plots for Channel Closing
FCC PART 15 SUBPART E Channel Closing Measurements
Table 5 FCC Part 15 Subpart E Channel Closing Test Results
Channel Closing Transmission Time 1
Channel Move Time Waveform Type
Measured Limit Measured Limit Result
Radar Type 1 1.5 ms 60 ms 1.7 s 10 s Complied After the final channel closing test the channel was monitored for a further 30 minutes. No transmissions occurred on the channel.
1 Channel closing time for FCC measurements is the aggregate transmission time starting from 200ms after the end of the radar signal to the completion of the channel move.

Elliott Laboratories -- EMC Department Test Report Report Date: April 12, 2010
File: R78277 Page 18 of 22
Figure 2 Channel Closing Time and Channel Move Time – 40 second plot
Elliott Laboratories -- EMC Department Test Report Report Date: April 12, 2010
File: R78277 Page 19 of 22
Figure 3 Close-Up of Transmissions Occurring More Than 200ms After The End of Radar

Elliott Laboratories -- EMC Department Test Report Report Date: April 12, 2010
File: R78277 Page 20 of 22
Figure 4 Radar Channel Non-Occupancy Plot
The non-occupancy plot was made over a 30-minute time period following the channel move time with the analyzer IF output connected to the scope and tuned to the vacated channel. No transmissions were observed after the channel move had been completed. After the channel move the client re-associated with the master device on the new channel.
Elliott Laboratories -- EMC Department Test Report Report Date: April 12, 2010
File: R78277 Page 21 of 22
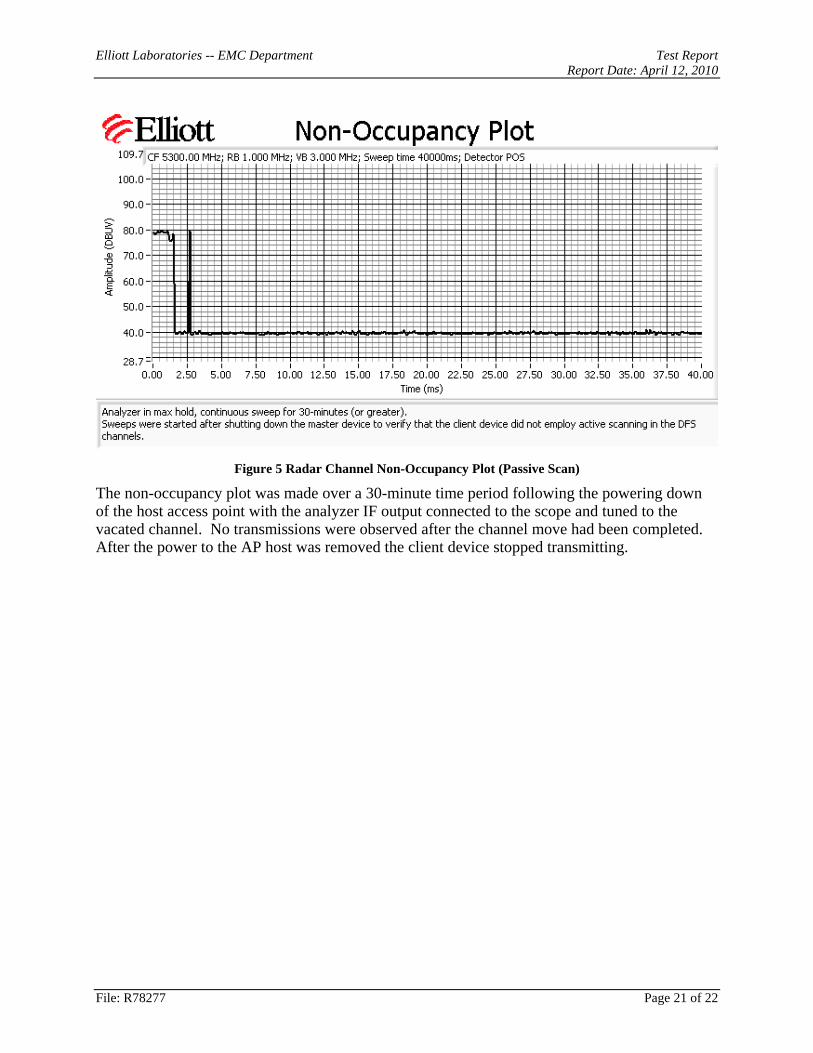
Figure 5 Radar Channel Non-Occupancy Plot (Passive Scan)
The non-occupancy plot was made over a 30-minute time period following the powering down of the host access point with the analyzer IF output connected to the scope and tuned to the vacated channel. No transmissions were observed after the channel move had been completed. After the power to the AP host was removed the client device stopped transmitting.

Elliott Laboratories -- EMC Department Test Report Report Date: April 12, 2010
File: R78277 Page 22 of 22
Appendix C Test Configuration Photographs