
Test Feasibility Survey PAKISTAN: Education Sector in Pakistan Overview Document - 1 - Test...
32
Education in Pakistan Overview Document - 1 - Test Feasibility Survey PAKISTAN: Education Sector Tahir Andrabi * Pomona College Jishnu Das The World Bank Asim Ijaz Khwaja Harvard University With Duriya Farooqi (Harvard University) and Tristan Zajonc (Pomona College) October 29, 2002 * [email protected], [email protected], [email protected]. We would like to acknowledge additional help in instrument design provided by Anila Asghar.
Transcript of Test Feasibility Survey PAKISTAN: Education Sector in Pakistan Overview Document - 1 - Test...

Education in Pakistan Overview Document
- 1 -
Test Feasibility Survey PAKISTAN: Education Sector
Tahir Andrabi* Pomona College
Jishnu Das
The World Bank
Asim Ijaz Khwaja Harvard University
With Duriya Farooqi (Harvard University) and Tristan Zajonc (Pomona College)
October 29, 2002
* [email protected], [email protected], [email protected]. We would like to acknowledge additional help in instrument design provided by Anila Asghar.
Education in Pakistan Overview Document
- 2 -
I. Introduction
As a preliminary effort in the process of obtaining data on the quality of education
provided by schools in Pakistan, a feasibility study was conducted during June and July of 2002
aimed at building the needed knowledge and capacities to conduct more extensive testing in the
future. This document provides background information for the feasibility test instrument, the
rationale behind the test design, a description of the test content, a formal validation of each
individual test and notes on issues that arose during the test’s administration and preliminary data
analysis. Thus, the document serves as a composite review and test validation base for future
assessment work in Pakistan that can directly feed into the ongoing project on National
Assessment.
The document is organized as follows. Section II summarizes previous assessments of primary
education undertaken in Pakistan over the past two decades. These studies provide a
contextualization for the current efforts. Section III details the justification behind conducting the
present study. Section IV provides an overview of the assessment instrument, discussing both the
test design and content. Section V covers the procedural and implementation issues faced during
the administration of the test instrument and a diverse range of concerns related the interpretation
of the results. This section includes a summary of the actions that were taken, or that should be
taken in the future, to address these issues and concerns. Section VI presents a detailed
assessment of the testing instrument using methods derived from Item-Response Theory to
examine the validity of each question (henceforth item) as well as the precision of the test taken
in it’s entirety. Finally, section VII outlines the kinds of results that can be studied with such a
testing exercise. However, we strongly caution against the use of the results presented here for
drawing any conclusions about learning outcomes in Pakistani schools given the non-random
nature of the sample and the small sample size of 245 test takers.
In addition, the appendices provide the educational frameworks referenced for literacy and
mathematics (appendix 1), the actual test instrument with its scoring key and preliminary analysis
on its discrimination and potential problems (appendix 2) and results from the detailed item-
response analysis carried out on each question (appendix 3).

Education in Pakistan Overview Document
- 3 -
II. Previous Studies
Since 1984, at least 19 assessments of primary education in Pakistan have been conducted. These
efforts gained momentum after the World Declaration on Education for All (EFA) in 1990 and
again with the joint UNESCO-UNICEF global initiative for Monitoring Learning Achievement in
1996. The studies have been both national and provincial in scope and focused on various
competencies/content areas. UNESCO (2001) provides an excellent summary of previous
assessment work in Pakistan and the summaries below draw from this document.
A. Early Studies – 1980s
The first two major assessments of primary education in Pakistan were the World Bank’s
Primary Education Project in 1984 and the BRIDGES project of the Harvard Institute of
International Development in 1988-89.
The Primary Education Project study compared Science and Mathematics achievement of
3,300 students of grades 4 and 5 in a representative sample of project and non-project schools in
Punjab, Sindh and the North-Western Frontier Province (NWFP). Shah (1984) summarizes the
results. In all three provinces, girls scored higher in sciences while boys scored higher in
mathematics. However, achievement for all groups was low and based on these results, the
author suggests that schools should primarily focus on ensuring that students acquire basic
competencies rather than increasing peripheral luxuries in the curriculum. Interestingly, the
correlation between professional teacher qualifications and test outcomes was fairly weak, with a
significant positive correlation only in one province.
The BRIDGES project collected student achievement data from a random sample of
about 11,000 students in grades 4 and 5 and 1,000 teachers from 500 schools using the same
instrument as the Primary Education Project study described above. One concerning result was a
decline in both Science and Mathematics scores between 1984 and 1989. The study also
collected information on student and teacher background characteristics and classroom practices,
in an effort to relate these teacher characteristics to student outcomes.
B. Later Studies – 1990s
Testing activity in Pakistan increased significantly during the 1990s as a result of the
Education For All (EFA) declaration and the associated UNESCO-UNICEF initiative. These
studies focused on a broad variety of topics. The results are briefly overviewed below.

Education in Pakistan Overview Document
- 4 -
Mirza and Hameed (1994) explored the effectiveness of various school types. These
types were: 1) mosque school, 2) two teacher primary school, 3) five teacher primary school, 4)
primary section with middle school and 5) primary section with high school. Three test
instruments were administered. The first two covered Mathematics, Science, Social Studies and
Dinyat (the study of the practical laws and ideology of Islam). The third attempted to assess
students’ behavior as measured by classroom participation, motivation, cooperation and
socialization, discipline, cleanliness, carefulness and regularity and punctuality. The sample
consisted of 15,991 students in grades 3 and 5 from 472 schools selected from the four provinces
of Balochistan, M.W.F.P., Punjab and Sindh. Mosque schools had the lowest gross achievement
and gross behavior scores. Primary sections of middle schools performed best on the
achievement score and primary sections of high schools ranked first for behavior. Five teacher
primary schools were the most cost-effective in terms of cognitive achievement. However
overall, the correlation between achievement scores and per-student cost was extremely weak.
Pervez (1995) attempted to determine the degree to which students possess basic competencies.
The testing instrument was a semi-structured questionnaire covering life skills, reading
competence, writing competence, counting and arithmetic, mental arithmetic and Holy Qur’an.
The sample consisted of a representative sample (multi-stage, systematic-random sampling
design) of 1,241 rural and 1,341 urban 11-12 year olds. One of the unique characteristics of
Pervez’s study was the use of a household rather than school based sampling frame. Thus,
children from the appropriate age group were sampled from households irrespective of whether
they were currently enrolled in school or not- as a result, the test outcomes are a snapshot of
learning achievement for the entire age-specific population, rather than a selected school-going
group. Perhaps as a result of this unique sampling frame, only 20.7% of children were competent
at levels considered basic. The competency for letter writing was the lowest whereas numerical
skills, arithmetic, rote-reading and writing from dictation were deemed acceptable. As a result,
Pervez (1995) concludes that Pakistani schools should shift away from teaching only rote-
memorization-based skills.1
The national survey conducted by the Multi-Donor Support Unit for the Social Action
Program in 1995 aimed at determining the critical variables impacting academic achievement at
the primary school level. Basic information was collected on 527 schools throughout the country.
1 Since the document does not provide detailed breakdowns by the schooling status of the child, we are unclear for the basis of this statement.

Education in Pakistan Overview Document
- 5 -
Academic achievement in mathematics, general knowledge and comprehension was tested for
914 teachers and 11,563 students in grade 5 (although data from the Sindh province was later
discarded). The test instruments were based on textbook materials for grades 3 and 4. The
survey found student performance to be satisfactory. There were three interesting correlations
reported from this study:
1. First, in general, teacher qualifications improved student scores (teacher performance
varied across provinces from a high of 91% in Punjab to a low of 77% in the Northern
Areas (FANA)).. This effect was particularly pronounced in rural areas where trained
teachers accounted for a 12% increase in student scores.
2. Students taught in mixes settings or by female teachers generally outperformed their
peers.
3. Private school consistently scored better than government schools.
The NGO Action Aid Pakistan conducted an assessment of Mathematics, Urdu and General
knowledge on 965 students in 50 schools sampled from six districts in the four major provinces
and AJK. In addition, the study included focal group sessions as well and interviews with
community leaders. Private schools performed significantly better than NGO and government
schools in all categories. The difference between NGO and government schools was negligible.
These results matched the opinions expressed in focal groups and interviews.
Khan et al (1999) assessed learning achievement in Science, Mathematics, and Language (Urdu)
for grade 4 students. The test instruments were based directly on the curriculum. In total, the
sample consisted of 145 schools and 2794 students from 28 districts (he sample was not random).
The results mirrored earlier studies. Girls performed better in Science and Urdu whereas boys
excelled further in Mathematics. Urban students scored higher on all three sections than rural
students. Children Sindh ranked first followed by Punjab and NWFP and significantly lower
FATA, FANA, AJK and Balochistan.
Arif et al (1999) explored the factors expounded by head teachers, teachers, learning
coordinators, parents and students for low educational outcomes. Additionally an achievement
test in Social Studies, Mathematics and Urdu was given to 200 students. Generally head teachers
criticized the standard of teaching, absenteeism of teachers, and lack of support provided to
students at home. Teachers predominantly blamed low performance of the lack of adequate
facilities and physical resources. Learning coordinators also focuses on the lack of physical

Education in Pakistan Overview Document
- 6 -
resources in addition to teacher absenteeism and, poor school administration and non-cooperation
between teachers and the community.
Studies by Haque et al (2000), the Bureau of Curriculum Development and Extension Servicess,
N.W.F.P, (1999) and the Bureau of Curriculum and Extension Centre, Balochistan, (2000) have
similarly explored the factors responsible for poor performances. Questionnaires in these studies
were submitted to head teachers, teacher and learning coordinators along with achievement tests
for students. Complaints were similar to those found by Arif et al (1999).
Punjab Literacy Watch (1999) tested students from 31 schools (16 boys public schools, 14 girls
public schools and one co-educational private school), 822 boys and 549 girls, to determine
competency in Mathematics and Urdu. For the choice of schools, District Educational Officers
from two districts in each of Northern, Central and Southern Punjab were asked to select equal
numbers of good, average and weak schools. The test instruments were designed based on the
complete common curriculum. Students did well on simple and mechanical mathematical
problems and tasks like joining letters into works, making sentences and comprehension. In
contrast, students performed poorly on geometry, fractions, decimals, and problems involving
thinking or application of knowledge as well as grammar, letter writing and arrangements in
alphabetical order.
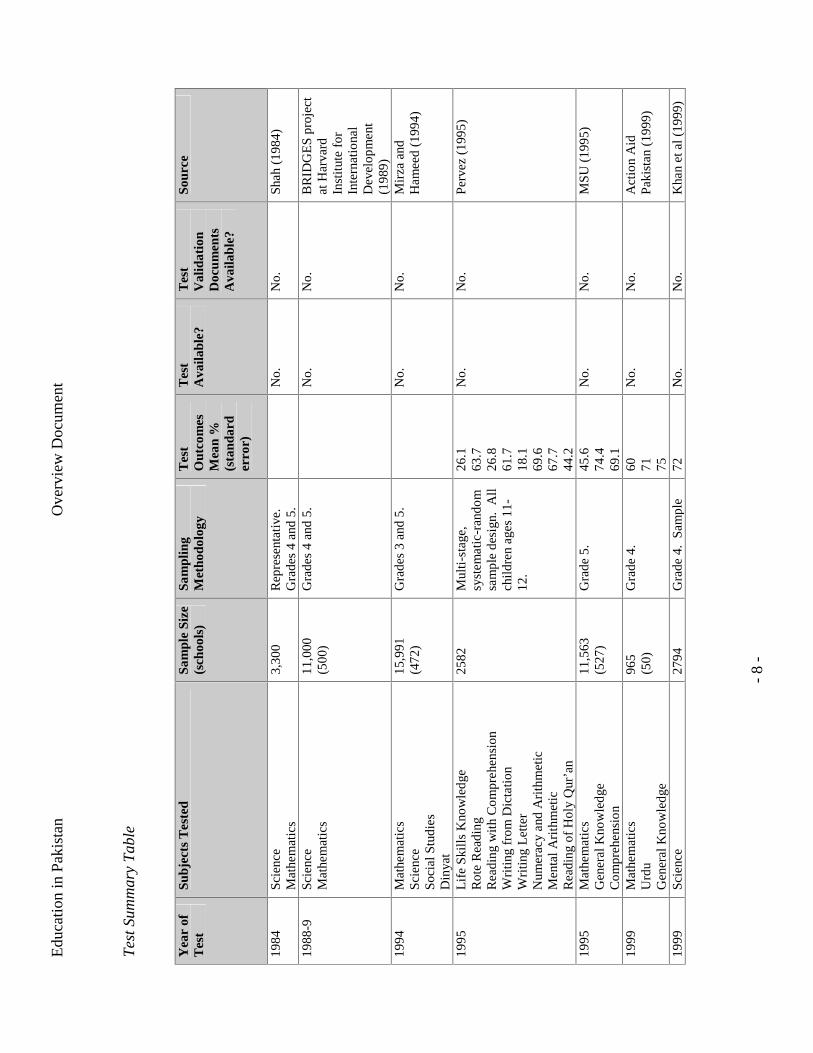
This somewhat bewildering array of tests and outcomes is summarized in the table below. A
surprising fact that emerges from the summary below is that although a large number of
assessments have been undertaken in Pakistan, there has been little (if at all, any) coordination
between the different testing bodies, and as a result, there is no systematic reporting of
information. For instance, UNESCO (2000) in their document on Assessing Learning
Achievement specifies that a `good survey’ should include at the very minimal, careful
documentation of the sampling methodology (with standard errors), as well as instrument
construction and validation. As our summary below shows, only in a very few cases are we able
to learn these essential test-characteristics from available documentation.2 As a result, there is
almost no comparability of these different tests- while they each provide an individual snapshot
that can be used to understand variation within the testing sample, they cannot be used to further
our understanding of changes in achievement over time (for instance, we have no idea whether
2 We are currently in the process of trying to contact each individual author to update this review, but in a number of cases, instruments have been discarded and published documents remain the only source of information.

Education in Pakistan Overview Document
- 7 -
students score higher in one Urdu test compared to another because of learning or because of
differences in the test instrument).
Edu
catio
n in
Pak
ista
n
Ove
rvie
w D
ocum
ent
-
8 -
Tes
t Sum
mar
y T
able
Yea
r of
T
est
Subj
ects
Tes
ted
Sam
ple
Size
(s
choo
ls)
Sam
plin
g M
etho
dolo
gy
Tes
t O
utco
mes
M
ean
%
(sta
ndar
d er
ror)
Tes
t A
vaila
ble?
T
est
Val
idat
ion
Doc
umen
ts
Ava
ilabl
e?
Sour
ce
1984
Sc
ienc
e M
athe
mat
ics
3,30
0 R
epre
sent
ativ
e.
Gra
des
4 an
d 5.
No.
N
o.
Shah
(19
84)
1988
-9
Scie
nce
Mat
hem
atic
s 11
,000
(5
00)
Gra
des
4 an
d 5.
No.
N
o.
BR
IDG
ES
proj
ect
at H
arva
rd
Inst
itut
e fo
r In
tern
atio
nal
Dev
elop
men
t (1
989)
19
94
Mat
hem
atic
s Sc
ienc
e So
cial
Stu
dies
D
inya
t
15,9
91
(472
) G
rade
s 3
and
5.
N
o.
No.
M
irza
and
H
amee
d (1
994)
1995
L
ife
Ski
lls
Kno
wle
dge
Rot
e R
eadi
ng
Rea
ding
wit
h C
ompr
ehen
sion
W
ritin
g fr
om D
icta
tion
Wri
ting
Let
ter
Num
erac
y an
d A
rith
met
ic
Men
tal A
rith
met
ic
Rea
ding
of
Hol
y Q
ur’a
n
2582
M
ulti
-sta
ge,
syst
emat
ic-r
ando
m
sam
ple
desi
gn.
All
chil
dren
age
s 11
-12
.
26.1
63
.7
26.8
61
.7
18.1
69
.6
67.7
44
.2
No.
N
o.
Per
vez
(199
5)
1995
M
athe
mat
ics
Gen
eral
Kno
wle
dge
Com
preh
ensi
on
11,5
63
(527
) G
rade
5.
45.6
74
.4
69.1
No.
N
o.
MSU
(19
95)
1999
M
athe
mat
ics
Urd
u G
ener
al K
now
ledg
e
965
(50)
G
rade
4.
60
71
75
No.
N
o.
Act
ion
Aid
P
akis
tan
(199
9)
1999
Sc
ienc
e 27
94
Gra
de 4
. S
ampl
e 72
N
o.
No.
K
han
et a
l (19
99)

Edu
catio
n in
Pak
ista
n
Ove
rvie
w D
ocum
ent
-
9 -
Yea
r of
T
est
Subj
ects
Tes
ted
Sam
ple
Size
(s
choo
ls)
Sam
plin
g M
etho
dolo
gy
Tes
t O
utco
mes
M
ean
%
(sta
ndar
d er
ror)
Tes
t A
vaila
ble?
T
est
Val
idat
ion
Doc
umen
ts
Ava
ilabl
e?
Sour
ce
Mat
hem
atic
s U
rdu
(145
) no
t pro
port
iona
te
to u
nive
rse.
58
72
19
99
Mat
hem
atic
s Sc
ienc
e So
cial
Stu
dies
U
rdu
200
(20)
G
rade
3 a
nd 5
.
No.
N
o.
Ari
f et
al (
1999
)
1999
M
athe
mat
ics
Scie
nce
Soci
al S
tudi
es
Urd
u
160
(20)
Sa
mpl
e 10
mal
e,
10 f
emal
e sc
hool
s (8
0 st
uden
ts e
ach)
. G
rade
s 3-
5.
N
o.
No.
R
esea
rch
Tea
m o
f B
urea
u of
C
urri
culu
m
Dev
elop
men
t and
E
xten
sion
Se
rvic
es, N
WFP
(1
999)
19
99
Mat
hem
atic
s U
rdu
1371
(3
1)
DE
Os
sele
cted
eq
ual n
umbe
rs o
f go
od, a
vera
ge a
nd
wea
k sc
hool
s.
N
o.
No.
P
unja
b L
iter
acy
Wat
ch (
1999
)
2000
Si
ndhi
M
athe
mat
ics
Scie
nce
Soci
al S
tudi
es
Isla
miy
at
300
(20)
R
ando
miz
ed
sam
ple
10 m
ale,
10
fem
ale
scho
ols
(150
stu
dent
s ea
ch).
Gra
des
3-5.
N
o.
No.
H
aque
et a
l (20
00)
2000
M
athe
mat
ics
Scie
nce
Soci
al S
tudi
es
Urd
u
801
(20)
10
mal
e, 1
0 fe
mal
e sc
hool
s. G
rade
s 3-
5.
N
o.
No.
R
esea
rch
Tea
m o
f B
urea
u of
C
urri
culu
m a
nd
Ext
ensi
on C
entr
e,
Bal
ochi
stan
(2
000)
So
urce
: U
NE
SCO
(20
01)

Edu
catio
n in
Pak
ista
n
Ove
rvie
w D
ocum
ent
-
10 -
Oth
er A
sses
smen
ts T
able
Aut
hor(
s) /
Res
earc
h O
rgan
izat
ion
Tit
le
Dat
e Sp
onso
ring
Org
aniz
atio
n
Inst
itut
e of
Edu
cati
on a
nd R
esea
rch
Uni
vers
ity
of
Pun
jab
(Not
kno
wn)
19
96
Pri
mar
y E
duca
tion
Pro
ject
Fr
om E
DI
(199
9)
Nor
th W
est E
duca
tiona
l Ass
essm
ent P
rogr
amm
e (N
ot k
now
n)
1996
P
ED
P
(NW
FP)
From
ED
I (1
999)
B
urea
u of
Cur
ricu
lum
and
Ext
ensi
on W
ing,
JA
MSH
OR
O, S
indh
(N
ot k
now
n)
1997
SP
ED
P
From
ED
I (1
999)
Pri
mar
y E
duca
tion
Dir
ecto
rate
, QU
ET
TA
, B
aloc
hist
an
(Not
kno
wn)
19
98
BP
ED
P
From
ED
I (1
999)
Bur
eau
of C
urri
culu
m a
nd E
xten
sion
Win
g,
JAM
SHO
RO
, Sin
dh
(Not
kno
wn)
19
98
SPE
DP
Fr
om E
DI
(199
9)
Tes
t Dev
elop
men
t Cen
tre,
Edu
catio
n D
epar
tmen
t, L
AH
OR
E
(Not
kno
wn)
19
99
Pun
jab
Mid
dle
Scho
olin
g P
roje
ct
From
ED
I (1
999)
Dir
ecto
rate
of
Edu
cati
on, G
ilgi
t B
asel
ine
Ach
ieve
men
t of
Cla
ss 4
Stu
dent
s in
N
orth
ern
Are
as, P
akis
tan
2000
N
AE
P
Sour
ce:
UN
ES
CO
(20
01)

Education in Pakistan Overview Document
- 11 -
III. Rationale for Further Study
Given the number of educational assessment studies conducted over the last two decades, it may
be suggested that further research is unwarranted and duplicative. However, this is not the case.
There are several compelling reasons to continue, and indeed expand, such research.
First, there have been important developments in the educational sector in Pakistan during the last
5 years. In particular, private schooling in Pakistan, particularly at the primary level is a large and
increasingly important sector, both in absolute terms and relative to public schooling. There has
been some recent work on this phenomenon (Andrabi, Das and Khwaja), but there remain serious
analytical issues related to efficiency and equity aspects (both on income and gender dimensions)
that cannot be addressed based on existing data. Simultaneously, there is urgent popular and
official pressure to create a new regulatory environment for such schools. To provide an
empirical basis for such a regulatory framework new research on learning achievement would be
extremely timely. Till now, Action Aid Pakistan (1999) represents the only recent direct attempt
to evaluate different school types. However the study was extremely limited with only 1 private
school being tested in Urdu and General Knowledge (14 were tested in Mathematics). The multi-
donor support unit study (1995) also evaluated government, private and NGO/Trust schools
although this distinction was not the primary focus of the study.
Second, collecting new data allows for the methodological flexibility that is critical to avoid the
analytical pitfalls plaguing other studies. While these methodological details are discussed in
greater detail elsewhere, one such example of this flexibility is the ability to test the same
students twice at two separate time periods. To understand the importance of this flexibility,
consider a situation where there are two types of schools with children from two different
backgrounds (the peer selection effect). Pupils in schools with good peers will score higher,
everything else being equal, compared to pupils in schools with bad peers. Given the better
performance, the school with better peers may charge more, and although it would appear that
higher test scores imply greater fees, this in itself has nothing to do with school quality, but is
related to the quality of household inputs. One way to identify the impact of public spending
would be to examine changes in test scores over time in the same school rather then test scores at
one given time in different schools. In the example above, if household inputs are fixed over time,
the differences in test scores will eliminate this variable, and we will be left with the correct
relationship between fees and school quality. These methods, often referred to as Value-Added

Education in Pakistan Overview Document
- 12 -
Assessment Systems, have recently become popular and are currently used in Tennessee’s
innovative yearly assessment program (see Sanders, 1998).
Third, the test proposed has unique elements not found in previous assessments. Most
importantly, the inclusion of English represents a significant departure from previous assessment
work. Data on English literacy has the potential to provide an interesting new explanatory
variable for further research for several reasons. First, English literacy may be closely linked
with school fees and may serve as an important signaling mechanism indicating quality for both
employers and parents. Second, there exist serious reasons to doubt that parents, especially low
income and less educated ones can judge English proficiency of their children adequately. Most
children have access to only their class textbook and do not have any reading material at home or
in school other than that. They are also not exposed to spoken English. Finally, the Government
of Pakistan has made English compulsory from kindergarten and started a new cadre of English
language teachers. Most schools do not have this post filled as yet but clearly English is expected
to figure importantly in Government policy henceforth.
Fourth, there exist practical difficulties to using previous data and assessment instruments
because of poor institutional memory and reporting. Finding the specific instruments used, the
precise schools tested and the detailed score results is impossible for many studies. The lack of
validation documents in particular makes it extremely difficult to gauge the validity of the test
results. Without such documents it is impossible to determine whether poor performance is due
to the quality of the test, problems with administration or the students’ level of knowledge. This
limits the usefulness of historical work for future research and suggests the need for new studies
that would lead to the creation of a carefully validated and documented item pool for future
testing requirements.
Finally, continued educational assessment research has capacity building functions. An explicit
goal of this project is to develop this exercise as a collaborative effort between the World Bank
team, Pakistani academicians and educationalists, and the educational administration in the
country itself. In particular, the development and administration of a test instrument will provide
a valuable opportunity for capacity building that can aid in the educational monitoring efforts in
the country.

Education in Pakistan Overview Document
- 13 -
IV. The Test Instrument
Our description of the test instruments as well as the testing environment is organized as follows:
In sections IV.A and IV.B we provide an overview of the aims of the test instruments as well as
the general principles used in the overall selection of test items. In Section IV.C we then outline
the basic structure of the three tests, with specific emphasis on the content domain and a
discussion of our instrument in the context of testing frameworks that have been developed by
other organizations. The specific questions, scoring keys, and question-specific comments are
presented in detail in Appendix 2.
What should we test?
Schools serve multiple purposes and teach a diverse range of subjects, skills as well as morals and
attitudes (see Box 1). As such, measuring their output is difficult and controversial. The test
instrument developed here attempts to roughly quantify a small set of a school’s output.
Accordingly, the test only includes sections on English, Urdu, and mathematics. Although far
from measuring the total “output” of a school, or even the educational development of students,
such an instrument is still useful for numerous purposes.
BOX 1: MUTIPLE SCHOOL EFFECTIVENESS
Schools serve a multiplicity of functions involving individual, institutional, community, national and international levels. As a consequence, assessing quality or effectiveness is both difficult and controversial. For example, one school may develop students with a strong sense of civic responsibility whereas another might excel at producing talented scientists. Since any assessment instrument implicitly supports a conceptualization of effectiveness, determining which roles to measure is an important consideration during the test construction stage. Cheng (1997) classifies the potential school functions into five types: technical/economic functions, human/social functions, political functions, cultural functions, and educational functions. In turn, these functions create five corresponding measures of school effectiveness. Technical/Economic School Effectiveness: The degree to which schools contribute to the technical or economic developments. This ranges from the individual level—skills and job training—all the way to the international level—the high quality forces needed for efficient economic cooperation and competitions. Human/Social School Effectiveness: The extent to which schools contribute to human and social development throughout society. Schools provide such things by promoting psychological development for individuals, nurturing human relationships within the institution, supporting the social needs of the community, facilitating social integration in society and fostering international social cooperation and friendship. Political School Effectiveness: The ability of schools to contribute to political developments at different levels of society. This includes promoting civic responsibility and attitudes within the citizenship, providing a venue for political discourse, serving the political needs of the community, encouraging democracy throughout society, and securing peace and stability at the

Education in Pakistan Overview Document
- 14 -
international level. Cultural School Effectiveness: The degree to which schools contribute to cultural transmission and development of society. At the individual level, this consists of the socialization with values, norms and beliefs. At higher levels, schools serve as an epicenter for cultural transmission, reproduction and understanding. Educational School Effectiveness: The extent to which schools contribute to the development and maintenance of education. This type of effectiveness refers to the role of schools in teaching students how to learn to learn rather than simply the educational attainment of pupils. Similarly, at higher levels the ability refers to the self-reinforcing power of schools—schools beget more support and resources for educational systems. For example, schools increase the supply of teachers.
IV.A Rational for Testing Urdu, English and Mathematics
The inclusion of Urdu and mathematics—the staple subjects of previous assessments—was made
for primarily three reasons. First, literacy and mathematics are two important competencies
supplied by primary schools. Second, literacy and mathematics are generally more standardized
than other subjects and hence lend themselves to greater cross-school comparability.3 Third,
most subjects besides Urdu and mathematics are based almost exclusively on rote-memorization
at the primary school level. Hence, the chosen subjects have the additional benefit of testing
reasoning and logical analysis as well as critical and complex thinking.
The inclusion of English separates this assessment from most previous studies. The primary
ground for its inclusion is that it can be considered a core competency. However, there are also
more subtle reasons. For instance, there may be a specific connection between English
achievement and private school fees. This suggestion is motivated by the prevalence of schools
advertising English language instruction. English instruction may also serve as an important
signaling mechanism indicating quality for both employers and parents. For these reasons, the
assessment of English achievement is particularly interesting.
IV.B Development and Selection of Test Items - Overall
The principles and frameworks prevalent in the learning assessment literature have been useful as
guiding principles for designing the test but they have not been treated as rigid structures that the
test must conform to. Many of the frameworks are formulated in the context of developed
countries and thus are not entirely well suited for settings in which the national distribution of
3 For example, due to the nature of the subject matter, the progression of social studies and life sciences can easily diverge significantly from curricular guidelines. Indeed, even the curricular guidelines for social studies indicate a substantial degree of flexibility, stating “much of the learning of pupils in the early years should be based on direct experience and practical activities, achieved as far as possible through the exploration of their immediate environment.”

Education in Pakistan Overview Document
- 15 -
achievement is dramatically dispersed (even across the same grade). In the design of the pre-test,
we chose not to administer a criterion-referenced test since an explicit goal in the future for such
tests would be to relate test outcomes to educational inputs (such as teacher quality) that we
believe are important. As such, it is important that the test measure learning with high precision
levels at all levels of knowledge- while a criterion-referenced test would distinguish sharply
between students who meet (do not meet) the specified criteria, it may not yield any information
of those below (or above) the critical level.
The use of a norm-referenced test creates special needs in the case of Pakistan: although the test
will be administered to Pakistani children who have all completed the fourth grade, there is wide
variation in learning across schools and provinces, and it is expected that many of the children
tested may not be familiar even with the content of the first grade curriculum. This places special
demands on test construction even if a norm-referenced test is used.
Specifically, to use a norm-referenced test properly, we need to first know what the lower and
upper limits of learning in the grades to be tested are; this is particularly important in the case of
value-added assessment, where the test has to try and cover children at all levels of knowledge in
the population. Because of the huge differences in learning across schools, it is important to
ascertain carefully the questions that can be used in a norm-referenced test. This pre-pilot phase
will help identify the lower and upper limits of learning in the population as well as provide a
careful analysis of the validity and reliability of the instrument used. The data from this phase
will thus enable construction of a more optimal instrument for future testing.
The choice and structure of content for English, Urdu, and Math was based on an attempt to
optimize on the following:
�� Breadth of content: The test should cover the general range of content taught to children
by the time they reach fifth grade.
�� Range of difficulty: The range of difficulty should be varied across skills (questions) as
well as within each skill (question) to better capture variation in achievement.
�� Distribution of ability type: The test should call upon the different cognitive abilities
relevant for understanding the content in question (e.g. For math: conceptual, procedural
and problem solving).

Education in Pakistan Overview Document
- 16 -
�� Variation in type of questions: Depending on the content being tested, there should be
some variation in type of questions: MCQ, short answer, long answer. Each type
connotes a different level of prerequisite skill as well.
In addition to these general optimization principles, other rules followed for wording and
compiling each question included the following criteria:
�� Easy to understand: Questions that are confusing will create noise. Thus, formats that are
familiar to children should be used and understanding the question should not require an
ability greater than that which is being tested by the question.
�� Easy to administer: Questions that required additional materials can be discriminatory.
Such questions should only be considered if they are feasible to administer properly.
�� Unbiased instrument with respect to socio-economic status: References to items that
children from particular socio-economic backgrounds will have no exposure to can create
bias. Such references should be avoided.
The initial version of the test followed the curricular standards for grade 4 closely. However, it
was quickly noted that the performance of children was considerably below what the curriculum
stated it should be, thus further validating the choice of a norm-referenced test (rather than a
criterion-referenced test based on the curriculum). For the first week of testing (6 schools) parts
of the test were reconstructed after each test to minimize the problems discussed above and
improve the precision of ability/learning estimates across the range of students. Although all the
content of the final version was checked for consistency with the Pakistan’s curricular standards
(see appendix 2) and some material was added based on emphasis in the curriculum, the
instrument is designed to test basic competencies rather than comprehensive knowledge of
specific curricular items. The content for the portions of the test specific to grade 4 (the medium
and difficult sections) follows frameworks prevalent in the learning assessment literature (see
appendix 1).
IV.C Development and Selection of Test Items
Urdu & English
Literacy frameworks used by other assessments (see appendix 1) categorize the different purposes
of reading and writing that should be assessed. However, these frameworks assume that the pupil

Education in Pakistan Overview Document
- 17 -
will have the basic ability to do some reading and writing. We have not made this assumption
while constructing the instrument. Hence both the English and Urdu sections begin with the
alphabet and progress through the basic elements of writing: word construction, grammar,
vocabulary, sentence construction, and conclude with a reading comprehension and essay
exercise.
The instruments included in the Urdu and English sections were adapted from a variety of
sources4. The two sections cover a comparable range of content and difficulty: Both sections
begin with alphabet recognition and end with an essay question and the tests maintain consistency
in content, structure and intellectual demands. Table I below summarizes the content areas of the
Urdu and English sections.
TABLE I: CONTENT AREAS FOR URDU AND ENGLISH
Content Areas Urdu English Type Qs* Type Qs
* Alphabets Written: Complete chronological
order of alphabets 1 Verbal: Write alphabets read aloud
Written: Complete chronological order of alphabets
1 3
Word Recognition
Written: Match words with pictures
2 Verbal: Write words read aloud Written: Match words with pictures
2 4
Word Construction
Break words into alphabets Join alphabets to form a word
3 4
Write words read aloud Complete word for each picture Create words from given alphabets
2 5 9
Grammar Match words with antonyms Write plural for singular words Fill blanks for gender agreement Cloze passage
6 7 8 9
Math words with Antonyms Fill blank words in sentences Cloze passage
6 7 8
Vocabulary Fill blank word in sentence
5 Fill blank word in sentence Create words from given alphabets
7 9
Sentence Construction
Use words in sentences 10 Use word in sentences 10
Comprehension 11 11 Essay 12 12 Note: *Multiple-choice questions are indicated in bold. Some questions are listed for more than one content area.
Note however, that the starting items of the English section are easier than the Urdu since
competency in English may be lower: For instance, the first question in English requires
4 Many questions in the Urdu section were adapted from instruments included in Kizilbash (1997). Other than tests and exams administered by teachers in schools, we were unable to find suitable instruments for the English component and in addition to designing questions ourselves, web-based resources for educationists were used to fill this gap. Based on Dr. Catherine Snow’s (Harvard School of Education) suggestion a cloze passage (every fifth word or so blanked out) was included in the English section (source: www.tut-world.org) and Urdu section.

Education in Pakistan Overview Document
- 18 -
recognizing 3 alphabets read aloud and writing them. No knowledge of alphabetical order
or the ability to recognize other alphabets is required. In Urdu on the other hand, the first
question involves filling the right Urdu alphabet in the blank and students need to know
both how to write the missing alphabet as well as recognize other alphabets and know the
alphabetical order. Apart from this difference in difficulty of the early items, the standard
test format between the two languages allows the student to familiarize herself with the
test in Urdu, before proceeding to the section on English. Finally, while difficulty
increases with each section of the test, there is also a range of difficulty within each test
section. Thus for example, the section on vocabulary includes both easy and difficult
words to aid in discriminating between different students.
Development and Selection of Test Items - Mathematics
For the Mathematics test, we have adapted frameworks used by other assessments that
outline the content domains to be assessed. The five major domains that are identified under these
outlines are5:
�� Number sense, properties, and operations (40%); �� Measurement (20%); �� Geometry and spatial sense (15%); �� Data analysis, statistics, and probability (15%); and �� Algebra and functions (15%).
While we have followed a similar pattern, greater emphasis is placed in our math test on the first
major domain- Number sense, properties and operations. During the initial fielding of the test
instrument in 6 schools, it was noted that performance in math was lower than expected, and the
test was not providing adequate information for children at the lower end of the knowledge
distribution. Thus, additional items were added covering the first domain to obtain finer partitions
of knowledge for this subset of test-takers. The content and cognitive demand of the final test is
summarized below:
TABLE II: CONTENT AND COGNITIVE DOMAIN FOR MATHEMATICS WITH
QUESTION EXAMPLES
Content Domains (example Qs from test) Cognitive Domains (example Qs from test)
5 See Appendix 1 for a detailed description

Education in Pakistan Overview Document
- 19 -
a) Number Operations (1-5)
b) Measurement (15)
c) Geometry (22)
d) Algebra (11 and 20)
e) Data Analysis (21)
1. Conceptual Understanding (4 and 11)
2. Procedural Knowledge (5, 10, 13)
3. Problem Solving (9, 12, 14)
The more advanced content domains such as algebra have only been conceptually
tested-. Where as, more rudimentary elements such as addition, subtraction, multiplication and
division have been tested both procedurally and through problem solving.
As with the English and Urdu tests, the range of difficulty varies within math skills tested
(e.g. Addition: single digit, two digit, three digit with carry, decimal with carry) as well as across
math skills tested (counting to percentages and fractions). In addition to better capturing variation
in achievement, the test design could also be useful in identifying particular `stumbling blocks’
for students with regard to particular skills (for example, difficulty with `division’) or particular
levels of difficulty (for example, difficulty with 2 digit division/multiplication). The order of
questions and progression of content is based on the order in which particular math skills are
taught to students in Pakistani schools (as indicated by the state curriculum) and is summarized in
the table below:
TABLE III: CONTENT AREA AND RANGE FOR MATHEMATICS ITEMS
Content Area Range of skills tested Q*
Counting Count objects, compare numbers, complete chronological
order of numbers, addition of objects, translate numbers in
words, tell time, retrieve count from word prob.
1,2,3,4,6,7,8,9
Addition 1 digit no carry- 3 digit with carry, word problem 5, 9, 10, 12
Subtraction 1 digit - 3 digit with carry, word problem 5, 9, 10, 14
Multiplication 1 digit by 1 digit - 3 digit by 2 digit with carry, word prob. 5, 13, 14, 18,19
Division 1 digit by 1 digit- 3 digit by 2 digit, word prob., LCM, HCF 5, 9, 13
Decimals Addition, subtraction 10
Fractions Read chart, conversion to mixed fractions, addition of
fractions, subtraction of fractions
15, 16, 17
Data Analysis Read Bar chart, read chart in fractions, read chart in
percentages
15, 21
Deductive Complete Sequence, weight comparison 11, 20

Education in Pakistan Overview Document
- 20 -
Note: *Multiple-choice questions are indicated in bold. Some questions are listed for more than one content area.
The careful design of the test instruments based on the pre-assessment in the first six
schools combined with a large number of interviews with teachers and children has allowed us to
estimate with fairly high precision, the knowledge of children at all levels of learning. However,
several problems were noted in the design and implementation of the tests, some of which are
specific to the educational environment in Pakistan and we outline these briefly below. While we
have tried to address some of these issues in the instruments themselves, these problems need to
be further discussed in the context of the national assessment exercise and we hope that the
documentation here ensures that future tests better accommodate these issues in the design and
administration of the instrument.
V. Procedural/Implementation Issues and Other Concerns
The first set of problems that we outline arises from the multiplicity of native languages currently
used in Pakistan. Specifically, we address the issue of the language that should be used to provide
instructions in different tests and the implication that restricting our tests to Urdu and English has
for the potential uses of such assessments. Lastly, we briefly note some problems that arose in the
formatting of test questions.
A. The Interpretation of Literacy Scores
The exclusive use of Urdu in our test instrument places limits on the interpretation of
literacy scores. Functional literacy, in terms of the ability of individuals to participate in society,
may diverge significantly from Urdu literacy if Urdu is used primarily as a ‘second-language’ in
the region considered. This limits the use of the literacy score in certain types of analysis. For
example, using Urdu literacy as a proxy for human capital may underestimate human capital in
areas where Urdu is not the primary language. This would suggest the expansion of the test-
instrument to include testing in the vernacular, particularly, Pashto and Punjabi.
On the other hand, this limitation does not significantly affect the value of Urdu literacy
scores for other potential questions. Since Urdu literacy is a core competency in Pakistan’s
curricular standards, Urud literacy scores provide valuable information on educational attainment
in different schools. Thus, the decision to test in the vernacular as opposed to (or in addition to)
testing in Urdu must be based on the aim of the test instrument- if the main aim of the test
instrument is to assess functional literacy, vernacular testing would be essential, but if the

Education in Pakistan Overview Document
- 21 -
primary focus is on learning in schools (or value-added learning), restriction to testing in Urdu
would yield significant insights.
B. Literacy Bias in Mathematics
Pakistan’s linguistic fractionalization also has implications for the language used in providing
instructions for the test instrument. For our pre-assessment, we chose Urdu and English primarily
due to high uniform exposure from early childhood and to ensure compatibility with the Pakistan
Education Ministry in their Strategic Framework for National Education Assessment 2001.
Despite the fact that our tests were administered in areas where Urdu is not a second language,
the use of two languages for instructions raised important issues in the Math assessment as a
result of the interaction between language skills and math skills in the design of the instrument.
This interaction was noted in two different areas of the test: the medium of instruction, and the
design of questions that required conceptual translations between language and math.
Medium of Instruction: All language statements (including instructions) in the mathematics
section were either in Urdu or English depending on the language of instruction. The need for
separate languages arises from a peculiarity of schools in the sub-continent. Specifically, in
`English-medium’ schools exposure to mathematical terminology may be only in English, and the
use of only Urdu terminology would lead to problems in comparisons across schools: For
instance, all children in English (Urdu) medium schools are familiar with the English (Urdu) but
not the Urdu (English) concept of the “lowest common multiple” of two numbers.
Although an effort was made to limit unneeded verbiage in the mathematics section of the test,
significant portions still required a basic level of literacy. The choice to include written
instructions with mathematical terminology and some word problems is intentional, and is
intended to test the ability of the student to mathematically interpret common (verbal) situations.
However, this prerequisite of basic literacy, although reasonable, may bias the use of test scores
as a measure of students’ skills and competencies in mathematics, if language skills are poor6.
Future tests need to carefully consider the implications of using verbal statements in mathematics
exams, specially in the context of students who may not have attained any degree of literacy by
the time the test is administered. This problem is further compounded in regions where the
6 For example, Howie and Plomp (2001) find a relationship between the number of first language speakers in a class and pupils’ achievement in mathematics in their analysis of South African school level TIMSS data. Similarly, The SAP National Survey (1995) found similar literacy effects when testing teacher skills. Both male and female teachers from urban and rural areas scored worse on narrative questions as compared to numerical questions.
Education in Pakistan Overview Document
- 22 -
vernacular language is different from Urdu- in these cases, test designers need to assess the
degree to which the use of vernacular instructions would help in ensuring that the test instrument
is valid as a measure of learning in mathematics.
Vocabulary Sets: A second, perhaps subtler problem was the requirement of different levels of
vocabulary in the translation of language to mathematical statements, depending on the medium
of instruction. One item that led to such a problem was the translation of numbers in words to
numbers in numerals. The choice of one particular number, “65” raises a direct issue, since in
English, to write numbers in words till “100” requires memorization of each number till the “20”
as well as the specific numbers “30”, “40” etc. In Urdu however, this requirement requires the
memorization of all numbers till “100”: and it is common to find students with the same
mathematical skills who differ along this particular dimension. Particular care needs to be taken
that when instructions and items are translated, the size of the required vocabulary set is the same
in all languages used for test administration.
Thus, the testing of Math in Pakistan raises special problems through the interaction of the subject
matter with language skills. Our recommendations for future tests in this regard are to assess with
some care (potentially through the development of a more extensive item-bank) the use of the
medium of the test instrument, with particular emphasis on the second issue raised above- the
levels of language skills required by the math instrument should ideally be independent of the
particular language used.
C. Question and Answer Format
During the initial testing rounds, there was some concern regarding the format of test questions.
Teachers felt that questions might be unfair, since students were not used to the particular
question-answer format used. As a result, efforts were made to format questions in collaboration
with the teachers, in a simple and straightforward manner. To assess the importance of formatting
in test scores, a simple experiment was carried out, where students in a large school were
randomly divided into two groups. For the first group, the test was administered with no guidance
and following standard guidelines. For the second group, an additional instructor was detailed to
provide assistance for `problematic questions’. The comparison of scores of the first and second
groups shows no significant difference, leading us to conclude that the format of the test was not

Education in Pakistan Overview Document
- 23 -
related to test scores of students7. However, we feel that the formatting of test questions requires
greater attention in future assessments. Prior to the design of such an assessment, it would be
important to assemble a data-base of tests currently used in different schools to check for
differences in the use of common test formats. The final format of the test instrument could then
account for these differences, potentially through the choice of a subset of formats that are
common to all schools.
VI. Assessment of the Instruments using Item Response Theory
This section undertakes a detailed validation exercise for the assessments carried out in Pakistan.
In doing so, we hope to assess the content of the test, and statistically examine the validity of the
test for examining various issues regarding learning achievement in Pakistan. For this section of
the document, we will rely almost entirely on methods derived from Item-Response Theory to
examine the validity of each question (henceforth item) as well as the precision of the test taken
in it’s entirety. As explained previously, this test was specifically designed to provide information
on the ability/knowledge of children from all points of the distribution- how precise is our test
then, in distinguishing between different ability/knowledge8 levels? For a brief introduction to
Item Response theory (to the extent needed to understand this section) and Item-by-Item analysis
refer to Appendix 3.
7 One particular formatting problem arises with the popular `matching’ questions used in tests in Pakistan. This item requires students to `match’ two words from different columns, for instance: Q. Match the opposites Good Smart Stupid Bad This sort of question has two problems: First, our preliminary results indicated that students were confused by this style of question, manifested by dramatically lower performance compared to levels seen for the same question formatted in alternative ways. Second, the answers for each match depends on the availability of remaining unmatched words. Since each match is not independent of the others, the informational content provided by every new match is reduced. This dependence between two test answers would then invalidate standard test response assessments. 8 Through this document, we use the words ability and knowledge interchangeably, although the terms have very different meanings in economics and Item Response. While in the former, ability is a measure of the student’s learning, in economics ability is an intrinsic attribute of the individual that remains fixed over time. We attempt to satisfy both strands by using `ability/knowledge’ but our functional definition of either is a measure of the student’s level of learning.

Education in Pakistan Overview Document
- 24 -
Sta
ndar
d E
rror
Test Characteristics EnglishAbility/Knowledge
Tes
t Inf
orm
atio
n
Test Standard Error Test Information
-3.99 4
.190764
1.07672
.862563
27.4795
How well do the tests estimate student ability/knowledge?
The first three graphs that we present shows the characteristics of the overall test. Each graph
shows two plots of the ‘test-information’ and the `test-standard error’ at different levels of the
knowledge distribution9. There are two important inferences that we can draw from these graphs:
1. The standard error of our ability estimates are extremely low. Comparable tests for other
countries (Sweden, Togo and Zambia have been compared) are characterized by much
higher at the lower and upper ends of the ability distribution (almost double that of our
tests). While we clearly need to undertake this assessment exercise with larger sample
sizes and a more representative sample, we feel that this pre-assessment has been
extremely valuable in demarcating the bounds of the knowledge distribution in terms of
the items that may be used in a norm-referenced assessment.
2. Nevertheless, the graphs show that our estimates around the middle of the distribution are
far better than at the ends-this can also be clearly seen in the graphs presented in the
appendix, where for most test items, item information is maximized around the middle
ranges of the knowledge distribution. As a result, an important focus of a more extensive
assessment should be the development of items that discriminate at each end of the
distribution.
Figure 1a: Test Characteristics of the English Instrument
9 Note that a significant advantage of using IRT methods is that the informational content of the test is a function only of the item parameters, and not the specific sample that was tested.

Education in Pakistan Overview Document
- 25 -
Sta
ndar
d E
rror
Test Characteristics MathAbility/Knowledge
Tes
t Inf
orm
atio
n
Test Standard Error Test Information
-3.99 4
.077494
.951764
1.10393
166.52
Figure 1b: Test Characteristics of Math Instrument
Figure 1c: Test Characteristics of the Urdu Instrument
A deeper understanding of the standard error and test information curves is provided by the next
three graphs, one for each subject, that isolate the discrimination and difficulty of each item in the
test. Recall that the `discrimination’ of an item is a measure of the ability of the item to
distinguish between different groups of test takers, while the difficulty of the item measures the
Sta
ndar
d E
rror
Test Characteristics UrduAbility/Knowledge
Tes
t Inf
orm
atio
n
Test Standard Error Test Information
-3.99 4
.101479
1.08608
.847767
97.1067
Education in Pakistan Overview Document
- 26 -
knowledge required by a test taker to answer the question with a 50% chance of providing the
correct answer (Appendix 3 provides a detailed discussion of these concepts). Thus, an extremely
well designed test would have questions with high discrimination at different levels of difficulty.
The high discrimination would allow each question to distinguish sharply between two groups of
test takers, while the differing difficulty would ensure that the discrimination occurs at each point
of the knowledge distribution in the sample. The three graphs below show the characterization of
each item by difficulty and discrimination, where the numbers in the graph correspond to the
items in the test. For all tests, we find that the difficulty of the items is spread over a large range
(note that since difficulty and knowledge are measured on the same scale, a test with difficulty
ranging from –4 to +4 would separate out more the 99% of all test-takers). However, specific
problems do arise with each test. First, for the English test, there are no items with difficulty
greater than 3, and this suggests that some new questions with higher difficulty levels be included
in the exam. For the math test, item 33 is too difficult for the test takers- a difficulty of 13 implies
that only .001% of the sample has a 50% chance of providing the correct answer. Further, all the
items with extremely high discriminatory powers are all concentrated at the same level of
difficulty, suggesting that the information of the test can be increased by retaining these items,
but changing the level of difficulty appropriately. Finally, for the math test as with the English,
some items with higher difficulty need to be introduced, while more items similar to items 30, 31
and 32 need to be introduced at different levels of difficulty.
Figure 2a: Difficulty and Discrimination of the English Test

Education in Pakistan Overview Document
- 27 -
Dis
crim
inat
ion
Difficulty and Discrimination: EnglishDifficulty
-6 -5 -4 -3 -2 -1 0 1 2 3
0
.5
1
1.5
2
2.5
3
12
3
4
56
7
89
10
11
12
13
14
15
16
17
18
19
20
21
22
2324
25
26
27
28
293031
3233
34
35
36
37
3839 40
414243
44
45
4647
48 49
50
5152
53
54 55
56
57
58
59

Education in Pakistan Overview Document
- 28 -
Figure 2b: Difficulty and Discrimination in Urdu
Dis
crim
inat
ion
Difficulty and Discrimination: UrduDifficulty
-6 -5 -4 -3 -2 -1 0 1 2 3 4 5 6 7 8 9 10 11 12 13 14 15
0
.5
1
1.5
2
2.5
3
3.5
4
4.5
5
5.5
6
6.5
7
12 34567 8
91011
12131415
1617
181920
21
22
23 24
2526
272829 30
3132
33
34
35
3637
38
39
40
41 4243
44
4546
47
48
495051
52 5354
55
56
575859
Figure 2c: Difficulty and Discrimination in Math
Dis
crim
inat
ion
Difficulty and Discrimination: MathDifficulty
-5 -4 -3 -2 -1 0 1 2 3
0
1
2
3
4
5
6
7
8
9
10
1 2 34 567 8910 11
121314 15 16171819
2021 2223 24
2526 27
2829
303132
3334
3536
3738 39
40
4142
434445 46 4748

Education in Pakistan Overview Document
- 29 -
VI. Preliminary Analysis
As we stress in the introduction, this pre-assessment is not extensive enough (small sample of 245
students) nor appropriately designed (sample was not randomly selected) to yield any information
about comparisons regarding learning differentials across different kinds of learning
environments, or by student characteristics. Nevertheless, a simple comparison of learning
outcomes by the type of school and the gender of the student yields some more information
regarding the content of the test, and suggests ways in which the test can be further improved in
future assessments. The table below shows the performance of students disaggregated by gender
and school type in the three tests. For each test, we present the percentage of questions that
students responded correctly to, the IRT scaled score across the categories under consideration as
well as graphs of the scaled score distributions.
Urdu English Math
Raw Scores
IRT Scaled Scores
Raw Scores
IRT Scaled Scores
Raw Scores
IRT Scaled Scores
Female students 55.8% -0.32 58.6% -0.21 54% -0.66
Male students 56.9% -0.35 55.4% -0.20 62.3% -0.03
Private School Students
63.3% 0.28 73.3% 0.85 61.8% -0.02
Government School Students
47.9% -1.14 34.2% -1.55 57.9% -0.31
Interestingly, gender differentials are almost non-existent in the languages, but are significant in
Math. On the other hand, across different school types, while private schools are outperforming
government schools, the difference is the largest for the languages and smallest for Mathematics.
This differential across the subject types needs to be investigated further, and if robust to a larger,
random sample, calls for language tests that encompass a far wider range of items than their
equivalent in mathematics.

Education in Pakistan Overview Document
- 30 -
Figures 2a-c: Distribution of Student Scores across School Types
Conclusion
This document provides a detailed description of the testing environment in Pakistan as well as
documentation and analysis of a pre-pilot test carried out in private and public schools in
Pakistan. The analysis of this test shows that while there are some areas for improvement, on the
whole the test has performed extremely well in its ability to distinguish between students of
different caliber. Nevertheless, valuable lessons were learnt, relating to the issues of testing in a
linguistically fractionalized region and these should be carefully noted, especially with regards to
the upcoming national assessment program.
Den
sity
Performance in English by School TypeAbility/Knowledge
Private school Students Govt. School Students
-4 -3.5 -3 -2.5 -2 -1.5 -1 -.5 0 .5 1 1.5 2 2.5 3 3.5 4
.006648
.538312
Den
sity
Performance in Math by GenderAbility/Knowledge
Male Students Female Students
-4 -3.5 -3 -2.5 -2 -1.5 -1 -.5 0 .5 1 1.5 2 2.5 3 3.5 4
0
.553207
Den
sity
Performance in Urdu by School TypeAbility/Knowledge
Private school Students Govt. School Students
-4 -3.5 -3 -2.5 -2 -1.5 -1 -.5 0 .5 1 1.5 2 2.5 3 3.5 4
0
.405891

Education in Pakistan Overview Document
- 110 -
BIBLIOGRAPHY Action Aid Pakistan. (1999) “Comparative Analysis of Public, Private and NGO Schools.” Arif, Charagh, Saima Chaudhary and Uzma Gilani. (1999). “Learning Achievement of Grades 3
and 5 Children in Rural Primary Schools.” Punjab Curriculum Development and Research Centre. October, 1999.
Balochistan Bureau of Curriculum and Extension Centre. (1999) “Learning Achievement of
Grade 3 and 5 Children in Rural Primary Schools of District Pishin, Balochistan.” December, 1999.
Bracey, Gerald W. (2000) “The TIMSS ‘Final Year’ Study and Report: A Critique.”
Educational Researcher. 29(4): pp. 4-10 Cheng, Yin Cheong. (1997) “Monitoring School Effectiveness: Conceptual and Practical
Possibilities and Dilemmas in Developing a Framework.” Paper presented at the Asia-Pacific Economic Cooperation Education Forum on School-Based Indicators of Effectiveness (Quilin, China, April 13-16, 1997).
EDI (1999). “Basic Skills Assessment – A Pakistan Case Study.” Theme 3 at EDI Seminar helt
at Bhurban (February 7-10, 1999). Haque, Manzoorul, Sharif Kalhoro and Shoukat Saeed. (2000) “Baseline Survey of Learning.”
Sindh Bureau of Curriculum Development and Extension Wing. May, 2000. Howie, Sarah J. and Tjeerd Plomp. (2001) “English Language Proficiency and Other Factors
Influencing Mathematics Achievement at Junior Secondary Level in South Africa.” Paper presented at the Annual Meeting of the American Educational Research Association (Seattle, WA, April 10-14, 2001).
IAE. (2001a) “TIMSS Assessment Frameworks and Specifications 2003.”
http://timss.bc.edu/timss2003i/t03pdf/T03_AF_BookFull.pdf IAE. (2001b) “Frameworks and Specifications for PIRLS Assessment 2001.”
http://timss.bc.edu/pirls2001i/pdf/PIRLS_frame2.pdf Khan, Habib, Seyed Shah, Mirza Ahmad, Nasir Amin, Humala Khalid and Ahmad Malik. (1999)
“Measuring Learning Achievement at Primary Level in Pakistan” Pakistan Ministry of Education (Academy of Educational Planning and Management), Islamabad, 1999
Kizilbash, Hamid (1997) “Working with Rural Primary Teachers: Final Report on Improving the
Quality of Rural Primary School Teachers in Pakistan.” Ali Institute of Education, Lahore, Pakistan.
Mirza, Munawar and Abdul Hameed. (1994) “Differential Achievement of Primary Age
Students and the Cost Effectiveness by School Type.” Primary and Non-Formal Education Wing, Ministry of Education.
Multi-Donor Support Unit for the Social Action Programme. (1995) “Determinants of Primary
Students Achievement – National Survey Results.” Islamabad, July 1995.

Education in Pakistan Overview Document
- 111 -
N.W.F.P. Bureau of Curriculum Development and Extension Services. (1999) “Learning
Achievement of Grade 3 and 5 Children in Rural Primary Schools.” December, 1999. NAEP. (undated) “Mathematics Framework for the 1996 and 2000 National Assessment of
Educational Progress.” http://nces.ed.gov/transfer.asp?location=www.nagb.org/pubs/math96-2000.pdf
NAEP. (undated) “Reading Framework for the National Assessment of Educational Progress:
1992-2000).” http://nces.ed.gov/transfer.asp?location=www.nagb.org/pubs/read92-2000.pdf
NAEP. (undated) “Writing Framework and Specifications for the 1998 National Assessment of
Educational Progress.” http://nces.ed.gov/transfer.asp?location=www.nagb.org/pubs/writing.pdf
PAKISTAN. (undated) “Strategic Frameword for National Education Assessment 2001” Pervez, Muhammad. (1995) “Basic Competencies of Children in Pakistan.” UNICEF:
Islamabad, March 1995 Punjab Literacy Watch. (1999) “Levels of Pupil Achievment in Primary Schools of Punjab: A
Sample Study.” UNESCO. October, 1999. Sanders, W. (1998). Tennessee Value-Added Assessment System [Online]. Available:
http://www.shearonforschools.com/TVAAS_index.html Shah, Mubarik Hussain. (1984) “National Achievement Tests (Protocol Analysis).” Primary
and Non-Formal Education Wing, Ministry of Education. Islamabad. UNESCO. (2001) “Learning Achievement in Primary Schools of Pakistan: A Quest for Quality
Education.” UNESCO, Islamabad, in collaboration with the Ministry of Education Curriculum Wing. March, 2001


