Test 1: Compsci 190 - courses.cs.duke.edu
12
DUKE UNIVERSITY Department of Computer Science Test 1: Compsci 190 Name: NetID/Login: Community Standard acknowledgment (signature) This test has 6 problems on 12 pages. Be sure your test has them all. Do not spend too much time on one question — remember that this class lasts only 75 minutes and there are 75 points on the exam. That means you should spend no more than 1 minute per point. Make sure to put your name and NetID in the space provided above and to put your NetID on the top of each page (worth 2 points). Assume that the statements from datascience import * and import numpy as np have been executed. Don’t worry about getting function or method names exactly right. Assume that if a column contains numbers without a decimal point, then they are integers, if the numbers have a dcimal point they are floats, and otherwise, it is a column of strings. Assume that all libraries and packages we’ve discussed are imported in any code you write. You can write any helper functions you would like in solving the problems. You should show your work on any questions involving arithmetic or analysis. Please write with a dark heavy pencil, or black pen and avoid writing too close to the edge of the paper. Use the blank page at the end of the test if you cannot fit everything on a particular page. Make a note on the appropriate problem if you use an extra sheet. All pages including your two (2) sheets of notes must be turned in. Don’t panic. Just read all the questions carefully to begin with, and first try to answer those parts about which you feel most confident. Do not be alarmed if some of the answers are obvious.
Transcript of Test 1: Compsci 190 - courses.cs.duke.edu

DUKE UNIVERSITYDepartment of Computer Science
Test 1: Compsci 190
Name: NetID/Login:
Community Standard acknowledgment (signature)
This test has 6 problems on 12 pages. Be sure your test has them all. Do not spend too much time on onequestion — remember that this class lasts only 75 minutes and there are 75 points on the exam. That meansyou should spend no more than 1 minute per point.
Make sure to put your name and NetID in the space provided above and to put your NetID on the top ofeach page (worth 2 points) .
Assume that the statements from datascience import * and import numpy as np have been executed.Don’t worry about getting function or method names exactly right. Assume that if a column containsnumbers without a decimal point, then they are integers, if the numbers have a dcimal point they are floats,and otherwise, it is a column of strings.
Assume that all libraries and packages we’ve discussed are imported in any code you write. You can writeany helper functions you would like in solving the problems.
You should show your work on any questions involving arithmetic or analysis.
Please write with a dark heavy pencil, or black pen and avoid writing too close to the edgeof the paper. Use the blank page at the end of the test if you cannot fit everything on a particular page.Make a note on the appropriate problem if you use an extra sheet.
All pages including your two (2) sheets of notes must be turned in.
Don’t panic. Just read all the questions carefully to begin with, and first try to answer those parts aboutwhich you feel most confident. Do not be alarmed if some of the answers are obvious.

Test 1 NetID: 2
PROBLEM 1 : (T/F (6 points))
In a August 2018 Lancet study, researchers studied 694 individual and population-level data sources detailingalcohol consumption among 28 million individuals and across populations. The figure from the paper belowtracks the relationship between the risk of alcohol-related health problems and the number of alcoholic drinksconsumed per day.
From the description of the study and the figure above, select either True or False for each of the followingstatements. Briefly justify your answer.
1.1. Drinking more alcohol causes more risk of health problems.
True False
1.2. This study shows that people who drink alcohol on average have a higher risk of alcohol-related healthproblems.
True False
1.3. This study shows that if you stop drinking alcohol, you will probably live longer.
True False

Test 1 NetID: 3
PROBLEM 2 : (Expressions (12 points)
The following code segment is executed.
a = make_array(0, 3, 2, 2)
b = make_array(2, 2, 2, 2)
c = make_array(’a’,’b’,’c’,’d’)
t = Table().with_columns(
"First", c,
"Second", a*b,
"Third", c*b,
"Fourth", make_array(c.item(a.item(0)), c.item(a.item(1)),
c.item(a.item(2)), c.item(a.item(3)))
)
Fill in the table with the resulting values for t below.
First Second Third Fourth

Test 1 NetID: 4
PROBLEM 3 : (Functions (8 points))
A square pyramid is a five-sided solid as shown.
The volume of a pyramid is given by this formula in terms of the length of a a side of the base, s, and theheight of the pyramid, h:
s2h
3
The surface area is given by this formula again in terms of the length of a side s and the height h.
s2 + 2s×√
s2
4+ h2
You may use the math.sqrt function to calculate square roots, e.g., math.sqrt(25) evaluates to 5. Completeboth functions below to return the volume and surface areas of a square pyramid.
def pyrvolume(s, h):
"""
return volume of pyramid with side s and height h
"""
def pyrsurface(s, h):
"""
return surface area of pyramid with side s and height h
"""

Test 1 NetID: 5
PROBLEM 4 : (Movie Tables (13 points))
Let imdb be a table with information about various movies.
Votes Rating Title Year Decade
88355 8.4 M 1931 1930132823 8.3 Singin’ in the Rain 1952 195074178 8.3 All About Eve 1950 1950
635139 8.6 Leon 1994 1990145514 8.2 The Elephant Man 1980 1980425461 8.3 Full Metal Jacket 1987 1980441174 8.1 Gone Girl 2014 2010850601 8.3 Batman Begins 2005 2000
241 lines omitted...
Answer the following questions about the movie ratings below.
4.1. [4pts] Set lowest_rating to the Rating of the lowest-rated movie in the dataset.
4.2. [4pts] Set elite_movie to the number of movies whose rating is ≥ 9.0.
4.3. [5pts] Set med_movie to the Title of the movie whose rating is closest to the average rating of allmovies in the database.

Test 1 NetID: 6
PROBLEM 5 : (Uber Tables (21 points))
In Homework 3, you were given data of 200,000 Uber rides in the Manila, Philippines, and Boston, Mas-sachusetts metropolitan areas. The sourceid and dstid columns contain integers corresponding to startand end locations of each ride. The hod column contains integers corresponding to the hour of the day theride took place. The ride time column contains the length of the ride as a float, in minutes.
boston = Table.read_table("boston.csv")
bins = np.arange(0, 120, 5)
boston.hist("ride time",bins=bins,unit="Minutes")
5.1. [4pts] Based on the histogram below, what percentage of rides took less than 15 minutes in Boston?Show your work.
Test 1 NetID: 7
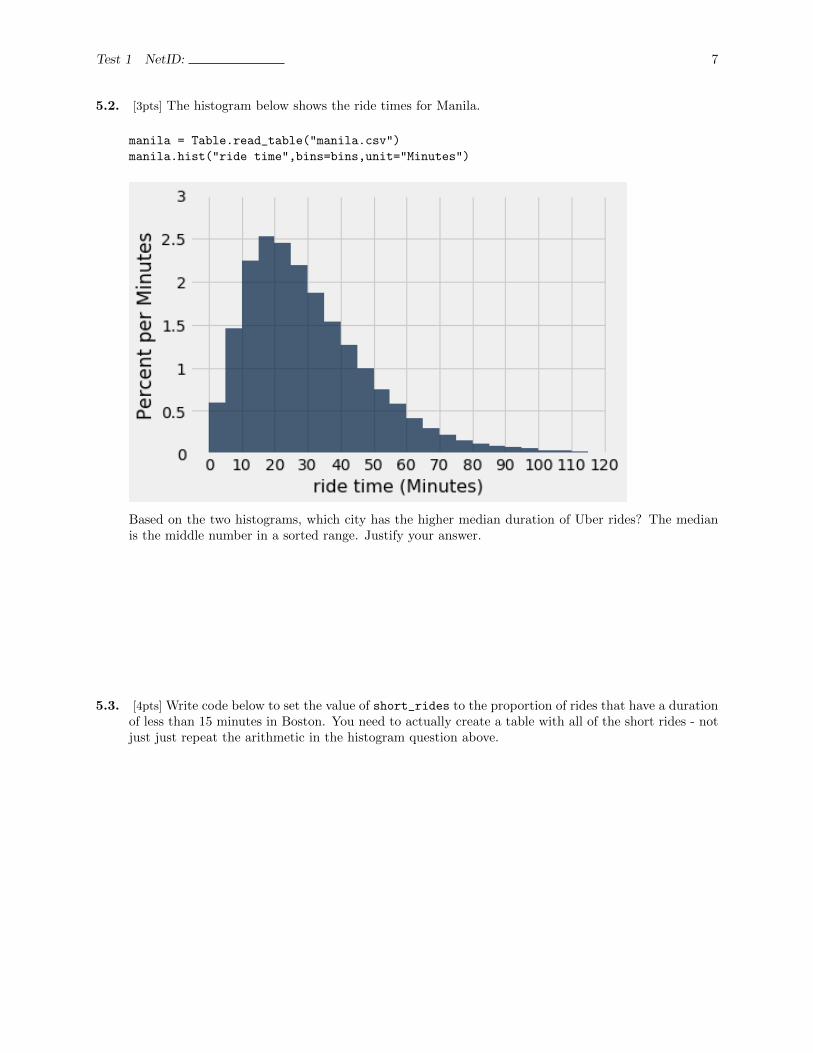
5.2. [3pts] The histogram below shows the ride times for Manila.
manila = Table.read_table("manila.csv")
manila.hist("ride time",bins=bins,unit="Minutes")
Based on the two histograms, which city has the higher median duration of Uber rides? The medianis the middle number in a sorted range. Justify your answer.
5.3. [4pts] Write code below to set the value of short_rides to the proportion of rides that have a durationof less than 15 minutes in Boston. You need to actually create a table with all of the short rides - notjust just repeat the arithmetic in the histogram question above.

Test 1 NetID: 8
5.4. [5pts] Write code to set maxcars to the number of rides that begin at the most popular location(sourceid) and time (hod) to start rides (e.g, 70 rides start at 11pm from sourceid 435) in Boston.You will need to determine what start location and hour of day is the most popular location and timeto begin rides and then count how many rides originate there.
5.5. [5pts] You are given a working version of a function dist that tells you how far apart two locationsare.
def dist(start, end):
"""
Returns the distance in miles between sourceid start and the destid end
"""
[ implementation omitted ]
You want to compute how long it takes to travel on average in both cities. The speed of a trip is theratio of distance divided by the duration of the trip (ride time) Set the variable bs to the averagespeed of trips in Boston and ms to the average speed of trips in Manila.
Test 1 NetID: 9
PROBLEM 6 : (NBA (13 Points))
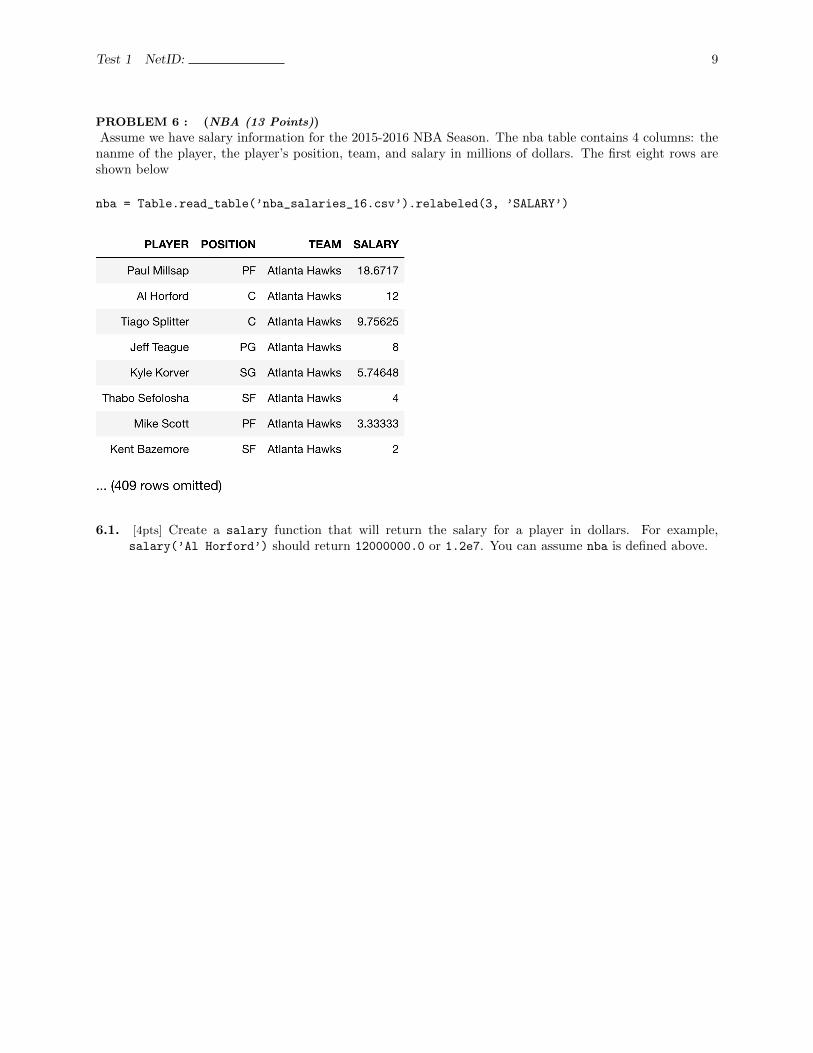
Assume we have salary information for the 2015-2016 NBA Season. The nba table contains 4 columns: thenanme of the player, the player’s position, team, and salary in millions of dollars. The first eight rows areshown below
nba = Table.read_table(’nba_salaries_16.csv’).relabeled(3, ’SALARY’)
6.1. [4pts] Create a salary function that will return the salary for a player in dollars. For example,salary(’Al Horford’) should return 12000000.0 or 1.2e7. You can assume nba is defined above.

Test 1 NetID: 10
6.2. [4pts] Set the variable superteams equal to the number of teams with at least three (3) players whomade more than 10 million dollars in salary in 2015-2016.
6.3. [5pts] You would like to determine the starters for each team. Each team has one starter per position.Assume the starter for a team at a position is the player with the highest salary on that team in thatposition. Set startsal to a table with the salaries for every starter on every team, as in the picturebelow.

Test 1 NetID: 11
This page is blank. Use as extra space if needed.

Test 1 NetID: 12
End of test