TESCO PLC1 · 2019-10-09 · TESCO PLC1 . 1. INTRODUCTION “Every little helps”, the slogan...
21
TESCO PLC 1 1. INTRODUCTION “Every little helps”, the slogan Tesco PLC has used for so long, really seems to have helped the group in creating a successful business. With more than 440.000 employees nowadays, the UK grocery store market leader Tesco has created a renowned business model over the world. Starting in London with a little store in 1919, Jack Cohen, its founder, has jumped from the local grocery market to a multinational diversified business with several subsidiaries: supermarkets, a bank, petrol stations, telecommunications, etc. The group focuses on meeting its customers’ needs by offering a wide range of products including the own brand products and a focus on customer satisfaction and corporate responsibility. 2. HISTORY OF TESCO PLC Jack Cohen realized in 1919 that he could make profits from selling war surplus groceries and, in fact, Cohen started from a stall in East End of London. Tesco as a brand did not appear until 1924, when Cohen bought from T.E Stockwell a shipment of tea, which was its first own-brand product. The first Tesco store was opened in 1929 and during the 30’s about one hundred stores were opened in London under the business core of buying small grocery stores and selling the products cheaper than ever. During the 60’s Tesco continued its expansion and started diversifying its products for the first time. Since the 90’s, Tesco has launched a great variety of products such as books, financial services, telecoms, petrol, etc. Moreover, the company decided to attract also people who cared about quality and not just low-cost and grew by having 2.000 more shops fifteen years later. It was not until 2013 that Tesco reported its first drop in profits in 20 years. Moreover, one year later the brand was accused of manipulating the way commercial income was registered causing a deep impact into its reputation. Aldi and Lidl were taking Tesco’s position and eating it away. Nowadays is one of the world’s largest retailers and serves millions of customers per week either in physical stores or online. The following figure shows the main facts of Tesco’s history. 1 Case written by Maria Sallent, Nerea Pérez, Paula Valenzuela; with the supervision of Professor Oriol Amat. Universitat Pompeu Fabra, 2018. 1
Transcript of TESCO PLC1 · 2019-10-09 · TESCO PLC1 . 1. INTRODUCTION “Every little helps”, the slogan...
TESCO PLC1
1. INTRODUCTION
“Every little helps”, the slogan Tesco PLC has used for so long, really seems to have helped the group in
creating a successful business. With more than 440.000 employees nowadays, the UK grocery store market
leader Tesco has created a renowned business model over the world. Starting in London with a little store in
1919, Jack Cohen, its founder, has jumped from the local grocery market to a multinational diversified
business with several subsidiaries: supermarkets, a bank, petrol stations, telecommunications, etc. The group
focuses on meeting its customers’ needs by offering a wide range of products including the own brand
products and a focus on customer satisfaction and corporate responsibility.
2. HISTORY OF TESCO PLC
Jack Cohen realized in 1919 that he could make profits from selling war surplus groceries and, in fact, Cohen
started from a stall in East End of London. Tesco as a brand did not appear until 1924, when Cohen bought
from T.E Stockwell a shipment of tea, which was its first own-brand product. The first Tesco store was
opened in 1929 and during the 30’s about one hundred stores were opened in London under the business core
of buying small grocery stores and selling the products cheaper than ever. During the 60’s Tesco continued
its expansion and started diversifying its products for the first time. Since the 90’s, Tesco has launched a
great variety of products such as books, financial services, telecoms, petrol, etc. Moreover, the company
decided to attract also people who cared about quality and not just low-cost and grew by having 2.000 more
shops fifteen years later.
It was not until 2013 that Tesco reported its first drop in profits in 20 years. Moreover, one year later the
brand was accused of manipulating the way commercial income was registered causing a deep impact into its
reputation. Aldi and Lidl were taking Tesco’s position and eating it away.
Nowadays is one of the world’s largest retailers and serves millions of customers per week either in physical
stores or online. The following figure shows the main facts of Tesco’s history.
1 Case written by Maria Sallent, Nerea Pérez, Paula Valenzuela; with the supervision of Professor Oriol Amat.
Universitat Pompeu Fabra, 2018.
1
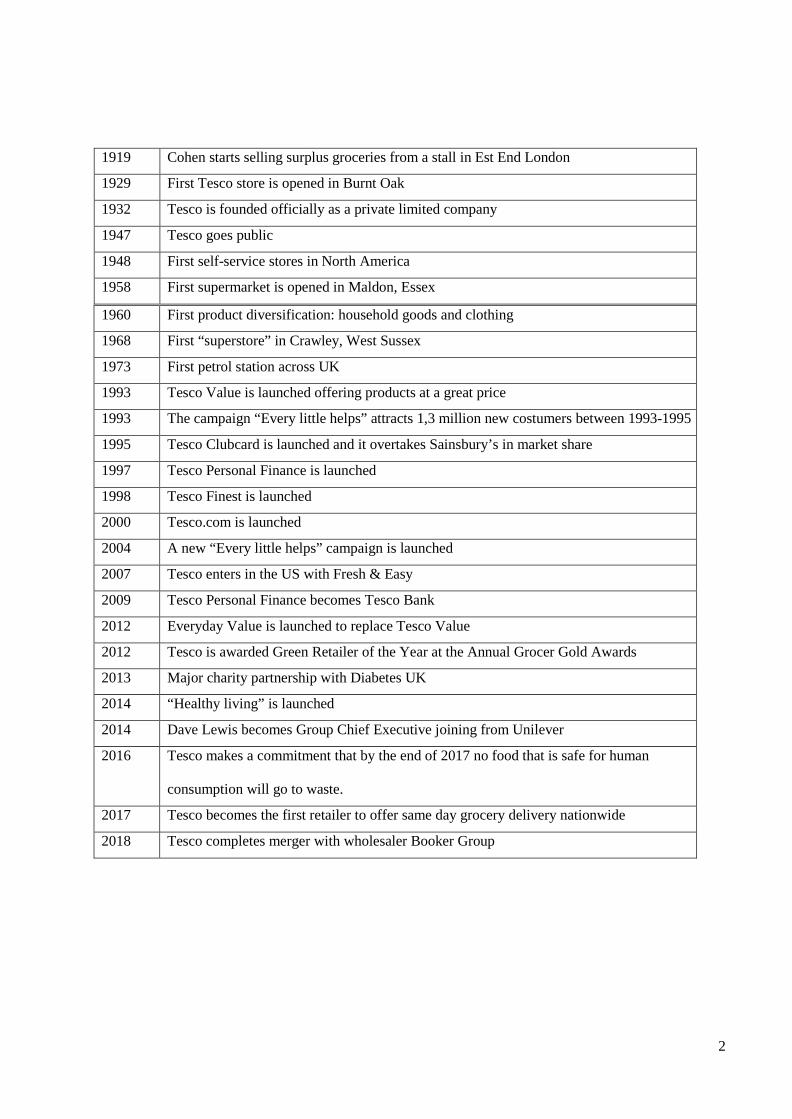
1919 Cohen starts selling surplus groceries from a stall in Est End London
1929 First Tesco store is opened in Burnt Oak
1932 Tesco is founded officially as a private limited company
1947 Tesco goes public
1948 First self-service stores in North America
1958 First supermarket is opened in Maldon, Essex
1960 First product diversification: household goods and clothing
1968 First “superstore” in Crawley, West Sussex
1973 First petrol station across UK
1993 Tesco Value is launched offering products at a great price
1993 The campaign “Every little helps” attracts 1,3 million new costumers between 1993-1995
1995 Tesco Clubcard is launched and it overtakes Sainsbury’s in market share
1997 Tesco Personal Finance is launched
1998 Tesco Finest is launched
2000 Tesco.com is launched
2004 A new “Every little helps” campaign is launched
2007 Tesco enters in the US with Fresh & Easy
2009 Tesco Personal Finance becomes Tesco Bank
2012 Everyday Value is launched to replace Tesco Value
2012 Tesco is awarded Green Retailer of the Year at the Annual Grocer Gold Awards
2013 Major charity partnership with Diabetes UK
2014 “Healthy living” is launched
2014 Dave Lewis becomes Group Chief Executive joining from Unilever
2016 Tesco makes a commitment that by the end of 2017 no food that is safe for human
consumption will go to waste.
2017 Tesco becomes the first retailer to offer same day grocery delivery nationwide
2018 Tesco completes merger with wholesaler Booker Group
2
3. BUSINESS MODEL
3.1. MISSION, VISION AND VALUES
Tesco’s core purpose is “Serving shoppers a little better every day”. They have a simple mission: being the
champion for customers by making easier their way of living and improving their quality of life. Serving
customers is the core of everything they do.
Tesco puts this into practice with the following values:
● No one tries harder for customers:
○ Understand customers
○ Be the first to meet their needs
○ Act responsibly for their communities
● Treat people how they want to be treated:
○ Teamwork
○ Trust and respect
○ Listen, support and say “thank you”
○ Share knowledge and experience
● Every little help makes a big difference:
○ Helping to decrease food waste and ensuring that surplus food goes to those in need
○ Making easier living healthier
○ Sourcing great quality, affordable and sustainable products
○ Making positive contributions to the communities where they operate
Their Code of Business Conduct is a key concept on how they run the business, it is designed to help and
protect themselves. For Tesco it is very important that everyone understands the rules and the conduct the
company expects to show. The goal is to make the best for customers and to protect their reputation.
3.2. CORPORATE GOVERNANCE
- Board role and effectiveness: The goal of the Board is to achieve long term success for the firm and
long term returns for shareholders. In order to reach it, the Board is required to set the firm’s strategic
goals and ensure that all the human and financial resources are placed where they are needed.
Moreover, they have to be aware of the management’s performance when delivering and also of the
3
necessities of their shareholders in order to be able to respond them. Moreover, the Board makes an
effectiveness evaluation per year.
- Governance: They want to keep high standards of corporate governance. They ensure a transparent
decision making process and they are open to discussions and constructive challenges.
- Succession planning: The Board invest an important part of their time to discuss the succession
planning and talent.
- Remuneration: Their goal is to have a fair and balanced remuneration plan based on the achievement
of their key strategic objectives while shareholders receives long term and sustainable returns.
- Culture: For Tesco, culture is a key concept in their business. Their goal is to construct a culture
where their stakeholders are recognized while their needs are understood in order to be able to
innovate and meet them.
- Diversity and inclusion: Tesco has become member of the 30% Club which fights to achieve a 30%
female representation in the Boards and in the senior leadership teams. They have established an
External Advisory Panel that helps to guide their inclusion agenda and they have as well implemented
an Inclusion strategy.
4. INDUSTRY ANALYSIS AND COMPETITORS
4.1. SALES EVOLUTION IN THE INDUSTRY
In 1977, in the middle of some economic problems, the chief executive of Tesco’s UK Ian McLaurin
implemented a price cut plan to increase sales. This started a price war with Sainsbury’s, one of the main
competitors. Also, the retailer closed 500 unprofitable stores and invested the money saved from this in other
stores, putting better lighting and wider aisles. Two years later, thanks to that, sales went up to 1 billion
pounds.
In 1982, McLaurin cut prices again by 3%-26% in at least 1.500 different products, starting another price
battle with Sainsbury’s. The results of this price cut were that sales had reached 2 billion pounds. Three years
later, Tesco also implemented more technology and expanded their stores and warehouse.
Some years later, with the UK in recession, Tesco launched a campaign to fight other competitors (Aldi,
KwikSave and Netto) by reducing prices. then, it acquired a French 92-store chain. A year later, it bought
Hungary S-Market, expanding their influence overseas to China, Korea and Turkey, among other European
countries. In 1995, with all this, Tesco won the top position of food retailers in the UK knocking its main
competitor Sainsbury’s.
In 1997, Terry Leahy becomes the new chief executive and Tesco opens its first extra hypermarket in Essex.
In 2000, tesco.com opened, which allowed more people to buy from it without the need to have a physical
store near you.
In 2005, benefits reached 2 billion pounds. And two years later they entered the US market. Meanwhile the
4
market share in the UK was of about 31.2%. In 2011, Phil Clarke became the chief executive and announced
that profits of 3.8 billion pounds. The same year, a price cutting plan is launched, but it fails the objective
and sales go down. one year after, it became clear that Tesco was going down and had lost the first position
in UK food retailers as well as the disaster of trying to enter the US market, which ended up being a loss of
1.8 billion pounds. In 2013, Tesco made public its first loss in 20 years and stated that it would not open any
more store.
In 2014, thanks to Christmas sales, even though they were poor, the company had some profits. The same
year they started a price cutting campaign to fight close competitors to try to gain market share, which at the
moment was of 28.7%, the lowest of the decade. By August, Tesco announced the third profit warning of
that year and cut its dividends by 75%.
However, by September this year, their shares went down since they admitted exaggerating the profit by 250
million pounds. From this moment on, because of many more managerial, executive and administrative
problems and scandals and also accounting errors, the company is at risk, their shares keep on going down.
The last downfall and biggest scandal resulted in a 6,4 billion pounds loss that dragged the company into the
red as a result of a massive depreciation of its stock and portfolio value.
Furthermore, we need to take a look at what the industry will look like in the near future in order to make
recommendations. The sources we have used to obtain the information displayed below are the Financial
Times market database and a 2017 report by the USDA Foreign Agricultural Service about UK retail foods.
According to these sources, the grocery sector in the UK records the strongest growth in retailing, being the
discounters, convenience stores and online shopping the ones expanding the most. The predictions are that
by 2021, the value of the UK grocery market will grow 9,9% to 196.9 billion pounds, and online shopping
will increase by 68% in the next 5 years. Regarding convenience stores, they are the third fastest growing
sector (from £37,5 billion in 2016 to £41,9 in 2021), and could represent a quarter of the grocery store market
by 2021.
5
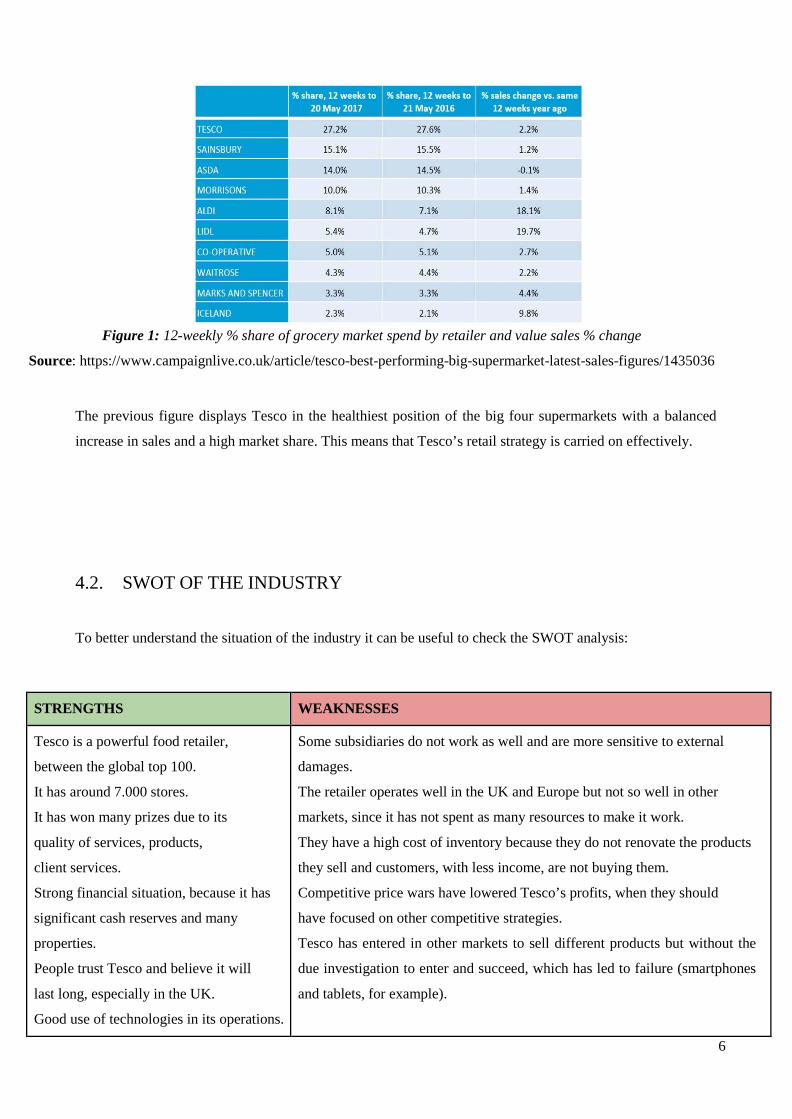
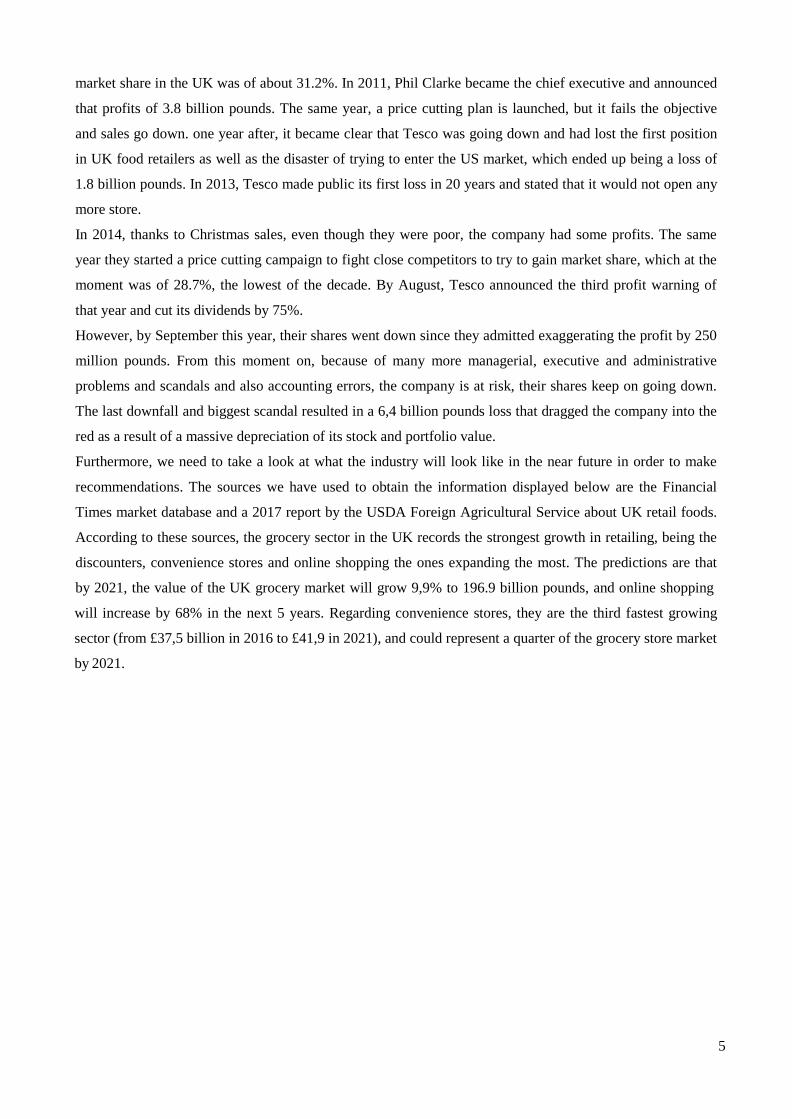
Figure 1: 12-weekly % share of grocery market spend by retailer and value sales % change
Source: https://www.campaignlive.co.uk/article/tesco-best-performing-big-supermarket-latest-sales-figures/1435036
The previous figure displays Tesco in the healthiest position of the big four supermarkets with a balanced
increase in sales and a high market share. This means that Tesco’s retail strategy is carried on effectively.
4.2. SWOT OF THE INDUSTRY
To better understand the situation of the industry it can be useful to check the SWOT analysis:
STRENGTHS WEAKNESSES
Tesco is a powerful food retailer,
between the global top 100.
It has around 7.000 stores.
It has won many prizes due to its
quality of services, products,
client services.
Strong financial situation, because it has
significant cash reserves and many
properties.
People trust Tesco and believe it will
last long, especially in the UK.
Good use of technologies in its operations.
Some subsidiaries do not work as well and are more sensitive to external
damages.
The retailer operates well in the UK and Europe but not so well in other
markets, since it has not spent as many resources to make it work.
They have a high cost of inventory because they do not renovate the products
they sell and customers, with less income, are not buying them.
Competitive price wars have lowered Tesco’s profits, when they should
have focused on other competitive strategies.
Tesco has entered in other markets to sell different products but without the
due investigation to enter and succeed, which has led to failure (smartphones
and tablets, for example).
6
OPPORTUNITIES THREATS
Strategic alliances with other brands of
the sector. Private label market.
Online shopping and home delivering.
Joint ventures in markets where Tesco is
not doing well, which may provide them
with more knowledge on how to
correctly perform.
Continue investing in Research and
Development so as to keep evolving and
improving.
Economic recessions threaten their market share and their volume of sales.
Prices around the globe are rising and people cannot afford to buy as many
things as in the past.
Government regulations and the political situation are making Tesco impose
new regulations that need to change their operational structure.
Other retailers offer lower prices, which puts pressure on Tesco to
lower theirs.
4.3. MAIN COMPETITORS
Tesco targets the middle class market, as it provides both economy and up-scale products. Tesco’s main
competitors in the grocery industry are ASDA, Sainsbury’s and Morrison’s, which are called the Big Four.
However, Aldi and Lidl are starting to gain territory. In addition, Tesco has to compete with convenience
stores, which are gaining popularity.
● ASDA: it is a subsidiary of Walmart and it has 604 stores in total, 196 of which are supermarket.
ASDA also sells clothes and furniture. Of the Big Four, ASDA is the one that keeps the lowest
prices. It is trying to improve the online channels to buy through the internet, the appearance of the
stores and the nutritional value of its products.
● SAINSBURY’S: this is the third largest retailer and is said to have the highest quality of all Big
Four members, which allows them to charge an extra price in all its food products. They are trying to
expand by widening its offer and boosting their banking services, and they have announced the will
to do a takeover of ASDA (pending regulatory’ approval).
● MORRISON’S: this is also involved in food production and it is, in fact, the second largest UK
producer. So, we know that this company is vertically integrated and is trying to make this structure
more efficient while reducing prices too. They have implemented a rigid CapEx plan and all new
stores that are opened are small convenience stores.
● ALDI: their strategy to success is based on the low price of their products in relation to their quality.
They have a special focus on private brands. They also have different weekly merchandise products
and do not accept discount coupons.
● LIDL: similar to Aldi, Lidl does not focus on a good presentation but on offering low price products
from the country where it is located. Like Aldi, they also have weekly merchandise products
changing every week. 7
● WAITROSE: they focus on the quality of staff and production processes. They have attempted to
rise prices a bit to give the image of a higher quality grocery store, matching the prices of Tesco in
the most select products.
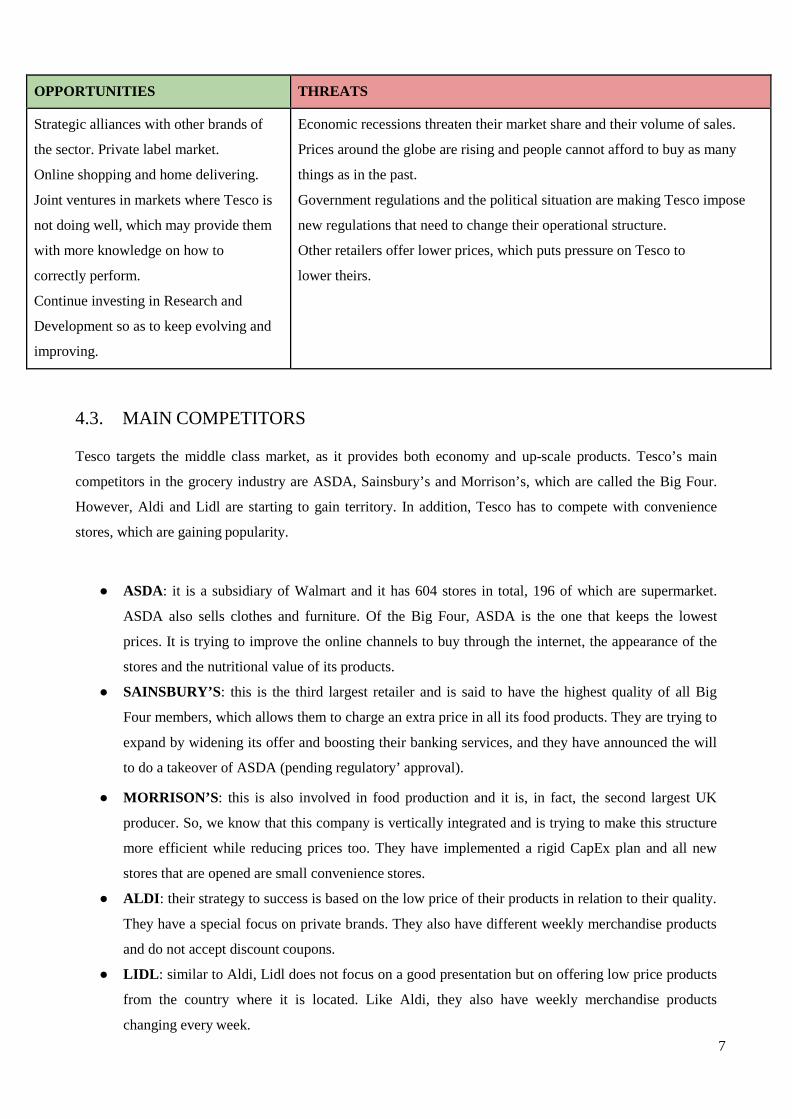
Apparently, the most dangerous of competitors are discounters such as Aldi and Lidl, which are expected to
grow 57% to 42.8 billion pounds in 2022.
As for the non-grocery sector, such as gas stations, the largest players in the UK market are Shell (569 stores
in 2017), Esso (198 stores) and BP (313 stores). As for Tesco, it owned 504 gas stations in 2017. In total
there are around 8438 functioning gas stations in the UK.
Figure 2: Market share of grocery stores in Great Britain from August 2012 to August 2018
Source: https://www.statista.com/statistics/300656/grocery-market-share-in-great-britain-year-on-year-
comparison
8
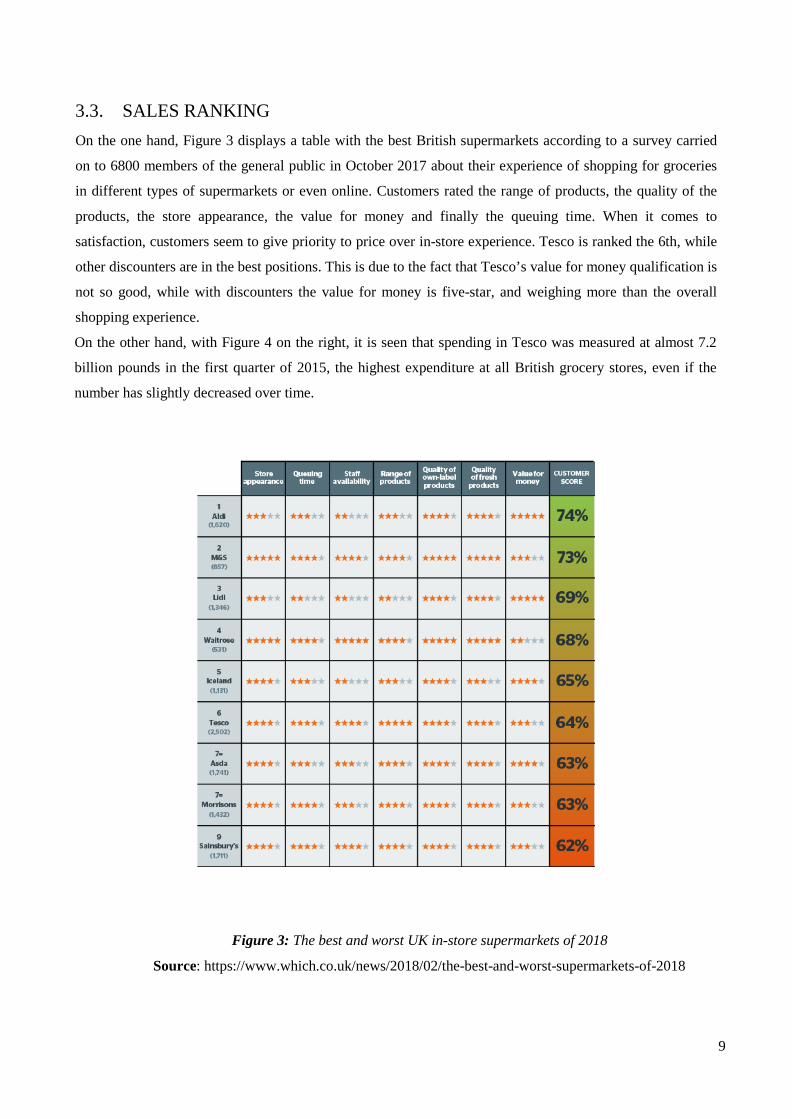
3.3. SALES RANKING On the one hand, Figure 3 displays a table with the best British supermarkets according to a survey carried
on to 6800 members of the general public in October 2017 about their experience of shopping for groceries
in different types of supermarkets or even online. Customers rated the range of products, the quality of the
products, the store appearance, the value for money and finally the queuing time. When it comes to
satisfaction, customers seem to give priority to price over in-store experience. Tesco is ranked the 6th, while
other discounters are in the best positions. This is due to the fact that Tesco’s value for money qualification is
not so good, while with discounters the value for money is five-star, and weighing more than the overall
shopping experience.
On the other hand, with Figure 4 on the right, it is seen that spending in Tesco was measured at almost 7.2
billion pounds in the first quarter of 2015, the highest expenditure at all British grocery stores, even if the
number has slightly decreased over time.
Figure 3: The best and worst UK in-store supermarkets of 2018
Source: https://www.which.co.uk/news/2018/02/the-best-and-worst-supermarkets-of-2018
9
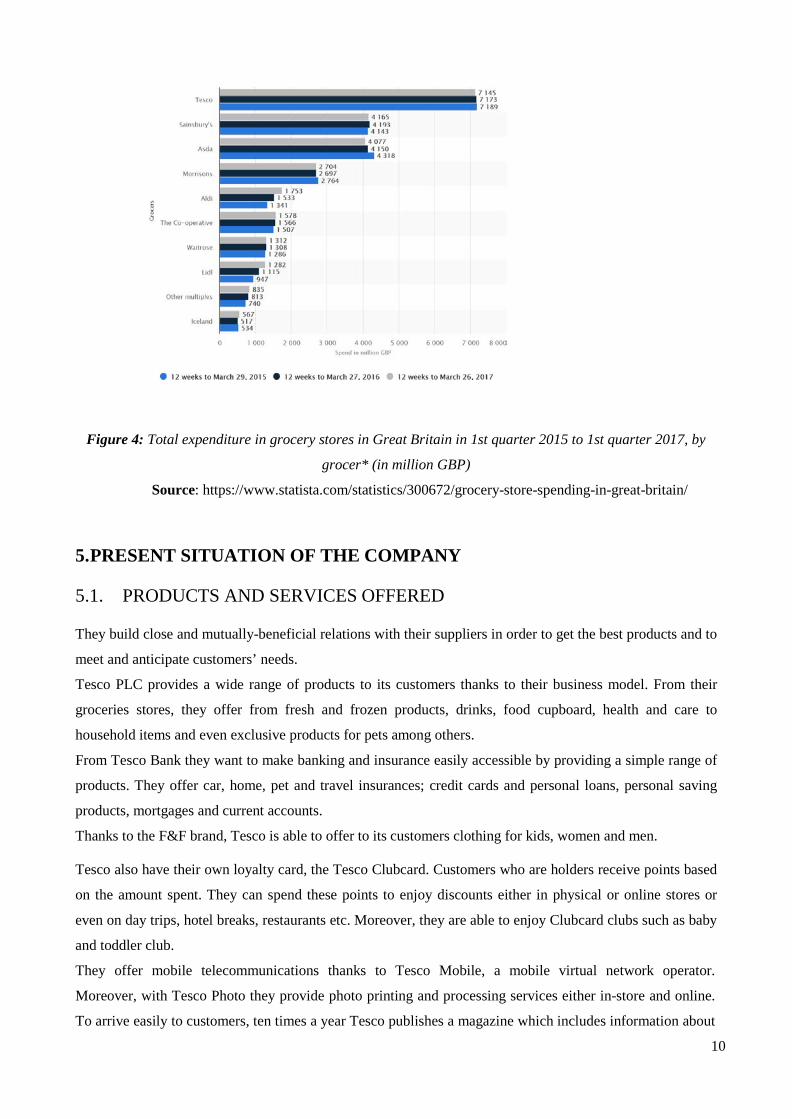
Figure 4: Total expenditure in grocery stores in Great Britain in 1st quarter 2015 to 1st quarter 2017, by
grocer* (in million GBP)
Source: https://www.statista.com/statistics/300672/grocery-store-spending-in-great-britain/
5. PRESENT SITUATION OF THE COMPANY
5.1. PRODUCTS AND SERVICES OFFERED
They build close and mutually-beneficial relations with their suppliers in order to get the best products and to
meet and anticipate customers’ needs.
Tesco PLC provides a wide range of products to its customers thanks to their business model. From their
groceries stores, they offer from fresh and frozen products, drinks, food cupboard, health and care to
household items and even exclusive products for pets among others.
From Tesco Bank they want to make banking and insurance easily accessible by providing a simple range of
products. They offer car, home, pet and travel insurances; credit cards and personal loans, personal saving
products, mortgages and current accounts.
Thanks to the F&F brand, Tesco is able to offer to its customers clothing for kids, women and men.
Tesco also have their own loyalty card, the Tesco Clubcard. Customers who are holders receive points based
on the amount spent. They can spend these points to enjoy discounts either in physical or online stores or
even on day trips, hotel breaks, restaurants etc. Moreover, they are able to enjoy Clubcard clubs such as baby
and toddler club.
They offer mobile telecommunications thanks to Tesco Mobile, a mobile virtual network operator.
Moreover, with Tesco Photo they provide photo printing and processing services either in-store and online.
To arrive easily to customers, ten times a year Tesco publishes a magazine which includes information about
10

the company and its products according to the season and even includes several recipes that can be made
with products purchased from Tesco.
5.2. CUSTOMERS, DISTRIBUTION CHANNELS AND LOGISTICS
Their main focus is customers. They want to do their best for them because that will improve sales. With the
improve on sales they will be able to reinvest in improving the shopping experience.
Customers feedback keeps improving and reflect the effort of Tesco to serve a little better every day. Within
the year 2017/2018 they gained 5 points in comparison with the previous year on the Group net promoter
score that is equal to fans (those scoring 9-10 out of 10) minus critics (those scoring 0-6) on an 11 point scale
question 0-10. 2017/2018: 12 pts whereas in 2016/2017: 7 pts. So customers not only are recommending
Tesco but also are coming back time and again.
Moreover their colleagues recommend them not only as a good place to work but also a great place to shop.
With over 6900 shops around the world, and with 440000 colleagues, they have around 80m shopping trips
per week and serve millions of customers every week in-stores and online.
Tesco operates in a wide range of channels in order to bring the best products to their customers. They
operate from small and big shops as well as online. With the merger of Booker, Tesco has been able to enjoy
new channels that include Business Centers and delivered wholesale. This multichannel strategy has helped
Tesco to adapt their operations within this new era of retailing.
5.3. KEY SUCCESS FACTORS
Regarding the retail stores, location is very important. Stores have easy access for cars and enough parking
places. Also, both product range and product availability, meaning big stores that offer a wide range of
different products, which are always available. That is, shelves are constantly replaced. Of course, this has a
cost, which is between 12 and 20% of the value of the products and it can be reduced by investing in IT,
which they do. Prices are an important feature too, since they have to be competitive.
Tesco offers a clubcard that rewards the clients in order to make them come back. For every purchase,
customers collect some points and when enough points are collected, they can be exchanged for vouchers to
be used in Tesco. This system ensures brand loyalty and gives the clients incentives to come back and only
buy in their stores. Another advantage of this system is that all purchases are registered and customers can
track them. However, this is also useful for Tesco because their team of analysts can examine this data so as
to make improvements depending on the preferences and tastes of their clients. In addition, and thanks to the
analysis of the club-card database, Tesco has launched some products of their own brand. Many of these
products are labelled as premium and they really have succeeded when competing with other brands
classified as premium too. And because Tesco is the owner of this brand, it can create an exclusivity
environment, promoting brand loyalty.
Moreover, after the crisis Tesco suffered in 2014, in 2015, it launched the Brand Guarantee scheme. This
11
consists in the following, they promised their clients that if a branded group of 10 or more products appeared
to be more expensive than their rivals’, they would made them a refund.
In relation to social media and publicity, Tesco is very active in social networks like Facebook and YouTube.
In Facebook, they have more than 2 million likes, and if clients have any doubt or complaint about anything
regarding the company, they can post it on Facebook and Tesco will answer them in a short period of time.
As for advertising, it is mainly aimed at satisfying stakeholders. It all moves around Tesco’s slogan “Every
little helps”, and although publicity expenses have decreased from 110.6 million pounds in 2013 to 77.7
million pounds in 2015, it has gained efficiency. Its marketing strategy is based on an extensive use of print
and media advertising as a way to communicate with current customers and potential ones. This has been
done through marketing differentiations, for example, by using singular Christmas ads. For sales promotion,
Tesco uses free gifts (such as promotions for specific products) and point of sale materials (conducted with
the cooperation of manufacturers in a way that they may supply posters and other promotional materials).
The head of marketing at Tesco, Robin Terrell, prefers to use humour as a way to attract customers.
5.4. STOCK MARKET AND DIVIDEND POLICY
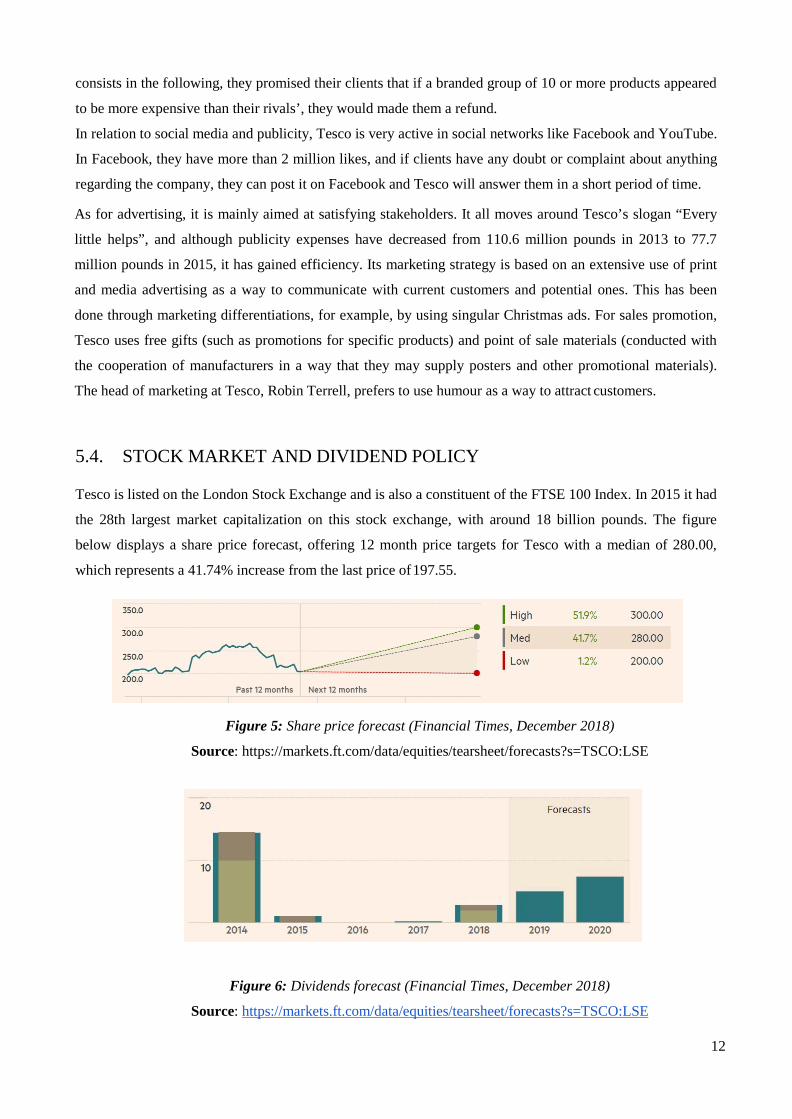
Tesco is listed on the London Stock Exchange and is also a constituent of the FTSE 100 Index. In 2015 it had
the 28th largest market capitalization on this stock exchange, with around 18 billion pounds. The figure
below displays a share price forecast, offering 12 month price targets for Tesco with a median of 280.00,
which represents a 41.74% increase from the last price of 197.55.
Figure 5: Share price forecast (Financial Times, December 2018)
Source: https://markets.ft.com/data/equities/tearsheet/forecasts?s=TSCO:LSE
Figure 6: Dividends forecast (Financial Times, December 2018)
Source: https://markets.ft.com/data/equities/tearsheet/forecasts?s=TSCO:LSE
12
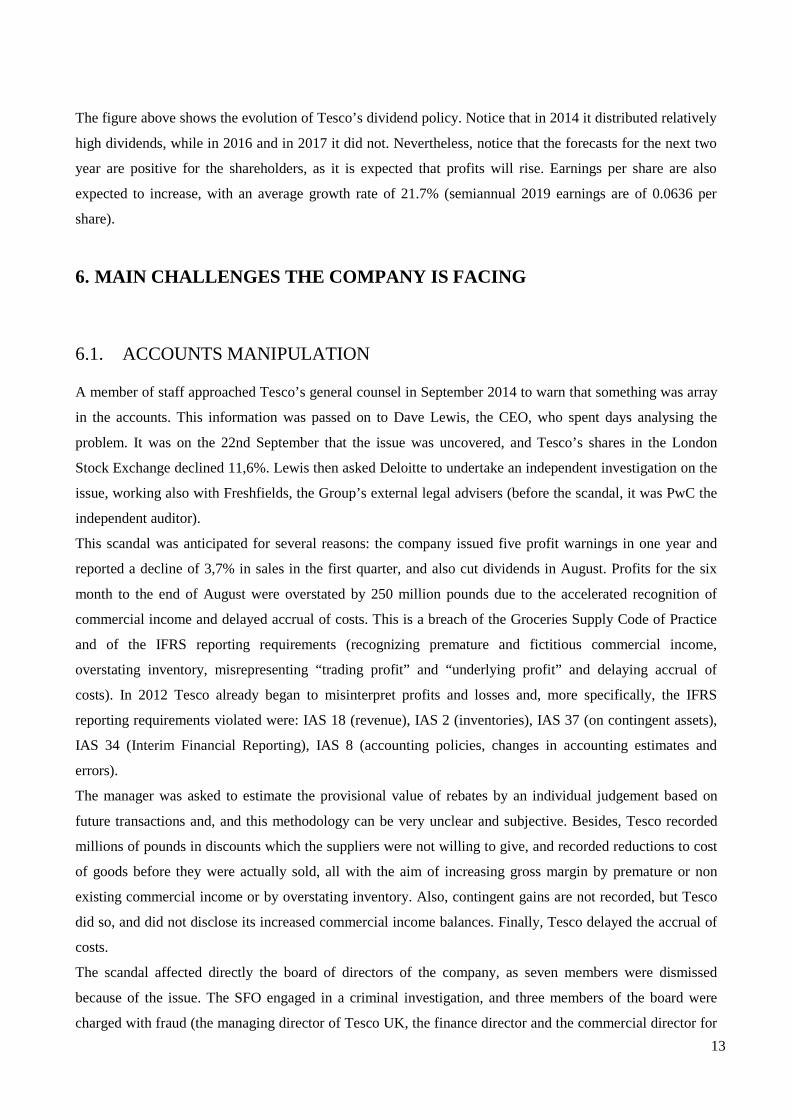
The figure above shows the evolution of Tesco’s dividend policy. Notice that in 2014 it distributed relatively
high dividends, while in 2016 and in 2017 it did not. Nevertheless, notice that the forecasts for the next two
year are positive for the shareholders, as it is expected that profits will rise. Earnings per share are also
expected to increase, with an average growth rate of 21.7% (semiannual 2019 earnings are of 0.0636 per
share).
6. MAIN CHALLENGES THE COMPANY IS FACING
6.1. ACCOUNTS MANIPULATION
A member of staff approached Tesco’s general counsel in September 2014 to warn that something was array
in the accounts. This information was passed on to Dave Lewis, the CEO, who spent days analysing the
problem. It was on the 22nd September that the issue was uncovered, and Tesco’s shares in the London
Stock Exchange declined 11,6%. Lewis then asked Deloitte to undertake an independent investigation on the
issue, working also with Freshfields, the Group’s external legal advisers (before the scandal, it was PwC the
independent auditor).
This scandal was anticipated for several reasons: the company issued five profit warnings in one year and
reported a decline of 3,7% in sales in the first quarter, and also cut dividends in August. Profits for the six
month to the end of August were overstated by 250 million pounds due to the accelerated recognition of
commercial income and delayed accrual of costs. This is a breach of the Groceries Supply Code of Practice
and of the IFRS reporting requirements (recognizing premature and fictitious commercial income,
overstating inventory, misrepresenting “trading profit” and “underlying profit” and delaying accrual of
costs). In 2012 Tesco already began to misinterpret profits and losses and, more specifically, the IFRS
reporting requirements violated were: IAS 18 (revenue), IAS 2 (inventories), IAS 37 (on contingent assets),
IAS 34 (Interim Financial Reporting), IAS 8 (accounting policies, changes in accounting estimates and
errors).
The manager was asked to estimate the provisional value of rebates by an individual judgement based on
future transactions and, and this methodology can be very unclear and subjective. Besides, Tesco recorded
millions of pounds in discounts which the suppliers were not willing to give, and recorded reductions to cost
of goods before they were actually sold, all with the aim of increasing gross margin by premature or non
existing commercial income or by overstating inventory. Also, contingent gains are not recorded, but Tesco
did so, and did not disclose its increased commercial income balances. Finally, Tesco delayed the accrual of
costs.
The scandal affected directly the board of directors of the company, as seven members were dismissed
because of the issue. The SFO engaged in a criminal investigation, and three members of the board were
charged with fraud (the managing director of Tesco UK, the finance director and the commercial director for 13
food).
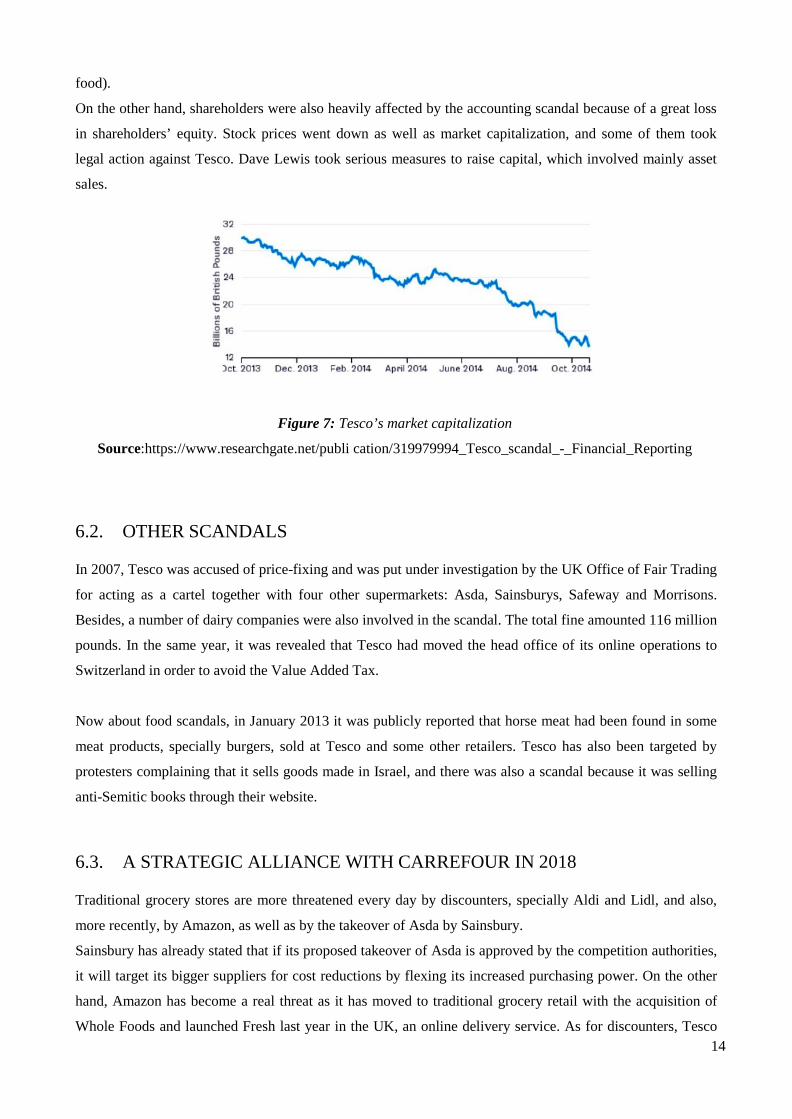
On the other hand, shareholders were also heavily affected by the accounting scandal because of a great loss
in shareholders’ equity. Stock prices went down as well as market capitalization, and some of them took
legal action against Tesco. Dave Lewis took serious measures to raise capital, which involved mainly asset
sales.
Figure 7: Tesco’s market capitalization
Source:https://www.researchgate.net/publi cation/319979994_Tesco_scandal_-_Financial_Reporting
6.2. OTHER SCANDALS
In 2007, Tesco was accused of price-fixing and was put under investigation by the UK Office of Fair Trading
for acting as a cartel together with four other supermarkets: Asda, Sainsburys, Safeway and Morrisons.
Besides, a number of dairy companies were also involved in the scandal. The total fine amounted 116 million
pounds. In the same year, it was revealed that Tesco had moved the head office of its online operations to
Switzerland in order to avoid the Value Added Tax.
Now about food scandals, in January 2013 it was publicly reported that horse meat had been found in some
meat products, specially burgers, sold at Tesco and some other retailers. Tesco has also been targeted by
protesters complaining that it sells goods made in Israel, and there was also a scandal because it was selling
anti-Semitic books through their website.
6.3. A STRATEGIC ALLIANCE WITH CARREFOUR IN 2018
Traditional grocery stores are more threatened every day by discounters, specially Aldi and Lidl, and also,
more recently, by Amazon, as well as by the takeover of Asda by Sainsbury.
Sainsbury has already stated that if its proposed takeover of Asda is approved by the competition authorities,
it will target its bigger suppliers for cost reductions by flexing its increased purchasing power. On the other
hand, Amazon has become a real threat as it has moved to traditional grocery retail with the acquisition of
Whole Foods and launched Fresh last year in the UK, an online delivery service. As for discounters, Tesco 14

remains under their pressure, especially the German ones. According to Euromonitor International, the
combination of Tesco and Carrefour would hold 8% of the European grocery market, as compared to Lidl’s
6% or Aldi’s 5%. A key focus if the strategic alliance is to reduce prices on own-brand products as a direct
response to discounters, whose products are basically own-brand, in order to make their products more
competitive. They want to imitate Sainsbury in its merger with Asda, reducing the number of branded
products, and analysts at Jefferies believe the groups could save up to £400m from the alliance (in case of a
hard Brexit it is necessary to be safe from possible supplier price rises).
The strategic alliance between Tesco and Carrefour will consist in increasing the pressure on supermarket
suppliers by teaming up to buy own-brand products together, which they claim will lead to lower prices and
more options for customers. They attempt to secure better deals from multinationals such as Nestlé as well. It
is planned to last for 3 years, and analysts claim they will squeeze suppliers.
A consequence of this strategic alliance would be having more British products in Carrefour supermarkets,
and more French products, such as cheese or wine, being sold in Tesco. Nevertheless, with increasing
globalization, this would give a plus to both retailers, even if they are already selling foreigner products.
The recent merger with Booker has also been aimed at reducing supplier costs and increasing market power
in this fierce competition environment.
7. QUESTIONS You are asked to prepare the following:
1. Prepare a qualitative analysis of Tesco PLC including the main strengths and weaknesses.
2. Analyze the balance sheet, income statement and cash flow statement from 2018 to 2012 in order
to identify the main financial strengths and weaknesses of Tesco PLC.
3. Calculate the working capital of Tesco PLC and the working capital needed in order to analyse
their financing necessities.
4. Does TESCO PLC have capacity to grow?
5. Calculate the Z score from 2012 to 2018. Are the prospects for the company good?
6. Analyse the case of accounts manipulation in 2014.
7. Prepare the Cause and Effect diagram.
8. What measures would you recommend the company to apply so as to improve their performance?
Demonstrate their effectiveness.
15
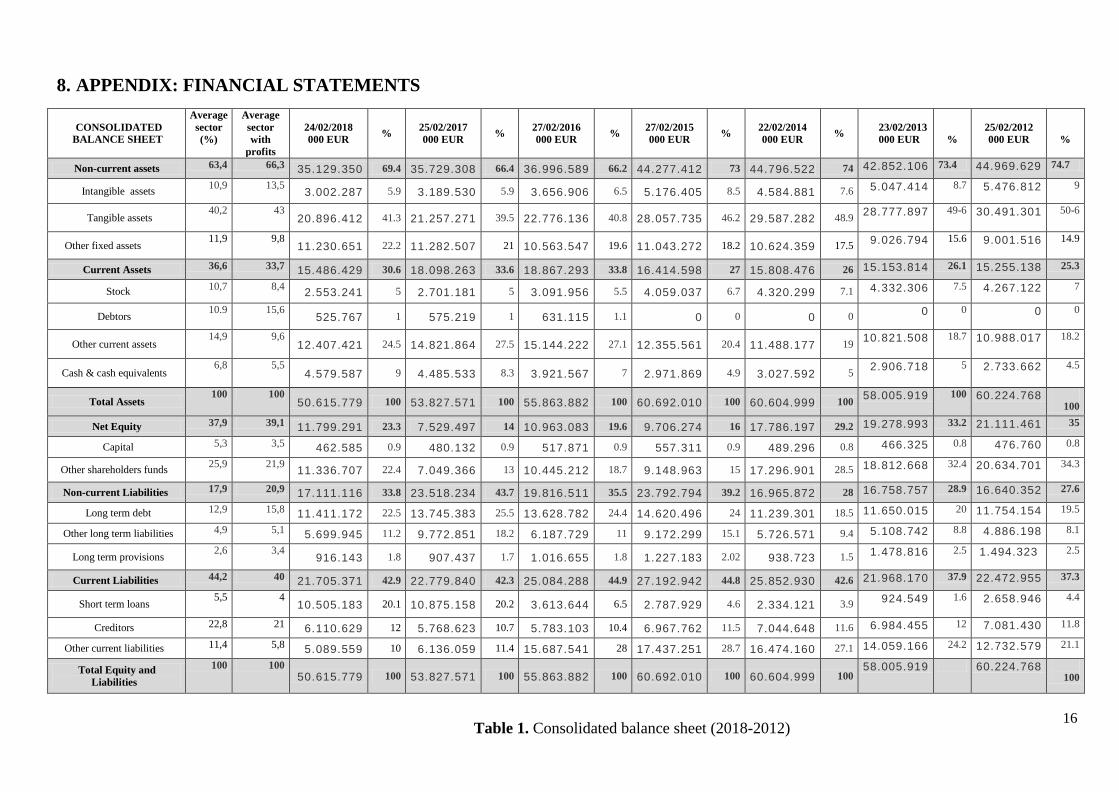
8. APPENDIX: FINANCIAL STATEMENTS
CONSOLIDATED BALANCE SHEET
Average sector (%)
Average sector with
profits
24/02/2018 000 EUR % 25/02/2017
000 EUR % 27/02/2016 000 EUR % 27/02/2015
000 EUR % 22/02/2014 000 EUR %
23/02/2013 000 EUR
%
25/02/2012 000 EUR
%
Non-current assets 63,4 66,3 35.129.350 69.4 35.729.308 66.4 36.996.589 66.2 44.277.412 73 44.796.522 74 42.852.106 73.4 44.969.629 74.7
Intangible assets 10,9
13,5 3.002.287 5.9 3.189.530 5.9 3.656.906 6.5 5.176.405 8.5 4.584.881 7.6 5.047.414 8.7 5.476.812 9
Tangible assets 40,2 43
20.896.412 41.3 21.257.271 39.5 22.776.136 40.8 28.057.735 46.2 29.587.282 48.9 28.777.897 49-6 30.491.301 50-6
Other fixed assets 11,9 9,8
11.230.651 22.2 11.282.507 21 10.563.547 19.6 11.043.272 18.2 10.624.359 17.5 9.026.794 15.6 9.001.516 14.9
Current Assets 36,6 33,7 15.486.429 30.6 18.098.263 33.6 18.867.293 33.8 16.414.598 27 15.808.476 26 15.153.814 26.1 15.255.138 25.3
Stock 10,7 8,4 2.553.241 5 2.701.181 5 3.091.956 5.5 4.059.037 6.7 4.320.299 7.1 4.332.306 7.5 4.267.122 7
Debtors 10.9 15,6 525.767 1 575.219 1 631.115 1.1 0 0 0 0 0 0 0 0
Other current assets 14,9 9,6
12.407.421 24.5 14.821.864 27.5 15.144.222 27.1 12.355.561 20.4 11.488.177 19 10.821.508 18.7 10.988.017 18.2
Cash & cash equivalents 6,8 5,5
4.579.587 9 4.485.533 8.3 3.921.567 7 2.971.869 4.9 3.027.592 5 2.906.718 5 2.733.662 4.5
Total Assets 100 100
50.615.779 100 53.827.571 100 55.863.882 100 60.692.010 100 60.604.999 100 58.005.919 100 60.224.768 100
Net Equity 37,9 39,1 11.799.291 23.3 7.529.497 14 10.963.083 19.6 9.706.274 16 17.786.197 29.2 19.278.993 33.2 21.111.461 35
Capital 5,3 3,5 462.585 0.9 480.132 0.9 517.871 0.9 557.311 0.9 489.296 0.8 466.325 0.8 476.760 0.8
Other shareholders funds 25,9 21,9 11.336.707 22.4 7.049.366 13 10.445.212 18.7 9.148.963 15 17.296.901 28.5 18.812.668 32.4 20.634.701 34.3
Non-current Liabilities 17,9 20,9 17.111.116 33.8 23.518.234 43.7 19.816.511 35.5 23.792.794 39.2 16.965.872 28 16.758.757 28.9 16.640.352 27.6
Long term debt 12,9 15,8 11.411.172 22.5 13.745.383 25.5 13.628.782 24.4 14.620.496 24 11.239.301 18.5 11.650.015 20 11.754.154 19.5
Other long term liabilities 4,9 5,1 5.699.945 11.2 9.772.851 18.2 6.187.729 11 9.172.299 15.1 5.726.571 9.4 5.108.742 8.8 4.886.198 8.1
Long term provisions 2,6 3,4 916.143 1.8 907.437 1.7 1.016.655 1.8 1.227.183 2.02 938.723 1.5 1.478.816 2.5 1.494.323 2.5
Current Liabilities 44,2 40 21.705.371 42.9 22.779.840 42.3 25.084.288 44.9 27.192.942 44.8 25.852.930 42.6 21.968.170 37.9 22.472.955 37.3
Short term loans 5,5 4 10.505.183 20.1 10.875.158 20.2 3.613.644 6.5 2.787.929 4.6 2.334.121 3.9 924.549 1.6 2.658.946 4.4
Creditors 22,8 21 6.110.629 12 5.768.623 10.7 5.783.103 10.4 6.967.762 11.5 7.044.648 11.6 6.984.455 12 7.081.430 11.8
Other current liabilities 11,4 5,8 5.089.559 10 6.136.059 11.4 15.687.541 28 17.437.251 28.7 16.474.160 27.1 14.059.166 24.2 12.732.579 21.1
Total Equity and Liabilities
100 100 50.615.779 100 53.827.571 100 55.863.882 100 60.692.010 100 60.604.999 100
58.005.919 60.224.768 100
Table 1. Consolidated balance sheet (2018-2012) 16
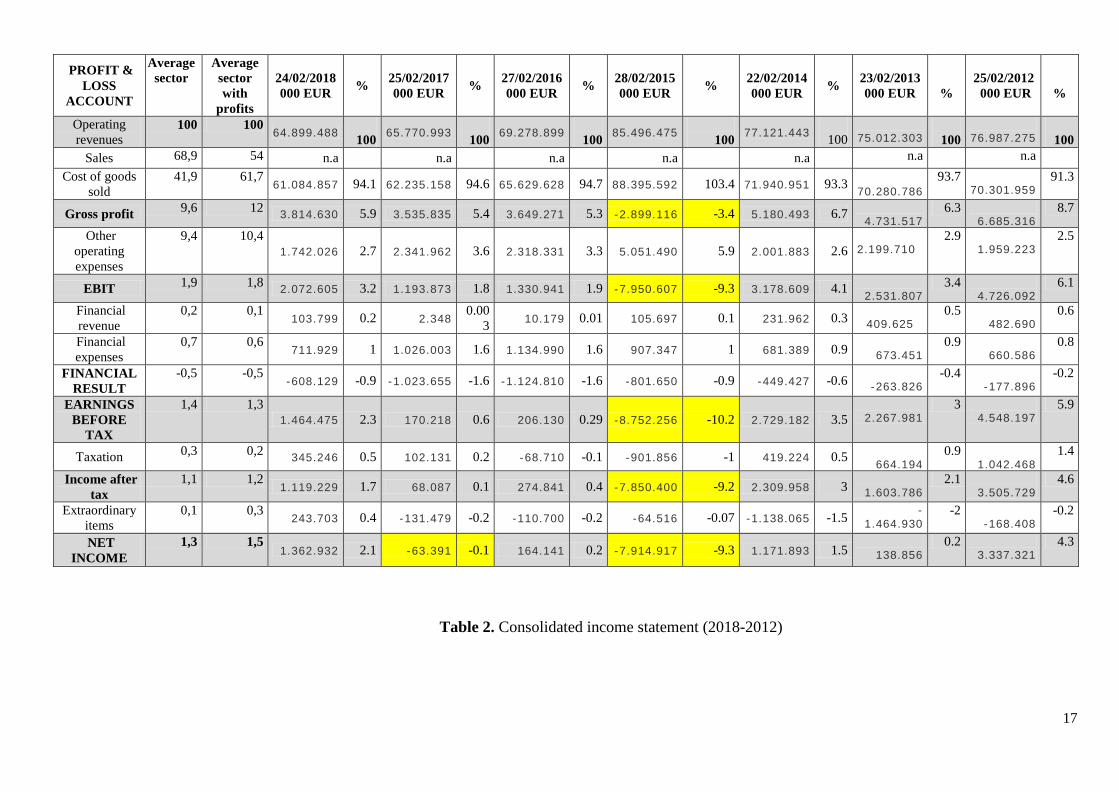
PROFIT & LOSS
ACCOUNT
Average sector
Average sector with
profits
24/02/2018 000 EUR % 25/02/2017
000 EUR % 27/02/2016 000 EUR % 28/02/2015
000 EUR % 22/02/2014 000 EUR %
23/02/2013 000 EUR
%
25/02/2012 000 EUR
%
Operating revenues
100 100 64.899.488 100 65.770.993
100 69.278.899 100 85.496.475 100 77.121.443
100
75.012.303
100
76.987.275
100
Sales 68,9 54 n.a n.a n.a n.a n.a n.a n.a
Cost of goods sold
41,9 61,7 61.084.857 94.1 62.235.158 94.6 65.629.628 94.7 88.395.592 103.4 71.940.951 93.3
70.280.786 93.7
70.301.959 91.3
Gross profit 9,6 12 3.814.630 5.9 3.535.835 5.4 3.649.271 5.3 -2.899.116 -3.4 5.180.493 6.7 4.731.517
6.3 6.685.316
8.7
Other operating expenses
9,4 10,4 1.742.026 2.7 2.341.962 3.6 2.318.331 3.3 5.051.490 5.9 2.001.883 2.6
2.199.710
2.9 1.959.223
2.5
EBIT 1,9 1,8 2.072.605 3.2 1.193.873 1.8 1.330.941 1.9 -7.950.607 -9.3 3.178.609 4.1 2.531.807
3.4 4.726.092
6.1
Financial revenue
0,2 0,1 103.799 0.2 2.348
0.003 10.179 0.01 105.697 0.1 231.962 0.3
409.625 0.5
482.690 0.6
Financial expenses
0,7 0,6 711.929 1 1.026.003 1.6 1.134.990 1.6 907.347 1 681.389 0.9
673.451 0.9
660.586 0.8
FINANCIAL RESULT
-0,5 -0,5 -608.129 -0.9 -1.023.655 -1.6 -1.124.810 -1.6 -801.650 -0.9 -449.427 -0.6
-263.826 -0.4
-177.896 -0.2
EARNINGS BEFORE
TAX
1,4 1,3 1.464.475 2.3 170.218 0.6 206.130 0.29 -8.752.256 -10.2 2.729.182 3.5
2.267.981
3 4.548.197
5.9
Taxation 0,3 0,2 345.246 0.5 102.131 0.2 -68.710 -0.1 -901.856 -1 419.224 0.5 664.194
0.9 1.042.468
1.4
Income after tax
1,1 1,2 1.119.229 1.7 68.087 0.1 274.841 0.4 -7.850.400 -9.2 2.309.958 3
1.603.786 2.1
3.505.729 4.6
Extraordinary items
0,1 0,3 243.703 0.4 -131.479 -0.2 -110.700 -0.2 -64.516 -0.07 -1.138.065 -1.5 -
1.464.930 -2
-168.408 -0.2
NET INCOME
1,3 1,5 1.362.932 2.1 -63.391 -0.1 164.141 0.2 -7.914.917 -9.3 1.171.893 1.5
138.856
0.2 3.337.321
4.3
Table 2. Consolidated income statement (2018-2012)
17
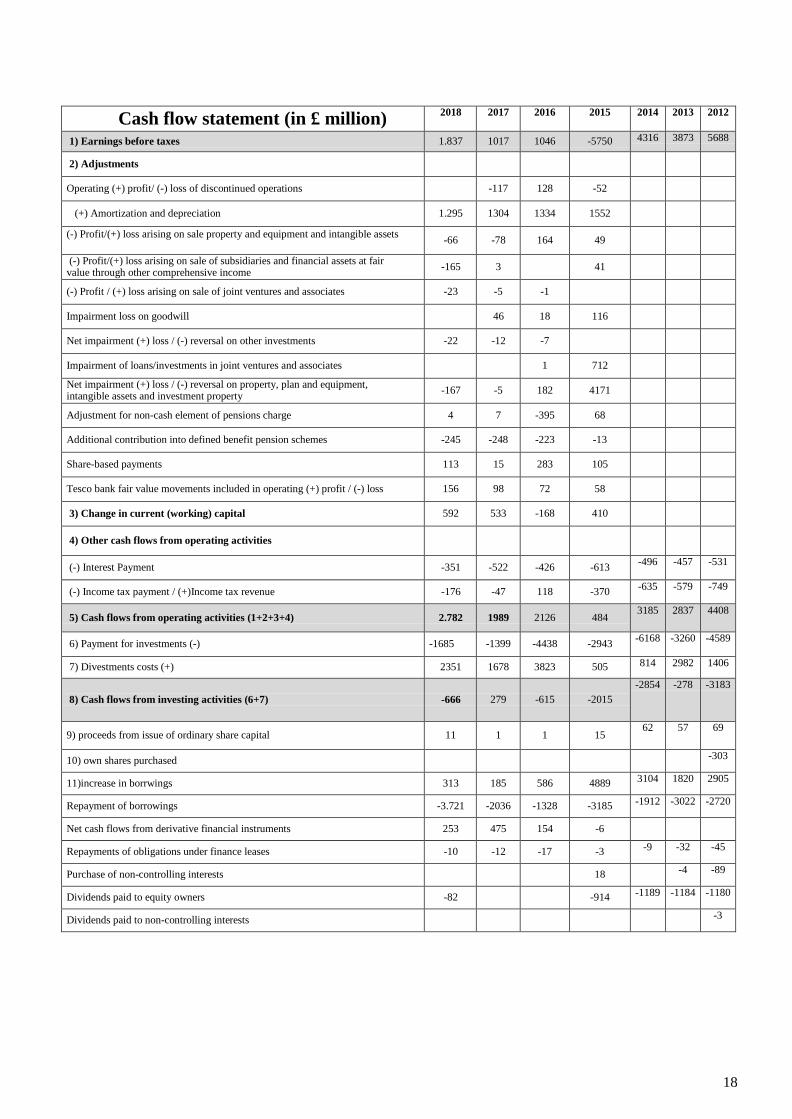
Cash flow statement (in £ million) 2018 2017 2016 2015 2014 2013 2012
1) Earnings before taxes 1.837 1017 1046 -5750 4316 3873 5688
2) Adjustments
Operating (+) profit/ (-) loss of discontinued operations -117 128 -52
(+) Amortization and depreciation 1.295 1304 1334 1552
(-) Profit/(+) loss arising on sale property and equipment and intangible assets -66 -78 164 49
(-) Profit/(+) loss arising on sale of subsidiaries and financial assets at fair value through other comprehensive income -165 3 41
(-) Profit / (+) loss arising on sale of joint ventures and associates -23 -5 -1
Impairment loss on goodwill 46 18 116
Net impairment (+) loss / (-) reversal on other investments -22 -12 -7
Impairment of loans/investments in joint ventures and associates 1 712
Net impairment (+) loss / (-) reversal on property, plan and equipment, intangible assets and investment property -167 -5 182 4171
Adjustment for non-cash element of pensions charge 4 7 -395 68
Additional contribution into defined benefit pension schemes -245 -248 -223 -13
Share-based payments 113 15 283 105
Tesco bank fair value movements included in operating (+) profit / (-) loss 156 98 72 58
3) Change in current (working) capital 592 533 -168 410
4) Other cash flows from operating activities
(-) Interest Payment -351 -522 -426 -613 -496 -457 -531
(-) Income tax payment / (+)Income tax revenue -176 -47 118 -370 -635 -579 -749
5) Cash flows from operating activities (1+2+3+4) 2.782 1989 2126 484 3185 2837 4408
6) Payment for investments (-) -1685 -1399 -4438 -2943 -6168 -3260 -4589
7) Divestments costs (+) 2351 1678 3823 505 814 2982 1406
8) Cash flows from investing activities (6+7)
-666
279
-615
-2015
-2854 -278 -3183
9) proceeds from issue of ordinary share capital 11 1 1 15 62 57 69
10) own shares purchased -303
11)increase in borrwings 313 185 586 4889 3104 1820 2905
Repayment of borrowings -3.721 -2036 -1328 -3185 -1912 -3022 -2720
Net cash flows from derivative financial instruments 253 475 154 -6
Repayments of obligations under finance leases -10 -12 -17 -3 -9 -32 -45
Purchase of non-controlling interests 18 -4 -89
Dividends paid to equity owners -82 -914 -1189 -1184 -1180
Dividends paid to non-controlling interests -3
18
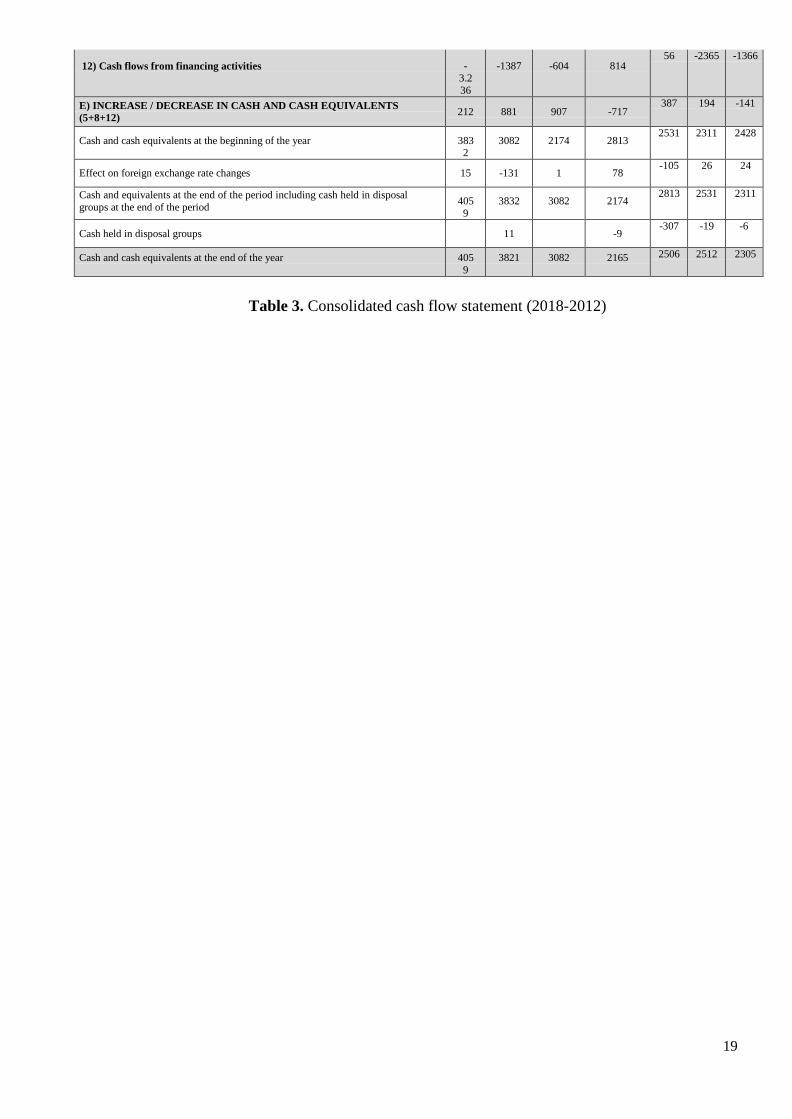
12) Cash flows from financing activities -3.236
-1387 -604 814 56 -2365 -1366
E) INCREASE / DECREASE IN CASH AND CASH EQUIVALENTS (5+8+12) 212 881 907 -717
387 194 -141
Cash and cash equivalents at the beginning of the year 3832
3082 2174 2813 2531 2311 2428
Effect on foreign exchange rate changes 15 -131 1 78 -105 26 24
Cash and equivalents at the end of the period including cash held in disposal groups at the end of the period 405
9 3832 3082 2174
2813 2531 2311
Cash held in disposal groups
11
-9 -307 -19 -6
Cash and cash equivalents at the end of the year 4059
3821 3082 2165 2506 2512 2305
Table 3. Consolidated cash flow statement (2018-2012)
19
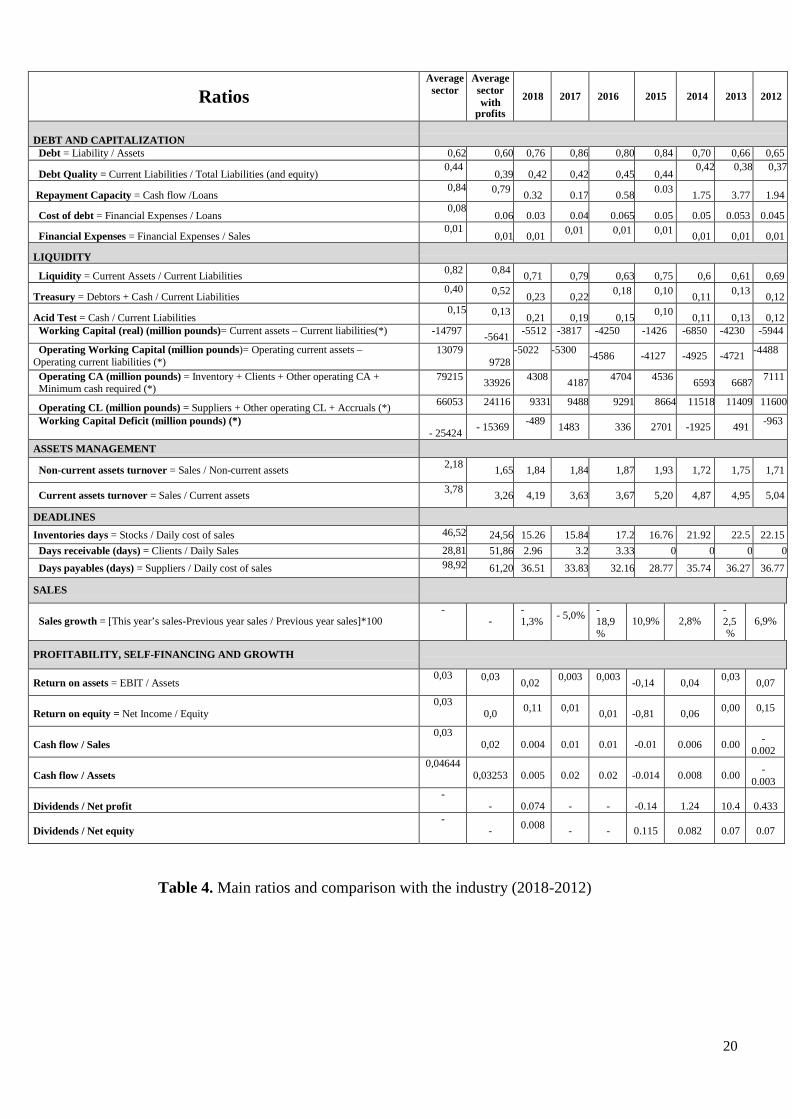
Ratios Average
sector Average sector with
profits
2018
2017
2016
2015
2014
2013
2012
DEBT AND CAPITALIZATION
Debt = Liability / Assets 0,62 0,60 0,76 0,86 0,80 0,84 0,70 0,66 0,65
Debt Quality = Current Liabilities / Total Liabilities (and equity) 0,44
0,39 0,42 0,42 0,45 0,44 0,42 0,38 0,37
Repayment Capacity = Cash flow /Loans 0,84 0,79 0.32 0.17 0.58 0.03 1.75 3.77 1.94
Cost of debt = Financial Expenses / Loans 0,08
0.06 0.03 0.04 0.065 0.05 0.05 0.053 0.045
Financial Expenses = Financial Expenses / Sales 0,01
0,01 0,01 0,01 0,01 0,01 0,01 0,01 0,01
LIQUIDITY
Liquidity = Current Assets / Current Liabilities 0,82 0,84 0,71 0,79 0,63 0,75 0,6 0,61 0,69
Treasury = Debtors + Cash / Current Liabilities 0,40 0,52 0,23 0,22 0,18 0,10 0,11 0,13 0,12
Acid Test = Cash / Current Liabilities 0,15 0,13 0,21 0,19 0,15 0,10 0,11 0,13 0,12
Working Capital (real) (million pounds)= Current assets – Current liabilities(*) -14797 -5641 -5512 -3817 -4250 -1426 -6850 -4230 -5944
Operating Working Capital (million pounds)= Operating current assets – Operating current liabilities (*)
13079 9728
-5022 -5300 -4586 -4127 -4925 -4721 -4488
Operating CA (million pounds) = Inventory + Clients + Other operating CA + Minimum cash required (*)
79215 33926 4308 4187 4704 4536 6593 6687 7111
Operating CL (million pounds) = Suppliers + Other operating CL + Accruals (*) 66053 24116 9331 9488 9291 8664 11518 11409 11600
Working Capital Deficit (million pounds) (*) - 25424 - 15369 -489 1483 336 2701 -1925 491 -963
ASSETS MANAGEMENT
Non-current assets turnover = Sales / Non-current assets 2,18 1,65 1,84 1,84 1,87 1,93 1,72 1,75 1,71
Current assets turnover = Sales / Current assets 3,78 3,26 4,19 3,63 3,67 5,20 4,87 4,95 5,04
DEADLINES
Inventories days = Stocks / Daily cost of sales 46,52 24,56 15.26 15.84 17.2 16.76 21.92 22.5 22.15 Days receivable (days) = Clients / Daily Sales 28,81 51,86 2.96 3.2 3.33 0 0 0 0 Days payables (days) = Suppliers / Daily cost of sales 98,92 61,20 36.51 33.83 32.16 28.77 35.74 36.27 36.77
SALES
Sales growth = [This year’s sales-Previous year sales / Previous year sales]*100
- -
-1,3% - 5,0% -
18,9%
10,9%
2,8%
- 2,5 %
6,9%
PROFITABILITY, SELF-FINANCING AND GROWTH
Return on assets = EBIT / Assets 0,03 0,03 0,02 0,003
0,003
-0,14 0,04 0,03 0,07
Return on equity = Net Income / Equity
0,03 0,0 0,11 0,01
0,01 -0,81
0,06 0,00
0,15
Cash flow / Sales
0,03 0,02
0.004
0.01
0.01
-0.01
0.006
0.00 -
0.002 Cash flow / Assets
0,04644 0,03253
0.005
0.02
0.02
-0.014
0.008
0.00 -
0.003 Dividends / Net profit
- -
0.074
-
-
-0.14
1.24
10.4
0.433
Dividends / Net equity
- - 0.008
-
-
0.115
0.082
0.07
0.07
Table 4. Main ratios and comparison with the industry (2018-2012)
20
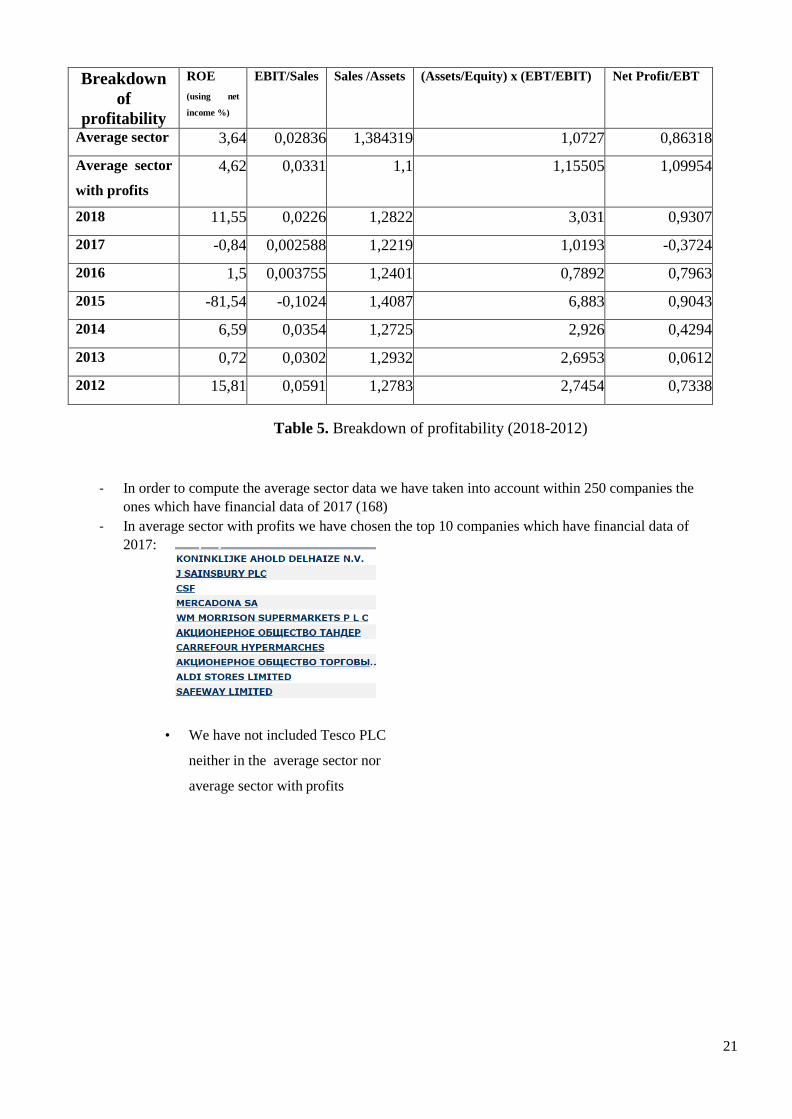
Breakdown
of profitability
ROE (using net
income %)
EBIT/Sales Sales /Assets (Assets/Equity) x (EBT/EBIT) Net Profit/EBT
Average sector 3,64 0,02836 1,384319 1,0727 0,86318
Average sector
with profits 4,62 0,0331 1,1 1,15505 1,09954
2018 11,55 0,0226 1,2822 3,031 0,9307
2017 -0,84 0,002588 1,2219 1,0193 -0,3724
2016 1,5 0,003755 1,2401 0,7892 0,7963
2015 -81,54 -0,1024 1,4087 6,883 0,9043
2014 6,59 0,0354 1,2725 2,926 0,4294
2013 0,72 0,0302 1,2932 2,6953 0,0612
2012 15,81 0,0591 1,2783 2,7454 0,7338
Table 5. Breakdown of profitability (2018-2012)
- In order to compute the average sector data we have taken into account within 250 companies the ones which have financial data of 2017 (168)
- In average sector with profits we have chosen the top 10 companies which have financial data of 2017:
• We have not included Tesco PLC
neither in the average sector nor
average sector with profits
21