Military and Their Families: Strengthening Community Support and Preparing for Successful Employment
Forschungsinstitut zur Zukunft der ArbeitInstitute for the Study of Labor
DI
SC
US
SI
ON
P
AP
ER
S
ER
IE
S
Terrorism and Employment:Evidence from Successful and Failed Terror Attacks
IZA DP No. 9526
November 2015
Abel Brodeur
Terrorism and Employment:
Evidence from Successful and Failed Terror Attacks
Abel Brodeur University of Ottawa
and IZA
Discussion Paper No. 9526 November 2015
IZA
P.O. Box 7240 53072 Bonn
Germany
Phone: +49-228-3894-0 Fax: +49-228-3894-180
E-mail: [email protected]
Any opinions expressed here are those of the author(s) and not those of IZA. Research published in this series may include views on policy, but the institute itself takes no institutional policy positions. The IZA research network is committed to the IZA Guiding Principles of Research Integrity. The Institute for the Study of Labor (IZA) in Bonn is a local and virtual international research center and a place of communication between science, politics and business. IZA is an independent nonprofit organization supported by Deutsche Post Foundation. The center is associated with the University of Bonn and offers a stimulating research environment through its international network, workshops and conferences, data service, project support, research visits and doctoral program. IZA engages in (i) original and internationally competitive research in all fields of labor economics, (ii) development of policy concepts, and (iii) dissemination of research results and concepts to the interested public. IZA Discussion Papers often represent preliminary work and are circulated to encourage discussion. Citation of such a paper should account for its provisional character. A revised version may be available directly from the author.
IZA Discussion Paper No. 9526 November 2015
ABSTRACT
Terrorism and Employment: Evidence from Successful and Failed Terror Attacks*
This paper examines the economic consequences of terror attacks and the channels through which terrorism affects local economies. I rely on an exhaustive list of terror attacks over the period 1970-2013 in the U.S. and exploit the inherent randomness in the success or failure of terror attacks to identify the economic impacts of terrorism. The findings suggest that successful attacks, in comparison to failed attacks, reduce the number of jobs in targeted counties by approximately 5% in the year the attack takes place. The effects fade away after 2 years and I find no evidence that neighboring counties suffer from the successful attack. Analyzing the channels, I find suggestive evidence that the decrease in the physical capital stock of a county partially explains the temporary reduction in jobs. I also focus on economic attitudes and political preferences since these preferences have been shown to be related to economic outcomes. The results suggest that successful attacks decrease temporarily vote share for Democrat candidates in gubernatorial elections and bring a leftward shift in attitudes in targeted counties. JEL Classification: D72, D74, C13, P16 Keywords: crime, terrorism, growth, preferences, voting behavior Corresponding author: Abel Brodeur Department of Economics University of Ottawa 120 University Ottawa, ON K1N 6N5 Canada E-mail: [email protected]
* I thank Cristina Blanco-Perez, Pierre Brochu, Marie Connolly, Serge Coulombe, Catherine Deri Armstrong, Jason Garred, Anthony Heyes, Louis-Philippe Morin, Francesca Rondina and Yanos Zylberberg for very useful remarks and encouragements. Financial support from SSHRC and the LABEX-OSE is gratefully acknowledged.
1 Introduction
Terrorism and its implications on contemporary society has been one of the
most discussed issues since Sept. 11, 2001. Terrorism has been associated
with uncertainty (Becker and Rubinstein (2011)), a decrease in tourist ar-
rivals (Enders et al. (1992)), the real estate market (Abadie and Dermisi
(2008); Besley and Mueller (2012); Glaeser and Shapiro (2002)), and net
foreign direct investment positions (Abadie and Gardeazabal (2008)).1 Un-
fortunately, the urgency of terrorism has never been greater. Mueller and
Stewart (2014) calculate that domestic counterterrorism expenditures per
year in the U.S. increased by approximately $75 billion since Sept. 11, 2001.
It is thus crucially important to determine the economic consequences of
terror attacks and to better understand the channels through which terror-
ism affects local economies.
Identifying the causal impact of terrorism on economic outcomes is dif-
ficult for a number of reasons. For instance, economic characteristics of
locations targeted by terrorists differ from non-targeted locations (see Ap-
pendix Table A1)2 and other economic shocks might affect the local econ-
omy simultaneously. In this study, I address these challenges by relying on
a novel identification strategy. I employ an exhaustive list of terror attacks
in the U.S. from 1970 to 2013 and directly compare successful terror at-
tacks to failed attacks. Success of terror attacks is defined according to the
actual impacts of the attacks (see Section 3). This setting is attractive for
at least two reasons reasons. First, the identification assumption is that,
conditional on being a location targeted by a terror attack, the success or
failure of the attack may be considered as plausibly exogenous. This as-
sumption seems reasonable given that the sample of successful and failed
terror attacks is balanced across a wide range of characteristics (see Sec-
tion 4). Moreover, the empirical model controls for attack type, the type
of weapon used and the target to make sure that the success of a terror
1See Landes (1978) for a seminal study of the effectiveness of counterterrorism policiesand Abadie (2006), Enders and Hoover (2012), Krueger and Maleckova (2003) andKrueger (2008) for the causes of terrorism. See Di Tella and Schargrodsky (2004), Dracaet al. (2011) and Klick and Tabarrok (2005) for the relationship between crime, policeand terrorism. Another important and debated theme is the analysis of terrorist attacktrends. Enders et al. (2011) point out many methodological issues of time series analysissuch as the importance of separating transnational and domestic terrorist incidents.
2Appendix Table A1 compares counties with a successful terror attack with all othercounties. I find that counties targeted by a successful terror attack are relatively morepopulous and have less social security recipients and people in poverty per capita thannon-targeted counties. Moreover, counties targeted by a successful terror attack aremore likely to be coastal counties, to have an airport and to be in the Northeast orWest.
2
attack is not related to terrorists’ tactics. Comparing successful and failed
terror attacks thus allows me to abstract from the empirical obstacles asso-
ciated with controlling for all the employment shocks and characteristics of
local economies at the moment of the attack. In other words, the empirical
model identifies, for instance, the effect of an explosion in which the device
detonates versus an explosion in which it does not detonate.
Second, despite its perceived economic costs in America and the other
OECD countries, the study of terrorism using subnational data is a rela-
tively recent phenomena. The large number of terror attacks and detailed
information on their location and date enable me to analyze the economic
consequences of terrorism at the county-level. Analyzing the impacts of ter-
ror attacks at this geographical level provides many advantages including
the possibility to test empirically the channels through which terror affects
local economies. The empirical strategy is also aided by the considerable
variation across counties in the timing of terror attacks.
Using this identification strategy, I first quantify the economic conse-
quences of terror attacks in targeted areas. In Section 5, I examine whether
local terror attacks cause a decrease in employment in targeted counties.
The findings suggest that successful attacks reduce the number of jobs by
approximately 5% in the year the attack takes place in comparison to failed
terror attacks. This impact is robust to the inclusion of many controls and
is especially large for employment in the sectors of wholesale trade and
finance and real estate. By contrast, the effects for neighboring counties
and subsequent years are smaller and statistically insignificant suggesting
that the employment effects are very local and fade away rapidly. Last, the
estimates yield weak evidence that successful terror attacks affect earnings
in the short-run in comparison to failed attacks. The point estimates are
smaller than for jobs (from -2.1% to -4.2%) and statistically significant in
only some econometric models.
I then examine the channels through which terror attacks temporarily
affect local economies. I first test whether the economic effects of terror
attacks causing more damages are greater than for non-lethal attacks. I find
suggestive evidence that terror attacks leading to a larger decrease in the
physical capital stock of a county have a greater impact on the number of
jobs lost. This result suggests that terrorism affect local economies through
the reduction in capital. But the estimates on jobs reduction are certainly
too large to imply that terrorism affects employment only through building
damages. Very few terror attacks in our sample led to catastrophic building
damages (see Section 3).
3
Another plausible channel is the increased (perceived) risk of investing
or visiting the local area. I thus check whether successful terror attacks
affect particularly counties with a large tourism industry. I rely on the
presence of an airport as a proxy for the size of the tourism industry. I
find that jobs-to-population ratios in counties with an airport (medium
or major hubs) decrease for the year of the attack and the subsequent
year suggesting that it takes few years before the psychological effects of
terrorism completely wane.
In addition, I focus on economic attitudes and political preferences since
these preferences have been shown to be related to labor supply and invest-
ment. A change in attitude of the local population following a terror attack
would thus provide a valid explanation for the negative impact of terror on
employment. In Section 6, I examine whether terrorism causes local popu-
lation to change their voting behavior and their economic attitude toward
government, marriage, religion, and a woman’s place in the society. The
evidence supports the idea that terrorism brought a change in the political
landscape. I find evidence that successful terror attacks decrease the likeli-
hood to vote for the Democrat candidates in gubernatorial elections. The
impact is local since voting behavior of neighboring counties is not signif-
icantly different for treated (successful attack) and control (failed attack)
counties. The results also suggest that successful terror attacks brought a
leftward shift in attitudes in targeted counties. For instance, local residents
of treated counties are more likely to disagree that a woman’s place is in
the home. Overall, these results suggest that some attitudes and voting
behavior temporarily change in locations in which the terror attack was
successful. Of note, though, the effects are small and temporary which
might explain the absence of long-term economic impacts of terrorism.
This paper relates to a recent literature that analyzes the economic con-
sequences of terrorism. The results highlight some of the different channels
through which terrorism may impact targeted economies. The presence
of many channels may explain the lack of consensus in the literature on
whether terror may have short- or long-term impact on employment and
growth. Many authors argue that terrorism is unlikely to affect economic
activity in the long-run (see Becker and Murphy (2001) for instance). On
the other hand, many empirical papers find that the outbreak of terrorism
declines GDP per capita (see Abadie and Gardeazabal (2003) for example).3
3Time-series and cross-country studies find that terrorism has heterogeneous impacts.For instance, see Blomberg et al. (2004), Crain and Crain (2006), Gaibulloev and Sandler(2008), Gries et al. (2011) and Meierrieks and Gries (2013). Sandler (2014) provides aliterature review.
4
I provide a literature review in Section 2 and I will turn to a discussion of
how my paper complements and contributes to this growing literature in
the conclusion.
This study also relates to a literature that studies the impact of terror-
ism and war on democratic elections (Berrebi and Klor (2006); Gassebner
et al. (2008); Karol and Miguel (2007); Kibris (2011); Jones and Olken
(2009); Montalvo (2011)). Many studies argue that the timing of terror
attacks is not random (Pape (2003, 2005)) which makes it hard to identify
the causal impact of terror attacks on electoral outcomes. Gould and Klor
(2010) find evidence that terrorism is an effective tool for achieving political
goals. The authors exploit geographical variation in terror attacks in Israel
and show that local terror attacks cause Israelis to vote increasingly for
right-wing parties and that right-wing parties move to the left in response
to terror. Last, my work complements studies that analyze the impact
of capital destruction. For instance, Deryugina et al. (2014) provide evi-
dence that Katrina victims’ incomes fully recovered within few years and
even surpass that of similar cities not affected by the hurricane. Strobl
(2011) finds that a county’s annual economic growth rate falls on average
by 0.45 percentage points following an hurricane and that the impact is not
economically important enough to affect the state-level economy.
In Section 2, I provide background on the economics of terrorism. Sec-
tion 3 details the data sets and provides descriptive statistics. Section 4
presents the methodology and the model specification. Section 5 presents
the results for jobs. Section 6 examines some of the channels through which
terror attacks affect employment. The last section concludes.
2 Conceptual Framework
The notion that terror attacks may have short- and long-run effects on eco-
nomic outcomes is not obvious, in part because there are many channels
through which terrorism could impact jobs (US Congress (2002)). On the
one hand, the rapid recovery from wars and natural disasters led many au-
thors such as British political economist Mill (1848) to argue that nations
recover quickly when the direct impacts on productive capital are modest.
Becker and Murphy (2001) point out that the city of Kobe recovered its
pre-quake GDP levels in only a little over a year after the 1995 earthquake.
The authors argue that uncertainty about future terror attacks may in-
crease the complexity of understanding the consequences of incidents such
as the Sept. 11 attacks, but conclude that, ultimately, history shows that
5
economies adjust rapidly. On the other hand, Abadie and Gardeazabal
(2003, 2008) provide empirical evidence that terrorism has large effects on
economic outcomes. In a seminal paper, Abadie and Gardeazabal (2003)
develop a new identification strategy that allows them to investigate the
economic effects of terrorism in the Basque Country. They construct a syn-
thetic control region without terrorism and find that, after the outbreak of
terrorism, GDP per capita in the Basque Country declined by 10 percentage
points relative to the control region.
• Destruction of Capital Stock: the human and physical capital
stock of a county may be reduced as a result of a terror attack. Becker
and Murphy (2001) estimated that the Sept. 11 attacks resulted in
a loss of 0.2% of physical assets and 0.06% of total productive assets
in the U.S. economy. But most terror attacks in the U.S. do not
cause catastrophic building damages. Section 3 documents that, in
our data set, the average number of deaths for counties with at least
one successful terror attack is 3.8 and very few terror attacks caused
over $1 billion in property damages. I test this channel empirically
by checking whether terror attacks causing more deaths and damages
have greater economic impacts.
• Migration: terrorism may worsen individual living and working con-
ditions and might thus impact individual migration decision (Dreher
et al. (2011)). Moreover, the desire to emigrate might increase as a
result of the increase in fear and uncertainty. I test this channel in
Section 5 and find no evidence that successful terror attacks decrease
the number of inhabitants in targeted counties in the years following
the attacks.
• Allocation of Productive Capital: capital may tend to flow to
destinations without a terrorist threat. This would reduce net for-
eign investment in the economies affected by terrorism and thus af-
fect growth and employment. Abadie and Gardeazabal (2008) argue
that terrorism may impact the allocation of productive capital across
countries. The authors provide evidence that higher levels of terrorist
risks are associated with lower levels of net foreign direct investment
positions.
• Uncertainty: a direct effect of terrorism is to increase uncertainty
(Becker and Rubinstein (2011)). Increased uncertainty may have an
impact on consumer and investment behavior. Investors may move
6
out of riskier assets into safer (US Congress (2002)). Terrorism may
also cause political instability which would translate into more un-
certainty.4
• Counterterrorism Expenditures: terror attacks may lead to an
increase in counterterrorism expenditures (Di Tella and Schargrodsky
(2004); Draca et al. (2011)). Resources would then move out of pro-
ductive sectors to unproductive sectors such as security. Mueller and
Stewart (2014) calculate that domestic counterterrorism expenditures
per year were about $25 billion in 2010 dollars before the terrorist at-
tacks of Sept. 11, 2001, and increased by about $75 billion in the
subsequent decade. Note that permanent increase in counterterror-
ism expenditures is generally at the national- and regional-levels.
• Airline and Tourism Industries: The risk of further incidents may
have psychological effects on potential tourists. A decrease in tourist
arrivals following a terror attack or political instability has been doc-
umented in several studies (see, for instance, Enders et al. (1992) or
Sonmez and Graefe (1998)). The psychological effects should wane
after some time, but the direct cost of increased airport security
could have (worldwide) permanent economic consequences. I check
in Section 5 whether terror attacks targeting areas with airports have
greater economic impacts.
• Economic Attitudes: terror attacks may fuel fears and shift tem-
porarily or permanently economic attitudes. I test in this research
whether the local population changes their economic attitudes and
voting behavior following a successful terror attack. I check attitudes
ranging from marriage, women’s place in the society to religion. Note
that this channel could impact the local economy in the long-run by
impacting, for instance, female labor supply. Moreover, there is evi-
dence that partisan allegiance of U.S. governors has a causal impact
on labor market outcomes (Beland (2015)). For instance, Besley and
Case (1995) find that Democratic governors are more likely to raise
taxes and that Republican governors are less likely to increase the
minimum wage.
A key insight from this conceptual framework is that terrorism may
impact local economies both in the short- and long-run. Local economies
4Jones and Olken (2009) provide evidence that assassinations of political leaders mayimpact the evolution of political institutions. Their identification strategy relies on theinherent randomness in the success or failure of assassination attempts.
7
might recover quickly from capital destruction and the decrease in tourist
arrivals, but the increased uncertainty and changes in economic attitudes
could impact employment with a lag.
Note that it is possible that the economies of control counties—those
with a failed terror attack in our sample period—may be affected by failed
terror attacks. A failed terror attack may increase uncertainty, for exam-
ple, but it is likely that failed terror attacks have a smaller impact than
successful attacks. Arguably, if the hijackers did not assume control of the
planes on Sept. 11, 2001, and did not crash into the World Trade Center,
there would have been less uncertainty in the following years.
3 Data Sources
3.1 Global Terrorism Database
This study relies on successful and failed terror attacks in the U.S. over
the past decades. To establish an exhaustive list of terror attacks, I use
the Global Terrorism Database (GTD (2014)), which is an open-source
database including information on terror attacks around the world from
1970 through 2013. The GTD is maintained by a research center at the
University of Maryland, College Park, the National Consortium for the
Study of Terrorism and Responses to Terrorism (START). START is a
Department of Homeland Security Center of Excellence which supports
research on terrorism. Its main mission is to advance science-based knowl-
edge about the human causes and consequences of terrorism. Note that
the data was originally collected by the Pinkerton Global Intelligence Ser-
vices (PGIS) for clients interested in knowing the terrorism risk in different
countries. The database is the product of important data collection efforts
relying on publicly available source materials such as media articles, elec-
tronic news archives and existing data sets. Unfortunately, all the records
of terror attacks during 1993 were lost — the box of data fell off a truck
while in transit (Enders et al. (2011)). As a consequence, the year 1993 is
excluded from the analysis.
The GTD (2014) defines a terrorist attack as “the threatened or actual
use of illegal force and violence by a non-state actor to attain a political,
economic, religious, or social goal through fear, coercion, or intimidation.”
In practice, an incident is considered a terror attack if (1) it is intentional,
(2) it entails some level of violence or threat of violence, and (3) the per-
petrators of the incidents are sub-national actors. In addition, two of the
8
three criteria must be fulfilled: (1) the act must be aimed at attaining
an economic, political, religious or social goal, (2) there must be evidence
of an intention to coerce, intimidate, or convey some other message to a
larger audience than the immediate victims, and (3) the action must be
outside the context of legitimate warfare activities. In this analysis, I rely
solely on terror attacks for which the three criteria above are met. A very
similar definition is used in many recent articles analyzing the economic
causes and consequences of terrorism. The US Department of State (2003)
defines terrorism as “premeditated, politically motivated violence against
non-combatant targets by subnational groups or clandestine agents, usually
intended to influence an audience.”
The database includes information on the date, location and a descrip-
tion of each terror attack, which allows me to match every incident with
other data sets. Using the variables collected in the GTD, I construct a
variable “Success” that is equal to one if one of the terror attacks is success-
ful and zero if the attack(s) failed. Note that I pool all the terror attacks
into each county-year cell. If one of the terror attack is successful in a given
county-year cell, then the variable “Success” is equal to one. Terror attacks
fail for a number of reasons. Letters containing poison are often intercepted
and targets frequently survive assassination attempts. Most of the failed
terror attacks involve explosive devices which do not detonate or are found
and safely defused.
Success of terrorist attack is defined according to the actual impacts
rather than the larger goals of the terrorists. The definition of a success-
ful/failed attack depends on the type of attack. For instance, an assassi-
nation is considered successful if the target is killed while an explosion is
considered successful if the explosive device detonates. On the other hand,
a hijacking or a kidnapping is successful if the hijackers/kidnappers assume
control of the vehicle/individual at any point.5
Figures 1 and 2 illustrate the number of observations per year for
Success = 0 and Success = 1 and the number of county-year observa-
tions with at least one lethal terror attack (i.e. causing at least one death).
The number of attempted terror attacks is very high in 1970-1971 and
sharply goes down in 1972. Overall, there is a downward trend in terror
activity over time. The number of failed terror attacks ranges from zero
to 14 over this time period. The high number of failed attacks in 1999 (14
5An armed assault is coded as successful if the assault takes place and the person orproperty is hit. An infrastructure attack is successful if the facility is damaged. Last,an unarmed assault is considered successful if a victim is injured.
9
observations) and 2002 (12 observations) is due to several related incidents.
In May 2002, a college student put eighteen pipe bombs in rural mailboxes,
of which more than half did not detonate. In 1999, many researchers in
different universities conducting research on non-human primates received
booby-trapped letters. The two deadliest terror attacks over this time pe-
riod are Sept. 11, 2001, and the Oklahoma City bombing.
The database includes information on tactics/attack types used, the
weapons used and the targets. In the database, there are nine different
categories for attack types, 22 categories of targets including businesses
and government buildings, and 13 categories of weapons ranging from bi-
ological to incendiary and bombs. The GTD also includes information on
the number of deaths, injured and property damages.
3.2 Description of the Employment Data and the Life
Style Survey
To measure employment and earnings at the county-level for the years 1970-
2013, I draw on the regional economic accounts of the Bureau of Economic
Analysis (BEA).6 The guide “Local Area Personal Income Methodology”
(BEA (2014)) presents the conceptual framework and data sources to esti-
mate employment and personal income. The BEA’s employment estimates
measure the number of jobs in a county, instead of the number of work-
ers who perform the jobs. This means that all jobs held by a worker are
counted. The BEA provides total full-time and part-time jobs by industry
and compensation of employees. Employment estimates are based primar-
ily on administrative records data. Some surveys and census data are also
used to complement these records.
The number of jobs in a county is on a place of work basis instead of
place of residence.7 This suggests that the estimates are more representa-
tive of a county’s industrial base than of the activities of the residents of
the county (BEA (2014)). The employment estimates are annual averages
of twelve monthly observations for the year. A job which lasts only part of
the year has a lesser weight.
The same weight is given to full-time and part-time jobs. Therefore, I
6Another data set that could have been used here is the Current Population Survey(CPS), but this was excluded since the sample size does not allow reliable estimates tobe obtained at the county-level. Not all counties are included in the CPS and the dataare not available for most counties due to confidentiality reasons.
7Proprietors’ employment is usually by place of residence since the estimates reflectthe addresses given in the tax returns, which are usually the proprietors’ residences.
10

cannot separate part-time jobs from full-time jobs. The BEA counts both
proprietors jobs and wage and salary jobs, but unpaid family workers and
volunteers are not counted. I calculate jobs-to-population ratios by county
and year. In some analysis, I also present results for different industries
such as manufacture and service.
Wages and salaries are mainly derived from the data that are reported
by place of work. In other words, these data are reported by industry in
the county in which the employing establishment is located. Note that
wages and salaries are broadly defined to include commissions, tips, and
bonuses. The wage and salary estimates also include voluntary employee
contributions, gains from exercising stock options and receipts-in-kind that
represent income (BEA (2014)).
I use the DDB Needham Life Style Survey (LSS) to identify the con-
sequences of terrorism on economic attitudes. The LSS is nationally rep-
resentative in the United States. It is a proprietary data archive that
is freely available for the period 1975-1998 on Robert Putnam’s Bowling
Alone website. The Life Style Survey started when the advertising agency
DDB Needham commissioned the polling firm Market Facts to conduct an
annual survey on Americans’ behaviors. The LSS has a sample of around
3,500 Americans per year. This data set is repeated cross sections and
includes different questions about demographics (sex, age, education, etc.),
self-reported economic characteristics, the county of residence of respon-
dents and answers to questions about attitudes and preferences. I restrict
the sample to the working age population (respondents aged 18-65 years
old).
Numerous questions about political preferences, religion, women and
workplace are asked repeatedly. The variables may be grouped into five
categories: attitudes toward (1) political philosophy, (2) government, (3)
religion, (4) marriage, and (5) a woman’s place in the society. I chose to look
at marriage and a woman’s place in the society because of their link with
female labor supply decision. (See Engels (1925) for one of the first major
work on family economics.) For instance, one of the variable analyzed
here is whether a woman’s place is in the home. Attitudes toward the
government and political philosophy used in this research include whether
the respondent is in favor of having a gun in every home. I also test
attitudes toward important political issues such as abortion and voting
behavior in U.S. Gobernatorial Elections from 1970-2013.8 Last, I looked
8The main sources of election data are USA Counties (Censtats database) and theAtlas Election Data (Leip (2008)). I rely on the percentage of vote cast for each candidate
11
at the number of times the respondent attended church or another place
of worship because of the link with labor supply and investment. (See,
for instance, the seminal work of Weber (1905) on the role of religion and
the advent of modern capitalism.) Appendix Table A2 reports summary
statistics for the economic attitude variables used in the regression analysis.
3.3 Descriptive statistics
Table 1 reports summary statistics for terror attacks.9 I restrict the sam-
ple to county-years observations with at least one attempted terror attack.
The main variable of interest refers to the percentage of observations in
which there was a successful terror attack(s). I classify county-year obser-
vations in two categories: (1) county-year observations in which the terror
attack(s) failed and (2) county-year observations in which there was at least
one successful terror attack. Approximately 86 percent of the observations
are classified in the second category. Note that there is more than one
attempted terror attack in about 30 percent of observations. The aver-
age number of deaths and injured for county-year observations classified as
successful is respectively 3.8 and 3.1. The mean for property damages (in
constant 2005 U.S. dollar) is approximately $750,000. Note that the value
of property damage is unknown for almost two thirds of terror attacks. For-
tunately, another variable in the database provides categorical information
for about a quarter of terror attacks for which the exact extent of damages
is unknown. The three categories are “Catastrophic (likely greater than $1
billion)”, “Major (likely greater than $1 million but smaller than $1 billion)”
and “Minor (likely smaller than $1 million).” Slightly over 40 attacks are
classified in the category major.
Up to three attack types and target information can be recorded by in-
cident. This explains why the sum of percentages in Table 1 is often greater
than 100. In the vast majority of terror attacks in the U.S., attacks are car-
ried out through the use of explosive and bombs (i.e. bombing) or arson and
various forms of sabotage (i.e. infrastructure). The rate of success is very
high for attacks in the categories infrastructure and armed assault. On the
other hand, attacks considered as unarmed assaults and assassinations are
less likely to succeed. Hijackings produce the greatest number of deaths,
injuries and damages on average. (Hijackings are included in the category
“Other and Unknown”.) Infrastructure attacks cause over $850,000 in dam-
in the U.S. Gubernatorial Elections from 1970-2013.9Appendix Figures A1, A2 and A3 illustrate the evolution in tactics, weapons used
and targets over the period 1970-2013.
12
ages on average, but do not lead to many deaths and injuries. About 27
percent of the attacks target businesses. Other common targets include
government buildings, abortion clinics and private properties. The rate of
success is over 80 percent for all the listed targets. Attacks targeting air-
ports lead, on average, to the greatest number of deaths with 74 against
three for government buildings and 11 for businesses. Terror attacks target-
ing businesses and other private properties cause over $1 million worth of
damage on average against less than half a million for the following targets:
abortion related, airports and religious figures/institutions.
Table 1 shows that the vast majority of weapons are explosives or in-
cendiary. The attack is designed melee when the terrorist(s) targets people
rather than property. The number of deaths is around 95 when the weapon
category is melee and the estimated damages are below the average. The
rate of success is very low for biological weapons, with success in less than
half the observations. (Biological weapons are included in the category
“Other and Unknown”.) These weapons also have a very large number of
deaths and injuries. Only 10 percent of the attacks target non-Americans.
Approximately 6.5 percent of the attacks are categorized as logistically in-
ternational meaning that the nationality of the perpetrator group is not
American. Attacks targeting non-Americans and/or in which the national-
ity of the terrorist group differs from the location of the attacks are defined
as transnational terror attacks. The rate of success of transnational attacks
is slightly higher than for domestic attacks. Transnational terror attacks
lead to less deaths and damages in comparison to domestic attacks.10
The descriptive statistics presented in this section suggest that the type
of terror attack and weapon used are statistically related to rate of success,
i.e. whether the terror attack succeeded or failed. The number of attempted
attacks in a given county-year is also a good predictor of success. The
findings reported in Table 1 also suggest that some type of terror attacks
cause more damages while others lead to more deaths on average.
4 Identification Strategy
In this section, I first provide evidence that the sample of successful and
failed terror attacks is balanced across a wide range of covariates. I then
describe the main specification and the controls.
10The differences in deaths and damages documented between attacks targeting non-Americans and Americans are related to the year of the attacks and the locations tar-geted rather than by the types of weapons and target information.
13
4.1 Identification Assumption
The key identification assumption is that the success of a terror attack is
exogenous conditional on observables. This explains my decision to control
in the empirical model for the type of weapon and the type of attack be-
cause they predict success. I investigate in Table 2 whether other variables
at the county-level predict whether a terror attack was successful. The
first two columns of Table 2 restrict the sample respectively to county-year
observations with at least one successful terror attacks and county-year ob-
servations with at least one failed terror attacks and no successful terror
attack. The first two columns present the mean values of the following
variables: natural log of population, natural log per-capita deaths, births,
social security recipients, people in poverty, public school enrollment, vio-
lent crimes, robberies, property crimes, motor vehicle thefts, and dummies
for state capitals, coastal counties11, for counties with an airport that has
been designated large hubs and medium hubs12, and for the four Census de-
mographic regions. Column 3 presents t-test for the equality of the means.
While a significant share of terror attacks happened in the Northeast
and West regions and in state capitals and coastal counties (Appendix
Table A1), the results suggest that the rate of success is not related to
geography. The differences for the natural log of the number of people in
poverty and social security recipients per capita are also non-significant.
The only results where the difference between columns 1 and 2 is statisti-
cally significant are births per capita and property crimes per capita. Note
that the difference observed might be related to the type of weapon used or
the attack type. Moreover, it is natural that few variables are statistically
significant given that 18 variables were tested.
Table 3 shows the results from probit regressions that consider some of
these variables simultaneously. The equation is:
P(SUCCESSFULa) = Φ(γ1 + γ2Xa), (1)
where a is a terror attack, whether successful or failed, and X is a set of
variables among the variables considered above. Unfortunately, some of
11I follow the definition of the National Oceanic and Atmospheric Administration andcode counties as coastal if they meet one of the following criteria: (1) at least 15 percentof a county’s total land area is located within the Nation’s coastal watershed or (2) aportion of or an entire county accounts for at least 15 percent of a coastal catalogingunit.
12Primary airports are classified by the Federal Aviation Administration as large hubsif they account for at least 1 percent of total U.S. passenger enplanements. Medium hubsaccount for between 0.25 and 1 percent of total U.S. passenger enplanements.
14
the variables are available annually solely over the period 1991-2007. I also
include in all the columns region fixed effects, attack type fixed effects,
target fixed effects, weapon fixed effects, a dummy that is equal to one if
the target is non-American and a variable that is equal to the number of
terror attacks.
In columns 1-4, I include all the socioeconomic characteristics variables
in the model and gradually add the crime variables. I find that none of
the crime and socioeconomic variables are significantly related to the rate
of success. Solely the dummy for state capital is significant at the 10%
level (columns 2 and 4). In column 5, when all the variables are included
simultaneously in the model, none of the socioeconomic characteristics vari-
ables are statistically significant at the 10% level and only one of the crime
variable, the natural log of property crimes, is statistically significant at
the 10%. When considering all these variables and the regions dummies
jointly, the joint p-values is 0.59. These results suggest that the sample
of successful and failed terror attacks is balanced across a wide range of
covariates and that the identification assumption is credible.
Unsurprisingly, the variable that is equal to the number of terror at-
tacks is statistically significant. I control for the number of attacks in the
empirical analysis which follows since the chance of seeing at least one suc-
cessful terror attacks will increase with the number of terror attempts. In
my sample, there is one attempted terror attack for 69% of county-year
cells and less than three attempted terror attacks for 83% of county-year
cells.
The rate of success may also be related to counterterrorism expenses.
The rate of success, measured by the variable “Success”, decreased by ap-
proximately 8 percent since Sept. 11, 2001, suggesting that the increase
in counterterrorism budget might have worked. On the other hand, the
rate of success is similar across Census regions suggesting that countert-
errorism efforts are not related to geography. In the empirical analysis, I
include region-year fixed effects to check whether the findings are related
to regional crime prevention efforts.
4.2 Model Specification
The objective is to investigate the impact of successful terror attacks. To
identify this effect, I restrict the sample to county-year observations with
at least one successful terror attacks or at least one failed terror attacks. I
thus directly compare county-year observations with at least one successful
15
terror attacks to county-year observations with a failed terror attack. In
other words, I look at economic outcomes in two sets of counties that
were targeted by terrorists in a given year. The only difference is that the
terrorists succeeded in the first set of counties (e.g. the bomb did detonate)
and failed in the second set of counties (e.g. the bomb did not detonate).
In my main specification, I estimate:
Yct = α + βs + δt + γSUCCESSFULct +X ′ctλ+ εct, (2)
where y is an economic outcome in county c and year t, SUCCESSFUL
is a dummy that is equal to one if the terror attack was successful in
that county and year and zero if the terror attack failed. If there are
many terror attacks, SUCCESSFUL is equal to one if at least one of the
attacks succeeded. I include state and year fixed effects to control flexibly
for common shocks at the national level and to control for common state
shocks.
Xct is a vector of other regressors. I include attack type fixed effects
(dummies for assassination, armed assault, bombing, infrastructure/facility
and other attack type) and weapon fixed effects (dummies for firearm, ex-
plosive, incendiary and other weapon type) since the definition of a suc-
cessful attack depends on the attack type. I follow the recommendations
of Bertrand et al. (2004) and compute standard errors clustered at the
county-level. I also include a dummy that is equal to one if the target is
non-American, a dummy that is equal to one is the attack is logistically
international and a variable that is equal to the number of terror attacks.13
I enrich the basic model in two ways. First, to allow for common re-
gional shocks to a given economic outcome, I estimate specifications that
include interactions between calendar-year dummies and indicator variables
denoting the four Census regions or the nine Census divisions. Second, I
include target fixed effects (dummies for abortion related incident, build-
ings, businesses, educational institution, government, private property and
other target) in addition to attack type and weapon fixed effects.
Estimates of equation (2) identify the difference between successful and
failed terror attacks. For example, the estimates identify the impact of
an infrastructure attack in which the facility is damaged versus an attack
in which the facility is not damaged. (See Section 3 for a definition of a
success attack for each type of attack.) In the next section, I present the
13I check the robustness of including the number of terror attacks in different ways.For instance, I check that adding the squared of the number of terror attacks does notaffect the size and significance of the main estimates (not shown for space consideration).
16
impact of successful terror attacks on employment and earnings.
5 Results
5.1 Impacts on Employment and Earnings
Panel A of Table 4 present estimates of equation (2) for jobs. The de-
pendent variable is 100 times the log of the county-year ratio of jobs-to-
population. What emerges clearly is that successful terror attacks are as-
sociated with a meaningful reduction in jobs in the year the attacks take
place. In column 1, I compare successful and failed terror attacks and find
that successful attacks reduce the overall jobs-to-population ratio by 4.3%
in the year the attacks take place. The estimate is statistically significant
at the 5% level. I also add target fixed effects and time-invariant con-
trols14 to check the robustness of the results. Furthermore, I include dum-
mies to absorb region-by-year employment shocks (column 3) and Census
division-by-year employment shocks (columns 4-5). Adding both dummies
to absorb Census division-by-year employment shocks and time-invariant
controls (column 6) slightly increases the absolute magnitude of the point
estimate to 5.6%.
Panel B repeat these estimates for earnings. The dependent variable
is 100 times the log of real average wage per job. These estimates yield
weak evidence that successful terror attacks affect earnings in the year the
attacks take place. The point estimates are smaller than for jobs (from -
2.1% to -4.2%) and statistically insignificant in the first two columns. When
the full set of controls is included in addition to interactions between year
dummies and region dummies, the estimate is statistically significant at the
10% level.
Given the large variation in damages and fatalities in our sample, one
potential reason why the estimates are insignificant for earnings is that
only terror attacks causing many casualties or building destruction have
meaningful impacts on wages. To examine this possibility, I estimate in
panel A of Table 5 a set of models that compares successful terror attacks
which led to at least one fatality or injury to failed attacks. In panel B, I
also present estimates that compare successful terror attacks which led to
a minimum of $100,000 (constant 2005 U.S.$) to failed attacks. The cost
of this approach is that it reduces the number of county-year observations
14Time-invariant controls include dummies for coastal counties and being a state cap-ital and a dummy for whether the county has an airport.
17
used in the analysis. As with the previous models, I control for target fixed
effects and include dummies to absorb region-by-year employment shocks
(columns 2 and 5) and division-by-year employment shocks (columns 3 and
6). I omit weapon and attack type fixed effects in this set of models because
of the high correlation between these variables and damages/fatalities.
Panels A and B confirm that, on average, successful terror attacks lead
to a reduction in jobs in comparison to failed attacks. The results in panel A
suggest that successful lethal attacks reduce the overall jobs-to-population
ratio from 5% to 12% the year the attack takes place. Of note, though, the
standard errors are quite large and the estimates are significant at the 10%
level solely in column 2.
The estimates for damages presented in panel B are larger than in Table
4 suggesting that the size of the economic effect is related to building dam-
ages. The point estimates are significant for both employment and earnings
and suggest that successful attacks which led to a minimum of $100,000
reduce the overall jobs-to-population ratio from 6% to 11% in the year the
attack takes place.
In panel C, I use the county adjacency file from the U.S. Census to com-
pute which county or counties are neighboring treated and control counties.
I estimate the impact of a successful terror attack versus a failed terror
attack on neighboring counties instead of targeted counties. This method-
ology allows me to check whether terror attacks cause economic spillovers
to neighboring counties. The point estimates for employment are negative
but not statistically significant at conventional levels, suggesting that only
targeted counties suffer from terror attacks. The estimates are also very
small for earning in neighboring counties and insignificant in two columns
out of three.
I next estimate the impact of terror attacks on employment levels in
the years following the attack. Table 6 shows estimates for the year of the
attack, the year after the attack, five years after the attack and five years
before the attack. Each entry is from a separate OLS regression and the
dependent variable is the log of the county-year ratio of jobs-to-population.
In panel A, I first check whether terror attacks have an economic impact
five years before the attack. This robustness check is useful because it allows
to check that counties targeted by a successful terror attack and a failed
attack had similar jobs-to-population ratio five years before the attack.
Unsurprisingly, the estimates are small and statistically insignificant.
Panel B reports the contemporaneous impacts. The estimates are the
same as in Table 4, panel A. The next three panels report the estimates
18
for the years after the terror attacks. The estimates for the year after the
attack are strikingly similar to the contemporaneous impacts reported in
panel B. The estimates in panels D and E provide evidence that the impact
of successful terror attacks is temporary and fades away after two years, or
that these effects are too small to detect. None of the estimates in panel
D and E is statistically significant at the 10% level and the size of the
estimates is very small.
These short-term effects are consistent with the idea that local economies
recover quickly after a terror attack (Becker and Murphy (2001)). The
large estimates for “major” terror attacks also suggest that the destruction
of capital stock of a county may play an important role in explaining the
short-term reduction in jobs.
5.2 Robustness Checks: Estimates by Industry
Table 7 tests whether successful terror attacks affect negatively specific
industries. For instance, it is well-known that terrorism is related to the
tourism and hotel industries. I rely on the Standard Industrial Classifica-
tion (SIC) and present estimates of equation (2) for jobs in the following
industries: (1) manufacturing, (2) construction, transportation, communi-
cations and utilities, (3) wholesale trade, (4) retail trade, (5) services, and
(6) finance, insurance, and real estate. The time period is 1970-2000 and
target fixed effects and region times year dummies are included in even-
numbered columns. The estimates are negative for all the industries which
reinforces the earlier conclusions. But the size of the estimates varies across
industries. The impacts of successful terror attacks in comparison to failed
attacks are especially large for wholesale trade and finance and real estate.
The estimates range from -9% for the latter industry to -13% for the former
industry. On the other hand, the estimates are smaller for retail trade and
manufacturing.
I test the hypothesis that terror attacks reduce more jobs of local
economies with a large tourism industry than other counties in Table 8.
The table focuses on the sample of counties with an airport that has been
designated either a large hub or a medium hub and presents estimates of
equation (2) for jobs. Since terror attacks may have psychological effects on
potential tourists, contemporaneous estimates and estimates for the years
after the attack are presented. The size of the estimates for the year of the
attack and the year after the attack are large for counties with an airport
and range from -7.47% to -9.12% for the year of the attack and the year
19
after the attack. The reduction in jobs fades away in the following years
and is not statistically significant five years after the terror attack.
Last, I check whether successful terror attacks lead to movements out of
the county. The results are presented in Appendix Table A4. The structure
of the table is the same as panel A of Table 4, but the dependent variable
is the log of population. The estimates are all statistically insignificant
suggesting that successful terror attacks have no impact on the number of
inhabitants in the year of the attack.
The evidence supports the hypothesis that successful terror attacks have
a greater impact on jobs for counties with specific industries such as the
tourism industry. Furthermore, the results indicate that business disruption
caused by a successful attack is particularly harmful for business sales and
inventories in comparison to business firms engaged in offering goods and
services directly to consumers. This might be related to the increased
uncertainty of investing. I now turn my attention to economic attitudes
and voting behavior.
6 Channels: Economic Attitudes
In this section, I present the results on the impact of terrorism on economic
attitudes. I rely on the Life Style Survey and data on voting behavior. I
first study the impact of terrorism on gubernatorial elections over the period
1970-2013 and then check if terror attacks affect economic attitudes.
Many studies find that terrorism is related to voting behavior (for ex-
ample Gould and Klor (2010)) and that political allegiance is statistically
related the local labor market (see Besley and Case (1995) and Beland
(2015)). I thus test whether successful terror attacks affect voting behavior
in gubernatorial elections.
In Table 9, I rely on gubernatorial elections data and estimate the im-
pact of successful terror attacks versus failed terror attacks (equation (2)).
In columns 1 to 3, the dependent variable is the percentage of vote for the
Democrat candidate (scale from 0 to 100). In columns 4 to 6, the dependent
variable is sum of the percentage of vote for the independent candidates.
Note that I exclude in columns 4 to 6 the elections in which there were no
independent candidates. I also exclude elections won by an independent
candidate. The analysis is at the county-year level and I compute standard
errors clustered at the county-level. I include in the model the basic set
of controls, state and year fixed effects and target fixed effects. I do not
include region-year fixed effects in the analysis since the sample size is quite
20
small (n=244).
The estimates suggest that a successful terror attack versus a failed
terror attack decreases significantly the percentage of vote for Democratic
candidates (coeff. -5.11, std. error 2.85). The estimate is also significant
for the Independent candidates in the year of the attack. In columns 2
and 5, I add a dummy variable that is equal to one if the governor at the
time of the election is a Democrat candidate. This variable is positive and
significant at the 1% level when the dependent variable is the percentage
of vote for the Democrat. The estimate is very large (coeff. 10.3) and the
R-squared increases from 0.585 to 0.638.
In Appendix Table A5 I check whether successful terror attacks have
long-term impacts on voting behavior. The estimates for the years following
the terror attacks are not statistically significant at the 10% level suggesting
that the impact on voting behavior does not last more than one year.
The results suggest that terror attacks have a short-term impact on
voting behavior: Republican candidates obtain more votes in the year of a
successful terror attack. The findings are surprising since I do not find that
terror has long-term impacts on local economies. One possibility is that
voting behavior of the targeted county is affected but that it does not affect
the outcome of Gubernatorial elections (state-level). I thus check whether
there are spillovers on neighboring counties (not shown for space consider-
ation). The methodology is similar to Table 4. The estimate is negative for
the year of the terror attack for neighboring counties but the estimate is
not statistically significant at the 10% level (coeff. -3.37, std. error. 2.44).
Another possibility is that terror affects the outcome of few gubernatorial
elections which would make the employment estimates imprecise for the
years after the terror attacks (Table 6).
In a very different political environment, Gould and Klor (2010) find
that terrorism induces Israelis to vote more for right-wing parties and
brought a leftward shift of the political map in Israel. I thus check in
Table 10 whether economic attitudes change following a successful terror
attack and whether the political landscape change in response to terror.
I also look at economic attitudes since previous studies have shown that
they are related to economic behavior. The dependent variables from the
Life Style Survey may be grouped into four categories: attitudes toward
the (1) government, (2) religion, (3) marriage, and (4) women’s place in
the society. Appendix Table 2 reports summary statistics for the variables
used in the analysis. I rely on variables that cover the period 1977-1998.
The first group contains measures of people’s attitude toward two im-
21
portant political issues. The questions are “There should be a gun in every
home?” and “I am in favor of legalized abortions.” I code the variables as
dummies. They are equal to one if respondents report that they moderately
agree, generally agree or definitely agree and are equal to zero if respon-
dents report that they moderately disagree, generally disagree or definitely
disagree. The second group contains only one variable: “Attended church
or other place of worship (frequency last 12 months).” I code the variable as
a dummy since the answers proposed are in categories that are non-linear.
The dummy is equal to one if the respondent reports that he/she went to
church or another place of worship nine times or more during the past 12
months. The third and fourth groups consist of two variables each. The
questions are “In today’s society there are many different life styles, and
some are acceptable today that weren’t in the past. Regardless of what
you may have done, or plan to do with your life, and thinking just of what
would give you personally the most satisfying and interesting life, which
one of these different ways of life do you think would be the best as a way
of life?”, “Couples should live together before getting married?”, “Men are
naturally better leaders than women?” and “A Woman’s place is in the
home?” For the last three variables, I compute dummies which are equal
to one if respondents report that they moderately agree, generally agree or
definitely agree and are equal to zero if the respondents report that they
moderately disagree, generally disagree or definitely disagree. For the ques-
tion on life style, I code the variable as a dummy which is equal to one if
respondents answer “traditional marriage (husband providing and wife at
home with kids)” and zero if they answer “marriage where husband and
wife share work, housework, and kids” or “other (e.g, staying single, living
with group, etc.).”
The model is similar to equation (2) with the exception that the unit
of observation is now the individual. I also control for the individual’s
demographic characteristics. Specifically, I estimate:
Yict = α + βc + δt + γSUCCESSFULct + λXct + θZict + εict, (3)
where y is an economic attitude for individual i in county c and year t and
Z is a vector of individual characteristics. These characteristics include
the individual’s gender, age, age squared, six education dummies and five
marital status dummies.
Before I comment on the results on the impact of terrorism, it is useful
to discuss the control variables. First, gender plays an important role in
22

most attitudes. Males tend to be more in favor of having a gun in every
home, to believe that couples should live together before getting married,
to think that men are naturally better leaders and that a woman’s place
is in the home. Males are also less likely to go to church or another place
of worship. Educated respondents tend to disagree that men are naturally
better leaders and that a woman’s place is in the home. They are more in
favor of legalizing abortion and they are less in favor of having a gun in
every home. Last, respondents who report being married are more likely to
think that a woman’s place is at home and that men are naturally better
leaders, they tend to go more often to a place of worship and they are less
likely to support the legalization of abortion.
Table 10 shows the results from probit regressions. I first present es-
timates for the whole sample of respondents (panel A) and then restrict
the sample to females (panel B), males (panel C), individuals between 40-
65 years old (panel D) and individuals younger than 40 years old (panel
E). For the whole sample of respondents, the estimate for whether there
should be a gun in every home is negative and statistically significant at
the 5% level for the year of the attack. The estimate is larger for males
and younger respondents and suggest that terror leads young male adults
to be less in favor of having a gun in every home. Note that the effects fade
away after one year (Appendix Table A5). There is some evidence that
terrorism affects the likelihood to agree that abortion should be legalized.
The results presented in Appendix Table A5 show that counties targeted
by a successful attack were less in favor of legalizing abortion before the
attack, but that individuals in the two sets of counties are as likely to agree
that abortion should be legalized the year after the attack.
The model finds evidence that respondents are more likely to go to
church or another place of worship the year after a successful terror at-
tack. The effect is not significant in the year of the attack for any of the
demographic group and the impact seems to disappear five years after the
attack.
Columns 4 and 5 repeat the exercise for traditional marriage (husband
providing and wife at home with kids) and living together before getting
married. I find no evidence that terrorism affects attitudes toward mar-
riage. There is no contemporaneous impacts of terror on the two dummies
for any of the demographic groups.
Last, I test attitudes toward a woman’s role and place in the home.
Here, a somewhat strong pattern appear. Successful terror attacks increases
the likelihood to disagree that a woman’s place is in the home for the year of
23
the attack. The estimate is significant at the 1% level for the whole sample
and the effect is particularly strong for males. Females are also more likely
to disagree that men are naturally better leaders than women the year of a
successful attack versus a failed attack (statistically significant at the 10%
level). Of note, the estimates presented in Appendix Table (A5) suggest
that the consequences of terrorism are not permanent.
Overall, I find evidence that successful terror attacks affect temporarily
attitudes toward a woman’s place and whether everybody should have a
gun. Given the lack of persistent changes in economic attitudes, the findings
are in line with the short-term impact on jobs documented in the previous
section.
7 Conclusion
In this paper I identify the impact of terrorism on local economies by ex-
ploiting the inherent randomness in the success or failure of terror attacks.
There are two main empirical results. First, successful terror attacks re-
duce the overall jobs-to-population ratio by approximately 5% in the year
the attack takes place in comparison to failed terror attacks. I find no ev-
idence that successful terror attacks have long-term consequences on local
economies.
Second, I try to explain the presence of a short-term impact and the
absence of long-term economic consequences. I find evidence that counties
victim of terror attacks leading to major damages experience a greater
decrease in jobs. Furthermore, successful terror attacks affect negatively
specific industries such as tourism and wholesale trade. In our analysis of
the effect of terrorism on people’s attitudes toward marriage, a woman’s
place in the society, political philosophy, government, and religion I have
found a number of regularities. For example, I found on average that
successful terror attacks decreases the likelihood of the county population
to vote for the Democrat candidates in the gubernatorial elections and
changes local residents’ attitudes toward woman’s place is in the home.
The effects fades away rapidly which is consistent with the absence of long-
term effect on employment.
The findings seem to confirm that economies adjust rapidly to terror
attacks (Becker and Murphy (2001)). While I document larger effects for
counties with airports and “major” terror attacks, the lack of a persistent
change in economic attitudes and the somewhat small destruction of hu-
man and physical capital might explain the temporary reduction in jobs
24

documented.
I believe further research is needed in at least two dimensions. From my
results, I cannot conclude on whether a region subject to repeated terror
attacks suffer economically. In order to answer this question, other identi-
fication strategies may be better suited (Abadie and Gardeazabal (2003)).
Moreover, more work is needed on the national consequences of terrorism
such as the rise of counterterrorism expenditures and the increased airport
security.
25
References
Abadie, A.: 2006, Poverty, Political Freedom, and the Roots of Terrorism,
American Economic Review 96(2), 50–56.
Abadie, A. and Dermisi, S.: 2008, Is Terrorism Eroding Agglomeration
Economies in Central Business Districts? Lessons From the Office
Real Estate Market in Downtown Chicago, Journal of Urban Economics
64(2), 451–463.
Abadie, A. and Gardeazabal, J.: 2003, The Economic Costs of Con-
flict: A Case Study of the Basque Country, American Economic Review
93(1), 113–132.
Abadie, A. and Gardeazabal, J.: 2008, Terrorism and the World Economy,
European Economic Review 52(1), 1–27.
BEA: 2014, Local Area Personal Income Methodology, Regional Economic
Accounts, November.
Becker, G. and Murphy, K.: 2001, Prosperity Will Rise Out of the Ashes,
Wall Street Journal: October 29, 2001.
Becker, G. S. and Rubinstein, Y.: 2011, Fear and the Response to Terror-
ism: An Economic Analysis, Technical Report dp1079, Centre for Eco-
nomic Performance.
Beland, L.-P.: 2015, Political Parties and Labor Market Outcomes: Evi-
dence from US States, American Economic Journal: Applied Economics
7(4), 198–220.
Berrebi, C. and Klor, E. F.: 2006, On Terrorism and Electoral Outcomes
Theory and Evidence from the Israeli-Palestinian Conflict, Journal of
Conflict Resolution 50(6), 899–925.
Bertrand, M., Duflo, E., Mullainathan, S. et al.: 2004, How Much Should
We Trust Differences-in-Differences Estimates?, Quarterly Journal of
Economics 119(1), 249–275.
Besley, T. and Case, A.: 1995, Does Electoral Accountability Affect Eco-
nomic Policy Choices? Evidence from Gubernatorial Term Limits, Quar-
terly Journal of Economics 110(3), 769–798.
26
Besley, T. and Mueller, H.: 2012, Estimating the Peace Dividend: The
Impact of Violence on House Prices in Northern Ireland, American Eco-
nomic Review 102(2), 810–33.
Blomberg, S. B., Hess, G. D. and Orphanides, A.: 2004, The Macroe-
conomic Consequences of Terrorism, Journal of Monetary Economics
51(5), 1007–1032.
Crain, N. V. and Crain, W. M.: 2006, Terrorized Economies, Public Choice
128(1), 317–349.
Deryugina, T., Kawano, L. and Levitt, S.: 2014, The Economic Impact of
Hurricane Katrina on its Victims: Evidence from Individual Tax Returns,
Technical Report 20713, National Bureau of Economic Research.
Di Tella, R. and Schargrodsky, E.: 2004, Do Police Reduce Crime? Es-
timates Using the Allocation of Police Forces After a Terrorist Attack,
American Economic Review 94(1), 115–133.
Draca, M., Machin, S. and Witt, R.: 2011, Panic on the Streets of London:
Police, Crime, and the July 2005 Terror Attacks, American Economic
Review 101(5), 2157.
Dreher, A., Krieger, T. and Meierrieks, D.: 2011, Hit and (they Will) Run:
The Impact of Terrorism on Migration, Economics Letters 113(1), 42–46.
Enders, W. and Hoover, G. A.: 2012, The Nonlinear Relationship Between
Terrorism and Poverty, American Economic Review, Papers and Pro-
ceedings 102(3), 267–272.
Enders, W., Sandler, T. and Gaibulloev, K.: 2011, Domestic Versus
Transnational Terrorism: Data, Decomposition, and Dynamics, Journal
of Peace Research 48(3), 319–337.
Enders, W., Sandler, T. and Parise, G. F.: 1992, An Econometric Analysis
of the Impact of Terrorism on Tourism, Kyklos 45(4), 531–554.
Engels, F.: 1925, The Origin of the Family, Private Property and the State,
Charles H. Kerr & Company Cooperative, Chicago.
Gaibulloev, K. and Sandler, T.: 2008, Growth Consequences of Terrorism
in Western Europe, Kyklos 61(3), 411–424.
27

Gassebner, M., Jong-A-Pin, R. and Mierau, J. O.: 2008, Terrorism and
Electoral Accountability: One Strike, you’re Out!, Economics Letters
100(1), 126–129.
Glaeser, E. L. and Shapiro, J. M.: 2002, Cities and Warfare: The Impact of
Terrorism on Urban Form, Journal of Urban Economics 51(2), 205–224.
Gould, E. D. and Klor, E. F.: 2010, Does Terrorism Work?, Quarterly
Journal of Economics 125(4), 1459–1510.
Gries, T., Krieger, T. and Meierrieks, D.: 2011, Causal Linkages Be-
tween Domestic Terrorism and Economic Growth, Defence and Peace
Economics 22(5), 493–508.
GTD: 2014, National Consortium for the Study of Terrorism and Re-
sponses to Terrorism (START), Global Terrorism Database: Retrieved
from http://www.start.umd.edu/gtd.
Jones, B. F. and Olken, B. A.: 2009, Hit or Miss? The Effect of Assassi-
nations on Institutions and War, American Economic Journal: Macroe-
conomics 1(2), 55–87.
Karol, D. and Miguel, E.: 2007, The Electoral Cost of War: Iraq Casualties
and the 2004 US Presidential Election, Journal of Politics 69(3), 633–
648.
Kibris, A.: 2011, Funerals and Elections: The Effects of Terrorism on
Voting Behavior in Turkey, Journal of Conflict Resolution 55(2), 220–
247.
Klick, J. and Tabarrok, A.: 2005, Using Terror Alert Levels to Estimate the
Effect of Police on Crime, Journal of Law and Economics 48(1), 267–279.
Krueger, A. B.: 2008, What Makes a Terrorist: Economics and the Roots
of Terrorism, Princeton University Press.
Krueger, A. B. and Maleckova, J.: 2003, Education, Poverty and Terror-
ism: Is There a Causal Connection?, Journal of Economic Perspectives
17(4), 119–144.
Landes, W. M.: 1978, An Economic Study of US Aircraft Hijacking, 1961-
1976, Journal of Law and Economics 21(1), 1–31.
Leip, D.: 2008, Atlas of US Presidential Elections, Online document:
http://www.uselectionatlas.org.
28
Meierrieks, D. and Gries, T.: 2013, Causality Between Terrorism and Eco-
nomic Growth, Journal of Peace Research 50(1), 91–104.
Mill, J. S.: 1848, Principles of Political Economy, JW Parker.
Montalvo, J. G.: 2011, Voting After the Bombings: A Natural Experiment
on the Effect of Terrorist Attacks on Democratic Elections, Review of
Economics and Statistics 93(4), 1146–1154.
Mueller, J. and Stewart, M. G.: 2014, Evaluating Counterterrorism Spend-
ing, Journal of Economic Perspectives 28(3), 237–48.
Pape, R.: 2003, The Strategic Logic of Suicide Terrorism, American Polit-
ical Science Review 97(03), 343–361.
Pape, R.: 2005, Dying to Win: The Strategic Logic of Suicide Terrorism,
Random House.
Sandler, T.: 2014, The Analytical Study of Terrorism: Taking Stock, Jour-
nal of Peace Research 51(2), 257–271.
Sonmez, S. F. and Graefe, A. R.: 1998, Influence of Terrorism Risk on
Foreign Tourism Decisions, Annals of Tourism Research 25(1), 112–144.
Strobl, E.: 2011, The Economic Growth Impact of Hurricanes: Evi-
dence from U.S. Coastal Counties, Review of Economics and Statistics
93(2), 575–589.
US Congress: 2002, The Economic Costs of Terrorism, United States
Congress, Joint Economic Committee.
US Department of State: 2003, Patterns of Global Terrorism: 2002, Wash-
ington, DC: US Department of State.
Weber, M.: 1905, The Protestant Ethic and the Spirit of Capitalism, Unwin,
London.
29
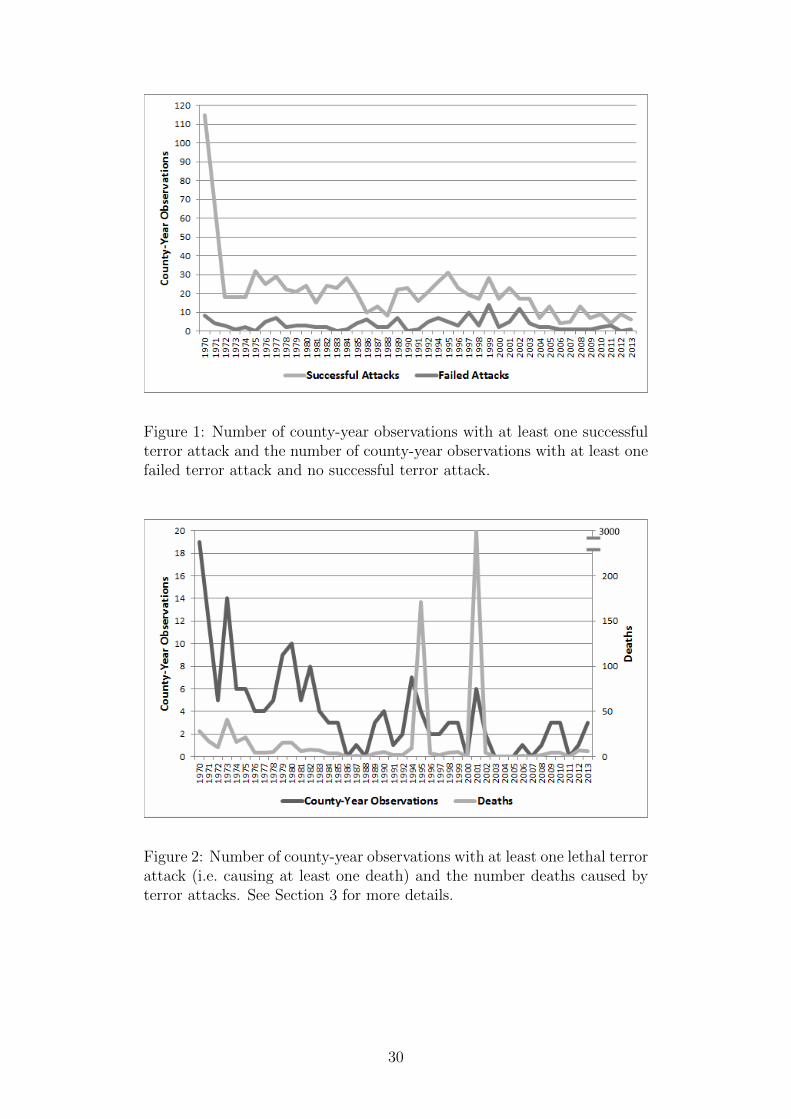
Figure 1: Number of county-year observations with at least one successfulterror attack and the number of county-year observations with at least onefailed terror attack and no successful terror attack.
Figure 2: Number of county-year observations with at least one lethal terrorattack (i.e. causing at least one death) and the number deaths caused byterror attacks. See Section 3 for more details.
30
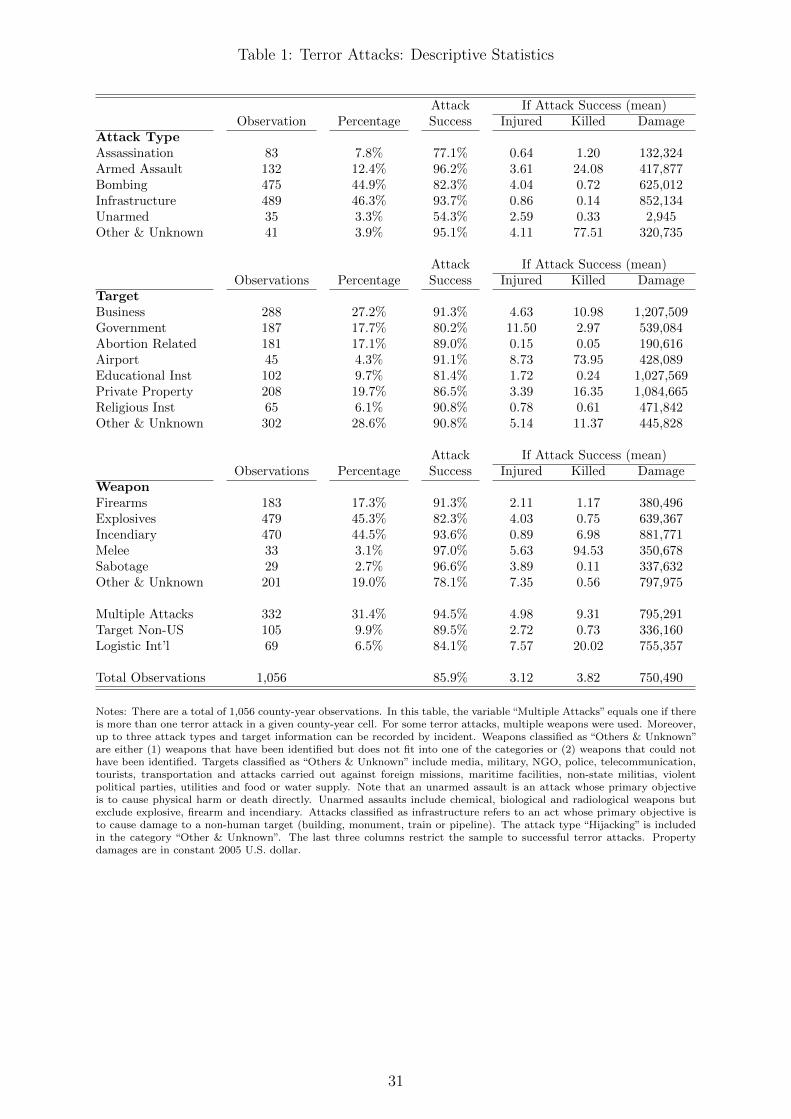
Table 1: Terror Attacks: Descriptive Statistics
Attack If Attack Success (mean)Observation Percentage Success Injured Killed Damage
Attack TypeAssassination 83 7.8% 77.1% 0.64 1.20 132,324Armed Assault 132 12.4% 96.2% 3.61 24.08 417,877Bombing 475 44.9% 82.3% 4.04 0.72 625,012Infrastructure 489 46.3% 93.7% 0.86 0.14 852,134Unarmed 35 3.3% 54.3% 2.59 0.33 2,945Other & Unknown 41 3.9% 95.1% 4.11 77.51 320,735
Attack If Attack Success (mean)Observations Percentage Success Injured Killed Damage
TargetBusiness 288 27.2% 91.3% 4.63 10.98 1,207,509Government 187 17.7% 80.2% 11.50 2.97 539,084Abortion Related 181 17.1% 89.0% 0.15 0.05 190,616Airport 45 4.3% 91.1% 8.73 73.95 428,089Educational Inst 102 9.7% 81.4% 1.72 0.24 1,027,569Private Property 208 19.7% 86.5% 3.39 16.35 1,084,665Religious Inst 65 6.1% 90.8% 0.78 0.61 471,842Other & Unknown 302 28.6% 90.8% 5.14 11.37 445,828
Attack If Attack Success (mean)Observations Percentage Success Injured Killed Damage
WeaponFirearms 183 17.3% 91.3% 2.11 1.17 380,496Explosives 479 45.3% 82.3% 4.03 0.75 639,367Incendiary 470 44.5% 93.6% 0.89 6.98 881,771Melee 33 3.1% 97.0% 5.63 94.53 350,678Sabotage 29 2.7% 96.6% 3.89 0.11 337,632Other & Unknown 201 19.0% 78.1% 7.35 0.56 797,975
Multiple Attacks 332 31.4% 94.5% 4.98 9.31 795,291Target Non-US 105 9.9% 89.5% 2.72 0.73 336,160Logistic Int’l 69 6.5% 84.1% 7.57 20.02 755,357
Total Observations 1,056 85.9% 3.12 3.82 750,490
Notes: There are a total of 1,056 county-year observations. In this table, the variable “Multiple Attacks” equals one if thereis more than one terror attack in a given county-year cell. For some terror attacks, multiple weapons were used. Moreover,up to three attack types and target information can be recorded by incident. Weapons classified as “Others & Unknown”are either (1) weapons that have been identified but does not fit into one of the categories or (2) weapons that could nothave been identified. Targets classified as “Others & Unknown” include media, military, NGO, police, telecommunication,tourists, transportation and attacks carried out against foreign missions, maritime facilities, non-state militias, violentpolitical parties, utilities and food or water supply. Note that an unarmed assault is an attack whose primary objectiveis to cause physical harm or death directly. Unarmed assaults include chemical, biological and radiological weapons butexclude explosive, firearm and incendiary. Attacks classified as infrastructure refers to an act whose primary objective isto cause damage to a non-human target (building, monument, train or pipeline). The attack type “Hijacking” is includedin the category “Other & Unknown”. The last three columns restrict the sample to successful terror attacks. Propertydamages are in constant 2005 U.S. dollar.
31
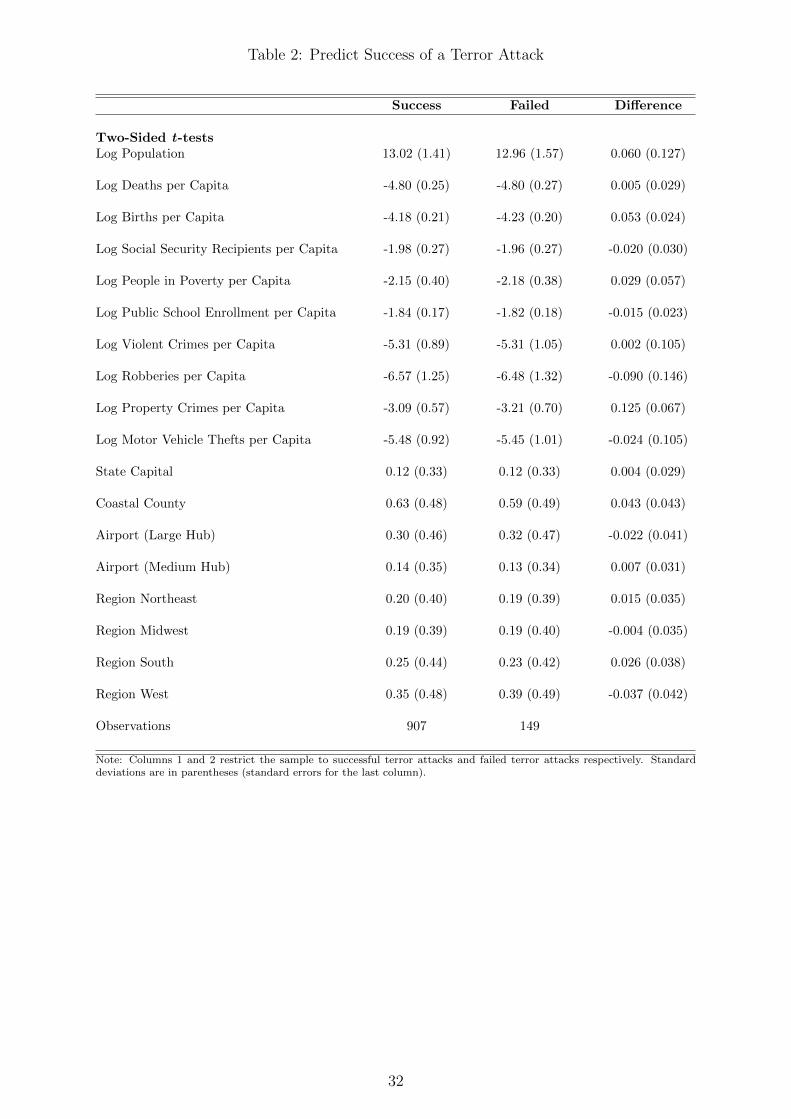
Table 2: Predict Success of a Terror Attack
Success Failed Difference
Two-Sided t-testsLog Population 13.02 (1.41) 12.96 (1.57) 0.060 (0.127)
Log Deaths per Capita -4.80 (0.25) -4.80 (0.27) 0.005 (0.029)
Log Births per Capita -4.18 (0.21) -4.23 (0.20) 0.053 (0.024)
Log Social Security Recipients per Capita -1.98 (0.27) -1.96 (0.27) -0.020 (0.030)
Log People in Poverty per Capita -2.15 (0.40) -2.18 (0.38) 0.029 (0.057)
Log Public School Enrollment per Capita -1.84 (0.17) -1.82 (0.18) -0.015 (0.023)
Log Violent Crimes per Capita -5.31 (0.89) -5.31 (1.05) 0.002 (0.105)
Log Robberies per Capita -6.57 (1.25) -6.48 (1.32) -0.090 (0.146)
Log Property Crimes per Capita -3.09 (0.57) -3.21 (0.70) 0.125 (0.067)
Log Motor Vehicle Thefts per Capita -5.48 (0.92) -5.45 (1.01) -0.024 (0.105)
State Capital 0.12 (0.33) 0.12 (0.33) 0.004 (0.029)
Coastal County 0.63 (0.48) 0.59 (0.49) 0.043 (0.043)
Airport (Large Hub) 0.30 (0.46) 0.32 (0.47) -0.022 (0.041)
Airport (Medium Hub) 0.14 (0.35) 0.13 (0.34) 0.007 (0.031)
Region Northeast 0.20 (0.40) 0.19 (0.39) 0.015 (0.035)
Region Midwest 0.19 (0.39) 0.19 (0.40) -0.004 (0.035)
Region South 0.25 (0.44) 0.23 (0.42) 0.026 (0.038)
Region West 0.35 (0.48) 0.39 (0.49) -0.037 (0.042)
Observations 907 149
Note: Columns 1 and 2 restrict the sample to successful terror attacks and failed terror attacks respectively. Standarddeviations are in parentheses (standard errors for the last column).
32
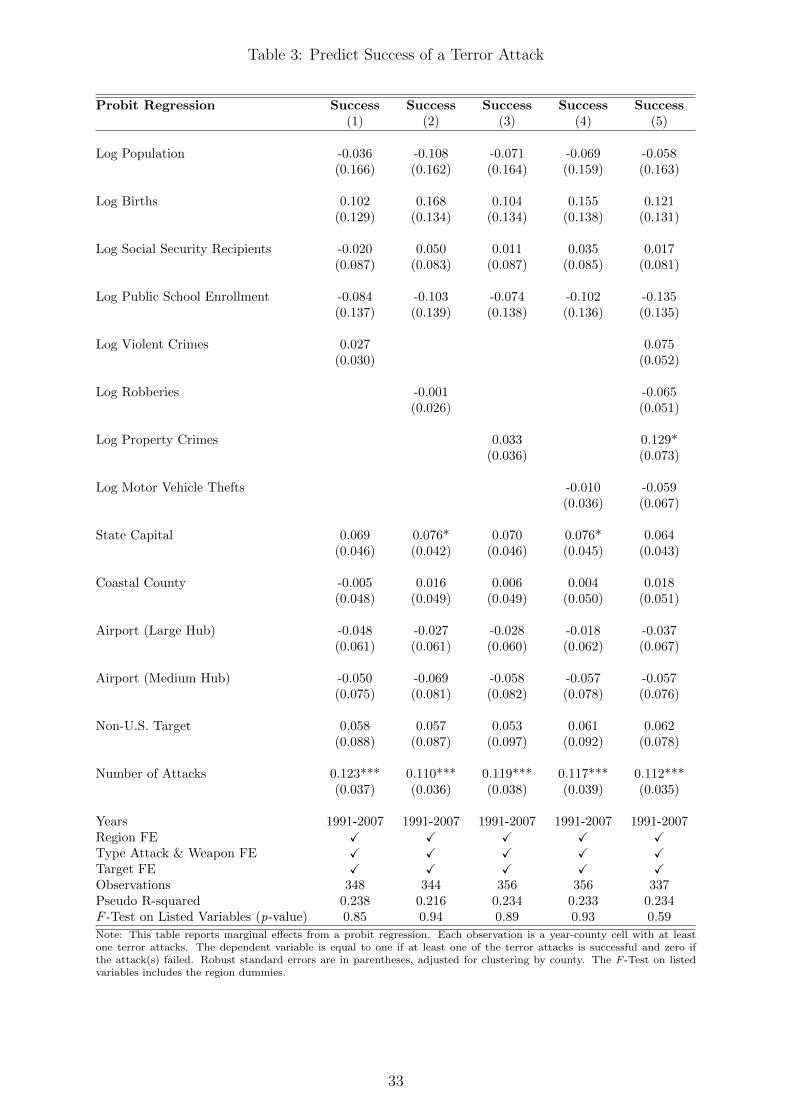
Table 3: Predict Success of a Terror Attack
Probit Regression Success Success Success Success Success(1) (2) (3) (4) (5)
Log Population -0.036 -0.108 -0.071 -0.069 -0.058(0.166) (0.162) (0.164) (0.159) (0.163)
Log Births 0.102 0.168 0.104 0.155 0.121(0.129) (0.134) (0.134) (0.138) (0.131)
Log Social Security Recipients -0.020 0.050 0.011 0.035 0.017(0.087) (0.083) (0.087) (0.085) (0.081)
Log Public School Enrollment -0.084 -0.103 -0.074 -0.102 -0.135(0.137) (0.139) (0.138) (0.136) (0.135)
Log Violent Crimes 0.027 0.075(0.030) (0.052)
Log Robberies -0.001 -0.065(0.026) (0.051)
Log Property Crimes 0.033 0.129*(0.036) (0.073)
Log Motor Vehicle Thefts -0.010 -0.059(0.036) (0.067)
State Capital 0.069 0.076* 0.070 0.076* 0.064(0.046) (0.042) (0.046) (0.045) (0.043)
Coastal County -0.005 0.016 0.006 0.004 0.018(0.048) (0.049) (0.049) (0.050) (0.051)
Airport (Large Hub) -0.048 -0.027 -0.028 -0.018 -0.037(0.061) (0.061) (0.060) (0.062) (0.067)
Airport (Medium Hub) -0.050 -0.069 -0.058 -0.057 -0.057(0.075) (0.081) (0.082) (0.078) (0.076)
Non-U.S. Target 0.058 0.057 0.053 0.061 0.062(0.088) (0.087) (0.097) (0.092) (0.078)
Number of Attacks 0.123*** 0.110*** 0.119*** 0.117*** 0.112***(0.037) (0.036) (0.038) (0.039) (0.035)
Years 1991-2007 1991-2007 1991-2007 1991-2007 1991-2007Region FE X X X X XType Attack & Weapon FE X X X X XTarget FE X X X X XObservations 348 344 356 356 337Pseudo R-squared 0.238 0.216 0.234 0.233 0.234F -Test on Listed Variables (p-value) 0.85 0.94 0.89 0.93 0.59
Note: This table reports marginal effects from a probit regression. Each observation is a year-county cell with at leastone terror attacks. The dependent variable is equal to one if at least one of the terror attacks is successful and zero ifthe attack(s) failed. Robust standard errors are in parentheses, adjusted for clustering by county. The F -Test on listedvariables includes the region dummies.
33
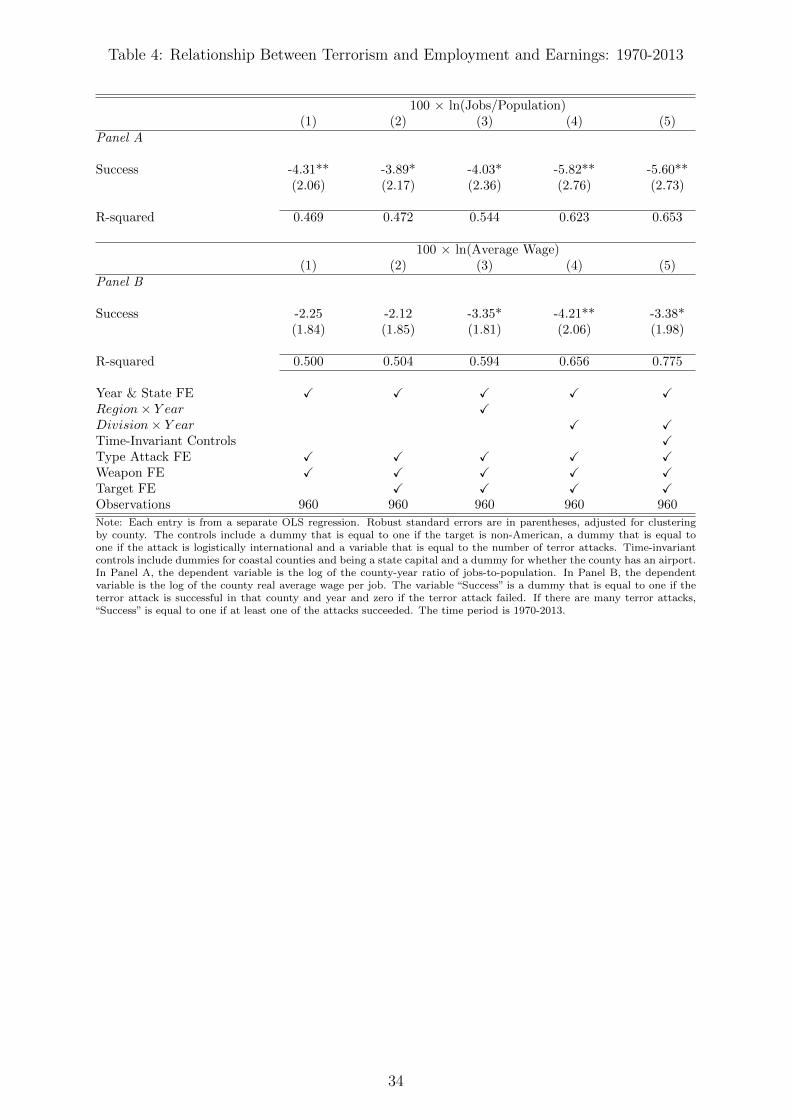
Table 4: Relationship Between Terrorism and Employment and Earnings: 1970-2013
100 × ln(Jobs/Population)(1) (2) (3) (4) (5)
Panel A
Success -4.31** -3.89* -4.03* -5.82** -5.60**(2.06) (2.17) (2.36) (2.76) (2.73)
R-squared 0.469 0.472 0.544 0.623 0.653
100 × ln(Average Wage)(1) (2) (3) (4) (5)
Panel B
Success -2.25 -2.12 -3.35* -4.21** -3.38*(1.84) (1.85) (1.81) (2.06) (1.98)
R-squared 0.500 0.504 0.594 0.656 0.775
Year & State FE X X X X XRegion× Y ear XDivision× Y ear X XTime-Invariant Controls XType Attack FE X X X X XWeapon FE X X X X XTarget FE X X X XObservations 960 960 960 960 960
Note: Each entry is from a separate OLS regression. Robust standard errors are in parentheses, adjusted for clusteringby county. The controls include a dummy that is equal to one if the target is non-American, a dummy that is equal toone if the attack is logistically international and a variable that is equal to the number of terror attacks. Time-invariantcontrols include dummies for coastal counties and being a state capital and a dummy for whether the county has an airport.In Panel A, the dependent variable is the log of the county-year ratio of jobs-to-population. In Panel B, the dependentvariable is the log of the county real average wage per job. The variable “Success” is a dummy that is equal to one if theterror attack is successful in that county and year and zero if the terror attack failed. If there are many terror attacks,“Success” is equal to one if at least one of the attacks succeeded. The time period is 1970-2013.
34
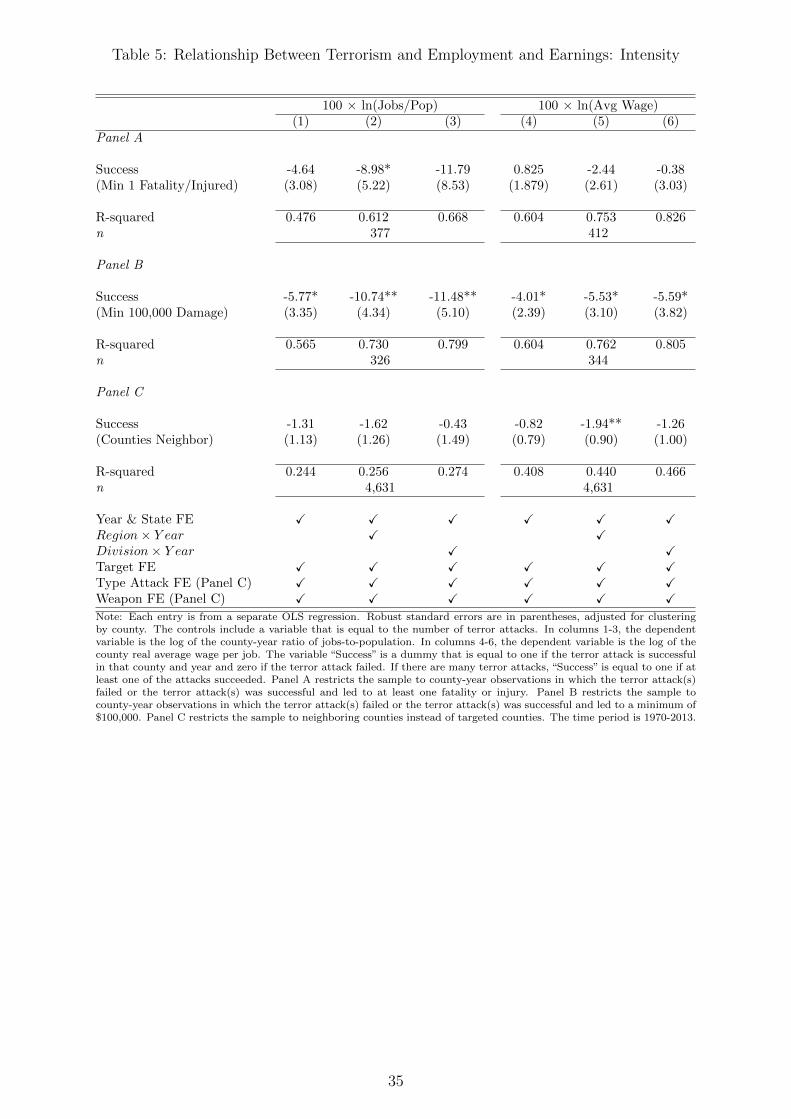
Table 5: Relationship Between Terrorism and Employment and Earnings: Intensity
100 × ln(Jobs/Pop) 100 × ln(Avg Wage)(1) (2) (3) (4) (5) (6)
Panel A
Success -4.64 -8.98* -11.79 0.825 -2.44 -0.38(Min 1 Fatality/Injured) (3.08) (5.22) (8.53) (1.879) (2.61) (3.03)
R-squared 0.476 0.612 0.668 0.604 0.753 0.826n 377 412
Panel B
Success -5.77* -10.74** -11.48** -4.01* -5.53* -5.59*(Min 100,000 Damage) (3.35) (4.34) (5.10) (2.39) (3.10) (3.82)
R-squared 0.565 0.730 0.799 0.604 0.762 0.805n 326 344
Panel C
Success -1.31 -1.62 -0.43 -0.82 -1.94** -1.26(Counties Neighbor) (1.13) (1.26) (1.49) (0.79) (0.90) (1.00)
R-squared 0.244 0.256 0.274 0.408 0.440 0.466n 4,631 4,631
Year & State FE X X X X X XRegion× Y ear X XDivision× Y ear X XTarget FE X X X X X XType Attack FE (Panel C) X X X X X XWeapon FE (Panel C) X X X X X XNote: Each entry is from a separate OLS regression. Robust standard errors are in parentheses, adjusted for clusteringby county. The controls include a variable that is equal to the number of terror attacks. In columns 1-3, the dependentvariable is the log of the county-year ratio of jobs-to-population. In columns 4-6, the dependent variable is the log of thecounty real average wage per job. The variable “Success” is a dummy that is equal to one if the terror attack is successfulin that county and year and zero if the terror attack failed. If there are many terror attacks, “Success” is equal to one if atleast one of the attacks succeeded. Panel A restricts the sample to county-year observations in which the terror attack(s)failed or the terror attack(s) was successful and led to at least one fatality or injury. Panel B restricts the sample tocounty-year observations in which the terror attack(s) failed or the terror attack(s) was successful and led to a minimum of$100,000. Panel C restricts the sample to neighboring counties instead of targeted counties. The time period is 1970-2013.
35
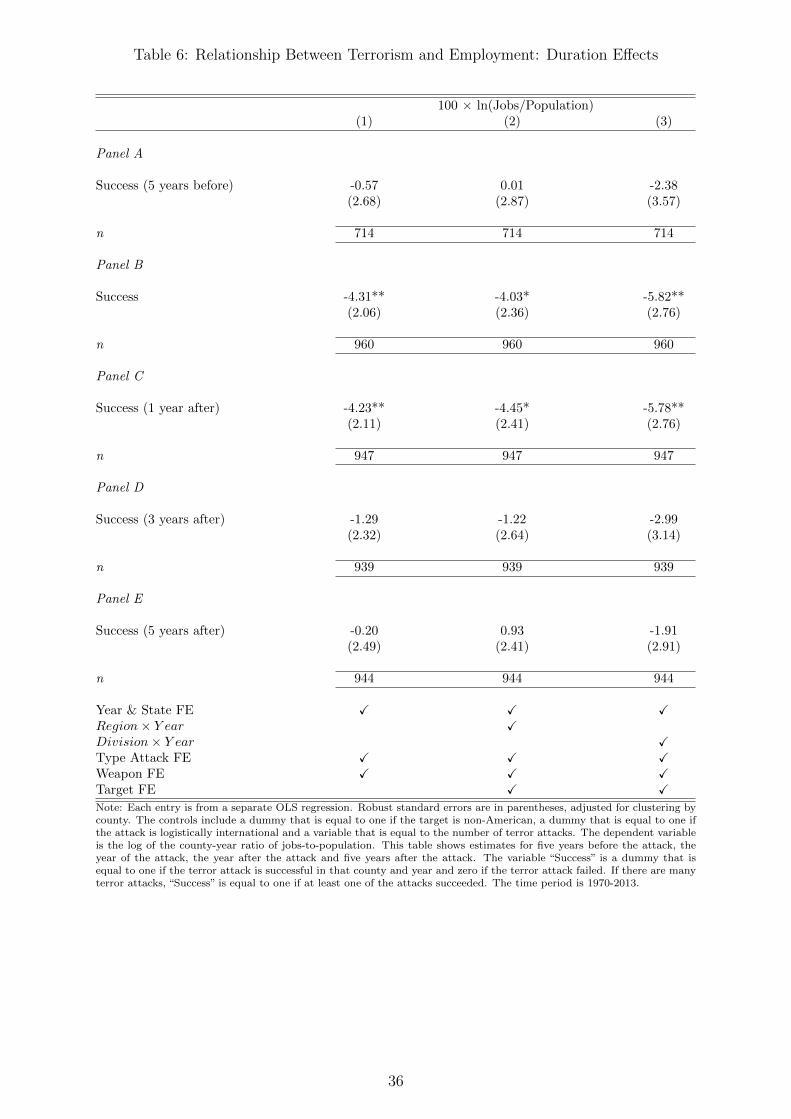
Table 6: Relationship Between Terrorism and Employment: Duration Effects
100 × ln(Jobs/Population)(1) (2) (3)
Panel A
Success (5 years before) -0.57 0.01 -2.38(2.68) (2.87) (3.57)
n 714 714 714
Panel B
Success -4.31** -4.03* -5.82**(2.06) (2.36) (2.76)
n 960 960 960
Panel C
Success (1 year after) -4.23** -4.45* -5.78**(2.11) (2.41) (2.76)
n 947 947 947
Panel D
Success (3 years after) -1.29 -1.22 -2.99(2.32) (2.64) (3.14)
n 939 939 939
Panel E
Success (5 years after) -0.20 0.93 -1.91(2.49) (2.41) (2.91)
n 944 944 944
Year & State FE X X XRegion× Y ear XDivision× Y ear XType Attack FE X X XWeapon FE X X XTarget FE X XNote: Each entry is from a separate OLS regression. Robust standard errors are in parentheses, adjusted for clustering bycounty. The controls include a dummy that is equal to one if the target is non-American, a dummy that is equal to one ifthe attack is logistically international and a variable that is equal to the number of terror attacks. The dependent variableis the log of the county-year ratio of jobs-to-population. This table shows estimates for five years before the attack, theyear of the attack, the year after the attack and five years after the attack. The variable “Success” is a dummy that isequal to one if the terror attack is successful in that county and year and zero if the terror attack failed. If there are manyterror attacks, “Success” is equal to one if at least one of the attacks succeeded. The time period is 1970-2013.
36
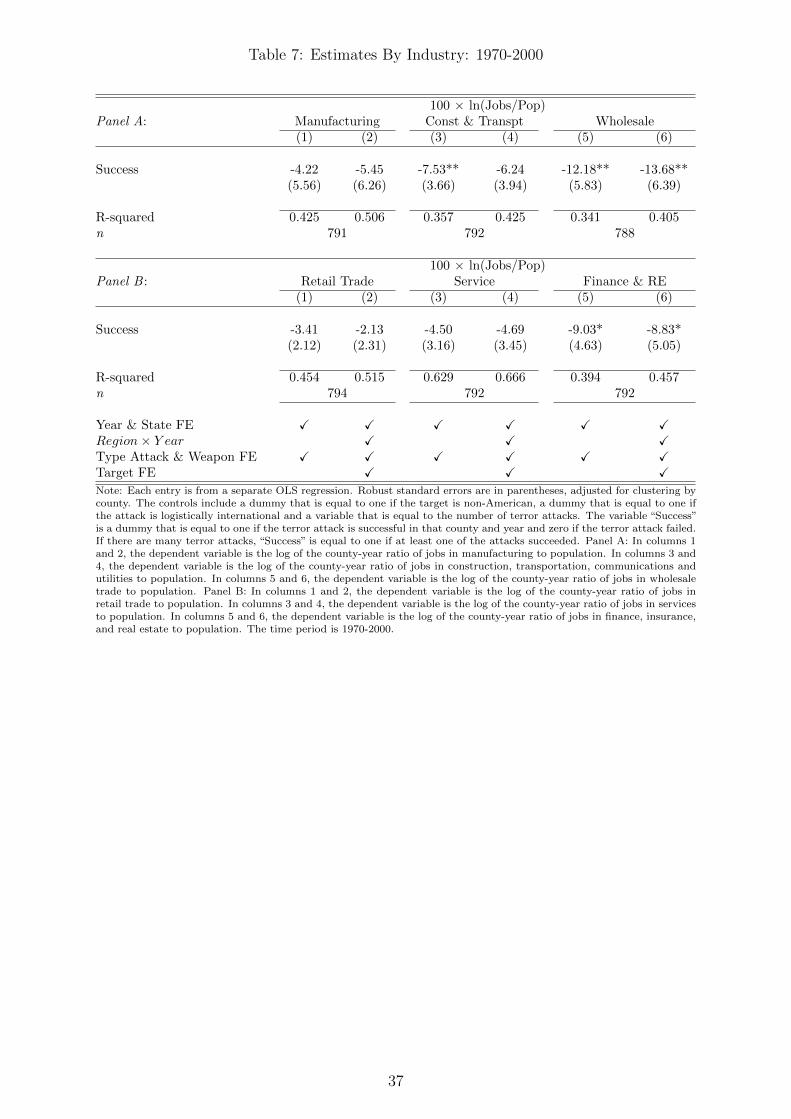
Table 7: Estimates By Industry: 1970-2000
100 × ln(Jobs/Pop)Panel A: Manufacturing Const & Transpt Wholesale
(1) (2) (3) (4) (5) (6)
Success -4.22 -5.45 -7.53** -6.24 -12.18** -13.68**(5.56) (6.26) (3.66) (3.94) (5.83) (6.39)
R-squared 0.425 0.506 0.357 0.425 0.341 0.405n 791 792 788
100 × ln(Jobs/Pop)Panel B : Retail Trade Service Finance & RE
(1) (2) (3) (4) (5) (6)
Success -3.41 -2.13 -4.50 -4.69 -9.03* -8.83*(2.12) (2.31) (3.16) (3.45) (4.63) (5.05)
R-squared 0.454 0.515 0.629 0.666 0.394 0.457n 794 792 792
Year & State FE X X X X X XRegion× Y ear X X XType Attack & Weapon FE X X X X X XTarget FE X X XNote: Each entry is from a separate OLS regression. Robust standard errors are in parentheses, adjusted for clustering bycounty. The controls include a dummy that is equal to one if the target is non-American, a dummy that is equal to one ifthe attack is logistically international and a variable that is equal to the number of terror attacks. The variable “Success”is a dummy that is equal to one if the terror attack is successful in that county and year and zero if the terror attack failed.If there are many terror attacks, “Success” is equal to one if at least one of the attacks succeeded. Panel A: In columns 1and 2, the dependent variable is the log of the county-year ratio of jobs in manufacturing to population. In columns 3 and4, the dependent variable is the log of the county-year ratio of jobs in construction, transportation, communications andutilities to population. In columns 5 and 6, the dependent variable is the log of the county-year ratio of jobs in wholesaletrade to population. Panel B: In columns 1 and 2, the dependent variable is the log of the county-year ratio of jobs inretail trade to population. In columns 3 and 4, the dependent variable is the log of the county-year ratio of jobs in servicesto population. In columns 5 and 6, the dependent variable is the log of the county-year ratio of jobs in finance, insurance,and real estate to population. The time period is 1970-2000.
37
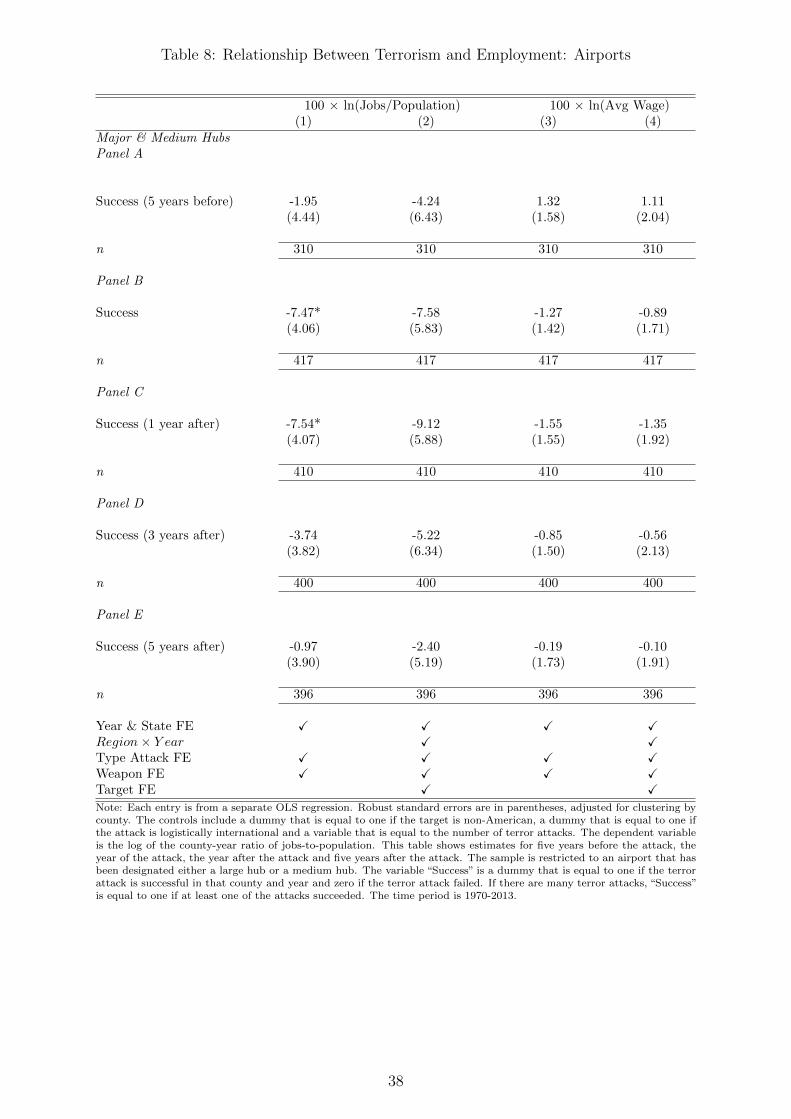
Table 8: Relationship Between Terrorism and Employment: Airports
100 × ln(Jobs/Population) 100 × ln(Avg Wage)(1) (2) (3) (4)
Major & Medium HubsPanel A
Success (5 years before) -1.95 -4.24 1.32 1.11(4.44) (6.43) (1.58) (2.04)
n 310 310 310 310
Panel B
Success -7.47* -7.58 -1.27 -0.89(4.06) (5.83) (1.42) (1.71)
n 417 417 417 417
Panel C
Success (1 year after) -7.54* -9.12 -1.55 -1.35(4.07) (5.88) (1.55) (1.92)
n 410 410 410 410
Panel D
Success (3 years after) -3.74 -5.22 -0.85 -0.56(3.82) (6.34) (1.50) (2.13)
n 400 400 400 400
Panel E
Success (5 years after) -0.97 -2.40 -0.19 -0.10(3.90) (5.19) (1.73) (1.91)
n 396 396 396 396
Year & State FE X X X XRegion× Y ear X XType Attack FE X X X XWeapon FE X X X XTarget FE X XNote: Each entry is from a separate OLS regression. Robust standard errors are in parentheses, adjusted for clustering bycounty. The controls include a dummy that is equal to one if the target is non-American, a dummy that is equal to one ifthe attack is logistically international and a variable that is equal to the number of terror attacks. The dependent variableis the log of the county-year ratio of jobs-to-population. This table shows estimates for five years before the attack, theyear of the attack, the year after the attack and five years after the attack. The sample is restricted to an airport that hasbeen designated either a large hub or a medium hub. The variable “Success” is a dummy that is equal to one if the terrorattack is successful in that county and year and zero if the terror attack failed. If there are many terror attacks, “Success”is equal to one if at least one of the attacks succeeded. The time period is 1970-2013.
38
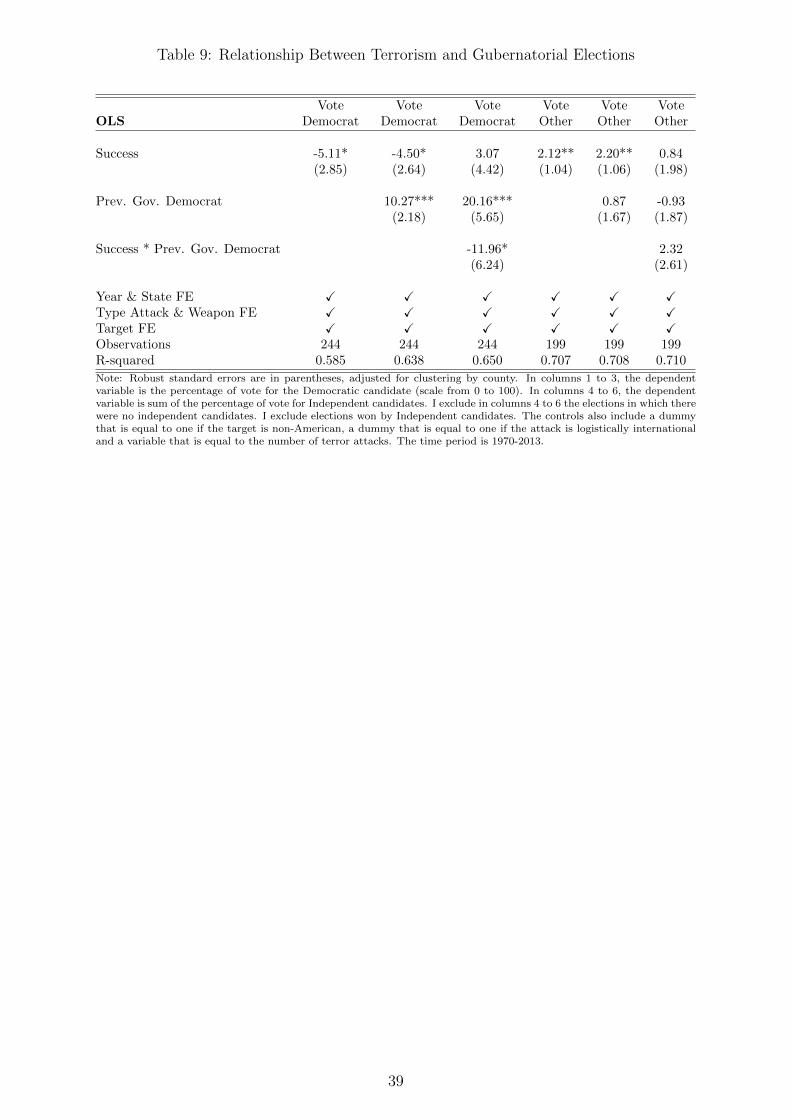
Table 9: Relationship Between Terrorism and Gubernatorial Elections
Vote Vote Vote Vote Vote VoteOLS Democrat Democrat Democrat Other Other Other
Success -5.11* -4.50* 3.07 2.12** 2.20** 0.84(2.85) (2.64) (4.42) (1.04) (1.06) (1.98)
Prev. Gov. Democrat 10.27*** 20.16*** 0.87 -0.93(2.18) (5.65) (1.67) (1.87)
Success * Prev. Gov. Democrat -11.96* 2.32(6.24) (2.61)
Year & State FE X X X X X XType Attack & Weapon FE X X X X X XTarget FE X X X X X XObservations 244 244 244 199 199 199R-squared 0.585 0.638 0.650 0.707 0.708 0.710
Note: Robust standard errors are in parentheses, adjusted for clustering by county. In columns 1 to 3, the dependentvariable is the percentage of vote for the Democratic candidate (scale from 0 to 100). In columns 4 to 6, the dependentvariable is sum of the percentage of vote for Independent candidates. I exclude in columns 4 to 6 the elections in which therewere no independent candidates. I exclude elections won by Independent candidates. The controls also include a dummythat is equal to one if the target is non-American, a dummy that is equal to one if the attack is logistically internationaland a variable that is equal to the number of terror attacks. The time period is 1970-2013.
39
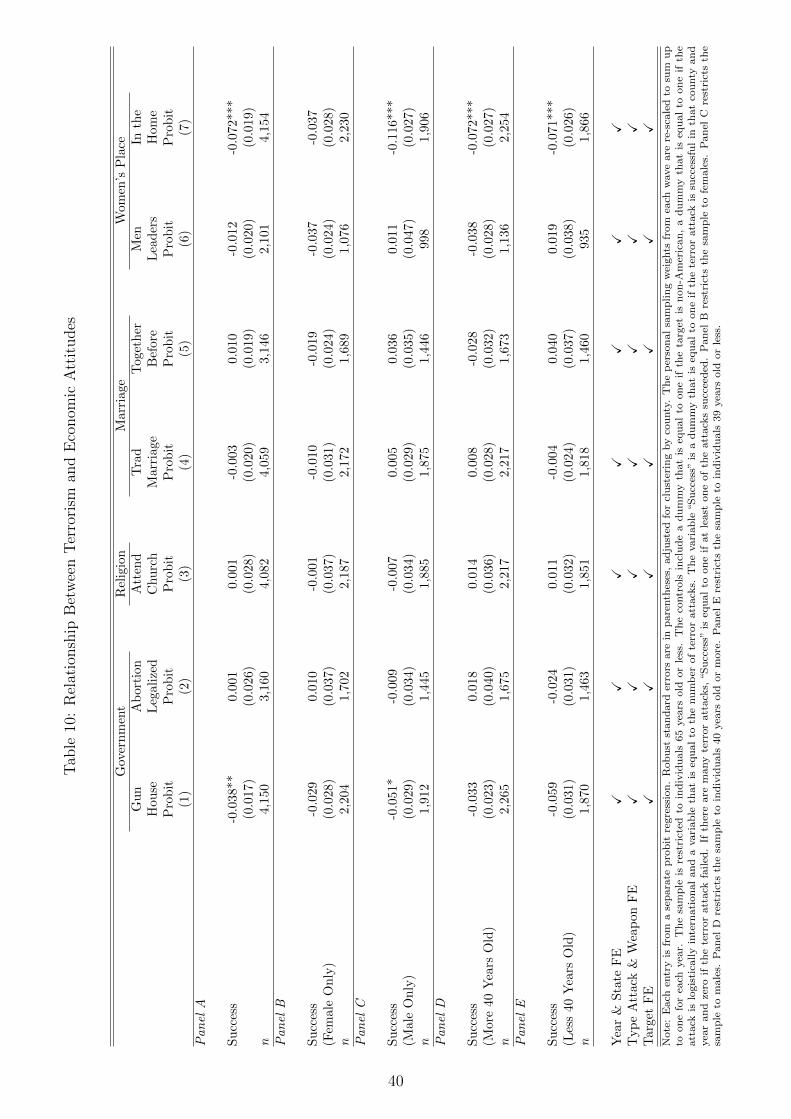
Tab
le10
:R
elat
ionsh
ipB
etw
een
Ter
rori
sman
dE
conom
icA
ttit
udes
Gov
ern
men
tR
elig
ion
Marr
iage
Wom
en’s
Pla
ceG
un
Ab
orti
on
Att
end
Tra
dT
oget
her
Men
Inth
eH
ouse
Leg
aliz
edC
hu
rch
Marr
iage
Bef
ore
Lea
der
sH
om
eP
robit
Pro
bit
Pro
bit
Pro
bit
Pro
bit
Pro
bit
Pro
bit
(1)
(2)
(3)
(4)
(5)
(6)
(7)
Panel
A
Su
cces
s-0
.038
**0.
001
0.0
01
-0.0
03
0.0
10
-0.0
12
-0.0
72***
(0.0
17)
(0.0
26)
(0.0
28)
(0.0
20)
(0.0
19)
(0.0
20)
(0.0
19)
n4,
150
3,16
04,0
82
4,0
59
3,1
46
2,1
01
4,1
54
Panel
B
Su
cces
s-0
.029
0.01
0-0
.001
-0.0
10
-0.0
19
-0.0
37
-0.0
37
(Fem
ale
Only
)(0
.028
)(0
.037)
(0.0
37)
(0.0
31)
(0.0
24)
(0.0
24)
(0.0
28)
n2,
204
1,70
22,1
87
2,1
72
1,6
89
1,0
76
2,2
30
Panel
C
Su
cces
s-0
.051
*-0
.009
-0.0
07
0.0
05
0.0
36
0.0
11
-0.1
16***
(Mal
eO
nly
)(0
.029
)(0
.034)
(0.0
34)
(0.0
29)
(0.0
35)
(0.0
47)
(0.0
27)
n1,
912
1,44
51,8
85
1,8
75
1,4
46
998
1,9
06
Panel
D
Su
cces
s-0
.033
0.01
80.0
14
0.0
08
-0.0
28
-0.0
38
-0.0
72***
(Mor
e40
Yea
rsO
ld)
(0.0
23)
(0.0
40)
(0.0
36)
(0.0
28)
(0.0
32)
(0.0
28)
(0.0
27)
n2,
265
1,67
52,2
17
2,2
17
1,6
73
1,1
36
2,2
54
Panel
E
Su
cces
s-0
.059
-0.0
24
0.0
11
-0.0
04
0.0
40
0.0
19
-0.0
71***
(Les
s40
Yea
rsO
ld)
(0.0
31)
(0.0
31)
(0.0
32)
(0.0
24)
(0.0
37)
(0.0
38)
(0.0
26)
n1,
870
1,46
31,8
51
1,8
18
1,4
60
935
1,8
66
Yea
r&
Sta
teF
EX
XX
XX
XX
Typ
eA
ttac
k&
Wea
pon
FE
XX
XX
XX
XT
arge
tF
EX
XX
XX
XX
Note
:E
ach
entr
yis
from
ase
para
tepro
bit
regre
ssio
n.
Robu
stst
an
dard
erro
rsare
inp
are
nth
eses
,ad
just
edfo
rcl
ust
erin
gby
county
.T
he
per
son
al
sam
plin
gw
eights
from
each
wave
are
re-s
cale
dto
sum
up
toone
for
each
yea
r.T
he
sam
ple
isre
stri
cted
toin
div
idu
als
65
yea
rsold
or
less
.T
he
contr
ols
incl
ud
ea
du
mm
yth
at
iseq
ual
toone
ifth
eta
rget
isn
on
-Am
eric
an
,a
du
mm
yth
at
iseq
ual
toone
ifth
eatt
ack
islo
gis
tica
lly
inte
rnati
on
al
and
avari
ab
leth
at
iseq
ual
toth
enu
mb
erof
terr
or
att
ack
s.T
he
vari
ab
le“Su
cces
s”is
ad
um
my
that
iseq
ual
toon
eif
the
terr
or
att
ack
issu
cces
sfu
lin
that
cou
nty
and
yea
rand
zero
ifth
ete
rror
att
ack
failed
.If
ther
eare
many
terr
or
att
ack
s,“S
ucc
ess”
iseq
ual
toon
eif
at
least
on
eof
the
att
ack
ssu
ccee
ded
.P
an
elB
rest
rict
sth
esa
mp
leto
fem
ale
s.P
an
elC
rest
rict
sth
esa
mp
leto
male
s.P
an
elD
rest
rict
sth
esa
mp
leto
indiv
idu
als
40
yea
rsold
or
more
.P
anel
Ere
stri
cts
the
sam
ple
toin
div
idu
als
39
yea
rsold
or
less
.
40
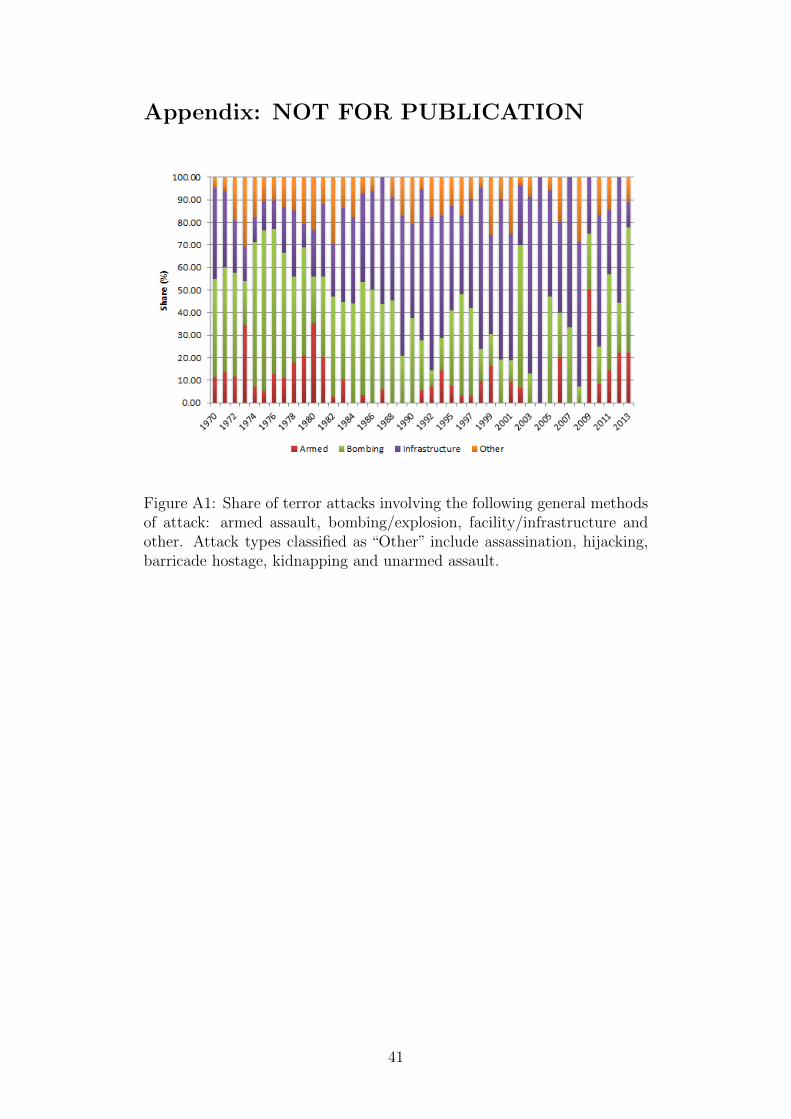
Appendix: NOT FOR PUBLICATION
Figure A1: Share of terror attacks involving the following general methodsof attack: armed assault, bombing/explosion, facility/infrastructure andother. Attack types classified as “Other” include assassination, hijacking,barricade hostage, kidnapping and unarmed assault.
41
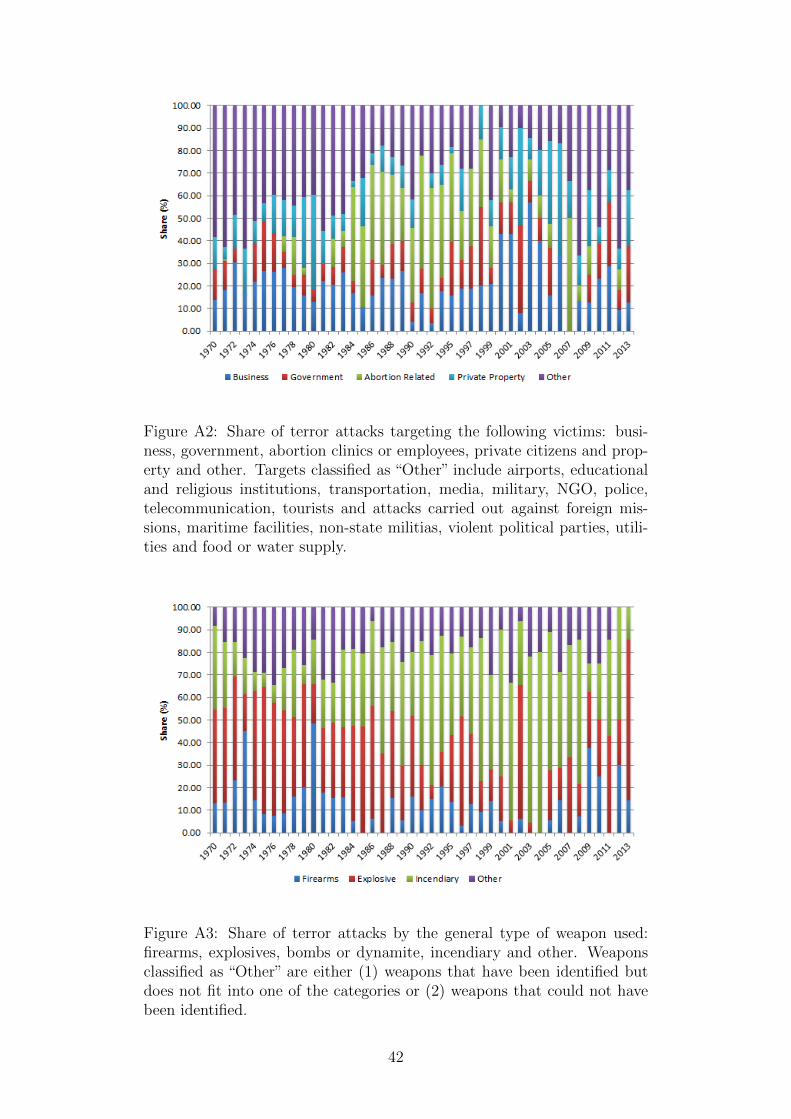
Figure A2: Share of terror attacks targeting the following victims: busi-ness, government, abortion clinics or employees, private citizens and prop-erty and other. Targets classified as “Other” include airports, educationaland religious institutions, transportation, media, military, NGO, police,telecommunication, tourists and attacks carried out against foreign mis-sions, maritime facilities, non-state militias, violent political parties, utili-ties and food or water supply.
Figure A3: Share of terror attacks by the general type of weapon used:firearms, explosives, bombs or dynamite, incendiary and other. Weaponsclassified as “Other” are either (1) weapons that have been identified butdoes not fit into one of the categories or (2) weapons that could not havebeen identified.
42
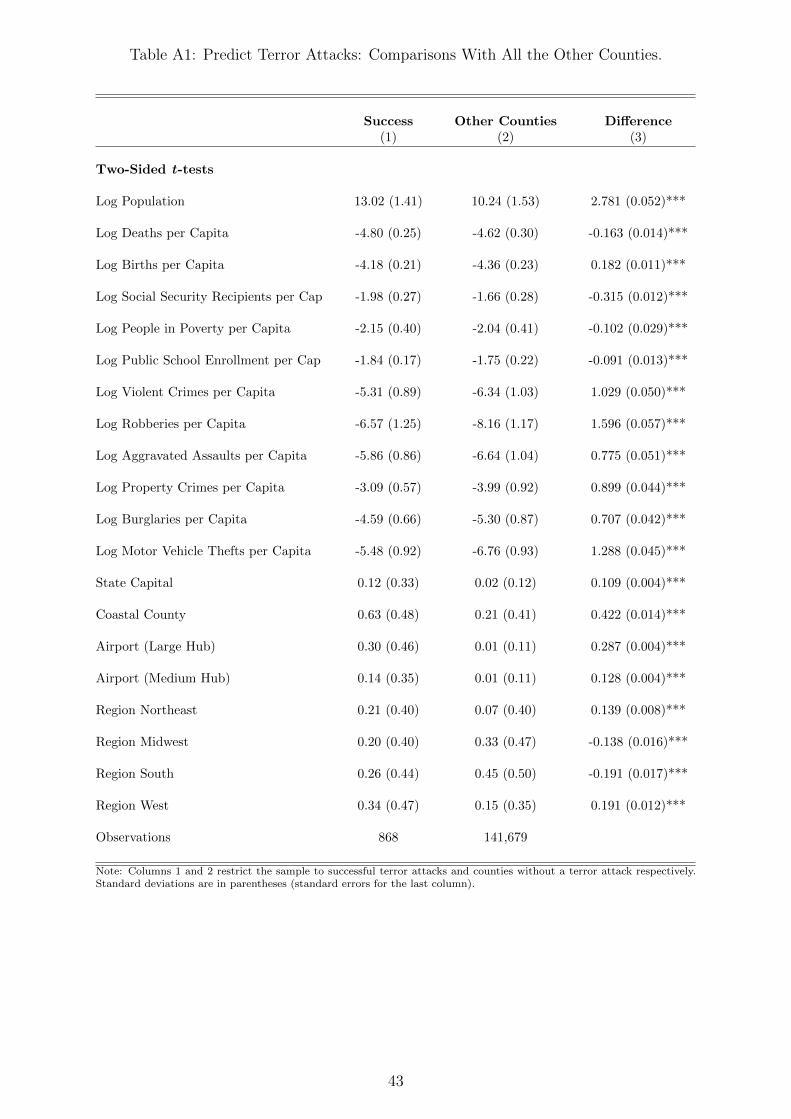
Table A1: Predict Terror Attacks: Comparisons With All the Other Counties.
Success Other Counties Difference(1) (2) (3)
Two-Sided t-tests
Log Population 13.02 (1.41) 10.24 (1.53) 2.781 (0.052)***
Log Deaths per Capita -4.80 (0.25) -4.62 (0.30) -0.163 (0.014)***
Log Births per Capita -4.18 (0.21) -4.36 (0.23) 0.182 (0.011)***
Log Social Security Recipients per Cap -1.98 (0.27) -1.66 (0.28) -0.315 (0.012)***
Log People in Poverty per Capita -2.15 (0.40) -2.04 (0.41) -0.102 (0.029)***
Log Public School Enrollment per Cap -1.84 (0.17) -1.75 (0.22) -0.091 (0.013)***
Log Violent Crimes per Capita -5.31 (0.89) -6.34 (1.03) 1.029 (0.050)***
Log Robberies per Capita -6.57 (1.25) -8.16 (1.17) 1.596 (0.057)***
Log Aggravated Assaults per Capita -5.86 (0.86) -6.64 (1.04) 0.775 (0.051)***
Log Property Crimes per Capita -3.09 (0.57) -3.99 (0.92) 0.899 (0.044)***
Log Burglaries per Capita -4.59 (0.66) -5.30 (0.87) 0.707 (0.042)***
Log Motor Vehicle Thefts per Capita -5.48 (0.92) -6.76 (0.93) 1.288 (0.045)***
State Capital 0.12 (0.33) 0.02 (0.12) 0.109 (0.004)***
Coastal County 0.63 (0.48) 0.21 (0.41) 0.422 (0.014)***
Airport (Large Hub) 0.30 (0.46) 0.01 (0.11) 0.287 (0.004)***
Airport (Medium Hub) 0.14 (0.35) 0.01 (0.11) 0.128 (0.004)***
Region Northeast 0.21 (0.40) 0.07 (0.40) 0.139 (0.008)***
Region Midwest 0.20 (0.40) 0.33 (0.47) -0.138 (0.016)***
Region South 0.26 (0.44) 0.45 (0.50) -0.191 (0.017)***
Region West 0.34 (0.47) 0.15 (0.35) 0.191 (0.012)***
Observations 868 141,679
Note: Columns 1 and 2 restrict the sample to successful terror attacks and counties without a terror attack respectively.Standard deviations are in parentheses (standard errors for the last column).
43
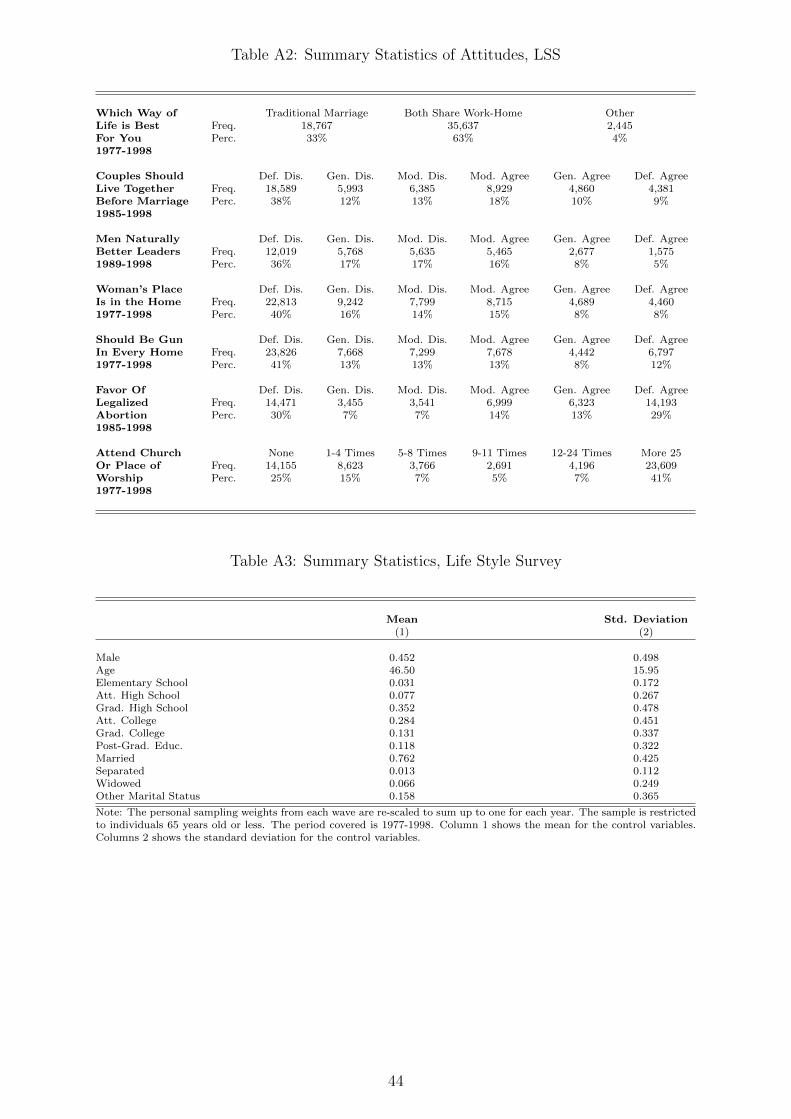
Table A2: Summary Statistics of Attitudes, LSS
Which Way of Traditional Marriage Both Share Work-Home OtherLife is Best Freq. 18,767 35,637 2,445For You Perc. 33% 63% 4%1977-1998
Couples Should Def. Dis. Gen. Dis. Mod. Dis. Mod. Agree Gen. Agree Def. AgreeLive Together Freq. 18,589 5,993 6,385 8,929 4,860 4,381Before Marriage Perc. 38% 12% 13% 18% 10% 9%1985-1998
Men Naturally Def. Dis. Gen. Dis. Mod. Dis. Mod. Agree Gen. Agree Def. AgreeBetter Leaders Freq. 12,019 5,768 5,635 5,465 2,677 1,5751989-1998 Perc. 36% 17% 17% 16% 8% 5%
Woman’s Place Def. Dis. Gen. Dis. Mod. Dis. Mod. Agree Gen. Agree Def. AgreeIs in the Home Freq. 22,813 9,242 7,799 8,715 4,689 4,4601977-1998 Perc. 40% 16% 14% 15% 8% 8%
Should Be Gun Def. Dis. Gen. Dis. Mod. Dis. Mod. Agree Gen. Agree Def. AgreeIn Every Home Freq. 23,826 7,668 7,299 7,678 4,442 6,7971977-1998 Perc. 41% 13% 13% 13% 8% 12%
Favor Of Def. Dis. Gen. Dis. Mod. Dis. Mod. Agree Gen. Agree Def. AgreeLegalized Freq. 14,471 3,455 3,541 6,999 6,323 14,193Abortion Perc. 30% 7% 7% 14% 13% 29%1985-1998
Attend Church None 1-4 Times 5-8 Times 9-11 Times 12-24 Times More 25Or Place of Freq. 14,155 8,623 3,766 2,691 4,196 23,609Worship Perc. 25% 15% 7% 5% 7% 41%1977-1998
Table A3: Summary Statistics, Life Style Survey
Mean Std. Deviation(1) (2)
Male 0.452 0.498Age 46.50 15.95Elementary School 0.031 0.172Att. High School 0.077 0.267Grad. High School 0.352 0.478Att. College 0.284 0.451Grad. College 0.131 0.337Post-Grad. Educ. 0.118 0.322Married 0.762 0.425Separated 0.013 0.112Widowed 0.066 0.249Other Marital Status 0.158 0.365
Note: The personal sampling weights from each wave are re-scaled to sum up to one for each year. The sample is restrictedto individuals 65 years old or less. The period covered is 1977-1998. Column 1 shows the mean for the control variables.Columns 2 shows the standard deviation for the control variables.
44
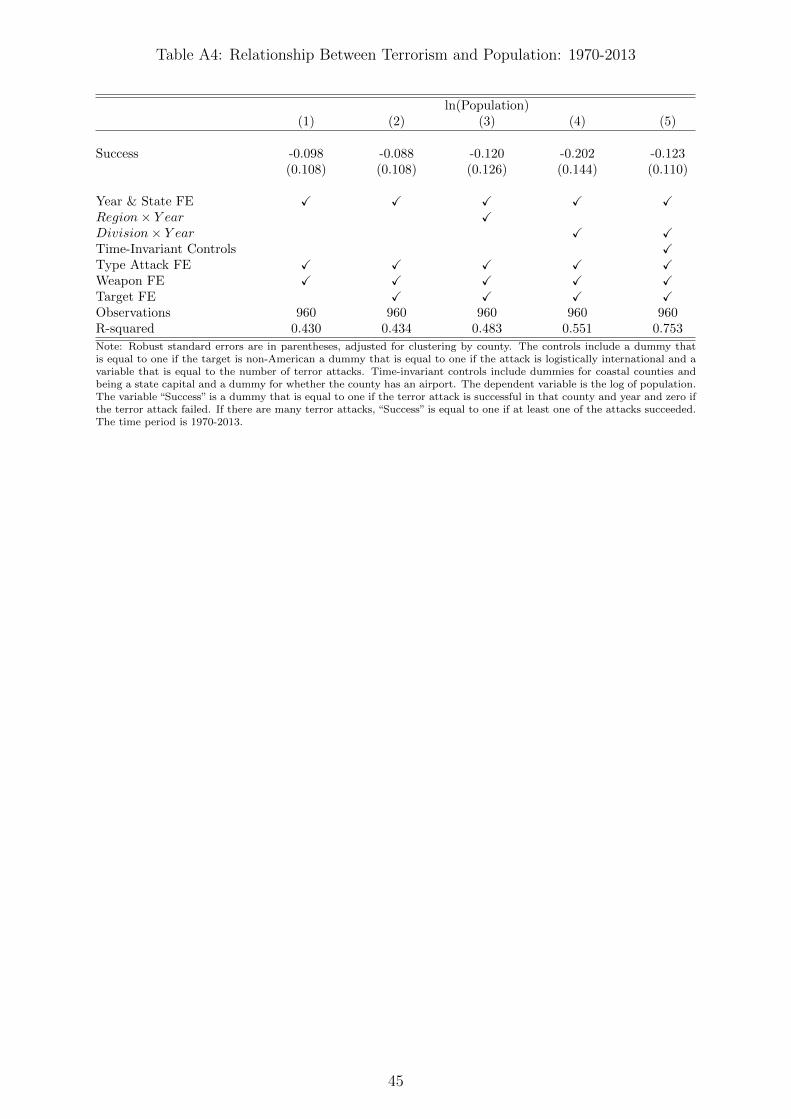
Table A4: Relationship Between Terrorism and Population: 1970-2013
ln(Population)(1) (2) (3) (4) (5)
Success -0.098 -0.088 -0.120 -0.202 -0.123(0.108) (0.108) (0.126) (0.144) (0.110)
Year & State FE X X X X XRegion× Y ear XDivision× Y ear X XTime-Invariant Controls XType Attack FE X X X X XWeapon FE X X X X XTarget FE X X X XObservations 960 960 960 960 960R-squared 0.430 0.434 0.483 0.551 0.753
Note: Robust standard errors are in parentheses, adjusted for clustering by county. The controls include a dummy thatis equal to one if the target is non-American a dummy that is equal to one if the attack is logistically international and avariable that is equal to the number of terror attacks. Time-invariant controls include dummies for coastal counties andbeing a state capital and a dummy for whether the county has an airport. The dependent variable is the log of population.The variable “Success” is a dummy that is equal to one if the terror attack is successful in that county and year and zero ifthe terror attack failed. If there are many terror attacks, “Success” is equal to one if at least one of the attacks succeeded.The time period is 1970-2013.
45
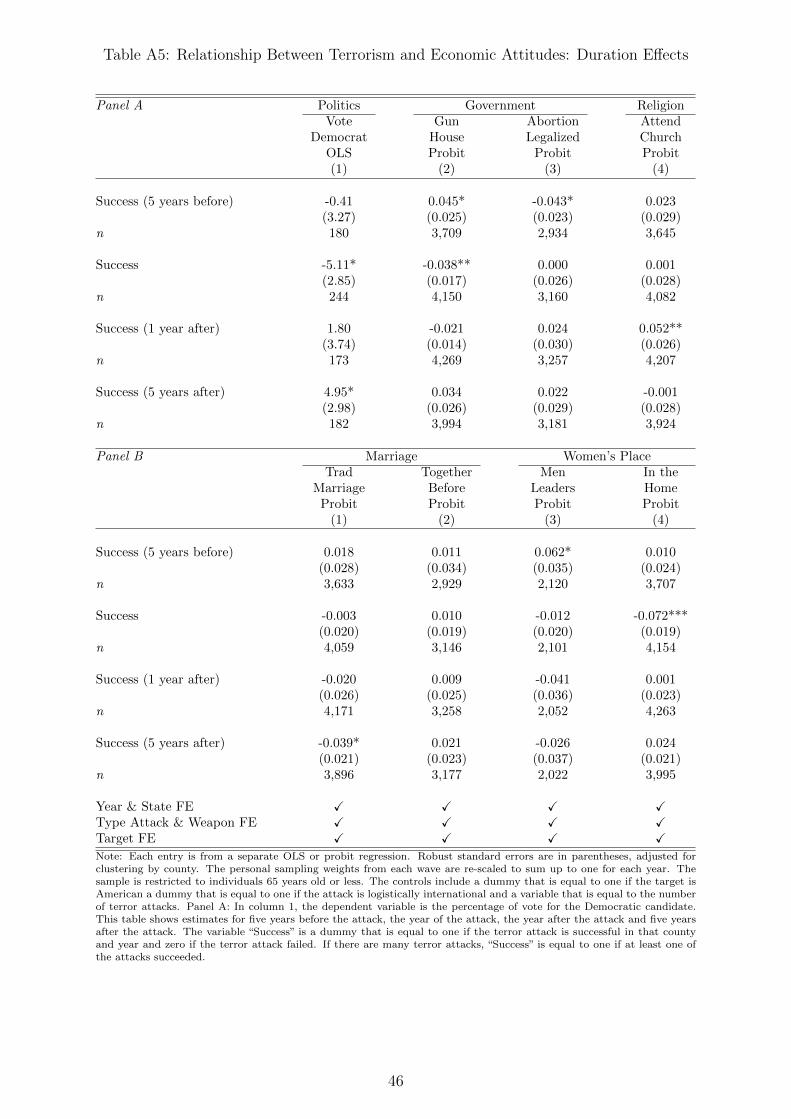
Table A5: Relationship Between Terrorism and Economic Attitudes: Duration Effects
Panel A Politics Government ReligionVote Gun Abortion Attend
Democrat House Legalized ChurchOLS Probit Probit Probit(1) (2) (3) (4)
Success (5 years before) -0.41 0.045* -0.043* 0.023(3.27) (0.025) (0.023) (0.029)
n 180 3,709 2,934 3,645
Success -5.11* -0.038** 0.000 0.001(2.85) (0.017) (0.026) (0.028)
n 244 4,150 3,160 4,082
Success (1 year after) 1.80 -0.021 0.024 0.052**(3.74) (0.014) (0.030) (0.026)
n 173 4,269 3,257 4,207
Success (5 years after) 4.95* 0.034 0.022 -0.001(2.98) (0.026) (0.029) (0.028)
n 182 3,994 3,181 3,924
Panel B Marriage Women’s PlaceTrad Together Men In the
Marriage Before Leaders HomeProbit Probit Probit Probit
(1) (2) (3) (4)
Success (5 years before) 0.018 0.011 0.062* 0.010(0.028) (0.034) (0.035) (0.024)
n 3,633 2,929 2,120 3,707
Success -0.003 0.010 -0.012 -0.072***(0.020) (0.019) (0.020) (0.019)
n 4,059 3,146 2,101 4,154
Success (1 year after) -0.020 0.009 -0.041 0.001(0.026) (0.025) (0.036) (0.023)
n 4,171 3,258 2,052 4,263
Success (5 years after) -0.039* 0.021 -0.026 0.024(0.021) (0.023) (0.037) (0.021)
n 3,896 3,177 2,022 3,995
Year & State FE X X X XType Attack & Weapon FE X X X XTarget FE X X X XNote: Each entry is from a separate OLS or probit regression. Robust standard errors are in parentheses, adjusted forclustering by county. The personal sampling weights from each wave are re-scaled to sum up to one for each year. Thesample is restricted to individuals 65 years old or less. The controls include a dummy that is equal to one if the target isAmerican a dummy that is equal to one if the attack is logistically international and a variable that is equal to the numberof terror attacks. Panel A: In column 1, the dependent variable is the percentage of vote for the Democratic candidate.This table shows estimates for five years before the attack, the year of the attack, the year after the attack and five yearsafter the attack. The variable “Success” is a dummy that is equal to one if the terror attack is successful in that countyand year and zero if the terror attack failed. If there are many terror attacks, “Success” is equal to one if at least one ofthe attacks succeeded.
46