Terrestrial Planet Finder Interferometer
81
JPL Publication 08-11 Terrestrial Planet Finder Interferometer TPF-I Technology Milestone #2 Report Formation Control Performance Demonstration Daniel P. Scharf, editor Peter R. Lawson, editor Jet Propulsion Laboratory National Aeronautics and Space Administration Jet Propulsion Laboratory California Institute of Technology Pasadena, California January 2008
Transcript of Terrestrial Planet Finder Interferometer
JPL Publication 08-11
Terrestrial Planet Finder Interferometer
TPF-I Technology
Milestone #2 Report
Formation Control Performance Demonstration
Daniel P. Scharf, editor Peter R. Lawson, editor Jet Propulsion Laboratory
National Aeronautics and
Space Administration
Jet Propulsion Laboratory
California Institute of Technology
Pasadena, California
January 2008
TPF-I Technology Milestone #2 Report
ii
This research was carried out at the Jet Propulsion Laboratory, California
Institute of Technology, under a contract with the National Aeronautics
and Space Administration.
Reference herein to any specific commercial product, process, or service
by trade name, trademark, manufacturer, or otherwise, does not constitute
or imply its endorsement by the United States Government or the Jet
Propulsion Laboratory, California Institute of Technology.
JPL Publication 08-11
iii
TERRESTRIAL PLANET FINDER INTERFEROMETER TECHNOLOGY MILESTONE #2 REPORT Approvals
Prepared By: Daniel Scharf, Date TPF-I Formation Flying Lead Engineer Approved By: Peter Lawson, Date TPF-I Systems Manager Daniel Coulter, Date TPF Project Manager Charles Beichman, Date TPF-I Project Scientist Michael Devirian, Date Navigator Program Manager Zlatan Tsvetanov Date TPF Program Scientist Lia LaPiana, Date TPF Program Executive

TPF-I Technology Milestone #2 Report
iv
Table of Contents
Approvals...................................................................................................................... iii 1. Abstract ...................................................................................................................1
2. Objective .................................................................................................................1
3. Demonstration Overview.........................................................................................2
3.1. Formation Control System Overview ...............................................................4
4. Demonstration Procedure.........................................................................................5
4.1. Definitions .......................................................................................................5
4.2. Procedure.........................................................................................................6
5. Success Criteria .....................................................................................................11
5.1. Formation Guidance Verification ...................................................................11
5.2. Translational Control Performance.................................................................11
5.3. Rotational Control Performance.....................................................................11
5.4. Multiple Guidance Profiles ............................................................................11
5.5. Repeatability..................................................................................................12
5.6. Formation Timing..........................................................................................12
5.7. Traceability to Flight via Error Budgets .........................................................12
6. Demonstration Results...........................................................................................12
6.1. Narrative of Example Demonstration .............................................................12
6.2. Demonstration Results and Success Criteria Satisfaction................................20
6.3. Formation Error Budget .................................................................................39
7. Summary ...............................................................................................................47
7.1. Some Recommendations for Flight Implementation .......................................47
8. References .............................................................................................................48
9. Appendices............................................................................................................49 A. Table of Acronyms & Abbreviations .................................................................... 49 B. Further Details on COTS Truth Sensors................................................................ 49 C. Specification of Requirements for Formation Flying............................................. 50 D. Milestone Certification Process ............................................................................ 51 E. Milestone White Paper.......................................................................................... 52

JPL Publication 08-11
1
TPF-I Technology Milestone #2 Report: Formation Control Performance Demonstration
1. Abstract
This document reports the achievement of Terrestrial Planet Finder Interferometer
(TPF-I) Technology Milestone #2, a ground-based, system-level demonstration of two-
spacecraft formation synchronized rotation. We review the milestone specification from
the Milestone White Paper (May 25, 2007), summarize the experiments performed in the
Formation Control Testbed (FCT), detail the procedures and analysis of the resulting
data, and describe and present the data itself.
2. Objective
In support of the Terrestrial Planet Finder Interferometer (TPF-I) pre-phase-A development program, this report presents the results of the laboratory demonstrations for TPF-I Technology Milestone #2. See Beichman et al. (1999) for a general discussion of the science and mission design of TPF-I. Per the Milestone #2 White Paper, this report documents the milestone demonstrations and allows for review and certification by the EIRB and NASA HQ. The certification process is reproduced in Appendix D. The entire White Paper is included in Appendix E. This technology milestone was established in the TPF-I Technology Plan (Lawson & Dooley 2005) to gauge the developmental progress of the TPF-I project and its readiness to proceed from pre-Phase A to Phase A. The formation control performance milestone described herein addresses precision range and bearing control. The milestone is restated in the Technology Milestone #2 Whitepaper (May 25, 2007) as follows.
Milestone #2: Formation Flying (Multiple Robot Demonstration)
Using the Formation Control Testbed (FCT) as an end-to-end system-level hardware testbed, demonstrate that a formation of multiple robots can autonomously initialize, maneuver and operate in a collision free manner. A key maneuver, representative of TPF-I science will be demonstrated by rotating through greater than 90° at ten times the flight rotation rate while maintaining a relative position control to 5 cm 1 per axis.1 This is the first step in a full validation of the formation control architecture and algorithms and the testbed models developed by the Formation Algorithms & Simulation Testbed while physically demonstrating a scaled version of the approach to achieving the angular resolution required for the detection of terrestrial planets. Milestone results in TRL 4.
1 This performance is required during the Performance Regime, which is a portion of the overall 90 deg turn that the robots maneuver through. See Figure 2 and Appendix E, Figure 7 and accompanying text. The FCT performance requirement specification is also given in Appendix E, Section 3.
TPF-I Technology Milestone #2 Report
2
This milestone for precision formation flying will show that, consistent with the FCT sensor precision and disturbance level, formation algorithms and software have been integrated with flight-like communication, sensor, and actuator sub-systems to execute a scaled-version of the most precise formation maneuver needed for TPF-I. An overview of the FCT hardware and the specification of the Milestone performance requirements are given in Appendix E, Section 3. The principal investigator for the Formation Performance Milestone is Daniel Scharf at NASA’s Jet Propulsion Laboratory (JPL). The FCT team that accomplished this milestone consists of Jason A. Keim, Arin C. Morfopoulos, Ali Vafaei, Yan Brenman, Joel F. Shields, Charles F. Bergh, Brandon C. Metz, and Asif Ahmed of JPL and industry partner Eric Rasmussen of Guidance Dynamics Corporation, Inc. A much larger team contributed to the overall development of the FCT (Regehr et al. 2004).
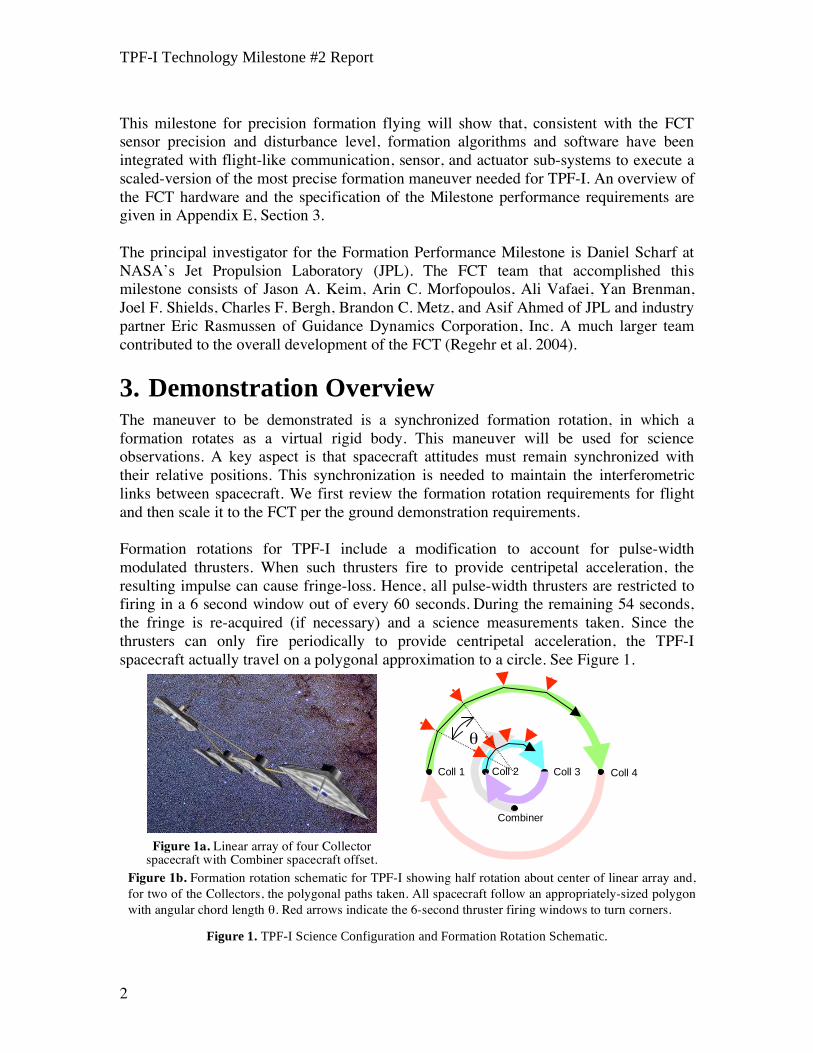
3. Demonstration Overview The maneuver to be demonstrated is a synchronized formation rotation, in which a formation rotates as a virtual rigid body. This maneuver will be used for science observations. A key aspect is that spacecraft attitudes must remain synchronized with their relative positions. This synchronization is needed to maintain the interferometric links between spacecraft. We first review the formation rotation requirements for flight and then scale it to the FCT per the ground demonstration requirements. Formation rotations for TPF-I include a modification to account for pulse-width modulated thrusters. When such thrusters fire to provide centripetal acceleration, the resulting impulse can cause fringe-loss. Hence, all pulse-width thrusters are restricted to firing in a 6 second window out of every 60 seconds. During the remaining 54 seconds, the fringe is re-acquired (if necessary) and a science measurements taken. Since the thrusters can only fire periodically to provide centripetal acceleration, the TPF-I spacecraft actually travel on a polygonal approximation to a circle. See Figure 1.
Figure 1. TPF-I Science Configuration and Formation Rotation Schematic.
Coll 1 Coll 2 Coll 3 Coll 4
Combiner
Figure 1a. Linear array of four Collector spacecraft with Combiner spacecraft offset.
Figure 1b. Formation rotation schematic for TPF-I showing half rotation about center of linear array and, for two of the Collectors, the polygonal paths taken. All spacecraft follow an appropriately-sized polygon with angular chord length . Red arrows indicate the 6-second thruster firing windows to turn corners.
JPL Publication 08-11
3
The FCT robots are not required to drift thrust-free for 54 seconds: although the ratio of control-authority to disturbance-level is 150 for TPF-I (the thrusters are sized for centripetal acceleration), the ratio for the FCT is only 6.2 However, the Formation and Attitude Control System (FACS) is capable of meeting thrust window constraints in lower-disturbance environments (Lurie 2003, Scharf et al. 2004). While the FCT demonstrations will not have “thrust-free” periods, the formation guidance algorithm generates the polygonal trajectories of Figure 1b to be consistent with the TPF-I design. The parameters that must be specified for a formation rotation are given in Table 1.
Table 1. Formation Rotation Parameters for TPF-I and the FCT.
# Parameters Unit TPF-I FCTb
1 Rotation Axis, N/A Within 45 deg of
anti-Sunline Vertical axis of
FCT
2 Rotation Rate, arcmin/s 0.5 5.0
3 Rotation Angle, deg 360 90
4 Vehicle Separation, b m 20-80 3.44
5 Angular Chord Length, deg 0.5 40, 20
6 Formation Controla cm per axis
± 1 5, 1
7 Attitude Controla arcmin per
axis ± 1 6.7, 1
8 Performance Regime deg 180 360 29.9-59.6 a Performance required during the Performance Regime, which is a portion of the 90 deg turn the robots maneuver through. See Figure 2 and Appendix E, Figure 7 and accompanying text. b See Appendix E for specification of FCT performance requirements.
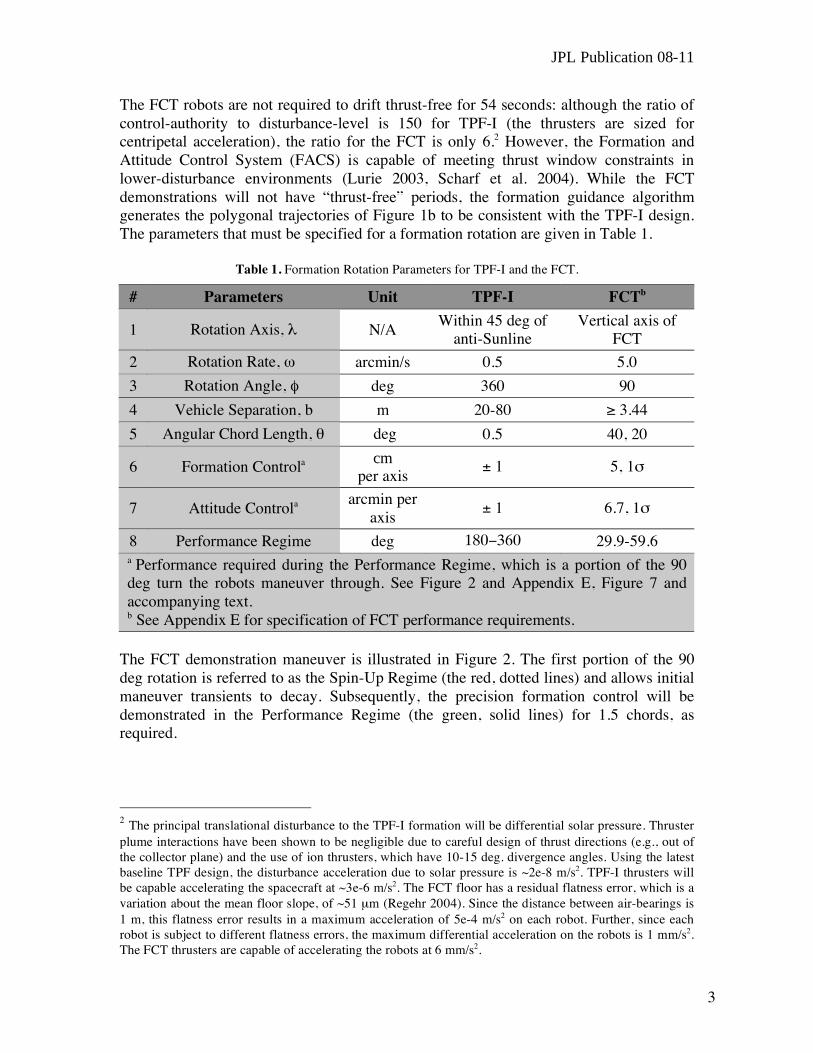
The FCT demonstration maneuver is illustrated in Figure 2. The first portion of the 90 deg rotation is referred to as the Spin-Up Regime (the red, dotted lines) and allows initial maneuver transients to decay. Subsequently, the precision formation control will be demonstrated in the Performance Regime (the green, solid lines) for 1.5 chords, as required.
2 The principal translational disturbance to the TPF-I formation will be differential solar pressure. Thruster plume interactions have been shown to be negligible due to careful design of thrust directions (e.g., out of the collector plane) and the use of ion thrusters, which have 10-15 deg. divergence angles. Using the latest baseline TPF design, the disturbance acceleration due to solar pressure is ~2e-8 m/s2. TPF-I thrusters will be capable accelerating the spacecraft at ~3e-6 m/s2. The FCT floor has a residual flatness error, which is a variation about the mean floor slope, of ~51 μm (Regehr 2004). Since the distance between air-bearings is 1 m, this flatness error results in a maximum acceleration of 5e-4 m/s2 on each robot. Further, since each robot is subject to different flatness errors, the maximum differential acceleration on the robots is 1 mm/s2. The FCT thrusters are capable of accelerating the robots at 6 mm/s2.
TPF-I Technology Milestone #2 Report
4
Figure 2. Illustration of the Precision Synchronized Formation Rotation Maneuver for the FCT as
Specified in Table 1. In the Spin-Up Regime initial maneuver transients decay. Precision formation control
is required in the Performance Regime. The maneuver is synchronized in that the robot attitudes rotate to
maintain the white thruster clusters (colored for emphasis) pointed along the inter-spacecraft vector.
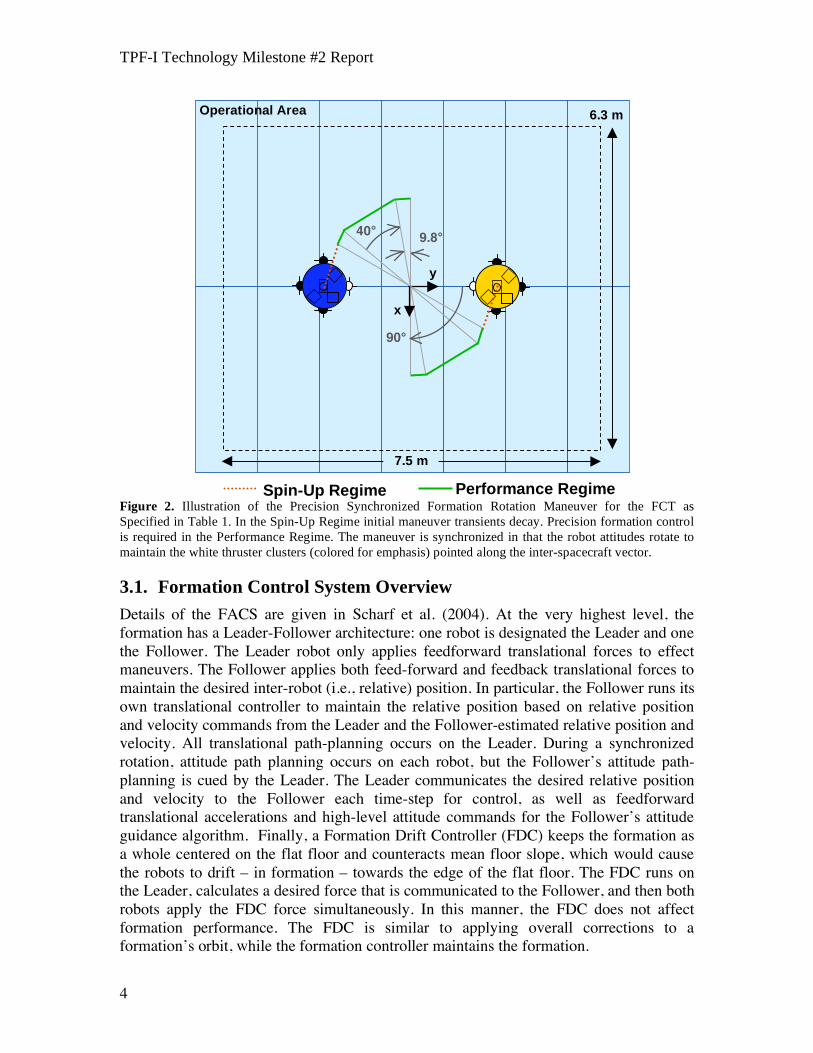
3.1. Formation Control System Overview
Details of the FACS are given in Scharf et al. (2004). At the very highest level, the formation has a Leader-Follower architecture: one robot is designated the Leader and one the Follower. The Leader robot only applies feedforward translational forces to effect maneuvers. The Follower applies both feed-forward and feedback translational forces to maintain the desired inter-robot (i.e., relative) position. In particular, the Follower runs its own translational controller to maintain the relative position based on relative position and velocity commands from the Leader and the Follower-estimated relative position and velocity. All translational path-planning occurs on the Leader. During a synchronized rotation, attitude path planning occurs on each robot, but the Follower’s attitude path-planning is cued by the Leader. The Leader communicates the desired relative position and velocity to the Follower each time-step for control, as well as feedforward translational accelerations and high-level attitude commands for the Follower’s attitude guidance algorithm. Finally, a Formation Drift Controller (FDC) keeps the formation as a whole centered on the flat floor and counteracts mean floor slope, which would cause the robots to drift – in formation – towards the edge of the flat floor. The FDC runs on the Leader, calculates a desired force that is communicated to the Follower, and then both robots apply the FDC force simultaneously. In this manner, the FDC does not affect formation performance. The FDC is similar to applying overall corrections to a formation’s orbit, while the formation controller maintains the formation.
x
y
90°
40°
6.3 m Operational Area
7.5 m
Spin-Up Regime Performance Regime
9.8°

JPL Publication 08-11
5
4. Demonstration Procedure
4.1. Definitions
Milestone #2 requires measurement and control of inter-robot position and absolute robot attitudes. In the following paragraphs we define the terms involved in this process, enumerate the measurement steps, and specify the data products. 4.1.1. Formation and Attitude Control System (FACS). The C-code software module
that runs in real-time on each robot and contains the formation and attitude estimation, guidance, and control algorithms. The FACS is discussed in detail in Scharf et al. (2004).
4.1.2. Room Frame. The reference frame of the FCT. The origin is at a reference block in the center of the FCT. The X- and Y-axes are defined by fixed posts (a second post for each axis was installed using a laser surveyor, since the reference block has since been covered by the flat floor). The Z-axis is defined by the cross product of the X and Y axes.
4.1.3. Robot Body Frame. The reference frame of a robot. The origin is at the center of
curvature of the spherical air bearing. The axes are defined by reference posts affixed to the attitude platform.
4.1.4. Absolute Position. The position vector, ri , i = 1, 2, of the origin of a robot’s Body Frame in the Room Frame as determined by the star tracker and represented in the Room Frame.
4.1.5. Relative Position. The position of Robot 2 (R2) with respect to R1 as determined by differencing Absolute Positions, r = r2-r1.
4.1.6. Desired Relative Position. The commanded relative position, rd, as calculated by the formation guidance algorithm.
4.1.7. Attitude Estimator. The element of the FACS that combines star tracker attitude measurements with gyroscope outputs to obtain an estimate of the orientation of a robot Body Frame with respect to the Room Frame.
4.1.8. Absolute Attitude. The rotation that takes the Room Frame to the Robot Body
Frame as determined by the output of a robot’s attitude estimator and represented as a proper quaternion, qRB,i, i = 1, 2.

TPF-I Technology Milestone #2 Report
6
4.1.9. Desired Absolute Attitude. The commanded rotation that takes the Room Frame to the Robot Body Frame as calculated by the formation guidance algorithm that synchronizes absolute attitude with the desired relative position. The rotation is represented by a proper quaternion, qRB,i
d, i = 1, 2. 4.1.10. Translational Control Error. The relative position minus the desired relative
position, re = r - rd. 4.1.11. Rotational Control Error. The rotation that takes the Desired Absolute Attitude
to the Absolute Attitude as represented by the proper quaternion qe,i = prop( conj(qRB,i
d) * qRB,i ), where conj(.) conjugates a quaternion, prop(.) properizes a quaternion, and * is the quaternion multiplication operator.
4.1.12. Angular Control Error. The representation of qe,i via a vector of angles, gi,
corresponding to the axis/angle rotation parameterization. That is, a rotation may be equivalently represented by the vector , where is the turning angle and is the unit vector to turn about. When is small, this vector of angles gives the “small angle” approximation to a rotation. For example, an angular control error of gi = [ 3 -2 4 ] arcmin means that to match the absolute attitude and the desired absolute attitude, the Robot Body Frame must be rotated -3 arcmin about the positive x-axis of the Robot Body Frame, 2 arcmin about the positive y-axis of the Robot Body Frame, and -4 arcmin about the positive z-axis of the Robot Body Frame.
4.1.13. Performance Interval. The interval of time when the Desired Relative Position is
commanding the green portion of the robot trajectories in Figure 2. 4.1.14. Translational Control Performance. The per axis standard deviations, pt, of the
Translational Control Error during the Performance Interval. 4.1.15. Rotational Control Performance. The per axis standard deviations, pr,i, i = 1, 2,
of an Angular Control Error during the Performance Interval.
4.2. Procedure
This section describes the procedure that will be followed to collect data for the milestone
validation review. The robots are given high-level commands over a wireless connection
from the FCT “Ground” Console. The commands are high level in that they specify the
desired outcome and the detailed path planning and execution is performed on-board the
robots by the FACS. Example commands are given below.
4.2.1. Initial Robot Positioning. The robots will be manually placed in their approximate initial conditions. A command script will be sent to the robots for them to position themselves at the initial conditions for the demonstration. After the robots have converged, they will be shutdown and their computers reset. These actions ensure repeatability from run to run and that the individual “flight”

JPL Publication 08-11
7
computers on each robot have arbitrary skew in their control cycles. An example command for positioning a robot in the Room Frame (not formation flying) is:
facs_cmd ATS_ABS_OFFSET time {20} OffsetVec {0, 1.72, 0}
which commands the Absolute Translation System (ATS) to go to the position
specified in the offset vector (OffsetVec) in the Room Frame when the on-board
clock is at 20 s.
4.2.2. Demonstration Run via Command Script. The robots will be started with a command script that contains all the commands for the demonstration. The robots go through their autonomous checkout modes in 15 seconds. Synchronizing control cycles can take up to 100 s. At 110 s, the robots will begin formation initialization as specified in the command script uploaded at the beginning of the demonstration. Initialization, during which the attitudes are aligned and formation flying begins, takes 50 s in this scenario. At 170 s, the synchronized formation rotation command activates. The rotation is actually commanded for 100 deg so that the formation will stop rotating beyond the Performance Interval. At 5 arcmin/s, this rotation takes 20 minutes. The robots are commanded to quit and download telemetry.
The exact commands sent to the robots for each run are given next. The
synchronized rotation commands differ in the angular chord width , specified by
LinArcLen, which is either 20 deg (0.349 rad) or 40 deg (0.698 rad), and the
total rotation angle , specified by the third component of Rotation, which is
either 100 deg or 120 deg. These values of are the smallest angles greater than
90 deg that are integer multiples of their respective angular chord lengths. Note
that there is a 300 s idle period at the beginning of each run during which
gyroscopes are auto-calibrated. The robots are then automatically floated at 300 s
on the transition in the formation flying software from IDLE mode to RUN mode.
The first two commands (GUID_ATT_...) set parameters for the attitude
guidance algorithms. The FCT_ATC_ENABLE command turns on the
independent robot control loops with respect to the Room Frame. This control
capability is referred to as Absolute Translational Control (ATC). The
FCT_ATC_ABS_OFFSET command keeps the robots at the desired positions
until formation initialization begins. This procedure ensures the subsequent
formation initialization maneuvers are not excessively long. Upon processing the
MDC_BEGIN_FORMINIT command, the ATC is automatically disabled and the
Formation Drift Controller (FDC) is enabled. The FDC keeps the formation from
drifting as a whole on the FCT flat floor. It corresponds to an outer orbit control
loop such as would be used on flight to keep the formation in the proper orbit.
Then, a RE_TARGET command is sent to set up the same formation at the
beginning of each synchronized rotation.
TPF-I Technology Milestone #2 Report
8
These commands result in guidance trajectories that satisfy the requirements of
Table 1. This satisfaction is discussed in Section 6. Note that more significant
digits are used in the 20 deg synchronized rotation command to prevent round-off
error. In the future, the command processing software will be modified so that it is
not numerically sensitive.
= 20 deg, Leader: facs_cmd GUID_ATT_DEFINE_BASE time {307} PriInertialName {0} PriInertialVec {0.0,0.0,1.0} SecInertialName {0} SecInertialVec {1.0,0.0,0.0} PriBodyName {0} PriBodyVec {0.0,0.0,1.0} SecBodyName {0} SecBodyVec {1.0,0.0,0.0} facs_cmd GUID_ATT_TURN_LIMITS time {308} MaxAngVel {0.0174,0.0174,0.0174} MaxAngAccel {0.0174,0.0174,0.0174} facs_cmd FCT_ATC_ENABLE time {320} facs_cmd FCT_ATC_ABS_OFFSET time {330} OffsetVec {- 0.7794,2.3818,0.9884} facs_cmd MDC_BEGIN_FORMINIT time {360} facs_cmd GUID_FORM_RE_TARGET time {400} StarDirection {0.0,0.0,1.0} BaselineIner {-0.5873,-3.4504,0} Duration {30} facs_cmd GUID_FORM_SYNCH_ROT time {450} Rotation {0.0,0.0,- 1.745329251994330} Duration {1200} LinArcLen {0.349065850398866}
= 20 deg, Follower:
facs_cmd GUID_ATT_DEFINE_BASE time {307} PriInertialName {0} PriInertialVec {0.0,0.0,1.0} SecInertialName {0} SecInertialVec {1.0,0.0,0.0} PriBodyName {0} PriBodyVec {0.0,0.0,1.0} SecBodyName {0} SecBodyVec {1.0,0.0,0.0} facs_cmd GUID_ATT_TURN_LIMITS time {308} MaxAngVel {0.0174,0.0174,0.0174} MaxAngAccel {0.0174,0.0174,0.0174} facs_cmd FCT_ATC_ENABLE time {320} facs_cmd FCT_ATC_ABS_OFFSET time {330} OffsetVec {-1.3668,- 1.0686,0.9884}
= 40 deg, Leader:
facs_cmd GUID_ATT_DEFINE_BASE time {307} PriInertialName {0} PriInertialVec {0.0,0.0,1.0} SecInertialName {0} SecInertialVec {1.0,0.0,0.0} PriBodyName {0} PriBodyVec {0.0,0.0,1.0} SecBodyName {0} SecBodyVec {1.0,0.0,0.0}
facs_cmd GUID_ATT_TURN_LIMITS time {308} MaxAngVel {0.0174,0.0174,0.0174} MaxAngAccel {0.0174,0.0174,0.0174} facs_cmd FCT_ATC_ENABLE time {320} facs_cmd FCT_ATC_ABS_OFFSET time {330} OffsetVec {-
JPL Publication 08-11
9
0.7794,2.3818,0.9884} facs_cmd MDC_BEGIN_FORMINIT time {360} facs_cmd GUID_FORM_RE_TARGET time {400} StarDirection {0.0,0.0,1.0} BaselineIner {-0.5873,-3.4504,0} Duration {30} facs_cmd GUID_FORM_SYNCH_ROT time {450} Rotation {0.0,0.0,- 2.0944} Duration {1440} LinArcLen {0.6982}
= 40 deg, Follower:
facs_cmd GUID_ATT_DEFINE_BASE time {307} PriInertialName {0} PriInertialVec {0.0,0.0,1.0} SecInertialName {0} SecInertialVec {1.0,0.0,0.0} PriBodyName {0} PriBodyVec {0.0,0.0,1.0} SecBodyName {0} SecBodyVec {1.0,0.0,0.0} facs_cmd GUID_ATT_TURN_LIMITS time {308} MaxAngVel {0.0174,0.0174,0.0174} MaxAngAccel {0.0174,0.0174,0.0174} facs_cmd FCT_ATC_ENABLE time {320} facs_cmd FCT_ATC_ABS_OFFSET time {330} OffsetVec {-1.3668,- 1.0686,0.9884}
4.2.3. Telemetry Processing. Upon receiving the shutdown command from the FCT
Ground Console, the robots de-float their air-bearings and download telemetry to the Ground Console. The telemetry contains all the data necessary to calculate the Translational Control Performance and Rotational Control Performance. These performances are then compared to the required values given in Section 3 and reiterated in Section 5.
Telemetry processing includes correcting guidance commands and position and
attitude data for communication packet drops and control cycle slips. A packet
drop, as the name suggests, is when the Follower robot does not receive the
command broadcast from the Leader robot. In this case, the Follower robot copies
the command from the most recently received packet. Packet drops occur
approximately once every 60 s on average. A control cycle slip is when the
computer on-board a robot misses the 1 Hz interrupt signal generated by the
timing chip due to electronic noise on the interrupt line. Cycle slips occur
approximately once every 300 s on average and result in a control cycle of 2 or 3
s in length, rather than the desired 1 s. Both phenomena, packet drops and cycle
slips, are caused by use of commercial off-the-shelf (COTS) hardware.
While COTS reduce cost, the formation flying system must robustly perform
given their non-ideal effects. That is, even though the Follower robot is following
guidance commands (i.e., desired relative position and attitude) that are altered by
these non-ideal effects, performance must be evaluated using the original,
unaltered guidance commands. The original commands specify the synchronized
rotation relative positions and attitudes.

TPF-I Technology Milestone #2 Report
10
To recover the original commands sent from the Leader to the Follower, the
following process is used. Cycle slips are determined by differencing the clock
reading in telemetry at the beginning of a control cycle. If a cycle slip occurs on
the Follower, a control cycle is added and position and attitude data and the
guidance commands are interpolated. If a cycle slip occurs on the Leader, which
is generating the guidance commands, the corresponding control cycle on the
Follower is deleted. This deletion is done so the Leader and Follower maintain the
same cycle count from the initiation of the synchronized rotation maneuver.
Packet drops are determined from telemetry: the flight system records when a
packet is not received. Given the packet drop times, guidance commands are
interpolated for those control cycles. The following is an example telemetry item
indicating a packet drop during control cycle 533
!! [Time 533.000000] Did not receive isc
facs_define_mdc_inputs: S/C[0] using saved ISC message
where ISC stands for Inter -Spacecraft Communication. A graphical example of
how using this telemetry to correct the guidance commands is shown in Figure 3.
The same telemetry processing script is used in all cases. The inputs are the
telemetry files and a list of packet drop times, which are manually read from
telemetry. As is shown subsequently, robot performance criteria are met with both
corrected and uncorrected position/attitude data and guidance commands.
However, for verifying that the guidance commands are correct, which is Success
Criterion 5.1, the corrected guidance commands from telemetry must be used.
Figure 3. Example of Correcting Guidance Commands for Packet Drops Based on Telemetry. In this case,
there is one drop at control cycle 1070 and then a sequence of five dropped packets starting at cycle 1076.
For each dropped packet, the last received command is copied, generating the plateaus. This example is the
most extreme that occurred.

JPL Publication 08-11
11
5. Success Criteria
The following is a statement of the elements that must be demonstrated to close the TPF-I Formation Control Milestone 2. Each element includes a brief rationale. See Appendix E for the requirement rationales. 5.1. Formation Guidance Verification
The time history of rd and qRB,id in telemetry must agree to ±5 mm and ±1 arcmin,
respectively, with the trajectory specified in Table 1 and shown in Figure 2 for the actual value of inter-robot separation b at the start of the synchronized formation rotation.
Rationale: Since the Translational and Rotational Control Performances are based on
the desired relative position and desired absolute attitude, these values are double-
checked for correctness. The accuracy specified is a factor of approximately 10 smaller
than the performance requirements and ensures the robots are following the proper
trajectories.
5.2. Translational Control Performance
The per-axis Translational Control Performance must be less than or equal to 5 cm 1 . Rationale: This performance shows that the formation algorithms in FACS and the flight-like sensing, actuation, and communication sub-systems have functioned together to achieve the highest formation performance consistent with sensing precision. 5.3. Rotational Control Performance
The per-axis Rotational Control Performance must be less than or equal to 6.7 arcmin 1 . Rationale: This performance shows that the formation algorithms in FACS and the flight-like sensing, actuation, and communication sub-systems have functioned together to achieve the highest synchronized attitude performance consistent with sensing precision. 5.4. Multiple Guidance Profiles
The 90 deg rotation must be performed with an angular chord width of 40 deg and 20 deg. Rationale: TPF-I will tailor its rotations to specific target stars. By demonstrating rotations with two different angular chord widths, the flexibility of the formation guidance algorithm is demonstrated.

TPF-I Technology Milestone #2 Report
12
5.5. Repeatability
The entire demonstration for both angular chord widths must be repeated three times while meeting Criteria 5.1 through 5.4 with at least two days between demonstrations. Demonstrations of different angular chord widths may occur on the same day. Rationale: This repeatability shows the Precision Formation Control capability is robust to variations in the testbed environment. 5.6. Formation Timing
During all demonstrations, timing information for each formation mode and maneuver will be recorded. There is no performance requirement on timing. Rationale: Since TPF-I will have cryogenic operating temperatures, maneuver times are critical to telescope design and overall observational efficiency. Future milestones will more completely address timing. However, the process is being initiated as part of this milestone, and documentation of maneuver times will be part of future milestone success criteria. 5.7. Traceability to Flight via Error Budgets
Provide analyses and error budgets showing that the FACS demonstrated in the FCT can achieve flight performance given flight-level spacecraft and environment properties. Rationale: Since exact flight performance is not being demonstrated, the performance of the FCT formation in this milestone must be shown to provide a path forward to flight.
6. Demonstration Results
6.1. Narrative of Example Demonstration
A demonstration consists of the two robots rotating as a formation. In all cases, Robot 1
(R1), which is gold, is the Leader, and Robot 2 (R2), which is blue, is the Follower.
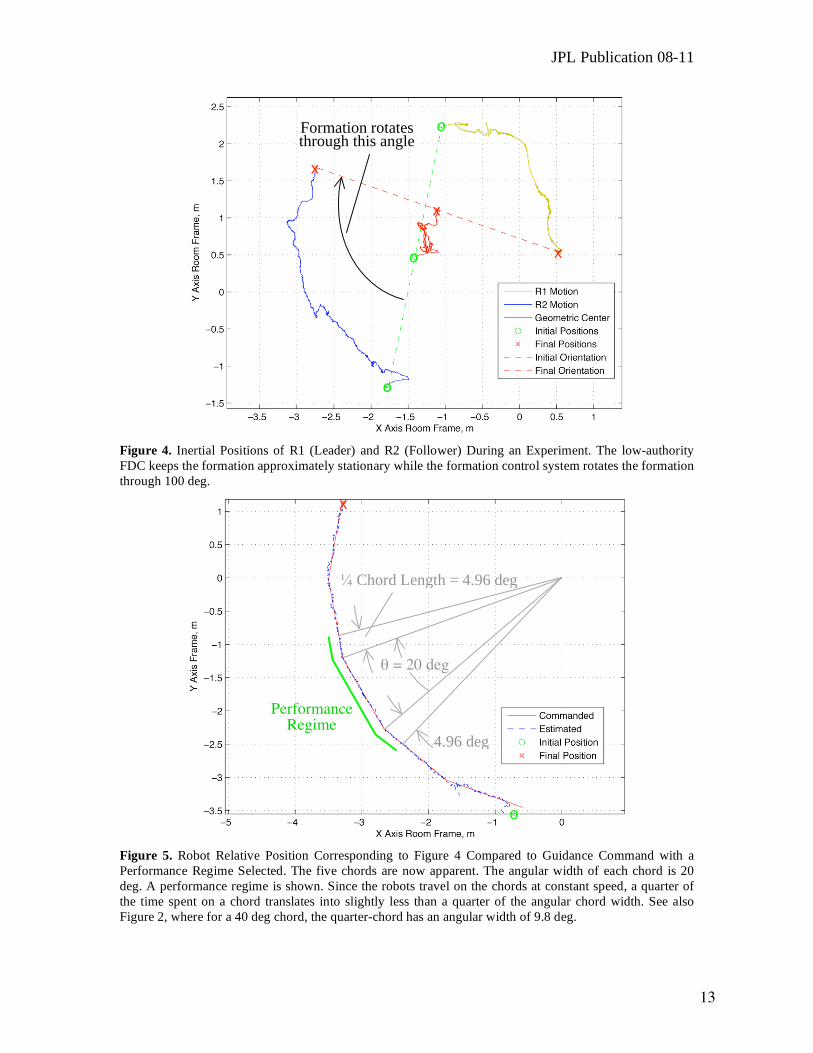
Figure 2 shows an idealized schematic of the inertial motion of the robots. Figure 4
shows an example of the actual inertial motion of two robots during a 100 deg formation
rotation. The motion of the geometric center of the formation shows that the formation as
a whole drifts due to floor slope and that the FDC keeps the formation relatively
stationary. The initial motion of R2 counter to the rotation direction is due to a decaying
transient from the preceding RE_TARGET maneuver. The chords that the robots move on
are not apparent in this visualization. To see the chords, relative motion must be
considered.
Figure 5 shows the motion of the Follower relative to the Leader resulting from the
inertial motion of Figure 4. Both the estimated relative position and the commanded
relative position are shown. Now the five, 20 deg chords are apparent. Recall from
JPL Publication 08-11
13
Figure 4. Inertial Positions of R1 (Leader) and R2 (Follower) During an Experiment. The low-authority
FDC keeps the formation approximately stationary while the formation control system rotates the formation
through 100 deg.
Figure 5. Robot Relative Position Corresponding to Figure 4 Compared to Guidance Command with a
Performance Regime Selected. The five chords are now apparent. The angular width of each chord is 20
deg. A performance regime is shown. Since the robots travel on the chords at constant speed, a quarter of
the time spent on a chord translates into slightly less than a quarter of the angular chord width. See also
Figure 2, where for a 40 deg chord, the quarter-chord has an angular width of 9.8 deg.
Performance Regime
4.96 deg
= 20 deg
Chord Length = 4.96 deg
x
o
x
o
x
o
x
o
Formation rotates through this angle
TPF-I Technology Milestone #2 Report
14
Figure 2 that the performance regime consists of one full chord plus the bordering quarter-chords. Since there are five chords, there are three possible performance regimes. When multiple performance regimes satisfy the Success Criteria, the regime with the best performance is selected for reporting. However, for an angular chord width of 40 deg, there are only three chords, and hence only one possible performance regime.
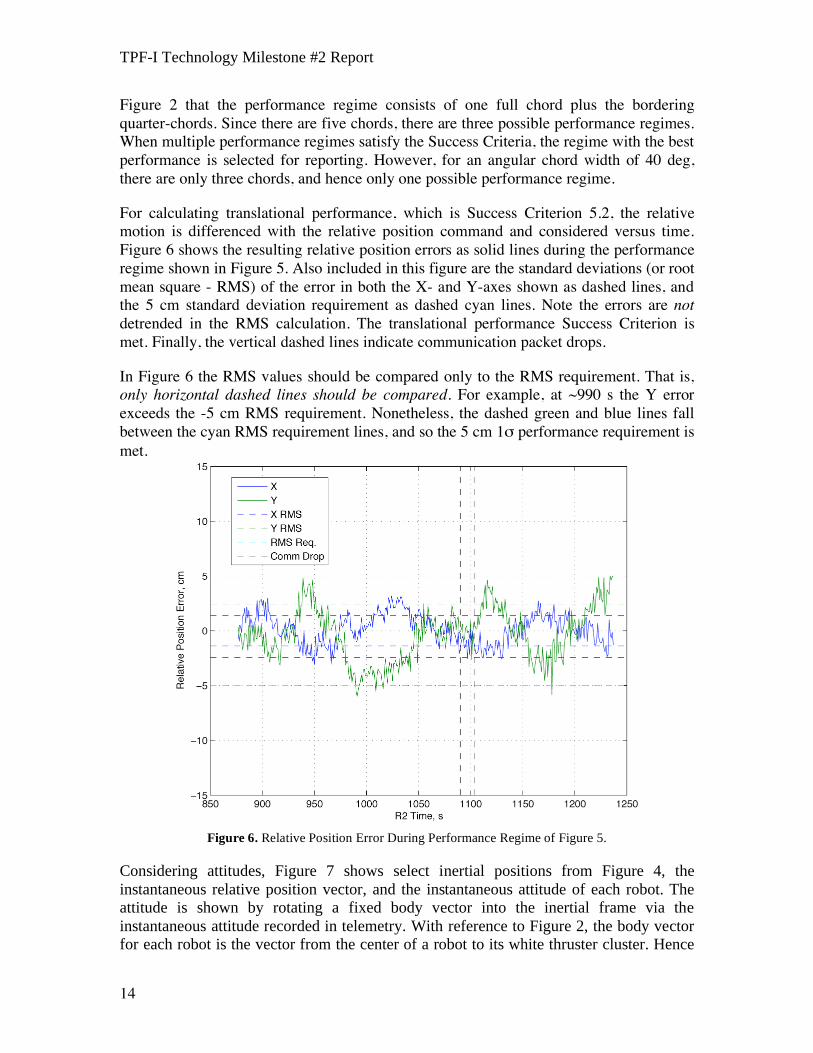
For calculating translational performance, which is Success Criterion 5.2, the relative motion is differenced with the relative position command and considered versus time. Figure 6 shows the resulting relative position errors as solid lines during the performance regime shown in Figure 5. Also included in this figure are the standard deviations (or root mean square - RMS) of the error in both the X- and Y-axes shown as dashed lines, and the 5 cm standard deviation requirement as dashed cyan lines. Note the errors are not detrended in the RMS calculation. The translational performance Success Criterion is met. Finally, the vertical dashed lines indicate communication packet drops.
In Figure 6 the RMS values should be compared only to the RMS requirement. That is, only horizontal dashed lines should be compared. For example, at ~990 s the Y error exceeds the -5 cm RMS requirement. Nonetheless, the dashed green and blue lines fall between the cyan RMS requirement lines, and so the 5 cm 1 performance requirement is met. a
Figure 6. Relative Position Error During Performance Regime of Figure 5.
Considering attitudes, Figure 7 shows select inertial positions from Figure 4, the
instantaneous relative position vector, and the instantaneous attitude of each robot. The
attitude is shown by rotating a fixed body vector into the inertial frame via the
instantaneous attitude recorded in telemetry. With reference to Figure 2, the body vector
for each robot is the vector from the center of a robot to its white thruster cluster. Hence
JPL Publication 08-11
15
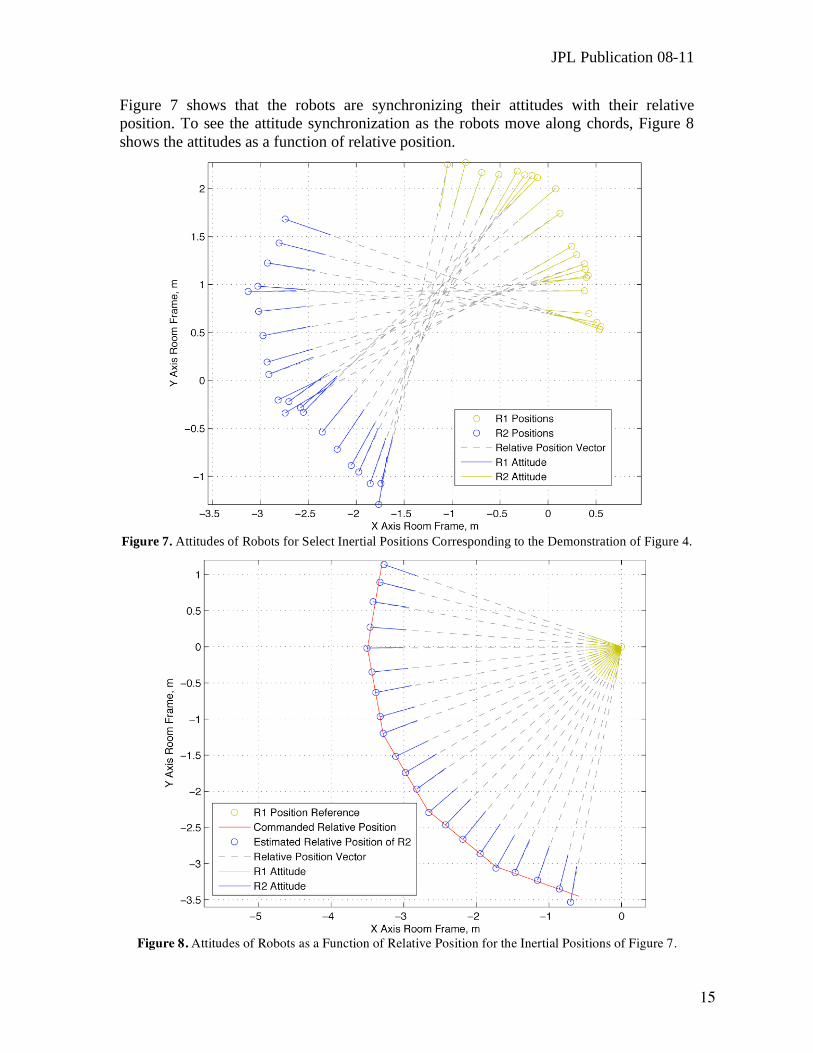
Figure 7 shows that the robots are synchronizing their attitudes with their relative
position. To see the attitude synchronization as the robots move along chords, Figure 8
shows the attitudes as a function of relative position.
Figure 7. Attitudes of Robots for Select Inertial Positions Corresponding to the Demonstration of Figure 4.
Figure 8. Attitudes of Robots as a Function of Relative Position for the Inertial Positions of Figure 7.

TPF-I Technology Milestone #2 Report
16
Similar to the translational analysis, Figure 9 shows the Follower’s attitude errors versus time, which are used to calculate the error RMS for the Success Criteria. The attitude errors per axis are the angles that a robot must rotate about each respective axis to reach the commanded attitude. RMS values for the Follower’s attitude errors over the performance regime and the required RMS value are also shown in Figure 9. Again, only horizontal dashed lines should be compared for evaluating Success Criteria. For example, even though the X- and Y-axis errors often exceed the 6.7 arcmin RMS requirement line (the cyan dashed line), the Follower meets its performance requirement since the blue and green dashed lines fall within the dashed cyan lines. The vertical dashed lines indicate packet drops. To evaluate Success Criterion 5.3, Rotational Control Performance, a similar plot is generated for the Leader’s attitude as well. If both the Leader and Follower meet the attitude error RMS requirements, then the criterion is met. Note that packet drops do not affect the Leader, and so packet drops are not shown in Leader performance figures.
Figure 9. Follower Attitude Error During Performance Regime of Figure 5. Finally, for calculating Success Criteria 5.1, the following guidance verification trajectories are used. These trajectories are developed to ensure the formation guidance software is generating commands corresponding to a synchronized rotation. The relative position (i.e., translational) trajectory is shown in Figure 10. This example shows four,
= 40 deg chords. The trajectory consists of (i) initial and final acceleration stages, shown in green, to start and stop the formation from rest, (ii) constant speed portions, shown in black, along chords, and (iii) constant speed, rounded corners, shown in blue,

JPL Publication 08-11
17
effected by constant normal acceleration. The acceleration stages, both tangential in green and normal in blue, use the maximum translational acceleration for path planning, which is a parameter specified within the guidance software. For these demonstrations it is 3 mm/s2. The chord coasting speed and the unique turn radius r are solved for given the maximum acceleration, the angular chord width, the inter-robot separation b, and the maneuver time T. The resulting speed is approximately 5 mm/s for both angular chord widths.
Figure 10. Construction of Relative Position Verification Trajectory. The quantity r is the turn radius for transitioning between chords. Figure 11 compares the commanded trajectory from corrected telemetry with the verification trajectory at the start and at the first chord transition. The acceleration phase can be seen during which the distance between subsequent positions grows. The rounded corner can also be seen. For scale, the length of rounded corner (the blue portions in Figure 10) is 3 mm.
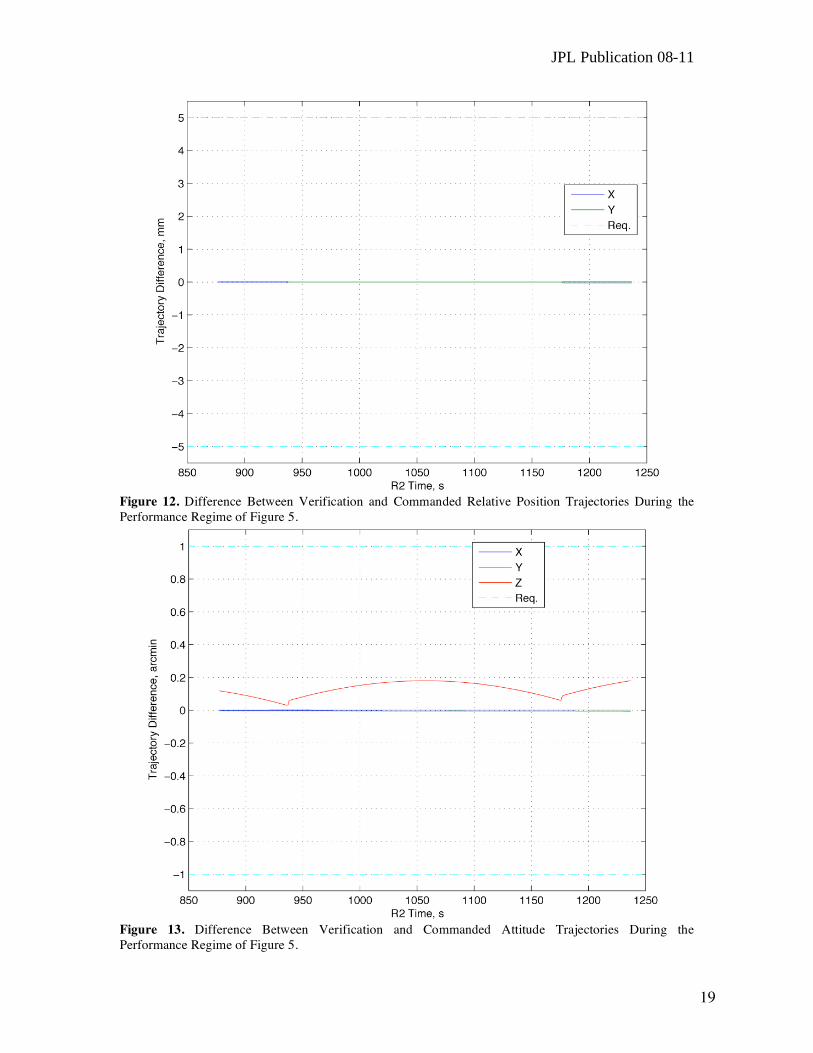
Figure 12 shows the difference between the commanded and verification trajectories as a function of time over the performance regime as well as the requirements for Criterion 5.1. The requirements for this criterion are absolute, not RMS. That is, the differences between the verification and the commanded trajectory must lie between the required bounds. Here the paths agree to the 0.1 mm-level.
The attitude verification trajectory is derived from the translational verification trajectory. At each time step, the verification attitude is the attitude needed to point the fixed, reference body vector along the relative position vector (of the verification trajectory). Figure 13 shows the difference between the commanded and verification attitude trajectories versus time. The differences, especially the notable hops at the chord transitions, are due to the guidance software using a “turn smoothing algorithm” that

TPF-I Technology Milestone #2 Report
18
reduces transients by completing turns on control cycle boundaries.3 Nonetheless, the requirement of agreeing to ±1 arcmin is met.
Figure 11. Comparison of Verification and Commanded Relative Position Trajectories at Start (Upper) and
at First Chord Transition (Lower). Acceleration phase and rounded corners can be seen.
3 Control cycles are cued by an interrupt to the on-board processor, which is in turn cued by the processor’s timing chip. Currently, an interrupt is sent every one second. Thus, the duration of the digital control cycle is one second. Once the formation control software runs, its process sleeps until the next interrupt. Telemetry is sent every cycle that includes the on-board time (from the timing chip) at interrupt receipt.
JPL Publication 08-11
19
Figure 12. Difference Between Verification and Commanded Relative Position Trajectories During the Performance Regime of Figure 5.
Figure 13. Difference Between Verification and Commanded Attitude Trajectories During the Performance Regime of Figure 5.
TPF-I Technology Milestone #2 Report
20
6.2. Demonstration Results and Success Criteria Satisfaction
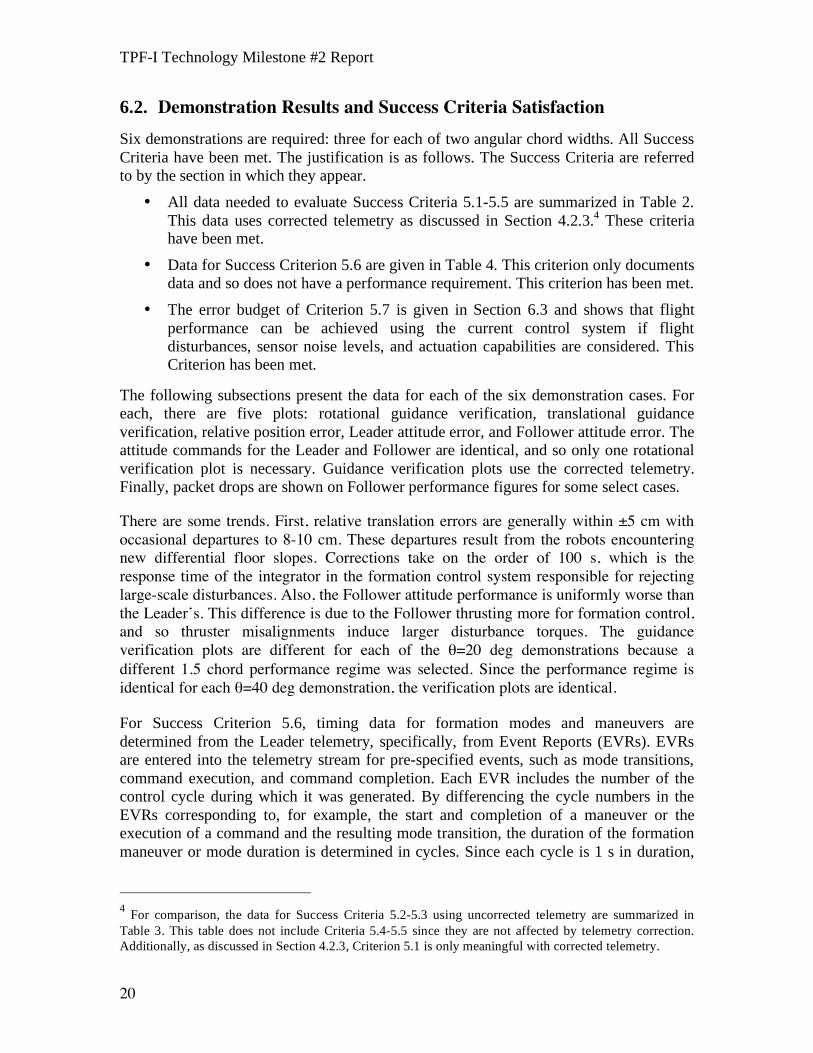
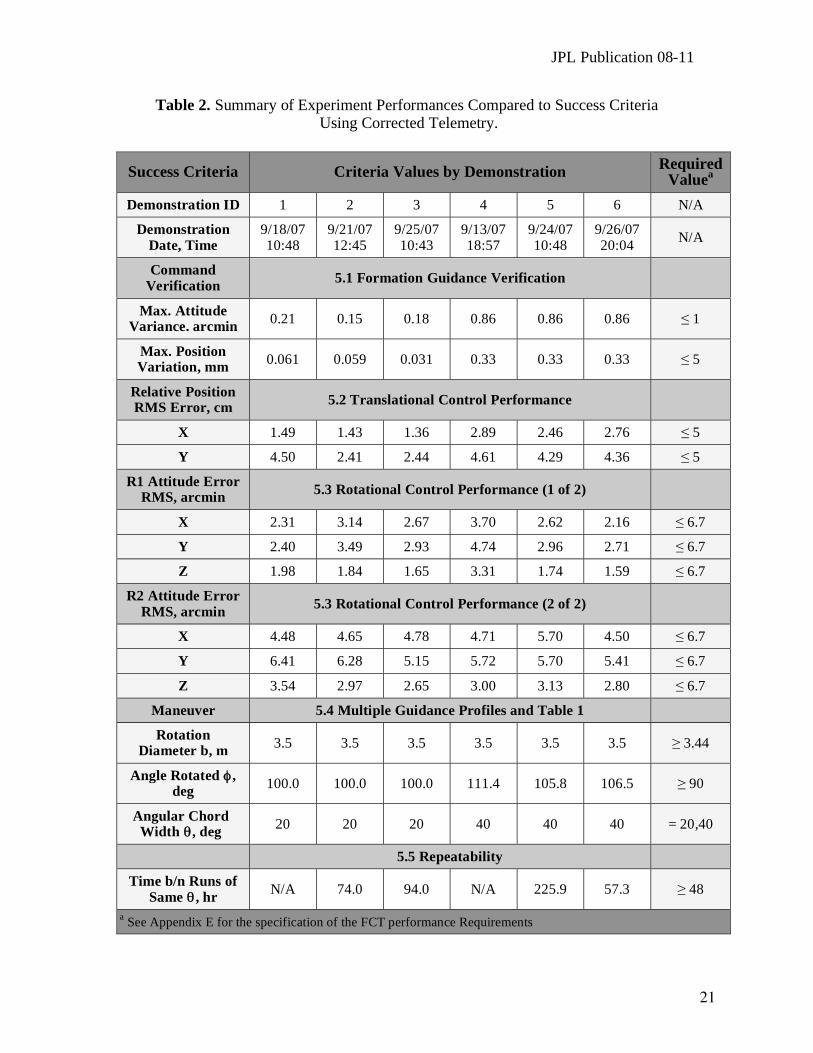
Six demonstrations are required: three for each of two angular chord widths. All Success
Criteria have been met. The justification is as follows. The Success Criteria are referred
to by the section in which they appear.
• All data needed to evaluate Success Criteria 5.1-5.5 are summarized in Table 2.
This data uses corrected telemetry as discussed in Section 4.2.3.4 These criteria
have been met.
• Data for Success Criterion 5.6 are given in Table 4. This criterion only documents
data and so does not have a performance requirement. This criterion has been met.
• The error budget of Criterion 5.7 is given in Section 6.3 and shows that flight
performance can be achieved using the current control system if flight
disturbances, sensor noise levels, and actuation capabilities are considered. This
Criterion has been met.
The following subsections present the data for each of the six demonstration cases. For
each, there are five plots: rotational guidance verification, translational guidance
verification, relative position error, Leader attitude error, and Follower attitude error. The
attitude commands for the Leader and Follower are identical, and so only one rotational
verification plot is necessary. Guidance verification plots use the corrected telemetry.
Finally, packet drops are shown on Follower performance figures for some select cases.
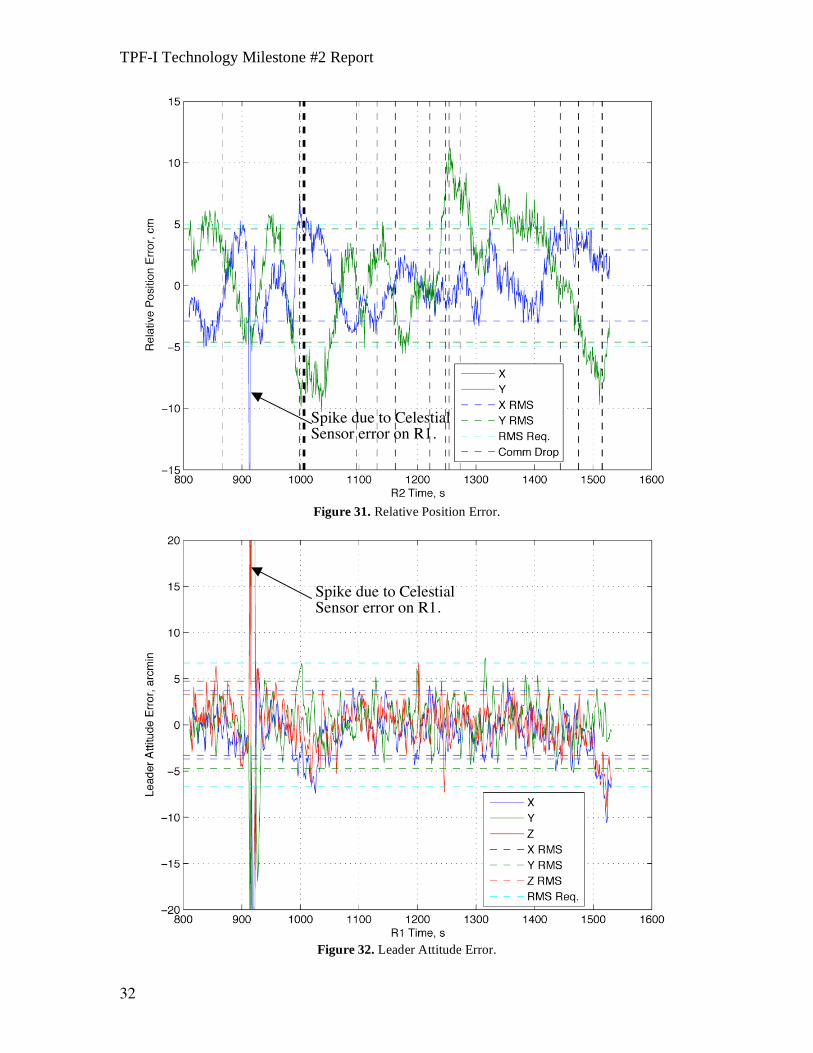
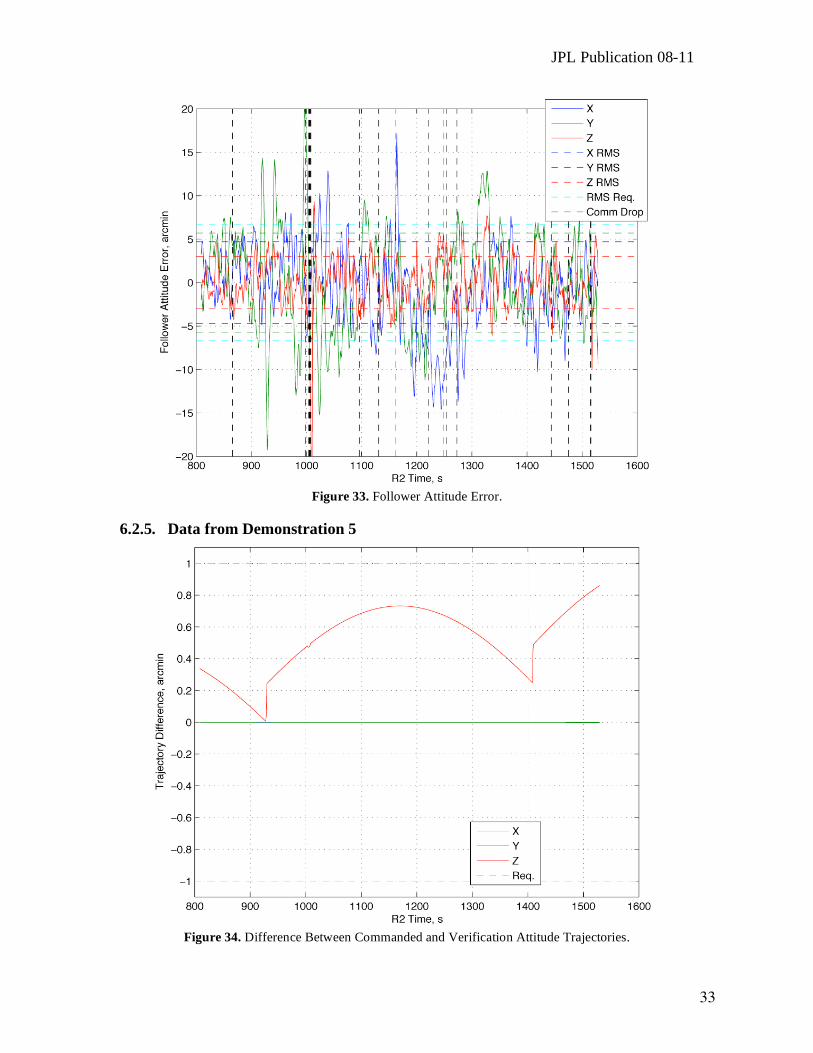
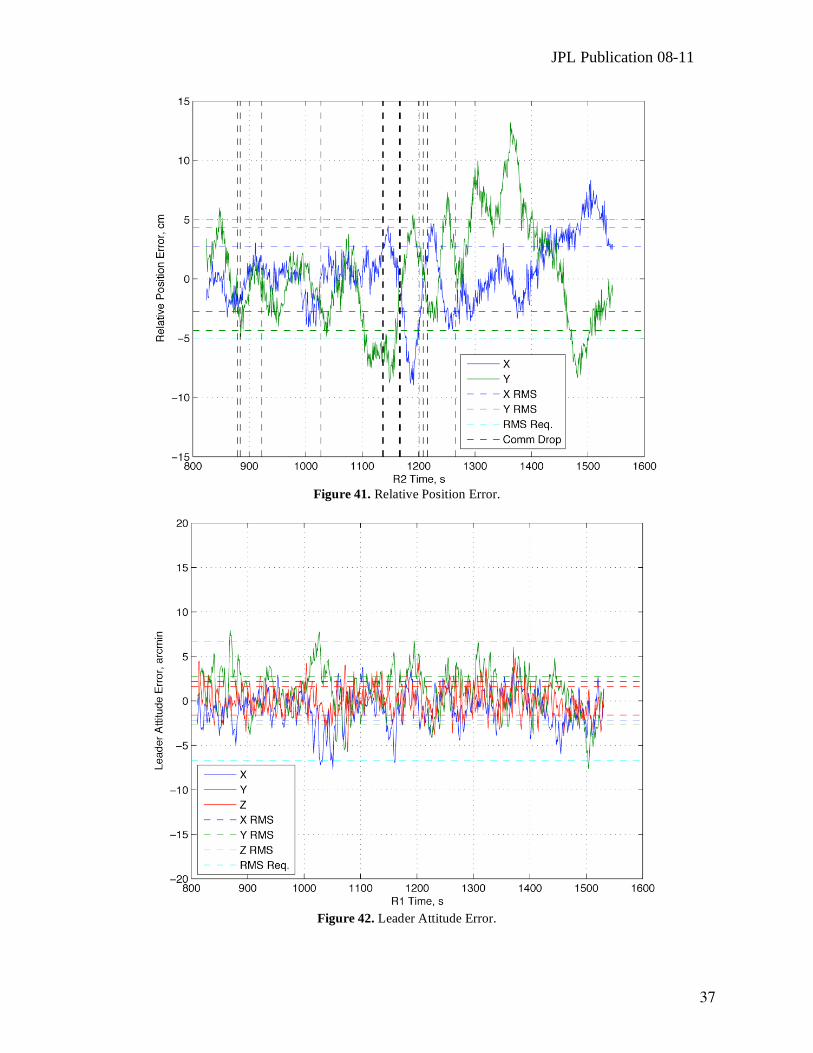
There are some trends. First, relative translation errors are generally within ±5 cm with occasional departures to 8-10 cm. These departures result from the robots encountering new differential floor slopes. Corrections take on the order of 100 s, which is the response time of the integrator in the formation control system responsible for rejecting large-scale disturbances. Also, the Follower attitude performance is uniformly worse than the Leader’s. This difference is due to the Follower thrusting more for formation control, and so thruster misalignments induce larger disturbance torques. The guidance verification plots are different for each of the =20 deg demonstrations because a different 1.5 chord performance regime was selected. Since the performance regime is identical for each =40 deg demonstration, the verification plots are identical.
For Success Criterion 5.6, timing data for formation modes and maneuvers are
determined from the Leader telemetry, specifically, from Event Reports (EVRs). EVRs
are entered into the telemetry stream for pre-specified events, such as mode transitions,
command execution, and command completion. Each EVR includes the number of the
control cycle during which it was generated. By differencing the cycle numbers in the
EVRs corresponding to, for example, the start and completion of a maneuver or the
execution of a command and the resulting mode transition, the duration of the formation
maneuver or mode duration is determined in cycles. Since each cycle is 1 s in duration,
4 For comparison, the data for Success Criteria 5.2-5.3 using uncorrected telemetry are summarized in
Table 3. This table does not include Criteria 5.4-5.5 since they are not affected by telemetry correction.
Additionally, as discussed in Section 4.2.3, Criterion 5.1 is only meaningful with corrected telemetry.
JPL Publication 08-11
21
Table 2. Summary of Experiment Performances Compared to Success Criteria Using Corrected Telemetry.
Success Criteria Criteria Values by Demonstration Required
Valuea
Demonstration ID 1 2 3 4 5 6 N/A
Demonstration Date, Time
9/18/07 10:48
9/21/07 12:45
9/25/07 10:43
9/13/07 18:57
9/24/07 10:48
9/26/07 20:04
N/A
Command Verification
5.1 Formation Guidance Verification
Max. Attitude Variance. arcmin
0.21 0.15 0.18 0.86 0.86 0.86 1
Max. Position Variation, mm
0.061 0.059 0.031 0.33 0.33 0.33 5
Relative Position RMS Error, cm
5.2 Translational Control Performance
X 1.49 1.43 1.36 2.89 2.46 2.76 5
Y 4.50 2.41 2.44 4.61 4.29 4.36 5
R1 Attitude Error RMS, arcmin
5.3 Rotational Control Performance (1 of 2)
X 2.31 3.14 2.67 3.70 2.62 2.16 6.7
Y 2.40 3.49 2.93 4.74 2.96 2.71 6.7
Z 1.98 1.84 1.65 3.31 1.74 1.59 6.7
R2 Attitude Error RMS, arcmin
5.3 Rotational Control Performance (2 of 2)
X 4.48 4.65 4.78 4.71 5.70 4.50 6.7
Y 6.41 6.28 5.15 5.72 5.70 5.41 6.7
Z 3.54 2.97 2.65 3.00 3.13 2.80 6.7
Maneuver 5.4 Multiple Guidance Profiles and Table 1
Rotation Diameter b, m
3.5 3.5 3.5 3.5 3.5 3.5 3.44
Angle Rotated , deg
100.0 100.0 100.0 111.4 105.8 106.5 90
Angular Chord Width , deg
20 20 20 40 40 40 = 20,40
5.5 Repeatability
Time b/n Runs of Same , hr
N/A 74.0 94.0 N/A 225.9 57.3 48
a See Appendix E for the specification of the FCT performance Requirements

TPF-I Technology Milestone #2 Report
22
Table 3. Summary of Experiment Performances Compared to Success Criteria Using
Uncorrected Telemetry.
Success Criteria Criteria Values by Demonstration Required
Value
Demonstration ID 1 2 3 4 5 6 N/A
Demonstration
Date, Time
9/18/07
10:48
9/21/07
12:45
9/25/07
10:43
9/13/07
18:57
9/24/07
10:48
9/26/07
20:04 N/A
Relative Position
RMS Error, cm 5.2 Translational Control Performance
X 1.49 1.44 1.39 2.88 2.47 2.75 5
Y 4.49 2.40 2.44 4.59 4.27 4.36 5
R1 Attitude Error
RMS, arcmin 5.3 Rotational Control Performance (1 of 2)
X 2.29 3.13 2.67 3.68 2.63 2.16 6.7
Y 2.40 3.49 2.92 4.74 2.96 2.71 6.7
Z 1.97 1.84 1.65 3.29 1.75 1.57 6.7
R2 Attitude Error
RMS, arcmin 5.3 Rotational Control Performance (2 of 2)
X 4.48 4.65 4.78 4.70 5.69 4.49 6.7
Y 6.32 6.28 5.15 5.72 5.64 5.38 6.7
Z 3.63 3.11 2.73 2.99 3.23 2.83 6.7
Table 4. Formation Timing.
Mode or
Maneuver
Duration, s
(Commanded Duration if Applicable)
Average
Std
Demo ID 1 2 3 4 5 6 N/A
Formation
Initialization 12 22 25 20 29 23
21.8
5.7
Formation
Retarget
31
(30)
31
(30)
31
(30)
31
(30)
31
(30)
31
(30)
31
0
Synchronized
Rotation
1201
(1200)
1201
(1200)
1201
(1200)
NC
(1440)
NC
(1440)
NC
(1440)
Cmd+1
0
NC = Not Completed Cmd = Commanded Duration
JPL Publication 08-11
23
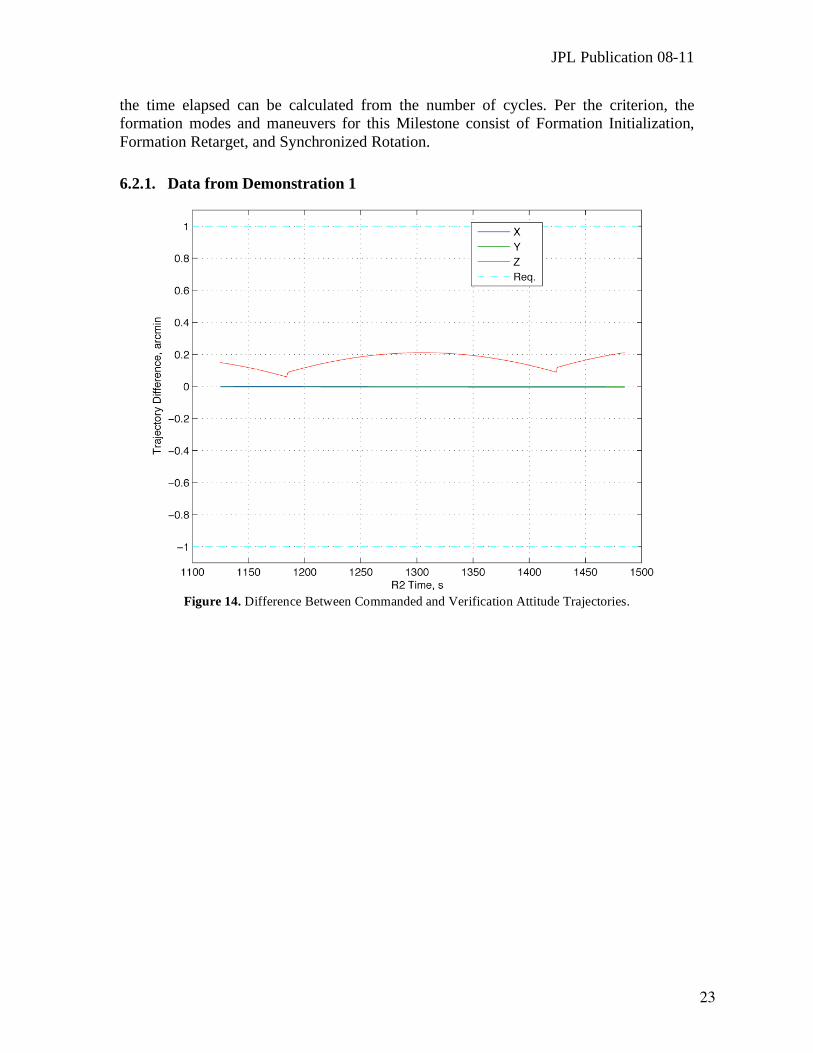
the time elapsed can be calculated from the number of cycles. Per the criterion, the
formation modes and maneuvers for this Milestone consist of Formation Initialization,
Formation Retarget, and Synchronized Rotation.
6.2.1. Data from Demonstration 1
Figure 14. Difference Between Commanded and Verification Attitude Trajectories.

TPF-I Technology Milestone #2 Report
24
Figure 15. Difference Between Commanded and Verification Relative Position Trajectories.
Figure 16. Relative Position Error.
JPL Publication 08-11
25
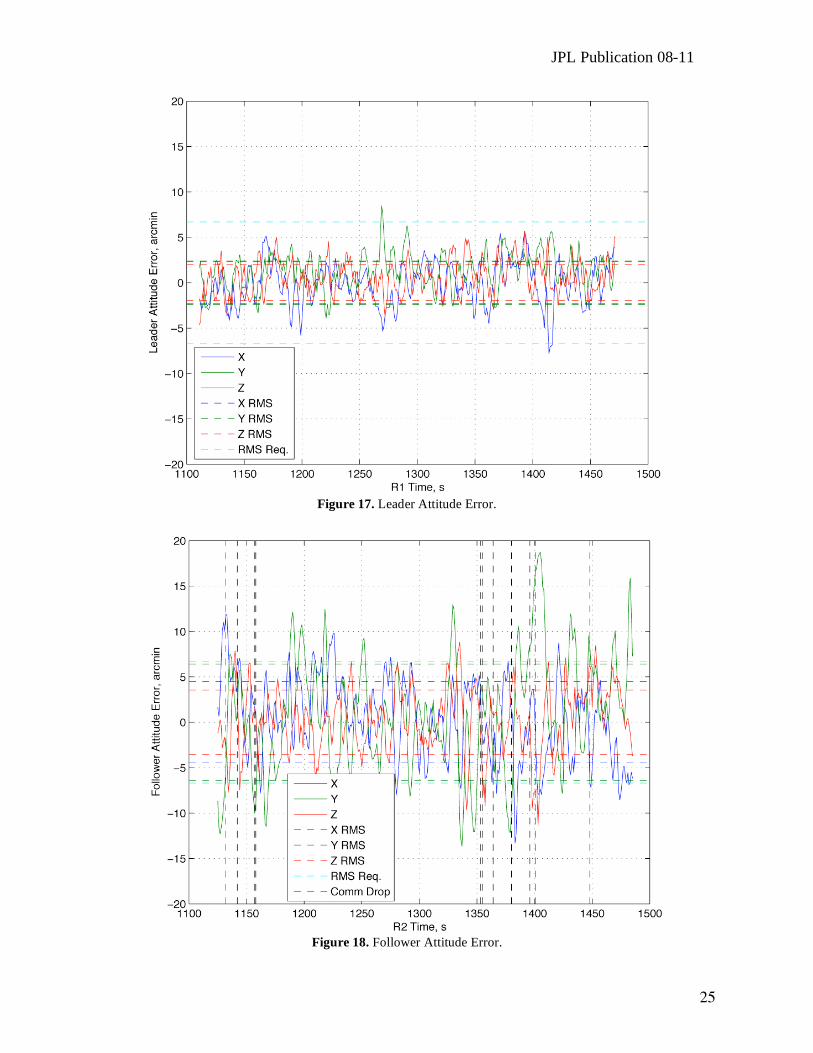
Figure 17. Leader Attitude Error.
Figure 18. Follower Attitude Error.

TPF-I Technology Milestone #2 Report
26
6.2.2. Data from Demonstration 2
Figure 19. Difference Between Commanded and Verification Attitude Trajectories.
Figure 20. Difference Between Commanded and Verification Relative Position Trajectories.

JPL Publication 08-11
27
Figure 21. Relative Position Error.
Figure 22. Leader Attitude Error.
Spikes due to Celestial Sensor error on R1.
Spikes due to Celestial Sensor error on R1.

TPF-I Technology Milestone #2 Report
28
Figure 23. Follower Attitude Error.
6.2.3. Data from Demonstration 3
Figure 24. Difference Between Commanded and Verification Attitude Trajectories.

JPL Publication 08-11
29
Figure 25. Difference Between Commanded and Verification Relative Position Trajectories.
Figure 26. Relative Position Error.
TPF-I Technology Milestone #2 Report
30
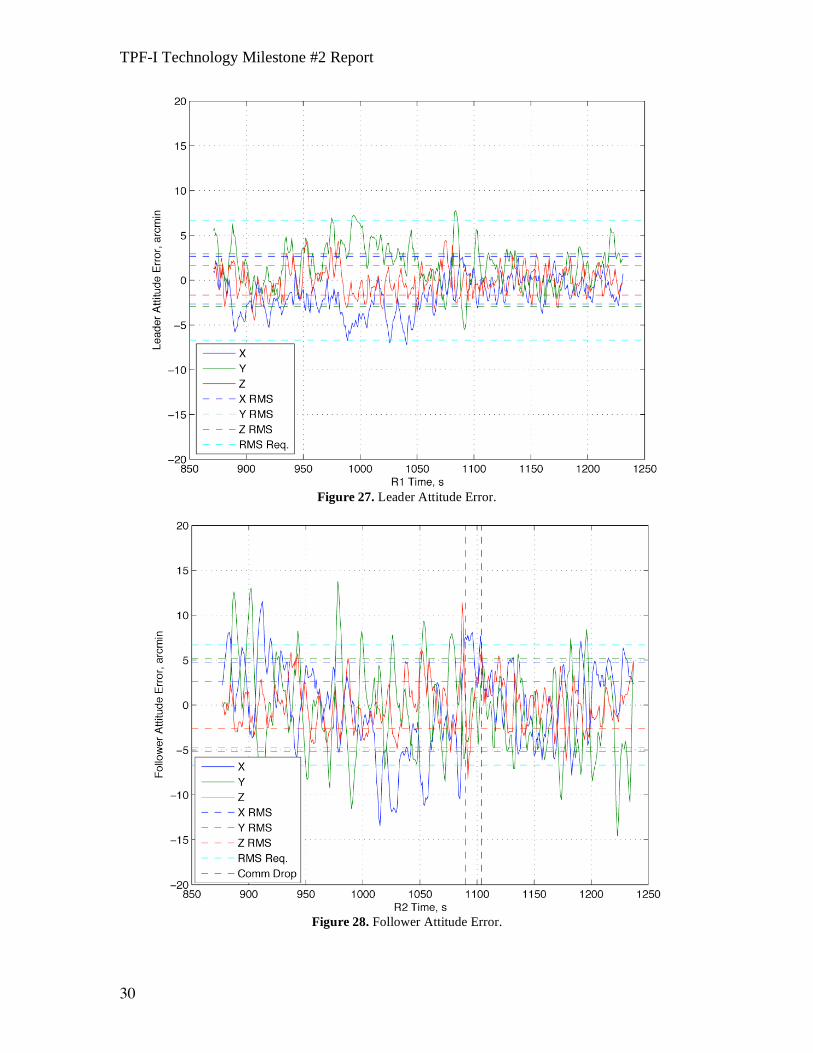
Figure 27. Leader Attitude Error.
Figure 28. Follower Attitude Error.
JPL Publication 08-11
31
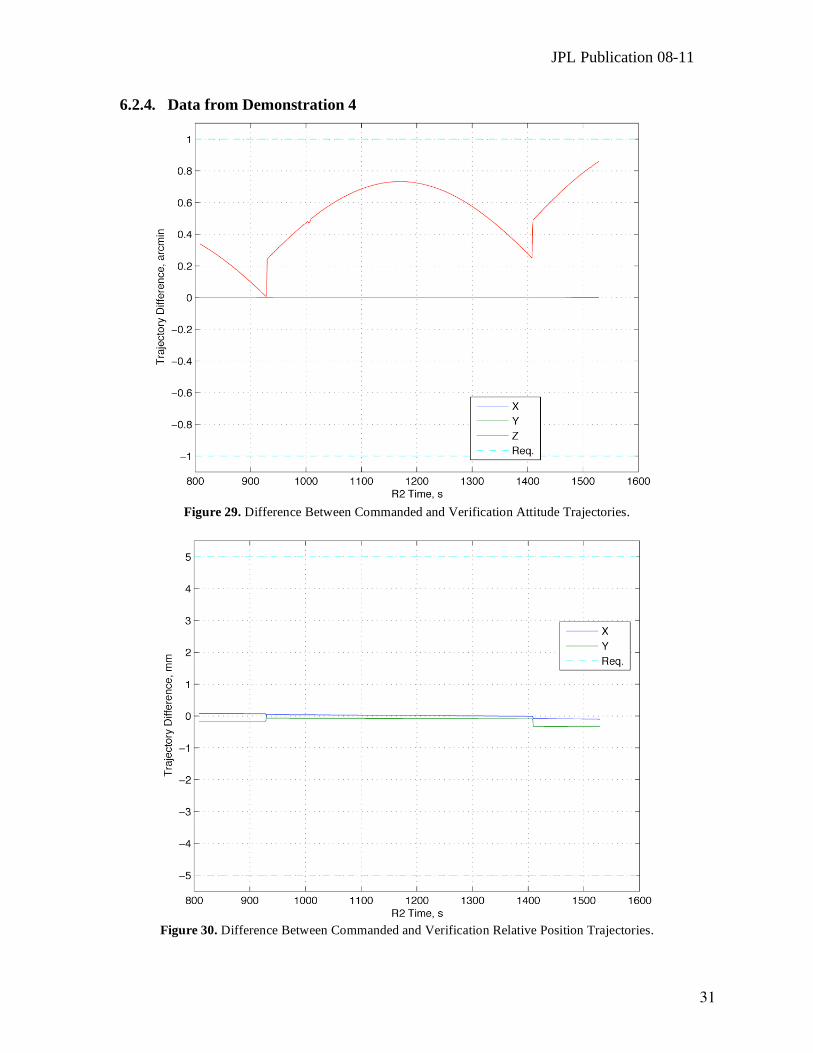
6.2.4. Data from Demonstration 4
Figure 29. Difference Between Commanded and Verification Attitude Trajectories.
Figure 30. Difference Between Commanded and Verification Relative Position Trajectories.
TPF-I Technology Milestone #2 Report
32
Figure 31. Relative Position Error.
Figure 32. Leader Attitude Error.
Spike due to Celestial Sensor error on R1.
Spike due to Celestial Sensor error on R1.
JPL Publication 08-11
33
Figure 33. Follower Attitude Error.
6.2.5. Data from Demonstration 5
Figure 34. Difference Between Commanded and Verification Attitude Trajectories.

TPF-I Technology Milestone #2 Report
34
Figure 35. Difference Between Commanded and Verification Relative Position Trajectories.
Figure 36. Relative Position Error.

JPL Publication 08-11
35
Figure 37. Leader Attitude Error.
Figure 38. Follower Attitude Error.
TPF-I Technology Milestone #2 Report
36
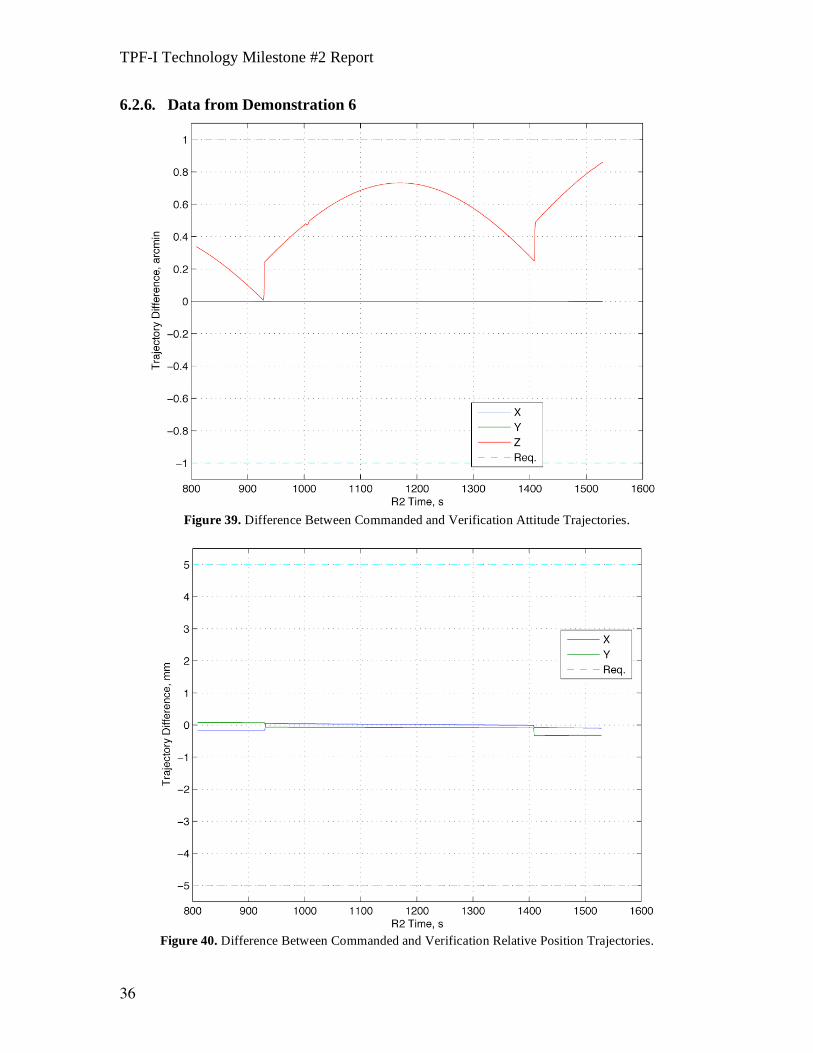
6.2.6. Data from Demonstration 6
Figure 39. Difference Between Commanded and Verification Attitude Trajectories.
Figure 40. Difference Between Commanded and Verification Relative Position Trajectories.
JPL Publication 08-11
37
Figure 41. Relative Position Error.
Figure 42. Leader Attitude Error.

TPF-I Technology Milestone #2 Report
38
Figure 43. Follower Attitude Error.

JPL Publication 08-11
39
6.3. Formation Error Budget
The purpose of the Formation Error Budget is to show traceability from the FCT
demonstrations at the several centimeter- and several arcminute-level to TPF-I flight
requirements at the sub-centimeter and sub-arcminute-level. The approach taken for this
Success Criterion is to:
• Identify the key control system parameters,
• Develop a control system simulation environment as a function of these key
parameters,
• Show that the simulation environment can qualitatively and quantitatively
reproduce the FCT demonstrations for parameter values corresponding to the
FCT, and
• Change the parameters to flight values and show the TPF-I flight requirements are
satisfied.
The same control laws are used in both the FCT and TPF-I simulations. Therefore, by
following this procedure, a direct link is shown between FCT performance and TPF-I
performance by simply varying the key parameters from FCT values to TPF-I values.
Table 5 shows the key parameters and their values for the FCT and a representative TPF-
I flight design (Scharf et al., 2004).
Table 5. Key Parameters and Values for FCT/TPF-I Error Budget Simulation.
Parameter / Value FCT TPF-I Notes
Mass, kg 365 879
Inertia, kg m2 14 2800 Approximate maximum values.
Relative Sensor Noise, mm 1 9 1
Attitude Sensor Noise, arcsec 1 120 5
Thruster Magnitude, N 1 0.075 TPF-I thruster still being determined. A 50-100 mN capability was initially baselined.
Thruster Minimum On-Time, ms 10 1
Thruster Directional Misalignment, deg
7 0.017 Over expansion in FCT thruster nozzle causes misalignment up to 10 deg. Calibration reduces effect in a plane; variation out of plane remains.
Vehicle Separation b, m 3.5 80
Formation Rotate Rate , arcmin/s
5 0.5 0.3 arcmin/s used in TPF-I simulations since TPF-I acceleration necessitates guidance algorithm with multi-chord acceleration profile.
Angular Chord Width , deg 20, 40 0.5
Disturbance Magnitude, N 0.72 0.0005 FCT can have up to 0.008” of differential floor slope. TPF-I has differential solar pressure.
TPF-I Technology Milestone #2 Report
40
A simulation environment was developed by extending previous work on TPF-I
performance analysis (Scharf et al., 2004). The extended environment includes:
• Rigid body dynamics assuming the spacecraft are in deep space, which also
describes the FCT dynamics,
• Sensor models that add Gaussian noise of the appropriate standard deviations,
• Guidance trajectories from the FCT software,
• Control laws identical to the FCT demonstration control laws,5
• The thruster geometry of the FCT, which is representative of a TPF-I flight
design,
• A thrust allocation algorithm that converts forces and torques into thruster on-
times,
• Actuator models that include minimum thruster on-time and directional
misalignments,
• Disturbance models that either emulate floor slope variations or differential solar
pressure.
For this analysis, the thruster performance is assumed to not degrade over the duration of
a simulation. For flight implementation, performance should be evaluated for thruster
performance at beginning and end of mission life. However, one advantage of ion
thrusters is that force level can be maintained even with thruster degradation (Sengupta et
al. 2004). The cost is reduced fuel efficiency on the order of 10-20%, which affects
resource budgets and not formation performance. Nonetheless, for whatever thruster is
eventually selected, performance must be demonstrated at beginning and end of mission
life. This necessity is documented in Section 7.1. In addition, thruster plumes are
assumed to not interact with the spacecraft. Thruster plume interactions have been shown
to be negligible due to careful design of thrust directions (e.g., out of the collector plane)
and the use of ion thrusters, which have 10-15 deg. divergence angles (Martin et al.
2008). However, in future design iterations, plume non-interaction must be verified.
In the current environment, communication is error free. The FCT disturbance model
consists of differential slopes to apply in each 20 s interval during a simulation. Since the
levelness of the flat floor varies by up to 0.0004 in, differential floor slope varies between
±0.0008 in. An optimization algorithm fits the differential floor slope magnitude to the
observed formation flying errors of an FCT demonstration within this ±0.0008 in. range.
All simulations use the same seed for generating sensor noise, and so sensor noise is
identical from run to run.
The next sequence of figures shows the translational and rotational performance from
Demonstration 3 and the output of the FCT simulation error budget.
5 The control law outputs are multiplied by either mass or inertia, and so depending on the vehicle model, the forces and torques applied are appropriately scaled.

JPL Publication 08-11
41
Figure 44. Relative Position Error from Demonstration 3.
Figure 45. Simulated FCT Relative Position Error After Disturbance Fit Optimization.

TPF-I Technology Milestone #2 Report
42
Figure 46. Leader Attitude Error From Demonstration 3.
Figure 47. Simulated FCT Leader Attitude Error.
JPL Publication 08-11
43
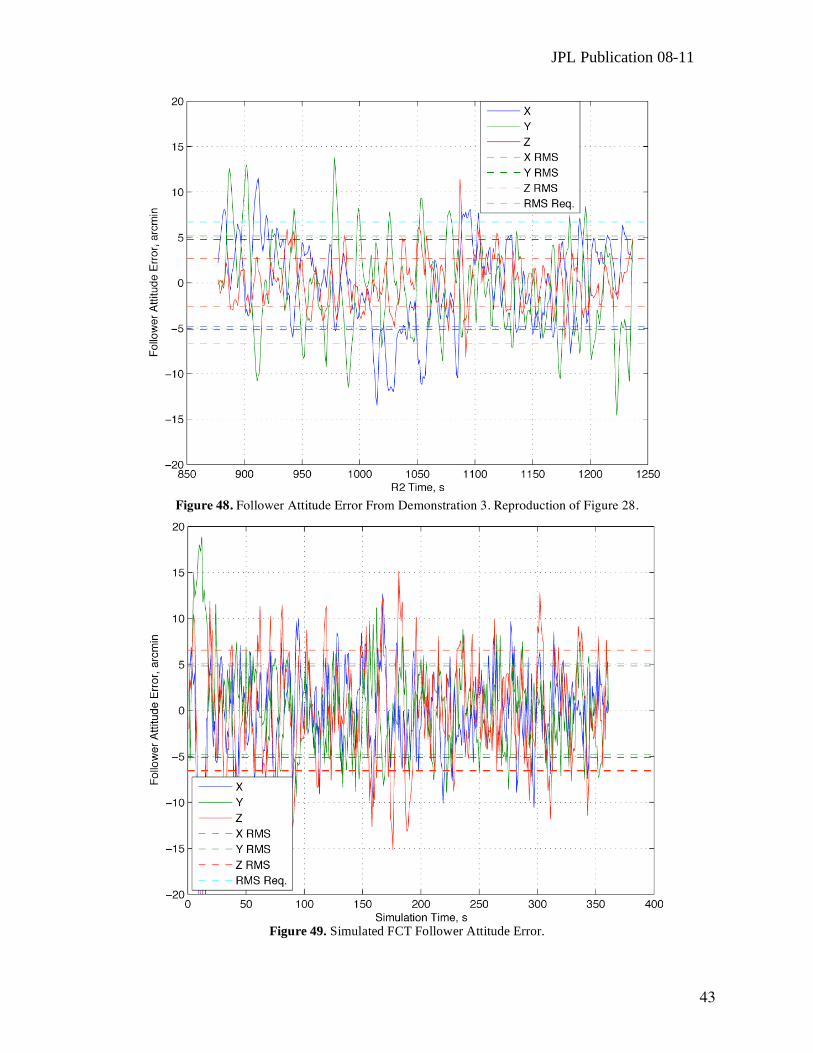
Figure 48. Follower Attitude Error From Demonstration 3. Reproduction of Figure 28.
Figure 49. Simulated FCT Follower Attitude Error.

TPF-I Technology Milestone #2 Report
44
The relative position error agreement is excellent. While the attitude errors agree in magnitude, the simulated errors have higher frequency content. Agreement can be improved in future analyses by including the center-of-mass offset of the FCT attitude stage and reducing attitude sensor noise in the simulation. However, note that a 7 deg thruster direction misalignment captures the difference in the attitude tracking errors between the Leader and Follower. To show that the FCT simulation environment captures the relevant parameters across FCT demonstrations, the simulation environment was also applied to Demonstration 5. The next two figures show the agreement of the relative position error after fitting the disturbance. The attitude errors are similar to the previous cases.
Figure 50. Relative Position Error from Demonstration 3.
Figure 51. Simulated FCT Relative Position Error After Disturbance Fit Optimization.
JPL Publication 08-11
45
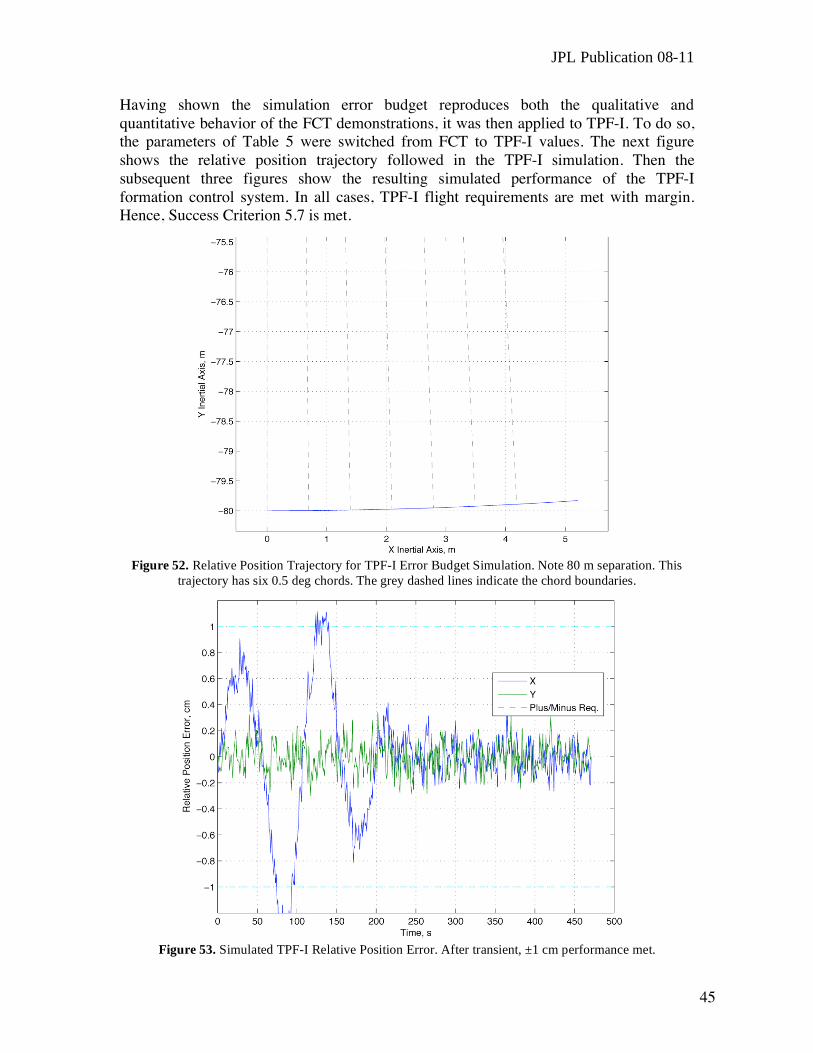
Having shown the simulation error budget reproduces both the qualitative and quantitative behavior of the FCT demonstrations, it was then applied to TPF-I. To do so, the parameters of Table 5 were switched from FCT to TPF-I values. The next figure shows the relative position trajectory followed in the TPF-I simulation. Then the subsequent three figures show the resulting simulated performance of the TPF-I formation control system. In all cases, TPF-I flight requirements are met with margin. Hence, Success Criterion 5.7 is met.
Figure 52. Relative Position Trajectory for TPF-I Error Budget Simulation. Note 80 m separation. This
trajectory has six 0.5 deg chords. The grey dashed lines indicate the chord boundaries.
Figure 53. Simulated TPF-I Relative Position Error. After transient, ±1 cm performance met.

TPF-I Technology Milestone #2 Report
46
Figure 54. Simulated TPF-I Leader Attitude Error. After transient, ±1 arcmin performance met.
Figure 55. Simulated TPF-I Follower Attitude Error. After transient, ±1 arcmin performance met.

JPL Publication 08-11
47
7. Summary
This document has reported the achievement of TPF-I Technology Milestone #2. The
milestone Success Criteria and demonstration procedures from the Milestone White
Paper were reviewed, a demonstration narrative was given for context, and then the
demonstration results and analyses were presented. As shown, all the Success Criteria
have been met, and we conclude that the TPF-I Technology Milestone #2 has been
demonstrated. Per the Technology Plan, future work in the Formation Flying Technology
area will include integrating these results with the overall TPF-I error budget and using
these experimental results to validate the high-fidelity simulation environment that will
be used for on-orbit performance predictions.
7.1. Some Recommendations for Flight Implementation
We highlight some lessons learned in the course of this Milestone.
• Algorithms that use counters for the number of control cycles should calculate
counter value based on time differences, not by incrementing the counter. This
approach is more robust to control cycle slips.
• Continuing the thinking that motivated Success Criterion 5.6, control system
settling times must be accounted for in transitioning a formation from one
maneuver to another.
• Low-level, turn performance-enhancing guidance algorithms should be carefully
evaluated for adverse interactions with high-level attitude guidance algorithms.
• Attitude performance, both tracking error and actuation cost, is sensitive to
thruster misalignments. Improvements in attitude performance can be achieved by
requiring increased thruster calibration.
• Current synchronized rotation algorithms assume sufficient acceleration to reach
coasting speed in one chord. For low-thrust mission designs, the algorithms
should be extended to include acceleration along multiple chords. For example
with two 3 mN MiXI thrusters, a 1000 kg spacecraft, 80 m separation, 0.5
arcmin/s formation rotation speed, and 0.5 deg chords (cf. Table 1), it will take
~1000 s to reach cruise speed, but only 60 s on average to traverse a chord. Such
an advance in guidance capability should simplify the propulsion system.
• The current hybrid guidance scheme provides deterministic inter-spacecraft
communication requirements, that is, the same amount of data is sent each time
step. However, communication errors can reduce performance. Initially
communicating entire guidance plans, and then only communicating
intermittently to coordinate may improve performance in the presence of non-
ideal effects. This guidance approach should be considered if the mission design
necessitates a lower-performance communication system.
• For the eventual actuator suite chosen, precision formation performance must be
evaluated over the entire mission life with the effects of thruster degradation.
Thruster plumes must also be checked for interactions with the spacecraft.
TPF-I Technology Milestone #2 Report
48
8. References
Beichman, C.A., Woolf, N.J., and Lindensmith, C.A., eds., The Terrestrial Planet Finder (TPF): A NASA Origins Program to Search for Habitable Planets, JPL Publication 99-003, Jet Propulsion Laboratory: Pasadena, CA,1999. Available online at http://planetquest.jpl.nasa.gov/TPF/tpf_book/index.cfm.
Lawson, P. R., and Dooley, J. A., eds., Technology Plan for the Terrestrial Planet Finder
Interferometer, JPL Pub 05-5, Jet Propulsion Laboratory: Pasadena, CA, 2005.
Available online at http://planetquest.jpl.nasa.gov/Navigator/library/tpfI414.pdf.
Lurie, B., “Multi-Mode Synchronized Control for Formation Flying Interferometer,” AIAA Guidance, Navigation, and Control Conference, 2003.
Martin, S., Scharf, D.P., Wirz, R., Lay, O., McKinstry, D., Mennesson, B., Purcell, G.,
Rodriguez, J., Scherr, L., Smith, J.R., and Wayne, L., “Design Study for a Planet-Finding Space Interferometer,” accepted for the IEEE Aerospace Conference, March, 2008.
Regehr, M.W., Acikmese, A.B., Ahmed, A., Aung, M., Bailey, R., Bushnell, C., Clark,
K.C., Hicke, A., Lytlel, B., MacNeal, P., Rasmussen, R.E., Shields, J., and Singh, G., “The Formation Control Testbed,” IEEE Aerospace Conference, Big Sky, MT, 2004.
Scharf, D.P., Hadaegh, F.Y., Rahman, Z.R., Shields, J.H., Singh, G., and Wette, M.R.,
“An Overview of the Formation and Attitude Control System for the Terrestrial Planet Finder Formation Flying Interferometer,” 2nd International Symposium on Formation Flying Missions and Technologies, Washington, D.C., September, 2004.
Sengupta, A., Anderson, J. R., Brophy, J. R., Kulleck, J., Garner, C. E., deGroth, K.,
Karniotis, T., Banks, B., and Walters, P., “The 30,000-Hr Life Test of the DS1 Flight Spare Ion Thruster, Final Report,” NASA T/TP 2004-213391, 2004.
JPL Publication 08-11
49
9. Appendices
Appendix A: Table of Acronyms & Abbreviations ATC Absolute Translation Controller, part of ATS ATS Absolute Translation System COTS Commercial Off The Shelf DOF Degree Of Freedom EVR Event Report FACS Formation and Attitude Control System FCT Formation Control Testbed FDC Formation Drift Controller ISC Inter-Spacecraft Communication TPF-I Terrestrial Planet Finder Interferometer
Appendix B: Further Details on COTS Truth Sensors
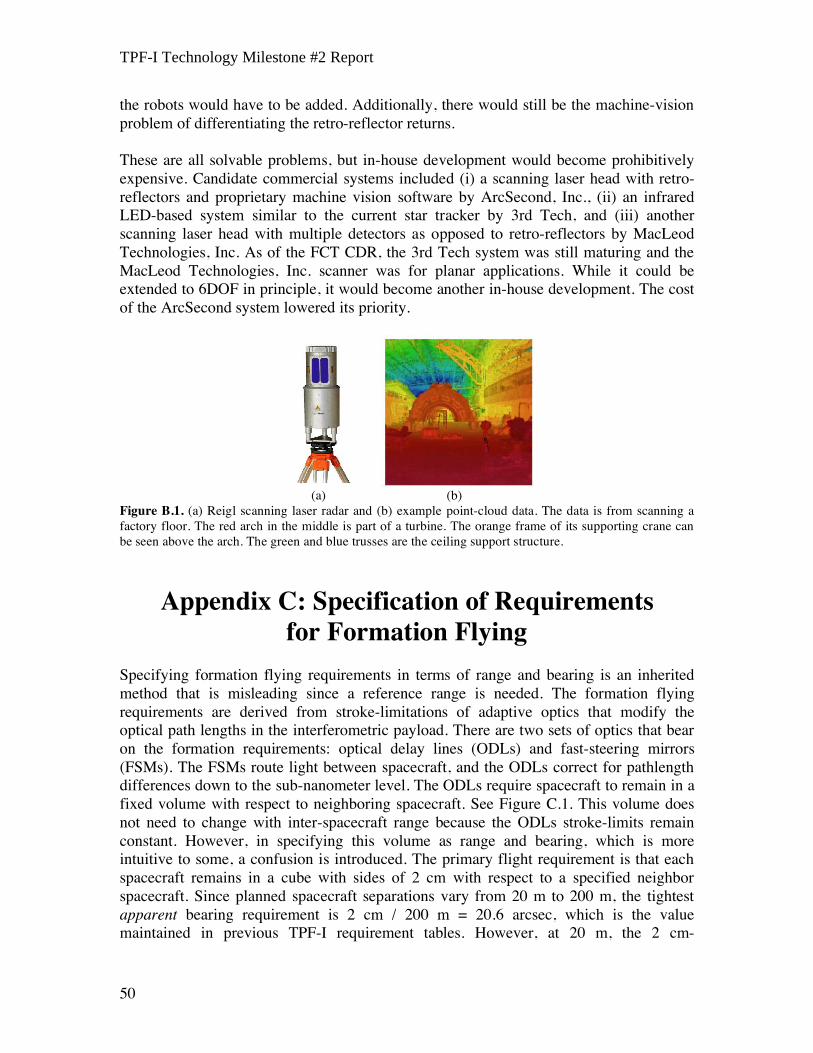
The principal challenge in a truth sensor for the FCT is to obtain 6DOF information with sub-centimeter and arcminute-level accuracy over a dynamic range of 7 meters. If the robots remained in the same positions with only tens of centimeters variations, a test stand as is used for JWST would be applicable. Other, 3DOF formation flying testbeds with appreciable dynamic ranges have used GPS pseudo-lites and ceiling-mounted camera systems. These two systems are significantly simplified by the 3DOF nature of these testbeds: they only need to sense planar position and scalar attitude, which makes the, say, colored LEDs in the camera frame a straightforward transformation of their pixel position. Camera systems were ruled-out since the achievable accuracy for a given complexity/cost was not feasible for our 6 DOF application; consider MSFC’s AVGS and StarVision’s VisNav products which achieve ~1 cm position but only 1 degree in attitude. The accuracy of RF-based sensing systems (including pseudo-lites) is limited in the FCT due to multi-path from the metallic floor. Ultrasound-based systems are corrupted by thruster firings. Capacitive sensing is clearly not applicable. Hence, a laser-based system must be used. There are two general types of laser-based distance measuring equipment: point-to-point interferometers such as the HP 5527A and point cloud-producing laser surveyors such as the Reigl Laser Radar (see Figure B.1). Estimating position and attitude from point clouds is a complex machine vision problem. Point-to-point interferometers do not have an appreciable FOV, and so steering mirrors and control loops to track retro-reflectors on
TPF-I Technology Milestone #2 Report
50
the robots would have to be added. Additionally, there would still be the machine-vision problem of differentiating the retro-reflector returns. These are all solvable problems, but in-house development would become prohibitively expensive. Candidate commercial systems included (i) a scanning laser head with retro-reflectors and proprietary machine vision software by ArcSecond, Inc., (ii) an infrared LED-based system similar to the current star tracker by 3rd Tech, and (iii) another scanning laser head with multiple detectors as opposed to retro-reflectors by MacLeod Technologies, Inc. As of the FCT CDR, the 3rd Tech system was still maturing and the MacLeod Technologies, Inc. scanner was for planar applications. While it could be extended to 6DOF in principle, it would become another in-house development. The cost of the ArcSecond system lowered its priority.
(a) (b)
Figure B.1. (a) Reigl scanning laser radar and (b) example point-cloud data. The data is from scanning a factory floor. The red arch in the middle is part of a turbine. The orange frame of its supporting crane can be seen above the arch. The green and blue trusses are the ceiling support structure.
Appendix C: Specification of Requirements for Formation Flying
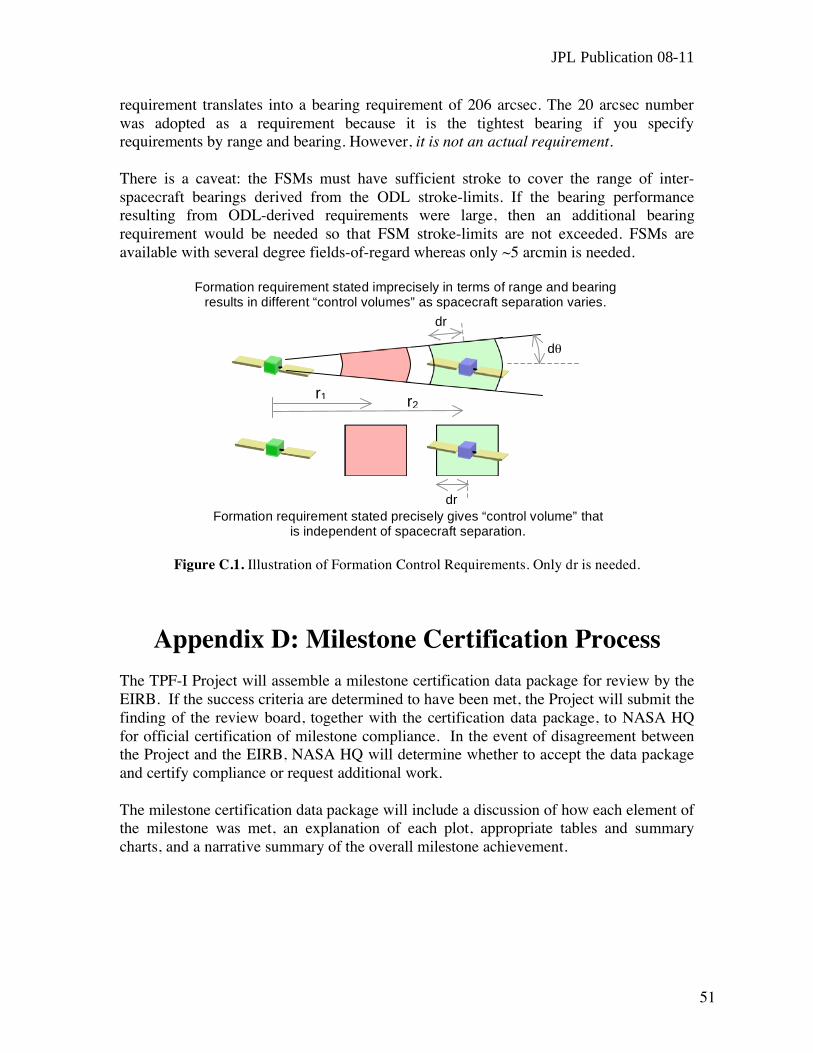
Specifying formation flying requirements in terms of range and bearing is an inherited method that is misleading since a reference range is needed. The formation flying requirements are derived from stroke-limitations of adaptive optics that modify the optical path lengths in the interferometric payload. There are two sets of optics that bear on the formation requirements: optical delay lines (ODLs) and fast-steering mirrors (FSMs). The FSMs route light between spacecraft, and the ODLs correct for pathlength differences down to the sub-nanometer level. The ODLs require spacecraft to remain in a fixed volume with respect to neighboring spacecraft. See Figure C.1. This volume does not need to change with inter-spacecraft range because the ODLs stroke-limits remain constant. However, in specifying this volume as range and bearing, which is more intuitive to some, a confusion is introduced. The primary flight requirement is that each spacecraft remains in a cube with sides of 2 cm with respect to a specified neighbor spacecraft. Since planned spacecraft separations vary from 20 m to 200 m, the tightest apparent bearing requirement is 2 cm / 200 m = 20.6 arcsec, which is the value maintained in previous TPF-I requirement tables. However, at 20 m, the 2 cm-
JPL Publication 08-11
51
requirement translates into a bearing requirement of 206 arcsec. The 20 arcsec number was adopted as a requirement because it is the tightest bearing if you specify requirements by range and bearing. However, it is not an actual requirement. There is a caveat: the FSMs must have sufficient stroke to cover the range of inter-spacecraft bearings derived from the ODL stroke-limits. If the bearing performance resulting from ODL-derived requirements were large, then an additional bearing requirement would be needed so that FSM stroke-limits are not exceeded. FSMs are available with several degree fields-of-regard whereas only ~5 arcmin is needed.
Figure C.1. Illustration of Formation Control Requirements. Only dr is needed.
Appendix D: Milestone Certification Process
The TPF-I Project will assemble a milestone certification data package for review by the EIRB. If the success criteria are determined to have been met, the Project will submit the finding of the review board, together with the certification data package, to NASA HQ for official certification of milestone compliance. In the event of disagreement between the Project and the EIRB, NASA HQ will determine whether to accept the data package and certify compliance or request additional work. The milestone certification data package will include a discussion of how each element of the milestone was met, an explanation of each plot, appropriate tables and summary charts, and a narrative summary of the overall milestone achievement.
dr
d
dr
Formation requirement stated imprecisely in terms of range and bearing results in different “control volumes” as spacecraft separation varies.
Formation requirement stated precisely gives “control volume” that is independent of spacecraft separation.
r1 r2

TPF-I Technology Milestone #2 Report
52
Appendix E: Milestone White Paper
The document starts on the next page.

JPL Publication 08-11
53
TERRESTRIAL PLANET FINDER INTERFEROMETER TECHNOLOGY MILESTONE #2 WHITE PAPER FORMATION CONTROL PERFORMANCE DEMONSTRATION
May 25, 2007
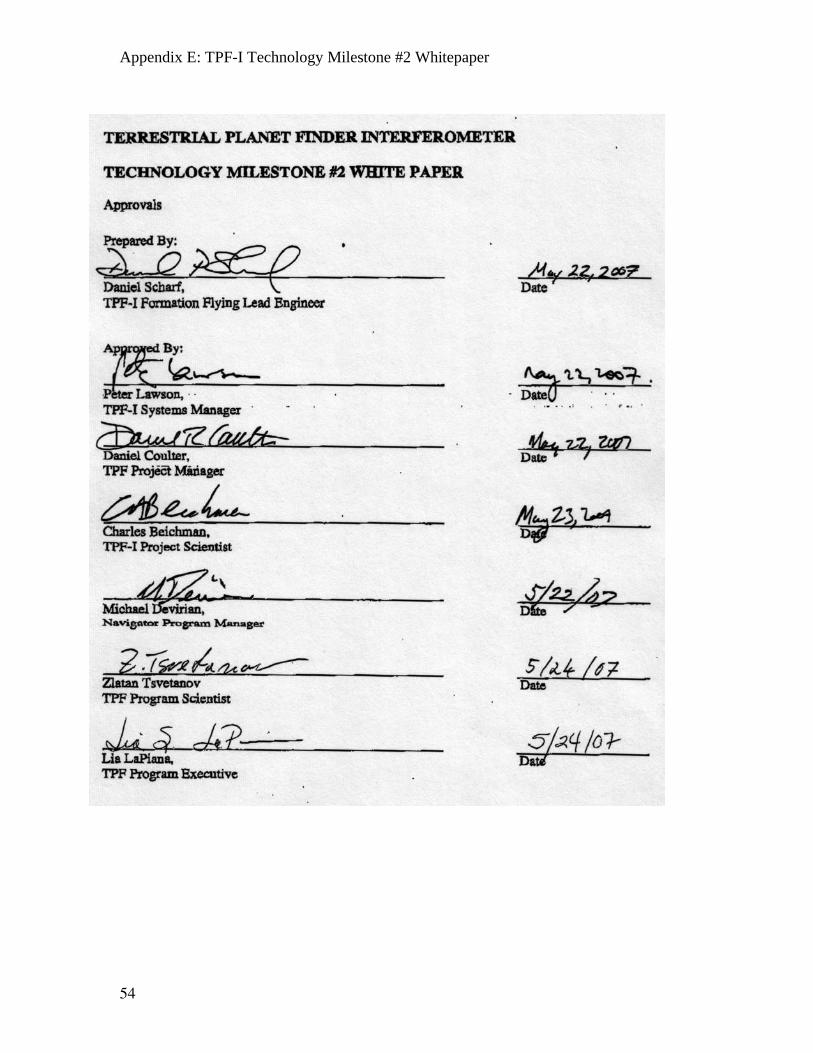
Appendix E: TPF-I Technology Milestone #2 Whitepaper
54

JPL Publication 08-11
55
TPF-I Technology Milestone #2 White Paper: Formation Control Performance Demonstration
1. Objective
In support of the Terrestrial Planet Finder Interferometer (TPF-I) pre-phase-A development program, this white paper explains the purpose of TPF-I Technology Milestone #2, specifies the methodology for computing the milestone metric, and establishes the success criteria against which the metric will be evaluated. See (Beichman et al. 1999) for a general discussion of the science and mission design of TPF-I. This technology milestone was established in the TPF-I Technology Plan (Lawson & Dooley 2005) to gauge the developmental progress of the TPF-I project and its readiness to proceed from pre-Phase A to Phase A. Completion of this milestone is to be documented by the project, reviewed by the EIRB, and approved by NASA HQ. The formation control performance milestone described here addresses precision range and bearing control. The milestone is stated in the Technology Plan as follows.
Milestone #2: Formation Flying (Multiple Robot Demonstration)
Using the Formation Control Testbed as an end-to-end system-level hardware testbed, demonstrate that a formation of multiple robots can autonomously initialize, maneuver and operate in a collision free manner. A key maneuver, representative of TPF-I science will be demonstrated by rotating through greater than 90° at ten times the flight rotation rate while maintaining a relative position control to 5 cm 1 per axis. This is the first step in a full validation the formation control architecture and algorithms and the testbed models developed by the Formation Algorithms & Simulation Testbed while physically demonstrating a scaled version of the approach to achieving the angular resolution required for the detection of terrestrial planets. Milestone TRL 4.
The goal of this milestone is to demonstrate that the developed formation algorithms can execute a scaled, two-spacecraft version of the most precise maneuver for TPF-I – a formation rotation – in an end-to-end, flight-like environment with performance traceable to flight. An end-to-end environment is required so that all sub-system interactions and algorithm and software interfaces that affect formation performance are included. As an example of such a sub-system interaction, consider that each TPF-I spacecraft will have its own flight computer and clock. Therefore, on start-up or after re-boot, the control cycles of each spacecraft will have arbitrary skew: one spacecraft may be firing its thrusters while another is reading its sensors. This skew introduces significant delay in the communication of formation control data between spacecraft, thereby degrading performance. To avoid this delay, an algorithm was developed as part of this task to synchronize the control cycles of multiple spacecraft to the millisecond level via inter-
Appendix E: TPF-I Technology Milestone #2 Whitepaper
56
spacecraft communication. An end-to-end testbed that includes such interactions is needed to fully validate formation algorithms. The ability to precision formation fly depends on sensors, communication, actuators and formation guidance, estimation, and control algorithms and the interactions of these sub-systems with each other and the environment. These algorithms are collectively referred to as formation algorithms or the Formation and Attitude Control System – FACS. The purpose of the FCT and the FAST, an associated distributed real-time simulation environment, is to demonstrate the technological maturity of FACS, that is, to demonstrate the formation algorithms in a realistic system-of-systems environment. To do so, several milestones are planned. In each milestone the exact same formation algorithms are used. The formation algorithms do have their parameters tuned to the specific system they are being demonstrated on (e.g., the thruster configuration in the FCT is different from flight, which changes the input file, but the same thrust allocator code is run), but again, the algorithms are the same. The planned milestones are: 1) Demonstrate precision formation flying in the FCT with 2 Robots (this shows the basic ability to precision formation fly), 2) Simulate the 2-Robot FCT in FAST with Comparable Performance (this validates the FAST simulation environment), 3) Demonstrate precision formation flying in the FCT with 3 Robots (this shows more complex formations can be controlled), 4) Simulate 5 Spacecraft TPF-I in FAST (this is the highest-fidelity ground emulation of TPF-I flight performance using a validated simulation environment and hardware-tested formation algorithms). Additional milestones address robustness to faults. Given formation algorithms, the more capable sensors, communication, and actuators are, the greater the precision that can be achieved. Error budgets, modeling, and analysis provide the link between sub-system capabilities and system-level performance resulting from formation algorithms. For the FCT, performance requirements must be sufficiently precise that flight-relevant system interactions that affect formation performance are exercised (e.g., if a communication packet is dropped, will it affect performance?). For this milestone, the performance requirements are a factor of 15 looser than flight due to testbed constraints, principally larger disturbances and sensor noise. However, the FCT requirements are shown to be sufficiently aggressive via error budgets (i.e., a dropped packet will have an effect). Finally, the exact same formation algorithms running on the FCT robots have been shown capable of achieving flight performance in stand-alone, non-real-time simulations with flight sensor noise and disturbances levels (Scharf et al. 2004b). Summarizing, the purpose of the above series of milestones is to demonstrate formation algorithms – shown to be capable of flight performance in lower-fidelity simulations – in both a high-fidelity, realistic (in terms of system interactions) hardware testbed and a distributed, real-time, and validated simulation environment. The traceability to flight for

JPL Publication 08-11
57
this milestone is provided through analyses and error budgets that are part of the milestone success criteria. This milestone for precision formation flying will show that, consistent with the FCT sensor precision and disturbance level, formation algorithms and software have been integrated seamlessly with flight-like communication, sensor, and actuator sub-systems to execute a scaled-version of the most precise formation maneuver needed for TPF-I. The principal investigator for the Formation Performance Milestone is Daniel Scharf at NASA’s Jet Propulsion Laboratory.
2. The Formation Control Testbed
The Formation Control Testbed (FCT) is a system-of-systems, robotic environment for ground validation of the formation algorithms being developed for TPF-I (Regehr et al., 2004). The FCT consists of two robots with flight-like hardware and dynamics, a precision flat floor for the robots to operate on, ceiling-mounted artificial stars for robot attitude sensing and navigation, and a “ground control” room for commanding the robots and receiving telemetry. The robots and part of the flat floor are shown in Figure 1. A detailed view of a robot with specific hardware identified is given in Figure 2. Each robot has a lower translational platform and an upper attitude platform. The attitude platform is the “spacecraft” and is completely disconnected from the translational platform. The attitude platform/spacecraft houses the avionics, actuators, sensors, inter-robot and aaaaaaaa
Figure 1: The Formation Control Testbed (FCT). Shown are the two robots on the flat floor with Jason Keim, the FCT Operations Lead. The floor is flat to 0.002 in., level to 120 μrad, and spans a 7.3 m x 8.5 m area. The robots’ attitude platforms (shown tilted for each robot) also float on spherical air bearings. As a result, the attitude platforms have extremely low-friction 5DOF motion. The final, vertical degree of freedom will be provided by retrofitted vertical stages that can translate 0.5 m. The robots serve as the system-level testing ground for flight software developed for space applications in formation flying.
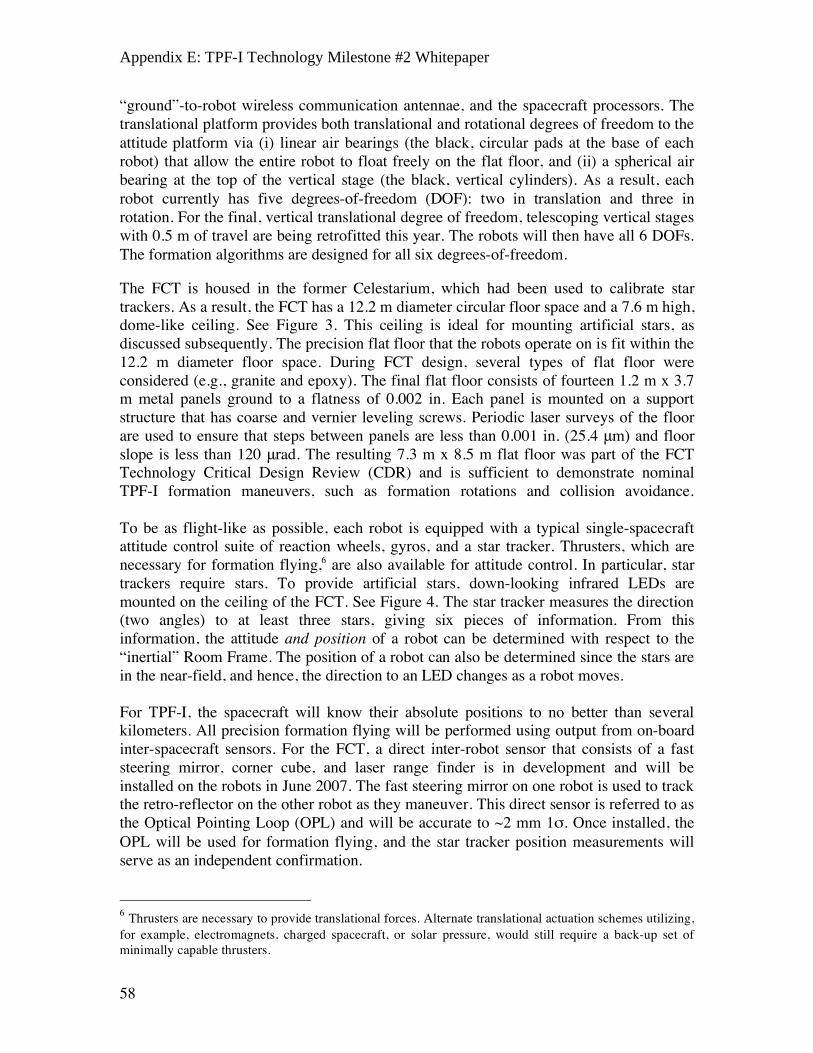
Appendix E: TPF-I Technology Milestone #2 Whitepaper
58
“ground”-to-robot wireless communication antennae, and the spacecraft processors. The translational platform provides both translational and rotational degrees of freedom to the attitude platform via (i) linear air bearings (the black, circular pads at the base of each robot) that allow the entire robot to float freely on the flat floor, and (ii) a spherical air bearing at the top of the vertical stage (the black, vertical cylinders). As a result, each robot currently has five degrees-of-freedom (DOF): two in translation and three in rotation. For the final, vertical translational degree of freedom, telescoping vertical stages with 0.5 m of travel are being retrofitted this year. The robots will then have all 6 DOFs. The formation algorithms are designed for all six degrees-of-freedom.
The FCT is housed in the former Celestarium, which had been used to calibrate star trackers. As a result, the FCT has a 12.2 m diameter circular floor space and a 7.6 m high, dome-like ceiling. See Figure 3. This ceiling is ideal for mounting artificial stars, as discussed subsequently. The precision flat floor that the robots operate on is fit within the 12.2 m diameter floor space. During FCT design, several types of flat floor were considered (e.g., granite and epoxy). The final flat floor consists of fourteen 1.2 m x 3.7 m metal panels ground to a flatness of 0.002 in. Each panel is mounted on a support structure that has coarse and vernier leveling screws. Periodic laser surveys of the floor are used to ensure that steps between panels are less than 0.001 in. (25.4 m) and floor slope is less than 120 rad. The resulting 7.3 m x 8.5 m flat floor was part of the FCT Technology Critical Design Review (CDR) and is sufficient to demonstrate nominal TPF-I formation maneuvers, such as formation rotations and collision avoidance. To be as flight-like as possible, each robot is equipped with a typical single-spacecraft attitude control suite of reaction wheels, gyros, and a star tracker. Thrusters, which are necessary for formation flying,6 are also available for attitude control. In particular, star trackers require stars. To provide artificial stars, down-looking infrared LEDs are mounted on the ceiling of the FCT. See Figure 4. The star tracker measures the direction (two angles) to at least three stars, giving six pieces of information. From this information, the attitude and position of a robot can be determined with respect to the “inertial” Room Frame. The position of a robot can also be determined since the stars are in the near-field, and hence, the direction to an LED changes as a robot moves.
For TPF-I, the spacecraft will know their absolute positions to no better than several kilometers. All precision formation flying will be performed using output from on-board inter-spacecraft sensors. For the FCT, a direct inter-robot sensor that consists of a fast steering mirror, corner cube, and laser range finder is in development and will be installed on the robots in June 2007. The fast steering mirror on one robot is used to track the retro-reflector on the other robot as they maneuver. This direct sensor is referred to as the Optical Pointing Loop (OPL) and will be accurate to ~2 mm 1 . Once installed, the OPL will be used for formation flying, and the star tracker position measurements will serve as an independent confirmation.
6 Thrusters are necessary to provide translational forces. Alternate translational actuation schemes utilizing, for example, electromagnets, charged spacecraft, or solar pressure, would still require a back-up set of minimally capable thrusters.
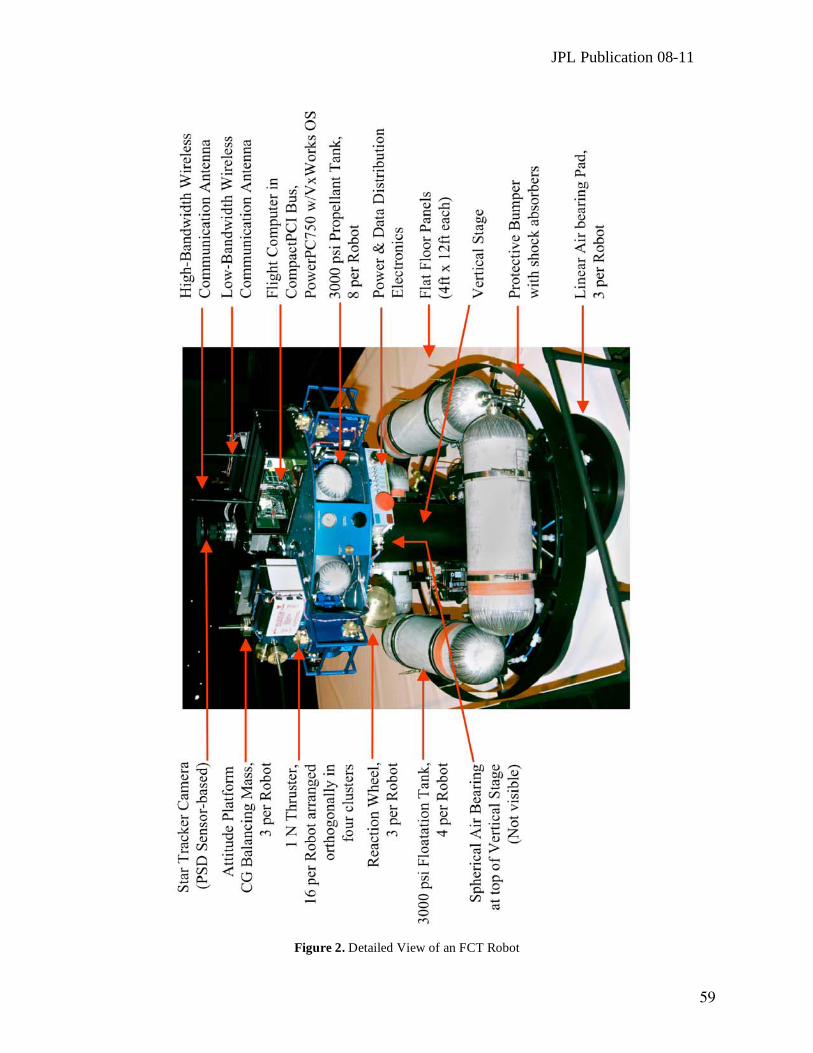
JPL Publication 08-11
59
Figure 2. Detailed View of an FCT Robot
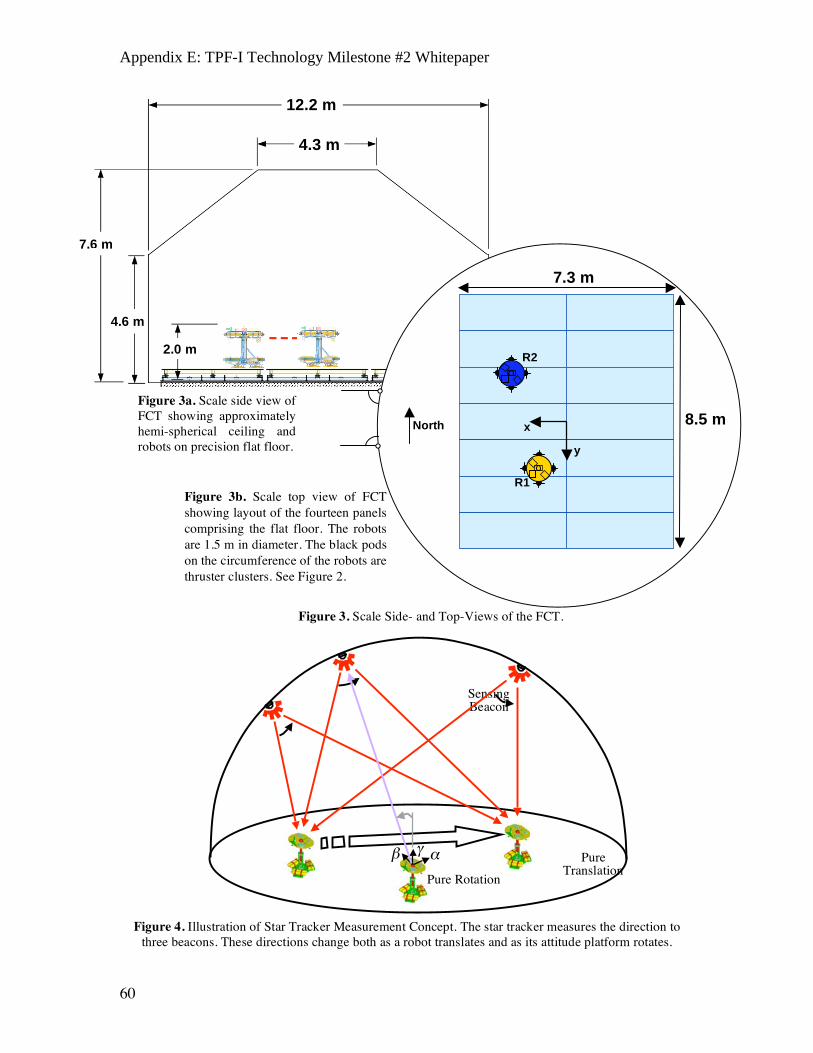
Appendix E: TPF-I Technology Milestone #2 Whitepaper
60
Figure 3. Scale Side- and Top-Views of the FCT.
Figure 4. Illustration of Star Tracker Measurement Concept. The star tracker measures the direction to three beacons. These directions change both as a robot translates and as its attitude platform rotates.
Sensing Beacon
Pure Rotation
Pure Translation
Figure 3b. Scale top view of FCT showing layout of the fourteen panels comprising the flat floor. The robots are 1.5 m in diameter. The black pods on the circumference of the robots are thruster clusters. See Figure 2.
Figure 3a. Scale side view of FCT showing approximately hemi-spherical ceiling and robots on precision flat floor.
7.3 m
8.5 m
R2
R1
x
y
North
12.2 m
4.3 m
7.6 m
4.6 m
2.0 m

JPL Publication 08-11
61
For the milestone demonstrations, the inter-robot position is determined by differencing Room Frame positions as measured by the star trackers. This approach is similar to differencing GPS position measurements in LEO, for example, as was done during the pre-terminal rendezvous stage of the DART mission. To ensure traceability to flight, the Room Frame positions are communicated between robots and differenced before being passed to the Formation and Attitude Control System (FACS) software. That is, the formation algorithms only have access to the inter-robot position measurement, as will be the case for TPF-I. The precision of the FCT star tracker is 6 arcmin 1 in attitude and 0.9 cm 1 in Room Frame position. Since inter-robot position is determined by differencing two Room Frame position measurements, the effective inter-robot position measurement precision is
2 * 0.9 cm = 1.3 cm 1 . Regarding attitude, a robot’s attitude estimator uses gyro measurements to improve the precision of attitude knowledge to 2 arcmin 1 . The FCT star trackers have been calibrated by placing them on a Physik Instrumente M-85 hexapod, which has a 6 DOF repeatability of ±2 μm and ±1 arcsec in translation and rotation, respectively. For calibration, a laser surveyor was used to accurately determine the position and attitude of the hexapod in the FCT Room Frame. Then, a star tracker was translated and rotated on the hexapod to several poses, and star tracker data was taken. This data was used to fit Zernike polynomials for lens aberrations. Details of this calibration and the algorithm that processes star tracker measurements into position and attitude are given in (Shields 2005).
There is currently no secondary truth sensor in the FCT. Several COTS truth sensors were considered (as opposed to in-house developed sensors that were deemed too expensive) as part of the FCT design process. These sensors were reviewed in technology preliminary and critical design reviews. The only viable candidate was a laser scanning system by ArcSecond, Inc. However, this system has not yet been within budget constraints of the FCT. See Appendix B for further details.
2.1. Formation Control Overview
Details of the FACS are given in (Scharf et al. 2004b). At the very highest level, the formation algorithms have the following architecture. The control architecture is Leader-Follower: one robot is designated the Leader and one the Follower. The Leader robot only applies feedforward translational forces to effect maneuvers. The Follower applies both feed-forward and feedback translational forces to maintain the desired inter-robot (i.e., relative) position. In particular, the Follower runs its own translational controller to maintain the relative position based on relative position and velocity commands from the Leader and the Follower-estimated relative position and velocity. Both robots control their attitudes independently. However, formation estimation does depend on attitude knowledge (Scharf et al. 2004b). The guidance architecture is hybrid: each robot has its own attitude guidance and the relative, translational path-planning occurs on the Leader. The Leader communicates the desired relative position and velocity to the Follower each time-step for control, as well as feedforward translational accelerations and high-level

Appendix E: TPF-I Technology Milestone #2 Whitepaper
62
attitude commands for the Follower’s attitude guidance algorithm. Each robot has its own formation estimator. All measurements (currently one inter-robot position in the FCT) are communicated between robots each time-step for estimation. Each robot maintains its own estimate of the formation state for collision avoidance and fault responses. Having presented the FCT, the milestone performance requirements are discussed in detail.
3. Milestone Requirements The FCT milestone goal is to demonstrate on the ground an end-to-end, system-level precision formation flying capability that is scaleable to flight. First, the performance requirements for the milestone and their relation to TPF-I flight requirements are discussed, and then the formation rotation maneuver to be demonstrated is specified.
3.1. Performance Requirements
Table 1 summarizes the top-level flight requirements for TPF-I. These requirements depend on operating mode, of which there are four: safe stand-off, reconfiguration, hand-off, and observation. These modes are based on operational needs. For each mode, requirements are listed separately for knowledge and control of (i) position (ii) attitude, and (iii) the time-rate-change of these three quantities. The attitude requirement is with respect to an inertial frame and the position requirement is with respect to the Combiner spacecraft. The knowledge requirements are 1 values for sensor precision in each axis. For example, the requirement in Table 1, Line 9, Observation Column, means that the sensor will measure the position of one spacecraft with respect to another to 0.1 cm 1 in each Cartesian axis. The control requirements are plus/minus bounds in each axis. For example, the requirement in Table 1, Line 10, Observation Column, means that a spacecraft must remain within ±1 cm in each Cartesian axis of its commanded position with respect to another spacecraft. That is, it must remain within a cube with a side length of 2 cm that is centered on the commanded relative position. See Appendix C for a discussion of specifying formation flying requirements as “cubes” rather than range/bearing volumes.
For TPF-I, the highest precision formation flying requirements are during science observations. Nulling requires sub-nanometer optical path-length control. There are also path-length rate control requirements derived from the capabilities of the fringe-tracking system. Focusing on the path-length control requirements for exposition, it is not possible to control inter-spacecraft positions to the sub-nanometer level. Hence, the control approach for the TPF-I distributed interferometer has two levels. In the first level, inter-spacecraft positions, which are directly related to path-lengths, are controlled via formation flying. In the second level, adaptive optics, fast steering mirrors, and optical delay lines (ODLs) cancel the residual path-length errors to the sub-nanometer level. As a result, formation flying requirements are driven by stroke and rate limitations of the optics and fringe-tracking system.

JPL Publication 08-11
63
Given ODL stroke limits of ±10 cm, performing a geometrical analysis of the science configuration, and adding margin, the inter-spacecraft positions are required to be controlled to ±1 cm in all axes. Based on the TPF-I flight requirements of Table 1, specific requirements are levied on the ground technology development during pre-Phase A efforts. See Tables 2 and 3 (Table 3 is on page 13). The formation requirements for the FCT are relaxed from TPF-I requirements due to increased sensor noise and disturbance level. However, the formation algorithms used to control the FCT robots have been shown in lower-fidelity simulations to be capable of flight performance when flight sensor and environmental characteristics are applied.
Table 2 gives select requirements from the FCT Technology-CDR. The principal
relaxation is of the precision formation control requirement from ±1 cm to 5 cm 1 . The
FCT performance requirement can be approximated as an absolute bound by taking the 3-
sigma value, that is, as ±15 cm.
Table 1. Flight Requirements for Formation Flying with the TPF Interferometer.
Knowledge requirements are 1 per axis and control requirements are ±bounds per axis.
Ref Parameter TPF-I Formation Flying Requirements per
Operating Mode
Units Safe-
Standoff
Reconfig-
uration
Hand-
off Observation
1 Operating Envelope
2 Formation Sensor Acquisition
Sensor
Acquisition
Sensor
Medium
Sensor Fine Sensor
3 Inter-S/C Range m 20–200 20–10,000 20–80 20–80
4 Inter-S/C Bearing – 4 sr 4 sr 10° cone 10 arcmin
cone
5 Inter-S/C Range Rate < cm/s 200 200 5 0.2
6 Inter-S/C Bearing Rate < arcmin/s 60 60 10 2.5
7 Max. Acquisition Time s 5 30 10 10
8 Relative Position
9 Knowledge cm 100 50 1 0.1
10 Control cm 500 250 5 1
11 Relative Velocity
12 Knowledge cm/s 1 0.1 0.1 0.005
13 Control cm/s 5 0.5 0.5 0.050
14 Inertial Attitude
15 Knowledge arcmin 1 1 0.1 0.1
16 Control arcmin 60 60 3.0 1.0
17 Inertial Attitude Rate
18 Knowledge arcsec/s 1 1 1 1
19 Control arcsec/s 5 5 5 5

Appendix E: TPF-I Technology Milestone #2 Whitepaper
64
Table 2. Select FCT Requirements from Technology-CDR.
Considering attitude, the TPF-I precision attitude requirement is ±1 arcmin with a sensor precision of 0.1 arcmin 1 . Given the FCT attitude estimator precision of 2 arcmin 1 (Shields et al. 2007) and this 10-to-1 of control to sensor requirement, the FCT attitude requirement is derived as ±20 arcmin. However, as discussed in the next paragraph, the FCT attitude control requirement is stated as a 1 value, specifically, 6.7 arcmin 1 . The FCT requirements have been specified in terms of 1 statistical bounds instead of absolute bounds. The reason for this is that absolute bounds are an approximation when disturbances, sensor noise, and actuator saturations are non-trivial. Figure 6 shows an example of simulated formation control errors from the FCT Error Budget with sensor = 1.3 cm, thruster saturation, and a varying floor slope disturbance due to robot motion. The statistics for this example are shown in Table 4, that is, the percentage of time-steps with control errors of greater than one, two, and three times sensor. As can be seen from the statistics, these time histories are a favorable example since more than the expected amount time-steps have an error of less than 1 sensor. However, this example illustrates that there is statistically a non-zero fraction of control errors that will exceed a given absolute bound.
Figure 6. Example Simulated Time Histories of Formation Control Errors by Axis from the FCT Error
Budget. By axis, the standard deviations of the control errors are [ 4.4 4.6 4.0 ] cm.
REFERENCE REQUIREMENT
2.01 The total relative translation motion error between the Combiner Robot Frame and any Collector Robot Frame shall not exceed 5.0 cm (per axis, 1 ).
5.02
FCT shall be able to execute two corners of a polygonal array rotation with 1/4 chord at both ends (for a total of 1-1/2 chords), at 10 times the TPF flight rate of 1 revolution/12 hours, with the number of sides of the polygon defined by the radius of rotation and the size of the control deadband in translation.

JPL Publication 08-11
65
Table 4. Statistics for Formation Control Example of Figure 6.
3.2. Formation Maneuver Specification
The maneuver to be demonstrated is a synchronized formation rotation, in which a formation rotates as a virtual rigid body. This maneuver will be used for science observations. A key aspect is that spacecraft attitudes must remain synchronized with their relative positions. This synchronization is needed to maintain the interferometric links between spacecraft. We first review the formation rotation requirements for flight and then scale it to the FCT per the ground demonstration requirements. Formation rotations for TPF-I include a modification to account for pulse-width modulated thrusters. When such thrusters fire to provide centripetal acceleration, the resulting impulse can cause fringe-loss. Hence, all pulse-width thrusters are restricted to firing in a 6 second window out of every 60 seconds. During the remaining 54 seconds, the fringe is re-acquired (if necessary) and a science measurement of the fringe is taken. Since the thrusters can only fire periodically to provide centripetal acceleration, the TPF-I spacecraft actually travel on a polygonal approximation to a circle. See Figure 6. Per requirement 5.10 of Table 2, a full TPF-I flight rotation takes 12 hours.7 Hence, the angular chord length is 0.5 deg and the rotation rate is 0.5 arcmin/s.
Figure 6. TPF-I Science Configuration and Formation Rotation Schematic.
7 The current TPF-I rotational period is 50,000 s (13.9 hrs). The requirements for the FCT were derived from TPF-I requirements frozen at the earlier value of 12 hrs. This freeze was done to prevent the FCT from chasing smaller variations in the evolving TPF-I design.
% of Time Steps with Control Error… Axis
> 1 sensor > 2 sensor > 3 sensor
X 16.6 2.0 1.0
Y 17.4 3.2 0.40
Z 18.8 3.6 0
Expected % 31.7 4.6 0.28
Coll 1 Coll 2 Coll 3 Coll 4
Combiner
Figure 6a. Linear array of four Collector spacecraft with Combiner spacecraft offset.
Figure 6b. Formation rotation schematic for TPF-I showing half rotation about center of linear array and, for two of the Collectors, the polygonal paths taken. All spacecraft follow an appropriately-sized polygon with angular chord length . Red arrows indicate the 6-second thruster firing windows to turn corners

Appendix E: TPF-I Technology Milestone #2 Whitepaper
66
Table 3. Requirements of the Formation Control Testbed vs Flight Requirements
Parameter Flight
Performance
Formation
Control Testbed Comments
Number of spacecraft 5 3 FCT has 2 as of FY07
Operational capability
Standalone operations 5 yrs 36 min Total FCT floatation time
Mission duration 5 yrs 5+ yrs
Observational duration ~14 hrs ~15 min “Observation on the fly”
Availability Continuous 8 hrs/day Ground testbed facility
Motion DOFs 6 5+1 FCT has 1 articulated DOF
Operating envelope 3D space 2D plane Limited out-of-plane FCT motion
Control
Relative Position ±1 cm ±15 cm
(5 cm 1 )
FCT med. sensor 13x noisier than
flight fine sensor, larger disturbance
Absolute Attitude ±1 arcmin ±20 arcmin
(6.7 arcmin1 )
FCT attitude knowledge 20x noisier
than flight
Fault recovery Active and passive In development FCT fault scope TBD
Flight capability
Sensor
Inertial Gyro/accel Gyro/accel
Celestial Star tracker Pseudo-star tracker
Relative Coarse, Med., Fine Medium Fine FCT sensor being developed
Actuator Thrusters, RWA Thrusters, RWA
Control Architecture Distributed Distributed
Control Algorithms Flight Flight Developed by FAST
Dynamic DOFs 6 5 FCT: +1 articulated DOF
Range of motion
Attitude In-plane 360° 360°
Attitude Out-of-plane ± 45° ± 30°
Linear-in-plane Limited by sensor Limited by lab
Linear-out-of-plane Limited by sensor ± 0.25 m Emulate science deadbands
Maneuvers
Acquisition 3D space 2D space
Array rotation in-plane Yes Yes
Array re-sizing Yes Yes
Array re-targeting Yes Yes
Collision Avoidance 3D space 2D space
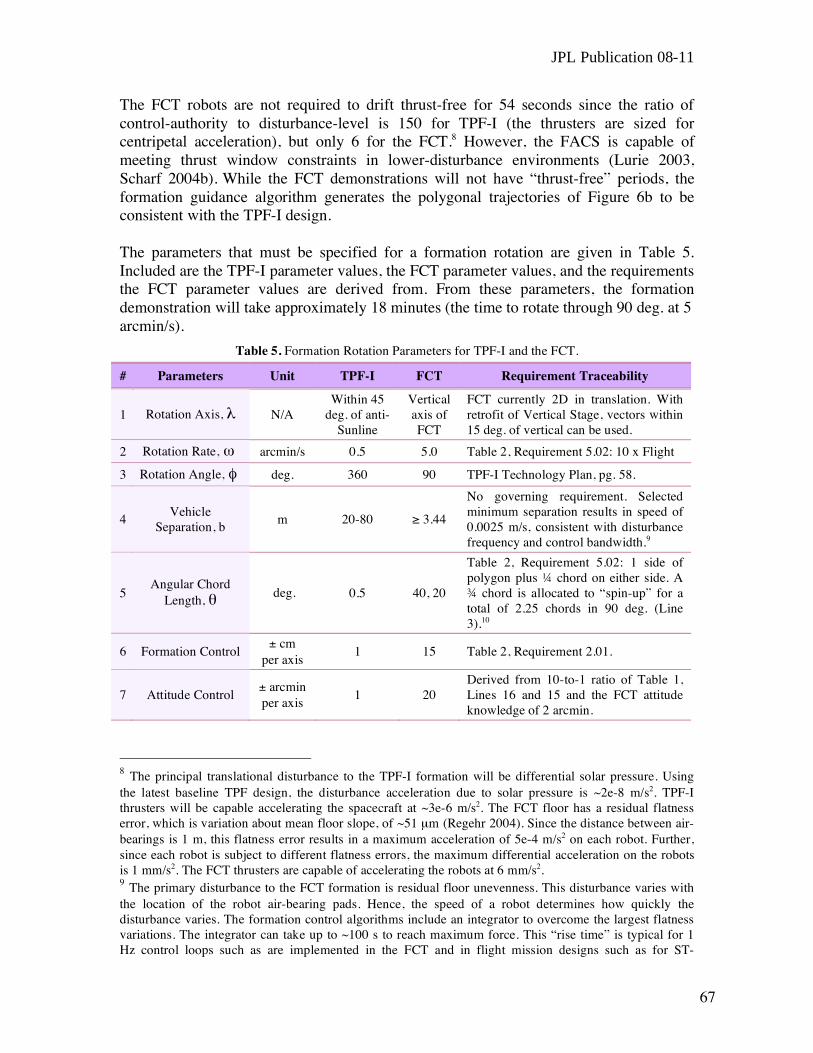
JPL Publication 08-11
67
The FCT robots are not required to drift thrust-free for 54 seconds since the ratio of control-authority to disturbance-level is 150 for TPF-I (the thrusters are sized for centripetal acceleration), but only 6 for the FCT.8 However, the FACS is capable of meeting thrust window constraints in lower-disturbance environments (Lurie 2003, Scharf 2004b). While the FCT demonstrations will not have “thrust-free” periods, the formation guidance algorithm generates the polygonal trajectories of Figure 6b to be consistent with the TPF-I design. The parameters that must be specified for a formation rotation are given in Table 5. Included are the TPF-I parameter values, the FCT parameter values, and the requirements the FCT parameter values are derived from. From these parameters, the formation demonstration will take approximately 18 minutes (the time to rotate through 90 deg. at 5 arcmin/s).
Table 5. Formation Rotation Parameters for TPF-I and the FCT.
8 The principal translational disturbance to the TPF-I formation will be differential solar pressure. Using the latest baseline TPF design, the disturbance acceleration due to solar pressure is ~2e-8 m/s2. TPF-I thrusters will be capable accelerating the spacecraft at ~3e-6 m/s2. The FCT floor has a residual flatness error, which is variation about mean floor slope, of ~51 μm (Regehr 2004). Since the distance between air-bearings is 1 m, this flatness error results in a maximum acceleration of 5e-4 m/s2 on each robot. Further, since each robot is subject to different flatness errors, the maximum differential acceleration on the robots is 1 mm/s2. The FCT thrusters are capable of accelerating the robots at 6 mm/s2. 9 The primary disturbance to the FCT formation is residual floor unevenness. This disturbance varies with the location of the robot air-bearing pads. Hence, the speed of a robot determines how quickly the disturbance varies. The formation control algorithms include an integrator to overcome the largest flatness variations. The integrator can take up to ~100 s to reach maximum force. This “rise time” is typical for 1 Hz control loops such as are implemented in the FCT and in flight mission designs such as for ST-
# Parameters Unit TPF-I FCT Requirement Traceability
1 Rotation Axis, N/A Within 45
deg. of anti-Sunline
Vertical axis of FCT
FCT currently 2D in translation. With retrofit of Vertical Stage, vectors within 15 deg. of vertical can be used.
2 Rotation Rate, arcmin/s 0.5 5.0 Table 2, Requirement 5.02: 10 x Flight
3 Rotation Angle, deg. 360 90 TPF-I Technology Plan, pg. 58.
4 Vehicle
Separation, b m 20-80 3.44
No governing requirement. Selected minimum separation results in speed of 0.0025 m/s, consistent with disturbance frequency and control bandwidth.9
5 Angular Chord
Length, deg. 0.5 40, 20
Table 2, Requirement 5.02: 1 side of polygon plus chord on either side. A
chord is allocated to “spin-up” for a total of 2.25 chords in 90 deg. (Line 3).10
6 Formation Control ± cm
per axis 1 15 Table 2, Requirement 2.01.
7 Attitude Control ± arcmin per axis
1 20 Derived from 10-to-1 ratio of Table 1, Lines 16 and 15 and the FCT attitude knowledge of 2 arcmin.
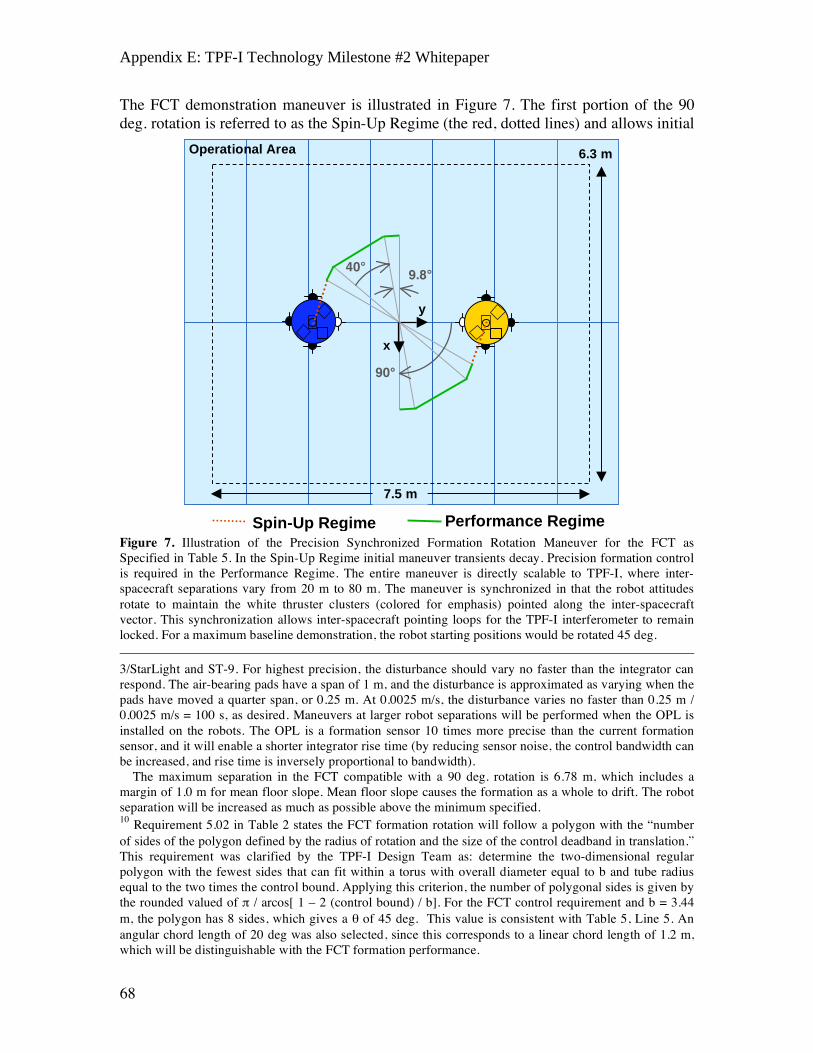
Appendix E: TPF-I Technology Milestone #2 Whitepaper
68
The FCT demonstration maneuver is illustrated in Figure 7. The first portion of the 90 deg. rotation is referred to as the Spin-Up Regime (the red, dotted lines) and allows initial a Figure 7. Illustration of the Precision Synchronized Formation Rotation Maneuver for the FCT as Specified in Table 5. In the Spin-Up Regime initial maneuver transients decay. Precision formation control is required in the Performance Regime. The entire maneuver is directly scalable to TPF-I, where inter-spacecraft separations vary from 20 m to 80 m. The maneuver is synchronized in that the robot attitudes rotate to maintain the white thruster clusters (colored for emphasis) pointed along the inter-spacecraft vector. This synchronization allows inter-spacecraft pointing loops for the TPF-I interferometer to remain locked. For a maximum baseline demonstration, the robot starting positions would be rotated 45 deg. 3/StarLight and ST-9. For highest precision, the disturbance should vary no faster than the integrator can respond. The air-bearing pads have a span of 1 m, and the disturbance is approximated as varying when the pads have moved a quarter span, or 0.25 m. At 0.0025 m/s, the disturbance varies no faster than 0.25 m / 0.0025 m/s = 100 s, as desired. Maneuvers at larger robot separations will be performed when the OPL is installed on the robots. The OPL is a formation sensor 10 times more precise than the current formation sensor, and it will enable a shorter integrator rise time (by reducing sensor noise, the control bandwidth can be increased, and rise time is inversely proportional to bandwidth). The maximum separation in the FCT compatible with a 90 deg. rotation is 6.78 m, which includes a margin of 1.0 m for mean floor slope. Mean floor slope causes the formation as a whole to drift. The robot separation will be increased as much as possible above the minimum specified. 10 Requirement 5.02 in Table 2 states the FCT formation rotation will follow a polygon with the “number of sides of the polygon defined by the radius of rotation and the size of the control deadband in translation.” This requirement was clarified by the TPF-I Design Team as: determine the two-dimensional regular polygon with the fewest sides that can fit within a torus with overall diameter equal to b and tube radius equal to the two times the control bound. Applying this criterion, the number of polygonal sides is given by the rounded valued of / arcos[ 1 – 2 (control bound) / b]. For the FCT control requirement and b = 3.44 m, the polygon has 8 sides, which gives a of 45 deg. This value is consistent with Table 5, Line 5. An angular chord length of 20 deg was also selected, since this corresponds to a linear chord length of 1.2 m, which will be distinguishable with the FCT formation performance.
x
y
90°
40°
6.3 m Operational Area
7.5 m
Spin-Up Regime Performance Regime
9.8°

JPL Publication 08-11
69
maneuver transients to decay. Then precision formation control will be demonstrated in the Performance Regime (the green, solid lines) for 1.5 chords as required by Table 2. Each chord is 2.35 m long. Hence, the quarter chords are 0.59 m long and subtend 9.8 deg. The Operational Area is shown for reference. It includes a 0.5 m margin to account for mean floor slope. Mean slope does not affect formation performance, but it can cause the formation as a whole to drift.
4. Computation of the Metric
4.1. Definitions
The TPF-I Formation Control Milestone 2 demonstration requires measurement and control of inter-robot position and absolute robot attitudes. In the following paragraphs we define the terms involved in this process, enumerate the measurement steps, and specify the data products. 4.1.1. Formation and Attitude Control System (FACS). The C-code software module
that runs in real-time on each robot and contains the formation and attitude estimation, guidance, and control algorithms. The FACS is discussed in detail in (Scharf et al. 2004b).
4.1.2. Room Frame. The reference frame of the FCT. The origin is at a reference block in the center of the FCT. The X and Y axes are defined by fixed posts (a second post for each axis was installed using a laser surveyor since the reference block has since been covered by the flat floor). The Z axis is defined by the cross product of the X and Y axes.
4.1.3. Robot Body Frame. The reference frame of a robot. The origin is at the center of
curvature of the spherical air bearing. The axes are defined by reference posts affixed to the attitude platform.
4.1.4. Absolute Position. The position vector, ri , i = 1, 2, of the origin of a robot’s Body Frame in the Room Frame as determined by the star tracker and represented in the Room Frame.
4.1.5. Relative Position. The position of Robot 2 (R2) with respect to R1 as determined by differencing Absolute Positions, r = r2-r1.
4.1.6. Desired Relative Position. The commanded relative position, rd, as calculated by the formation guidance algorithm. See Figure 8 for an example as generated by the C-coded algorithm running on the robots. In this example, three successive synchronized rotations are commanded about different axes with different rotation angles and angular chord lengths.

Appendix E: TPF-I Technology Milestone #2 Whitepaper
70
Figure 8. Example Desired Relative Positions as Output by Formation Guidance Algorithm to Demonstrate Algorithm Capabilities. The robots will not actually follow these paths. The guidance algorithm can rotate a formation about an arbitrary axis with arbitrary chord length (subject to geometrical constraints and vehicle capabilities). The desired relative positions are shown with respect to the Leader, which in this case is Robot 1 (R1). As shown in Figure 7, both robots actually rotate about the geometric center of the formation. The rotations correspond to a 180 deg. rotation about the Z-axis with 45 deg. chords, a 90 deg. rotation about the Y-axis with 30 deg. chords, and a 90 deg. rotation about the X-axis with 6 deg. chords. For the last rotation, the linear chord length is 10 cm, and so at the scale of the plot the rotation looks continuous.
4.1.7. Attitude Estimator. The element of the FACS that combines star tracker attitude measurements with gyroscope outputs to obtain an estimate of the orientation of a robot Body Frame with respect to the Room Frame.
4.1.8. Absolute Attitude. The rotation that takes the Room Frame to the Robot Body Frame as determined by the output of a robot’s attitude estimator and represented as a proper quaternion, qRB,i, i = 1, 2.
4.1.9. Desired Absolute Attitude. The commanded rotation that the takes the Room Frame to the Robot Body Frame as calculated by the formation guidance algorithm that synchronizes absolute attitude with the desired relative position. The rotation is represented by a proper quaternion, qRB,i
d, i = 1, 2. 4.1.10. Translational Control Error. The relative position minus the desired relative
position, re = r - rd. An example is shown in Figure 6. 4.1.11. Rotational Control Error. The rotation that takes the Desired Absolute Attitude
to the Absolute Attitude as represented by the proper quaternion
180° about +Z
Start
90° about +X
90° about +Y
End
Z
Y X
R2
R1
Room Frame
Room Frame Y, m Room Frame X, m

JPL Publication 08-11
71
qe,i = prop( conj(qRB,id) * qRB,i ), where conj(.) is conjugates a quaternion, prop(.)
properizes a quaternion, and * is the quaternion multiplication operator. 4.1.12. Angular Control Error. The representation of qe,i via a vector of angles, gi,
corresponding to the axis/angle rotation parameterization. That is, a rotation may be equivalently represented by the vector , where is the angle to turn and is the unit vector to turn about. When is small, this vector of angles gives the “small angle” approximation to a rotation. For example, an angular control error of gi = [ 3 -2 4 ] arcmin means that to match the absolute attitude and the desired absolute attitude, the Robot Body Frame must be rotated -3 arcmin about the positive x-axis of the Robot Body Frame, 2 arcmin about the positive y-axis of the Robot Body Frame, and -4 arcmin about the positive z-axis of the Robot Body Frame.
4.1.13. Performance Interval. The interval of time when the Desired Relative Position is
commanding the green portion of the robot trajectories in Figure 7. 4.1.14. Translational Control Performance. The by axis standard deviations, pt, of the
Translational Control Error during the Performance Interval. An example is given in the caption of Figure 6.
4.1.15. Rotational Control Performance. The by axis standard deviations, pr,i, i = 1, 2,
of an Angular Control Error during the Performance Interval.
4.2. Formation Control Milestone 2 Demonstration Procedure
This section describes the procedure that will be followed to collect data for the milestone
validation review. The robots are given high-level commands over a wireless connection
from the FCT “Ground” Console. The commands are high-level in that they specify the
desired outcome and the detailed path-planning and execution is performed on-board the
robots by the FACS. Example commands are given below.
4.2.1. Initial Robot Positioning. The robots will be manually placed in their approximate initial conditions. A command script will be sent to the robots for them to position themselves at the initial conditions for the demonstration. After the robots have converged, they will be shut-down and their computers reset. These actions ensure repeatability from run to run and that the individual “flight” computers on each robot have arbitrary skew in their control cycles. An example command for positioning a robot in the Room Frame (not formation flying) is:
facs_cmd ATS_ABS_OFFSET time {20} OffsetVec {0, 1.72, 0}
which commands the Absolute Translation System (ATS) to go to the position
specified in the offset vector (OffsetVec) in the Room Frame when the on-board
clock is at 20 s.

Appendix E: TPF-I Technology Milestone #2 Whitepaper
72
4.2.2. Demonstration Run via Command Script. The robots will be started with a command script that contains all the commands for the demonstration. The robots go through their autonomous check-out modes in 15 seconds. Synchronizing control cycles can take up to 100 s (the need for synchronization is discussed at the bottom of Page 2). At 110 s, the robots will begin formation initialization as specified in the command script uploaded at the beginning of the demonstration. Initialization, during which the attitudes are aligned and formation flying begins, takes 50 s in this scenario. At 170 s, the synchronized formation rotation command activates. The rotation is actually commanded for 100 deg. so that the formation will stop rotating beyond the Performance Interval. At 5 arcmin/s, this rotation takes 20 minutes. The robots are commanded to quit and download telemetry. An example command script for R1 is:
facs_cmd BEGIN_FORMINIT time {110}
facs_cmd SYNCH_ROT time {170} Rotation {0, 0, 1.7453} Duration
{1200} LinArcLen {0.6981}
The Rotation vector is similar to the g vector in Section 4.1.12 and specifies a 100
deg. rotation about the Room Frame z-axis. The Duration of 1200 s results in a
rotation rate of 100 deg. / 1200 s = 5 arcmin/s. Finally, LinArcLen is the length of
a chord.
4.2.3. Telemetry Processing. Upon receiving the shut-down command from the FCT Ground Console, the robots de-float their air-bearings and download telemetry to the Ground Console. The telemetry contains all the data necessary to calculate the Translational Control Performance and Rotational Control Performance. These performances are then compared to the required values given in Section 3.1 and reiterated in Section 5.
5. Success Criteria
The following is a statement of the three elements that must be demonstrated to close the TPF-I Formation Control Milestone 2. Each element includes a brief rationale. 5.1.1. Formation Guidance Verification. The time history of rd and qRB,i
d in telemetry must agree to ±5 mm and ±1 arcmin, respectively, with the trajectory specified in Table 5 and shown in Figure 7 for the actual value of inter-robot separation b at the start of the synchronized formation rotation.
Rationale: Since the Translational and Rotational Control Performances are based on
the desired relative position and desired absolute attitude, these values are double-
checked for correctness. The accuracy specified is a factor of 10 smaller than the
performance requirements and ensures the robots are following the proper trajectories.
JPL Publication 08-11
73
5.1.2. Translational Control Performance. The per-axis Translational Control Performance must be less than or equal to 5 cm 1 .
Rationale: This performance shows that the formation algorithms in FACS and the flight-like sensing, actuation, and communication sub-systems have functioned together to achieve the highest formation performance consistent with sensing precision. 5.1.3. Rotational Control Performance. The per-axis Rotational Control Performance
must be less than or equal to 6.7 arcmin 1 . Rationale: This performance shows that the formation algorithms in FACS and the flight-like sensing, actuation, and communication sub-systems have functioned together to achieve the highest synchronized attitude performance consistent with sensing precision. 5.1.4. Multiple Guidance Profiles. The 90 deg rotation must be performed with an
angular chord width of 40 deg and 20 deg. Rationale: TPF-I will tailor its rotations to specific target stars. By demonstrating rotations with two different angular chord widths, the flexibility of the formation guidance algorithm is demonstrated. 5.1.5. Repeatability. The entire demonstration for both angular chord widths must be
repeated three times while meeting criteria 5.1.1-4 with at least two days between demonstrations. Demonstrations of different angular chord widths may occur on the same day.
Rationale: This repeatability shows the Precision Formation Control capability is robust to variations in the testbed environment. 5.1.6. Formation Timing. During all demonstrations, timing information for each
formation mode and maneuver will be recorded. There is no performance requirement on timing.
Rationale: Since TPF-I will have cryogenic operating temperatures, maneuver times are critical to telescope design and overall observational efficiency. Future milestones will more completely address timing. However, the process is being initiated as part of this milestone, and documentation of maneuver times will be part of future milestone success criteria. 5.1.7. Traceability to Flight via Error Budgets. Provide analyses and error budgets
showing that the FACS demonstrated in the FCT can achieve flight performance given flight-level spacecraft and environment properties.
Rationale: Since exact flight performance is not being demonstrated, the performance of the FCT formation in this milestone must be shown to provide a path forward to flight.

Appendix E: TPF-I Technology Milestone #2 Whitepaper
74
6. Certification Process
The TPF-I Project will assemble a milestone certification data package for review by the EIRB. If the success criteria are determined to have been met, the Project will submit the finding of the review board, together with the certification data package, to NASA HQ for official certification of milestone compliance. In the event of disagreement between the Project and the EIRB, NASA HQ will determine whether to accept the data package and certify compliance or request additional work. The milestone certification data package will include a discussion of how each element of the milestone was met, an explanation of each plot, appropriate tables and summary charts, and a narrative summary of the overall milestone achievement.
7. References
Beichman, C.A., Woolf, N.J., and Lindensmith, C.A., eds., The Terrestrial Planet Finder (TPF): A NASA Origins Program to Search for Habitable Planets, JPL Publication 99-003, Jet Propulsion Laboratory: Pasadena, CA,1999. Available online at http://planetquest.jpl.nasa.gov/TPF/tpf_book/index.cfm.
Lawson, P. R., and Dooley, J. A., eds., Technology Plan for the Terrestrial Planet Finder
Interferometer, JPL Pub 05-5, Jet Propulsion Laboratory: Pasadena, CA, 2005.
Available online at http://planetquest.jpl.nasa.gov/Navigator/library/tpfI414.pdf.
Lurie, B., “Multi-Mode Synchronized Control for Formation Flying Interferometer,” AIAA Guidance, Navigation, and Control Conference, 2003.
Regehr, M.W., Acikmese, A.B., Ahmed, A., Aung, M., Bailey, R., Bushnell, C., Clark,
K.C., Hicke, A., Lytlel, B., MacNeal, P., Rasmussen, R.E., Shields, J., and Singh, G., “The Formation Control Testbed,” IEEE Aerospace Conference, Big Sky, MT, 2004.
Scharf, D.P., Hadaegh, F.Y., Rahman, Z.R., Shields, J.H., Singh, G., and Wette, M.R.,
“An Overview of the Formation and Attitude Control System for the Terrestrial Planet Finder Formation Flying Interferometer,” 2nd International Symposium on Formation Flying Missions and Technologies, Washington, D.C., September, 2004b.
Shields, J.F., “The Formation Control Testbed Celestial Sensor: Overview, Modelling and Calibrated Performance,” IEEE Aerospace Conference, Big Sky, MT, 2005. Shields, J., Goldberg, H., Keim, J., Morales, M., and Scharf, D., “Terrestrial Attitude Estimation for the Formation Control Testbed,” IEEE Aerospace Conference, Big Sky, MT, 2007.

JPL Publication 08-11
75
Appendix A: Table of Acronyms and Abbreviations ATS Absolute Translation System CDR Critical Design Review COTS Commercial Off The Shelf DART Demonstrator for Autonomous Rendezvous Technology DOF Degree Of Freedom FACS Formation and Attitude Control System FCT Formation Control Testbed GPS Global Positioning System LED Light Emitting Diode ODL Optical Delay Line OPL Optical Pointing Loop RWA Reaction Wheel Assembly TPF-I Terrestrial Planet Finder Interferometer
Appendix B: Further Details on COTS Truth Sensors The principal challenge in a truth sensor for the FCT is to obtain 6DOF information with sub-centimeter and arcminute-level accuracy over a dynamic range of 7 meters. If the robots remained in the same positions with only tens of centimeters variations, a test-stand as is used for JWST would be applicable. Other, 3DOF formation flying testbeds with appreciable dynamic ranges have used GPS pseudo-lites and ceiling-mounted camera systems. These two systems are significantly simplified by the 3DOF nature of these testbeds: they only need to sense planar position and scalar attitude, which makes the, say, colored LEDS in the camera frame a straightforward transformation of their pixel position. Camera systems were ruled-out since the achievable accuracy for a given complexity/cost was not feasible for our 6 DOF application; consider MSFC’s AVGS and StarVision’s VisNav products which achieve ~1 cm position but only 1 degree in attitude. The accuracy of RF-based sensing systems (including pseudo-lites) is limited in the FCT due to multi-path from the metallic floor. Ultrasound-based systems are corrupted by thruster firings. Capacitive sensing is clearly not applicable. Hence, a laser-based system must be used. There are two general types of laser-based distance measuring equipment: point-to-point interferometers such as the HP 5527A and point cloud-producing laser surveyors such as the Reigl Laser Radar (see Figure B.1). Estimating position and attitude from point

Appendix E: TPF-I Technology Milestone #2 Whitepaper
76
clouds is a complex machine vision problem. Point-to-point interferometers do not have an appreciable FOV, and so steering mirrors and control loops to track retro-reflectors on the robots would have to be added. Additionally, there would still be the machine-vision problem of differentiating the retro-reflector returns. These are all solvable problems, but in-house development would become prohibitively expensive. Candidate commercial systems included (i) a scanning laser head with retro-reflectors and proprietary machine vision software by ArcSecond, Inc., (ii) an infrared LED-based system similar to the current star tracker by 3rd Tech, and (iii) another scanning laser head with multiple detectors as opposed to retro-reflectors by MacLeod Technologies, Inc. As of the FCT CDR, the 3rd Tech system was still maturing and the MacLeod Technologies, Inc. scanner was for planar applications. While it could be extended to 6DOF in principle, it would become another in-house development. The cost of the ArcSecond system lowered its priority.
Figure B.1. Reigl scanning laser radar and example point-cloud data.
Appendix C: Specification of Formation Flying Requirements Specifying formation flying requirements in terms of range and bearing is an inherited method that is misleading since a reference range is needed. The formation flying requirements are derived from stroke-limitations of adaptive optics that modify the optical path lengths in the interferometric payload. There are two sets of optics that bear on the formation requirements: optical delay lines (ODLs) and fast-steering mirrors (FSMs). The FSMs route light between spacecraft, and the ODLs correct for pathlength differences down to the sub-nanometer level. The ODLs require spacecraft to remain in a fixed volume with respect to neighboring spacecraft. See Figure C.1. This volume does not need to change with inter-spacecraft range because the ODLs stroke-limits remain constant. However, in specifying this volume as range and bearing, which is more intuitive to some, a confusion is introduced. The primary flight requirement is that each spacecraft remains in a cube with sides of 2 cm with respect to a specified neighbor spacecraft. Since planned spacecraft separations vary from 20 m to 200 m, the tightest apparent bearing requirement is 2 cm / 200 m = 20.6 arcsec, which is the value

JPL Publication 08-11
77
maintained in previous TPF-I requirement tables. However, at 20 m the 2 cm-requirement translates into a bearing requirement of 206 arcsec. The 20 arcsec number was adopted as a requirement because it is the tightest bearing if you specify requirements by range and bearing. However, it is not an actual requirement. There is a caveat: the FSMs must have sufficient stroke to cover the range of inter-spacecraft bearings derived from the ODL stroke-limits. If the bearing performance resulting from ODL-derived requirements were large, then an additional bearing requirement would be needed so that FSM stroke-limits are not exceeded. FSMs are available with several degree fields-of-regard whereas only ~5 arcmin is needed.
Figure C.1. Illustration of Formation Control Requirements. Only dr is needed.
dr
d
dr
Formation requirement stated imprecisely in terms of range and bearing results in different “control volumes” as spacecraft separation varies.
Formation requirement stated precisely gives “control volume” that is independent of spacecraft separation.
r1 r2