Terrestrial biosphere models underestimate photosynthetic ......Terrestrial biosphere models...
14
Terrestrial biosphere models underestimate photosynthetic capacity and CO 2 assimilation in the Arctic Alistair Rogers 1 , Shawn P. Serbin 1 , Kim S. Ely 1 , Victoria L. Sloan 2 and Stan D. Wullschleger 2 1 Environmental and Climate Sciences Department, Brookhaven National Laboratory, Upton, NY 11973-5000, USA; 2 Environmental Sciences Division, Oak Ridge National Laboratory, Oak Ridge, TN 37831-6301, USA Author for correspondence: Alistair Rogers Tel: +1 631 344 2948 Email: [email protected] Received: 6 June 2017 Accepted: 8 July 2017 New Phytologist (2017) 216: 1090–1103 doi: 10.1111/nph.14740 Key words: earth system models, maximum carboxylation capacity (V c,max ), maximum electron transport rate (J max ), photosynthesis, Rubisco, temperature response function, tundra. Summary Terrestrial biosphere models (TBMs) are highly sensitive to model representation of photo- synthesis, in particular the parameters maximum carboxylation rate and maximum electron transport rate at 25°C(V c,max.25 and J max.25 , respectively). Many TBMs do not include repre- sentation of Arctic plants, and those that do rely on understanding and parameterization from temperate species. We measured photosynthetic CO 2 response curves and leaf nitrogen (N) content in species representing the dominant vascular plant functional types found on the coastal tundra near Barrow, Alaska. The activation energies associated with the temperature response functions of V c,max and J max were 17% lower than commonly used values. When scaled to 25°C, V c,max.25 and J max.25 were two- to five-fold higher than the values used to parameterize current TBMs. This high photosynthetic capacity was attributable to a high leaf N content and the high fraction of N invested in Rubisco. Leaf-level modeling demonstrated that current parameterization of TBMs resulted in a two-fold underestimation of the capacity for leaf-level CO 2 assimilation in Arctic vegetation. This study highlights the poor representation of Arctic photosynthesis in TBMs, and pro- vides the critical data necessary to improve our ability to project the response of the Arctic to global environmental change. Introduction Carbon (C) uptake and loss from high-latitude ecosystems are highly sensitive to climate change, and these processes are poorly represented in Earth system models. The Arctic has experienced the greatest regional warming (Kaufman et al., 2009) and is pro- jected to warm twice as much as the rest of the planet by the end of the century (IPCC, 2013). The resulting widely observed per- mafrost thaw and degradation are projected to continue as the region warms, leading to the release of large amounts of stored C into the atmosphere (Jorgenson et al., 2006; Schuur et al., 2009, 2015; Koven et al., 2015). At the same time, rising carbon diox- ide concentration ([CO 2 ]), increasing temperature and increased nitrogen (N) availability may stimulate CO 2 uptake and lead to a continued and enhanced ‘greening’ of the Arctic landscape, creat- ing critical uncertainty over the future of the Arctic C cycle (Sturm et al., 2001; Tape et al., 2006; Frost & Epstein, 2014; Salmon et al., 2016). Accurate projection of C fluxes at high lati- tudes will require improved model representation of these pro- cesses in terrestrial biosphere models (TBMs). A recent analysis has demonstrated that, in current TBMs, photosynthesis remains a dominant source of C cycle uncertainty in the Arctic (Fisher et al., 2014). Leaf-level photosynthesis is represented in many TBMs by the Farquhar, von Caemmerer and Berry (FvCB) model (Farquhar et al., 1980; von Caemmerer, 2000). Two key parameters required by the FvCB model are the maximum carboxylation rate (V c,max ) by the photosynthetic enzyme Rubisco (EC number 4.1.1.39) and the maximum electron transport rate (J max ) associated with regeneration of the CO 2 acceptor molecule ribu- lose-1,5-bisphosphate (RuBP). Currently, most TBMs use plant functional types (PFTs) to represent the vegetation present in dif- ferent biomes, and these PFTs are parameterized with traits that are used to model the CO 2 uptake of the vegetation in a given biome. There are a range of alternative approaches that seek to replace PFTs with a ‘trait-based’ approach in future TBMs (Wullschleger et al., 2014). However, these approaches, such as trait–environment linkages (e.g. van Bodegom et al., 2014), trait filtering (e.g. Fisher et al., 2012) and optimality approaches (e.g. Xu et al., 2012), still use an FvCB approach to represent photo- synthesis, and still need data to inform parameterization, model development and to evaluate prognostic traits. In current TBMs, V c,max at 25°C(V c,max.25 ) is typically a PFT-specific model input, whereas J max at 25°C(J max.25 ) is commonly calculated from the PFT-specific V c,max.25 using a TBM-specific ratio between J max.25 and V c,max.25 (JV ratio.25 ). The JV ratio has also been used in the 1090 New Phytologist (2017) 216: 1090–1103 No claim to original US Government works New Phytologist Ó 2017 New Phytologist Trust www.newphytologist.com Research
Transcript of Terrestrial biosphere models underestimate photosynthetic ......Terrestrial biosphere models...
Terrestrial biosphere models underestimate photosyntheticcapacity and CO2 assimilation in the Arctic
Alistair Rogers1, Shawn P. Serbin1, Kim S. Ely1, Victoria L. Sloan2 and Stan D. Wullschleger2
1Environmental and Climate Sciences Department, Brookhaven National Laboratory, Upton, NY 11973-5000, USA; 2Environmental Sciences Division, Oak Ridge National Laboratory, Oak
Ridge, TN 37831-6301, USA
Author for correspondence:Alistair Rogers
Tel: +1 631 344 2948Email: [email protected]
Received: 6 June 2017
Accepted: 8 July 2017
New Phytologist (2017) 216: 1090–1103doi: 10.1111/nph.14740
Key words: earth system models, maximumcarboxylation capacity (Vc,max), maximumelectron transport rate (Jmax), photosynthesis,Rubisco, temperature response function,tundra.
Summary
� Terrestrial biosphere models (TBMs) are highly sensitive to model representation of photo-
synthesis, in particular the parameters maximum carboxylation rate and maximum electron
transport rate at 25°C (Vc,max.25 and Jmax.25, respectively). Many TBMs do not include repre-
sentation of Arctic plants, and those that do rely on understanding and parameterization from
temperate species.� We measured photosynthetic CO2 response curves and leaf nitrogen (N) content in species
representing the dominant vascular plant functional types found on the coastal tundra near
Barrow, Alaska.� The activation energies associated with the temperature response functions of Vc,max and
Jmax were 17% lower than commonly used values. When scaled to 25°C, Vc,max.25 and Jmax.25
were two- to five-fold higher than the values used to parameterize current TBMs. This high
photosynthetic capacity was attributable to a high leaf N content and the high fraction of N
invested in Rubisco. Leaf-level modeling demonstrated that current parameterization of TBMs
resulted in a two-fold underestimation of the capacity for leaf-level CO2 assimilation in Arctic
vegetation.� This study highlights the poor representation of Arctic photosynthesis in TBMs, and pro-
vides the critical data necessary to improve our ability to project the response of the Arctic to
global environmental change.
Introduction
Carbon (C) uptake and loss from high-latitude ecosystems arehighly sensitive to climate change, and these processes are poorlyrepresented in Earth system models. The Arctic has experiencedthe greatest regional warming (Kaufman et al., 2009) and is pro-jected to warm twice as much as the rest of the planet by the endof the century (IPCC, 2013). The resulting widely observed per-mafrost thaw and degradation are projected to continue as theregion warms, leading to the release of large amounts of stored Cinto the atmosphere (Jorgenson et al., 2006; Schuur et al., 2009,2015; Koven et al., 2015). At the same time, rising carbon diox-ide concentration ([CO2]), increasing temperature and increasednitrogen (N) availability may stimulate CO2 uptake and lead to acontinued and enhanced ‘greening’ of the Arctic landscape, creat-ing critical uncertainty over the future of the Arctic C cycle(Sturm et al., 2001; Tape et al., 2006; Frost & Epstein, 2014;Salmon et al., 2016). Accurate projection of C fluxes at high lati-tudes will require improved model representation of these pro-cesses in terrestrial biosphere models (TBMs). A recent analysishas demonstrated that, in current TBMs, photosynthesis remainsa dominant source of C cycle uncertainty in the Arctic (Fisheret al., 2014).
Leaf-level photosynthesis is represented in many TBMs by theFarquhar, von Caemmerer and Berry (FvCB) model (Farquharet al., 1980; von Caemmerer, 2000). Two key parametersrequired by the FvCB model are the maximum carboxylation rate(Vc,max) by the photosynthetic enzyme Rubisco (EC number4.1.1.39) and the maximum electron transport rate (Jmax)associated with regeneration of the CO2 acceptor molecule ribu-lose-1,5-bisphosphate (RuBP). Currently, most TBMs use plantfunctional types (PFTs) to represent the vegetation present in dif-ferent biomes, and these PFTs are parameterized with traits thatare used to model the CO2 uptake of the vegetation in a givenbiome. There are a range of alternative approaches that seek toreplace PFTs with a ‘trait-based’ approach in future TBMs(Wullschleger et al., 2014). However, these approaches, such astrait–environment linkages (e.g. van Bodegom et al., 2014), traitfiltering (e.g. Fisher et al., 2012) and optimality approaches (e.g.Xu et al., 2012), still use an FvCB approach to represent photo-synthesis, and still need data to inform parameterization, modeldevelopment and to evaluate prognostic traits. In current TBMs,Vc,max at 25°C (Vc,max.25) is typically a PFT-specific model input,whereas Jmax at 25°C (Jmax.25) is commonly calculated from thePFT-specific Vc,max.25 using a TBM-specific ratio between Jmax.25
and Vc,max.25 (JVratio.25). The JVratio has also been used in the
1090 New Phytologist (2017) 216: 1090–1103 No claim to original US Government works
New Phytologist� 2017 New Phytologist Trustwww.newphytologist.com
Research
opposite direction to estimate Vc,max from remotely sensedchlorophyll content (Alton, 2017). Based on previous analysis(Wullschleger, 1993), JVratio.25 has long been assumed to be con-stant for all PFTs, but has been shown to decrease with increasinggrowth temperature (Kattge & Knorr, 2007). Critically, JVratio.25
can have a significant impact on photosynthetic CO2 responsive-ness, with a higher JVratio.25 enabling a more responsive Rubisco-limited increase in photosynthesis as [CO2] rises (Rogers et al.,2017c). In TBMs, photosynthesis is particularly sensitive to thetemperature response functions (TRFs) used to scale both Vc,max
and Jmax from the reference temperature, usually 25°C, to growthtemperature. However, these TRFs are typically assumed to beidentical for all PFTs (Rogers et al., 2017c). Mounting evidencehas shown that this is not a valid assumption and there is anongoing effort in the community to capture PFT-specific TRFsfor use in TBMs (Medlyn et al., 2002; Varhammar et al., 2015;Galmes et al., 2016). This is particularly important for the Arctic,because widely used TRFs have been derived from measurementsmade on temperate species and do not include measurementsmade below 10°C, a typical growth temperature for Arcticspecies (Bernacchi et al., 2001, 2003).
Sensitivity analysis, model simulations and efforts to identifymodel parameter uncertainty have repeatedly shown that modelprojections of gross and net primary productivity are particularlysensitive to Vc,max.25, and the parameters used to estimate it(Friend, 2010; Bonan et al., 2011; Lebauer et al., 2013; Sargsyanet al., 2014). Moreover, previous studies have also shown thatmodel uncertainty in plant productivity can be significantlyreduced through the incorporation of PFT-specific measured val-ues of Vc,max (Dietze et al., 2014). However, a recent examinationof the derivation of Vc,max in 10 TBMs revealed that most modelsdo not have an explicit Arctic PFT and the four models that doinclude an Arctic PFT rely on limited or inappropriate datasetsto estimate Arctic Vc,max.25 (Rogers, 2014).
There is a rich history of ecological research in the Arctic,including many studies that have measured photosynthesis(Wookey et al., 1995; Chapin & Shaver, 1996; Muraoka et al.,2002, 2008; Starr & Oberbauer, 2003; Starr et al., 2004; Reichet al., 2009; Albert et al., 2011; Boesgaard et al., 2012; Fletcheret al., 2012; Leffler & Welker, 2013; Patankar et al., 2013;Heskel et al., 2014; Souther et al., 2014; Saarinen et al., 2016).However, at the time we began this study, there were no pub-lished data on Vc,max or Jmax measured in Arctic vegetation thatcould be used to inform the representation of Arctic photosyn-thesis in TBMs and, to the best of our knowledge, only one otherstudy emerged after we began our work (van de Weg et al. 2013).In short, the data needed to understand and parameterize a keyprocess that has been demonstrated to be driving marked uncer-tainty in TBM projections of the C cycle in a critical biome areessentially missing.
We hypothesized that current TBM representation and param-eterization of photosynthesis, which is based largely on knowl-edge gained in temperate systems, will be markedly different forArctic vegetation. The goal of this study was to increase ourunderstanding of photosynthesis in the Arctic and to providenew data and insights that could be used to reduce uncertainty in
TBM projections of photosynthesis in the Arctic, either directlythrough improved parameterization of the Arctic PFT, or indi-rectly through the evaluation of emergent model states that resultfrom alternative ‘trait-based’ modeling approaches (prognosticphotosynthetic parameters). In this study, we provide the firstArctic dataset on the critical photosynthetic traits Vc,max.25 andJmax.25, their TRFs and associated biochemical and structuraltraits; and compare these data with the parameterization cur-rently used in TBMs, including the use of plant traits to derivephotosynthetic parameters.
Materials and Methods
Plant material
This study was conducted on the coastal tundra at the BarrowEnvironmental Observatory (BEO), near Barrow, AK (71.3°N,156.5°W; note that, on 1 December 2016, Barrow was officiallyrenamed Utqia _gvik following the original Inupiat name), USA.The BEO landscape is characterized by small thaw ponds andlow- and high-centered polygons with a low vascular plant speciesdiversity that is dominated by Carex aquatilis (Brown et al.,1980). Mean annual air temperature is �12°C (annual range,31°C) and mean annual precipitation is 106 mm, with themajority falling as rain during the short summer. Soils are gener-ally classified as Gelisols, underlain by permafrost which extendsto depths of 300 m or greater, with an active layer thickness of20–70 cm (Brown et al., 1980; Bockheim et al., 1999; Shiklo-manov et al., 2010).
The measurement of leaf traits and gas exchange was con-ducted over an area of c. 1 km2 centered at 71.28°N, 156.65°W.This area was characterized by zones of disturbance and signifi-cant permafrost degradation, standing water, dry, high-centeredpolygons as well as relatively undisturbed low-centered polygonalground that collectively provided diverse microtopography anddrainage, and therefore highly suitable habitats for large stands ofthe different species of interest. Our goal was to measure keytraits in the dominant vascular plants in this landscape, but alsoin those plants that represented key Arctic PFTs (Chapin et al.,1996). Our choice of species was also constrained by practicallimitations of the gas exchange instrumentation: for example, theability to clamp on a leaf with sufficient leaf area to provide anacceptable signal-to-noise ratio that enabled us to measure a CO2
response curve. We studied seven species covering four ArcticPFTs: grasses, Arctagrostis latifolia (R.Br.) Griseb, Arctophilafulva (Trin.) Andersson, Dupontia fisheri R.Br.; sedges, Carexaquatilis Wahlenb., Eriophorum angustifolium Honck.; forbs,Petasites frigidus (L.) Fr.; and deciduous shrubs, Salix pulchraCham. As a result of the clonal nature of these species, it was notpossible to determine whether individual ramets were geneticallydistinct. Therefore, stands separated by geomorphological fea-tures, i.e. different polygonal units or thaw ponds, were chosen toincrease the likelihood that they were not members of the sameclonal colony (Shaver et al., 1979). Measurements were takenbetween 10 July and 10 August (2012–2016), a period character-ized by cool temperatures and continuous daylight. The bulk of
No claim to original US Government works
New Phytologist� 2017 New Phytologist TrustNew Phytologist (2017) 216: 1090–1103
www.newphytologist.com
NewPhytologist Research 1091
our measurements were focused on the period of the peakbiomass (mid to late July), when the first mature leaves in thesespecies are available for gas exchange, but before the onset of leafsenescence. As a result of the scarcity of individuals of somespecies (S. pulchra), additional data collection associated an effortto link leaf spectral signatures with physiology (Serbin et al.,2012) and the challenge of taking good measurements (D. fish-eri), our replication within a species varied (A. latifolia, n = 13;A. fulva, n = 26; C. aquatilis, n = 36; D. fisheri, n = 8;E. angustifolium, n = 43; P. frigidus, n = 44; S. pulchra, n = 9).
Gas exchange and derived parameters
Gas exchange measurements were made in the field using two tofive LI-6400XT gas exchange systems (Li-Cor, Lincoln, NE,USA) that were zeroed at the field site with a common nitrogenstandard (99.9998% N2, CO2 < 0.5 ppm, H2O < 0.5 ppm;Alphagaz 2, Air Liquide American Specialty Gases LLC,Anchorage, AK, USA). We measured the response of photosyn-thesis (A) to intercellular CO2 concentration (Ci), commonlycalled A–Ci curves. Leaf chamber temperature was maintained atambient temperature using the Peltier-based temperature controlof the gas exchange system by setting the chamber block tempera-ture to match the air temperature measured using the leaf ther-mocouple with the chamber open. The water vapor pressure ofair entering the chamber was not controlled and thereforematched ambient conditions. However, on cold, high-humiditydays, the block temperature was set to 0.5–1.5°C above ambientair temperature to increase the differential between the dew pointtemperature and the chamber block temperature in order to elim-inate the chance of condensation inside the instrument. Evenwith this slight increase in temperature, the leaf water vapor pres-sure deficit (VPDleaf) was always below 1.0 kPa and, typically,c. 0.3 kPa. All measurements were made on fully expanded leaves.When the leaf did not completely fill the leaf chamber of theinstrument, which was the case for all the graminoid species,the leaf material protruding from the chamber was marked at theedge of the gasket to identify the section that was enclosed in thechamber. The leaf was then removed from the chamber andplant, and the enclosed section was measured indoors with a rulerand hand lens to allow the determination of the leaf width to thenearest 0.25 mm. The leaf width was then used to calculate theleaf area enclosed by the leaf chamber, and gas exchange datawere recomputed using the measured leaf area.
During the period of measurement, the Arctic experiences24 h of daylight. As a result, transient decreases in chloroplastinorganic phosphate concentration and photosystem II effi-ciency, which can occur shortly after initial illumination, andwhich may alter the response of A to Ci, are not a concern(Ainsworth et al., 2003). In addition, attempts to remove plantmaterial from the field and to conduct measurements indoors,where marked temperature manipulation would be possible,were unsuccessful. Therefore, A–Ci curves were all measuredin situ. Preliminary light response curves, in which we carefullycontrolled for CO2 concentration and leaf temperature, indi-cated that, despite expectations, these Arctic species did not
photosaturate below 1500 lmol m�2 s�1. Therefore, we usedan irradiance of 2000 lmol m�2 s�1 for our light-saturatedmeasurements. The differential between sample and referenceinfrared gas analyzers (IRGAs) was maximized using the 29 3-cm2 leaf chamber to increase potential leaf area, and by lower-ing the flow rate (typically to 350 lmol s�1) until the CO2 dif-ferential between sample and reference chambers was c.10 lmol CO2 mol�1 at a CO2 reference chamber set point of400 lmol mol�1 and saturating irradiance. This ensured agood signal-to-noise ratio at low [CO2]. After clamping on aleaf, the chamber was leak tested by vigorously blowingthrough a tube directed at the margins of the gasket. Whenleaks were identified (fluctuations in [CO2] in the sample cell> 1 lmol mol�1 over 15 s), the leaf was repositioned or leakswere sealed with a silicone compound (Molykote 111; DowCorning, MI, USA). Following the established procedure(Long & Bernacchi, 2003; Bernacchi et al., 2006), each leafwas first allowed to achieve steady-state CO2 and water vaporexchange. The minimum amount of time allowed for stabiliza-tion was 20 min, but, typically, we waited more than 30 min.The reference [CO2] was then reduced stepwise to50 lmol mol�1, returned to 400 lmol mol�1 and thenincreased stepwise to 1800 lmol mol�1. Each individual curveconsisted of 13 separate CO2 set points and included multipleset points at a [CO2] value of 400 lmol mol�1 to allow forpotential recovery from low [CO2]. Response curves were mea-sured rapidly to avoid acclimation to a given set point. Follow-ing an adjustment to a new [CO2] value, data were logged assoon as the [CO2] in the reference cell was stable(SD < 0.75 lmol mol�1 over 20 s). Following equilibration,each curve took c. 30 min to complete.
In addition to making measurements at ambient growth tem-perature in all species, we also measured A–Ci response curves atmultiple temperatures on the same leaf in P. frigidus andE. angustifolium in order to expand the temperature range of ourdataset. This was achieved using the cooling and heating featureof the gas exchange system. In some cases, we focused on theinitial slope of this response to speed up measurements and, as aresult, collected more data on the temperature response of Vc,max
than Jmax. In each case, following the completion of a full orpartial CO2 response curve, the leaf temperature was increasedby c. 5°C and allowed to stabilize for a minimum of 20 minbefore a new response curve was measured. At our high-temperature limit (25°C), VPDleaf did not rise above 1.75 kPa.Analysis of the data from a nearby flux tower (Torn et al., 2014and unpublished data) showed that mean daily air temperatureson the days preceding our measurements were similar (3.7� 2.5SD (5-d average), 4.3� 2.0 SD (10-d average), 4.3� 1.7 SD(30-d average)), giving us confidence that, when combining ourfull dataset for the analysis of temperature response functions,there would be no marked impact of potential thermal acclima-tion to the air temperature of the days preceding our measure-ments.
The photosynthetic parameters Vc,max and Jmax were estimatedbased on the equations originally described by Farquhar et al.(1980), where A is the minimum of the RuBP-saturated CO2
New Phytologist (2017) 216: 1090–1103 No claim to original US Government works
New Phytologist� 2017 New Phytologist Trustwww.newphytologist.com
Research
NewPhytologist1092
assimilation rate (Ac) and the RuBP-limited CO2 assimilationrate (Aj, Eqn 1).
A ¼ minðAc;AjÞ Eqn 1
Triose phosphate utilization (TPU) limitation can also be athird limitation on A, but usually occurs at a higher than physio-logically relevant CO2 concentration (Sharkey, 1985). We sawno evidence of TPU limitation of A in our A–Ci curves, despitethe low measurement temperatures. One possible explanationfor the absence of TPU limitation is the large root : shoot ratio(Iversen et al., 2015), and hence sink capacity, in Arctic specieswhich would limit the potential feedback inhibition of photo-synthesis by minimizing the buildup of triose phosphate in theleaves. Therefore, we did not include TPU limitation in ourmodel formulation for the estimation of Vc,max and Jmax. We didnot account for the influence of mesophyll conductance on theestimates of Vc,max and Jmax, and thus our reported ‘apparent’values are based on intercellular as opposed to chloroplastic[CO2].
Apparent Vc,max and apparent Jmax were determined based onCi, as described previously, using the commonly employedmethod of separate fitting of A to Ci for Rubisco and RuBPregeneration-limited A (Farquhar et al., 1980; Bernacchi et al.,2013). Ac was modeled based on Eqn 2, where Ci and Oi are theintercellular CO2 and O2 concentrations (Oi = 210 mmolmol�1), respectively, Γ* is the CO2 compensation point in theabsence of non-photorespiratory mitochondrial respiration in thelight, and Kc and Ko are the Michaelis–Menten coefficients ofRubisco activity for CO2 and O2, respectively. We used theNADPH-limited version of the equation used to describe theelectron transport rate in the determination of the RuBP-limitedCO2 assimilation rate (Aj, Eqn 3), and employed the values andtemperature sensitivities of Kc, Ko and Γ* from Bernacchi et al.(2001).
Ac ¼ ðCi � C�ÞVc;max
Kc 1þ Oi
Ko
� �þ Ci
� Rd Eqn 2
Aj ¼ ðCi � C�ÞJ4C þ 8C� � Rd Eqn 3
We parameterized Eqns 2 and 3 of the FvCB model, using acustom program (https://github.com/TESTgroup-BNL/R-GasExchange/releases/tag/0.8) developed within the R statisticalenvironment (R Development Core Team, 2013), to calculatethe optimum apparent Vc,max, apparent Jmax and leaf respirationfor each A–Ci curve. Our model fitting utilized the derivativeevolution (DE) algorithm (Price et al., 2006), implemented inthe R package ‘DEOPTIM’ (Ardia, 2009), to minimize the differ-ence between the modeled and observed photosynthetic rate toderive the optimum apparent Vc,max and apparent Jmax for eachA–Ci curve. The DE algorithm is a stochastic, population-basedoptimizer, which seeks the global minimum of the objective
function without the need for arbitrary initial parameter valueswhich can result in errors in optimization (Dubois et al., 2007).Our parameter optimization strategy was implemented to avoidthe co-limited region of the A–Ci response curve, which, forthese Arctic species, was at a high Ci: Vc,max was estimated fromthe lower portion of the A–Ci curve (Ci < 400 Pa) and Jmax wasestimated from the upper portion of the curve (Ci > 650 Pa).
The temperature responses of Vc,max and Jmax were determinedby fitting measured values against the mean Tleaf for each individ-ual A–Ci response curve, as described previously (Medlyn et al.,2002), which allowed us to estimate the activation energy (Ea)associated with Vc,max and Jmax. We then used Eqn 4 (shown forVc,max) to scale the measured Vc,max at Tleaf (Vc,max.T) to Vc,max at25°C (Vc,max.25). Tleaf was expressed in K and R is the universalgas constant (8.314 J mol�1 K�1). Again, we utilized the ‘DEOP-
TIM’ parameter optimization algorithm in R to fit the temperatureresponse model (Eqn. 4).
Vc;max:T ¼ Vc;max:25 expEaðTleaf � 298:15Þð298:15R Tleaf Þ
� �Eqn 4
Biochemical analysis
The leaf area enclosed by the leaf chamber of the IRGAwas removed, placed in a paper envelope and dried to aconstant mass (70°C, Lindberg Blue M, Thermo Scientific,Waltham MA, USA) before shipping to BrookhavenNational Laboratory. Leaf samples were weighed to obtainthe leaf mass area (LMA, g m�2) and then ground to a finepowder using a ball mill (2000 Geno Grinder; Spex SamplePrep, Cridersville, OH, USA). A 1.50–2.50-mg aliquot wasweighed in 0.1-ml tin foil vials (AX26DR; Mettler Toledo,Columbus, OH, USA) and used to determine the C to Nratio (CNratio) and elemental N content employing aCHNS/O elemental analyzer operated in CHN mode,according to the manufacturer’s instructions (2400 Series IICHNS/0 Analyzer; Perkin Elmer, Waltham, MA, USA).
The fraction of leaf N invested in Rubisco
The fraction of leaf N invested in Rubisco (FLNR) can becalculated as described previously (Thornton & Zimmermann,2007) following Eqn 5, where leaf N content on an area basis(Na, g m
�2) and Vc,max.25 are PFT-specific inputs, and the speci-fic activity of Rubisco (aR25) and the mass ratio of total Rubiscomolecular mass to N in Rubisco (FNR) are considered to beglobal constants.
FLNR ¼ Vc;max:25
NaFNRaR25Eqn 5
We derived FLNR from the mean Vc,max.25 (Fig. 2a), mean Na
(Fig. 4a) and the values for FNR (6.22 g Rubisco g�1 N inRubisco) and aR25 (47.3 lmol CO2 g
�1 Rubisco s�1) providedby Rogers (2014).
No claim to original US Government works
New Phytologist� 2017 New Phytologist TrustNew Phytologist (2017) 216: 1090–1103
www.newphytologist.com
NewPhytologist Research 1093
Models considered
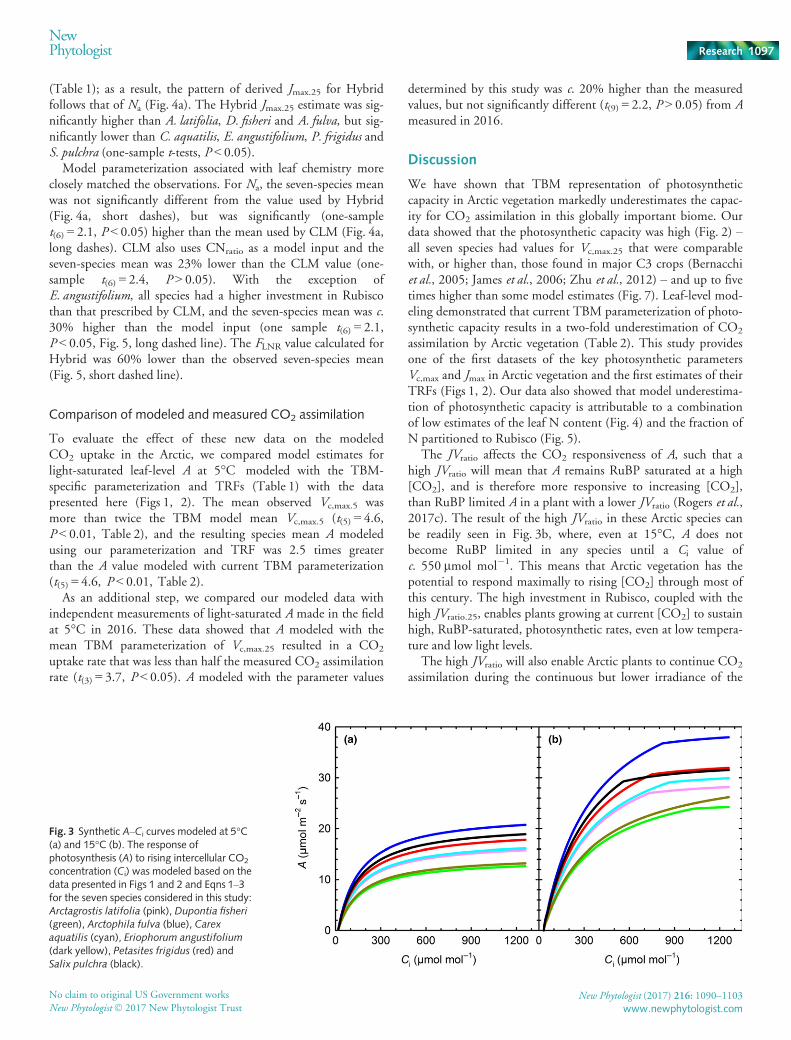
We looked at the model parameterization for all the TBMs repre-sented in the fourth and fifth phases of the Coupled Climate Car-bon Cycle Model Intercomparison Project (Friedlingstein et al.,2006, 2014) and those identified in a recent review of global scalemodels (Smith & Dukes, 2013). Only four models includedexplicit parameterization of an Arctic PFT and were consideredin detail here (Table 1). In order to compare the parameterizationof these four models with the data presented in this study and,importantly, to avoid mixing and matching temperature responsefunctions and kinetic constants (Rogers et al., 2017c), we scaledour measured photosynthetic parameters to 25°C using the tem-perature response functions and Q10 values or activation energiesfor Vc,max and Jmax used by the models (Table 1). For the Atmo-sphere–Vegetation Interaction Model (AVIM), it was necessaryto refit the A–Ci response curves using the kinetic constants andTRFs employed by Collatz et al. (1991), and then scale Vc,max.T
to 25°C using the Q10 temperature response function for AVIMpresented in Table 1. To account for the temperature acclimationformulations in the Biosphere Energy Transfer HydrologyScheme (BETHY) and Community Land Model (CLM) used inthe calculation of JVratio.25 and DS (Table 1), we employed datafrom a nearby flux tower to provide mean daily air temperaturefor the proceeding 10 (CLM) and 30 (BETHY) days. For CLM,this 10-d mean temperature was below the restricted temperaturerange implemented in the model, and therefore the 11°C defaultvalue was used in our calculations (Oleson et al., 2013).
Statistical analysis
Significant (P < 0.05) variation among species was identifiedusing a one-way analysis of variance (ANOVA). Significantdifferences between an individual species (or the seven speciesmean) and an individual TBM input were identified using aone-sample t-test. Significant differences between the measuredphotosynthetic parameters and the model inputs from the fourTBMs, and differences between the leaf-level photosynthesismodeled with the measured parameterization and TBM parame-terization, were identified using a two-tailed Student’s t-test.
Results
Activation energy values associated with the temperatureresponse functions of Vc,max and Jmax
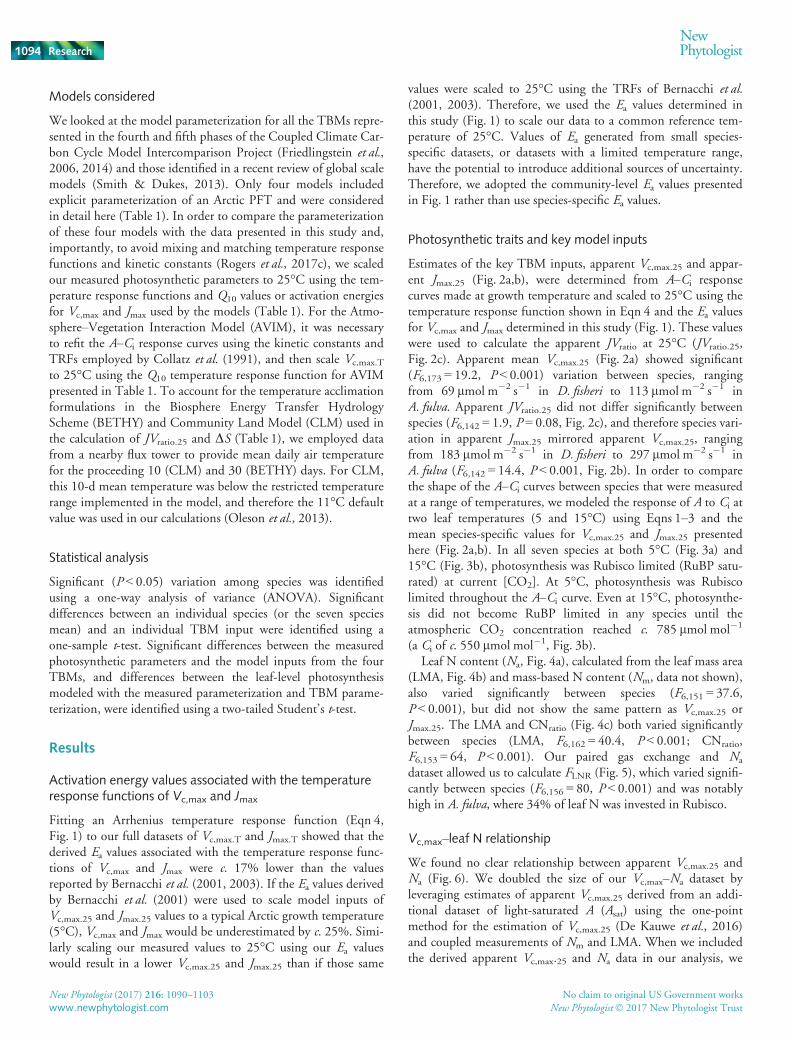
Fitting an Arrhenius temperature response function (Eqn 4,Fig. 1) to our full datasets of Vc,max.T and Jmax.T showed that thederived Ea values associated with the temperature response func-tions of Vc,max and Jmax were c. 17% lower than the valuesreported by Bernacchi et al. (2001, 2003). If the Ea values derivedby Bernacchi et al. (2001) were used to scale model inputs ofVc,max.25 and Jmax.25 values to a typical Arctic growth temperature(5°C), Vc,max and Jmax would be underestimated by c. 25%. Simi-larly scaling our measured values to 25°C using our Ea valueswould result in a lower Vc,max.25 and Jmax.25 than if those same
values were scaled to 25°C using the TRFs of Bernacchi et al.(2001, 2003). Therefore, we used the Ea values determined inthis study (Fig. 1) to scale our data to a common reference tem-perature of 25°C. Values of Ea generated from small species-specific datasets, or datasets with a limited temperature range,have the potential to introduce additional sources of uncertainty.Therefore, we adopted the community-level Ea values presentedin Fig. 1 rather than use species-specific Ea values.
Photosynthetic traits and key model inputs
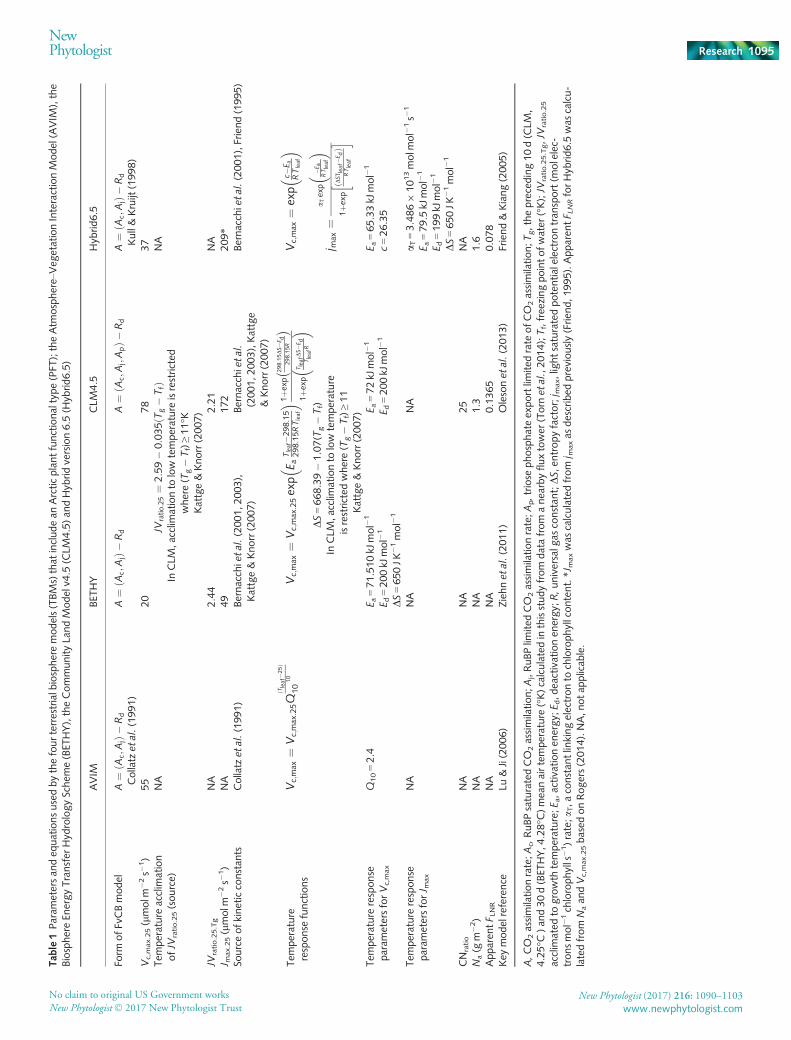
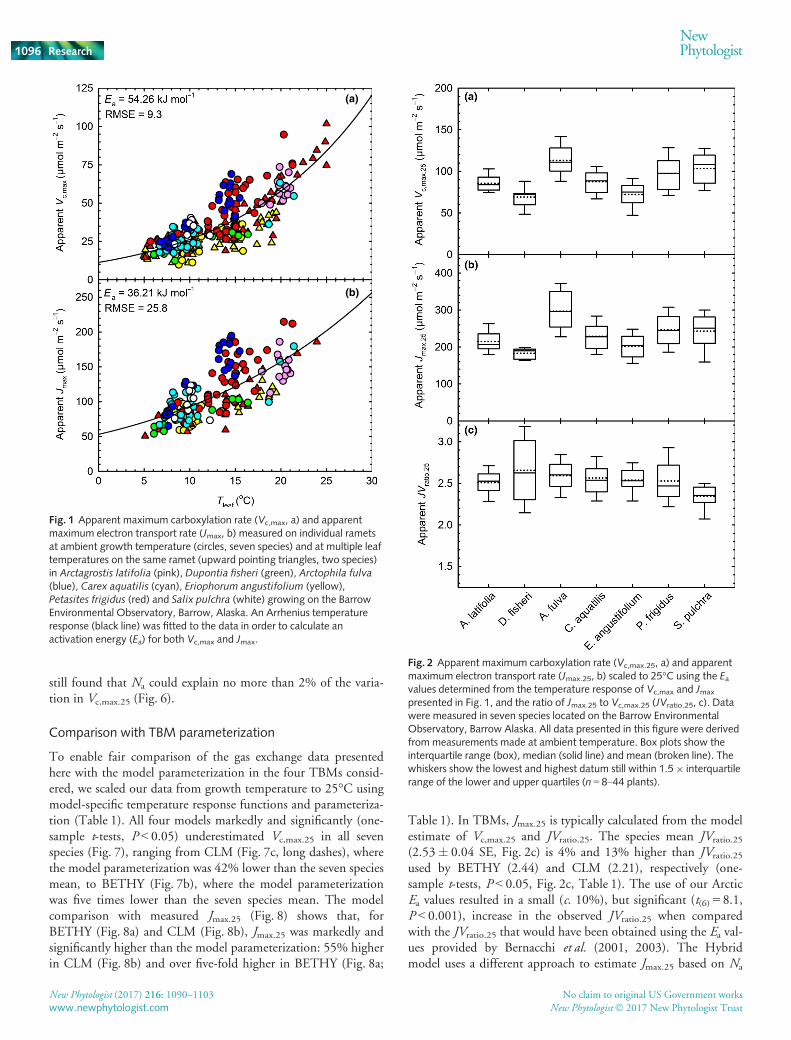
Estimates of the key TBM inputs, apparent Vc,max.25 and appar-ent Jmax.25 (Fig. 2a,b), were determined from A–Ci responsecurves made at growth temperature and scaled to 25°C using thetemperature response function shown in Eqn 4 and the Ea valuesfor Vc,max and Jmax determined in this study (Fig. 1). These valueswere used to calculate the apparent JVratio at 25°C (JVratio.25,Fig. 2c). Apparent mean Vc,max.25 (Fig. 2a) showed significant(F6,173 = 19.2, P < 0.001) variation between species, rangingfrom 69 lmol m�2 s�1 in D. fisheri to 113 lmol m�2 s�1 inA. fulva. Apparent JVratio.25 did not differ significantly betweenspecies (F6,142 = 1.9, P = 0.08, Fig. 2c), and therefore species vari-ation in apparent Jmax.25 mirrored apparent Vc,max.25, rangingfrom 183 lmol m�2 s�1 in D. fisheri to 297 lmol m�2 s�1 inA. fulva (F6,142 = 14.4, P < 0.001, Fig. 2b). In order to comparethe shape of the A–Ci curves between species that were measuredat a range of temperatures, we modeled the response of A to Ci attwo leaf temperatures (5 and 15°C) using Eqns 1–3 and themean species-specific values for Vc,max.25 and Jmax.25 presentedhere (Fig. 2a,b). In all seven species at both 5°C (Fig. 3a) and15°C (Fig. 3b), photosynthesis was Rubisco limited (RuBP satu-rated) at current [CO2]. At 5°C, photosynthesis was Rubiscolimited throughout the A–Ci curve. Even at 15°C, photosynthe-sis did not become RuBP limited in any species until theatmospheric CO2 concentration reached c. 785 lmol mol�1
(a Ci of c. 550 lmol mol�1, Fig. 3b).Leaf N content (Na, Fig. 4a), calculated from the leaf mass area
(LMA, Fig. 4b) and mass-based N content (Nm, data not shown),also varied significantly between species (F6,151 = 37.6,P < 0.001), but did not show the same pattern as Vc,max.25 orJmax.25. The LMA and CNratio (Fig. 4c) both varied significantlybetween species (LMA, F6,162 = 40.4, P < 0.001; CNratio,F6,153 = 64, P < 0.001). Our paired gas exchange and Na
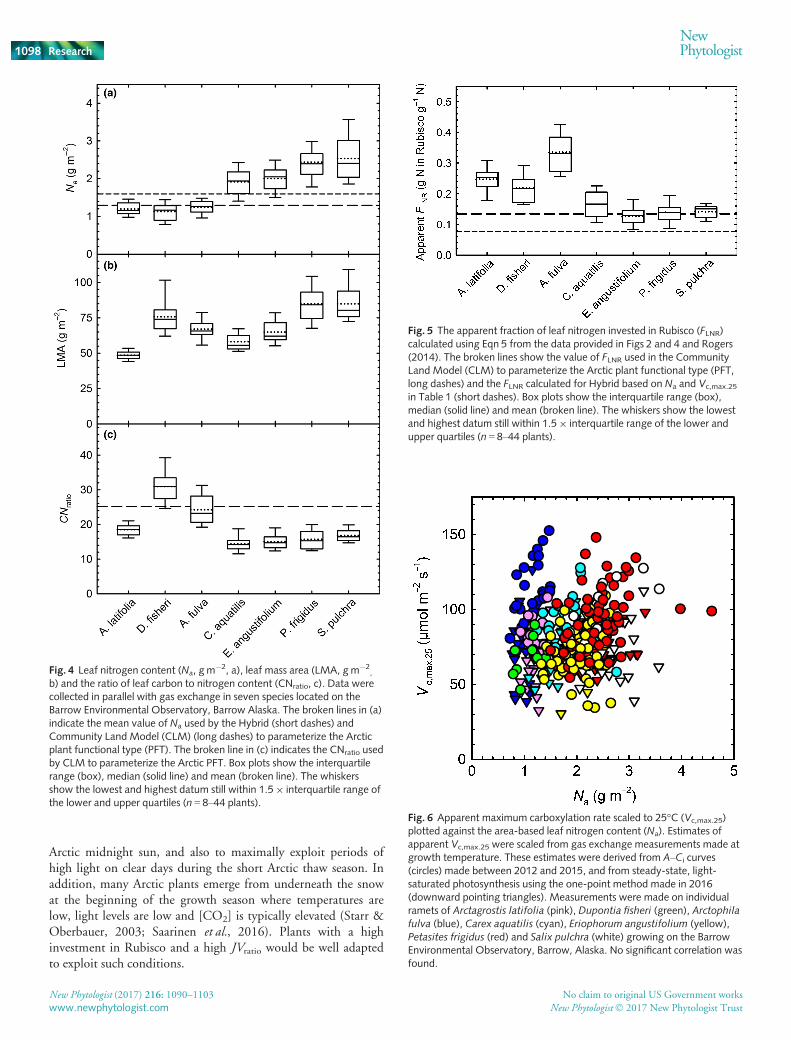
dataset allowed us to calculate FLNR (Fig. 5), which varied signifi-cantly between species (F6,156 = 80, P < 0.001) and was notablyhigh in A. fulva, where 34% of leaf N was invested in Rubisco.
Vc,max–leaf N relationship
We found no clear relationship between apparent Vc,max.25 andNa (Fig. 6). We doubled the size of our Vc,max–Na dataset byleveraging estimates of apparent Vc,max.25 derived from an addi-tional dataset of light-saturated A (Asat) using the one-pointmethod for the estimation of Vc,max.25 (De Kauwe et al., 2016)and coupled measurements of Nm and LMA. When we includedthe derived apparent Vc,max.25 and Na data in our analysis, we
New Phytologist (2017) 216: 1090–1103 No claim to original US Government works
New Phytologist� 2017 New Phytologist Trustwww.newphytologist.com
Research
NewPhytologist1094
Tab
le1Param
etersan
deq
uationsusedbythefourterrestrialb
iospheremodels(TBMs)that
includean
Arcticplantfunctionaltype(PFT
);theAtm
osphere–Veg
etationInteractionModel(AVIM
),the
BiosphereEn
ergyTransfer
Hyd
rologySchem
e(BET
HY),theCommunityLa
ndModelv4
.5(CLM
4.5)an
dHyb
ridve
rsion6.5
(Hyb
rid6.5)
AVIM
BET
HY
CLM
4.5
Hyb
rid6.5
Form
ofFv
CBmodel
A¼
ðAc;A
j�Rd
Collatz
etal.(1991)
A¼
ðAc;A
j�Rd
A¼
ðAc;A
j;Ap�
Rd
A¼
ðAc;A
j�Rd
Kull&Kruijt
(1998)
Vc,max.25(lmolm
�2s�
1)
55
20
78
37
Tem
perature
acclim
ation
ofJV
ratio.25(source)
NA
JVratio:25¼
2:59�0:035ðT
g�TfÞ
InCLM
,acclim
ationto
low
temperature
isrestricted
where(T
g�Tf)≥11°K
Kattge&Knorr(2007)
NA
JVratio.25.Tg
NA
2.44
2.21
NA
J max.25(lmolm
�2s�
1)
NA
49
172
209*
Sourceofkineticconstan
tsCollatz
etal.(1991)
Bernacchietal.(2001,2003),
Kattge&Knorr(2007)
Bernacchietal.
(2001,2003),Kattge
&Knorr(2007)
Bernacchietal.(2001),Friend(1995)
Tem
perature
response
functions
Vc;max
¼Vc;max
:25Q
ðTleaf�2
5Þ
10
10
Vc;max
¼Vc;max
:25ex
pE a
Tleaf�2
98:15
298:15RTleaf
�� 1þ
exp
298:15DS�
E d298:15R
��
1þe
xpTleafDS�
E dTleafR
��
DS=668.39�1.07(T
g�Tf)
InCLM
,acclim
ationto
low
temperature
isrestricted
where(T
g�Tf)≥11
Kattge&Knorr(2007)
Vc;max
¼ex
pc�
E aRTleaf
��
j max
¼a T
exp
�Ea
RTleaf
��
1þe
xpDST
leaf�E
dð
ÞRTleaf
hi
Tem
perature
response
param
etersforVc,max
Q10=2.4
E a=71.510kJ
mol�
1
E d=200kJ
mol�
1
DS=650JK�1mol�
1
E a=72kJ
mol�
1
E d=200kJ
mol�
1Ea=65.33kJ
mol�
1
c=26.35
Tem
perature
response
param
etersforJ m
ax
NA
NA
NA
aT=3.48691013molm
ol�
1s�
1
Ea=79.5
kJmol�
1
Ed=199kJ
mol�
1
DS=650JK�1mol�
1
CNratio
NA
NA
25
NA
Na(g
m�2)
NA
NA
1.3
1.6
Apparen
tF L
NR
NA
NA
0.1365
0.078
Key
modelreference
Lu&Ji(2006)
Ziehnetal.(2011)
Olesonetal.(2013)
Friend&Kiang(2005)
A,CO
2assimilationrate;Ac,RuBPsaturatedCO
2assimilation;A
j,RuBPlim
ited
CO
2assimilationrate;Ap,triose
phosphateex
portlim
ited
rate
ofCO
2assimilation;Tg,thepreceding10d(CLM
,4.25°C
)an
d30d(BET
HY,4.28°C
)mea
nairtemperature
(°K)calculatedin
thisstudyfrom
datafrom
anea
rbyfluxtower
(Torn
etal.,2014);Tf,free
zingpointofwater
(°K);JV
ratio.25.Tg,JV
ratio.25
acclim
ated
togrowth
temperature;E
a,activationen
ergy;
E d,deactivationen
ergy;
R,universalg
asconstan
t;DS,
entropyfactor;j m
ax,lightsaturatedpotentialelectrontran
sport(m
olelec-
tronsmol�
1chlorophylls
�1)rate;a T,aconstan
tlinkingelectronto
chlorophyllcontent.*J
maxwas
calculatedfrom
j maxas
described
previously(Frien
d,1995).Apparen
tF L
NRforHyb
rid6.5
was
calcu-
latedfrom
Naan
dVc,max.25based
onRogers(2014).NA,n
otap
plicab
le.
No claim to original US Government works
New Phytologist� 2017 New Phytologist TrustNew Phytologist (2017) 216: 1090–1103
www.newphytologist.com
NewPhytologist Research 1095
still found that Na could explain no more than 2% of the varia-tion in Vc,max.25 (Fig. 6).
Comparison with TBM parameterization
To enable fair comparison of the gas exchange data presentedhere with the model parameterization in the four TBMs consid-ered, we scaled our data from growth temperature to 25°C usingmodel-specific temperature response functions and parameteriza-tion (Table 1). All four models markedly and significantly (one-sample t-tests, P < 0.05) underestimated Vc,max.25 in all sevenspecies (Fig. 7), ranging from CLM (Fig. 7c, long dashes), wherethe model parameterization was 42% lower than the seven speciesmean, to BETHY (Fig. 7b), where the model parameterizationwas five times lower than the seven species mean. The modelcomparison with measured Jmax.25 (Fig. 8) shows that, forBETHY (Fig. 8a) and CLM (Fig. 8b), Jmax.25 was markedly andsignificantly higher than the model parameterization: 55% higherin CLM (Fig. 8b) and over five-fold higher in BETHY (Fig. 8a;
Table 1). In TBMs, Jmax.25 is typically calculated from the modelestimate of Vc,max.25 and JVratio.25. The species mean JVratio.25
(2.53� 0.04 SE, Fig. 2c) is 4% and 13% higher than JVratio.25
used by BETHY (2.44) and CLM (2.21), respectively (one-sample t-tests, P < 0.05, Fig. 2c, Table 1). The use of our ArcticEa values resulted in a small (c. 10%), but significant (t(6) = 8.1,P < 0.001), increase in the observed JVratio.25 when comparedwith the JVratio.25 that would have been obtained using the Ea val-ues provided by Bernacchi et al. (2001, 2003). The Hybridmodel uses a different approach to estimate Jmax.25 based on Na
(a)
(b)
Fig. 1 Apparent maximum carboxylation rate (Vc,max, a) and apparentmaximum electron transport rate (Jmax, b) measured on individual rametsat ambient growth temperature (circles, seven species) and at multiple leaftemperatures on the same ramet (upward pointing triangles, two species)in Arctagrostis latifolia (pink), Dupontia fisheri (green), Arctophila fulva(blue), Carex aquatilis (cyan), Eriophorum angustifolium (yellow),Petasites frigidus (red) and Salix pulchra (white) growing on the BarrowEnvironmental Observatory, Barrow, Alaska. An Arrhenius temperatureresponse (black line) was fitted to the data in order to calculate anactivation energy (Ea) for both Vc,max and Jmax.
Fig. 2 Apparent maximum carboxylation rate (Vc,max.25, a) and apparentmaximum electron transport rate (Jmax.25, b) scaled to 25°C using the Eavalues determined from the temperature response of Vc,max and Jmax
presented in Fig. 1, and the ratio of Jmax.25 to Vc,max.25 (JVratio.25, c). Datawere measured in seven species located on the Barrow EnvironmentalObservatory, Barrow Alaska. All data presented in this figure were derivedfrom measurements made at ambient temperature. Box plots show theinterquartile range (box), median (solid line) and mean (broken line). Thewhiskers show the lowest and highest datum still within 1.59 interquartilerange of the lower and upper quartiles (n = 8–44 plants).
New Phytologist (2017) 216: 1090–1103 No claim to original US Government works
New Phytologist� 2017 New Phytologist Trustwww.newphytologist.com
Research
NewPhytologist1096
(Table 1); as a result, the pattern of derived Jmax.25 for Hybridfollows that of Na (Fig. 4a). The Hybrid Jmax.25 estimate was sig-nificantly higher than A. latifolia, D. fisheri and A. fulva, but sig-nificantly lower than C. aquatilis, E. angustifolium, P. frigidus andS. pulchra (one-sample t-tests, P < 0.05).
Model parameterization associated with leaf chemistry moreclosely matched the observations. For Na, the seven-species meanwas not significantly different from the value used by Hybrid(Fig. 4a, short dashes), but was significantly (one-samplet(6) = 2.1, P < 0.05) higher than the mean used by CLM (Fig. 4a,long dashes). CLM also uses CNratio as a model input and theseven-species mean was 23% lower than the CLM value (one-sample t(6) = 2.4, P > 0.05). With the exception ofE. angustifolium, all species had a higher investment in Rubiscothan that prescribed by CLM, and the seven-species mean was c.30% higher than the model input (one sample t(6) = 2.1,P < 0.05, Fig. 5, long dashed line). The FLNR value calculated forHybrid was 60% lower than the observed seven-species mean(Fig. 5, short dashed line).
Comparison of modeled and measured CO2 assimilation
To evaluate the effect of these new data on the modeledCO2 uptake in the Arctic, we compared model estimates forlight-saturated leaf-level A at 5�C℃ modeled with the TBM-specific parameterization and TRFs (Table 1) with the datapresented here (Figs 1, 2). The mean observed Vc,max.5 wasmore than twice the TBM model mean Vc,max.5 (t(5) = 4.6,P < 0.01, Table 2), and the resulting species mean A modeledusing our parameterization and TRF was 2.5 times greaterthan the A value modeled with current TBM parameterization(t(5) = 4.6, P < 0.01, Table 2).
As an additional step, we compared our modeled data withindependent measurements of light-saturated A made in the fieldat 5°C in 2016. These data showed that A modeled with themean TBM parameterization of Vc,max.25 resulted in a CO2
uptake rate that was less than half the measured CO2 assimilationrate (t(3) = 3.7, P < 0.05). A modeled with the parameter values
determined by this study was c. 20% higher than the measuredvalues, but not significantly different (t(9) = 2.2, P > 0.05) from Ameasured in 2016.
Discussion
We have shown that TBM representation of photosyntheticcapacity in Arctic vegetation markedly underestimates the capac-ity for CO2 assimilation in this globally important biome. Ourdata showed that the photosynthetic capacity was high (Fig. 2) –all seven species had values for Vc,max.25 that were comparablewith, or higher than, those found in major C3 crops (Bernacchiet al., 2005; James et al., 2006; Zhu et al., 2012) – and up to fivetimes higher than some model estimates (Fig. 7). Leaf-level mod-eling demonstrated that current TBM parameterization of photo-synthetic capacity results in a two-fold underestimation of CO2
assimilation by Arctic vegetation (Table 2). This study providesone of the first datasets of the key photosynthetic parametersVc,max and Jmax in Arctic vegetation and the first estimates of theirTRFs (Figs 1, 2). Our data also showed that model underestima-tion of photosynthetic capacity is attributable to a combinationof low estimates of the leaf N content (Fig. 4) and the fraction ofN partitioned to Rubisco (Fig. 5).
The JVratio affects the CO2 responsiveness of A, such that ahigh JVratio will mean that A remains RuBP saturated at a high[CO2], and is therefore more responsive to increasing [CO2],than RuBP limited A in a plant with a lower JVratio (Rogers et al.,2017c). The result of the high JVratio in these Arctic species canbe readily seen in Fig. 3b, where, even at 15°C, A does notbecome RuBP limited in any species until a Ci value ofc. 550 lmol mol�1. This means that Arctic vegetation has thepotential to respond maximally to rising [CO2] through most ofthis century. The high investment in Rubisco, coupled with thehigh JVratio.25, enables plants growing at current [CO2] to sustainhigh, RuBP-saturated, photosynthetic rates, even at low tempera-ture and low light levels.
The high JVratio will also enable Arctic plants to continue CO2
assimilation during the continuous but lower irradiance of the
Fig. 3 Synthetic A–Ci curves modeled at 5°C(a) and 15°C (b). The response ofphotosynthesis (A) to rising intercellular CO2
concentration (Ci) was modeled based on thedata presented in Figs 1 and 2 and Eqns 1–3for the seven species considered in this study:Arctagrostis latifolia (pink), Dupontia fisheri(green), Arctophila fulva (blue), Carexaquatilis (cyan), Eriophorum angustifolium
(dark yellow), Petasites frigidus (red) andSalix pulchra (black).
No claim to original US Government works
New Phytologist� 2017 New Phytologist TrustNew Phytologist (2017) 216: 1090–1103
www.newphytologist.com
NewPhytologist Research 1097
Arctic midnight sun, and also to maximally exploit periods ofhigh light on clear days during the short Arctic thaw season. Inaddition, many Arctic plants emerge from underneath the snowat the beginning of the growth season where temperatures arelow, light levels are low and [CO2] is typically elevated (Starr &Oberbauer, 2003; Saarinen et al., 2016). Plants with a highinvestment in Rubisco and a high JVratio would be well adaptedto exploit such conditions.
Fig. 4 Leaf nitrogen content (Na, g m�2, a), leaf mass area (LMA, gm�2
,
b) and the ratio of leaf carbon to nitrogen content (CNratio, c). Data werecollected in parallel with gas exchange in seven species located on theBarrow Environmental Observatory, Barrow Alaska. The broken lines in (a)indicate the mean value of Na used by the Hybrid (short dashes) andCommunity Land Model (CLM) (long dashes) to parameterize the Arcticplant functional type (PFT). The broken line in (c) indicates the CNratio usedby CLM to parameterize the Arctic PFT. Box plots show the interquartilerange (box), median (solid line) and mean (broken line). The whiskersshow the lowest and highest datum still within 1.59 interquartile range ofthe lower and upper quartiles (n = 8–44 plants).
Fig. 5 The apparent fraction of leaf nitrogen invested in Rubisco (FLNR)calculated using Eqn 5 from the data provided in Figs 2 and 4 and Rogers(2014). The broken lines show the value of FLNR used in the CommunityLand Model (CLM) to parameterize the Arctic plant functional type (PFT,long dashes) and the FLNR calculated for Hybrid based on Na and Vc,max.25
in Table 1 (short dashes). Box plots show the interquartile range (box),median (solid line) and mean (broken line). The whiskers show the lowestand highest datum still within 1.59 interquartile range of the lower andupper quartiles (n = 8–44 plants).
Fig. 6 Apparent maximum carboxylation rate scaled to 25°C (Vc,max.25)plotted against the area-based leaf nitrogen content (Na). Estimates ofapparent Vc,max.25 were scaled from gas exchange measurements made atgrowth temperature. These estimates were derived from A–Ci curves(circles) made between 2012 and 2015, and from steady-state, light-saturated photosynthesis using the one-point method made in 2016(downward pointing triangles). Measurements were made on individualramets of Arctagrostis latifolia (pink), Dupontia fisheri (green), Arctophilafulva (blue), Carex aquatilis (cyan), Eriophorum angustifolium (yellow),Petasites frigidus (red) and Salix pulchra (white) growing on the BarrowEnvironmental Observatory, Barrow, Alaska. No significant correlation wasfound.
New Phytologist (2017) 216: 1090–1103 No claim to original US Government works
New Phytologist� 2017 New Phytologist Trustwww.newphytologist.com
Research
NewPhytologist1098
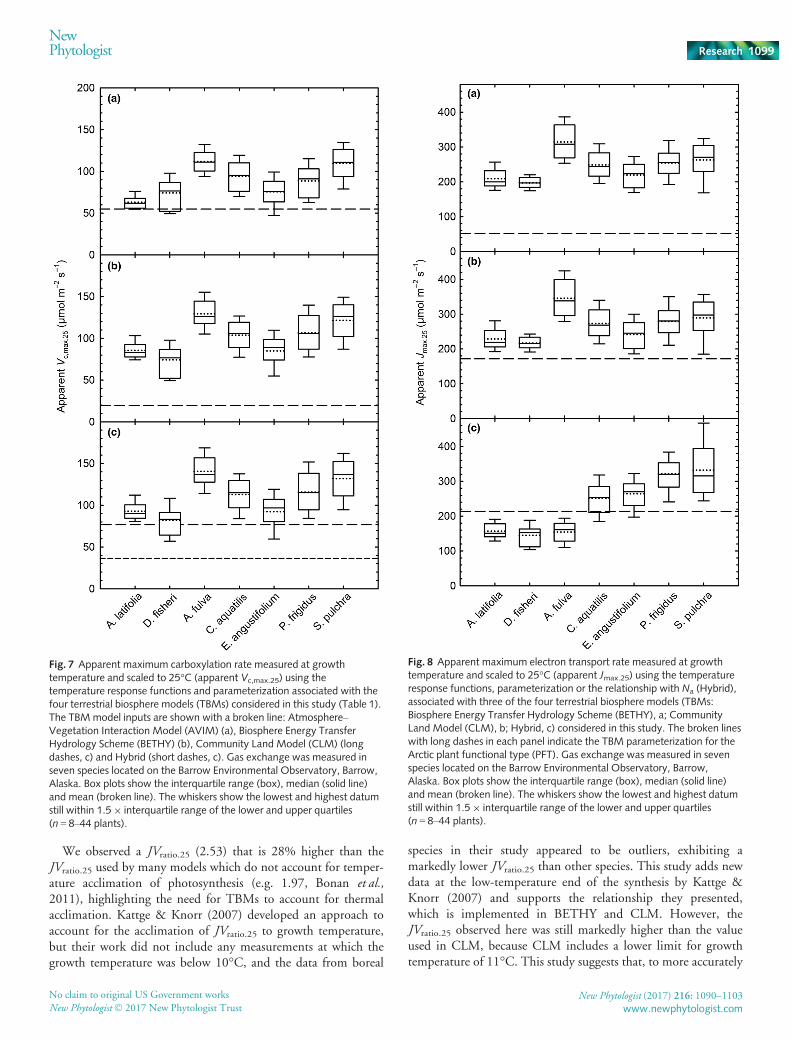
We observed a JVratio.25 (2.53) that is 28% higher than theJVratio.25 used by many models which do not account for temper-ature acclimation of photosynthesis (e.g. 1.97, Bonan et al.,2011), highlighting the need for TBMs to account for thermalacclimation. Kattge & Knorr (2007) developed an approach toaccount for the acclimation of JVratio.25 to growth temperature,but their work did not include any measurements at which thegrowth temperature was below 10°C, and the data from boreal
species in their study appeared to be outliers, exhibiting amarkedly lower JVratio.25 than other species. This study adds newdata at the low-temperature end of the synthesis by Kattge &Knorr (2007) and supports the relationship they presented,which is implemented in BETHY and CLM. However, theJVratio.25 observed here was still markedly higher than the valueused in CLM, because CLM includes a lower limit for growthtemperature of 11°C. This study suggests that, to more accurately
Fig. 7 Apparent maximum carboxylation rate measured at growthtemperature and scaled to 25°C (apparent Vc,max.25) using thetemperature response functions and parameterization associated with thefour terrestrial biosphere models (TBMs) considered in this study (Table 1).The TBMmodel inputs are shown with a broken line: Atmosphere–Vegetation Interaction Model (AVIM) (a), Biosphere Energy TransferHydrology Scheme (BETHY) (b), Community Land Model (CLM) (longdashes, c) and Hybrid (short dashes, c). Gas exchange was measured inseven species located on the Barrow Environmental Observatory, Barrow,Alaska. Box plots show the interquartile range (box), median (solid line)and mean (broken line). The whiskers show the lowest and highest datumstill within 1.59 interquartile range of the lower and upper quartiles(n = 8–44 plants).
Fig. 8 Apparent maximum electron transport rate measured at growthtemperature and scaled to 25°C (apparent Jmax.25) using the temperatureresponse functions, parameterization or the relationship with Na (Hybrid),associated with three of the four terrestrial biosphere models (TBMs:Biosphere Energy Transfer Hydrology Scheme (BETHY), a; CommunityLand Model (CLM), b; Hybrid, c) considered in this study. The broken lineswith long dashes in each panel indicate the TBM parameterization for theArctic plant functional type (PFT). Gas exchange was measured in sevenspecies located on the Barrow Environmental Observatory, Barrow,Alaska. Box plots show the interquartile range (box), median (solid line)and mean (broken line). The whiskers show the lowest and highest datumstill within 1.59 interquartile range of the lower and upper quartiles(n = 8–44 plants).
No claim to original US Government works
New Phytologist� 2017 New Phytologist TrustNew Phytologist (2017) 216: 1090–1103
www.newphytologist.com
NewPhytologist Research 1099

capture the JVratio.25 in Arctic species, this lower limit should beremoved from the model formulation.
Our biochemical data revealed markedly different strategies forN partitioning in these seven Arctic species. Some species (A. lati-folia, D. fisheri and A. fulva) had a tightly constrained Na, whereasothers, notably S. pulchra and P. frigidus, had a large range in Na
(Fig. 4), suggesting that Na may drive the greater plasticity inphotosynthetic capacity (Fig. 2). Most of the species had a lowCNratio in comparison with the value used by CLM (Fig. 4c).This indicates that the high Na in some Arctic species is caused,in part, by a higher investment in N per unit C, and not just ahigh N density per unit leaf area (Fig. 4). Our dataset affordedthe opportunity to calculate apparent FLNR for these Arcticspecies (a key model input for CLM), thus providing modelswith a parameter associated with N partitioning that could beused as a PFT-specific model input, or to evaluate prognostic Nallocation models, e.g. Ali et al. (2016). It is notable that specieswith a lower Na (A. latifolia, D. fisheri and A. fulva, Fig. 4) alsohad a high FLNR (Fig. 5), suggesting that the high partitioning ofN to Rubisco in these species enabled them to produce leaveswith a lower Na (Fig. 4), but comparable photosynthetic capacity(Fig. 2), which, at the whole-plant level, may enable a higherproductivity for a given N supply.
One approach used by TBMs to derive Vc,max.25 is to usePFT-specific slopes and intercepts from the linear relationshipwith Na (Medlyn et al., 1999; Kattge et al., 2009; Walkeret al., 2014). Previously, there was insufficient data to examinethis relationship in Arctic species (Kattge et al., 2009; Ziehnet al., 2011). We did not observe a Vc,max.25–Na relationship(Fig. 6). The different N allocation strategies outlined above,
and the high diversity of leaf morphology in these species,may explain why we did not observe a Vc,max.25–Na relation-ship at our field site, a finding also observed in Betula nanaand Eriophorum vaginatum (van der Weg et al. 2013).Although data at the global or biome scale often demonstratea strong relationship between Vc,max.25 and Na (Kattge et al.,2009; Walker et al., 2014), these relationships can changemarkedly and even fall apart at finer scales (Feng & Dietze,2013; Bahar et al., 2016; Croft et al., 2017), which has led tothe use of other variables, including phosphorus, to explainglobal variation in Vc,max.25 (Walker et al., 2014; Ali et al.,2015; Croft et al., 2017). There is evidence that phosphorusplays a role in limiting the productivity of Arctic tundraecosystems, and may be a limiting nutrient on the coastal tun-dra in Barrow (Chapin et al., 1975, 1995; Shaver & Chapin,1980). However, the examination of N : phosphorus ratiosacross major biomes suggests that direct phosphorus limitationof photosynthesis in the Arctic is unlikely (Reich et al., 2009).
As recently pointed out, it is critically important for models tomake consistent use of kinetic constants and temperatureresponse functions (Rogers et al., 2017c). Therefore, the data pre-sented here should be used in conjunction with the kinetic con-stants and temperature response functions associated with Kc, Ko
and Γ* that are provided by Bernacchi et al. (2001). Similarly,use of the Arctic Vc,max.25 and Jmax.25 data (Fig. 2) will requiretemperature scaling with the Ea values and the TRFs presentedhere (Fig. 1, Eqn 4). We also recognize that there are many alter-native approaches to the analysis of photosynthetic CO2 responsecurves, including, for example, those that use different TRFs, cor-rect data for potential chamber leaks or account for mesophyll
Table 2 Modeled and measured light-saturated CO2 assimilation at 5°C
Species/TBM
Modeled photosynthesisMeasured photosynthesis
Vc,max.5 (lmol m�2 s�1) A (lmol m�2 s�1) A (lmol m�2 s�1)
Arctagrostis latifolia 17.9 11.2 9.2� 2.5Dupontia fisheri 14.4 9.0 NDArctophila fulva 23.5 14.8 10.1� 1.8Carex aquatilis 18.3 11.5 8.8� 1.9Eriophorum angustifolium 15.0 9.4 10.1� 1.6Petasites frigidus 20.2 12.7 11.3� 2.7Salix pulchra 21.4 13.5 9.1� 2.5Species mean 18.6� 3.3 11.7� 2.1 9.8� 0.9AVIM 9.5 6.0BETHY 2.0 1.3CLM4.5 11.8 7.4Hybrid6.5 5.6 3.5Model mean 7.2� 4.3 4.5� 2.7
Leaf-level CO2 assimilation (A) modeled for the seven Arctic species in this study and for the Arctic plant functional types (PFT) represented in four terres-trial biosphere models (Table 1). Leaf-level, light-saturated A was modeled using Eqns 1–3, where leaf temperature = 5°C, CO2 concentra-tion = 390 lmol mol�1, O2 concentration = 210mmol mol�1 and Ci : Ca ratio = 0.7. Under these conditions, photosynthesis was limited by carboxylationcapacity. Vc,max.5 for the seven species was obtained by scaling Vc,max.25 (Fig. 2) to 5°C using Eqn 4 and the Ea values presented in Fig. 1. Vc,max.5 for themodels was calculated by scaling Vc,max.25 for the Arctic PFT using the model-specific Vc,max.25 and temperature response function (TRF) (Table 1). Mea-sured photosynthesis (n = 8–17 individual ramets per species, � SD) was derived from a separate study on different plants in different locations on the Bar-row Environmental Observatory (BEO), measured in a different year, where mean Tleaf = 5°C. Species and model means are shown � SD. AVIM,Atmosphere–Vegetation Interaction Model; BETHY, Biosphere Energy Transfer Hydrology Scheme; CLM4.5, Community Land Model v.4.5; Hybrid6.5,Hybrid v.6.5; ND, no data; TBM, terrestrial biosphere model.
New Phytologist (2017) 216: 1090–1103 No claim to original US Government works
New Phytologist� 2017 New Phytologist Trustwww.newphytologist.com
Research
NewPhytologist1100
conductance (Ethier & Livingston, 2004; Flexas et al., 2007;Sharkey et al., 2007; Gu et al., 2010; Bernacchi et al., 2013). Toallow for future reanalysis of our data, and to maximize their fur-ther use by the modeling community, all of our data – includingour raw gas exchange data – are available online (Rogers et al.,2017a,b). In addition, we have submitted calculated photosyn-thetic parameters and biochemical trait data to the TRY database(Kattge et al., 2011) and the database (www.BETYdb.org) associ-ated with the Predictive Ecosystem Analyzer (PEcAn) project(Lebauer et al., 2013).
In addition to advancing our understanding of photosynthesisin the Arctic, these data clearly indicate that CO2 assimilation inArctic vegetation is poorly represented by current TBMs.Although we caution that these data and insights are only fromone site in the high Arctic, this study represents a significantadvance, and we hope that the TBM community will improvethe representation of CO2 assimilation in the Arctic by usingthese data.
Acknowledgements
We are grateful for the technical assistance provided by StefanieLasota. This work was supported by the Next-Generation Ecosys-tem Experiments (NGEE Arctic) project which is supported bythe Office of Biological and Environmental Research in theDepartment of Energy, Office of Science, and through theUnited States Department of Energy contract no. DE-SC0012704 to Brookhaven National Laboratory. The authorsare grateful to UIC Science for logistical support.
Author contributions
A.R. designed the study with input from V.L.S., S.P.S. andS.D.W. The data were collected and analyzed by A.R., K.S.E.and S.P.S. The initial draft of the manuscript was prepared byA.R. All authors contributed to the writing.
References
Ainsworth EA, Davey PA, Hymus GJ, Osborne CP, Rogers A, Blum H,
Nosberger J, Long SP. 2003. Is stimulation of leaf photosynthesis by
elevated carbon dioxide concentration maintained in the long term? A test
with Lolium perenne grown for 10 years at two nitrogen fertilization levels
under Free Air CO2 Enrichment (FACE). Plant, Cell & Environment 26:705–714.
Albert KR, Mikkelsen TN, Ro-Poulsen H, Arndal MF, Michelsen A. 2011.
Ambient UV-B radiation reduces PSII performance and net photosynthesis in
high Arctic Salix arctica. Environmental and Experimental Botany 73: 10–18.Ali AA, Xu C, Rogers A, Fisher RA, Wullschleger SD, Massoud EC, Vrugt JA,
Muss JD, McDowell NG, Fisher JB et al. 2016. A global scale mechanistic
model of photosynthetic capacity (LUNA V1.0). Geoscientific ModelDevelopment 9: 587–606.
Ali AA, Xu CG, Rogers A, McDowell NG, Medlyn BE, Fisher RA, Wullschleger
SD, Reich PB, Vrugt JA, Bauerle WL et al. 2015. Global-scale environmental
control of plant photosynthetic capacity. Ecological Applications 25: 2349–2365.
Alton PB. 2017. Retrieval of seasonal Rubisco-limited photosynthetic capacity at
global FLUXNET sites from hyperspectral satellite remote sensing: impact on
carbon modelling. Agricultural and Forest Meteorology 232: 74–88.
Ardia D. 2009. DEoptim: differential evolution optimization in R. R package,
version 1.3-3. http://CRAN.R-project.org/package=DEoptim.
Bahar NHA, Ishida FY, Weerasinghe LK, Guerrieri R, O’Sullivan OS,
Bloomfield KJ, Asner GP, Martin RE, Lloyd J, Malhi Y et al. 2016. Leaf-levelphotosynthetic capacity in lowland Amazonian and high-elevation Andean
tropical moist forests of Peru. New Phytologist 214: 1002–1018.Bernacchi CJ, Bagley JE, Serbin SP, Ruiz-Vera UM, Rosenthal DM, Vanloocke
A. 2013.Modelling C3 photosynthesis from the chloroplast to the ecosystem.
Plant, Cell & Environment 36: 1641–1657.Bernacchi CJ, Leakey ADB, Heady LE, Morgan PB, Dohleman FG, McGrath
JM, Gillespie KM, Wittig VE, Rogers A, Long SP et al. 2006.Hourly and
seasonal variation in photosynthesis and stomatal conductance of soybean
grown at future CO2 and ozone concentrations for 3 years under fully open-air
field conditions. Plant, Cell & Environment 29: 2077–2090.Bernacchi CJ, Morgan PB, Ort DR, Long SP. 2005. The growth of soybean
under free air CO2 enrichment (FACE) stimulates photosynthesis while
decreasing in vivo Rubisco capacity. Planta 220: 434–446.Bernacchi CJ, Pimentel C, Long SP. 2003. In vivo temperature response
functions of parameters required to model RuBP-limited photosynthesis. PlantCell and Environment 26: 1419–1430.
Bernacchi CJ, Singsaas EL, Pimentel C, Portis AR, Long SP. 2001. Improved
temperature response functions for models of Rubisco-limited photosynthesis.
Plant, Cell & Environment 24: 253–259.Bockheim JG, Everett LR, Hinkel KM, Nelson FE, Brown J. 1999. Soil organic
carbon storage and distribution in Arctic Tundra, Barrow, Alaska. Soil ScienceSociety of America Journal 63: 934–940.
van Bodegom PM, Douma JC, Verheijen LM. 2014. A fully traits-based
approach to modeling global vegetation distribution. Proceedings of the NationalAcademy of Sciences, USA 111: 13733–13738.
Boesgaard KS, Albert KR, Ro-Poulsen H, Michelsen A, Mikkelsen TN, Schmidt
NM. 2012. Long-term structural canopy changes sustain net photosynthesis
per ground area in high arctic Vaccinium uliginosum exposed to changes in
near-ambient UV-B levels. Physiologia Plantarum 145: 540–550.Bonan GB, Lawrence PJ, Oleson KW, Levis S, Jung M, Reichstein M, Lawrence
DM, Swenson SC. 2011. Improving canopy processes in the Community
Land Model version 4 (CLM4) using global flux fields empirically inferred
from FLUXNET data. Journal of Geophysical Research–Biogeosciences 116:G02014.
Brown J, Everett KR, Webber PJ, Maclean SF, Murray DF. 1980. The coastal
tundra at Barrow. In: Brown J, Miller PC, Tiezen LL, Bunnell FL, eds. AnArctic ecosystem: the coastal tundra at Barrow, Alaska. Stroudsburg, PA, USA:
Dowden, Hutchinson & Ross, 1–29.von Caemmerer S. 2000. Biochemical models of leaf photosynthesis. Collingwood,Australia: CSIRO Publishing.
Chapin FS, Bretharte MS, Hobbie SE, Zhong HL. 1996. Plant functional types
as predictors of transient responses of arctic vegetation to global change. Journalof Vegetation Science 7: 347–358.
Chapin FS, Shaver GR. 1996. Physiological and growth responses of arctic plants
to a field experiment simulating climatic change. Ecology 77: 822–840.Chapin FS, Shaver GR, Giblin AE, Nadelhoffer KJ, Laundre JA. 1995.
Response of Arctic tundra to experimental and observed changes in climate.
Ecology 76: 694–711.Chapin FS, Van Cleve K, Tieszen LL. 1975. Seasonal nutrient dynamics of
tundra vegetation at Barrow, Alaska. Arctic and Alpine Research 7: 209–226.Collatz GJ, Ball JT, Grivet C, Berry JA. 1991. Physiological and environmental
regulation of stomatal conductance, photosynthesis and transpiration – a model
that includes a laminar boundary layer. Agricultural and Forest Meteorology 54:107–136.
Croft H, Chen JM, Luo X, Bartlett P, Chen B, Staebler RM. 2017. Leaf
chlorophyll content as a proxy for leaf photosynthetic capacity. Global ChangeBiology 23: 3433–3964.
De Kauwe MG, Lin YS, Wright IJ, Medlyn BE, Crous KY, Ellsworth DS,
Maire V, Prentice IC, Atkin OK, Rogers A et al. 2016. A test of the ‘one-point
method’ for estimating maximum carboxylation capacity from field-measured,
light-saturated photosynthesis. New Phytologist 210: 1130–1144.Dietze MC, Serbin SP, Davidson C, Desai AR, Feng X, Kelly R, Kooper R,
LeBauer D, Mantooth J, McHenry K et al. 2014. A quantitative assessment of
No claim to original US Government works
New Phytologist� 2017 New Phytologist TrustNew Phytologist (2017) 216: 1090–1103
www.newphytologist.com
NewPhytologist Research 1101
a terrestrial biosphere model’s data needs across North American biomes.
Journal of Geophysical Research-Biogeosciences 119: 286–300.Dubois JJ, Fiscus BEL, Booker FL, Flowers MD, Reid CD. 2007.Optimizing
the statistical estimation of the parameters of the Farquhar–von Caemmerer–Berry model of photosynthesis. New Phytologist 176: 402–414.
Ethier GJ, Livingston NJ. 2004.On the need to incorporate sensitivity to CO2
transfer conductance into the Farquhar–von Caemmerer–Berry leafphotosynthesis model. Plant, Cell & Environment 27: 137–153.
Farquhar GD, Caemmerer SV, Berry JA. 1980. A biochemical model of
photosynthetic CO2 assimilation in leaves of C3 species. Planta 149: 78–90.Feng XH, Dietze M. 2013. Scale dependence in the effects of leaf
ecophysiological traits on photosynthesis: Bayesian parameterization of
photosynthesis models. New Phytologist 200: 1132–1144.Fisher JB, Badgley G, Blyth E. 2012. Global nutrient limitation in terrestrial
vegetation. Global Biogeochemical Cycles 26: GB3007.Fisher JB, Sikka M, Oechel WC, Huntzinger DN, Melton JR, Koven CD,
Ahlstrom A, Arain MA, Baker I, Chen JM et al. 2014. Carbon cycle
uncertainty in the Alaskan Arctic. Biogeosciences 11: 4271–4288.Fletcher BJ, Gornall JL, Poyatos R, Press MC, Stoy PC, Huntley B, Baxter R,
Phoenix GK. 2012. Photosynthesis and productivity in heterogeneous arctic
tundra: consequences for ecosystem function of mixing vegetation types at
stand edges. Journal of Ecology 100: 441–451.Flexas J, Diaz-Espejo A, Berry JA, Cifre J, Galmes J, Kaidenhoff R, Medrano H,
Ribas-Carbo M. 2007. Analysis of leakage in IRGA’s leaf chambers of open gas
exchange systems: quantification and its effects in photosynthesis
parameterization. Journal of Experimental Botany 58: 1533–1543.Friedlingstein P, Cox P, Betts R, Bopp L, Von Bloh W, Brovkin V, Cadule P,
Doney S, Eby M, Fung I et al. 2006. Climate-carbon cycle feedback analysis:
results from the C4MIP model intercomparison. Journal of Climate 19: 3337–3353.
Friedlingstein P, Meinshausen M, Arora VK, Jones CD, Anav A, Liddicoat SK,
Knutti R. 2014. Uncertainties in CMIP5 climate projections due to carbon
cycle feedbacks. Journal of Climate 27: 511–526.Friend AD. 1995. PGEN – an integrated model of leaf photosynthesis,
transpiration and conductance. Ecological Modelling 77: 233–255.Friend AD. 2010. Terrestrial plant production and climate change. Journal ofExperimental Botany 61: 1293–1309.
Friend AD, Kiang NY. 2005. Land surface model development for the GISS
GCM: effects of improved canopy physiology on simulated climate. Journal ofClimate 18: 2883–2902.
Frost GV, Epstein HE. 2014. Tall shrub and tree expansion in Siberian tundra
ecotones since the 1960s. Global Change Biology 20: 1264–1277.Galmes J, Hermida-Carrera C, Laanisto L, Niinemets U. 2016. A compendium
of temperature responses of Rubisco kinetic traits: variability among and within
photosynthetic groups and impacts on photosynthesis modeling. Journal ofExperimental Botany 67: 5067–5091.
Gu LH, Pallardy SG, Tu K, Law BE, Wullschleger SD. 2010. Reliable
estimation of biochemical parameters from C3 leaf photosynthesis-intercellular
carbon dioxide response curves. Plant, Cell & Environment 33: 1852–1874.Heskel MA, Bitterman D, Atkin OK, Turnbull MH, Griffin KL. 2014.
Seasonality of foliar respiration in two dominant plant species from the Arctic
tundra: response to long-term warming and short-term temperature variability.
Functional Plant Biology 41: 287–300.IPCC. 2013. Stocker TF, Qin D, Plattner G-K, Tignor M, Allen SK, Boschung
J, Nauels A, Xia Y, Bex V, Midgley PM, eds. Climate Change 2013: ThePhysical Science Basis. Contribution of Working Group I to the Fifth AssessmentReport of the Intergovernmental Panel on Climate Change. Cambridge, UK and
New York, NY, USA: Cambridge University Press.
Iversen CM, Sloan VL, Sullivan PF, Euskirchen ES, McGuire AD, Norby RJ,
Walker AP, Warren JM, Wullschleger SD. 2015. The unseen iceberg: plant
roots in arctic tundra. New Phytologist 205: 34–58.James RA, Munns R, Von Caemmerer S, Trejo C, Miller C, Condon T. 2006.
Photosynthetic capacity is related to the cellular and subcellular partitioning of
Na+, K+ and Cl� in salt-affected barley and durum wheat. Plant, Cell &Environment 29: 2185–2197.
Jorgenson MT, Shur YL, Pullman ER. 2006. Abrupt increase in permafrost
degradation in Arctic Alaska. Geophysical Research Letters 33: L02503.
Kattge J, Diaz S, Lavorel S, Prentice C, Leadley P, Boenisch G, Garnier E,
Westoby M, Reich PB, Wright IJ et al. 2011. TRY – a global database of planttraits. Global Change Biology 17: 2905–2935.
Kattge J, Knorr W. 2007. Temperature acclimation in a biochemical model of
photosynthesis: a reanalysis of data from 36 species. Plant, Cell & Environment30: 1176–1190.
Kattge J, Knorr W, Raddatz T, Wirth C. 2009.Quantifying photosynthetic
capacity and its relationship to leaf nitrogen content for global-scale terrestrial
biosphere models. Global Change Biology 15: 976–991.Kaufman DS, Schneider DP, McKay NP, Ammann CM, Bradley RS, Briffa
KR, Miller GH, Otto-Bliesner BL, Overpeck JT, Vinther BM et al. 2009.Recent warming reverses long-term Arctic cooling. Science 325: 1236–1239.
Koven CD, Schuur EAG, Schaedel C, Bohn TJ, Burke EJ, Chen G, Chen X,
Ciais P, Grosse G, Harden JW et al. 2015. A simplified, data-constrained
approach to estimate the permafrost carbon-climate feedback. PhilosophicalTransactions of the Royal Society A: Mathematical Physical and EngineeringSciences 373: 20140423.
Kull O, Kruijt B. 1998. Leaf photosynthetic light response: a mechanistic model
for scaling photosynthesis to leaves and canopies. Functional Ecology 12: 767–777.
Lebauer DS, Wang D, Richter KT, Davidson CC, Dietze MC. 2013.
Facilitating feedbacks between field measurements and ecosystem models.
Ecological Monographs 83: 133–154.Leffler AJ, Welker JM. 2013. Long-term increases in snow pack elevate leaf N
and photosynthesis in Salix arctica: responses to a snow fence experiment in the
High Arctic of NW Greenland. Environmental Research Letters 8: 025023.Long SP, Bernacchi CJ. 2003. Gas exchange measurements, what can they tell us
about the underlying limitations to photosynthesis? Procedures and sources of
error. Journal of Experimental Botany 54: 2393–2401.Lu J, Ji J. 2006. A simulation and mechanism analysis of long-term variations at
land surface over arid/semi-arid area in north China. Journal of GeophysicalResearch-Atmospheres 111: D09306.
Medlyn BE, Badeck FW, De Pury DGG, Barton CVM, Broadmeadow M,
Ceulemans R, De Angelis P, Forstreuter M, Jach ME, Kellomaki S et al.1999. Effects of elevated CO2 on photosynthesis in European forest species: a
meta-analysis of model parameters. Plant, Cell & Environment 22: 1475–1495.Medlyn BE, Dreyer E, Ellsworth D, Forstreuter M, Harley PC, Kirschbaum
MUF, Le Roux X, Montpied P, Strassemeyer J, Walcroft A et al. 2002.Temperature response of parameters of a biochemically based model of
photosynthesis. II. A review of experimental data. Plant, Cell & Environment25: 1167–1179.
Muraoka H, Noda H, Uchida M, Ohtsuka T, Koizumi H, Nakatsubo T. 2008.
Photosynthetic characteristics and biomass distribution of the dominant
vascular plant species in a high Arctic tundra ecosystem, Ny-�Alesund Svalbard:
implications for their role in ecosystem carbon gain. Journal of Plant Research121: 137–145.
Muraoka H, Uchida M, Mishio M, Nakatsubo T, Kanda H, Koizumi H. 2002.
Leaf photosynthetic characteristics and net primary production of the polar
willow (Salix polaris) in a high arctic polar semi-desert, Ny-�Alesund, Svalbard.
Canadian Journal of Botany–Revue Canadienne de Botanique 80: 1193–1202.Oleson KW, Lawrence DM, Bonan GB, Drewniak B, Huang M, Koven CD,
Levis S, Li F, Riley WJ, Subin ZM et al. 2013. Technical description of version4.5 of the community land model (CLM). Boulder, CO, USA: National Center
for Atmospheric Research.
Patankar R, Mortazavi B, Oberbauer SF, Starr G. 2013. Diurnal patterns of gas-
exchange and metabolic pools in tundra plants during three phases of the arctic
growing season. Ecology and Evolution 3: 375–388.Price KV, Storn RM, Lampinen JA. 2006. Differential evolution: a practicalapproach to global optimization. New York, NY, USA: Springer.
R Development Core Team. 2013. R: a language and environment for statisticalcomputing. Vienna, Austria: R Foundation for Statistical Computing. [WWW
document] URL www.r-project.org [accessed October 2016].
Reich PB, Oleksyn J, Wright IJ. 2009. Leaf phosphorus influences the
photosynthesis–nitrogen relation: a cross-biome analysis of 314 species.
Oecologia 160: 207–212.Rogers A. 2014. The use and misuse of Vc,max in Earth System Models.
Photosynthesis Research 119: 15–29.
New Phytologist (2017) 216: 1090–1103 No claim to original US Government works
New Phytologist� 2017 New Phytologist Trustwww.newphytologist.com
Research
NewPhytologist1102
Rogers A, Ely KS, Serbin SP. 2017a. Leaf photosynthetic parameters Vcmax andJmax and supporting gas exchange data, Barrow, Alaska, 2012–2016. In: Nextgeneration ecosystems experiment Arctic data collection. Carbon Dioxide
Information Analysis Center, Oak Ridge National Laboratory, Oak Ridge, TN,
USA. [WWW document] URL doi: 10.5440/1336809 [accessed 1 January
2017].
Rogers A, Ely KS, Serbin SP, Lasota S, Liberman-Cribbin W. 2017b. Leaf massarea, leaf carbon and nitrogen content, Barrow, Alaska, beginning 2012. In: Nextgeneration ecosystems experiments Arctic data collection. Carbon Dioxide
Information Analysis Center, Oak Ridge National Laboratory, Oak Ridge, TN,
USA. [WWW document] URL doi: 10.5440/1336812 [accessed 1 January
2017]. [Correction added after online publication 6 September 2017: the doi
in Rogers et al. (2017b) has been corrected.]
Rogers A, Medlyn BE, Dukes JS, Bonan G, von Caemmerer S, Dietze MC,
Kattge J, Leakey ADB, Mercado LM, Niinemets €U et al. 2017c. A roadmap
for improving the representation of photosynthesis in Earth system models.
New Phytologist 213: 22–42.Saarinen T, Rasmus S, Lundell R, Kauppinen OK, Hanninen H. 2016.
Photosynthetic and phenological responses of dwarf shrubs to the depth and
properties of snow. Oikos 125: 364–373.Salmon VG, Soucy P, Mauritz M, Celis G, Natali SM, Mack MC, Schuur EAG.
2016. Nitrogen availability increases in a tundra ecosystem during five years of
experimental permafrost thaw. Global Change Biology 22: 1927–1941.Sargsyan K, Safta C, Najm HN, Debusschere BJ, Ricciuto D, Thornton P.
2014. Dimensionality reduction for complex models via bayesian
compressive sensing. International Journal for Uncertainty Quantification 4:
63–93.Schuur EAG, McGuire AD, Schaedel C, Grosse G, Harden JW, Hayes DJ,
Hugelius G, Koven CD, Kuhry P, Lawrence DM et al. 2015. Climate change
and the permafrost carbon feedback. Nature 520: 171–179.Schuur EAG, Vogel JG, Crummer KG, Lee H, Sickman JO, Osterkamp TE.
2009. The effect of permafrost thaw on old carbon release and net carbon
exchange from tundra. Nature 459: 556–559.Serbin SP, Dillaway DN, Kruger EL, Townsend PA. 2012. Leaf optical
properties reflect variation in photosynthetic metabolism and its sensitivity to
temperature. Journal of Experimental Botany 63: 489–502.Sharkey TD. 1985. Photosynthesis in intact leaves of C3 plants – physics,physiology and rate limitations. Botanical Review 51: 53–105.
Sharkey TD, Bernacchi CJ, Farquhar GD, Singsaas EL. 2007. Fitting
photosynthetic carbon dioxide response curves for C3 leaves. Plant, Cell &Environment 30: 1035–1040.
Shaver GR, Chapin FS. 1980. Response to fertilization by various plant-growth
forms in an Alaskan tundra – nutrient accumulation and growth. Ecology 61:662–675.
Shaver GR, Chapin FS, Billings WD. 1979. Ecotypic differentiation in Carexaquatilis on ice-wedge polygons in the Alaskan coastal tundra. Journal of Ecology67: 1025–1046.
Shiklomanov NI, Streletskiy DA, Nelson FE, Hollister RD, Romanovsky VE,
Tweedie CE, Bockheim JG, Brown J. 2010. Decadal variations of active-layer
thickness in moisture-controlled landscapes, Barrow, Alaska. Journal ofGeophysical Research-Biogeosciences 115: G00104.
Smith NG, Dukes JS. 2013. Plant respiration and photosynthesis in global-scale
models: incorporating acclimation to temperature and CO2. Global ChangeBiology 19: 45–63.
Souther S, Fetcher N, Fowler Z, Shaver GR, Mcgraw JB. 2014. Ecotypic
differentiation in photosynthesis and growth of Eriophorum vaginatum along a
latitudinal gradient in the Arctic tundra. Botany-Botanique 92: 551–561.Starr G, Neuman DS, Oberbauer SF. 2004. Ecophysiological analysis of two
arctic sedges under reduced root temperatures. Physiologia Plantarum 120:
458–464.Starr G, Oberbauer SF. 2003. Photosynthesis of arctic evergreens under snow:
implications for tundra ecosystem carbon balance. Ecology 84: 1415–1420.Sturm M, Racine C, Tape K. 2001. Climate change – increasing shrubabundance in the Arctic. Nature 411: 546–547.
Tape K, Sturm M, Racine C. 2006. The evidence for shrub expansion in
Northern Alaska and the Pan-Arctic. Global Change Biology 12: 686–702.Thornton PE, Zimmermann NE. 2007. An improved canopy integration scheme
for a land surface model with prognostic canopy structure. Journal of Climate20: 3902–3923.
Torn M, Raz-Yaseef N, Billesbach D. 2014. Eddy-covariance and auxiliarymeasurements, NGEE-Barrow, 2012–2013. Next generation ecosystem experiments– Arctic data collection. Carbon Dioxide Information Analysis Center, Oak
Ridge National Laboratory, Oak Ridge, TN, USA. [WWW document] URL
doi: 10.5440/1124200 [accessed 8 January 2014].
Varhammar A, Wallin G, McLean CM, Dusenge ME, Medlyn BE, Hasper TB,
Nsabimana D, Uddling J. 2015. Photosynthetic temperature responses of tree
species in Rwanda: evidence of pronounced negative effects of high temperature
in montane rainforest climax species. New Phytologist 206: 1000–1012.Walker AP, Beckerman AP, Gu LH, Kattge J, Cernusak LA, Domingues TF,
Scales JC, Wohlfahrt G, Wullschleger SD, Woodward FI. 2014. The
relationship of leaf photosynthetic traits – Vcmax and Jmax – to leaf nitrogen, leafphosphorus, and specific leaf area: a meta-analysis and modeling study. Ecologyand Evolution 4: 3218–3235.
van de Weg MJ, Shaver GR, Salmon VG. 2013. Contrasting effects of long term
versus short-term nitrogen addition on photosynthesis and respiration in the
Arctic. Plant Ecology 214: 1273–1286.Wookey PA, Robinson CH, Parsons AN, Welker JM, Press MC, Callaghan TV,
Lee JA. 1995. Environmental constraints on the growth, photosynthesis and
reproductive development of Dryas octopetala at a high Arctic polar semidesert,
Svalbard. Oecologia 102: 478–489.Wullschleger SD. 1993. Biochemical limitations to carbon assimilation in C3
plants – a retrospective analysis of the A/Ci curves from 109 species. Journal ofExperimental Botany 44: 907–920.
Wullschleger SD, Epstein HE, Box EO, Euskirchen ES, Goswami S, Iversen
CM, Kattge J, Norby RJ, van Bodegom PM, Xu X. 2014. Plant functional
types in Earth system models: past experiences and future directions for
application of dynamic vegetation models in high-latitude ecosystems. Annals ofBotany 114: 1–16.
Xu CG, Fisher R, Wullschleger SD, Wilson CJ, Cai M, McDowell NG. 2012.
Toward a mechanistic modeling of nitrogen limitation on vegetation dynamics.
PLoS ONE 7: e37914.
Zhu C, Ziska L, Zhu J, Zeng Q, Xie Z, Tang H, Jia X, Hasegawa T. 2012. The
temporal and species dynamics of photosynthetic acclimation in flag leaves of
rice (Oryza sativa) and wheat (Triticum aestivum) under elevated carbondioxide. Physiologia Plantarum 145: 395–405.
Ziehn T, Kattge J, Knorr W, Scholze M. 2011. Improving the predictability of
global CO2 assimilation rates under climate change. Geophysical Research Letters38: 10404.
No claim to original US Government works
New Phytologist� 2017 New Phytologist TrustNew Phytologist (2017) 216: 1090–1103
www.newphytologist.com
NewPhytologist Research 1103