Ternpe:rature Dependence, of Hydrolysis of … .,,t NRL Memorandum Report 5158 Ternpe:rature...
26
.. .. ' . ' ! - .,,t NRL Memorandum Report 5158 Ternpe:rature Dependence, of Hydrolysis of PolyinAide Wire Insulation F. 1. CAMPBELL Radiation-Afatter Interactions Branch Condensed Matter and Radiation Sciences Division August 4, 1983 NAVAL RESEARCH LABORATORY WashinJtton, D.C. •\i•l't••ved for pu!>lk release; unlimited. {) .-1 0 [)
Transcript of Ternpe:rature Dependence, of Hydrolysis of … .,,t NRL Memorandum Report 5158 Ternpe:rature...

.. ..
' . ' !
- .,,t
NRL Memorandum Report 5158
Ternpe:rature Dependence, of Hydrolysis of PolyinAide Wire Insulation
F. 1. CAMPBELL
Radiation-Afatter Interactions Branch Condensed Matter and Radiation Sciences Division
August 4, 1983
NAVAL RESEARCH LABORATORY WashinJtton, D.C.
•\i•l't••ved for pu!>lk release; di~tribution unlimited.
{) .-1 0
[)

SCCURITY CLASSIFICATION OF TNIS PAGE fW l 60 Date Entered)
REPORT DOCUMENTATION PAGE RED 'STRUCINOS1. REPORT NumeaE I2 GOVT ACCESSION NO. -. RECIPiENT"S CATALOG NUMMER
NRL Memorandum Report 5158 K____--____________4. TITL[ (and $"tlte) S. TyPe OF REPORT a P EROo COVERED
Interim reportTEMPERATURE DEPENDENCE OF HYDROLYSIS OF 7/1/82 - 6/30/83POLYIMIDE WIRE INSULATION * PRFORMIN oRG. REORT MUMMER
7. AUTHON(t) S. CONTRACT OR GRANT NUMBER(S)
F.J. Campbel6. PERVORMING ORGANIZATION NAME ANO ADDRESS 10. PROGRAM ELEMENT. PROJECT. TASK
Naval Research Laboratory AREA , UNIT ".,.N*Z
Washington, DC 20375 66-1699-0-3
I1. CONTROLLING OFFICE NAME ANO ADDRESS 43. REPORT DATE
Naval Air Systems Command August 4,1983Washington, DC 20361 13. NuMeER OF PAGES
2514. MONITORING AGENCY NAME I AOIRESSf(II dflferenI fm Conttrollnd OfficeJ VS. SECURITY CLASS. (of thl .poon)
UNCLASSIFIEDISO. DEC ASSIFICATION/DOWN GRADING
SCNEOULE
16. OISTRIUTION STATEMENT (of Wea Rpoprt)
Approved for public release; distribution unlimited.
I?. DISTRIbUTION STATEMENT (of the obract entered In Slock 20, It dife wt hvi Report)
1S. SUPPLEMENTARY NOTES
It. acey WORDS (Centime.an po ew. side It Anoeseary mnd Identify by block numbe)
Wires Hydrolysis Electrical insulationReliability Chemical reaction rate polyimideAircraft Arrhenius plotMulti-factor stress Thermal aging life prediction
20. AMSTRACT wConeIoe Art .OVeroo *#do Ii n ei noo mad Idemif by block mkf o)
Degradation of polymeric materials as a chemical reaction rate related to exposuremperature has been confirmed by many laboratory studies and the rate equation,
enhanced by other stresses and environmental conditions, has been utilized to comparethe service life expectancy of various electrical insulation materials and systems formany years. In recent Naval aircraft wiring applications it has been experienced that a
(Continues)0O, 1473 EDTION Or I NOV65 IS O.SOLCT.
S/N 0102-014- 6601SECURITY CLASSIFICATION OF THIS PAGE ( m Date E1114E)

SECUMITr CLASSIFICATION Of TNIS PAG( fthC Det. £.n.eE)
20. AUSTRACT (Coaninuod)
\popular polyimide insulation undergoes degradation by a hydrolytic chain splitting
reaction that can be attributed to an unexpected number of service failures. Inthis initial study it has been determined that the reaction does proceed in a neutralpH aqueous enviornment at a rate that is temperature dependent, and the data of lifeversus temperature conforms to an Arrhenius plot so that from accelerated tests atelevated temperatures it is possible to extrapolate to service temperatures. Continuingstudies will lead to the development of a functional aging procedure for applyinga moisture exposure step into each cycle in order to more nearly predict servicelife of this insulation system and provide a comparison with other candidatesystems.-
SsCUNItY CLASSIFCATION OF THIS PAGtr*on 0atef ,*ea)
ii
CONTENTS
INTRODUCTION .............................................. 1
BACKGROUND ................................................ 3
EXPERIMENTAL .............................................. 10
CONCLUSIONS AND RECOMMENDATIONS ........................ 20
REFERENCES ................................................ 22
A7ccessia'on For--NrIS GRA&IDTIC TAB ElUnannounced 0IJustif ictt i c.L
By -
Distr llmt I o/
rJ
ili

TEMPERATURE DEPENDENCE OF HYDROLYSIS OF POLYIMI3DE WIRE INSULATION
INTRODUCTION
The number of Naval aircraft maintenance problems due to deteriorated
wire insulation has increased at an appalling rate in the past few years.
The wiring that was initially specified for general installation was selected
for its expected durability along with its low weight and bulk character-
istics. However, the inherent weakness of this insulating material, that of
susceptibility to hydrolytic degradation which reduces the polymer chain
length and renders the initially very strong material to a weak and brittle
wire coating, was overlooked in the performance specifications. Therefore,
many of the Navy's aircraft are wired with this polyimide type insulation
that has become a major maintenance problem.
When cracking and fraying were initially observed the deterioration was
attributed to the wires coming into contact with the high pH cleaning
solutions used frequently on the aircraft. A study conducted at the Naval
Air Rework Facility (NARF) North Island, CA1I in 1976 demonstrated that the
time for cracking to develop in polyimide wire insulations was a function of
the pH and the temperature. In 1978, another study conducted at the Naval
Air Development Center, Warminster, PA 2 demonstrated that even in distilled
water (pH 7) the deterioration of polyimide insulation takes place, and it is
more rapid at 75'C than at room temperature. Upon additional search for
information on the observance of degradation of polyimide insulation it was
found that failures occurred during storage of aerospace wiring in which the
3insulation is applied as a bonded Kapton(-'film on flat wire missile cables
The failure was attributed to the high humidity of the uncontrolled environ-
ment in the cable stock room prior to the missile assembly. In other studies
conducted at Grumman Aerospace in 1971 4 it was also concluded that the
Manuscript approved July 14, 1983.

degradation of KaptonQ /polyimide film in aqueous media is due to a hydrolytic
chain scission mechanism occurring at amide linkages present in the polyimide.
Therefore, the previous studies provided the evidence that water in any form
will attack the polyimide chain and produce degradation. Increasing the
temperature of the exposures showed that the deterioration was accelerated
so it was presumed feasible to apply the Arrhenius rate equation to a study of
Kapton(. insulated wire, especially since water is a component of the aging
environment.
2

BACKGROUND,
A program to study the thermal aging characteristics of wire insulation
systems of interest to the Defense Department was initiated at the Naval
Research Laboratory in 1958, sponsored initially by the Electronic Technology
Laboratory of the Wright Air Development Division, United States Air Force,
and subsequently by the Airborne Equipment Division, Bureau of Naval Weapons
Department of the Navy. The program was continuous until about 1966. The
results of this program demonstrated that the relationship between reliable
life and the aging temperature of many commonly used power and hook-up wires
in aircraft and missile systems could be determined5 . By applying the laws
of physical chemistry to the philosophy of functional evaluation, a standard
procedure was adopted to obtain experimental data which plotted graphically
into the straight-line relationship commonly known as the Arrhenius Plot.
From experimental investigations of many different types of insulated wires,
curves have been derived showing the utility of this procedure as a thermal-
5aging classifying system
A very similar study was later started at the Lockheed Aircraft
Corporation to compare results obtained by the Navy and to evaluate several
new wire insulation systems that had more recently evolved. This work was
reported by Elliot in 1972 with Arrhenius plots very similar to those
6previously derived from a similar functional aging procedure . As a result
of the two studies the ASTM Subcommittee on Hook-up Wire Insulation, D09.16
developed a standardized procedure, utilizing a compromise of the procedures
of the above two studies, which is now published as a Standard Method of
Testing Hookup Wire Insulation for Relative Thermal Life and Temperature
Index.
3

The resulting life versus temperature relationships derived from these
procedures are providing aerospace design engineers with information to select
the wire insulation and to utilize minimum wire sizes required to maintain
maximum reliability while reducing weight and bulk to a minimum. These
procedures are based on the recognition that degradation is the result of a
chemical reaction such as oxidation that occurs at a rate that is temperature
dependent. This reaction then weakens the materials resistance to mechanical
stress, moisture penetration and electrical stress which ultimately produce
system failures.
Since this degradation is the result of a chemical reaction, the rate
can be expressed by a mathematical formula derived from a combination of the
first-order kinetic equation and the Arrhenius equation, which relates the
thermodynamic equilibrium constant of a reacting process to the exposure
8temperature . This derivation in final form is expressed as follows:
Log L = log A + BIT
where
L = hours of life to a specified end-point while aging at
a temperature T
T = absolute or Kelvin scale temperature (*C + 273)
A and B = constants of the intercept and the slope, respectively, and are
related to the entropy of the system and the activation energy
of the degradation process
4

This equation yields a straight-line curve which is easily interpreted when
plotted on semi-log graph paper which has been specially prepared to present
the hours of life on a logarithmic scale as the ordinate and the aging
temperature in degrees Celsius on the abscissa with a scale that has been
graduated to the reciprocal of the corresponding absolute temperature.
The life at any temperature can then be predicted from only three or
four experimental points by extrapolating the curve of the experimental data
of life versus temperature following a regression analysis. The reliability
of the prediction will then depend upon the accuracy of the equation constants
selected to describe the curve. Since deterioration is a function of chemical
changes occurring in the insulation material, extrapolations are limited to
the temperature region in which there are no transitions either in the physical
structure of the plastic, such as melting, or in the chemical mechanisms of
deterioration, such as a change from free-radical chain scission to rapid
oxidation or combustion.
In actual service conditions, the wire will experience other exposures
and stresses besides heat which can also contribute to deterioration and
failure of the insulation. These may be environmental such as humidity,
moisture, cold, dust, chemicals, and radiation. There will also be mechanical
and electrical stresses. The magnitude and number of these conditions to
which a wire may be exposed will depend on the type of aircraft, the location
of the wire, and the components of the circuit. To evaluate typical life by
a laboratory procedure, a compromise of simulated conditions which could be
readily reproduced was adopted and standardized. It was derived from
5

combining existing standards, information from published reports, and opinions
from personal surveys into a system by which multiple specimens could be
easily processed. This procedure, which was utilized in the earlier NRL
study provided the functional aging cycle through the following steps:
thermal degradation in an oven; mechanical flexing to amplify physical weak-
ness when embrittlement occurs; exposure to a moisture-saturated atmosphere,
which will seek out cracks and porosities in the materials caused by heating
and flexing; and finally a voltage stress, which determines the electrical
integrity of the wire insulation in the moist atmosphere. By applying these
steps in repeated cycles, the life at each temperature was readily determined.
By subjecting each wire sample to this procedure, the resulting curves
obtained presented a comparison of the merits of a particular wire with
respect to others of its classification. By plotting curves of many wires on
a single graph, it was found that within each MIL-specification, a range of
typical characteristics could be outlined. From results of all tests
conducted in that study, typical ranges of life versus temperature are
presented graphically in Figure 1 for the following wire specifications:
MIL-W-5086A, MIL-W-8777A, MIL-W-7139A, MIL-W-25038, MIL-W-16878C - "E" and
"EE. ''5 Specifying 10,000 hours as the rated operating life desired, the
approximate normal operating temperatures which can be specified for these
wires are listed in Table I. This information can be a very useful tool to
the design engineer for selecting the type of wire needed for particular
temperature zones and thermal load requirements.
6

10,00 5086 A 8777A--_ 7139 A-2503850,000r-4 Ill 7 1 r 6878C
- A~ A -t E-EE20,000k I
1000
2,000
12000AMU
100
50;--
10LL 1 L fi100 120 140 160 180 200 240 280 320 360 400
TEMPERATURE (0C)(RECIPROCAL ABSOLUTE -TEMPERATURE SCALE)
SUMMARY GRAPHRANGES OF LIFE TEMPERATURE CURVES
OF MIL- SPECIFICATION WIRES
Figure 1. Summary graph of the Arrhenius plots of various aircraft wires
showing the ranges of life-temperature curves for each type of
insulation. (from Ref. 5)

Table I. Classifying temperatures of various types of aircraft wires derived
from The Arrhenius plots of Figure 1.
Average Classifying TemperatureMilitary Specification at 10,000 hours, °C
MIL-W-5086A 115
MIL-W-8777A 185
MIL-W-7139A 235
MIL-C-25038 270
MIL-W-16878C, types E and EE 290
a

Since the recent experiences with KaptonQ~insulated wires have found
that hydrolytic degradation due to moisture and high pH fluid exposures is
the primary cause of wiring failures, the current study has been directed
toward the inclusion of such an environmental condition into a modification
of the standard procedure described above. The initial experiments which
were conducted to determine if the hydrolysis reaction also followed the
Arrhenius rate will be described in the next section.
9I

EXPERIMENTAL
Experiments were conducted to determine the temperature-life relationship
of the hydrolytic degradation reaction under accelerated conditions. The
procedure consisted of aging wire specimens in water at various temperatures
and testing to determine the time to reach an arbitrary end-of-life, deter-
mined by a proof-voltage test.
The experimental apparatus consisted of three 3-liter reaction kettles
filled with deionized water and fitted with heating mantles and water-cooled
condenser tubes. Temperatures were controlled at 600C, 800 C and 1000C with
Versatherm(,electronic temperature controllers linked to mercury contact
thermo-regulators. With this system the water temperatures were controlled to
within t 1°C. A view of the controllers and kettles with wire specimens
being aged is shown in Figure 2.
The pH of the water at room temperature was measured with a Fisher
AcumetopH meter. Initially, when the kettles were filled from the Barnstead
803 Demineralizer, the pH was 6.95. After completion of the aging exposures
of the wires being studied the water from the 100 0C kettle (after approximately
three months) was again measured at room temperature and was found to have a
pH of 8.60. No post-exposure measurements were made on the water from the
other two kettles.
Specimens were prepared from samples of MIL-W-81381/11 wires obtained
from the Defense Industrial Supply Center, representative of two different
manufacturers. Each specimen consisted of a 32-inch length of wire wrapped
tightly around a i-inch diameter rod of TFF-Teflonofor a wrapped length of
10-inches, or 51 turns. Waterproof FEP-Teflon®Rtape was employed to hold
the wire in place on the rod throughout the exposure life of the specimen.
10

PIN
8012(1)
Figure 2. Controlled temperature water immersion system for wire specimens.
11

The two ends of the wire were stripped and twisted together, giving a 10-inch
straight wire handle to facilitate the immnersion of the specimen into the hot
water for aging and in the cold water of the voltage proof-test beaker.
After each hot water aging cycle the specimens were cooled in water at
room temperature and then examined for cracks in the wire jackets. In most
wire samples the appearance of cracks was a good indication that the proof-
test failure was iminent. End-of-life was determined by applying a voltage
stress of 2500 volts rrns between the conductor and a ground wire in the
beaker of tap waters for 30 seconds. With the Peschel Series H, Sensitive
Hipot Tester, a voltage rise of one second per kilovolt was applied. Over-
load sensitivity was set at 500 mA, so that a failure occurred either on the
complete breakdown at a point in the insulation or when leakage current of
the degraded specimen exceeded this amount. A view of the test is shown in
Figure 3. If failure did not occur the specimens were returned for another
cycle of aging in the hot water.
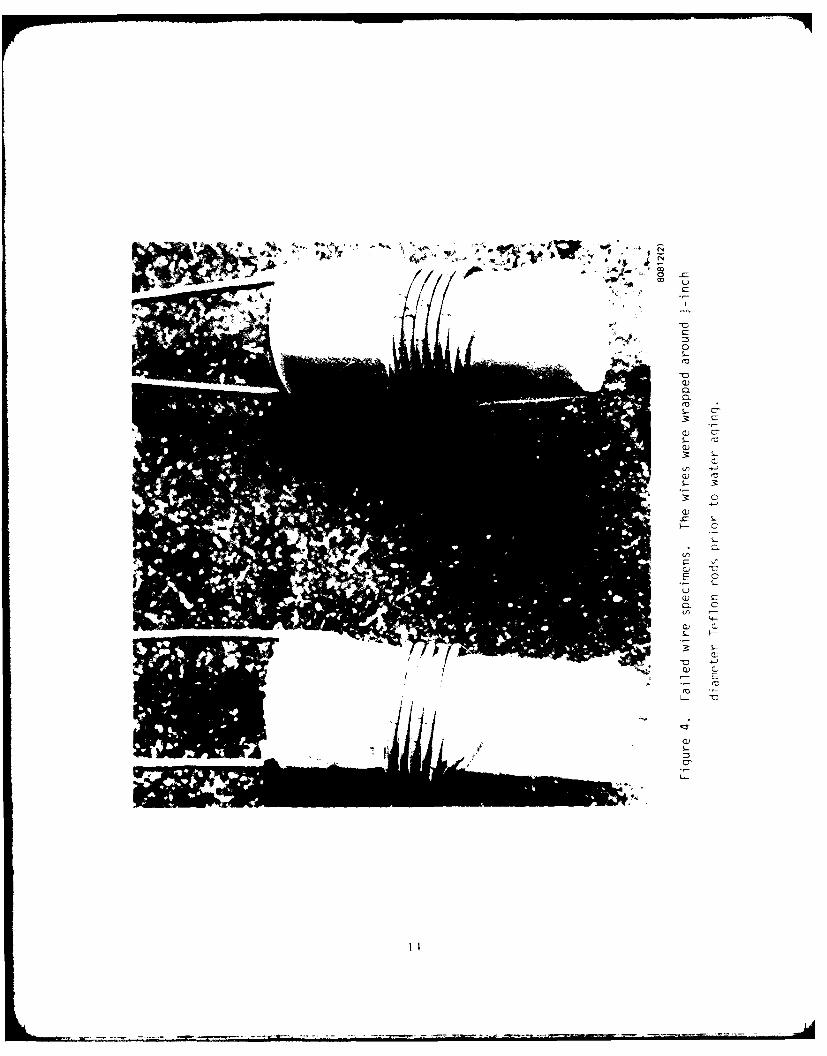
A close-up of two wire specimens that had failed the proof-test is shown
in Figure 4. Many cracks developed in the top coat of the wires during the
water aging, and it was usually noticed before the specimen aged to the
failure cycle, giving a warning of the approach of the failure time. When
voltage breakdown did occur, it was through the primary insulation at one of
these cracks. The number of cracks developing differed with each manufac-
turer's wire, indicating that variations are permissible in the top-coating
process.
12

_________ - ti
4J
CAi
4- prw~a*waar V - S ~*- 0 ~CU
C
Cla.a(01- C~3 C
Cl Cs~ r~Cl3 L
Cl~C UH- C
U
(AC U~Cl rCl C
S.-S.)Cl Ca CLA I-
'4-Cl C.U H-
3 S.-
'0U- r
Cl
U
C-
U-
I'
The exposure test cycles were established by a pre-data run with two
specimens aged at 800C and 1000C to obtain an approximation of life at these
temperatures. Where practical each cycle period was established to approxi-
mate one-tenth of the estimated lifetime, except for the 100*C aging where
the minimum timing of 24 hours was applied. These aging schedules were as
follows:
Water Temperature: 1000C 800C 600CHours Per Cycle: 24 48 72
Failures did not all occur at the same cycle, so the failure times of
the ten specimens at each aging temperature were averaged to determine the
life at that temperature. Time to failure of a specimen was determined by
taking the total exposure time of the cycles through which it passed the
proof-test plus one-half of the time of the last cycle. The time for each
data point on the Arrhenius plot is the log average life of the ten specimens
tested at that temperature.
log t I+log t2 +log t3 . . log t10Log average life = log -10
where ti, t2, t39. . . . . t10 are the successive times to failure of the 10
specimens of that group.
It would be possible to make a complete regression analysis of the
life-temperature data thus obtained by following the statistical analysis
procedure in IEEE Standard No. 101. However, the abbreviated procedure of
this standard was applied here to plot the best-fit straight line to the
data points.
15
The Arrhenius plots of each wire sample are shown in Figures 5 and 6
showing the data spread of the ten specimens at each temperature point and the
close fit of the log average life points to a straight line. A plot of the
two samples studies is presented in Figure 7, showing that the slopes are
nearly the same, indicating that the activation energy for the hydrolytic
degradation mechanism is the same for each sample. Since the lines do not
overlap, variations in the wire manufacturing process are attributed to the
shift in the constant of the Arrhenius equation.
I 16

100,000
IxI
"-
U. 1oo. ."0
I-I
0z __
10
10
20 30 40 50 60 70 80 90 100 110 120TEMPERATURE, 0C
(RECIPROCAL ABSOLUTE- TEMPERATURE SCALE)
Figure 5. Life versus water aging temperature of wire sample no. 1,
MIL-W-81381/11, AWG 22, aromatic polyimide (Kapton®) insulation.
17

100,000
LL
100
1020 3 0 5 0 7 0 9 0 1 2
1008

10,000 -
U-0
Ch,
D
0 1__000_
z
100_ __
10
20 30 40 50 60 70 80 90 100 110 120
TEMPERATURE, 0C
(RECIPROCAL ABSOLUTE- TEMPERATURE SCALE)
Figure 7. Comparison of Arrhenius plots of wire samples from two different
manufacturers. MIL-W-81381/11, AWG 22, aromatic polyimide
(Kapton®-) insulation.
19

CONCLUSIONS AND RECOMMENDATIONS
The results of this initial experiment demonstrate that the Arrhenius
rate equation can be applied to achieve linear extrapolation from higher
temperature, shorter life tests in order to approximate the lifetime of the
insulation system at the service temperature under the same conditions of
aging. Other parameters of stress held constant throughout the test will have
an effect on the intercepts (predicted life at a specified service temperature),
but manufacturing variations in which the same materials were used will
probably not affect the slope. For example, wrapping the wires on a smaller
diameter rod will impose a greater stress on the outer perimeter of the
insulation and thus reduce the time to failure at the test temperature.
Since other studies found in the reference literature confirm that the major
reaction in Kapton-degradation is chain splitting by hydrolysis, the same
procedure of accelerated testing should also be applicable to other variations
in the nature of the aqueous media of the aging exposure test. Typical high
humidity conditions of the aircraft carrier can also produce the hydrolysis
reaction, and thus life in a humid environment should also be predictable by
extrapolating from accelerated temperature tests in controlled humidity
chambers by the Arrhenius plot procedure. Further studies will be conducted
to determine if this can be applied by substituting controlled humidity
exposures in place of the deionized water of this first study.
The long-range program objective does not only address this specific
problem of determining the effects of hydrolysis in service-simulated aqueous
exposures on the service life of this one type of insulation used on Navy
aircraft. The selection of alternative types is now also an important
policy course to be followed in future aircraft wiring installations. Other
20

insulation systems may be less vulnerable to hydrolytic degradation, but may
be more adversely affected by other service environments or stresses. Thus,
a functional aging procedure which incorporates these other possible major
stress parameters in a multi-factor accelerated process will be developed in
order to obtain an estimation of service life and a comparison of insulation
systems.
In addition, the Arrhenius plot provides a relative comparison of various
manufacturers' experimental wire insulation products so that the same proce-
dures will provide an index of quality that is useful to industrial
laboratories. Therefore, the procedure will be an essential addition to the
other quality assurance and performance requirements of the existing wire
specification documents.
21

REFERENCES
1. NARF Report No. 03-76, Fluid Immersion Testing of Electrical Wire, North
Island Rework Facility, February 13, 1976.
2. NADC Report, "Airframe Wire Evaluation: Resistance to Heat and Aircraft
Surface Cleaners (MIL-C-43616)", Naval Air Development Center, June 5,
1978.
3. Sandia Report SC-TM-70-228, "Effects of Humidity on Polyimide-Insulated
Cables Used on the W-68", Sandia Laboratories, April 1970.
4. R. Delasi and J. Russell, "Aqueous Degradation of Polyimides", Journal of
Applied Polymer Science, Vol 15, pp 2965-2974 (1971).
5. F.J. Campbell and E.L. Brancato, "Determination and Application of
Thermal-Life Characteristics of Aerospace Wires", Insulation, Part 1
pp 17-22, October 1963; Part 2 pp 23-30, November 1963.
6. D.K. Elliot, "A Standardized Procedure for Evaluating the Relative Thermal
Life and Temperature Rating of Thin-Wall Airframe Wire Insulation", IEEE
Transactions on Electrical Insulation, Vol EI-7, No. 1, pp 16-25,
March 1972.
7. ASTM Standard No. D 3032-82, Section 14, "Standard Method of Testing
Hookup Wire Insulation for Relative Thermal Life and Temperature Index"
8. T.W. Dakin, "Electrical Insulation Deterioration Treated as a Chemical
Rate Phenomena", AIEE Transactions, Vol 67, pp 113-122, 1948.
22