Term 2, 2011 Week 1. CONTENTS Types and purposes of graphic representations Spreadsheet software –...
21
Types and purposes of graphic representation Term 2, 2011 Week 1
-
Upload
philippa-pope -
Category
Documents
-
view
214 -
download
0
Transcript of Term 2, 2011 Week 1. CONTENTS Types and purposes of graphic representations Spreadsheet software –...
Types and purposes of graphic representation
Term 2, 2011Week 1
CONTENTS
• Types and purposes of graphic representations• Spreadsheet software– Producing graphs from numerical data
• Mathematical functions• Financial functions• Statistical functions• Lookup and reference functions
– Efficiency– Effectiveness
• Questions

Types and purposes of graphic representations
• Graphic representations of data are pictorial diagrams that show interdependence between variables.
• In IT, a variable is a word or symbol that represents a value that may change.
• They are one of the most commonly used methods of representing data & information, and can make the reading of data & information more interesting, less time consuming & more understandable.

• They are also used to facilitate the interpretation of data & for data to be compared at a glance.
• Graphic representations are particularly useful for summarising a data set, the associated interrelationships & assist in the identification of trends and patterns.
Column & bar charts
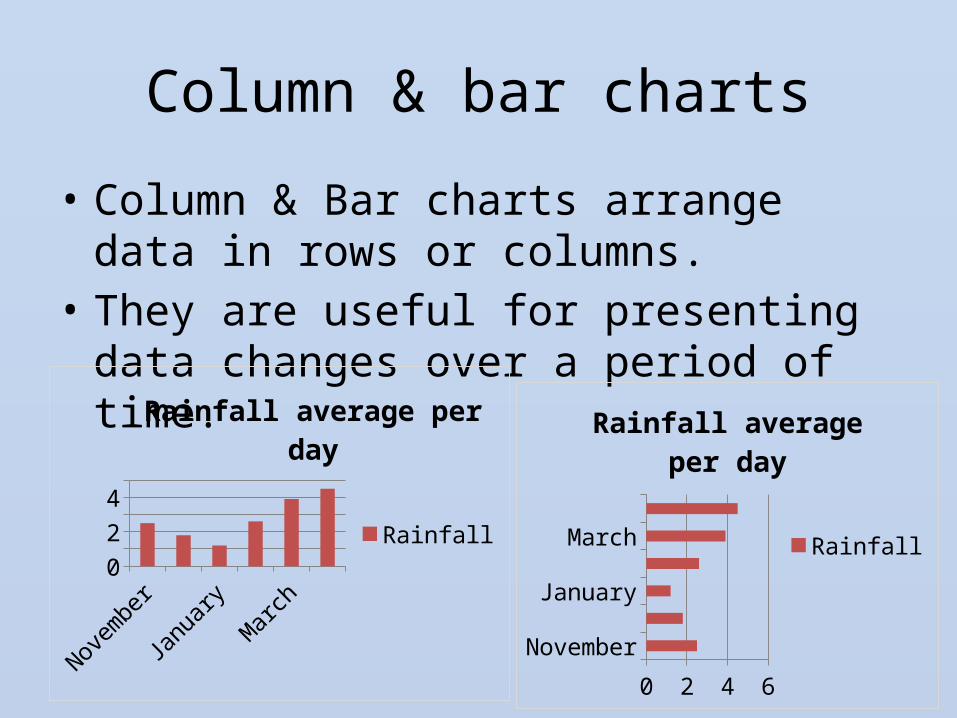
• Column & Bar charts arrange data in rows or columns.
• They are useful for presenting data changes over a period of time.
November
December
January
Febru
ary
Marc
hApril
012345
Rainfall average per day
Rainfall
November
December
January
February
March
April
0 1 2 3 4 5
Rainfall average per day
Rainfall

Line charts
• Line charts display continuous data over time.• They are useful for showing trends in data at equal intervals.
Monday
Tuesday
Wednesd
ay
Thursday
Friday
Monday
Tuesday
Wednesd
ay
Thursday
Friday
4080
4085
4090
4095
4100
4105
4110
AORD Performance over two week period
Exchange Rate
Pie charts
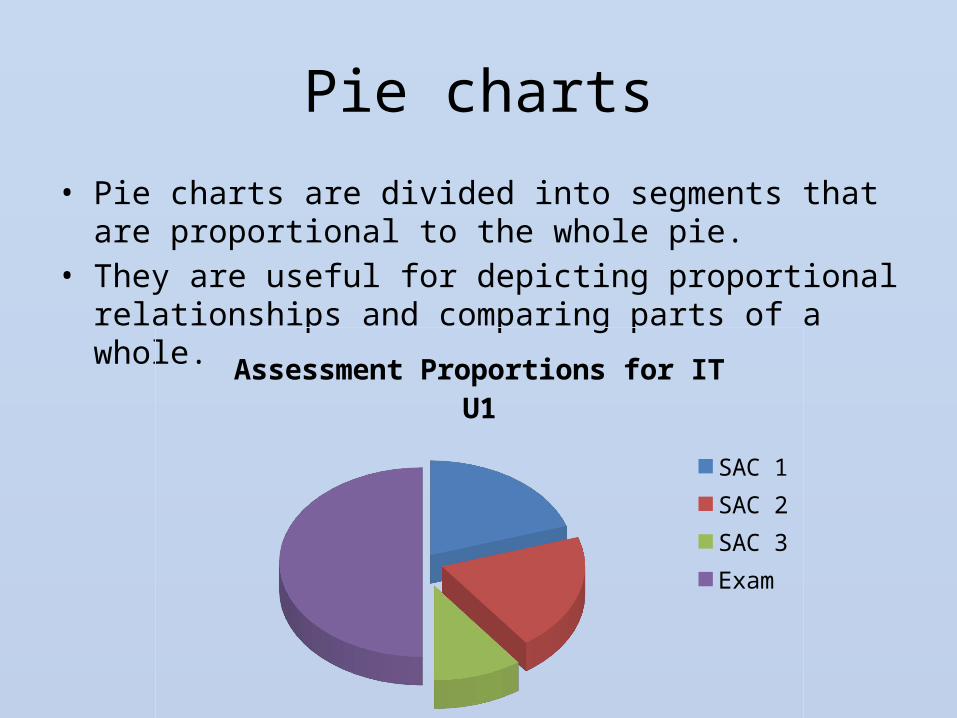
• Pie charts are divided into segments that are proportional to the whole pie.
• They are useful for depicting proportional relationships and comparing parts of a whole.
Assessment Proportions for IT U1
SAC 1SAC 2SAC 3Exam
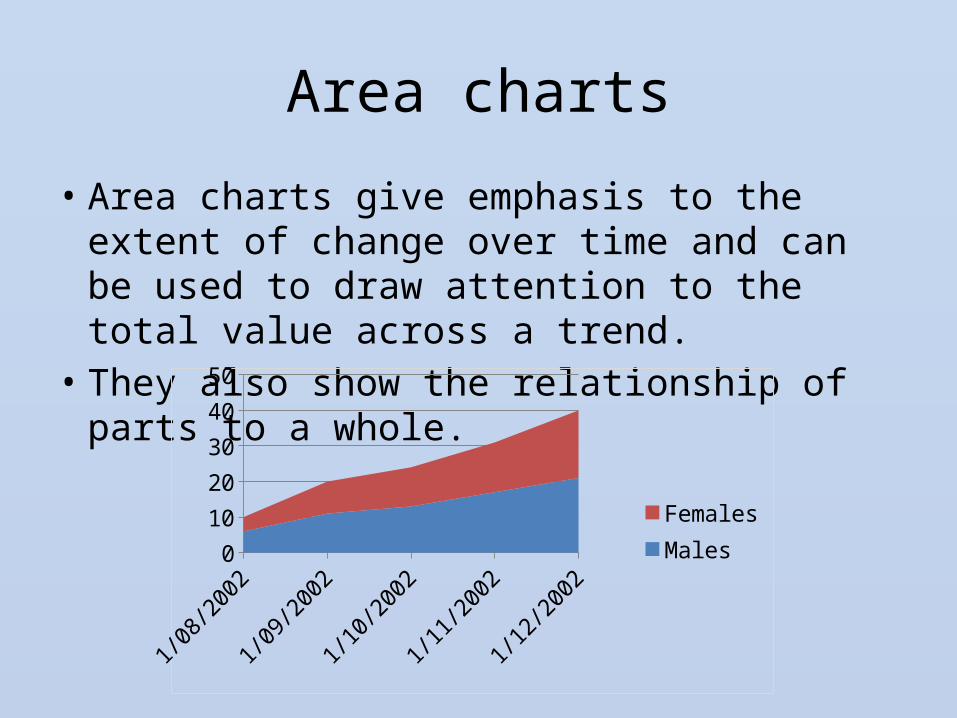
Area charts
• Area charts give emphasis to the extent of change over time and can be used to draw attention to the total value across a trend.
• They also show the relationship of parts to a whole.
1/08/2
002
1/09/2
002
1/10/2
002
1/11/2
002
1/12/2
0020
10
20
30
40
FemalesMales

Scatter diagrams
• Scatter diagrams show the relationship between two variables.
• Typically, they are used for displaying & comparing scientific, statistical & engineering data.
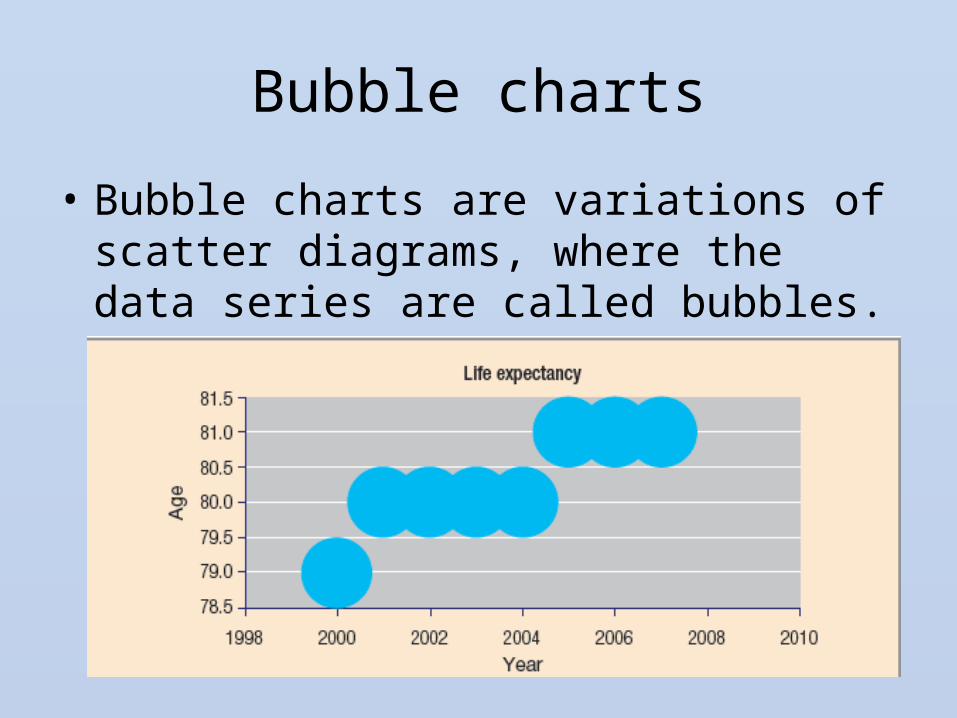
Bubble charts
• Bubble charts are variations of scatter diagrams, where the data series are called bubbles.

Spreadsheet software
• Spreadsheets were previously written on paper. Computerised spreadsheets originated in 1979.
• Spreadsheets display data in a table form, with rows and columns, called a worksheet. Columns are identified by letters, and rows by numbers.
• The location of a cell is known as a cell reference.• When referencing a group of cells (or a range of
cells) start with the beginning cell reference, and then the last cell.
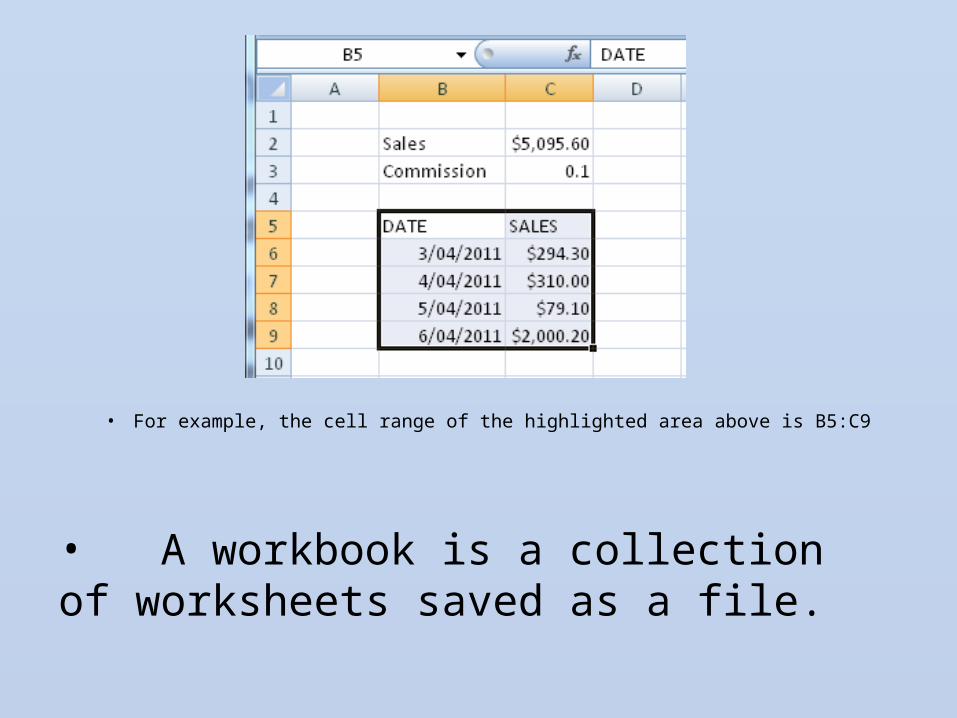
• For example, the cell range of the highlighted area above is B5:C9
• A workbook is a collection of worksheets saved as a file.

• Formulas and functions are used in spreadsheets to manipulate data. Common formulas include:– Conditional formulas test whether conditions are true
and false and make logical comparisons between expressions. AND, OR, NOT and IF functions are used to create conditional formulas.
– Lookup formulas return a value from a table (in a range) by looking up another value.
– Date and time formulas provide various functions for working with date and time.
– Financial, statistical and math formulas allow you to use a number of financial, statistical and/or math functions to perform calculations.
– Counting formulas allow you to perform a variety of counts, such as counting how often a specific value occurs or counting unique values among duplicates.
– Conversion formulas allow you to convert times, measurements and numbers into different number systems.
– Text formulas provide various options for working with text, including the ability to check whether text exists in a cell, which can assist with existence checking.
• Functions are predefined formulas that perform calculations by using given values, called arguments, in a particular order or structure. They can be used to perform simple or complex calculations.

• A significant capability of spreadsheets is they allow you to sort and filter data.
• Sorting data is an essential part of data analysis. Sorting assists you to visualise the data more clearly so that it is organised and enables you to find data quickly.
• Filtering enables you to work with a subset of data as it displays only the rows that meet a specific criteria.

• Advantages of spreadsheets include– Their ability to update information and perform
calculations quickly.– Ability to perform a ‘what if analysis’ (where the
values in the cells are changed to see how those changes would affect the outcome on the spreadsheet).
– Can be used for a variety of purposes that involve calculations.

Producing graphs from numerical data
• Spreadsheet functions can be used to manipulate numerical data in several ways.
• Through the use of mathematical, financial, statistical, lookup and reference functions, spreadsheets provide users with a range of capabilities that facilitate efficient and effective working with numbers.– Mathematical functions: Spreadsheets facilitate the use of simple
and complex mathematical calculations. – Financial functions: Effective decision-making is reliant on
information provided by the accounting system. Spreadsheets are an essential part of any financial analysis as they enable users to conduct profit analysis, prepare quotations and budgets, deal with investment data etc.
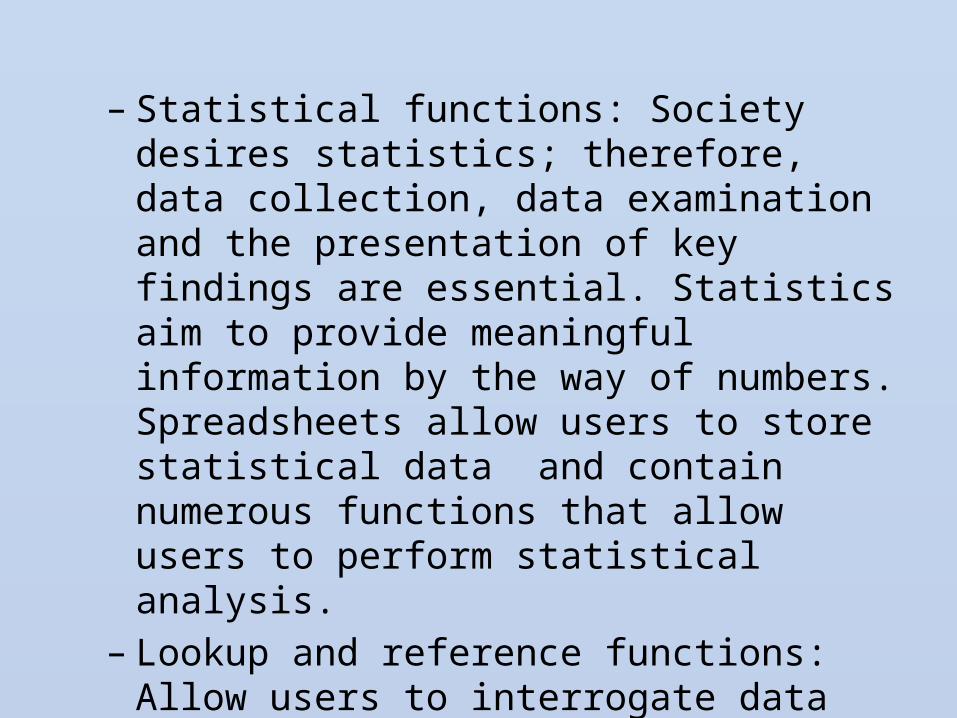
– Statistical functions: Society desires statistics; therefore, data collection, data examination and the presentation of key findings are essential. Statistics aim to provide meaningful information by the way of numbers. Spreadsheets allow users to store statistical data and contain numerous functions that allow users to perform statistical analysis.
– Lookup and reference functions: Allow users to interrogate data tables, and values can be returned from a specific range.
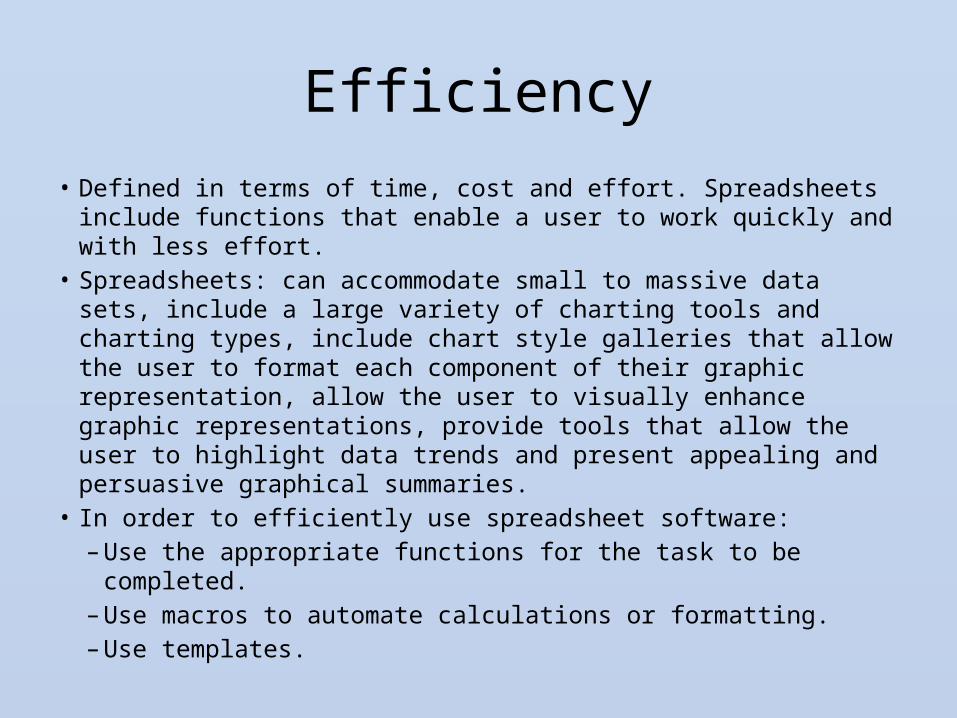
Efficiency• Defined in terms of time, cost and effort. Spreadsheets include
functions that enable a user to work quickly and with less effort. • Spreadsheets: can accommodate small to massive data sets,
include a large variety of charting tools and charting types, include chart style galleries that allow the user to format each component of their graphic representation, allow the user to visually enhance graphic representations, provide tools that allow the user to highlight data trends and present appealing and persuasive graphical summaries.
• In order to efficiently use spreadsheet software:– Use the appropriate functions for the task to be completed.– Use macros to automate calculations or formatting.– Use templates.

Effectiveness
• A measure of how well a solution works and the extent to which it fulfils its purpose.
• Measures of an effective solution include completeness, readability, attractiveness, clarity, accuracy, accessibility, timeliness, communication of message, relevance and reliability.
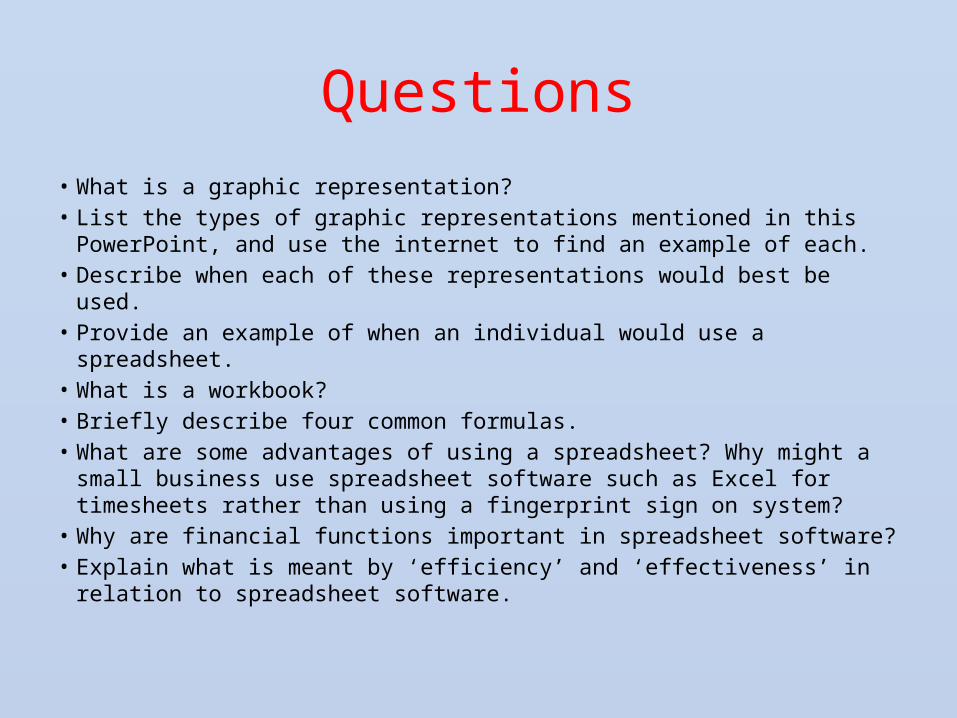
Questions• What is a graphic representation?• List the types of graphic representations mentioned in this PowerPoint,
and use the internet to find an example of each.• Describe when each of these representations would best be used.• Provide an example of when an individual would use a spreadsheet.• What is a workbook?• Briefly describe four common formulas.• What are some advantages of using a spreadsheet? Why might a small
business use spreadsheet software such as Excel for timesheets rather than using a fingerprint sign on system?
• Why are financial functions important in spreadsheet software?• Explain what is meant by ‘efficiency’ and ‘effectiveness’ in relation to
spreadsheet software.