Tennessee Mathematics Standards
171
1 Revised February 5, 2021 Tennessee Mathematics Standards Introduction The Process The Tennessee State Math Standards were reviewed and developed by Tennessee teachers for Tennessee schools. The rigorous process used to arrive at the standards in this document began with a public review of the then-current standards. After receiving public reviews and comments, a committee composed of Tennessee educators spanning elementary through higher education reviewed each standard. The committee scrutinized and debated each standard using public feedback and the collective expertise of the group. The committee kept some standards as written, changed or added imbedded examples, clarified the wording of some standards, moved some standards to different grades, and wrote new standards that needed to be included for coherence and rigor. From here the standards went before the appointed Standards Review Committee to make further recommendations before being presented to the Tennessee Board of Education for final adoption. The result is Tennessee Math Standards for Tennessee Students by Tennesseans. Mathematically Prepared Tennessee students have various mathematical needs that their K-12 education should address. All students should be able to recall and use their math education when the need arises. That is, a student should know certain math facts and concepts such as the multiplication table, how to add, subtract, multiply, and divide basic numbers, how to work with simple fractions and percentages, etc. There is a level of procedural fluency that a student’s K-12 math education should provide him or her along with conceptual understanding so that this can be recalled and used throughout his or her life. Students also need to be able to reason mathematically. This includes problem solving skills in work and non-work related settings and the ability to critically evaluate the reasoning of others. A student’s K-12 math education should also prepare him or her to be free to pursue post- secondary education opportunities. Students should be able to pursue whatever career choice, and its post-secondary education requirements, that they desire. To this end, the K-12 math standards lay the foundation that allows any student to continue further in college, technical school, or with any other post-secondary educational needs. A college and career ready math class is one that addresses all of the needs listed above. The standards’ role is to define what our students should know, understand, and be able to do mathematically so as to fulfill these needs. To that end, the standards address conceptual understanding, procedural fluency, and application.
Transcript of Tennessee Mathematics Standards

1 Revised February 5, 2021
Tennessee Mathematics Standards
Introduction The Process
The Tennessee State Math Standards were reviewed and developed by Tennessee teachers for
Tennessee schools. The rigorous process used to arrive at the standards in this document began with a public review of the then-current standards. After receiving public reviews and comments, a committee composed of Tennessee educators spanning elementary through higher education reviewed each standard. The committee scrutinized and debated each standard using public feedback and the collective expertise of the group. The committee kept some standards as written, changed or added imbedded examples, clarified the wording of some standards, moved some standards to different grades, and wrote new standards that needed to be included for coherence and rigor. From here the standards went before the appointed Standards Review Committee to make further recommendations before being presented to the Tennessee Board of Education for final adoption.
The result is Tennessee Math Standards for Tennessee Students by Tennesseans.
Mathematically Prepared
Tennessee students have various mathematical needs that their K-12 education should address.
All students should be able to recall and use their math education when the need arises. That is, a student should know certain math facts and concepts such as the multiplication table, how to add, subtract, multiply, and divide basic numbers, how to work with simple fractions and percentages, etc. There is a level of procedural fluency that a student’s K-12 math education should provide him or her along with conceptual understanding so that this can be recalled and used throughout his or her life. Students also need to be able to reason mathematically. This includes problem solving skills in work and non-work related settings and the ability to critically evaluate the reasoning of others.
A student’s K-12 math education should also prepare him or her to be free to pursue post-
secondary education opportunities. Students should be able to pursue whatever career choice, and its post-secondary education requirements, that they desire. To this end, the K-12 math standards lay the foundation that allows any student to continue further in college, technical school, or with any other post-secondary educational needs.
A college and career ready math class is one that addresses all of the needs listed above. The
standards’ role is to define what our students should know, understand, and be able to do mathematically so as to fulfill these needs. To that end, the standards address conceptual understanding, procedural fluency, and application.

2 Revised February 5, 2021
Conceptual Understanding, Procedural Fluency, and Application
In order for our students to be mathematically proficient, the standards focus on a balanced development of conceptual understanding, procedural fluency, and application. Through this balance, students gain understanding and critical thinking skills that are necessary to be truly college and career ready.
Conceptual understanding refers to understanding mathematical concepts, operations, and
relations. It is more than knowing isolated facts and methods. Students should be able to make sense of why a mathematical idea is important and the kinds of contexts in which it is useful. It also allows students to connect prior knowledge to new ideas and concepts.
Procedural fluency is the ability to apply procedures accurately, efficiently, and flexibly. One
cannot stop with memorization of facts and procedures alone. It is about recognizing when one strategy or procedure is more appropriate to apply than another. Students need opportunities to justify both informal strategies and commonly used procedures through distributed practice. Procedural fluency includes computational fluency with the four arithmetic operations. In the early grades, students are expected to develop fluency with whole numbers in addition, subtraction, multiplication, and division. Therefore, computational fluency expectations are addressed throughout the standards. Procedural fluency extends students’ computational fluency and applies in all strands of mathematics. It builds from initial exploration and discussion of number concepts to using informal strategies and the properties of operations to develop general methods for solving problems (NCTM, 2014).
Application provides a valuable context for learning and the opportunity to practice skills in a
relevant and a meaningful way. As early as Kindergarten, students are solving simple “word problems” with meaningful contexts. In fact, it is in solving word problems that students are building a repertoire of procedures for computation. They learn to select an efficient strategy and determine whether the solution(s) makes sense.
Problem solving provides an important context in which students learn about numbers and other
mathematical topics by reasoning and developing critical thinking skills (Adding It Up, 2001).
Progressions
The standards for each grade are not written to be nor are they to be considered as an island in and of themselves. There is a flow, or progression, from one grade to the next, all the way through to the high school standards. There are four main progressions that are composed of mathematical domains/conceptual categories (see the Structure section below and color chart on the following page).
The progressions are grouped as follows:
Grade Domain/Conceptual Category
K Counting and Cardinality
K-5 Number and Operations in Base Ten

3 Revised February 5, 2021
3-5 Number and Operations – Fractions
6-7 Ratios and Proportional Relationships
6-8 The Number System
9-12 Number and Quantity
K-5 Operations and Algebraic Thinking
6-8 Expressions and Equations
8 Functions
9-12 Algebra and Functions
K-12 Geometry
K-5 Measurement and Data
6-12 Statistics and Probability
Each of the progressions begins in Kindergarten, with a constant movement toward the high
school standards as a student advances through the grades. This is very important to guarantee a steady, age appropriate progression which allows the student and teacher alike to see the overall coherence of and connections among the mathematical topics. It also ensures that gaps are not created in the mathematical education of our students.

4 Revised February 5, 2021
Structure of the Standards
Most of the structure of the previous state standards has been maintained. This structure is logical and informative as well as easy to follow. An added benefit is that most Tennessee teachers are already familiar with it.
The structure includes:
• Content Standards - Statements of what a student should know, understand, and be able to do.
• Clusters - Groups of related standards. Cluster headings may be considered as the big idea(s) that the
group of standards they represent are addressing. They are therefore useful as a quick summary of the progression of ideas that the standards in a domain are covering and can help teachers to determine the focus of the standards they are teaching.
• Domains - A large category of mathematics that the clusters and their respective content standards
delineate and address. For example, Number and Operations – Fractions is a domain under which there are a number of clusters (the big ideas that will be addressed) along with their respective content standards, which give the specifics of what the student should know, understand, and be able to do when working with fractions.
• Conceptual Categories – The content standards, clusters, and domains in the 9th – 12th grades are
further organized under conceptual categories. These are very broad categories of mathematical thought and lend themselves to the organization of high school course work. For example, Algebra is a conceptual category in the high school standards under which are domains such as Seeing Structure in Expressions, Creating Equations, Arithmetic with Polynomials and Rational Expressions, etc.
Standards and Curriculum
It should be noted that the standards are what students should know, understand, and be able to do; but, they do not dictate how a teacher is to teach them. In other words, the standards do not dictate curriculum. For example, students are to understand and be able to add, subtract, multiply, and divide fractions according to the standards. Although within the standards algorithms are mentioned and examples are given for clarification, how to approach these concepts and the order in which the standards are taught within a grade or course are all decisions determined by the local district, school, and teachers.
Example from the Standards’ Document for K – 8
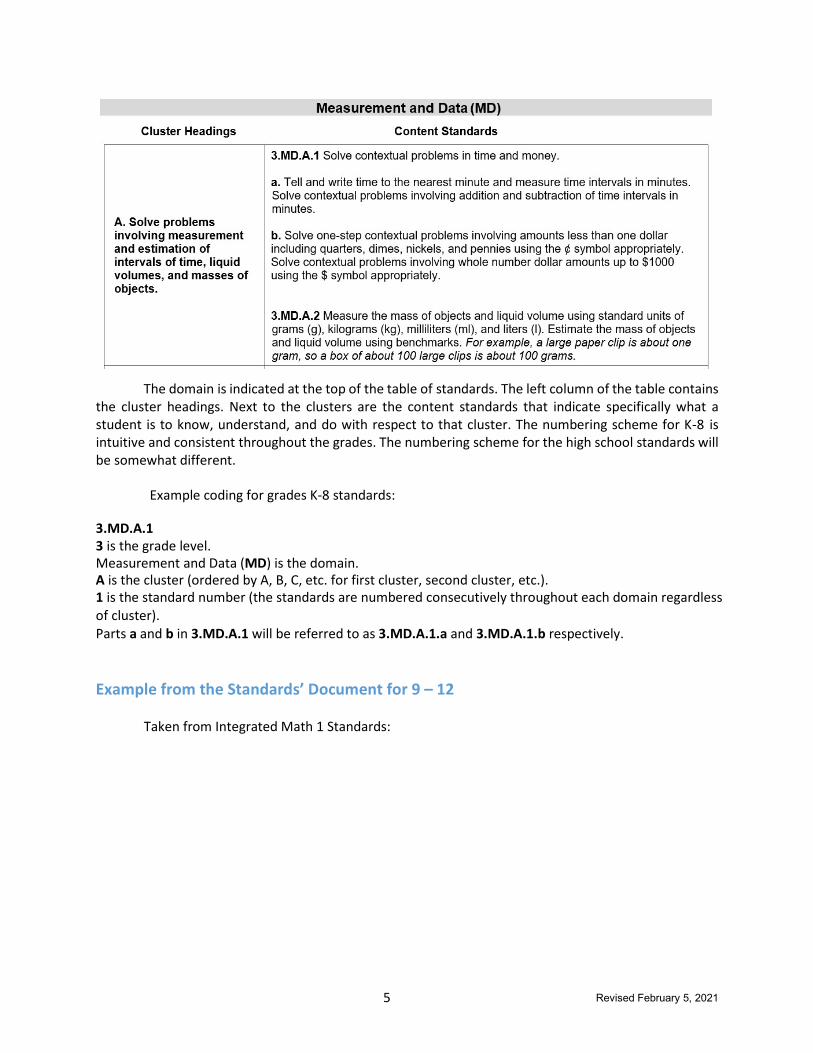
Taken from 3rd Grade Standards:
5 Revised February 5, 2021
The domain is indicated at the top of the table of standards. The left column of the table contains the cluster headings. Next to the clusters are the content standards that indicate specifically what a student is to know, understand, and do with respect to that cluster. The numbering scheme for K-8 is intuitive and consistent throughout the grades. The numbering scheme for the high school standards will be somewhat different.
Example coding for grades K-8 standards:
3.MD.A.1 3 is the grade level. Measurement and Data (MD) is the domain. A is the cluster (ordered by A, B, C, etc. for first cluster, second cluster, etc.). 1 is the standard number (the standards are numbered consecutively throughout each domain regardless of cluster). Parts a and b in 3.MD.A.1 will be referred to as 3.MD.A.1.a and 3.MD.A.1.b respectively.
Example from the Standards’ Document for 9 – 12
Taken from Integrated Math 1 Standards:

6 Revised February 5, 2021
The high school standards follow a slightly different coding structure. They start with the course indicator (M1 – Integrated Math 1, A1 – Algebra 1, G – Geometry, etc.), then the conceptual category (in the example below – Algebra) and then the domain (just above the table of standards it represents – Seeing Structure in Expressions). There are various domains under each conceptual category. The table of standards contains the cluster headings (see explanation above), content standards, and the scope and clarifications column, which gives further clarification of the standard and the extent of its coverage in the course. A * with a standard indicates a modeling standard (see MP4 on p.11).
Example coding for grades 9-12 standards:
M1.A.SSE.A.1 Integrated Math 1 (M1) is the course. Algebra (A) is the conceptual category. Seeing Structure in Expressions (SSE) is the domain. A is the cluster (ordered by A, B, C, etc. for first cluster, second cluster, etc.). 1 is the standard number (the standards are numbered consecutively throughout each domain regardless of cluster).

7 Revised February 5, 2021
Tennessee State Mathematics Standards

8 Revised February 5, 2021
The Standards for Mathematical Practice
Being successful in mathematics requires that development of approaches, practices, and habits of mind be in place as one strives to develop mathematical fluency, procedural skills, and conceptual understanding. The Standards for Mathematical Practice are meant to address these areas of expertise that teachers should seek to develop within their students. These approaches, practices, and habits of mind can be summarized as “processes and proficiencies” that successful mathematicians have as a part of their work in mathematics.
Processes and proficiencies are two words that address the purpose and intent of the practice standards. Process is used to indicate a particular course of action intended to achieve a result, and this ties to the process standards from NCTM that pertain to problem solving, reasoning and proof, communication, representation, and connections. Proficiencies pertain to being skilled in the command of fundamentals derived from practice and familiarity. Mathematically, this addresses concepts such as adaptive reasoning, strategic competence, conceptual understanding, procedural fluency, and productive dispositions toward the work at hand. The practice standards are written to address the needs of the student with respect to being successful in mathematics.
These standards are most readily developed in the solving of high-level mathematical tasks. High-
level tasks demand a greater level of cognitive effort to solve than routine practice problems do. Such tasks require one to make sense of the problem and work at solving it. Often a student must reason abstractly and quantitatively as he or she constructs an approach. The student must be able to argue his or her point as well as critique the reasoning of others with respect to the task. These tasks are rich enough to support various entry points for finding solutions. To develop the processes and proficiencies addressed in the practice standards, students must be engaged in rich, high-level mathematical tasks that support the approaches, practices, and habits of mind which are called for within these standards.
The following are the eight standards for mathematical practice:
Standards for Mathematical Practice
1. Make sense of problems and persevere in solving them.
2. Reason abstractly and quantitatively.
3. Construct viable arguments and critique the reasoning of others.
4. Model with mathematics.
5. Use appropriate tools strategically.
6. Attend to precision.
7. Look for and make use of structure.
8. Look for and express regularity in repeated reasoning.
A full description of each of these standards follows.

9 Revised February 5, 2021
MP1: Make sense of problems and persevere in solving them.
Mathematically proficient students start by explaining to themselves the meaning of a problem and looking for entry points to its solution. They analyze givens, constraints, relationships, and goals. They make conjectures about the form and meaning of the solution and plan a solution pathway rather than simply jumping into a solution attempt. They consider analogous problems and try special cases and simpler forms of the original problem in order to gain insight into its solution. They monitor and evaluate their progress and change course if necessary. Older students might, depending on the context of the problem, transform algebraic expressions or change the viewing window on their graphing calculator to get the information they need. Mathematically proficient students can explain correspondences between equations, verbal descriptions, tables, and graphs or draw diagrams of important features and relationships, graph data, and search for regularity or trends. Younger students might rely on using concrete objects or pictures to help conceptualize and solve a problem. Mathematically proficient students check their answers to problems using a different method, and they continually ask themselves, "Does this make sense?" They can understand the approaches of others to solving complex problems and identify correspondences between different approaches.
MP2: Reason abstractly and quantitatively.
Mathematically proficient students make sense of quantities and their relationships in problem situations. They bring two complementary abilities to bear on problems involving quantitative relationships: the ability to decontextualize—to abstract a given situation and represent it symbolically and manipulate the representing symbols as if they have a life of their own, without necessarily attending to their referents—and the ability to contextualize, to pause as needed during the manipulation process in order to probe into the referents for the symbols involved. Quantitative reasoning entails habits of creating a coherent representation of the problem at hand, considering the units involved, attending to the meaning of quantities, not just how to compute them, and knowing and flexibly using different properties of operations and objects.
MP3: Construct viable arguments and critique the reasoning of others.
Mathematically proficient students understand and use stated assumptions, definitions, and previously established results in constructing arguments. They make conjectures and build a logical progression of statements to explore the truth of their conjectures. They are able to analyze situations by breaking them into cases and can recognize and use counterexamples. They justify their conclusions, communicate them to others, and respond to the arguments of others. They reason inductively about data, making plausible arguments that take into account the context from which the data arose.
Mathematically proficient students are also able to compare the effectiveness of two plausible
arguments, distinguish correct logic or reasoning from that which is flawed, and, if there is a flaw in an argument, explain what it is. Elementary students can construct arguments using concrete referents such as objects, drawings, diagrams, and actions. Such arguments can make sense and be correct, even though they are not generalized or made formal until later grades. Later, students learn to determine domains to which an argument applies. Students at all grades can listen or read the arguments of others, decide whether they make sense, and ask useful questions to clarify or improve the arguments.

10 Revised February 5, 2021
MP4: Model with mathematics.
Mathematically proficient students can apply the mathematics they know to solve problems arising in everyday life, society, and the workplace. In early grades, this might be as simple as writing an addition equation to describe a situation. In middle grades, a student might apply proportional reasoning to plan a school event or analyze a problem in the community. By high school, a student might use geometry to solve a design problem or use a function to describe how one quantity of interest depends on another.
Mathematically proficient students who can apply what they know are comfortable making
assumptions and approximations to simplify a complicated situation, realizing that these may need revision later. They are able to identify important quantities in a practical situation and map their relationships using such tools as diagrams, two-way tables, graphs, flowcharts, and formulas. They can analyze those relationships mathematically to draw conclusions. They routinely interpret their mathematical results in the context of the situation and reflect on whether the results make sense, possibly improving the model if it has not served its purpose.
MP5: Use appropriate tools strategically.
Mathematically proficient students consider the available tools when solving a mathematical problem. These tools might include pencil and paper, concrete models, a ruler, a compass, a protractor, a calculator, a spreadsheet, a computer algebra system, a statistical package, or dynamic geometry software. Proficient students are sufficiently familiar with tools appropriate for their grade or course to make sound decisions about when each of these tools might be helpful, recognizing both the insight to be gained and their limitations. For example, mathematically proficient high school students analyze graphs of functions and solutions generated using a graphing calculator. They detect possible errors by strategically using estimation and other mathematical knowledge. When making mathematical models, they know that technology can enable them to visualize the results of varying assumptions, explore consequences, and compare predictions with data. Mathematically proficient students at various grade levels are able to identify relevant external mathematical resources, such as digital content located on a website, and use them to pose or solve problems. They are able to use technological tools to explore and deepen their understanding of concepts.
MP6: Attend to precision.
Mathematically proficient students try to communicate precisely to others. They try to use clear definitions in discussion with others and in their own reasoning. They state the meaning of the symbols they choose, including using the equal sign consistently and appropriately. They are careful about specifying units of measure and labeling axes to clarify the correspondence with quantities in a problem. They calculate accurately and efficiently, expressing numerical answers with a degree of precision appropriate for the problem context. In the elementary grades, students give carefully formulated explanations to each other. By the time they reach high school, they have learned to examine claims and make explicit use of definitions.

11 Revised February 5, 2021
MP7: Look for and make use of structure.
Mathematically proficient students look closely to discern a pattern or structure. Young students, for example, might notice that three and seven more is the same amount as seven and three more, or they may sort a collection of shapes according to how many sides the shapes have. Later, students see 7 × 8 equals the well-remembered 7 × 5 + 7 × 3, in preparation for learning about the distributive property. In the expression x2 + 9x + 14, older students can see the 14 as 2 × 7 and the 9 as 2 + 7. They recognize the significance of an existing line in a geometric figure and can use the strategy of drawing an auxiliary line for solving problems. They also can step back for an overview and shift perspective. They can see complicated things, such as some algebraic expressions, as single objects or as being composed of several objects. For example, they can see 5 - 3(x - y)2 as 5 minus a positive number times a square and use that to realize that its value cannot be more than 5 for any real numbers x and y.
MP8: Look for and express regularity in repeated reasoning.
Mathematically proficient students notice if calculations are repeated and look both for general methods and for shortcuts. Upper elementary students might notice when dividing 25 by 11 that they are repeating the same calculations over and over again, and conclude they have a repeating decimal. By paying attention to the calculation of slope as they repeatedly check whether points are on the line through (1, 2) with slope 3, middle school students might abstract the equation (y - 2)/(x - 1) = 3. Noticing the regularity in the way terms cancel when expanding (x - 1)(x + 1), (x - 1)(x2 + x + 1), and (x - 1)(x3 + x2 + x + 1) might lead them to the general formula for the sum of a geometric series. As they work to solve a problem, mathematically proficient students maintain oversight of the process, while attending to the details. They continually evaluate the reasonableness of their intermediate results.
Literacy Skills for Mathematical Proficiency
Communication in mathematics employs literacy skills in reading, vocabulary, speaking and listening, and writing. Mathematically proficient students communicate using precise terminology and multiple representations including graphs, tables, charts, and diagrams. By describing and contextualizing mathematics, students create arguments and support conclusions. They evaluate and critique the reasoning of others and analyze and reflect on their own thought processes. Mathematically proficient students have the capacity to engage fully with mathematics in context by posing questions, choosing appropriate problem-solving approaches, and justifying solutions.
Literacy Skills for Mathematical Proficiency
1. Use multiple reading strategies.
2. Understand and use correct mathematical vocabulary.
3. Discuss and articulate mathematical ideas.
4. Write mathematical arguments.

12 Revised February 5, 2021
Reading
Reading in mathematics is different from reading literature. Mathematics contains expository text along with precise definitions, theorems, examples, graphs, tables, charts, diagrams, and exercises. Students are expected to recognize multiple representations of information, use mathematics in context, and draw conclusions from the information presented. In the early grades, non-readers and struggling readers benefit from the use of multiple representations and contexts to develop mathematical connections, processes, and procedures. As students’ literacy skills progress, their skills in mathematics develop so that by high school, students are using multiple reading strategies, analyzing context-based problems to develop understanding and comprehension, interpreting and using multiple representations, and fully engaging with mathematics textbooks and other mathematics-based materials. These skills support Mathematical Practices 1 and 2.
Vocabulary
Understanding and using mathematical vocabulary correctly is essential to mathematical proficiency. Mathematically proficient students use precise mathematical vocabulary to express ideas. In all grades, separating mathematical vocabulary from everyday use of words is important for developing an understanding of mathematical concepts. For example, a “table” in everyday use means a piece of furniture, while in mathematics, a “table” is a way of organizing and presenting information. Mathematically proficient students are able to parse a mathematical term, definition, or theorem, provide examples and counterexamples, and use precise mathematical vocabulary in reading, speaking, and writing arguments and explanations. These skills support Mathematical Practice 6.
Speaking and Listening
Mathematically proficient students can listen critically, discuss, and articulate their mathematical ideas clearly to others. As students’ mathematical abilities mature, they move from communicating through reiterating others’ ideas to paraphrasing, summarizing, and drawing their own conclusions. A mathematically proficient student uses appropriate mathematics vocabulary in verbal discussions, listens to mathematical arguments, and dissects an argument to recognize flaws or determine validity. These skills support Mathematical Practice 3.
Writing
Mathematically proficient students write mathematical arguments to support and refute conclusions and cite evidence for these conclusions. Throughout all grades, students write reflectively to compare and contrast problem-solving approaches, evaluate mathematical processes, and analyze their thinking and decision-making processes to improve their mathematical strategies. These skills support Mathematical Practices 2, 3, and 4.

13 Revised February 5, 2021
Mathematics | Grade K
The descriptions below provide an overview of the mathematical concepts and skills that students explore throughout Kindergarten.
Counting and Cardinality
Students use numbers, including written numerals and counting, to develop concepts about quantity. Students use numbers to solve contextual problems and represent quantities, such as counting objects in a set, counting out a given number of objects, and comparing sets or numerals. Students use effective strategies for counting and answering quantitative questions, including quickly recognizing the cardinalities of small sets of objects and learning about counting sequences.
Operations and Algebraic Thinking
Students develop an understanding of addition and subtraction and determine when to add or subtract in a given context. Students should solve a variety of problem types in order to make connections among contexts, equations, and strategies (See Table 1 - Addition and Subtraction Situations). Students choose from multiple representations (including using objects, fingers, mental images, drawings, sounds, acting out situations, verbal explanations, expressions, or equations) when solving addition and subtraction problems within 10. Students compose and decompose quantities within 10 in various ways, and use mental strategies flexibly to develop fluency in addition and subtraction within 10.
Number and Operations in Base Ten
Students understand that numbers from 11 to 19 represent ten ones and some more ones by using objects or drawings, and record each composition or decomposition by a drawing and/or write an equation to represent this relationship.
Measurement and Data
Students describe and sort objects in many different ways. This includes length, weight, and coins. They classify objects in categories and compare measurable attributes. Students begin to learn to graph and analyze collections of objects. Students learn to identify the penny, nickel, dime, and quarter and know the value of each.
Geometry
Students describe their physical world using geometric ideas, vocabulary, and positional words. Regardless of orientation, students name two-dimensional shapes and three-dimensional solids, compare shapes/solids, and combine shapes/solids to create new shapes/solids. Students will recognize, describe, extend, and create patterns and explain patterning rules and the structure of patterns.

14 Revised February 5, 2021
Standards for Mathematical Practice
Being successful in mathematics requires the development of approaches, practices, and habits of mind that need to be in place as one strives to develop mathematical fluency, procedural skills, and conceptual understanding. The Standards for Mathematical Practice are meant to address these areas of expertise that teachers should seek to develop in their students. These approaches, practices, and habits of mind can be summarized as “processes and proficiencies” that successful mathematicians have as a part of their work in mathematics. Additional explanations are included in the main introduction of these standards.
Standards for Mathematical Practice
1. Make sense of problems and persevere in solving them. 2. Reason abstractly and quantitatively. 3. Construct viable arguments and critique the reasoning of others. 4. Model with mathematics. 5. Use appropriate tools strategically. 6. Attend to precision. 7. Look for and make use of structure. 8. Look for and express regularity in repeated reasoning.
Literacy Standards for Mathematics
Communication in mathematics employs literacy skills in reading, vocabulary, speaking and listening, and writing. Mathematically proficient students communicate using precise terminology and multiple representations including graphs, tables, charts, and diagrams. By describing and contextualizing mathematics, students create arguments and support conclusions. They evaluate and critique the reasoning of others, analyze, and reflect on their own thought processes. Mathematically proficient students have the capacity to engage fully with mathematics in context by posing questions, choosing appropriate problem-solving approaches, and justifying solutions. Further explanations are included in the main introduction.
Literacy Skills for Mathematical Proficiency
1. Use multiple reading strategies. 2. Understand and use correct mathematical vocabulary. 3. Discuss and articulate mathematical ideas. 4. Write mathematical arguments.
15 Revised February 5, 2021
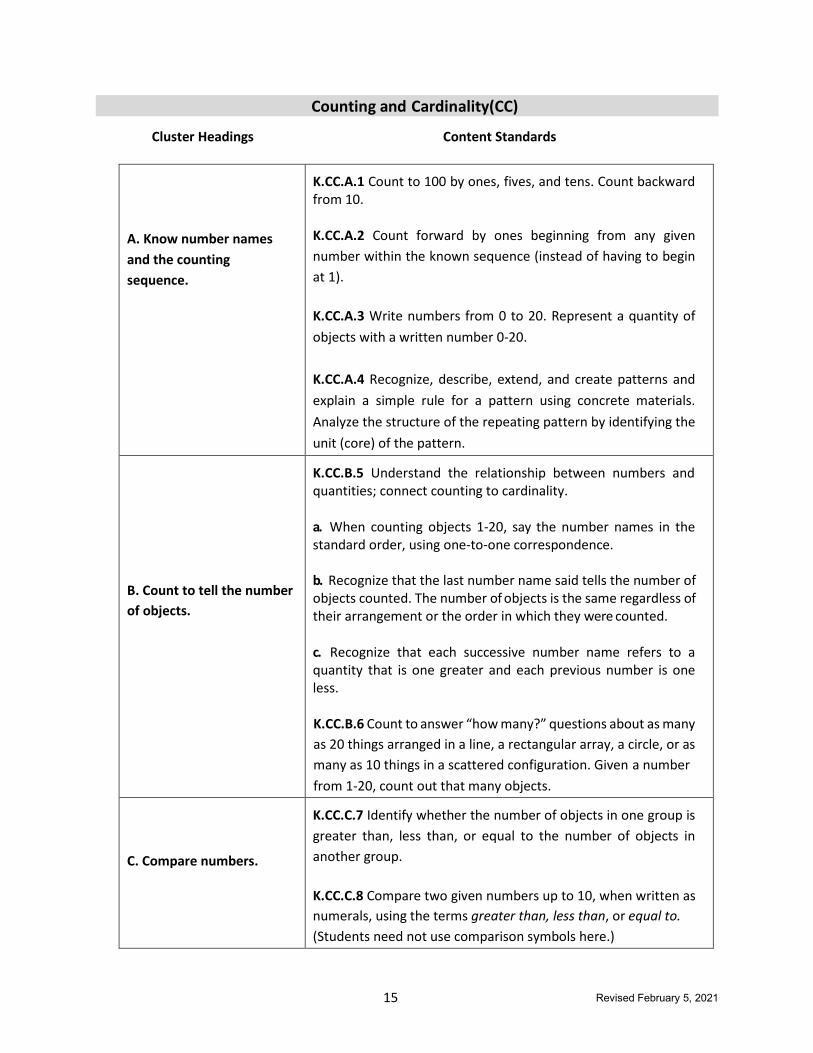
Counting and Cardinality(CC)
Cluster Headings Content Standards
A. Know number names and the counting sequence.
K.CC.A.1 Count to 100 by ones, fives, and tens. Count backward from 10.
K.CC.A.2 Count forward by ones beginning from any given number within the known sequence (instead of having to begin at 1).
K.CC.A.3 Write numbers from 0 to 20. Represent a quantity of objects with a written number 0-20.
K.CC.A.4 Recognize, describe, extend, and create patterns and explain a simple rule for a pattern using concrete materials. Analyze the structure of the repeating pattern by identifying the unit (core) of the pattern.
B. Count to tell the number of objects.
K.CC.B.5 Understand the relationship between numbers and quantities; connect counting to cardinality.
a. When counting objects 1-20, say the number names in the standard order, using one-to-one correspondence.
b. Recognize that the last number name said tells the number of objects counted. The number of objects is the same regardless of their arrangement or the order in which they were counted.
c. Recognize that each successive number name refers to a quantity that is one greater and each previous number is one less.
K.CC.B.6 Count to answer “how many?” questions about as many as 20 things arranged in a line, a rectangular array, a circle, or as many as 10 things in a scattered configuration. Given a number from 1-20, count out that many objects.
C. Compare numbers.
K.CC.C.7 Identify whether the number of objects in one group is greater than, less than, or equal to the number of objects in another group.
K.CC.C.8 Compare two given numbers up to 10, when written as numerals, using the terms greater than, less than, or equal to. (Students need not use comparison symbols here.)

16 Revised February 5, 2021
Operations and Algebraic Thinking (OA)
Cluster Headings Content Standards
A. Represent and solve problems involving addition and subtraction. (See Table 1 - Addition and Subtraction Situations)
K.OA.A.1 Represent addition and subtraction with objects, fingers, drawings, acting out situations, verbal explanations, expressions, or equations.
K.OA.A.2 Add and subtract within 10 to solve contextual problems with result/total unknown involving situations of add to, take from, and put together/take apart. Use objects, drawings, or equations to represent the problem.
K.OA.A.3 Decompose numbers less than or equal to 10 into addend pairs in more than one way (e.g., 5 = 2 + 3 and 5 = 4 + 1) by using objects or drawings. Record each decomposition using a drawing or writing an equation.
K.OA.A.4 Find the number that makes 10, when added to any given number, from 1 to 9 using objects or drawings. Record the answer using a drawing or writing an equation.
K.OA.A.5 Use mental strategies flexibly to develop fluency in addition and subtraction within 10.
Number and Operations in Base Ten (NBT)
Cluster Headings Content Standards
A. Work with numbers 11– 19 to gain foundations for place value.
K.NBT.A.1 Compose and decompose numbers from 11 to 19 into a group of ten ones and some more ones by using objects or drawings (e.g., 18 equals 10 + 8). Record the composition or decomposition using a drawing or by writing an equation.

17 Revised February 5, 2021
Measurement and Data (MD)
Cluster Headings Content Standards
A. Describe and compare measurable attributes.
K.MD.A.1 Describe the measurable attributes of an object, such as length (long/short), height (tall/short), or weight (heavy/light).
K.MD.A.2 Directly compare two objects with a measurable attribute in common, to describe which object has more of/less of the attribute. For example, directly compare the heights of two children and describe one child as taller/shorter.
B. Work with money.
K.MD.B.3 Identify the penny, nickel, dime, and quarter based on their attributes (size and color) and recognize the value of each.
C. Classify objects and count the number of objects in each category.
K.MD.C.4 Sort a collection of objects into a given category, with 10 or fewer in each category. Compare the categories by group size.
Geometry (G)
Cluster Headings Content Standards
A. Identify and describe shapes and solids.
K.G.A.1 Describe objects in the environment using names of shapes and solids (squares, circles, triangles, rectangles, hexagons, cubes, cones, cylinders, and spheres). Describe the relative positions of these objects using terms such as above, below, beside, in front of, behind, between, and next to.
K.G.A.2 Correctly name shapes and solids (squares, circles, triangles, rectangles, hexagons, cubes, cones, cylinders, and spheres) regardless of their orientations or overall size.
K.G.A.3 Identify shapes (squares, circles, triangles, rectangles, and hexagons) as two-dimensional and solids (cubes, cones, cylinders, and spheres) as three-dimensional.
18 Revised February 5, 2021
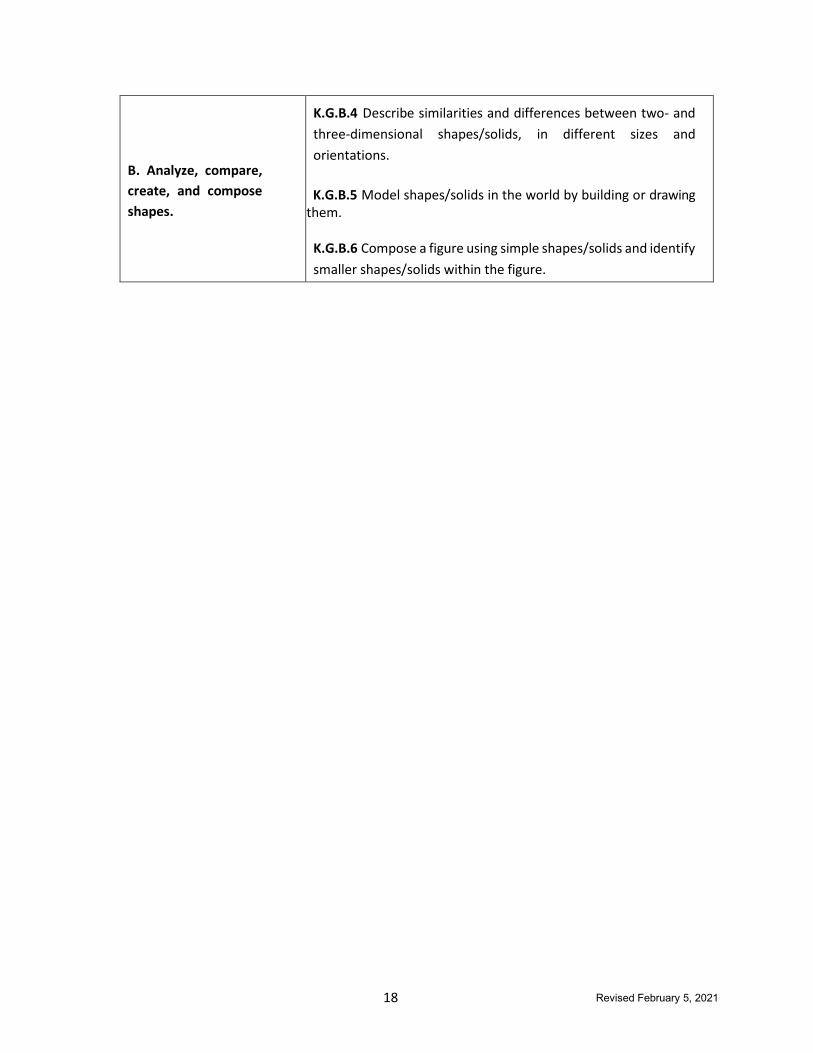
B. Analyze, compare, create, and compose shapes.
K.G.B.4 Describe similarities and differences between two- and three-dimensional shapes/solids, in different sizes and orientations.
K.G.B.5 Model shapes/solids in the world by building or drawing
them.
K.G.B.6 Compose a figure using simple shapes/solids and identify smaller shapes/solids within the figure.

19 Revised February 5, 2021

20 Revised February 5, 2021
Mathematics | Grade 1
The descriptions below provide an overview of the mathematical concepts and skills that students explore throughout the 1st grade.
Operations and Algebraic Thinking
Students extend previous understanding of addition and subtraction to solve contextual problems within 20, add three addends, and recognize subtraction as an unknown addend problem. Students solve a variety of problem types, with unknowns in all positions, in order to make connections among contexts, equations, and strategies (See Table 1 - Addition and Subtraction Situations). Students should apply properties of operations as strategies to add and subtract when needed (See Table 3 - Properties of Operations). By the end of 1st grade, students should know from memory sums of 10 and fluently add and subtract within 20.
Students demonstrate their understanding of the equal sign (=) by determining if addition/subtraction equations are true or false and writing equations to represent a given situation.
Numbers and Operations in Base Ten
Students read, write, and represent a given number of objects numerically and extend the counting sequence to 120. They demonstrate the ability to count from any number up to 120, count by twos and fives from a multiple of that number, and count backward from 20. In addition, students recognize, describe, extend, and create patterns when counting by ones, twos, and fives. Students understand that two-digit numbers represent groups of tens and ones and each two-digit number can be composed and decomposed in a variety of ways. Using place value understanding, students compare two- digit numbers based on the number of tens and ones represented in the given numbers using symbols for comparison.
Students build number sense and use increasingly sophisticated strategies based on place value
and properties of operations to add and subtract.
Measurement and Data
This is the first time students develop an understanding of the meaning and processes of measurement including iteration of non-standard equal-sized units. Students compare two objects using a third object as a benchmark and also order objects by length. Students are introduced to writing and telling time to the nearest hour and half-hour. Students build on their previous work in kindergarten and count the value of like coins using the ¢ symbol. Students interpret data to answer questions such as how many more or less.

21 Revised February 5, 2021
Geometry
Students build on previous knowledge to explore attributes of shapes and to build, draw, and identify two-dimensional shapes. Two-dimensional shapes and three-dimensional solids are used to create composite shapes/solids. This is the first time students partition circles and rectangles to create halves and fourths/quarters.
Standards for Mathematical Practice
Being successful in mathematics requires the development of approaches, practices, and habits
of mind that need to be in place as one strives to develop mathematical fluency, procedural skills, and conceptual understanding. The Standards for Mathematical Practice are meant to address these areas of expertise that teachers should seek to develop in their students. These approaches, practices, and habits of 6mind can be sutr5mmarized as “processes and proficiencies” that successful mathematicians have as a part of their work in mathematics. Additional explanations are included in the main introduction of these standards.
Standards for Mathematical Practice
1. Make sense of problems and persevere in solving them. 2. Reason abstractly and quantitatively. 3. Construct viable arguments and critique the reasoning of others. 4. Model with mathematics. 5. Use appropriate tools strategically. 6. Attend to precision. 7. Look for and make use of structure. 8. Look for and express regularity in repeated reasoning.
. Literacy Standards for Mathematics
Communication in mathematics employs literacy skills in reading, vocabulary, speaking and
listening, and writing. Mathematically proficient students communicate using precise terminology and multiple representations including graphs, tables, charts, and diagrams. By describing and contextualizing mathematics, students create arguments and support conclusions. They evaluate and critique the reasoning of others, analyze, and reflect on their own thought processes. Mathematically proficient students have the capacity to engage fully with mathematics in context by posing questions, choosing appropriate problem-solving approaches, and justifying solutions. Further explanations are included in the main introduction.
Literacy Skills for Mathematical Proficiency
1. Use multiple reading strategies. 2. Understand and use correct mathematical vocabulary. 3. Discuss and articulate mathematical ideas. 4. Write mathematical arguments.

22 Revised February 5, 2021
Operations and Algebraic Thinking (OA)
Cluster Headings Content Standards
A. Represent and solve problems involving addition and subtraction.
1.OA.A.1 Add and subtract within 20 to solve contextual problems, with unknowns in all positions, involving situations of add to, take from, put together/take apart, and compare. Use objects, drawings, and equations with a symbol for the unknown number to represent the problem. NOTE: While start unknown situations may be introduced in first grade, they are not expected to be mastered until second grade. (See Table 1- Addition and Subtraction Situations)
1.OA.A.2 Add three whole numbers whose sum is within 20 to solve contextual problems using objects, drawings, and equations with a symbol for the unknown number to represent the problem.
B. -
1.OA.B.3 Apply properties of operations (additive identity, commutative, and associative) as strategies to add and subtract. (Students need not use formal terms for these properties.) (See Table 3-Properties of Operations)
1.OA.B.4 Understand the relationship between addition and subtraction by representing subtraction as an unknown-addend problem. For example, to solve 10 – 8 = , a student can use 8 + = 10. (See Table 3-Properties of Operations)
C. Add and subtract within 20.
1.OA.C.5 Add and subtract within 20 using strategies such as counting on, counting back, making 10, related known facts, and composing/decomposing numbers with an emphasis on making ten (e.g., 13 – 4 = 13 – 3 – 1 = 10 – 1 = 9 or adding 6 + 7 by creating the known equivalent 6 + 4 + 3 = 10 + 3 = 13 OR 6 + 6 + 1 = 12 + 1).
1.OA.C.6 Use mental strategies flexibly and efficiently to develop fluency in addition and subtraction within 20. By the end of grade 1, know all sums and differences up to 10.
D. Work with addition and sub\traction equations.
1.OA.D.7 Understand the meaning of the equal sign (e.g., 6 = 6; 5 + 2 = 4 + 3; 7 = 8 – 1). Determine if equations involving addition and subtraction are true or false.
1.OA.CD.8 Determine the unknown whole number in an addition or subtraction equation with sums/differences within 20, with the unknown in any position (e.g., 8 + ? = 11, 5 = ? – 3, 6 + 6 = ?). (See Table 3-Properties of Operations)
23 Revised February 5, 2021
Number and Operations in Base Ten (NBT)
Cluster Headings Content Standards
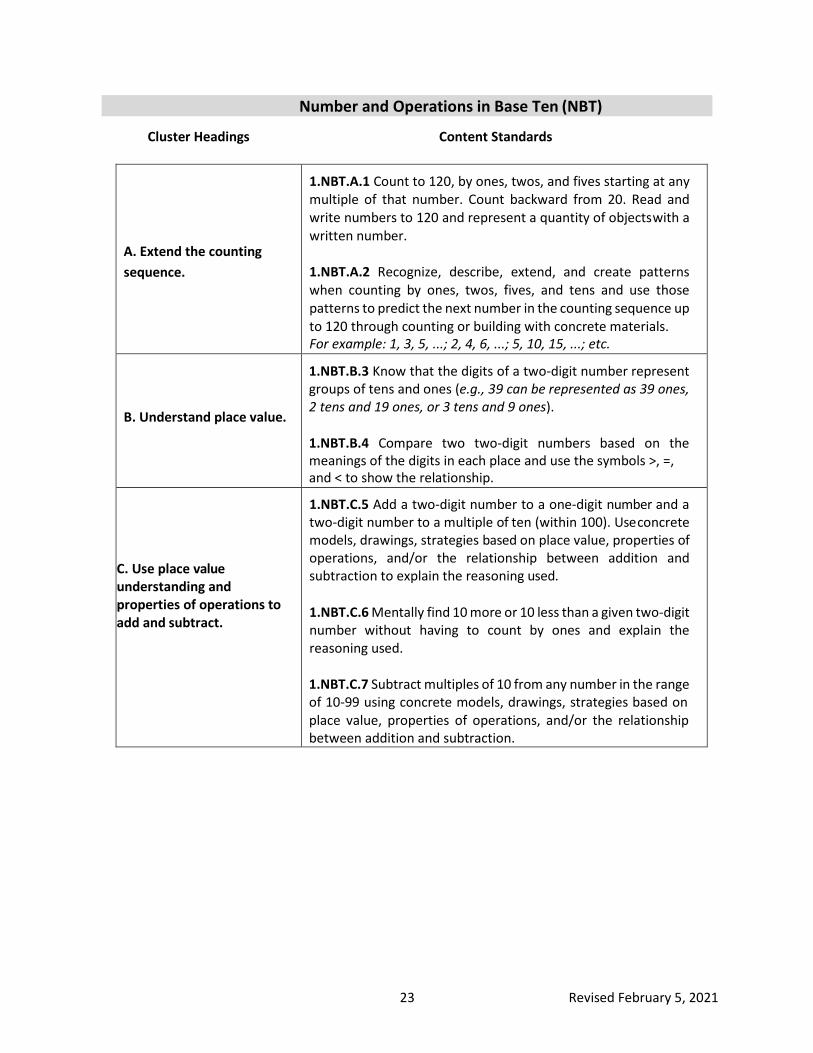
A. Extend the counting sequence.
1.NBT.A.1 Count to 120, by ones, twos, and fives starting at any multiple of that number. Count backward from 20. Read and write numbers to 120 and represent a quantity of objects with a written number.
1.NBT.A.2 Recognize, describe, extend, and create patterns when counting by ones, twos, fives, and tens and use those patterns to predict the next number in the counting sequence up to 120 through counting or building with concrete materials. For example: 1, 3, 5, ...; 2, 4, 6, ...; 5, 10, 15, ...; etc.
B. Understand place value.
1.NBT.B.3 Know that the digits of a two-digit number represent groups of tens and ones (e.g., 39 can be represented as 39 ones, 2 tens and 19 ones, or 3 tens and 9 ones).
1.NBT.B.4 Compare two two-digit numbers based on the meanings of the digits in each place and use the symbols >, =, and < to show the relationship.
C. Use place value understanding and properties of operations to add and subtract.
1.NBT.C.5 Add a two-digit number to a one-digit number and a two-digit number to a multiple of ten (within 100). Use concrete models, drawings, strategies based on place value, properties of operations, and/or the relationship between addition and subtraction to explain the reasoning used.
1.NBT.C.6 Mentally find 10 more or 10 less than a given two-digit number without having to count by ones and explain the reasoning used.
1.NBT.C.7 Subtract multiples of 10 from any number in the range of 10-99 using concrete models, drawings, strategies based on place value, properties of operations, and/or the relationship between addition and subtraction.

24 Revised February 5, 2021
Measurement and Data (MD)
Cluster Headings Content Standards
A. Measure lengths indirectly and by iterating length units.
1.MD.A.1 Order three objects by length. Compare the lengths of two objects indirectly by using a third object. For example, to compare indirectly the heights of Bill and Susan: if Bill is taller than mother and mother is taller than Susan, then Bill is taller than Susan.
1.MD.A.2 Measure the length of an object using non-standard units (paper clips, cubes, etc.) and express this length as a whole number of units.
B. Work with time and money.
1.MD.B.3 Recognize a clock as a measurement tool. Tell and write time in hours and half-hours using analog and digital clocks.
1.MD.B.4 Count the value of a set of like coins less than one dollar using the ¢ symbol only.
C. Represent and interpret data.
1.MD.C.5 Organize, represent, and interpret data with up to three categories using pictographs, bar graphs, and tally charts. Ask and answer questions about the total number of data points, how many in each category, and how many more or less are in one category than in another.
Geometry (G)
Cluster Headings Content Standards
A. Reason about shapes/solids and their attributes.
1.G.A.1 Distinguish between attributes that define a shape (e.g., number of sides and vertices) versus attributes that do not define the shape (e.g., color, orientation, overall size); build and draw two-dimensional shapes to possess defining attributes.
1.G.A.2 Create a composite figure and use the composite figure to make new figures by using two-dimensional shapes (rectangles, squares, hexagons, trapezoids, triangles, half- circles, and quarter-circles) or three-dimensional solids (cubes, spheres, rectangular prisms, cones, and cylinders).
1.G.A.3 Partition circles and rectangles into two and four equal shares, describe the shares using the words halves, fourths, and quarters, and use the phrases half of, fourth of, and quarter of. Describe the whole as two of, or four of, the shares. Understand for these examples that partitioning into more equal shares creates smaller shares.

25 Revised February 5, 2021

26 Revised February 5, 2021

27 Revised February 5, 2021
Mathematics | Grade 2
The descriptions below provide an overview of the mathematical concepts and skills that students explore throughout the 2nd grade.
Operations & Algebraic Thinking
Students solve one- and two-step addition and subtraction contextual problems within 100 with an unknown in any position. Students should solve a variety of problem types in order to make connections among contexts, equations, and strategies (See Table 1 - Addition and Subtraction Situations). Students also represent these problems with objects, drawings, and/or equations.
Students build upon previously taught strategies to mentally add and subtract within 30. Students
should know from memory all sums of two one-digit numbers and related subtraction facts.
Numbers & Operations in Base Ten
Students extend their understanding of the base-ten place value system to 1,000. This includes counting by ones, fives, tens, and hundreds. Students write numbers using standard form, word form, and expanded form. They deepen their understanding of different ways a number can be composed and decomposed. Students extend their understanding of place value, properties of operations, and the relationship between addition and subtraction to add and subtract within 1,000 and fluently add and subtract within 100 (See Table 3 - Properties of Operations). They add up to four two-digit numbers. They should also be able to explain why these strategies work. Students mentally add and subtract 10 or 100 to/from with a sum/difference within 1,000.
Measurement & Data
In previous grades, students measured with non-standard units. Students in 2nd grade measure with whole number standard units (centimeter and inch), and they use rulers and other measurement tools with the understanding that linear measure involves an iteration of units. They recognize that the smaller the unit, the more iterations they need to cover a given length. Students use addition and subtraction to solve contextual problems with unknowns in all positions involving lengths in the same units and represent lengths on a number line. Students expand their understanding of telling time to tell and write time in quarter hours and to the nearest 5 minutes using analog and digital clocks. Students create and use bar graphs and pictographs with up to four categories to answer addition and subtraction problems. Students are first introduced to line plots in second grade with whole number units and a given set of data. Students build on their previous work of counting the value of like coins to solving contextual problems less than one dollar involving a mixed set of coins using the ¢ symbol appropriately as well as solving contextual problems involving whole number dollar amounts up to $100 using the $ symbol appropriately. (Decimal addition and subtraction is not introduced until 4th grade.)

28 Revised February 5, 2021
Geometry
Students describe and analyze shapes by examining their sides and angles. Students recognize and draw shapes based on given attributes, such as draw a shape with 3 vertices. Students also are able to partition circles and rectangles into two, three, and four equal shares and rectangles into rows and columns, laying the foundation for fractions and area.
Standards for Mathematical Practice
Being successful in mathematics requires the development of approaches, practices, and habits
of mind that need to be in place as one strives to develop mathematical fluency, procedural skills, and conceptual understanding. The Standards for Mathematical Practice are meant to address these areas of expertise that teachers should seek to develop in their students. These approaches, practices, and habits of mind can be summarized as “processes and proficiencies” that successful mathematicians have as a part of their work in mathematics. Additional explanations are included in the main introduction of these standards.
Standards for Mathematical Practice
1. Make sense of problems and persevere in solving them. 2. Reason abstractly and quantitatively. 3. Construct viable arguments and critique the reasoning of others. 4. Model with mathematics. 5. Use appropriate tools strategically. 6. Attend to precision. 7. Look for and make use of structure. 8. Look for and express regularity in repeated reasoning.
Literacy Standards for Mathematics
Communication in mathematics employs literacy skills in reading, vocabulary, speaking and
listening, and writing. Mathematically proficient students communicate using precise terminology and multiple representations including graphs, tables, charts, and diagrams. By describing and contextualizing mathematics, students create arguments and support conclusions. They evaluate and critique the reasoning of others, analyze, and reflect on their own thought processes. Mathematically proficient students have the capacity to engage fully with mathematics in context by posing questions, choosing appropriate problem-solving approaches, and justifying solutions. Further explanations are included in the main introduction.
Literacy Skills for Mathematical Proficiency
1. Use multiple reading strategies. 2. Understand and use correct mathematical vocabulary. 3. Discuss and articulate mathematical ideas. 4. Write mathematical arguments.

29 Revised February 5, 2021
Operations and Algebraic Thinking (OA)
Cluster Headings Content Standards
A. Represent and solve problems involving addition and subtraction.
2.OA.A.1 Add and subtract within 100 to solve one- and two-step contextual problems, with unknowns in all positions, involving situations of add to, take from, put together/take apart, and compare. Use objects, drawings, and equations with a symbol for the unknown number to represent the problem. (See Table 1 - Addition and Subtraction Situations)
B. Add and subtract within 30.
2.OA.B.2 Fluently add and subtract within 30 using mental strategies. By the end of 2nd grade, know all sums of two one- digit numbers and related subtraction facts.
C. Work with equal groups of objects to gain foundations for multiplication.
2.OA.C.3 Determine whether a group of objects (up to 20) has an odd or even number of members by pairing objects or counting them by 2s. Write an equation to express an even number as a sum of two equal addends.
2.OA.C.4 Use repeated addition to find the total number of objects arranged in rectangular arrays with up to 5 rows and up to 5 columns; write an equation to express the total as a sum of equal addends. For example, a 3 by 4 array can be expressed as 3 + 3 + 3 + 3 = 12 or 4 + 4 + 4 = 12.
D. Solve problems involving addition and subtraction and identify and explain patterns in arithmetic.
2.OA.D.1 Identify arithmetic patterns in an addition or hundreds chart and explain them using properties of operations. For example, analyze patterns in the addition chart and observe an alternating pattern of even and odd numbers (because each time we move to the right one box or down one box, we are adding one more to our sum: (2 + 3) + 1 = 2 + (3 + 1)= 2 + 4 which uses the associative property of addition). (See Table 3 - Properties of Operations)

30 Revised February 5, 2021
Number and Operations in Base Ten (NBT)
Cluster Headings Content Standards
operations and strategies based on place value.
number within 1000.
A. Understand place value.
2.NBT.A.1 Know that the three digits of a three-digit number represent amounts of hundreds, tens, and ones (e.g., 706 can be represented in multiple ways as 7 hundreds, 0 tens, and 6 ones; 706 ones; or 70 tens and 6 ones).
2.NBT.A.2 Recognize, describe, extend, and create patterns when counting by ones, twos, fives, tens, and hundreds and use those patterns to predict the next number in the counting sequence up to 1000 through counting. For example: 111, 113, 115, ...; 82, 84, 86, ...; 370, 380, 390 ; 100, 200, 300,…; etc.
2.NBT.A.3 Read and write numbers to 1000 using standard form, word form, and expanded form. For example, write 234 as 200 + 30 + 4.
2.NBT.A.4 Compare two three-digit numbers based on the meanings of the digits in each place and use the symbols >, =, and < to show the relationship.
B. Use place value under- standing and properties of operations to add and subtract. (See Table 3 - Properties of Operations)
2.NBT.B.5 Fluently add and subtract within 100 using properties of operations, strategies based on place value, and/or the relationship between addition and subtraction.
2.NBT.B.6 Add up to four two-digit numbers using properties of
2.NBT.B.7 Add and subtract within 1000 using concrete models, drawings, strategies based on place value, properties of operations, and/or the relationship between addition and subtraction to explain the reasoning used. (Explanations may include words, drawing, or objects.)
2.NBT.B.8 Mentally add or subtract 10 or 100 to/from any given

31 Revised February 5, 2021
Measurement and Data (MD)
Cluster Headings Content Standards
A. Measure and estimate lengths in standard units.
2.MD.A.1 Measure the length of an object in whole number units by selecting and using appropriate tools such as rulers, yardsticks, meter sticks, and measuring tapes.
2.MD.A.2 Measure the length of an object using two different whole number units of measure and describe how the two measurements relate to the size of the unit chosen.
2.MD.A.3 Estimate lengths using whole number units of inches, feet, yards, centimeters, and meters.
2.MD.A.4 Measure, using whole number lengths, to determine how much longer one object is than another and express the difference in terms of a standard unit of length.
B. Relate addition and subtraction to length.
2.MD.B.5 Add and subtract within 100 to solve contextual problems, with the unknown in any position, involving lengths that are given in the same units by using drawings and equations with a symbol for the unknown to represent the problem. (See Table 1 - Addition and Subtraction Situations)
2.MD.B.6 Represent whole numbers as lengths from 0 on a number line and know that the points corresponding to the numbers on the number line are equally spaced. Use a number line to represent whole number sums and differences of lengths within 100.
C. Work with time and money.
2.MD.C.7 Tell and write time in quarter hours and to the nearest five minutes (in a.m. and p.m.) using analog and digital clocks.
2.MD.C.8 Solve contextual problems involving amounts less than one dollar including quarters, dimes, nickels, and pennies using the ¢ symbol appropriately. Solve contextual problems involving whole number dollar amounts up to $100 using the $ symbol appropriately.
D. Represent and interpret data.
2.MD.D.9 Given a set of data, create a line plot, where the horizontal scale is marked off in whole-number units.
2.MD.D.10 Draw a pictograph (with a key of values of 1, 2, 5, or 10) and a bar graph (with intervals of one) to represent a data set with up to four categories. Solve addition and subtraction problems related to the data in a graph.

32 Revised February 5, 2021
Geometry (G)
Cluster Headings Content Standards
A. Reason about shapes and their attributes.
2.G.A.1 Identify triangles, quadrilaterals, pentagons, and hexagons. Draw two-dimensional shapes having specified attributes (as determined directly or visually, not by measuring), such as a given number of angles/vertices or a given number of sides of equal length.
2.G.A.2 Partition a rectangle into rows and columns of same- sized squares and find the total number of squares.
2.G.A.3 Partition circles and rectangles into two, three, and four equal shares. Describe the shares using the words halves, thirds, fourths, half of, a third of, and a fourth of, and describe the whole as two halves, three thirds, four fourths. Recognize that equal shares of identical wholes need not have the same shape.

33 Revised February 5, 2021

34 Revised February 5, 2021

35 Revised February 5, 2021
Mathematics | Grade 3
The descriptions below provide an overview of the mathematical concepts and skills that students explore throughout the 3rd grade.
Operations and Algebraic Thinking
Students build on their understanding of addition and subtraction to develop an understanding of the meanings of multiplication and division of whole numbers. Students use increasingly sophisticated strategies based on properties of operations to fluently solve multiplication and division problems within 100 (See Table 3 - Properties of Operations). Students interpret multiplication as finding an unknown product in situations involving equal-sized groups, arrays, area and measurement models, and division as finding an unknown factor in situations involving the unknown number of groups or the unknown group size. Students use these interpretations to represent and solve contextual problems with unknowns in all positions. By the end of 3rd grade, students should know all products of two one-digit numbers and related division facts.
Students use all four operations to solve two-step word problems and use place value, mental
computation, and estimation strategies to assess the reasonableness of solutions. They build number sense by investigating numerical representations, such as addition or multiplication tables for the purpose of identifying arithmetic patterns. Students should solve a variety of problem types in order to make connections among contexts, equations, and strategies (See Table 1 - Addition and Subtraction Situations and Table 2 - Multiplication and Division Situations).
Number and Operations in Base Ten
Students generalize place value understanding to read and write numbers to 100,000, using standard form, word form, and expanded form. Students begin to develop an understanding of rounding whole numbers to the nearest ten or hundred. Students fluently add and subtract within 1000 using strategies and algorithms. Students multiply one-digit whole numbers by multiples of 10.
Number and Operations in Fractions
This domain builds on the previous skill of partitioning shapes in geometry. This is the first time students are introduced to unit fractions. Students understand that fractions are composed of unit fractions and they use visual fraction models to represent parts of a whole. Students build on their understanding of number lines to represent fractions as locations and lengths on a number line. Students use fractions to represent numbers equal to, less than, and greater than 1 and are able to generate simple equivalent fractions by using drawings and/or reasoning about fractions. Students understand that the size of a fractional part is relative to the size of the whole.

36 Revised February 5, 2021
Measurement and Data
In 2nd grade, students tell time in five minute increments, measure lengths, and create bar graphs, pictographs, and line plots with whole number units. In 3rd grade, students tell and write time to the nearest minute and solve contextual problems involving addition and subtraction. They use appropriate tools to measure and estimate liquid volume and mass. Students draw pictographs and bar graphs and answer two-step questions about these graphs. Students generate measurement data and represent the data on line plots marked with whole number, half, or quarter units. Students recognize area as an attribute of two-dimensional shapes and measure the area of a shape using the standard unit (a square) by finding the total number of same-sized units required to cover the shape without gaps or overlaps. Students connect area to multiplication and use multiplication to justify the area of a rectangle by decomposing rectangles into rectangular arrays of squares.
Geometry
Students understand that shapes in given categories have shared attributes and they identify polygons. Students continue their understanding of shapes and fractions by partitioning shapes into parts with equal areas and identify the parts with unit fractions.
Standards for Mathematical Practice
Being successful in mathematics requires the development of approaches, practices, and habits
of mind that need to be in place as one strives to develop mathematical fluency, procedural skills, and conceptual understanding. The Standards for Mathematical Practice are meant to address these areas of expertise that teachers should seek to develop in their students. These approaches, practices, and habits of mind can be summarized as “processes and proficiencies” that successful mathematicians have as a part of their work in mathematics. Additional explanations are included in the main introduction of these standards.
Standards for Mathematical Practice
1. Make sense of problems and persevere in solving them. 2. Reason abstractly and quantitatively. 3. Construct viable arguments and critique the reasoning ofothers. 4. Model with mathematics. 5. Use appropriate tools strategically. 6. Attend to precision. 7. Look for and make use of structure. 8. Look for and express regularity in repeated reasoning.
Literacy Standards for Mathematics
Communication in mathematics employs literacy skills in reading, vocabulary, speaking and
listening, and writing. Mathematically proficient students communicate using precise terminology and

37 Revised February 5, 2021
multiple representations including graphs, tables, charts, and diagrams. By describing and contextualizing mathematics, students create arguments and support conclusions. They evaluate and critique the reasoning of others, analyze, and reflect on their own thought processes. Mathematically proficient students have the capacity to engage fully with mathematics in context by posing questions, choosing appropriate problem-solving approaches, and justifying solutions. Further explanations are included in the main introduction.
Literacy Skills for Mathematical Proficiency
1. Use multiple reading strategies. 2. Understand and use correct mathematical vocabulary. 3. Discuss and articulate mathematical ideas. 4. Write mathematical arguments.
Operations and Algebraic Thinking (OA)
Cluster Headings Content Standards
A. Represent and solve problems involving multiplication and division.
3.OA.A.1 Interpret the factors and products in whole number multiplication equations (e.g., 4 x 7 is 4 groups of 7 objects with a total of 28 objects or 4 strings measuring 7 inches each with a total length of 28 inches).
3.OA.A.2 Interpret the dividend, divisor, and quotient in whole number division equations (e.g., 28 ÷ 7 can be interpreted as 28 objects divided into 7 equal groups with 4 objects in each group or 28 objects divided so there are 7 objects in each of the 4 equal groups).
3.OA.A.3 Multiply and divide within 100 to solve contextual problems, with the unknown in any positions, in situations involving equal groups, arrays/area, and measurement quantities using strategies based on place value, the properties of operations, and the relationship between multiplication and division (e.g., contexts including computations such as 3 x ? = 24, 6 x 16 = ?, ? ÷ 8 = 3, or 96 ÷ 6 = ?). (See Table 2 - Multiplication and Division Situations).
3.OA.A.4 Determine the unknown whole number in a multiplication or division equation relating three whole numbers within 100. For example, determine the unknown number that makes the equation true in each of the equations: 8 x ? = 48, 5 = ? ÷ 3, 6 x 6 =?.

38 Revised February 5, 2021
B. Understand properties of multiplication and the relationship between Multiplication and division.
(See Table 3 - Properties of Operations)
3.OA.B.5 Apply properties of operations as strategies to multiply and divide. (Students need not use formal terms for these properties.) Examples: If 6 x 4 = 24 is known, then 4 x 6 = 24 is also known (commutative property of multiplication). 3 x 5 x 2 can be solved by (3 x 5) x 2 or 3 x (5 x 2) (associative property of multiplication). One way to find 8 x 7 is by using 8 x (5 + 2) = (8 x 5) + (8 x 2). By knowing that 8 x 5 = 40 and 8 x 2 = 16, then 8 x 7 = 40 + 16 = 56 (distributive property of multiplication over addition).
3.OA.B.6 Understand division as an unknown-factor problem. For example, find 32 ÷ 8 by finding the number that makes 32 when multiplied by 8.
C. Multiply and divide within 100.
3.OA.C.7 Fluently multiply and divide within 100, using strategies such as the properties of operations or the relationship between multiplication and division (e.g., knowing that 8 x 5 = 40, one knows 40 ÷ 5 = 8). By the end of 3rd grade, know all products of two one-digit numbers and related division facts.
D. Solve problems involving the four operations and identify and explain patterns in arithmetic.
3.OA.D.8 Solve two-step contextual problems using the four operations. Represent these problems using equations with a letter standing for the unknown quantity.
Assess the reasonableness of answers using mental computation and estimation strategies including rounding (See Table 1 - Addition and Subtraction Situations and Table 2 - Multiplication and Division Situations).
3.OA.D.9 Identify patterns in a multiplication chart and explain them using properties of operations. For example, in the multiplication chart, observe that 4 times a number is always even (because 4 x 6 = (2 x 2) x 6 = 2 x (2 x 6), which uses the associative property of multiplication) or, for example, observe that 6 times 7 is one more group of 7 than 5 times 7 (because 6 x 7 = (5 + 1) x 7 = (5 x 7) + (1 x 7), which uses the distributive property of multiplication over addition). (See Table 3 - Properties of Operations)

39 Revised February 5, 2021
Number and Operations in Base Ten (NBT)
Cluster Headings Content Standards
A. Use place value understanding and properties of operations to perform multi-digit arithmetic.
3.NBT.A.1 Round whole numbers to the nearest 10 or 100 using understanding of place value and use a number line to explain how the number was rounded.
3.NBT.A.2 Fluently add and subtract within 1000 using strategies and algorithms based on place value, properties of operations, and/or the relationship between addition and subtraction.
3.NBT.A.3 Multiply one-digit whole numbers by multiples of 10 in the range 10–90 (e.g., 9 x 80, 5 x 60) using strategies based on place value and properties of operations.
3.NBT.A.4 Read and write multi-digit whole numbers (less than or equal to 100,000) using standard form, word form, and expanded form (e.g., 23,456 can be written as 20,000 + 3,000 + 400 + 50 + 6).

40 Revised February 5, 2021
Number and Operations – Fractions (NF)
Cluster Headings Content Standards
A. Develop understanding of fractions as numbers.
3.NF.A.1 Understand a unit fraction, 1/b, as the quantity formed by 1 part when a whole is partitioned into b equal parts; understand a non-unit fraction, n/b, as the quantity formed by n parts of size 1/b. For example, 3/4 represents a quantity formed by 3 parts of size 1/4.
3. NF.A.2 Understand a fraction as a number on the number line. Represent fractions on a number line.
a. Represent a fraction 1/b on a number line diagram by defining the interval from 0 to 1 as the whole and partitioning it into b equal parts. Recognize that each part has size 1/b and that the endpoint locates the number 1/b on the number line. For example, on a number line from 0 to 1, students can partition it into 4 equal parts and recognize that each part represents a length of 1/4 and the first part has an endpoint at 1/4 on the number line.
b. Represent a fraction n/b on a number line diagram by marking off n lengths 1/b from 0. Recognize that the resulting interval has size n/b and that its endpoint locates the number n/b on the number line. For example, 5/3 is the distance from 0 when there are 5 iterations of 1/3.
3.NF.A.3 Explain equivalence of fractions and compare fractions by reasoning about their size.
a. Understand two fractions as equivalent (equal) if they are the same size or the same point on a number line.
b. Recognize and generate simple equivalent fractions (e.g., 1/2 = 2/4, 4/6 = 2/3) and explain why the fractions are equivalent using a visual fraction model.
c. Express whole numbers as fractions and recognize fractions that are equivalent to whole numbers. For example, express 3 in the form 3 = 3/1; recognize that 6/1= 6; locate 4/4 and 1 at the same point on a number line diagram.
d. Compare two fractions with the same numerator or the same denominator by reasoning about their size. Recognize that comparisons are valid only when the two fractions refer to the same whole. Use the symbols >, =, or < to show the relationship and justify the conclusions.

41 Revised February 5, 2021
Measurement and Data (MD)
Cluster Headings Content Standards
A. Solve problems involving measurement and estimation of intervals of time, liquid volumes, and masses of objects.
3.MD.A.1 Solve contextual problems in time and money. a. Tell and write time to the nearest minute and measure time intervals in minutes. Solve contextual problems involving addition and subtraction of time intervals in minutes.
b. Solve one-step contextual problems involving amounts less than one dollar including quarters, dimes, nickels, and pennies using the ¢ symbol appropriately. Solve contextual problems involving whole number dollar amounts up to $1000 using the $ symbol appropriately.
3.MD.A.2 Measure the mass of objects and liquid volume using standard units of grams (g), kilograms (kg), milliliters (ml), and liters (l). Estimate the mass of objects and liquid volume using benchmarks. For example, a large paper clip is about one gram, so a box of about 100 large clips is about 100 grams.
B. Represent and interpret data.
3.MD.B.3 Draw a pictograph and a scaled bar graph to represent a data set with several categories. Solve one- and two-step "how many more" and "how many less" problems using information presented in graphs.
3.MD.B.4 Generate measurement data by measuring lengths using rulers marked with halves and fourths of an inch. Show the data by making a line plot, where the horizontal scale is marked off in appropriate units: whole numbers, halves, or quarters.

42 Revised February 5, 2021
C. Geometric measurement: under-stand and apply concepts of area and relate area to multiplication and to addition.
3. MD.C.5 Recognize that plane figures have an area and understand concepts of area measurement.
a. Understand that a square with side length 1 unit, called "a unit square," is said to have "one square unit" of area and can be used to measure area.
b. Understand that a plane figure which can be covered without gaps or overlaps by n unit squares is said to have an area of n square units.
3.MD.C.6 Measure areas by counting unit squares (square centimeters, square meters, square inches, square feet, and improvised units).
3. MD.C.7 Relate area of rectangles to the operations of multiplication and addition.
a. Find the area of a rectangle with whole-number side lengths by tiling it and show that the area is the same as would be found by multiplying the side lengths.
b. Multiply side lengths to find areas of rectangles with whole number side lengths in the context of solving real-world and mathematical problems and represent whole-number products as rectangular areas in mathematical reasoning.
c. Use tiling to show in a concrete case that the area of a rectangle with whole-number side lengths a and (b + c) is the sum of (a x b) and (a x c). Use area models to represent the distributive property in mathematical reasoning. For example, in a rectangle with dimensions 4 by 6, students can decompose the rectangle into 4 x 3 and 4 x 3 to find the total area of 4 x 6. (See Table 3 - Properties of Operations)
d. Recognize area as additive. Find areas of rectilinear figures by decomposing them into non-overlapping rectangles and adding the areas of the non-overlapping parts, applying this technique to solve real-world problems.
D. Geometric measurement: recognize perimeter as an attribute of plane figures and distinguish between linear and area measures.
3.MD.D.8 Solve real-world and mathematical problems involving perimeters of polygons, including finding the perimeter given the side lengths, finding an unknown side length, and exploring rectangles with the same perimeter and different areas or with the same area and different perimeters.

43 Revised February 5, 2021
Geometry (G)
Cluster Headings Content Standards
A. Reason about shapes and their attributes.
3.G.A.1 Understand that shapes in different categories may share attributes and that the shared attributes can define a larger category. Recognize rhombuses, rectangles, and squares as examples of quadrilaterals and recognize examples of quadrilaterals that do not belong to any of these subcategories.
3.G.A.2 Partition shapes into parts with equal areas. Recognize that equal shares of identical wholes need not have the same shape. Express the area of each part as a unit fraction of the whole.
3.G.A.3 Determine if a figure is a polygon.
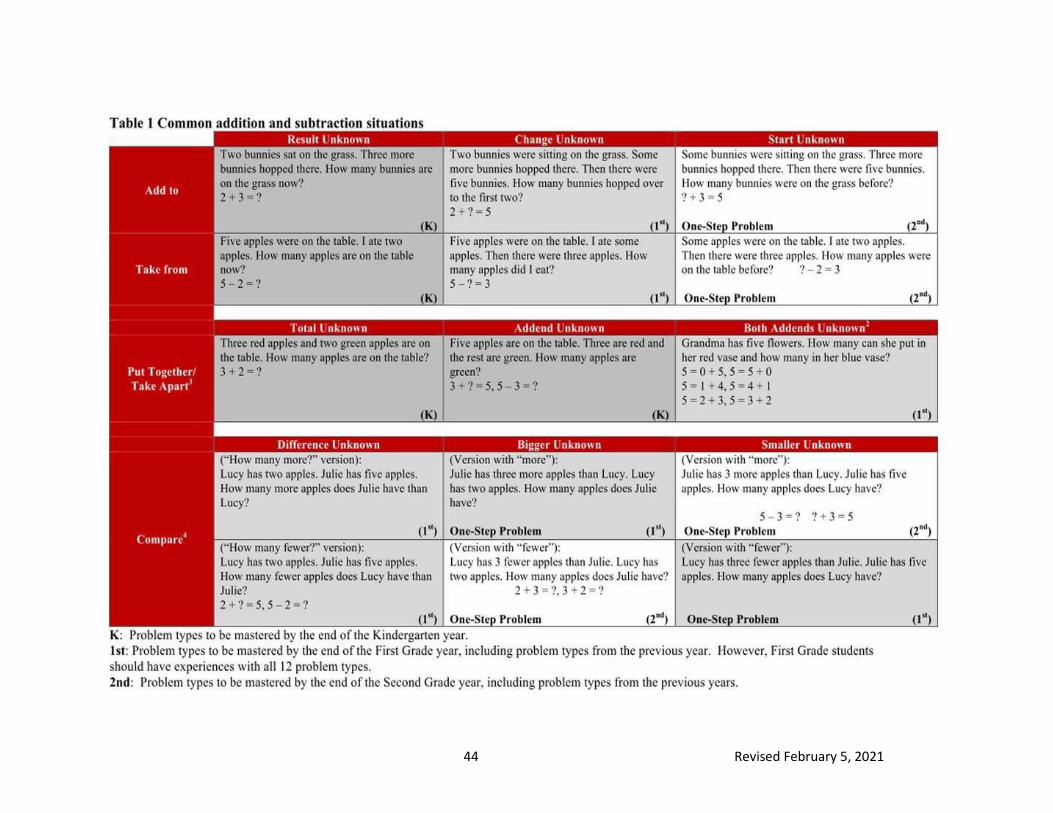
44 Revised February 5, 2021

45 Revised February 5, 2021

46 Revised February 5, 2021

47 Revised February 5, 2021
Mathematics | Grade 4
The descriptions below provide an overview of the mathematical concepts and skills that students explore throughout the 4th grade.
Operations and Algebraic Thinking
Students build on their knowledge of multiplication and begin to interpret and represent multiplication as a comparison. They multiply and divide to solve contextual problems involving multiplicative situations, distinguishing their solutions from additive comparison situations. Students solve multi-step whole number contextual problems using the four operations representing the unknown as a variable within equations (See Table 1 - Addition and Subtraction Situations and Table 2 - Multiplication and Division Situations). This is the first time students find and interpret remainders in context. Students find factors and multiples, and they identify prime and composite numbers. Students generate number or shape patterns following a given rule.
Number and Operations in Base Ten
Students generalize place value understanding to read and write numbers to 1,000,000, using standard form, word form, and expanded notation. They compare the relative size of the numbers and round numbers to the nearest hundred thousand, which builds on 3rd grade rounding concepts. By the end of 4th grade, students should fluently add and subtract multi-digit whole numbers to 1,000,000. Students use strategies based on place value and the properties of operations to multiply a whole number up to four-digits by a one-digit number, and multiply two two-digit numbers. They use these strategies and the relationship between multiplication and division to find whole number quotients and remainders up to four-digit dividends and one-digit divisors (See Table 3 - Properties of Operations).
Number and Operations-Fractions
Students continue to develop an understanding of fraction equivalence by reasoning about the size of the fractions, using a benchmark fraction to compare the fractions, or finding a common denominator. Students extend previous understanding of unit fractions to compose and decompose fractions in different ways. They use the meaning of fractions and the meaning of multiplication as repeated addition to multiply a whole number by a fraction. Students solve contextual problems involving addition and subtraction of fractions with like denominators and multiplication of a whole number by a fraction (See Table 1 - Addition and Subtraction Situations and Table 2 - Multiplication and Division Situations for whole number situations that can be applied to fractions). Students learn decimal notation for the first time to represent fractions with denominators of 10 and 100. They express these fractions and their equivalents as decimals and are able to read, write, compare, and locate these decimals on a number line.

48 Revised February 5, 2021
Measurement and Data
Students know the relative sizes of measurement units within one system of units. They use the four operations to solve contextual problems involving measurement. Students build on their previous understanding of area and perimeter to generate and apply formulas for finding the area and perimeter of rectangles. Students also build on their understanding of line plots and solve problems involving fractions using operations appropriate for the grade. For the first time, students learn concepts of angle measurement.
Geometry
Students extend their previous understanding to analyze and classify shapes based on line and angle types. Students also use knowledge of line and angle types to identify right triangles. Students recognize and draw lines of symmetry for the first time.
Standards for Mathematical Practice
Being successful in mathematics requires the development of approaches, practices, and habits
of mind that need to be in place as one strives to develop mathematical fluency, procedural skills, and conceptual understanding. The Standards for Mathematical Practice are meant to address these areas of expertise that teachers should seek to develop in their students. These approaches, practices, and habits of mind can be summarized as “processes and proficiencies” that successful mathematicians have as a part of their work in mathematics. Additional explanations are included in the main introduction of these standards.
Standards for Mathematical Practice
1. Make sense of problems and persevere in solving them. 2. Reason abstractly and quantitatively. 3. Construct viable arguments and critique the reasoning of others. 4. Model with mathematics. 5. Use appropriate tools strategically. 6. Attend to precision. 7. Look for and make use of structure. 8. Look for and express regularity in repeated reasoning.
Literacy Standards for Mathematics
Communication in mathematics employs literacy skills in reading, vocabulary, speaking and
listening, and writing. Mathematically proficient students communicate using precise terminology and multiple representations including graphs, tables, charts, and diagrams. By describing and contextualizing mathematics, students create arguments and support conclusions. They evaluate and critique the reasoning of others, analyze, and reflect on their own thought processes. Mathematically proficient students have the capacity to engage fully with mathematics in context by posing questions, choosing

49 Revised February 5, 2021
appropriate problem-solving approaches, and justifying solutions. Further explanations are included in the main introduction.
Literacy Skills for Mathematical Proficiency
1. Use multiple reading strategies. 2. Understand and use correct mathematical vocabulary. 3. Discuss and articulate mathematical ideas. 4. Write mathematical arguments.
Operations and Algebraic Thinking (OA)
Cluster Headings Content Standards
A. Use the four operations with whole numbers to solve problems. (See Table 1 - Addition and Subtraction Situations and Table 2 - Multiplication and Division Situations)
4.OA.A.1 Interpret a multiplication equation as a comparison (e.g., interpret 35 = 5 x 7 as a statement that 35 is 5 times as many as 7 and 7 times as much as 5). Represent verbal/written statements of multiplicative comparisons as multiplication equations.
4.OA.A.2 Multiply or divide to solve contextual problems involving multiplicative comparison, and distinguish multiplicative comparison from additive comparison. For example, school A has 300 students and school B has 600 students: to say that school B has two times as many students is an example of multiplicative comparison; to say that school B has 300 more students is an example of additive comparison.
4.OA.A.3 Solve multi-step contextual problems (posed with whole numbers and having whole-number answers using the four operations) including problems in which remainders must be interpreted. Represent these problems using equations with a letter standing for the unknown quantity.
B. Gain familiarity with factors and multiples.
4.OA.B.4 Find factor pairs for whole numbers in the range 1–100 using models. Recognize that a whole number is a multiple of each of its factors. Determine whether a given whole number is prime or composite and whether the given number is a multiple of a given one-digit number.
C. Generate and analyze patterns.
4.OA.C.5 Generate a number or shape pattern that follows a given rule. Identify apparent features of the pattern that were not explicit in the rule itself. For example, given the rule "Add 3" and the starting number 1, generate terms in the resulting sequence and observe that the terms appear to alternate between odd and even numbers. Explain informally why the numbers will continue to alternate in this way.

50 Revised February 5, 2021
Number and Operations in Base Ten (NBT)
Cluster Headings Content Standards
A. Generalize place value understanding for multi- digit whole numbers.
4.NBT.A.1 Recognize that in a multi-digit whole number (less than or equal to 1,000,000), a digit in one place represents 10 times as much as it represents in the place to its right. For example, recognize that 7 in 700 is 10 times bigger than the 7 in 70 because 700 ÷ 70 = 10 and 70 x 10 = 700.
4.NBT.A.2 Read and write multi-digit whole numbers (less than or equal to 1,000,000) using standard form, word form, and expanded notation (e.g. the expanded notation of 4256 is written as (4 x 1000) + (2 x 100) + (5 x 10) + (6 x 1)). Compare two multi-digit numbers based on meanings of the digits in each place and use the symbols >, =, and < to show the relationship.
4.NBT.A.3 Round multi-digit whole numbers to any place (up to and including the hundred-thousand place) using understanding of place value and use a number line to explain how the number was rounded.
B. Use place value understanding and properties of operations to perform multi-digit arithmetic.
(See Table 3 - Properties of Operations)
4.NBT.B.4 Fluently add and subtract within 1,000,000 using efficient strategies and algorithms.
4.NBT.B.5 Multiply a whole number of up to four digits by a one- digit whole number and multiply two two-digit numbers, using strategies based on place value and the properties of operations. Illustrate and explain the calculation by using equations, rectangular arrays, and/or area models.
4.NBT.B.6 Find whole-number quotients and remainders with up to four-digit dividends and one-digit divisors, using strategies based on place value, the properties of operations, and/or the relationship between multiplication and division. Illustrate and explain the calculation by using equations, rectangular arrays, and/or area models.

51 Revised February 5, 2021
Number and Operations – Fractions (NF) Limited to fractions with denominators 2, 3, 4, 5, 6, 8, 10, 12, and 100.
Cluster Headings Content Standards
A. Extend understanding of fraction equivalence and comparison.
4.NF.A.1 Explain why a fraction a/b is equivalent to a fraction (a x n)/(b x n) or (a ÷ n)/(b ÷ n) using visual fraction models, with attention to how the number and size of the parts differ even though the two fractions themselves are the same size. Use this principle to recognize and generate equivalent fractions. For example, 3/4 = (3 x 2)/(4 x 2) = 6/8.
4.NF.A.2 Compare two fractions with different numerators and different denominators by creating common denominators or common numerators or by comparing to a benchmark such as 0 or 1/2 or 1. Recognize that comparisons are valid only when the two fractions refer to the same whole. Use the symbols >, =, or < to show the relationship and justify the conclusions.
B. Build fractions from unit fractions by applying and extending previous understandings of operations on whole numbers.
(See Table 1 - Addition and Subtraction Situations and Table 2 - Multiplication and Division Situations for whole number situations that can be applied for fractions.)
4. NF.B.3 Understand a fraction a/b with a > 1 as a sum of fractions 1/b. For example, 4/5 = 1/5 +1/5 + 1/5 + 1/5.
a. Understand addition and subtraction of fractions as joining and separating parts referring to the same whole.
b. Decompose a fraction into a sum of fractions with the same denominator in more than one way (e.g., 3/8 = 1/8 + 1/8 + 1/8; 3/8 = 1/8 + 2/8; 2 1/8 = 1 + 1 + 1/8 = 8/8 + 8/8 + 1/8) recording each decomposition by an equation. Justify decompositions using a visual fraction model.
c. Add and subtract mixed numbers with like denominators by replacing each mixed number with an equivalent fraction and/or by using properties of operations and the relationship between addition and subtraction.
d. Solve contextual problems involving addition and subtraction of fractions referring to the same whole and having like denominators
4. NF.B.4 Apply and extend understanding of multiplication as repeated addition to multiply a whole number by a fraction.
a. Understand a fraction a/b as a multiple of 1/b. For example, use a visual fraction model to represent 5/4 as the product 5 × 1/4, recording the conclusion by the equation 5/4 = 5 x 1/4.

52 Revised February 5, 2021
b. Understand a multiple of a/b as a multiple of 1/b and use this understanding to multiply a whole number by a fraction. For example, use a visual fraction model to express 3 × 2/5 as 6 × 1/5, recognizing this product as 6/5. (In general, n x a/b = (n x a)/b = (n x a) x 1/b.)
c. Solve contextual problems involving multiplication of a whole number by a fraction (e.g., by using visual fraction models and equations to represent the problem). For example, if each person at a party will eat 3/8 of a pound of roast beef, and there will be 4 people at the party, how many pounds of roast beef will be needed? Between what two whole numbers does your answer lie?
C. Understand decimal notation for fractions and compare decimal fractions.
4.NF.C.5 Express a fraction with denominator 10 as an equivalent fraction with denominator 100, and use this technique to add two fractions with respective denominators 10 and 100.
4.NF.C.6 Read and write decimal notation for fractions with denominators 10 or 100. Locate these decimals on a number line.
4.NF.C.7 Compare two decimals to hundredths by reasoning about their size. Recognize that comparisons are valid only when the two decimals refer to the same whole. Use the symbols >, =, or < to show the relationship and justify the conclusions.
Measurement and Data (MD)
Cluster Headings Content Standards
A. Estimate and solve problems involving measurement.
4.MD.A.1 Measure and estimate to determine relative sizes of measurement units within a single system of measurement involving length, liquid volume, and mass/weight of objects using customary and metric units.
4.MD.A.2 Solve one- or two-step real-world problems involving whole number measurements (including length, liquid volume, mass/weight, time, and money) with all four operations within a single system of measurement. (Contexts need not include conversions.)
4.MD.A.3 Know and apply the area and perimeter formulas for rectangles in real- world and mathematical contexts. For example, find the width of a rectangular room given the area of the flooring and the length, by viewing the area formula as a multiplication equation with an unknown factor.

53 Revised February 5, 2021
B. Represent and interpret data.
4.MD.B.4 Make a line plot to display a data set of measurements in fractions of the same unit (1/2 or 1/4 or 1/8). Use operations on fractions for this grade to solve problems involving information presented in line plots. For example, from a line plot find and interpret the difference in length between the longest and shortest specimens in an insect collection.
C. Geometric measurement: understand concepts of angle and measure angles.
4. MD.C.5 Recognize angles as geometric shapes that are formed wherever two rays share a common endpoint; and understand concepts of angle measurement.
a. Understand that an angle is measured with reference to a circle with its center at the common endpoint of the rays, by considering the fraction of the circular arc between the points where the two rays intersect the circle.
b. Understand that an angle that turns through 1/360 of a circle is called a "one-degree angle," and can be used to measure angles. An angle that turns through n one-degree angles is said to have an angle measure of n degrees and represents a fractional portion of the circle.
4.MD.C.6 Measure angles in whole-number degrees using a protractor. Sketch angles of specified measure.
4.MD.C.7 Recognize angle measure as additive. When an angle is decomposed into non-overlapping parts, the angle measure of the whole is the sum of the angle measures of the parts. Solve addition and subtraction problems to find unknown angles on a diagram in real-world and mathematical problems. (e.g., by using an equation with a symbol for the unknown angle measure).

54 Revised February 5, 2021
Geometry (G)
Cluster Headings Content Standards
A. Draw and identify lines and angles and classify shapes by properties of their lines and angles.
4.G.A.1 Draw points, lines, line segments, rays, angles (right, acute, obtuse, straight, reflex), and perpendicular and parallel lines. Identify these in two- dimensional figures.
4.G.A.2 Classify two-dimensional figures based on the presence or absence of parallel or perpendicular lines or the presence or absence of angles of a specified size. Classify triangles based on the measure of the angles as right, acute, or obtuse.
4.G.A.3 Recognize and draw lines of symmetry for two-dimensional figures.

55 Revised February 5, 2021

56 Revised February 5, 2021

57 Revised February 5, 2021

58 Revised February 5, 2021
Mathematics | Grade 5
The descriptions below provide an overview of the mathematical concepts and skills that students explore throughout the 5th grade.
Operations and Algebraic Thinking
Students build on their understanding of patterns to generate two numerical patterns using given rules and identify relationships between the patterns. For the first time, students form ordered pairs and graph them on a coordinate plane. In addition, students write and evaluate numerical expressions using parentheses and/or brackets.
Number and Operations in Base Ten
Students generalize their understanding of place value to include decimals by reading, writing, comparing, and rounding numbers. Students explain patterns in products when multiplying a number by a power of 10. Whole-number exponents are used to denote powers of 10 for the first time. By the end of 5th grade, students should fluently multiply multi-digit whole numbers (up to 4 digits by 3 digits).
Students build on their understanding of why division procedures work based on place value and
the properties of operations to find whole number quotients and remainders (See Table 3 - Properties of Operations). They apply their understanding of models for decimals, decimal notation, and properties of operations to add, subtract, multiply, and divide decimals to hundredths. (Limit division problems so that either the dividend or the divisor is a whole number.) They develop fluency in these computations and make reasonable estimates of their results. Students finalize their understanding of multi-digit addition, subtraction, multiplication, and division with whole numbers.
Number and Operations in Fractions
Students apply their understanding of equivalent fractions and fraction models to represent the addition and subtraction of fractions with unlike denominators as equivalent calculations with like denominators. They develop fluency in calculating sums and differences of fractions and make reasonable estimates of them. For the first time, students develop an understanding of fractions as division problems. They use the meaning of fractions, of multiplication and division, and the relationship between multiplication and division to understand and explain why the procedures for multiplying and dividing fractions make sense. Students reason about the size of products compared to the size of the factors. Students should solve a variety of problem types in order to make connections among contexts, equations, and strategies (See Table 1 - Addition and Subtraction Situations and Table 2 - Multiplication and Division Situations for whole number situations that can be applied to fractions).

59 Revised February 5, 2021
Measurement and Data
Students build on their understanding of area and recognize volume as an attribute of three- dimensional space. They understand that volume can be measured by finding the total number of same- sized units of volume required to fill the space without gaps or overlaps. Students decompose three- dimensional shapes and find volumes of right rectangular prisms by viewing them as decomposed into layers of cubes. Students build on their understanding of measurements to convert from larger units to smaller units within a single system of measurement and solve multistep problems involving these conversions. Students solve problems with data from line plots involving fractions using operations appropriate for the grade.
Geometry
Students plot points on the coordinate plane to solve real-world and mathematical problems. Students classify two-dimensional figures into categories based on their properties.
Standards for Mathematical Practice
Being successful in mathematics requires the development of approaches, practices, and habits
of mind that need to be in place as one strives to develop mathematical fluency, procedural skills, and conceptual understanding. The Standards for Mathematical Practice are meant to address these areas of expertise that teachers should seek to develop in their students. These approaches, practices, and habits of mind can be summarized as “processes and proficiencies” that successful mathematicians have as a part of their work in mathematics. Additional explanations are included in the main introduction of these standards.
Standards for Mathematical Practice
1. Make sense of problems and persevere in solving them. 2. Reason abstractly and quantitatively. 3. Construct viable arguments and critique the reasoning of others. 4. Model with mathematics. 5. Use appropriate tools strategically. 6. Attend to precision. 7. Look for and make use of structure. 8. Look for and express regularity in repeated reasoning.
Literacy Standards for Mathematics
Communication in mathematics employs literacy skills in reading, vocabulary, speaking and
listening, and writing. Mathematically proficient students communicate using precise terminology and multiple representations including graphs, tables, charts, and diagrams. By describing and contextualizing mathematics, students create arguments and support conclusions. They evaluate and critique the reasoning of others, analyze, and reflect on their own thought processes. Mathematically proficient

60 Revised February 5, 2021
students have the capacity to engage fully with mathematics in context by posing questions, choosing appropriate problem-solving approaches, and justifying solutions. Further explanations are included in the main introduction.
Literacy Skills for Mathematical Proficiency
1. Use multiple reading strategies. 2. Understand and use correct mathematical vocabulary. 3. Discuss and articulate mathematical ideas. 4. Write mathematical arguments.
Operations and Algebraic Thinking (OA)
Cluster Headings Content Standards
A. Write and interpret numerical expressions.
5.OA.A.1 Use parentheses and/or brackets in numerical expressions involving whole numbers and evaluate expressions having these symbols using the conventional order by applying the Order of Operations. (When applying the order of operations, the evaluation of exponents need not be included.)
5.OA.A.2 Write numerical expressions that record calculations with numbers and interpret numerical expressions without evaluating them. For example, express the calculation "add 8 and 7, then multiply by 2" as 2 x (8 + 7). Recognize that 3 x (18,932 + 921) is three times as large as 18,932 + 921, without having to calculate the indicated sum or product.
B. Analyze patterns and relationships.
5. OA.B.3 Generate two numerical patterns using two given rules. For example, given the rule "Add 3" and the starting number 0, and given the rule "Add 6" and the starting number 0, generate terms in the resulting sequences.
a. Identify relationships between corresponding terms in two numerical patterns.
b. Form ordered pairs (limited to first quadrant) consisting of corresponding terms from two numerical patterns and graph the ordered pairs on a coordinate plane.

61 Revised February 5, 2021
Number and Operations in Base Ten (NBT)
Cluster Headings Content Standards
A. Understand the place value system.
5.NBT.A.1 Recognize that in a multi-digit number, a digit in one place represents 10 times as much as it represents in the place to its right and 1/10 of what it represents in the place to its left.
5.NBT.A.2 Explain patterns in the number of zeros of the product when multiplying a number by powers of 10, and explain patterns in the placement of the decimal point when a decimal is multiplied or divided by a power of 10. Use whole- number exponents to denote powers of 10.
5.NBT.A.3 Read and write decimals to thousandths using standard form, word form, and expanded notation (e.g., the expanded notation of 347.392 is written as (3 x 100) + (4 x 10) + (7 x 1) + (3 x (1/10)) + (9 x (1/100)) + (2 x (1/1000))). Compare two decimals to thousandths based on meanings of the digits in each place and use the symbols >, =, and < to show the relationship.
5.NBT.A.4 Round decimals to the nearest hundredth, tenth, or whole number using understanding of place value, and use a number line to explain how the number was rounded.
B. Perform operations with multi-digit whole numbers and with decimals to hundredths.
(See Table 3 - Properties of Operations)
5.NBT.B.5 Fluently multiply multi-digit whole numbers (up to three-digit by four-digit factors) using efficient strategies and algorithms.
5.NBT.B.6 Find whole-number quotients and remainders of whole numbers with up to four-digit dividends and two-digit divisors, using strategies based on place value, the properties of operations, and/or the relationship between multiplication and division. Illustrate and explain the calculation by using equations, rectangular arrays, and/or area models.
5.NBT.B.7 Add, subtract, multiply, and divide decimals to hundredths, using concrete models or drawings and strategies based on place value, properties of operations, and/or the relationship between operations. Assess the reasonableness of answers using estimation strategies. (Limit multiplication problems so that the product does not exceed thousandths. Limit division problems so that either the dividend or the divisor is a whole number.)

62 Revised February 5, 2021
Number and Operations – Fractions (NF)
Cluster Headings Content Standards
A. Use equivalent fractions as a strategy to add and subtract fractions.
(See Table 1 - Addition and Subtraction Situations for whole number situations that can be applied to fractions)
5.NF.A.1 Add and subtract fractions with unlike denominators (including mixed numbers) by replacing given fractions with equivalent fractions in such a way as to produce an equivalent sum or difference of fractions with like denominators. For example, 2/3 + 5/4 = 8/12 + 15/12 = 23/12 or 3/5 + 7/10 = 6/10 + 7/10 = 13/10.
5.NF.A.2 Solve contextual problems involving addition and subtraction of fractions referring to the same whole, including cases of unlike denominators. Use benchmark fractions and number sense of fractions to estimate mentally and assess the reasonableness of answers. For example, recognize an incorrect result 2/5 + 1/2 = 3/7, by observing that 3/7 < 1/2.
B. Apply and extend previous understandings of multiplication and division to multiply and divide fractions.
(See Table 2 - Multiplication and Division Situations for whole number situations that can be applied to fractions)
5.NF.B.3 Interpret a fraction as division of the numerator by the denominator (a/b = a ÷ b). For example, 3/4 = 3 ÷ 4 so when 3 wholes are shared equally among 4 people, each person has a share of size 3/4. Solve contextual problems involving division of whole numbers leading to answers in the form of fractions or mixed numbers by using visual fraction models or equations to represent the problem. For example, if 8 people want to share 49 sheets of construction paper equally, how many sheets will each person receive? Between what two whole numbers does your answer lie?
5.NF.B.4 Apply and extend previous understandings of multiplication to multiply a fraction by a whole number or a fraction by a fraction.
a. Interpret the product a/b x q as a x (q ÷ b) (partition the quantity q into b equal parts and then multiply by a). Interpret the product a/b x q as (a x q) ÷ b (multiply a times the quantity q and then partition the product into b equal parts). For example, use a visual fraction model or write a story context to show that 2/3 x 6 can be interpreted as 2 x (6 ÷ 3) or (2 x 6) ÷ 3. Do the same with 2/3 x 4/5 = 8/15. (In general, a/b x c/d = ac/bd.)
b. Find the area of a rectangle with fractional side lengths by tiling it with unit squares of the appropriate unit fraction side lengths, and show that the area is the same as would be found by multiplying the side lengths. Multiply fractional side lengths
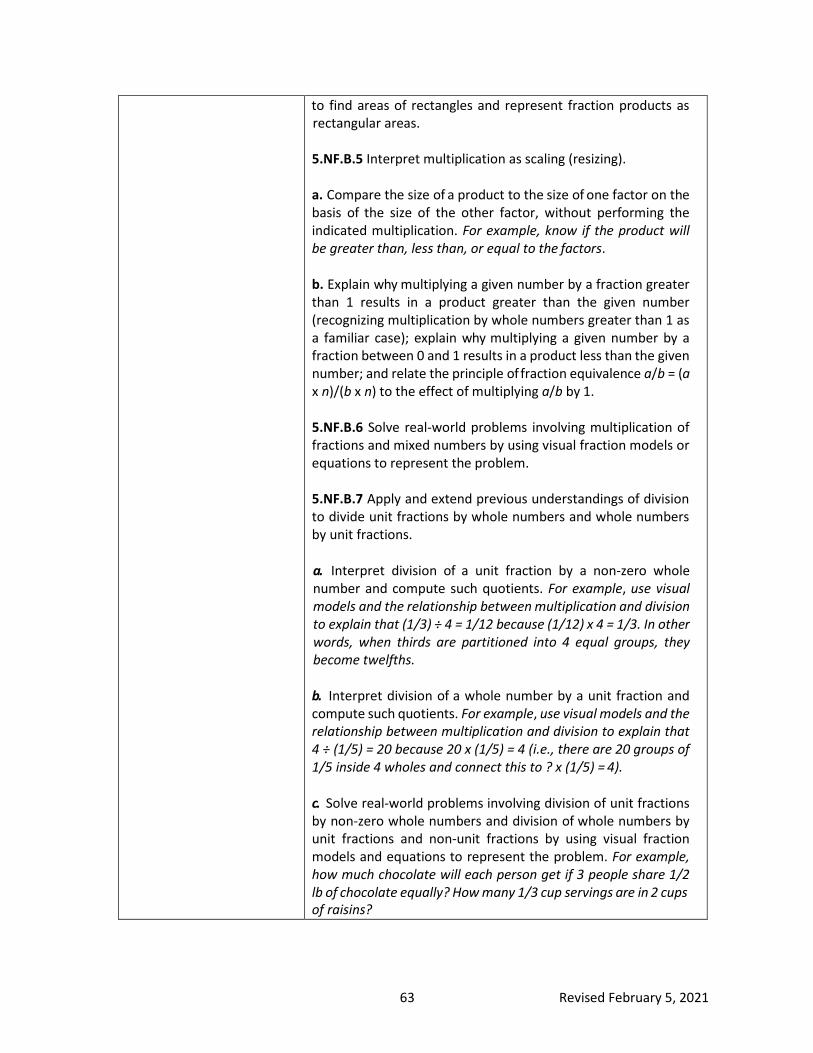
63 Revised February 5, 2021
to find areas of rectangles and represent fraction products as rectangular areas.
5.NF.B.5 Interpret multiplication as scaling (resizing).
a. Compare the size of a product to the size of one factor on the basis of the size of the other factor, without performing the indicated multiplication. For example, know if the product will be greater than, less than, or equal to the factors.
b. Explain why multiplying a given number by a fraction greater than 1 results in a product greater than the given number (recognizing multiplication by whole numbers greater than 1 as a familiar case); explain why multiplying a given number by a fraction between 0 and 1 results in a product less than the given number; and relate the principle of fraction equivalence a/b = (a x n)/(b x n) to the effect of multiplying a/b by 1.
5.NF.B.6 Solve real-world problems involving multiplication of fractions and mixed numbers by using visual fraction models or equations to represent the problem.
5.NF.B.7 Apply and extend previous understandings of division to divide unit fractions by whole numbers and whole numbers by unit fractions.
a. Interpret division of a unit fraction by a non-zero whole number and compute such quotients. For example, use visual models and the relationship between multiplication and division to explain that (1/3) ÷ 4 = 1/12 because (1/12) x 4 = 1/3. In other words, when thirds are partitioned into 4 equal groups, they become twelfths.
b. Interpret division of a whole number by a unit fraction and compute such quotients. For example, use visual models and the relationship between multiplication and division to explain that 4 ÷ (1/5) = 20 because 20 x (1/5) = 4 (i.e., there are 20 groups of 1/5 inside 4 wholes and connect this to ? x (1/5) = 4).
c. Solve real-world problems involving division of unit fractions by non-zero whole numbers and division of whole numbers by unit fractions and non-unit fractions by using visual fraction models and equations to represent the problem. For example, how much chocolate will each person get if 3 people share 1/2 lb of chocolate equally? How many 1/3 cup servings are in 2 cups of raisins?

64 Revised February 5, 2021
Measurement and Data (MD)
Cluster Headings Content Standards
A. Convert like measurement units within a given measurement system from a larger unit to a smaller unit.
5.MD.A.1 Convert customary and metric measurement units within a single system by expressing measurements of a larger unit in terms of a smaller unit. Use these conversions to solve multi-step real-world problems involving distances, intervals of time, liquid volumes, masses of objects, and money (including problems involving simple fractions or decimals). For example, 3.6 liters and 4.1 liters can be combined as 7.7 liters or 7700 milliliters.
B. Represent and interpret data.
5.MD.B.2 Make a line plot to display a data set of measurements in fractions of a unit (1/2, 1/4, 1/8). Use operations on fractions for this grade to solve problems involving information presented in line plots. For example, given different measurements of liquid in identical beakers, find the amount of liquid each beaker would contain if the total amount in all the beakers were redistributed equally.
C. Geometric measurement: understand concepts of volume and relate volume to multiplication and to addition.
5. MD.C.3 Recognize volume as an attribute of solid figures and understand concepts of volume measurement.
a. Understand that a cube with side length 1 unit, called a "unit cube," is said to have "one cubic unit" of volume and can be used to measure volume.
b. Understand that a solid figure which can be packed without gaps or overlaps using n unit cubes is said to have a volume of n cubic units.
5.MD.C.4 Measure volume by counting unit cubes, using cubic centimeters, cubic inches, cubic feet, and improvised units.
5.MD.C.5 Relate volume to the operations of multiplication and addition and solve real-world and mathematical problems involving volume of right rectangular prisms.
a. Find the volume of a right rectangular prism with whole- number side lengths by packing it with unit cubes and show that the volume is the same as would be found by multiplying the edge lengths, equivalently by multiplying the height by the area of the base. Represent whole-number products of three factors as volumes (e.g., to represent the associative property of multiplication).

65 Revised February 5, 2021
b. Know and apply the formulas V = l x w x h and V = B x h (where B represents the area of the base) for rectangular prisms with whole number edge lengths in the context of solving real-world and mathematical problems.
c. Recognize volume as additive. Find volumes of solid figures composed of two non-overlapping right rectangular prisms by adding the volumes of the non-overlapping parts, applying this technique to solve real-world problems.
Geometry (G)
Cluster Headings Content Standards
A. Graph points on the coordinate plane to solve real-world and mathe- matical problems.
5.G.A.1 Graph ordered pairs and label points using the first quadrant of the coordinate plane. Understand in the ordered pair that the first number indicates the horizontal distance traveled along the x-axis from the origin and the second number indicates the vertical distance traveled along the y-axis, with the convention that the names of the two axes and the coordinates correspond (e.g., x-axis and x- coordinate, y-axis and y- coordinate).
5.G.A.2 Represent real-world and mathematical problems by graphing points in the first quadrant of the coordinate plane and interpret coordinate values of points in the context of the situation.
B. Classify two- dimensional figures into categories based on their properties.
5.G.B.3 Classify two-dimensional figures in a hierarchy based on properties. Understand that attributes belonging to a category of two-dimensional figures also belong to all subcategories of that category. For example, all rectangles have four right angles and squares are rectangles, so all squares have four right angles.

66 Revised February 5, 2021

67 Revised February 5, 2021

68 Revised February 5, 2021

69 Revised February 5, 2021
Mathematics | Grade 6
The descriptions below provide an overview of the mathematical concepts and skills that students explore throughout the 6th grade.
Ratios and Proportional Relationships
6th grade begins the formal study of ratios and proportions. Students use reasoning about multiplication and division to solve ratio and rate problems about quantities. By viewing equivalent ratios and rates as deriving from, and extending, pairs of rows (or columns) in the multiplication table and by analyzing simple drawings that indicate the relative size of quantities, students connect their understanding of multiplication and division with ratios and rates.
Students expand the scope of problems for which they can use multiplication and division as they
connect ratios and fractions learning the similarities and the differences. Students solve a wide variety of problems involving ratios and rates. Proportional relationships are added and studied in the 7th grade and so such methods as cross multiplication should not be taught until 7th grade.
The Number System
Students make use of fractions and coupled with an understanding of the relationship between multiplication and division they learn to explain why the procedures for dividing fractions make sense. With this understanding, students are in a better position to use these operations to solve mathematical and real-world problems. Students also extend their previous understandings of numbers and the ordering of numbers to the full system of rational numbers, which includes negative rational numbers, and in particular negative integers. They reason about the order and absolute value of rational numbers and about the location of points in all four quadrants of the coordinate plane.
Expressions and Equations
Students begin to use properties of arithmetic operations systematically to work with numerical expressions that contain whole number exponents. Students come to understand more fully the use of variables and variable expressions. They write expressions and equations that correspond to given situations, evaluate expressions, and use expressions and formulas to solve problems. Students understand that expressions in different forms can be equivalent, and they use the properties of operations to rewrite expressions in equivalent forms. Students know that the solutions of an equation are the values of the variables that make the equation true. Students use properties of operations and the idea of maintaining the equality of both sides of an equation to solve simple one step equations. Students explore how algebraic expressions can represent written situations and generalize relationships from specific cases.

70 Revised February 5, 2021
Geometry
Students build on their work with area from earlier grades by reasoning about relationships among shapes to determine area, surface area, and volume. They find areas of right triangles, other triangles, and special quadrilaterals by decomposing these shapes, rearranging or removing pieces, and relating the shapes to rectangles. Using these methods, students discuss, develop, and justify formulas for areas of triangles and parallelograms. Students find areas of polygons and surface areas of prisms and pyramids by decomposing them into pieces whose area they can more easily determine. They reason about right rectangular prisms with fractional side lengths to extend formulas for the volume of a right rectangular prism to fractional side lengths. They prepare for work on scale drawings and constructions in the 7th grade by drawing polygons in the coordinate plane.
Statistics and Probability
6th grade students begin to formally develop their ability to think statistically. They understand that a set of data (collected to answer a question) will have a distribution, which can be described by its center, spread, and shape. Students calculate the median, mean, and mode and relate these to the overall shape of the distribution. They recognize that the median measures center in the sense that it is the middle value of the data and the mean measures center in that it is the numerical average of all the data points in the set. They understand that the mode refers to the most frequently occurring number found in a set of numbers and is found by collecting and organizing the data in order to count the frequency of each result. Students display, summarize and describe data sets, considering the context in which the data were collected. Students use dot plots, box plots, pie charts, and stem plots to display numerical data.
Standards for Mathematical Practice
Being successful in mathematics requires the development of approaches, practices, and habits
of mind that need to be in place as one strives to develop mathematical fluency, procedural skills, and conceptual understanding. The Standards for Mathematical Practice are meant to address these areas of expertise that teachers should seek to develop in their students. These approaches, practices, and habits of mind can be summarized as “processes and proficiencies” that successful mathematicians have as a part of their work in mathematics. Additional explanations are included in the main introduction of these standards.
Standards for Mathematical Practice
1. Make sense of problems and persevere in solving them. 2. Reason abstractly and quantitatively. 3. Construct viable arguments and critique the reasoning of others. 4. Model with mathematics. 5. Use appropriate tools strategically. 6. Attend to precision. 7. Look for and make use of structure. 8. Look for and express regularity in repeated reasoning.

71 Revised February 5, 2021
Literacy Standards for Mathematics
Communication in mathematics employs literacy skills in reading, vocabulary, speaking and listening, and writing. Mathematically proficient students communicate using precise terminology and multiple representations including graphs, tables, charts, and diagrams. By describing and contextualizing mathematics, students create arguments and support conclusions. They evaluate and critique the reasoning of others, analyze, and reflect on their own thought processes. Mathematically proficient students have the capacity to engage fully with mathematics in context by posing questions, choosing appropriate problem-solving approaches, and justifying solutions. Further explanations are included in the main introduction.
Literacy Skills for Mathematical Proficiency
1. Use multiple reading strategies. 2. Understand and use correct mathematical vocabulary. 3. Discuss and articulate mathematical ideas. 4. Write mathematical arguments.

72 Revised February 5, 2021
Ratios and Proportional Relationships (RP)
Cluster Headings Content Standards
A. Understand ratio concepts and use ratio reasoning to solve problems.
6.RP.A.1 Understand the concept of a ratio and use ratio language to describe a ratio relationship between two quantities. Make a distinction between ratios and fractions. For example, the ratio of wings to beaks in a bird house at the zoo was 2:1, because for every 2 wings there was 1 beak. Another example could be for every vote candidate A received, candidate C received nearly three votes.
6.RP.A.2 Understand the concept of a unit rate a/b associated with a ratio a:b with b ≠ 0. Use rate language in the context of a ratio relationship. For example, this recipe has a ratio of 3 cups of flour to 4 cups of sugar, so there is 3/4 cup of flour for each cup of sugar. Also, we paid $75 for 15 hamburgers, which is a rate of $5 per hamburger. (Expectations for unit rates in 6th
grade are limited to non-complex fractions).
6.RP.A.3 Use ratio and rate reasoning to solve real-world and mathematical problems (e.g., by reasoning about tables of equivalent ratios, tape diagrams, double number line diagrams, or equations).
a. Make tables of equivalent ratios relating quantities with whole number measurements, find missing values in the tables, and plot the pairs of values on the coordinate plane. Use tables to compare ratios.
b. Solve unit rate problems including those involving unit pricing and constant speed. For example, if a runner ran 10 miles in 90 minutes, running at that speed, how long will it take him to run 6 miles? How fast is he running in miles per hour?
c. Find a percent of a quantity as a rate per 100 (e.g., 30% of a quantity means 30/100 times the quantity); solve problems involving finding the whole, given a part and the percent.
d. Use ratio reasoning to convert customary and metric measurement units (within the same system); manipulate and transform units appropriately when multiplying or dividing quantities.

73 Revised February 5, 2021
The Number System (NS)
Cluster Headings Content Standards
A. Apply and extend previous understandings of multiplication and division to divide fractions by fractions.
6.NS.A.1 Interpret and compute quotients of fractions, and solve real-world and mathematical problems involving division of fractions by fractions (e.g., connecting visual fraction models and equations to represent the problem is suggested). For example, create a story context for (2/3) ÷ (3/4) and use a visual fraction model to show the quotient; use the relationship between multiplication and division to explain that (2/3) ÷ (3/4) = 8/9 because 3/4 times 8/9 is 2/3 ((a/b) ÷ (c/d) = ad/bc). Further example: How much chocolate will each person get if 3 people share 1/2 lb of chocolate equally? How wide is a rectangular strip of land with length 3/4 mi and area 1/2 square mi?
B. Compute fluently with multi-digit numbers and find common factors and multiples.
6.NS.B.2 Fluently divide multi-digit numbers using a standard algorithm.
6.NS.B.3 Fluently add, subtract, multiply, and divide multi-digit decimals using a standard algorithm and making connections to previous conceptual work with each operation.
6.NS.B.4 Find the greatest common factor of two whole numbers less than or equal to 100 and the least common multiple of two whole numbers less than or equal to 12. Use the distributive property to express a sum of two whole numbers 1–100 with a common factor as a multiple of a sum of two whole numbers with no common factor. For example, express 36 + 8 as 4 (9 + 2).

74 Revised February 5, 2021
C. Apply and extend previous understandings of numbers to the system of rational numbers.
6.NS.C.5 Understand that positive and negative numbers are used together to describe quantities having opposite directions or values (e.g., temperature above/below zero, elevation above/below sea level, credits/debits, positive/negative electric charge); use positive and negative numbers to represent quantities in real- world contexts, explaining the meaning of 0 in each situation as well as describing situations in which opposite quantities can combine to make 0.
6. NS.C.6 Understand a rational number as a point on the number line. Extend number line diagrams and coordinate axes familiar from previous grades to represent points on the line and in the plane with negative number coordinates.
a. Recognize opposite signs of numbers as indicating locations on opposite sides of 0 on the number line; recognize that the opposite of the opposite of a number is the number itself. For example, – (–3) = 3, and that 0 is its own opposite.
b. Understand signs of numbers in ordered pairs as indicating locations in quadrants of the coordinate plane; recognize that when two ordered pairs differ only by signs, the locations of the points are related by reflections across one or both axes.
c. Find and position integers and other rational numbers on a horizontal or vertical number line diagram; find and position pairs of integers and other rational numbers on a coordinate plane.
6.NS.C.7 Understand ordering and absolute value of rational numbers.
a. Interpret statements of inequality as statements about the relative position of two numbers on a number line diagram. For example, interpret –3 > –7 as a statement that –3 is located to the right of –7 on a number line oriented from left to right.
b. Write, interpret, and explain statements of order for rational numbers in real-world contexts. For example, write –3º C > –7º C to express the fact that –3º C is warmer than –7º C.
c. Understand the absolute value of a rational number as its distance from 0 on the number line and distinguish comparisons of absolute value from statements about order in a real-world context. For example, an account balance of -24 dollars represents a greater debt than an account balance - 14 dollars because -24 is located to the left of -14 on the number line.

75 Revised February 5, 2021
C. Apply and extend previous understandings of numbers to the system of rational numbers.
6.NS.C.8 Solve real-world and mathematical problems by graphing points in all four quadrants of the coordinate plane. Include use of coordinates and absolute value to find distances between points with the same first coordinate or the same second coordinate.
Expressions and Equations (EE)
Cluster Headings Content Standards
A. Apply and extend previous understandings of arithmetic to algebraic expressions.
6.EE.A.1 Write and evaluate numerical expressions involving whole-number exponents.
6. EE.A.2 Write, read, and evaluate expressions in which variables stand for numbers.
a. Write expressions that record operations with numbers and with variables. For example, express the calculation "Subtract y from 5" as 5 – y.
b. Identify parts of an expression using mathematical terms (sum, term, product, factor, quotient, coefficient); view one or more parts of an expression as a single entity. For example, describe the expression 2 (8 + 7) as a product of two factors; view (8 + 7) as both a single entity and a sum of two terms.
c. Evaluate expressions at specific values of their variables. Include expressions that arise from formulas used in real-world problems. Perform arithmetic operations, including those involving whole number exponents, in the conventional order when there are no parentheses to specify a particular order (Order of Operations).
6.EE.A.3 Apply the properties of operations (including, but not limited to, commutative, associative, and distributive properties) to generate equivalent expressions. (The distributive property of multiplication over addition is prominent here. Negative coefficients are not an expectation at this grade level.) For example, apply the distributive property to the expression 3 (2 + x) to produce the equivalent expression 6 + 3x; apply the distributive property to the expression 24x + 18y to produce the equivalent expression 6 (4x + 3y); apply properties of operations to y + y + y to produce the equivalent expression 3y.
6.EE.A.4 Identify when expressions are equivalent (i.e., when the expressions name the same number regardless of which value is

76 Revised February 5, 2021
substituted into them). For example, the expression 5b + 3b is equivalent to (5 +3) b, which is equivalent to 8b.
B. Reason about and solve one-variable equations and inequalities.
6.EE.B.5 Understand that a solution to an equation or inequality is the value(s) that makes that statement true. Use substitution to determine whether a given number in a specified set makes an equation or inequality true.
6.EE.B.6 Use variables to represent numbers and write expressions when solving real-world and mathematical problems; understand that a variable can represent an unknown number, or, depending on the purpose at hand, any number in a specified set.
6.EE.B.7 Solve real-world and mathematical problems by writing and solving one- step equations of the form x + p = q, px = q, x – p = q, and x/p = q for cases in which p, q, and x are all nonnegative rational numbers and p ≠ 0. (Complex fractions are not an expectation at this grade level.)
6.EE.B.8 Interpret and write an inequality of the form x > c, x < c, x ≤ c, or x ≥ c which represents a condition or constraint in a real-world or mathematical problem. Recognize that inequalities have infinitely many solutions; represent solutions of inequalities on number line diagrams.
C. Represent and analyze quantitative relationships between dependent and independent variables.
6. EE.C.9 Use variables to represent two quantities in a real- world problem that change in relationship to one another. For example, Susan is putting money in her savings account by depositing a set amount each week ($50). Represent her savings account balance with respect to the number of weekly deposits (s = 50w, illustrating the relationship between balance amount s and number of weeks w).
a. Write an equation in the form of y = px where y, p, and x are all non-negative and p ≠ 0, to express one quantity, thought of as the dependent variable, in terms of the other quantity, thought of as the independent variable.
b. Analyze the relationship between the dependent and independent variables using graphs and tables, and relate these to the equation.

77 Revised February 5, 2021
Geometry (G)
Cluster Headings Content Standards
A. Solve real-world and
6.G.A.1 Find the area of right triangles, other triangles, special quadrilaterals, and polygons by composing into rectangles or decomposing into triangles and other shapes; know and apply these techniques in the context of solving real-world and mathematical problems.
mathematical problems involving area, surface area, and volume.
6.G.A.2 Find the volume of a right rectangular prism with fractional edge lengths by packing it with unit cubes of the appropriate unit fraction edge lengths, and show that the volume is the same as would be found by multiplying the edge lengths of the prism. Apply the formulas V = lwh and V = Bh where B is the area of the base to find volumes of right rectangular prisms with fractional edge lengths in the context of solving real-world and mathematical problems.
6.G.A.3 Draw polygons in the coordinate plane given coordinates for the vertices; use coordinates to find the length of a side that joins two vertices (vertical or horizontal segments only). Apply these techniques in the context of solving real- world and mathematical problems.
6.G.A.4 Represent three-dimensional figures using nets made up of rectangles and triangles, and use the nets to find the surface area of these figures. Apply these techniques in the context of solving real-world and mathematical problems.
Statistics and Probability (SP)
Cluster Headings Content Standards
A. Develop understanding of statistical variability.
6.SP.A.1 Recognize a statistical question as one that anticipates variability in the data related to the question and accounts for it in the answers. For example, “How old am I?” is not a statistical question, but “How old are the students in my school?” is a statistical question because one anticipates variability in students’ ages.
6.SP.A.2 Understand that a set of data collected to answer a statistical question has a distribution which can be described by its measures of center (mean, median, mode), measures of variation (range only), and overall shape.
6.SP.A.3 Recognize that a measure of center (mean, median, mode) for a numerical data set summarizes all of its values with a single number, while a measure of variation describes how its values vary with a single number.

78 Revised February 5, 2021
B. Summarize and describe distributions.
6.SP.B.4 Display a single set of numerical data using dot plots (line plots), box plots, pie charts and stem plots.
6.SP.B.5 Summarize numerical data sets in relation to their context.
a. Report the number of observations.
b. Describe the nature of the attribute under investigation, including how it was measured and its units of measurement.
c. Give quantitative measures of center (median and/or mean) and variability (range) as well as describing any overall pattern with reference to the context in which the data were gathered.
d. Relate the choice of measures of center to the shape of the data distribution and the context in which the data were gathered.
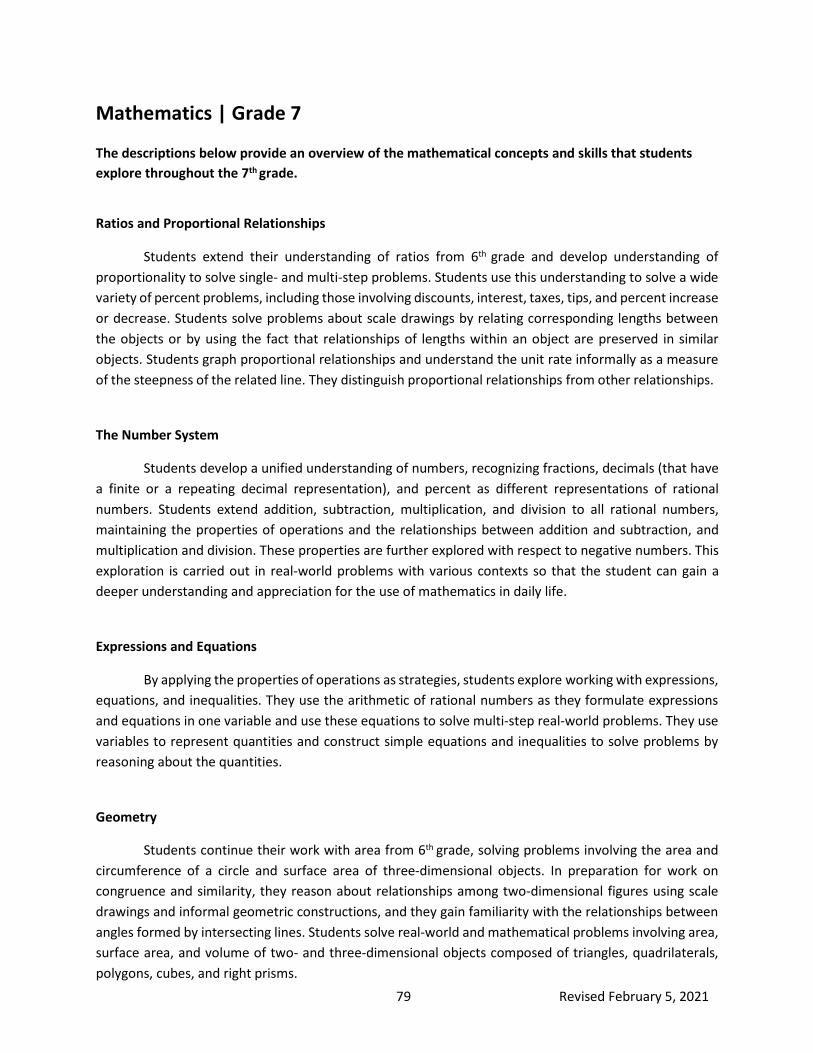
79 Revised February 5, 2021
Mathematics | Grade 7
The descriptions below provide an overview of the mathematical concepts and skills that students explore throughout the 7th grade.
Ratios and Proportional Relationships
Students extend their understanding of ratios from 6th grade and develop understanding of proportionality to solve single- and multi-step problems. Students use this understanding to solve a wide variety of percent problems, including those involving discounts, interest, taxes, tips, and percent increase or decrease. Students solve problems about scale drawings by relating corresponding lengths between the objects or by using the fact that relationships of lengths within an object are preserved in similar objects. Students graph proportional relationships and understand the unit rate informally as a measure of the steepness of the related line. They distinguish proportional relationships from other relationships.
The Number System
Students develop a unified understanding of numbers, recognizing fractions, decimals (that have a finite or a repeating decimal representation), and percent as different representations of rational numbers. Students extend addition, subtraction, multiplication, and division to all rational numbers, maintaining the properties of operations and the relationships between addition and subtraction, and multiplication and division. These properties are further explored with respect to negative numbers. This exploration is carried out in real-world problems with various contexts so that the student can gain a deeper understanding and appreciation for the use of mathematics in daily life.
Expressions and Equations
By applying the properties of operations as strategies, students explore working with expressions, equations, and inequalities. They use the arithmetic of rational numbers as they formulate expressions and equations in one variable and use these equations to solve multi-step real-world problems. They use variables to represent quantities and construct simple equations and inequalities to solve problems by reasoning about the quantities.
Geometry
Students continue their work with area from 6th grade, solving problems involving the area and circumference of a circle and surface area of three-dimensional objects. In preparation for work on congruence and similarity, they reason about relationships among two-dimensional figures using scale drawings and informal geometric constructions, and they gain familiarity with the relationships between angles formed by intersecting lines. Students solve real-world and mathematical problems involving area, surface area, and volume of two- and three-dimensional objects composed of triangles, quadrilaterals, polygons, cubes, and right prisms.

80 Revised February 5, 2021
Statistics and Probability
Students continue their work from 6th grade in order to build a strong foundation for statistics and probability needed for high school. Students understand that statistics can be used to gain information about a population through sampling. They work with drawing inferences about a population based on a sample and use measures of center and of variability to draw informal comparative inferences about two populations. Students investigate the chance processes and develop, use, and evaluate probability models. Students summarize numerical data sets with respect to their context using quantitative measures and describe any overall patterns or deviations from the overall pattern.
Standards for Mathematical Practice
Being successful in mathematics requires the development of approaches, practices, and habits
of mind that need to be in place as one strives to develop mathematical fluency, procedural skills, and conceptual understanding. The Standards for Mathematical Practice are meant to address these areas of expertise that teachers should seek to develop in their students. These approaches, practices, and habits of mind can be summarized as “processes and proficiencies” that successful mathematicians have as a part of their work in mathematics. Additional explanations are included in the main introduction of these standards.
Standards for Mathematical Practice
1. Make sense of problems and persevere in solving them. 2. Reason abstractly and quantitatively. 3. Construct viable arguments and critique the reasoning of others. 4. Model with mathematics. 5. Use appropriate tools strategically. 6. Attend to precision. 7. Look for and make use of structure. 8. Look for and express regularity in repeated reasoning.
Literacy Standards for Mathematics
Communication in mathematics employs literacy skills in reading, vocabulary, speaking and
listening, and writing. Mathematically proficient students communicate using precise terminology and multiple representations including graphs, tables, charts, and diagrams. By describing and contextualizing mathematics, students create arguments and support conclusions. They evaluate and critique the reasoning of others, analyze, and reflect on their own thought processes. Mathematically proficient students have the capacity to engage fully with mathematics in context by posing questions, choosing appropriate problem-solving approaches, and justifying solutions. Further explanations are included in the main introduction.

81 Revised February 5, 2021
Literacy Skills for Mathematical Proficiency
1. Use multiple reading strategies. 2. Understand and use correct mathematical vocabulary. 3. Discuss and articulate mathematical ideas. 4. Write mathematical arguments.
Ratios and Proportional Relationships (RP)
Cluster Headings Content Standards
A. Analyze proportional relationships and use them to solve real-world and mathematical problems.
7.RP.A.1 Compute unit rates associated with ratios of fractions, including ratios of lengths, areas, and other quantities measured in like or different units. For example, if a person walks 1/2 mile in each 15 minutes, compute the unit rate as the complex fraction (1/2) / (1/4) miles per hour, equivalently 2 miles per hour.
7.RP.A.2 Recognize and represent proportional relationships between quantities.
a. Decide whether two quantities are in a proportional relationship (e.g., by testing for equivalent ratios in a table or graphing on a coordinate plane and observing whether the graph is a straight line through the origin).
b. Identify the constant of proportionality (unit rate) in tables, graphs, equations, diagrams, and verbal descriptions of proportional relationships.
c. Use the concept of equality to represent proportional relationships with equations. For example, if total cost t is proportional to the number n of items purchased at a constant price p, the relationship between the total cost and the number of items can be expressed as t = pn.
d. Explain what a point (x, y) on the graph of a proportional relationship means in terms of the situation, with special attention to the points (0, 0) and (1, r) where r is the unit rate.
7.RP.A.3 Use proportional relationships to solve multi-step ratio and percent problems. Examples: batting averages, recipes, simple interest, tax, markups and markdowns, gratuities and commissions, fees, percent increase and decrease, percent error, etc.

82 Revised February 5, 2021
The Number System (NS)
Cluster Headings Content Standards
A. Apply and extend previous understandings of operations with fractions to add, subtract, multiply, and divide rational numbers.
7. NS.A.1 Apply and extend previous understandings of addition and subtraction to add and subtract rational numbers; represent addition and subtraction on a horizontal or vertical number line diagram.
a. Understand p + q as the number located a distance |q| from p, in the positive or negative direction depending on whether q is positive or negative. Show that a number and its opposite have a sum of 0 (are additive inverses). Interpret sums of rational numbers by describing real- world contexts.
b. Understand subtraction of rational numbers as adding the additive inverse, p – q = p + (–q). Show that the distance between two rational numbers on the number line is the absolute value of their difference, and apply this principle in real-world contexts.
c. Apply properties of operations as strategies to add and subtract rational numbers.
7. NS.A.2 Apply and extend previous understandings of multiplication and division and of fractions to multiply and divide rational numbers.
a. Understand that multiplication is extended from fractions to all rational numbers by requiring that operations continue to satisfy the properties of operations, particularly the distributive property, leading to products such as (–1)(–1) = 1 and the rules for multiplying signed numbers. Interpret products of rational numbers by describing real-world contexts.
b. Understand that integers can be divided, provided that the divisor is not zero, and every quotient of integers (with non- zero divisor) is a rational number. If p and q are integers, then –(p/q) = (–p)/q = p/(–q). Interpret quotients of rational numbers by describing real-world contexts.
c. Apply properties of operations as strategies to multiply and divide rational numbers.
d. Convert a rational number to a decimal using long division; know that the decimal form of a rational number terminates or eventually repeats.

83 Revised February 5, 2021
7.NS.A.3 Solve real-world and mathematical problems involving the four operations with rational numbers. (Computations with rational numbers extend the rules for manipulating fractions to complex fractions.)
Expressions and Equations (EE)
Cluster Headings Content Standards
A. Use properties of operations to generate equivalent expressions.
7.EE.A.1 Apply properties of operations as strategies to add, subtract, factor, and expand linear expressions with rational coefficients.
7.EE.A.2 Rewrite and connect equivalent expressions in different forms in a contextual problem to provide multiple ways of interpreting the problem and investigating how the quantities in it are related. For example, shoes are on sale at a 25% discount. How is the discounted price P related to the original cost C of the shoes? C – 0.25C = P. In other words, P is 75% of the original cost since C – 0.25C can be written as 0.75C.
B. Solve real-world and mathematical problems using numerical and algebraic expressions and equations and inequalities.
7. EE.B.3 Solve multi-step real-world and mathematical problems posed with positive and negative rational numbers presented in any form (whole numbers, fractions, and decimals).
a. Apply properties of operations to calculate with numbers in any form; convert between forms as appropriate.
b. Assess the reasonableness of answers using mental computation and estimation strategies.
7.EE.B.4 Use variables to represent quantities in a real-world and mathematical problem, and construct simple equations and inequalities to solve problems by reasoning about the quantities.
a. Solve real-world and mathematical problems leading to equations of the form px + q = r and p(x + q) = r where p, q, and r are specific rational numbers. Solve equations of these forms fluently. Compare an algebraic solution to an arithmetic solution, identifying the sequence of the operations used in each approach. For example, the perimeter of a rectangle is 54 cm. Its length is 6 cm. What is its width?
b. Solve real-world and mathematical problems leading to inequalities of the form px + q > r, px + q < r, px + q ≥ r, and px + q ≤ r, where p, q, and r are specific rational numbers. Graph

84 Revised February 5, 2021
the solution set of the inequality on a number line and interpret it in the context of the problem. For example: As a salesperson, you are paid $50 per week plus $3 per sale. This week you want your pay to be at least $100. Write an inequality for the number of sales you need to make, and describe the solutions.
Geometry (G)
Cluster Headings Content Standards
A. Draw, construct, and describe geometrical figures and describe the relationships between them.
7.G.A.1 Solve problems involving scale drawings of congruent and similar geometric figures, including computing actual lengths and areas from a scale drawing and reproducing a scale drawing at a different scale.
7.G.A.2 Draw triangles with given conditions: three angle measures or three side measures. Notice when the conditions determine a unique triangle, more than one triangle, or no triangle.
B. Solve real-world and mathematical problems involving angle measure, area, surface area, and volume.
7.G.B.3 Know the formulas for the area and circumference of a circle and use them to solve problems. Explore the relationships between the radius, the circumference, and the area of a circle, and the number π.
7.G.B.4 Know and use facts about supplementary, complementary, vertical, and adjacent angles in a multi-step problem to write and solve simple equations for an unknown angle in a figure. 7.G.B.5 Solve real-world and mathematical problems involving area of two-dimensional figures composed of triangles, quadrilaterals, and polygons, and volume and surface area of three-dimensional objects composed of cubes and right prisms.
Statistics and Probability (SP)
Cluster Headings Content Standards
A. Use random sampling to draw inferences about a population.
7.SP.A.1 Explore how statistics can be used to gain information about a population by examining a sample of the population; generalizations about a population from a sample are valid only if the sample is representative of that population. Understand that random sampling tends to produce representative samples and support valid inferences.

85 Revised February 5, 2021
7.SP.A.2 Collect and use data from a random sample to draw inferences about a population with an unknown characteristic of interest. Generate multiple samples (or simulated samples) of the same size to gauge the variation in estimates or predictions. For example, estimate the mean word length in a book by randomly sampling words from the book; predict the winner of a school election based on randomly sampled survey data. Gauge how far off the estimate or prediction might be.
B. Draw informal comparative inferences about two populations.
7.SP.B.3 Informally compare the measures of center (mean, median, mode) of two numerical data distributions with similar variabilities. For example, the mean height of players on the basketball team is 10 cm greater than the mean height of players on the soccer team; on a dot plot or box plot, the separation between the two distributions of heights is noticeable.
7.SP.B.4 Use measures of center and measures of variability for numerical data from random samples to draw informal comparative inferences about two populations. For example, decide whether the words in a chapter of a 7th grade science book are generally longer than the words in a chapter of a 4th
grade science book.
C. Investigate chance processes and develop, use, and evaluate probability models.
7.SP.C.5 Recognize that the probability of a chance event is a number between 0 and 1 and interpret the likelihood of the event occurring.
7. SP.C.6 Calculate theoretical and experimental probability of simple events.
a. Approximate the probability of a chance event by collecting data on the chance process that produces it and observing its long-run relative frequency, and predict the approximate relative frequency given the probability.
b. Calculate the theoretical probability of a simple event.
c. Compare theoretical probabilities to experimental probabilities; explain any possible sources of discrepancy. For example, when rolling a number cube 600 times, predict that a 3 or 6 would be rolled roughly 200 times, but probably not exactly 200 times.
7.SP.C.7 Develop a probability model and use it to find experimental or theoretical probabilities of events.

86 Revised February 5, 2021
a. Use a uniform probability model, with equal probability assigned to all outcomes, to determine probabilities of events. For example, if a student is selected at random from a class, find the probability that Jane will be selected and the probability that a girl will be selected.
b. Develop a probability model, including non-uniform models, by observing frequencies in data generated from a chance process. Use the model to estimate the probabilities of events. For example, find the approximate probability that a spinning penny will land heads up or that a tossed paper cup will land open end down. Do the outcomes for the spinning penny appear to be equally likely based on the observed frequencies?
D. Summarize and describe numerical data sets.
7. SP.D.8 Summarize a numerical data set in relation to its context.
a. Give quantitative measures of center (median and/or mean) and variability (range and/or interquartile range), as well as describe any overall pattern and any striking deviations from the overall pattern with reference to the context in which the data were gathered.
b. Relate and understand the choice of measures of center (median and/or mean) and variability (range and/or interquartile range) to the shape of the data distribution and the context in which the data were gathered.
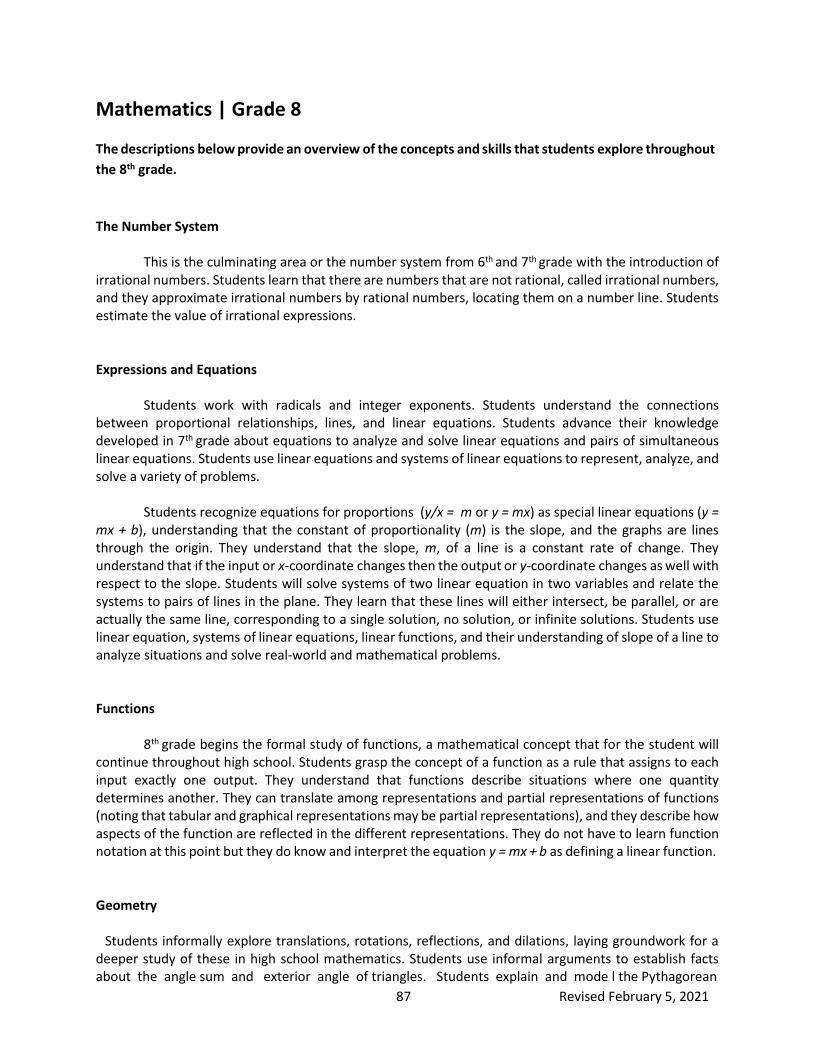
87 Revised February 5, 2021
Mathematics | Grade 8
The descriptions below provide an overview of the concepts and skills that students explore throughout the 8th grade.
The Number System
This is the culminating area or the number system from 6th and 7th grade with the introduction of irrational numbers. Students learn that there are numbers that are not rational, called irrational numbers, and they approximate irrational numbers by rational numbers, locating them on a number line. Students estimate the value of irrational expressions.
Expressions and Equations
Students work with radicals and integer exponents. Students understand the connections between proportional relationships, lines, and linear equations. Students advance their knowledge developed in 7th grade about equations to analyze and solve linear equations and pairs of simultaneous linear equations. Students use linear equations and systems of linear equations to represent, analyze, and solve a variety of problems.
Students recognize equations for proportions (y/x = m or y = mx) as special linear equations (y =
mx + b), understanding that the constant of proportionality (m) is the slope, and the graphs are lines through the origin. They understand that the slope, m, of a line is a constant rate of change. They understand that if the input or x-coordinate changes then the output or y-coordinate changes as well with respect to the slope. Students will solve systems of two linear equation in two variables and relate the systems to pairs of lines in the plane. They learn that these lines will either intersect, be parallel, or are actually the same line, corresponding to a single solution, no solution, or infinite solutions. Students use linear equation, systems of linear equations, linear functions, and their understanding of slope of a line to analyze situations and solve real-world and mathematical problems.
Functions
8th grade begins the formal study of functions, a mathematical concept that for the student will continue throughout high school. Students grasp the concept of a function as a rule that assigns to each input exactly one output. They understand that functions describe situations where one quantity determines another. They can translate among representations and partial representations of functions (noting that tabular and graphical representations may be partial representations), and they describe how aspects of the function are reflected in the different representations. They do not have to learn function notation at this point but they do know and interpret the equation y = mx + b as defining a linear function.
Geometry
Students informally explore translations, rotations, reflections, and dilations, laying groundwork for a deeper study of these in high school mathematics. Students use informal arguments to establish facts about the angle sum and exterior angle of triangles. Students explain and mode l the Pythagorean

88 Revised February 5, 2021
Theorem and its converse. They apply the Pythagorean Theorem to find distances between points on the coordinate plane and to find side lengths in right triangles. Students work with volume by solving problems involving cones, cylinders, and spheres.
Statistics and Probability
Students extend their knowledge from 7th grade by working with scatter plots for bivariate measurement data and understand linear associations and the use of linear models to solve problems interpreting the slope and intercept. Students will assess models by informally fitting a straight line and judging the closeness of the data points to the line. Students continue their work with probability from 6th
and 7th grade by finding probability of compound events and represent the data using organized lists, tables, and tree diagrams.
Standards for Mathematical Practice
Being successful in mathematics requires the development of approaches, practices, and habits
of mind that need to be in place as one strives to develop mathematical fluency, procedural skills, and conceptual understanding. The Standards for Mathematical Practice are meant to address these areas of expertise that teachers should seek to develop in their students. These approaches, practices, and habits of mind can be summarized as “processes and proficiencies” that successful mathematicians have as a part of their work in mathematics. Additional explanations are included in the main introduction of these standards.
Standards for Mathematical Practice
1. Make sense of problems and persevere in solving them. 2. Reason abstractly and quantitatively. 3. Construct viable arguments and critique the reasoning ofothers. 4. Model with mathematics. 5. Use appropriate tools strategically. 6. Attend to precision. 7. Look for and make use of structure. 8. Look for and express regularity in repeated reasoning.
Literacy Standards for Mathematics
Communication in mathematics employs literacy skills in reading, vocabulary, speaking and
listening, and writing. Mathematically proficient students communicate using precise terminology and multiple representations including graphs, tables, charts, and diagrams. By describing and contextualizing mathematics, students create arguments and support conclusions. They evaluate and critique the reasoning of others, analyze, and reflect on their own thought processes. Mathematically proficient students have the capacity to engage fully with mathematics in context by posing questions, choosing appropriate problem-solving approaches, and justifying solutions. Further explanations are included in the main introduction.

89 Revised February 5, 2021
Literacy Skills for Mathematical Proficiency
1. Use multiple reading strategies. 2. Understand and use correct mathematical vocabulary. 3. Discuss and articulate mathematical ideas. 4. Write mathematical arguments.
The Number System (NS)
Cluster Headings Content Standards
A. Know that there are numbers that are not rational, and approximate them by rational numbers.
8.NS.A.1 Know that real numbers that are not rational are called irrational (e.g., π, √2, etc.). Understand informally that every number has a decimal expansion; for rational numbers show that the decimal expansion repeats eventually or terminates, and convert a decimal expansion which repeats eventually or terminates into a rational number.
8.NS.A.2 Use rational approximations of irrational numbers to compare the size of irrational numbers by locating them approximately on a number line diagram. Estimate the value of irrational expressions (such as π2). For example, by truncating the decimal expansion of √2, show that √2 is between 1 and 2, then between 1.4 and 1.5, and explain how to continue on to get better approximations.

90 Revised February 5, 2021
Expressions and Equations (EE)
Cluster Headings Content Standards
A. Work with radicals and integer exponents.
8.EE.A.1 Know and apply the properties of integer exponents to generate equivalent numerical expressions. For example, 32 x 3-
5 = 3-3 = 1/33 = 1/27.
8.EE.A.2 Use square root and cube root symbols to represent solutions to equations of the form x2 = p and x3 = p, where p is a positive rational number. Evaluate square roots of small perfect squares and cube roots of small perfect cubes.
8.EE.A.3 Use numbers expressed in the form of a single digit times an integer power of 10 to estimate very large or very small quantities and to express how many times as much one is than the other. For example, estimate the population of the United States as 3 x 10⁸ and the population of the world as 7 x 10⁹, and determine that the world population is more than 20 times larger.
8.EE.A.4 Using technology, solve real-world problems with numbers expressed in decimal and scientific notation. Use scientific notation and choose units of appropriate size for measurements of very large or very small quantities (e.g., use millimeters per year for seafloor spreading).
B. Understand the connections between proportional relationships, lines, and linear equations.
8.EE.B.5 Graph proportional relationships, interpreting the unit rate as the slope of the graph. Compare two different proportional relationships represented in different ways. For example, compare a distance-time graph to a distance-time equation to determine which of two moving objects has greater speed.
8.EE.B.6 Use similar triangles to explain why the slope m is the same between any two distinct points on a non-vertical line in the coordinate plane; know and apply the equation y = mx for a line through the origin and the equation y = mx + b for a line intercepting the vertical axis at b.

91 Revised February 5, 2021
C. Analyze and solve linear equations, linear inequalities, and systems of two linear equations.
8.EE.C.7 Solve linear equations in one variable.
a. Give examples of linear equations in one variable with one solution, infinitely many solutions, or no solutions. Show which of these possibilities is the case by successively transforming the given equation into simpler forms, until an equivalent equation of the form x = a, a = a, or a = b results (where a and b are different numbers).
b. Solve linear equations with rational number coefficients, including equations whose solutions require expanding expressions using the distributive property and combining like terms.
8. EE.C.8 Analyze and solve systems of two linear equations graphically.
a. Understand that solutions to a system of two linear equations in two variables correspond to points of intersection of their graphs, because points of intersection satisfy both equations simultaneously.
b. Estimate solutions by graphing a system of two linear equations in two variables. Identify solutions by inspecting graphs.
8.EE.C.9 By graphing on the coordinate plane or by analyzing a given graph, determine the solution set of a linear inequality in one or two variables.

92 Revised February 5, 2021
Functions (F)
Cluster Headings Content Standards
A. Define, evaluate, and compare functions.
8.F.A.1 Understand that a function is a rule that assigns to each input exactly one output. The graph of a function is the set of ordered pairs consisting of an input and the corresponding output. (Function notation is not required in 8th grade.)
8.F.A.2 Compare properties of two functions each represented in a different way (algebraically, graphically, numerically in tables, or by verbal descriptions). For example, given a linear function represented by a table of values and another linear function represented by an algebraic expression, determine which function has the greater rate of change.
8.F.A.3 Know and interpret the equation y = mx + b as defining a linear function, whose graph is a straight line; give examples of functions that are not linear. For example, the function A = s2
giving the area of a square as a function of its side length is not linear because its graph contains the points (1,1), (2,4) and (3,9), which are not on a straight line.
B. Use functions to model relationships between quantities.
8.F.B.4 Construct a function to model a linear relationship between two quantities. Determine the rate of change and initial value of the function from a description of a relationship or from two (x, y) values, including reading these from a table or from a graph. Interpret the rate of change and initial value of a linear function in terms of the situation it models and in terms of its graph or a table of values.
8.F.B.5 Describe qualitatively the functional relationship between two quantities by analyzing a graph (e.g., where the function is increasing or decreasing, linear or nonlinear). Sketch a graph that exhibits the qualitative features of a function that has been described verbally.

93 Revised February 5, 2021
Geometry (G)
Cluster Headings Content Standards
A. Understand and describe the effects of transformations on two- dimensional figures and use informal arguments to establish facts about angles.
8.G.A.1 Describe the effect of translations, rotations, reflections, and dilations on two-dimensional figures using coordinates.
a. Verify informally that lines are taken to lines, and determine when line segments are taken to line segments of the same length.
b. Verify informally that angles are taken to angles of the same measure.
c. Verify informally that parallel lines are taken to parallel lines.
d. Make connections between dilations and scale factors.
8.G.A.2 Use informal arguments to establish facts about the angle sum and exterior angle of triangles, about the angles created when parallel lines are cut by a transversal, and the angle-angle criterion for similarity of triangles.
B. Understand and apply the Pythagorean Theorem.
8.G.B.3 Explain a model of the Pythagorean Theorem and its converse.
8.G.B.4 Know and apply the Pythagorean Theorem to determine unknown side lengths in right triangles in real-world and mathematical problems in two and three dimensions.
8.G.B.5 Apply the Pythagorean Theorem to find the distance between two points in a coordinate system.
C. Solve real-world and mathematical problems involving volume of cylinders, cones, and spheres.
8.G.C.6 Apply the formulas for the volumes of cones, cylinders, and spheres to solve real-world and mathematical problems.

94 Revised February 5, 2021
Statistics and Probability (SP)
Cluster Headings Content Standards
A. Investigate patterns of association in bivariate data.
8.SP.A.1 Construct and interpret scatter plots for bivariate measurement data to investigate patterns of association between two quantities. Describe patterns such as clustering, outliers, positive or negative association, linear association, and nonlinear association.
8.SP.A.2 Know that straight lines are widely used to model linear relationships between two quantitative variables. For scatter plots that suggest a linear association, informally fit a straight line and informally assess the model fit by judging the closeness of the data points to the line.
8.SP.A.3 Use the equation of a linear model to solve problems in the context of bivariate measurement data, interpreting the slope and intercepts. For example, in a linear model for a biology experiment, interpret a slope of 1.5 cm/hr as meaning that an additional hour of sunlight each day is associated with an additional 1.5 cm in mature plant height.
B. Investigate chance processes and develop, use, and evaluate probability models.
8. SP.B.4 Find probabilities of and represent sample spaces for compound events using organized lists, tables, tree diagrams, and simulation.
a. Understand that, just as with simple events, the probability of a compound event is the fraction of outcomes in the sample space for which the compound event occurs.
b. Represent sample spaces for compound events using methods such as organized lists, tables, and tree diagrams. For an event described in everyday language (e.g., "rolling double sixes"), identify the outcomes in the sample space which compose the event.

95 Revised February 5, 2021
Algebra I |A1
Algebra 1 is the initial math course for high school students. It provides the foundation students require for future success in mathematics. Algebra 1 emphasizes linear and quadratic expressions, equations, inequalities, and functions. The course also introduces students to absolute value functions and exponential functions with integer exponents, especially as they compare to linear and quadratic functions. Additionally, students will work to summarize, represent, and interpret statistical data.
Throughout the course, students explore the structures of and interpret functions and other
mathematical models. Algebra 1 topics will build upon previous knowledge requiring students to reason, solve, and represent mathematical concepts in multiple ways; i.e., graphically, numerically, and algebraically. Modeling and real-world problems are introduced throughout the course with standards written to encourage the use of math to answer problems students will encounter in life.
Mathematical Modeling
Mathematical Modeling is a Standard for Mathematical Practice (MP4) and a Conceptual
Category. Specific modeling standards appear throughout the high school standards indicated with a star (*). Where an entire domain is marked with a star, each standard in that domain is a modeling standard.
Standards for Mathematical Practice
Being successful in mathematics requires the development of approaches, practices, and habits
of mind that need to be in place as one strives to develop mathematical fluency, procedural skills, and conceptual understanding. The Standards for Mathematical Practice are meant to address these areas of expertise that teachers should seek to develop in their students. These approaches, practices, and habits of mind can be summarized as “processes and proficiencies” that successful mathematicians have as a part of their work in mathematics. Additional explanations are included in the main introduction of these standards.
Standards for Mathematical Practice
1. Make sense of problems and persevere in solving them. 2. Reason abstractly and quantitatively. 3. Construct viable arguments and critique the reasoning of others. 4. Model with mathematics. 5. Use appropriate tools strategically. 6. Attend to precision. 7. Look for and make use of structure. 8. Look for and express regularity in repeated reasoning.

96 Revised February 5, 2021
Literacy Standards for Mathematics
Communication in mathematics employs literacy skills in reading, vocabulary, speaking and listening, and writing. Mathematically proficient students communicate using precise terminology and multiple representations including graphs, tables, charts, and diagrams. By describing and contextualizing mathematics, students create arguments and support conclusions. They evaluate and critique the reasoning of others, analyze, and reflect on their own thought processes. Mathematically proficient students have the capacity to engage fully with mathematics in context by posing questions, choosing appropriate problem-solving approaches, and justifying solutions. Further explanations are included in the main introduction.
Literacy Skills for Mathematical Proficiency
1. Use multiple reading strategies. 2. Understand and use correct mathematical vocabulary. 3. Discuss and articulate mathematical ideas. 4. Write mathematical arguments.
Number and Quantity
Quantities * (N.Q)
Cluster Headings Content Standards Scope & Clarifications
A. Reason quantitatively and use units to understand problems.
A1.N.Q.A.1 Use units as a way to understand real-world problems.*
a. Choose and interpret the scale and the origin in graphs and data displays.*
b. Use appropriate quantities in formulas, converting units as necessary.*
c. Define and justify appropriate quantities within a context for the purpose of modeling.*
d. Choose an appropriate level of accuracy when reporting quantities.*
Apply this standard to any real-world problems studied within the scope of this course.
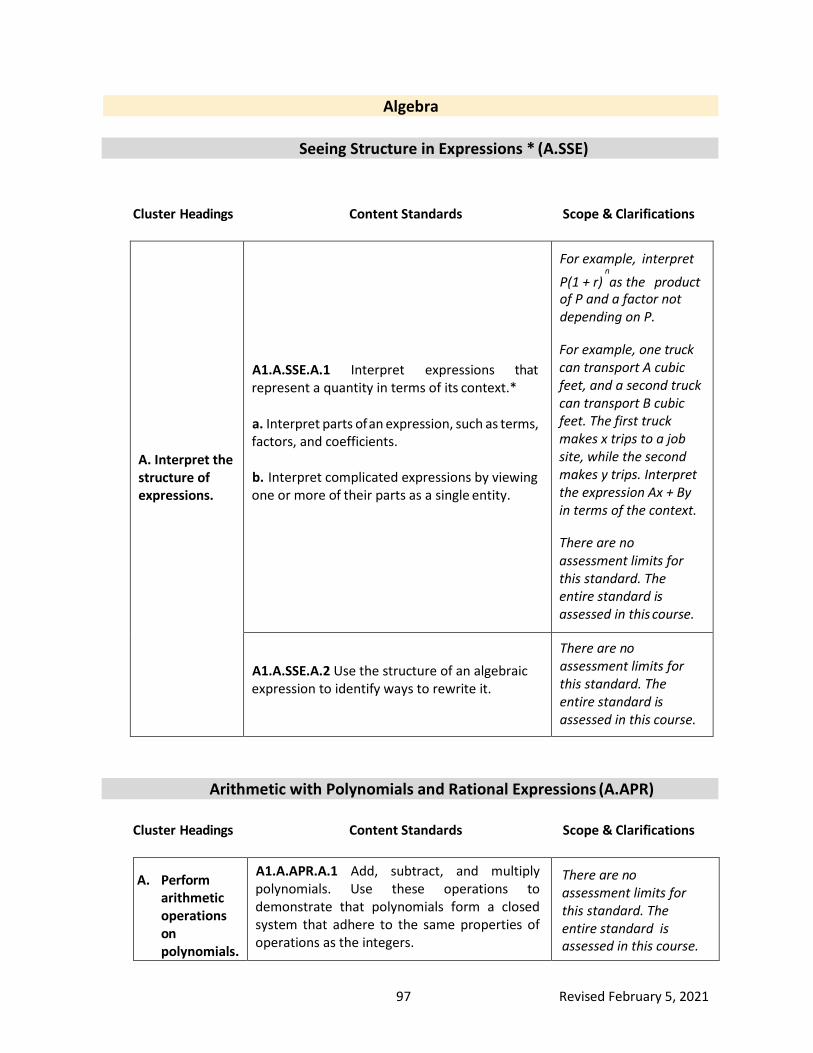
97 Revised February 5, 2021
Algebra
Seeing Structure in Expressions * (A.SSE)
Cluster Headings Content Standards Scope & Clarifications
A. Interpret the structure of expressions.
A1.A.SSE.A.1 Interpret expressions that represent a quantity in terms of its context.*
a. Interpret parts of an expression, such as terms, factors, and coefficients.
b. Interpret complicated expressions by viewing one or more of their parts as a single entity.
For example, interpret n
P(1 + r) as the product of P and a factor not depending on P.
For example, one truck can transport A cubic feet, and a second truck can transport B cubic feet. The first truck makes x trips to a job site, while the second makes y trips. Interpret the expression Ax + By in terms of the context.
There are no assessment limits for this standard. The entire standard is assessed in this course.
A1.A.SSE.A.2 Use the structure of an algebraic expression to identify ways to rewrite it.
There are no assessment limits for this standard. The entire standard is assessed in this course.
Arithmetic with Polynomials and Rational Expressions (A.APR)
Cluster Headings Content Standards Scope & Clarifications
A. Perform arithmetic operations on polynomials.
A1.A.APR.A.1 Add, subtract, and multiply polynomials. Use these operations to demonstrate that polynomials form a closed system that adhere to the same properties of operations as the integers.
There are no assessment limits for this standard. The entire standard is assessed in this course.
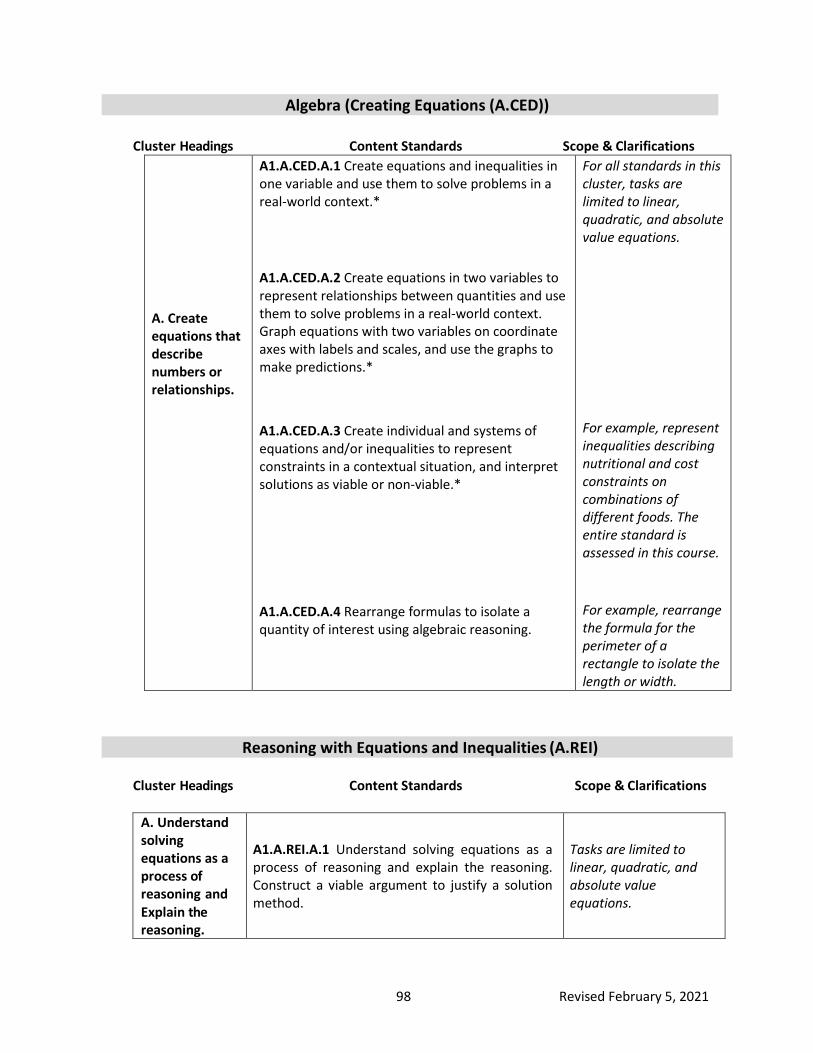
98 Revised February 5, 2021
Algebra (Creating Equations (A.CED))
Cluster Headings Content Standards Scope & Clarifications A. Create equations that describe numbers or relationships.
A1.A.CED.A.1 Create equations and inequalities in one variable and use them to solve problems in a real-world context.* A1.A.CED.A.2 Create equations in two variables to represent relationships between quantities and use them to solve problems in a real-world context. Graph equations with two variables on coordinate axes with labels and scales, and use the graphs to make predictions.* A1.A.CED.A.3 Create individual and systems of equations and/or inequalities to represent constraints in a contextual situation, and interpret solutions as viable or non-viable.* A1.A.CED.A.4 Rearrange formulas to isolate a quantity of interest using algebraic reasoning.
For all standards in this cluster, tasks are limited to linear, quadratic, and absolute value equations. For example, represent inequalities describing nutritional and cost constraints on combinations of different foods. The entire standard is assessed in this course. For example, rearrange the formula for the perimeter of a rectangle to isolate the length or width.
Reasoning with Equations and Inequalities (A.REI)
Cluster Headings Content Standards Scope & Clarifications
A. Understand solving equations as a process of reasoning and Explain the reasoning.
A1.A.REI.A.1 Understand solving equations as a process of reasoning and explain the reasoning. Construct a viable argument to justify a solution method.
Tasks are limited to linear, quadratic, and absolute value equations.

99 Revised February 5, 2021
B. Solve equations and inequalities in one variable.
A1.A.REI.B.2 Solve linear and absolute value equations and inequalities in one variable.
a. Solve linear equations and inequalities, including compound inequalities, in one variable. Represent solutions algebraically and graphically.
b. Solve absolute value equations and inequalities in one variable. Represent solutions algebraically and graphically.
Equations and inequalities should include integer, rational, and/or irrational coefficients. If coefficients are irrational, rationalization of a denominator is not required. Tasks may or may not have a real- world context.
There are no assessment limits for this standard. The entire standard is assessed in this course.
A1.A.REI.B.3 Solve quadratic equations and inequalities in one variable.
a. Solve quadratic equations by inspection (e.g., for x2 = 49), taking square roots, knowing and applying the quadratic formula, and factoring, as appropriate to the initial form of the equation. Recognize when a quadratic equation has solutions that are not real numbers.
b. Solve quadratic inequalities using the graph of the related quadratic equation.
Tasks may or may not have a real-world context.
C. Solve systems of equations.
A1.A.REI.C.4 Write and solve a system of linear equations in real-world context.*
Systems are limited to at most two equations in two unknowns.

100 Revised February 5, 2021
D. Represent and solve equations and inequalities graphically.
A1.A.REI.D.5 Understand that the graph of an equation in two variables is the set of all its solutions plotted in the coordinate plane, often forming a curve (which could be a line).
There are no assessment limits for this standard. The entire standard is assessed in this course.
A1.A.REI.D.6 Explain why the x-coordinates of the points where the graphs of the equations y = f(x) and y = g(x) intersect are the solutions of the equation f(x) = g(x). Find approximate solutions by graphing the functions or making a table of values, using technology when appropriate.*
Include cases where f(x) and/or g(x) are linear, quadratic, absolute value, and exponential functions. For example, f(x) = 3x + 5 and g(x) = x2 + 1.
When finding solutions approximately, students may be expected to produce graphs of functions that are linear, quadratic, exponential, or absolute value, but may be given graphs of other function types. Exponential functions are limited to domains in the integers.
A1.A.REI.D.7 Graph the solution set to a system of linear inequalities in two variables as the intersection of the corresponding half-planes.
There are no assessment limits for this standard. The entire standard is assessed in this course.
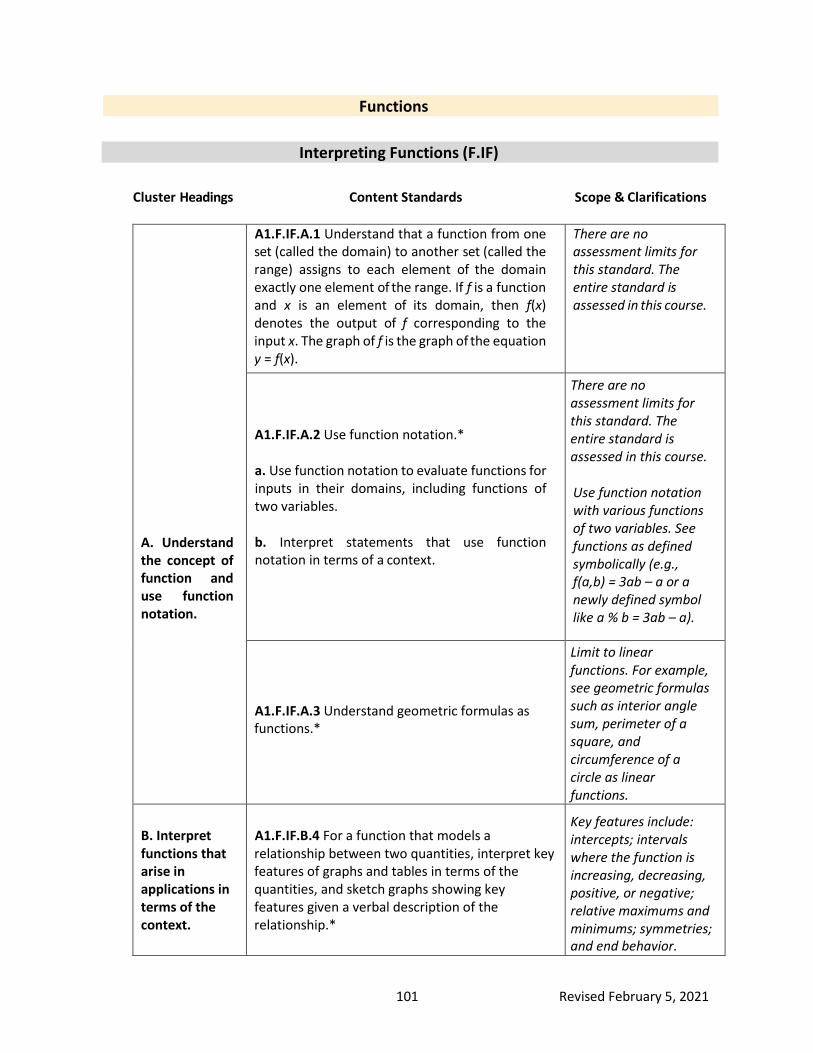
101 Revised February 5, 2021
Functions
Interpreting Functions (F.IF)
Cluster Headings Content Standards Scope & Clarifications
A. Understand the concept of function and use function notation.
A1.F.IF.A.1 Understand that a function from one set (called the domain) to another set (called the range) assigns to each element of the domain exactly one element of the range. If f is a function and x is an element of its domain, then f(x) denotes the output of f corresponding to the input x. The graph of f is the graph of the equation y = f(x).
There are no assessment limits for this standard. The entire standard is assessed in this course.
A1.F.IF.A.2 Use function notation.*
a. Use function notation to evaluate functions for inputs in their domains, including functions of two variables.
b. Interpret statements that use function notation in terms of a context.
There are no assessment limits for this standard. The entire standard is assessed in this course.
Use function notation with various functions of two variables. See functions as defined symbolically (e.g., f(a,b) = 3ab – a or a newly defined symbol like a % b = 3ab – a).
A1.F.IF.A.3 Understand geometric formulas as functions.*
Limit to linear functions. For example, see geometric formulas such as interior angle sum, perimeter of a square, and circumference of a circle as linear functions.
B. Interpret functions that arise in applications in terms of the context.
A1.F.IF.B.4 For a function that models a relationship between two quantities, interpret key features of graphs and tables in terms of the quantities, and sketch graphs showing key features given a verbal description of the relationship.*
Key features include: intercepts; intervals where the function is increasing, decreasing, positive, or negative; relative maximums and minimums; symmetries; and end behavior.
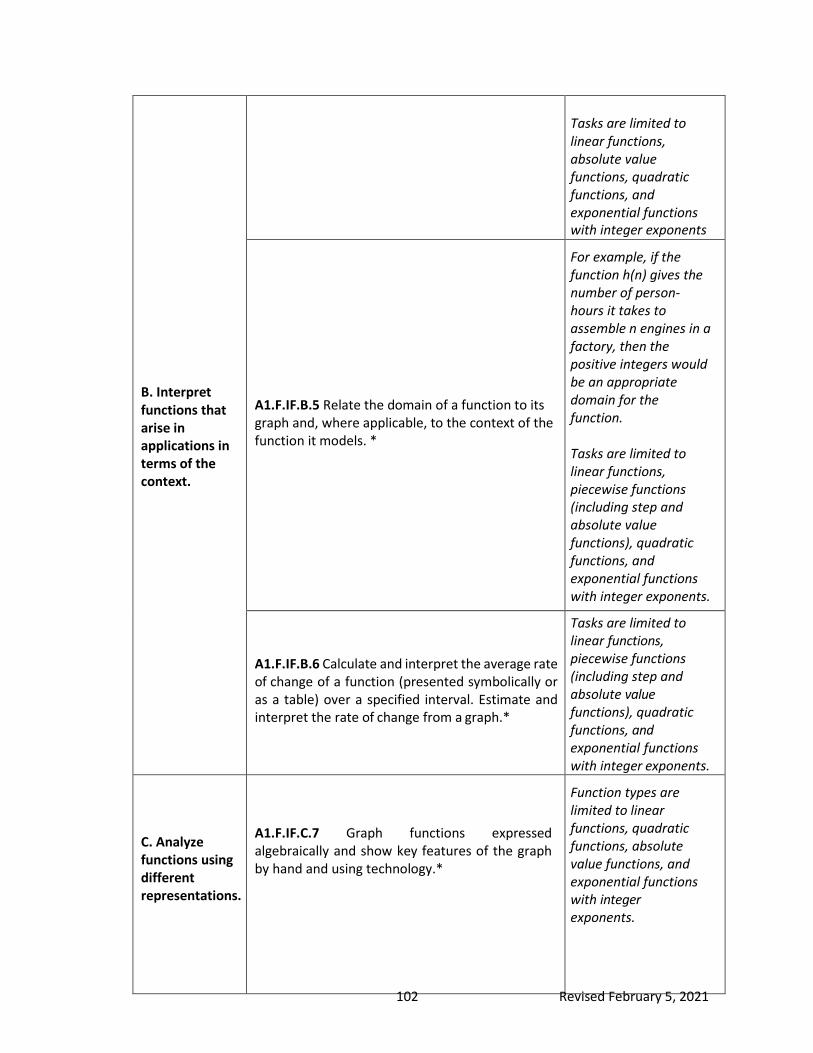
102 Revised February 5, 2021
B. Interpret functions that arise in applications in terms of the context.
Tasks are limited to linear functions, absolute value functions, quadratic functions, and exponential functions with integer exponents
A1.F.IF.B.5 Relate the domain of a function to its graph and, where applicable, to the context of the function it models. *
For example, if the function h(n) gives the number of person- hours it takes to assemble n engines in a factory, then the positive integers would be an appropriate domain for the function.
Tasks are limited to linear functions, piecewise functions (including step and absolute value functions), quadratic functions, and exponential functions with integer exponents.
A1.F.IF.B.6 Calculate and interpret the average rate of change of a function (presented symbolically or as a table) over a specified interval. Estimate and interpret the rate of change from a graph.*
Tasks are limited to linear functions, piecewise functions (including step and absolute value functions), quadratic functions, and exponential functions with integer exponents.
C. Analyze functions using different representations.
A1.F.IF.C.7 Graph functions expressed algebraically and show key features of the graph by hand and using technology.*
Function types are limited to linear functions, quadratic functions, absolute value functions, and exponential functions with integer exponents.

103 Revised February 5, 2021
A1.F.IF.C.8 Write a function defined by an expression in different but equivalent forms to reveal and explain different properties of the function. *
a. Rewrite quadratic functions to show zeros,
extreme values, and symmetry of the graph, and interpret these in terms of a real-world context.
There are no assess-ment limits for this standard. The entire standard is assessed in this course.
A1.F.IF.C.9 Compare properties of functions represented algebraically, graphically, numerically in tables, or by verbal descriptions.*
a. Compare properties of two different functions. Functions may be of different types and/or represented in different ways.
b. Compare properties of the same function on two different intervals or represented in two different ways.
Functions may or may not have a real-world context. Function types are limited to linear functions, quadratic functions, absolute value functions, and exponential functions with integer exponents.
Building Functions (F.BF)
Cluster Headings Content Standards Scope & Clarifications
A. Build a function that models a relationship between two quantities.
A1.F.BF.A.1 Build a function that describes a relationship between two quantities.*
a. Determine steps for calculation, a recursive process, or an explicit expression from a context.
Tasks are limited to linear and exponential relationships. For example, create a function from a visual pattern and describe how each component of their function relates to characteristics of figures in the pattern.
B. Build new functions from existing functions.
A1.F.BF.B.2 Identify the effect on the graph of replacing f(x) by f(x) + k, k f(x), f(kx), and f(x + k) for specific values of k (both positive and negative); find the value of k given graphs.

104 Revised February 5, 2021
Linear, Quadratic, and Exponential Models * (F.LE)
Cluster Headings Content Standards Scope & Clarifications
A. Construct and compare linear, quadratic, and exponential models and solve problems.
A1.F.LE.A.1 Distinguish between situations that can be modeled with linear functions and with exponential functions.*
a. Know that linear functions grow by equal differences over equal intervals and that exponential functions grow by equal factors over equal intervals.
b. Recognize situations in which one quantity changes at a constant rate per unit interval relative to another.
c. Recognize situations in which a quantity grows or decays by a constant factor per unit interval relative to another.
There are no assessment limits for this standard. The entire standard is assessed in this course.
A1.F.LE.A.2 Construct linear and exponential functions, including arithmetic and geometric sequences, given a graph, a table, a description of a relationship, or input-output pairs.*
Tasks are limited to constructing linear and exponential functions in simple context (not multi-step).
B. Interpret expressions for functions in terms of the situation they model.
A1.F.LE.B.3 Interpret the parameters in a linear or exponential function in terms of a context.*
For example, the total cost of an electrician who charges 35 dollars for a house call and 50 dollars per hour would be expressed as the function y = 50x + 35. If the rate were raised to 65 dollars per hour, describe how the function would change.
For example, a population is modeled by a function y = 30000 (1.04)x. Interpret the value 30000 as the initial population and 1.04 as a 4% increase per year.

104 Revised February 5, 2021
Statistics and Probability
Interpreting Categorical and Quantitative Data * (S.ID)
Cluster Headings Content Standards Scope & Clarifications
A. Summarize, represent, and interpret data on a single count or measurement variable.
A1.S.ID.A.1 Use measures of center to solve real- world and mathematical problems.*
Measures of center should include mean (including weighted averages), median, and mode. For example, a course has 6 tests during the semester. If your average after the first 5 tests is 85, what must you score on the 6th test to have at least an 87 semester average?
A1.S.ID.A.2 Use statistics appropriate to the shape of the data distribution to compare center (mean, median, and/or mode) and spread (range, interquartile range) of two or more different data sets.*
Students may be given a numerical data set or a visual and/or verbal depiction of a data set. Shapes of distribution are limited to: uniform, symmetric, right skewed, and left skewed.
A1.S.ID.A.3 Interpret differences in shape, center, and spread in the context of the data sets, accounting for possible effects of extreme data points.*
Students may be given a numerical data set or a visual and/or verbal depiction of the data set.
B. Summarize, represent, and interpret data on two categorical and quantitative variables.
A1.S.ID.B.4 Represent data from two quantitative variables on a scatter plot, and describe how the variables are related. Fit a function to the data; use functions fitted to data to solve problems in the context of the data.*
Fitted functions are limited to linear, exponential, and quadratic functions.
C. Interpret linear models.
A1.S.ID.C.5 Interpret the rate of change and the constant term of a linear model in the context of data.*
There are no assessment limits for this standard. The entire standard is assessed in this course.

105 Revised February 5, 2021
A1.S.ID.C.6 Use technology to compute the correlation coefficient of a linear model; interpret the correlation coefficient in the context of the data.*
There are no assess- ment limits for this standard. The entire standard is assessed in this course.
A1.S.ID.C.7 Explain the differences between correlation and causation. Recognize situations where an additional factor may be affecting correlated data.*
There are no assess-ment limits for this standard. The entire standard is assessed in this course.

106 Revised February 5, 2021
Geometry | G
Geometry emphasizes congruence, similarity, right triangle trigonometry, coordinate geometry, and modeling geometry concepts in real life situations. This course also introduces students to geometric constructions. Student extend their understanding of surface area and volume from previous grade levels by using unit analysis and the coordinate plane to solve problems in the real world. Finally, this course further develops student use of visual representations to understand and compute probabilities.
Throughout the course, students build upon previous knowledge to justify relationships, reason
mathematically, and solve problems. Modeling and real-world problems are introduced throughout the course with standards written to encourage the use of math to answer problems students will encounter in life.
Mathematical Modeling
Mathematical Modeling is a Standard for Mathematical Practice (MP4) and a Conceptual
Category. Specific modeling standards appear throughout the high school standards indicated with a
star ( ★). Where an entire domain is marked with a star, each standard in that domain is a modeling standard.
Standards for Mathematical Practice
Being successful in mathematics requires the development of approaches, practices, and habits
of mind that need to be in place as one strives to develop mathematical fluency, procedural skills, and conceptual understanding. The Standards for Mathematical Practice are meant to address these areas of expertise that teachers should seek to develop in their students. These approaches, practices, and habits of mind can be summarized as “processes and proficiencies” that successful mathematicians have as a part of their work in mathematics. Additional explanations are included in the main introduction of these standards.
Standards for Mathematical Practice
1. Make sense of problems and persevere in solving them. 2. Reason abstractly and quantitatively. 3. Construct viable arguments and critique the reasoning of others. 4. Model with mathematics. 5. Use appropriate tools strategically. 6. Attend to precision. 7. Look for and make use of structure. 8. Look for and express regularity in repeated reasoning.

107 Revised February 5, 2021
Literacy Standards for Mathematics
Communication in mathematics employs literacy skills in reading, vocabulary, speaking and listening, and writing. Mathematically proficient students communicate using precise terminology and multiple representations including graphs, tables, charts, and diagrams. By describing and contextualizing mathematics, students create arguments and support conclusions. They evaluate and critique the reasoning of others, analyze, and reflect on their own thought processes. Mathematically proficient students have the capacity to engage fully with mathematics in context by posing questions, choosing appropriate problem-solving approaches, and justifying solutions. Further explanations are included in the main introduction.
Literacy Skills for Mathematical Proficiency
1. Use multiple reading strategies. 2. Understand and use correct mathematical vocabulary. 3. Discuss and articulate mathematical ideas. 4. Write mathematical arguments.
Number and Quantity
Quantities * (N.Q)
Cluster Headings Content Standards Scope & Clarifications
A. Reason quantitatively and use units to solve problems.
G.N.Q.A.1 Use units as a way to understand real- world problems.*
a. Use appropriate quantities in formulas, converting units as necessary.
b. Define and justify appropriate quantities within a context for the purpose of modeling.
c. Choose an appropriate level of accuracy when reporting quantities.
Apply this standard to any real-world problems studied within the scope of this course.

108 Revised February 5, 2021
Geometry
Congruence (G.CO)
Cluster Headings Content Standards Scope & Clarifications
A. Experiment
with transformations in the plane.
G.CO.A.1 Describe transformations as functions that take points in the plane (pre-image) as inputs and give other points (image) as outputs. Compare transformations that preserve distance and angle measure to those that do not, by hand for basic transformations and using technology for more complex cases.
For example, a translation will preserve both distances and angle measures associated with a figure, a compression based around a point preserves angle measures but not distances, and a horizontal stretch does not preserve either except in the cases of a vertical line, ray, or line segment.
G.CO.A.2 Given a rectangle, parallelogram, trapezoid, or regular polygon, determine the transformations that carry the shape onto itself and describe them in terms of the symmetry of the figure.
There are no assessment limits for this standard. The entire standard is assessed in this course.
G.CO.A.3 Develop definitions of rotations, reflections, and translations in terms of angles, circles, perpendicular lines, parallel lines, and line segments.
There are no assessment limits for this standard. The entire standard is assessed in this course.
G.CO.A.4 Given a geometric figure, draw the image of the figure after a sequence of one or more rigid motions, by hand and using technology. Identify a sequence of rigid motions that will carry a given figure onto another.
There are no assessment limits for this standard. The entire standard is assessed in this course.

109 Revised February 5, 2021
B. Understand congruence in terms of rigid motions.
G.CO.B.5 Given two figures, use the definition of congruence in terms of rigid motions to determine informally if they are congruent.
There are no assess-ment limits for this standard. The entire standard is assessed in this course.
G.CO.B.6 Use the definition of congruence in terms of rigid motions to show that two triangles are congruent if and only if corresponding pairs of sides and corresponding pairs of angles are congruent.
There are no assess-ment limits for this standard. The entire standard is assessed in this course.
G.CO.B.7 Explain how the criteria for triangle congruence (ASA, SAS, AAS, SSS, and HL) follow from the definition of congruence in terms of rigid motions.
There are no assess- ment limits for this standard. The entire standard is assessed in this course.
C. Use geometric theorems to justify relationships.
G.CO.C.8 Use definitions and theorems about lines and angles to solve problems and to justify relationships in geometric figures.
"Justification" may take a variety of forms. Theorems include but are not limited to: vertical angles are congruent; when a transversal crosses parallel lines, alternate interior angles are congruent and corresponding angles are congruent; points on a perpendicular bisector of a line segment are exactly those equidistant from the segment’s endpoints.
G.CO.C.9 Use definitions and theorems about triangles to solve problems and to justify relationships in geometric figures.
"Justification" may take a variety of forms. Theorems include but are not limited to: measures of interior angles of a triangle sum to 180°; base angles of

110 Revised February 5, 2021
isosceles triangles are congruent; the segment joining mid-points of two sides of a triangle is parallel to the third side and half the length; the medians of a triangle meet at a point.
G.CO.C.10 Use definitions and theorems about parallelograms to solve problems and to justify relationships in geometric figures.
“Justification” may take a variety of forms. Theorems may include, but are not limited to: opposite sides of a parallelo-gram are congruent, opposite angles of a parallelogram are congruent, the diagonals of a par-allelogram bisect each other and conversely, rectangles are parallel-ograms with congruent diagonals.
D. Perform geometric constructions.
G.CO.D.11 Perform formal geometric constructions with a variety of tools and methods (compass and straightedge, string, reflective devices, paper folding, dynamic geometric software, etc.).
Constructions are limited to: bisecting an angle; constructing perpendicular lines, including the per-pendicular bisector of a line segment; and con-structing a line parallel to a given line through a point not on the line.
G.CO.D.12 Use geometric constructions to solve geometric problems in context, by hand and using technology.*
For example, find the point equidistant from three given points by constructing two perpendicular bisectors and locating their point of inter- section.

111 Revised February 5, 2021
Similarity, Right Triangles, and Trigonometry (G.SRT)
Cluster Headings Content Standards Scope & Clarifications
A. Understand similarity in terms of similarity transformations.
G.SRT.A.1 Use properties of dilations given by a center and a scale factor to solve problems and to justify relationships in geometric figures.
There are no assessment limits for this standard. The entire standard is assessed in this course.
G.SRT.A.2 Define similarity in terms of transformations. Use transformations to determine whether two figures are similar.
There are no assessment limits for this standard. The entire standard is assessed in this course.
B. Use similarity to solve problems and justify relationships.
G.SRT.B.3 Use congruence and similarity criteria for triangles to solve problems and to justify relationships in geometric figures.
“Justification” may take a variety of forms. For example, tasks could include, but are not limited to: a line parallel to one side of a triangle divides the other two proportionally, and conversely; finding the area of a kite by partitioning it into two congruent triangles and finding the area of one triangle.
C. Define trigonometric ratios and solve problems involving triangles.
G.SRT.C.4 Use side ratios in right triangles to define trigonometric ratios.
a. Understand that by similarity, side ratios in right triangles are properties of the angles in the triangle, leading to definitions of trigonometric ratios for acute angles.
There are no assess-ment limits for this standard. The entire standard is assessed in this course.
b. Explain and use the relationship between the sine and cosine of complementary angles.
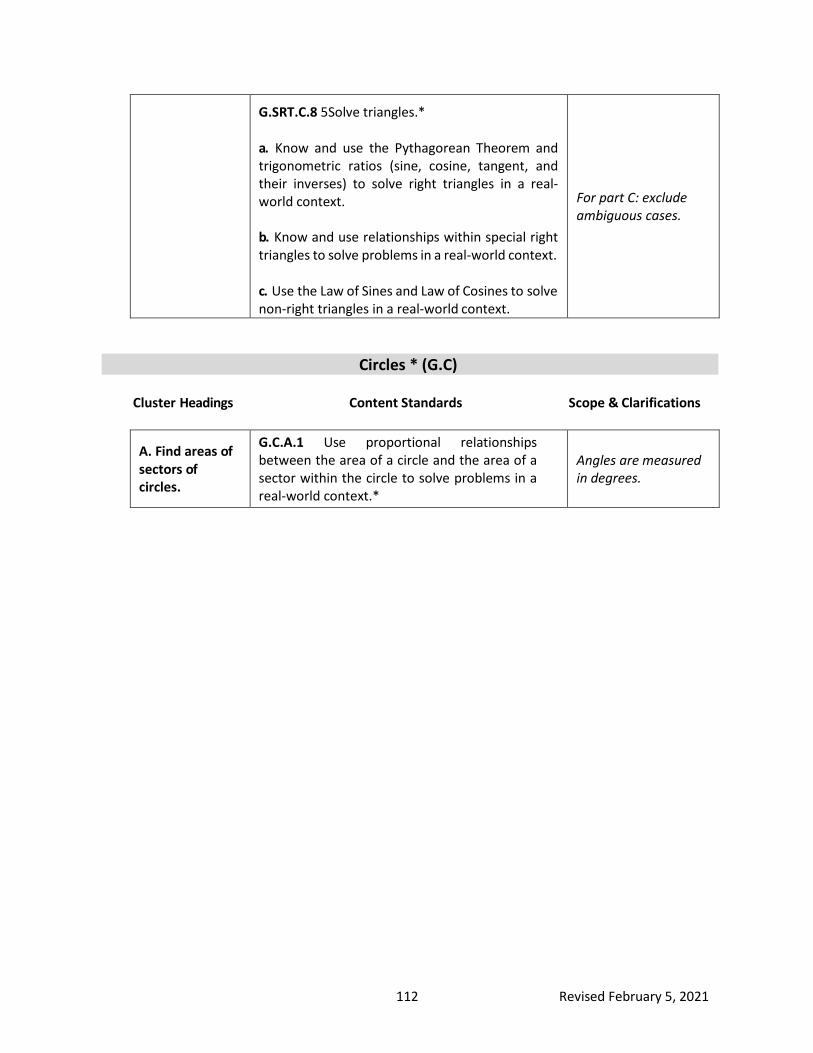
112 Revised February 5, 2021
G.SRT.C.8 5Solve triangles.*
a. Know and use the Pythagorean Theorem and trigonometric ratios (sine, cosine, tangent, and their inverses) to solve right triangles in a real- world context.
b. Know and use relationships within special right triangles to solve problems in a real-world context.
c. Use the Law of Sines and Law of Cosines to solve non-right triangles in a real-world context.
For part C: exclude ambiguous cases.
Circles * (G.C)
Cluster Headings Content Standards Scope & Clarifications
A. Find areas of sectors of circles.
G.C.A.1 Use proportional relationships between the area of a circle and the area of a sector within the circle to solve problems in a real-world context.*
Angles are measured in degrees.

113 Revised February 5, 2021
Expressing Geometric Properties with Equations (G.GPE)
Cluster Headings Content Standards Scope & Clarifications
A. Use coordi-nates to solve problems and justify simple geo-metric theorems algebraically.
G.GPE.A.1 Use coordinates to justify geometric relationships algebraically and to solve problems.
Examples include but are not limited to: determine whether four points in the co-ordinate plane are the vertices of a rec-tangle, trapezoid, rhombus, square, or parallelogram; deter-mine whether three points in the coordi-nate plane are the vertices of a scalene, isosceles, equilateral, or right triangle; de-termine the median of a triangle using the midpoint formula; given the coordinates of the center of a circle and a point on the circle, find the area and/or circum-ference of the circle.
G.GPE.A.2 Use the slope criteria for parallel and perpendicular lines to solve problems and to justify relationships in geometric figures.
For example, justify why two lines are parallel, perpendicular, or neither. Create parallel and perpendicular lines to solve problems in context (e.g., given three noncollinear points in the plane, find the coordinates of a fourth point so that the four points are the vertices of a rectangle).

114 Revised February 5, 2021
G.GPE.A.3 Understand the relationship between the Pythagorean Theorem and the distance formula and use an efficient method to solve problems on the coordinate plane.
For example, compute the radius of a circle given a center and a point on the circle, perimeters of polygons, and areas of triangles and quadrilaterals.
Finding the area of a triangle is limited to cases when the triangle is either right or contains a side that is horizontal or vertical.
Geometric Measurement and Dimension (G.GMD)
Cluster Headings Content Standards Scope & Clarifications
A. Explain volume and surface area formulas and use them to solve problems.
G.GMD.A.1 Understand and explain the formulas for the volume and surface area of a cylinder, cone, prism, and pyramid.
Informal arguments are limited to dissection. Memorizing formulas is not required.
G.GMD.A.2 Use volume and surface area formulas for cylinders, cones, prisms, pyramids, and spheres to solve problems in a real-world context.*
There are no assess- ment limits for this standard. The entire standard is assessed in this course.
Modeling with Geometry * (G.MG)
Cluster Headings Content Standards Scope & Clarifications
A. Apply geometric concepts in modeling situations.
G.MG.A.1 Use geometric shapes, their measures, and their properties to model objects found in a real-world context for the purpose of approximating solutions to problems.*
For example, determine which geometric shape best approximates a real- world object.

115 Revised February 5, 2021
Cluster Headings Content Standards Scope & Clarifications
A. Understand independence and conditional probability and use them to create visual representations of data.
G.S.CP.A.1 Use set notation to represent contextual situations.*
a. Describe events as subsets of a sample space (the set of outcomes) using characteristics (or categories) of the outcomes, or as unions, intersections, or complements of other events ("or", "and", "not").
b. Flexibly move between visual models (Venn diagrams, frequency tables, etc.) and set notation.
There are no assess-ment limits for this standard. The entire standard is assessed in this course.
B. Use the rules of probability to compute probabilities of compound events in a uniform probability model.
G.S.CP.B.2 Find the conditional probability of A given B as the fraction of B’s outcomes that also belong to A and interpret the answer in terms of the given context.*
Calculating condition- al probability may be performed via use of a visual model (Venn diagrams, frequency tables, etc.).
G.S.CP.B.3 Understand and apply the Addition Rule.*
a. Explain the Addition Rule, P(A or B) = P(A) + P(B) – P(A and B) in terms of visual models (Venn diagrams, frequency tables, etc.).
b. Apply the Addition Rule to solve problems and interpret the answer in terms of the given context.
There are no assess- ment limits for this standard. The entire standard is assessed in this course.
C. Apply geometric concepts to situations involving probability.
G.S.CP.C.4 Calculate probabilities using geometric figures.*
Geometric figures include line segments, two-dimensional shapes, and three- dimensional solids.
Statistics and Probability
Conditional Probability and the Rules of Probability* (S.CP)

116 Revised February 5, 2021
Algebra II |A2
Algebra 2 further expands a student’s understanding of functions and function types developed in Algebra 1. In particular, cubic, exponential, inverse, logarithmic, piecewise, and radical functions are studied. Students explore techniques for representing and solving systems of equations, including graphically, algebraically, and through the use of matrices. In addition, Algebra 2 includes a more in-depth focus on using statistics to understand data and make decisions.
Throughout the course, students explore the structures of and interpret functions and other
mathematical models. Algebra 2 topics will build upon previous knowledge requiring students to reason, solve, and represent mathematical concepts in multiple ways; i.e., graphically, numerically, and algebraically. Modeling and real-world problems are introduced throughout the course with standards written to encourage the use of math to answer problems students will encounter in life.
Mathematical Modeling
Mathematical Modeling is a Standard for Mathematical Practice (MP4) and a Conceptual
Category. Specific modeling standards appear throughout the high school standards indicated with a star
(★). Where an entire domain is marked with a star, each standard in that domain is a modeling standard.
Standards for Mathematical Practice
Being successful in mathematics requires the development of approaches, practices, and habits
of mind that need to be in place as one strives to develop mathematical fluency, procedural skills, and conceptual understanding. The Standards for Mathematical Practice are meant to address these areas of expertise that teachers should seek to develop in their students. These approaches, practices, and habits of mind can be summarized as “processes and proficiencies” that successful mathematicians have as a part of their work in mathematics. Additional explanations are included in the main introduction of these standards.
Standards for Mathematical Practice
1. Make sense of problems and persevere in solving them. 2. Reason abstractly and quantitatively. 3. Construct viable arguments and critique the reasoning of others. 4. Model with mathematics. 5. Use appropriate tools strategically. 6. Attend to precision. 7. Look for and make use of structure. 8. Look for and express regularity in repeated reasoning.

117 Revised February 5, 2021
Literacy Standards for Mathematics
Communication in mathematics employs literacy skills in reading, vocabulary, speaking and listening, and writing. Mathematically proficient students communicate using precise terminology and multiple representations including graphs, tables, charts, and diagrams. By describing and contextualizing mathematics, students create arguments and support conclusions. They evaluate and critique the reasoning of others, analyze, and reflect on their own thought processes. Mathematically proficient students have the capacity to engage fully with mathematics in context by posing questions, choosing appropriate problem-solving approaches, and justifying solutions. Further explanations are included in the main introduction.
Literacy Skills for Mathematical Proficiency
1. Use multiple reading strategies. 2. Understand and use correct mathematical vocabulary. 3. Discuss and articulate mathematical ideas. 4. Write mathematical arguments.
Number and Quantity
The Real Number System (N.RN)
Cluster Headings Content Standards Scope & Clarifications
A. Extend the properties of exponents to rational exponents.
A2.N.RN.A.1 Extend the properties of integer exponents to rational exponents.
a. Develop the meaning of rational exponents by applying the properties of integer exponents.
b. Explain why x1/n can be written as the nth root of x.
c. Rewrite expressions involving radicals and rational exponents using the properties of exponents.
For example, we define 51/3 to be the cube root of 5 because we want (51/3)3 = 5(1/3)3 to
hold, so (51/3)3 must equal 5.
There are no assessment limits for this standard. The entire standard is assessed in this course.

118 Revised February 5, 2021
Cluster Headings Content Standards Scope & Clarifications
A. Reason quantitatively and use units to understand problems.
A2.N.Q.A.1 Use units as a way to understand real- world problems.*
a. Choose and interpret the scale and the origin in graphs and data displays.
b. Use appropriate quantities in formulas, converting units as necessary.
c. Define and justify appropriate quantities within a context for the purpose of modeling.
d. Choose an appropriate level of accuracy when reporting quantities.
Apply this standard to any real-world problems studied within the scope of this course.
Cluster Headings Content Standards Scope & Clarifications
A. Perform operations on matrices and use matrices in applications.
A2.N.M.A.1 Use matrices to represent data in a real-world context. Interpret rows, columns, and dimensions of matrices in terms of the context.*
There are no assessment limits for this standard. The entire standard is assessed in this course.
A2.N.M.A.2 Perform operations on matrices in a real-world context.*
a. Multiply a matrix by a scalar to produce a new matrix.
b. Add and/or subtract matrices by hand and using technology.
c. Multiply matrices of appropriate dimensions, by hand in simple cases and using technology for more complicated cases.
d. Describe the roles that zero matrices and identity matrices play in matrix addition and multiplication, recognizing that they are similar to the roles of 0 and 1 in the real number system.
Part c: each matrix used as a factor is limited to no more than six elements when multiplying by hand.
Quantities ★ (N.Q)
Matrices ★ (N.M)

119 Revised February 5, 2021
A2.N.M.A.3 Create and use augmented matrices to solve systems of linear equations in real-world contexts, by hand and using technology.*
When solving by hand, limit system size to at most two unknowns, and when solving by technology, limit system size to at most three unknowns.
Algebra
Cluster Headings Content Standards Scope & Clarifications
A. Interpret the structure of expressions.
A2.A.SSE.A.1 Interpret expressions that represent a quantity in terms of its context.*
a. Interpret parts of an expression, such as terms, factors, and coefficients.
b. Interpret complicated expressions by viewing one or more of their parts as a single entity.
For example, interpret P(1 + r)n as the product of the initial value P and the growth rate after the first n years. View (1000 – 70x) (0.5 + 0.1x) as the product of the number of items sold and the cost of each item, which produces the profit, where x is the number of 10-cent price increases. View x(100 – 2x)(30 – 2x) as the product of the length, width, and height, which produces the volume of an open box made from a 100 by 30 rectangle with an x by x square cut out of each corner.
Tasks are limited to exponential, quadratic and cubic expressions.
Seeing Structure in Expressions ★ (A.SSE)

120 Revised February 5, 2021
Arithmetic with Polynomials and Rational Expressions (A.APR)
Cluster Headings Content Standards Scope & Clarifications
A. Understand the relationship between zeros and factors of polynomials.
A2.A.APR.A.1 Know and apply the Factor Theorem: For a polynomial p(x) and a number a, p(a) = 0 if and only if (x – a) is a factor of p(x).
Polynomials are limited to degree 3 or less.
A2.A.APR.A.2 Identify zeros of polynomials when suitable factorizations are available, and use the zeros to construct a rough graph of the function defined by the polynomial.
Polynomials are limited to degree 3 or less.
Cluster Headings Content Standards Scope & Clarifications
Tasks are limited to A2.A.CED.A.1 Create equations and inequalities
in one variable and use them to solve problems in a real-world context.*
quadratic, cubic, square root, cube root, and exponential equations and
inequalities. A2.A.CED.A.2 Create equations in two variables Tasks are limited to
linear, quadratic, cubic, square root, cube root, exponential, and absolute value functions.
to represent relationships between quantities and use them to solve problems in a real-world context. Graph equations with two variables on
A. Create equations that
coordinate axes with labels and scales, and use the graphs to make predictions.*
describe numbers or relationships.
Tasks are limited to quadratic, square root, cubic, cube root,
exponential, or logarithmic functions. For example, A2.A.CED.A.3 Rearrange formulas to isolate a rearrange the formula quantity of interest using algebraic reasoning.* for the area of a circle to isolate the radius. Rearrange the formula for the volume of a cube to isolate the side length.
Creating Equations ★ (A.CED)

121 Revised February 5, 2021
Reasoning with Equations and Inequalities (A.REI)
Cluster Headings Content Standards Scope & Clarifications
A. Understand solving equations as a process of reasoning and explain the reasoning.
A2.A.REI.A.1 Understand solving equations as a process of reasoning and explain the reasoning. Construct a viable argument to justify a solution method.
Tasks are limited to quadratic, radical, exponential, and logarithmic equations.
A2.A.REI.A.2 Solve radical equations in one variable, and identify extraneous solutions when they exist.
Limit radicand to a linear or quadratic expression. Limit the index to a value of 2 or 3. Tasks may or may not have a real-world context.
B. Solve systems of equations.
A2.A.REI.B.3 Write and solve a system of linear equations in a real-world context. *
When solving algebraically and graphically, tasks are limited to systems of at most two equations and two variables. When solving using technology, tasks are limited to systems of at most three equations and three variables. For example, use systems of equations to find the vertices of a triangle defined by three lines.
A2.A.REI.B.4 Solve a system consisting of a linear equation and a quadratic equation in two variables algebraically, graphically, and using technology.
Tasks may or may not have a real-world context.

122 Revised February 5, 2021
Functions
Cluster Headings Content Standards Scope & Clarifications
A. Interpret functions that arise in applications in terms of the context.
A2.F.IF.A.1 For a function that models a relationship between two quantities, interpret key features of graphs and tables in terms of the quantities, and sketch graphs showing key features given a verbal description of the relationship. ★
Key features include: intercepts; intervals where the function is increasing, decreasing, positive, or negative; relative maximums and minimums; symmetries; end behavior; and/or asymptotes where appropriate. Tasks are limited to linear, quadratic, cubic, square root, cube root, exponential, logarithmic, and piecewise (including absolute value functions).
A2.F.IF.A.2 Calculate and interpret the average rate of change of a function (presented algebraically or as a table) over a specified interval. Estimate and interpret the rate of change from a graph. *
There are no assessment limits for this standard. The entire standard is assessed in this course.
A2.F.IF.A.3 Understand geometric formulas as functions.*
Limit to quadratic and cubic functions. For example, see geometric formulas such as area of a circle, area of a square, and surface area of a cube as quadratic functions. See the volume of a cube and volume of a
Interpreting Functions ★ (F.IF)

123 Revised February 5, 2021
sphere as cubic functions.
B. Analyze functions using different representations.
A2.F.IF.B.4 Graph functions expressed algebraically and show key features of the graph by hand and using technology.*
A2.F.IF.B.5 Write a function defined by an expression in different but equivalent forms to reveal and explain different properties of the function.*
a. Rewrite quadratic functions to show zeros, extreme values, and symmetry of the graph, and interpret these in terms of a real-world context.
b. Know and use the properties of exponents to interpret expressions for exponential functions in terms of a real-world context.
Key features include: intercepts; intervals where the function is increasing, decreasing, positive, or negative; relative maximums and minimums; symmetries; end behavior; and/or asymptotes where appropriate.
Tasks are limited to linear, quadratic, cubic, square root, cube root, exponential, logarithmic, and piecewise functions (including absolute value functions).
For example, the growth of bacteria can be modeled by either f(t) = 3t+2 or g(t) = 9(3t) because the expression 3t+2 can be rewritten as (3t) (32) = 9(3t).

124 Revised February 5, 2021
A2.F.IF.B.6 Compare properties of functions represented algebraically, graphically, numerically in tables, or by verbal descriptions.*
a. Compare properties of two different functions. Functions may be of different types and/or represented in different ways.
b. Compare properties of the same function on two different intervals or represented in two different ways.
Functions may or may not have a real-world context.
Tasks are limited to linear, quadratic, cubic, square root, cube root, exponential, logarithmic, and piecewise functions (including absolute value functions).

125 Revised February 5, 2021
Building Functions (F.BF)
Cluster Headings Content Standards Scope & Clarifications
A. Build a function that models a relationship between two quantities.
A2.F.BF.A.1 Build a function that describes a relationship between two quantities.*
a. Combine standard function types using arithmetic operations.
b. Combine standard function types using composition.
Tasks are limited to linear, quadratic, square root, cubic, cube root, exponential, and logarithmic functions.
Part a: for example, if 1000 – 70x represents the number of items sold in a month and 0.5 + 0.1x represents the cost of each item, multiply (1000 – 70x)(0.5 + 0.1x) to write the quadratic function representing the profit, where x is the number of 10-cent price increases.
Part b: for example, given a product originally priced at $x is $4 off, build a function that will calculate the final price including 10% sales tax (i.e., f(g(x)) = 1.10 (x – 4)).
A2.F.BF.A.2 Define sequences as functions, including recursive definitions, whose domain is a subset of the integers. Write explicit and recursive formulas for arithmetic and geometric sequences in context and connect them to linear and exponential functions.*
There are no assessment limits for this standard. The entire standard is assessed in this course.
B. Build new functions from existing functions.
A2.F.BF.B.3 Identify the effect on the graph of replacing f(x) by f(x) + k, k f(x), f(kx), and f(x + k) for specific values of k (both positive and negative); find the value of k given the graphs.
Experiment with cases and illustrate an explanation of the effects on the graph using technology.

126 Revised February 5, 2021
A2.F.BF.B.4 Find the inverse of a function.
a. Determine whether a function is one-to-one.
b. Find the inverse of a function on an appropriate domain.
c. Given an invertible function on an appropriate domain, identify the domain of the inverse function.
Tasks are limited to linear, quadratic, square root, cubic, cube root, exponential, and logarithmic functions.
Cluster Headings Content Standards Scope & Clarifications
A. Construct and compare linear, quadratic, and exponential
A2.F.LE.A.1 Know the relationship between exponential functions and logarithmic functions. *
a. Solve exponential equations using a variety of strategies, including logarithms.
b. Understand that a logarithm is the solution to abct = d, where a, b, c, and d are numbers.
c. Evaluate logarithms using technology.
Bases should include ALL numbers, including the natural base e.
models and solve problems.
A2.F.LE.A.2 Know that a quantity increasing exponentially eventually exceeds a quantity increasing linearly, quadratically, or cubically.*
For example, illustrate using graphs and tables that g(x) = 21.6x eventually exceeds f(x) = 4x3 + 18. Tasks are limited to linear, quadratic, cubic and exponential functions.
Linear, Quadratic, and Exponential Models ★ (F.LE)

127 Revised February 5, 2021
Statistics and Probability
Cluster Headings Content Standards Scope & Clarifications
A. Summarize, represent, and interpret data on a single count or measurement variable.
A2.S.ID.A.1 Use statistics appropriate to the shape of the data distribution to compare center (mean, median, and/or mode) and spread (range, standard deviation) of two or more different data sets.*
Students will be given a visual and/or verbal description of a density curve. Shapes of distribution are limited to: uniform, symmetric, right skewed, and left skewed. Student will not be expected to calculate the standard deviation.
A2.S.ID.A.2 Use the mean and standard deviation of a data set to fit it to a normal distribution and to estimate population percentages using the Empirical Rule.*
There are no assessment limits for this standard. The entire standard is assessed in this course.
A2.S.ID.A.3 Compute, interpret, and compare z- scores for normally distributed data in a real-world context.*
There are no assessment limits for this standard. The entire standard is assessed in this course.
B. Summarize, represent, and interpret data on two categorical and quantitative variables.
A2.S.ID.B.4 Represent data from two quantitative variables on a scatter plot, and describe how the variables are related. Fit a function to the data; use functions fitted to data to solve problems in the context of the data.*
Use given functions or choose a function suggested by the shape of the data.
Tasks are limited to linear, quadratic, cubic, logarithmic, and exponential functions.
Interpreting Categorical and Quantitative Data * (S.ID)

128 Revised February 5, 2021
Cluster Headings Content Standards Scope & Clarifications
A. Make inferences and justify conclusions from sample surveys, experiments, and observational studies.
A2.S.IC.A.1 Recognize the purposes of and differences among sample surveys, experiments, and observational studies.*
For example, in a given situation, is it more appropriate to use a sample survey, an experiment, or an observational study?
A2.S.IC.A.2 Identify potential sources of bias in statistical studies.*
Sources of bias include but are not limited to: leading questions, lack of randomization, sampling bias, undercoverage, nonresponse, and/or small sample size.
A2.S.IC.A.3 Distinguish between a statistic and a parameter; Evaluate reports based on data and recognize when poor conclusions are drawn from well-collected data.*
There are no assessment limits for this standard. The entire standard is assessed in this course.
Cluster Headings Content Standards Scope & Clarifications
A. Understand independence and conditional probability and use them to create visual representations of data.
A2.S.CP.A.1 Recognize and explain the concepts of conditional probability and independence in everyday language and everyday situations. Categorize events as independent or dependent.*
There are no assessment limits for this standard. The entire standard is assessed in this course.
Making Inferences and Justifying Conclusions *(S.IC)
Conditional Probability and the Rules of Probability *(S.CP)

129 Revised February 5, 2021
B. Understand and apply basic concepts of probability.
A2.S.CP.B.2 Apply statistical counting techniques.*
a. Use the Fundamental Counting Principle to compute probabilities of compound events and solve problems.
b. Use permutations and combinations to compute probabilities of compound events and solve problems.
There are no assessment limits for this standard. The entire standard is assessed in this course.
A2.S.CP.B.3 Use the Law of Large Numbers to assess the validity of a statistical claim. *
There are no assessment limits for this standard. The entire standard is assessed in this course.
Calculating conditional probability may be performed via use of a
C. Use the rules of probability to compute probabilities of compound events in a uniform probability model.
A2.S.CP.C.4 Find the conditional probability of A given B as the fraction of B’s outcomes that also belong to A and interpret the answer in terms of the given context.*
visual model (Venn diagrams, frequency tables, etc.), calculation/formula, or by using counting techniques. For example, a teacher gave two exams. 75 percent passed the first exam and 25
percent passed both. What percent who passed the first exam also passed the second exam?

130 Revised February 5, 2021
Integrated Math I | M1
“Students must learn mathematics with understanding, actively building new knowledge from experience and previous knowledge” (Principles and Standards for School Mathematics, NCTM). Thus, Integrated Mathematics I seeks to activate students’ prior learning experiences and connect new concepts in a coherent, conceptual manner while also building procedural fluency. This course develops conceptual understanding for absolute value equations and linear and exponential (with integer exponents) expressions, equations, and functions. The course also focuses on systems of equations and inequalities graphically, algebraically, and through the use of matrices. Students will be given the opportunity to explore geometric concepts on the coordinate plane and interpret linear models. To develop mathematically proficient students, it is imperative attention be given to the Standards for Math Practice as instruction facilitates learning on these topics. Modeling real-world problems through mathematics anchors this course, and “engages students in meaningful learning through individual and collaborative experiences that promote their ability to make sense of mathematical ideas and reason mathematically” (Principles to Action, NCTM).
Mathematical Modeling
Mathematical Modeling is a Standard for Mathematical Practice (MP4) and a Conceptual
Category. Specific modeling standards appear throughout the high school standards indicated with a star
(★). Where an entire domain is marked with a star, each standard in that domain is a modeling standard.
Standards for Mathematical Practice
Being successful in mathematics requires the development of approaches, practices, and habits
of mind that need to be in place as one strives to develop mathematical fluency, procedural skills, and conceptual understanding. The Standards for Mathematical Practice are meant to address these areas of expertise that teachers should seek to develop in their students. These approaches, practices, and habits of mind can be summarized as “processes and proficiencies” that successful mathematicians have as a part of their work in mathematics. Additional explanations are included in the main introduction of these standards.
Standards for Mathematical Practice
1. Make sense of problems and persevere in solving them. 2. Reason abstractly and quantitatively. 3. Construct viable arguments and critique the reasoning ofothers. 4. Model with mathematics. 5. Use appropriate tools strategically. 6. Attend to precision. 7. Look for and make use of structure. 8. Look for and express regularity in repeated reasoning.

131 Revised February 5, 2021
Literacy Standards for Mathematics
Communication in mathematics employs literacy skills in reading, vocabulary, speaking and listening, and writing. Mathematically proficient students communicate using precise terminology and multiple representations including graphs, tables, charts, and diagrams. By describing and contextualizing mathematics, students create arguments and support conclusions. They evaluate and critique the reasoning of others, analyze, and reflect on their own thought processes. Mathematically proficient students have the capacity to engage fully with mathematics in context by posing questions, choosing appropriate problem-solving approaches, and justifying solutions. Further explanations are included in the main introduction.
Literacy Skills for Mathematical Proficiency
1. Use multiple reading strategies. 2. Understand and use correct mathematical vocabulary. 3. Discuss and articulate mathematical ideas. 4. Write mathematical arguments.
Number and Quantity
Quantities * (N.Q)
Cluster Headings Content Standards Scope & Clarifications
A. Reason quantitatively and use units to understand problems.
M1.N.Q.A.1 Use units as a way to understand real-world problems.*
a. Choose and interpret the scale and the origin in graphs and data displays.
b. Use appropriate quantities in formulas, converting units as necessary.
c. Define and justify appropriate quantities within a context for the purpose of modeling.
d. Choose an appropriate level of accuracy when reporting quantities.
Apply this standard to any real-world problems studied within the scope of this course.

132 Revised February 5, 2021
Matrix Quantities (N.M)
Cluster Headings Content Standards Scope & Clarifications
A. Perform operations on matrices and use matrices in applications.
M1.N.M.A.1 Use matrices to represent data in a real-world context. Interpret rows, columns, and dimensions of matrices in terms of the context.*
There are no assessment limits for this standard. The entire standard is assessed in this course.
M1.N.M.A.2 Perform operations on matrices in a real-world context.*
a. Multiply a matrix by a scalar to produce a new matrix.
b. Add and/or subtract matrices by hand and using technology.
c. Multiply matrices of appropriate dimensions, by hand in simple cases and using technology for more complicated cases.
d. Describe the roles that zero matrices and identity matrices play in matrix addition and multiplication, recognizing that they are similar to the roles of 0 and 1 in the real number system.
Part c: each matrix used as a factor is limited to no more than six elements when multiplying by nb hand.
M1.N.M.A.3 Create and use augmented matrices to solve systems of linear equations in real-world contexts, by hand and using technology.*
When solving by hand, limit system size to at most two unknowns, and when solving by technology, limit system size to at most three unknowns.

133 Revised February 5, 2021
Algebra
Seeing Structure in Expressions (A.SSE)
Cluster Headings Content Standards Scope & Clarifications
A. Interpret the structure of expressions.
M1.A.SSE.A.1 Interpret expressions that represent a quantity in terms of its context.*
a. Interpret parts of an expression, such as terms, factors, and coefficients.
b. Interpret complicated expressions by viewing one or more of their parts as a single entity.
For example, one truck can transport A cubic feet, and a second truck can transport B cubic feet. The first truck makes x trips to a job site, while the second makes y trips. Interpret the expression Ax + By in terms of the context.
For example, interpret P(1 + r)n as the product of P and a factor not depending on P.
Tasks are limited to linear and exponential expressions, including related numerical expressions.
M1.A.SSE.A.2 Use the structure of an algebraic expression to identify ways to rewrite it.
There are no assessment limits for this standard. The entire standard is assessed in this course.

134 Revised February 5, 2021
Cluster Headings Content Standards Scope & Clarifications
A. Create equations that describe numbers or relationships
M1.A.CED.A.1 Create equations and inequalities in one variable and use them to solve problems.*
Tasks are limited to equations or inequalities of these types: linear and absolute value.
M1.A.CED.A.2 Create equations in two variables to represent relationships between quantities and use them to solve problems in a real-world context. Graph equations with two variables on coordinate axes with labels and scales, and use the graphs to make predictions.*
Tasks are limited to linear, absolute value, and exponential equations of two variables.
M1.A.CED.A.3 Create individual and systems of equations and/or inequalities to represent constraints in a contextual situation, and interpret solutions as viable or non-viable.*
For example, represent inequalities describing nutritional and cost constraints on combinations of different foods. There are no assessment limits for this standard. The entire standard is assessed in this course.
M1.A.CED.A.4 Rearrange formulas to isolate a quantity of interest using algebraic reasoning.*
Tasks are limited to linear and absolute value expressions.
For example, rearrange the formula for the perimeter of a rectangle to isolate the length or width.
Creating Equations (A.CED)

135 Revised February 5, 2021
Reasoning with Equations and Inequalities (A.REI)
Cluster Headings Content Standards Scope & Clarifications
A. Understand solving equations as a p\\\\\rocess of reasoning and explain the reasoning.
M1.A.REI.A.1 Understand solving equations as a process of reasoning and explain the reasoning. Construct a viable argument to justify a solution method.
Tasks are limited to linear and absolute value equations.
B. Solve equations and inequalities in one variable.
M1.A.REI.B.2 Solve linear and absolute value equations and inequalities in one variable.
a. Solve linear equations and inequalities, including compound inequalities, in one variable. Represent solutions algebraically and graphically.
b. Solve absolute value equations and inequalities in one variable. Represent solutions algebraically and graphically.
Equations and inequalities should include integer, rational, and/or irrational coefficients. If coefficients are irrational, rationalization of a denominator is not required.
Tasks may or may not have a real-world context.
There are no assessment limits for this standard. The entire standard is assessed in this course.
C. Solve systems of equations.
M1.A.REI.C.3 Write and solve a system of linear equations in a real-world context.*
When solving algebraically and graphically, tasks are limited to systems of at most two equations and two variables. When solving using technology, tasks are limited to systems of at most three equations and three variables. For example, use systems

136 Revised February 5, 2021
of equations to find the vertices of a triangle defined by three lines.
D. Represent and solve equations and inequalities graphically.
M1.A.REI.D.4 Understand that the graph of an equation in two variables is the set of all its solutions plotted in the coordinate plane, often forming a curve (which could be a line).
There are no assessment limits for this standard. The entire standard is assessed in this course.
M1.A.REI.D.5 Explain why the x-coordinates of the points where the graphs of the equations y = f(x) and y = g(x) intersect are the solutions of the equation f(x) = g(x). Find approximate solutions by graphing the functions or making a table of values, using technology when appropriate.*
When finding solutions approximately, students may be expected to produce graphs of functions that are linear, but may be given graphs of other function types.
Exponential functions are limited to domains in the integers.
M1.A.REI.D.6 Graph the solution set to a system of linear inequalities in two variables as the intersection of the corresponding half-planes.
There are no assessment limits for this standard. The entire standard is assessed in this course.

137 Revised February 5, 2021
Functions
Interpreting Functions (F.IF)
Cluster Headings Content Standards Scope & Clarifications
A. Understand the concept of a function and use function notation.
M1.F.IF.A.1 Understand that a function from one set (called the domain) to another set (called the range) assigns to each element of the domain exactly one element of the range. If f is a function and x is an element of its domain, then f(x) denotes the output of f corresponding to the input x. The graph of f is the graph of the equation y = f(x).
There are no assessment limits for this standard. The entire standard is assessed in this course.
M1.F.IF.A.2 Use function notation.*
a. Use function notation to evaluate functions for inputs in their domains, including functions of two variables.
b. Interpret statements that use function notation in terms of a context.
Limit to functions of one variable.
M1.F.IF.A.3 Understand geometric formulas as functions.*
Limit to linear functions. For example, see geometric formulas such as interior angle sum, perimeter of a square, and circumference of a circle as linear functions.
B. Interpret functions that arise in applications in terms of the context.
M1.F.IF.B.4 For a function that models a relationship between two quantities, interpret key features of graphs and tables in terms of the quantities, and sketch graphs showing key features given a verbal description of the relationship.*
Key features include: intercepts; intervals where the function is increasing, decreasing, positive, or negative; relative maximums and minimums; symmetries; and end behavior.
Tasks are limited to linear functions and

138 Revised February 5, 2021
exponential functions with integer exponents.
M1.F.IF.B.5 Relate the domain of a function to its graph and, where applicable, to the context of the function it models.*
For example, if the function h(n) gives the number of person-hours it takes to assemble n engines in a factory, then the positive integers would be an appropriate domain for the function.
Tasks are limited to linear functions and exponential functions with integer exponents.
C. Analyze functions using different representations.
M1.F.IF.C.6 Compare properties of functions represented algebraically, graphically, numerically in tables, or by verbal descriptions.
a. Compare properties of two different functions. Functions may be of different types and/or represented in different ways.
b. Compare properties of the same function on two different intervals or represented in two different ways.
Functions may or may not have a real- world context.
Tasks are limited to linear functions and exponential functions with integer exponents.
Building Functions (F.BF)
Cluster Headings Content Standards Scope & Clarifications
A. Build a function that models a relationship between two quantities.
M1.F.BF.A.1 Build a function that describes a relationship between two quantities.*
a. Determine steps for calculation, a recursive process, or an explicit expression from a context.
Tasks are limited to linear and exponential relationships. For example, create a function from a visual pattern and describe how each component of their function relates to characteristics of figures in the pattern.

139 Revised February 5, 2021
M1.F.BF.A.2 Define sequences as functions, including recursive definitions, whose domain is a subset of the integers. Write explicit and recursive formulas for arithmetic and geometric sequences in context and connect them to linear and exponential functions.*
There are no assessment limits for this standard. The entire standard is assessed in this course.

140 Revised February 5, 2021
Cluster Headings Content Standards Scope & Clarifications
A. Construct and compare linear and exponential models and solve problems.
M1.F.LE.A.1 Distinguish between situations that can be modeled with linear functions and with exponential functions. *
a. Know that linear functions grow by equal differences over equal intervals and that exponential functions grow by equal factors over equal intervals.
b. Recognize situations in which one quantity changes at a constant rate per unit interval relative to another.
c. Recognize situations in which a quantity grows or decays by a constant factor per unit interval relative to another.
There are no assessment limits for this standard. The entire standard is assessed in this course.
M1.F.LE.A.2 Construct linear and exponential functions, including arithmetic and geometric sequences, given a graph, a table, a description of a relationship, or input-output pairs.*
There are no assessment limits for this standard. The entire standard is assessed in this course.
B. Interpret expressions for functions in terms of the situation they model.
M1.F.LE.B.3 Interpret the parameters in a linear or exponential function in terms of a context. *
For example, the total cost of an electrician who charges a flat fee for a house call and an hourly rate is given by the function y = 50x + 35. Interpret the value 35 as the flat fee and the value of 50 as the hourly rate.
For example, a population is modeled by a function y = 30000 (1.04)x. Interpret the value 30000 as the initial population and 1.04 as a 4% increase per year.
Linear and Exponential Models★ (F.LE)

141 Revised February 5, 2021
Geometry
Congruence (G.CO)
Cluster Headings Content Standards Scope & Clarifications
A. Experiment with transformations in the plane.
M1.G.CO.A.1 Describe transformations as functions that take points in the plane (pre-image) as inputs and give other points (image) as outputs. Compare transformations that preserve distance and angle measure to those that do not, by hand for basic transformations and using technology for more complex cases.
For example, a translation will preserve both distances and angle measures associated with a figure, a compression based around a point preserves angle measures but not distances, and a horizontal stretch does not preserve either except in the cases of a vertical line, ray, or line segment.
Limit the comparison of transformations to figures graphed on a coordinate plane.
M1.G.CO.A.2 Given a rectangle, parallelogram, trapezoid, or regular polygon, determine the transformations that carry the shape onto itself and describe them in terms of the symmetry of the figure.
Limit transformations to figures graphed on a coordinate plane.
B. Use geometric theorems to justify relationships.
M1.G.CO.B.3 Use definitions and theorems about lines and angles to solve problems and to justify relationships in geometric figures.
“Justification” may take a variety of forms. Students should be introduced to the terminology of “congruence” when measuring angles and segment lengths.
For example, tasks may include, but are not limited to: vertical angles are congruent; when a transversal

142 Revised February 5, 2021
crosses parallel lines, alternate interior angles are congruent and corresponding angles are congruent; points on a perpendicular bisector of a line segment are exactly those equidistant from the segment’s endpoints.
M1.G.CO.B.4 Use definitions and theorems about triangles to solve problems and to justify relationships in geometric figures.
“Justification” may take a variety of forms.
For example, tasks may include, but are not limited to: measures of interior angles of a triangle sum to 180°; base angles of isosceles triangles are congruent.
C. Perform geometric constructions.
M1.G.CO.C.5 Perform formal geometric constructions with a variety of tools and methods (compass and straightedge, string, reflective devices, paper folding, dynamic geometric software, etc.).
Constructions are limited to: bisecting an angle; constructing perpendicular lines, including the perpendicular bisector of a line segment; and constructing a line parallel to a given line through a point not on the line.
M1.G.CO.C.6 Use geometric constructions to solve geometric problems in context, by hand and using technology.*
For example, find the point equidistant from three given points by constructing two perpendicular bisectors and locating their point of intersection.

143 Revised February 5, 2021
Geometric Properties with Equations (G.GPE)
Cluster Headings Content Standards Scope & Clarifications
For example, tasks could include, but are not limited to: determine whether four points in the coordinate plane are the vertices of a rectangle, trapezoid, rhombus, square, or parallelogram; determine whether three points in the coordinate plane are M1.G.GPE.A.1 Use coordinates to solve problems the vertices of a and justify geometric relationships algebraically. scalene, isosceles, equilateral, or right triangle; determine the median of a
A. Use triangle using the coordinates to midpoint formula; solve problems and justify simply
given the coordinates of the
geometric center of a circle and theorems algebraically.
a point on the circle, find the area and/or circumference of the
circle. For example, tasks could include, but are not limited to: justify why two lines are parallel, perpendicu- lar, or neither. Create M1.G.GPE.A.2 Use the slope criteria for parallel
and perpendicular lines to solve problems and to justify relationships in geometric figures.
parallel and perpen- dicular lines to solve problems in context (e.g., given three non-
collinear points in the plane, find the coor- dinates of a fourth point so that the four points are the vertices of a rectangle).

144 Revised February 5, 2021
M1.G.GPE.A.3 Understand the relationship between the Pythagorean Theorem and the distance formula and use an efficient method to solve problems on the coordinate plane.
For example, compute the radius of a circle given a center and point on the circle, perimeters of polygons, and areas of triangles and quadrilaterals. Finding the area of a triangle is limited to cases when the triangle is either right or contains a side that is horizontal or vertical.
Statistics and Probability
Interpreting Categorical and Quantitative Data * (S.ID)
Cluster Headings Content Standards Scope & Clarifications
A. Summarize, represent, and interpret data on two categorical and quantitative variables.*
M1.S.ID.A.1 Represent data from two quantitative variables on a scatter plot, and describe how the variables are related. Fit a function to the data; use functions fitted to data to solve problems in the context of the data.*
Tasks are limited to linear functions.
B. Interpret linear models.
M1.S.ID.B.2 Interpret the rate of change and the constant term of a linear model in the context of the data.*
There are no assessment limits for this standard. The entire standard is assessed in this course.
M1.S.ID.B.3 Use technology to compute the correlation coefficient of a linear model; interpret the correlation coefficient in the context of the data.*
There are no assessment limits for this standard. The entire standard is assessed in this course.
M1.S.ID.B.4 Explain the differences between correlation and causation. Recognize situations where an additional factor may be affecting correlated data.*
There are no assessment limits for this standard. The entire standard is assessed in this course.

145 Revised February 5, 2021
Integrated Math II |M2
“Students must learn mathematics with understanding, actively building new knowledge from experience and previous knowledge” (Principles and Standards for School Mathematics, NCTM). Thus, Integrated Mathematics II seeks to activate students’ prior learning experiences and connect new concepts in a coherent, conceptual manner while also building procedural fluency. This course develops conceptual understanding for quadratic, square root, and exponential expressions, equations, and functions. Students will investigate a system of equations written with quadratic and linear functions and explore piecewise functions. Working with rational exponents is an expectation of this course to prepare students for understanding the square root function. Students will be given the opportunity to explore geometric concepts on a plane and develop foundational knowledge in congruence and similarity, which will bridge to constructions and right triangle trigonometry in Integrated Mathematics III. Students will use real-world data to model and interpret quadratic and exponential relationships. To develop mathematically proficient students, it is imperative attention be given to the Standards for Math Practice as instruction facilitates learning on these topics. Modeling real-world problems through mathematics anchors this course, and “engages students in meaningful learning through individual and collaborative experiences that promote their ability to make sense of mathematical ideas and reason mathematically” (Principles to Action, NCTM).
Mathematical Modeling
Mathematical Modeling is a Standard for Mathematical Practice (MP4) and a Conceptual
Category. Specific modeling standards appear throughout the high school standards indicated with a star (*). Where an entire domain is marked with a star, each standard in that domain is a modeling standard.
Standards for Mathematical Practice
Being successful in mathematics requires the development of approaches, practices, and habits
of mind that need to be in place as one strives to develop mathematical fluency, procedural skills, and conceptual understanding. The Standards for Mathematical Practice are meant to address these areas of expertise that teachers should seek to develop in their students. These approaches, practices, and habits of mind can be summarized as “processes and proficiencies” that successful mathematicians have as a part of their work in mathematics. Additional explanations are included in the main introduction of these standards.

146 Revised February 5, 2021
Standards for Mathematical Practice
1. Make sense of problems and persevere in solving them. 2. Reason abstractly and quantitatively. 3. Construct viable arguments and critique the reasoning of others. 4. Model with mathematics. 5. Use appropriate tools strategically. 6. Attend to precision. 7. Look for and make use of structure. 8. Look for and express regularity in repeated reasoning.
Literacy Standards for Mathematics
Communication in mathematics employs literacy skills in reading, vocabulary, speaking and listening, and writing. Mathematically proficient students communicate using precise terminology and multiple representations including graphs, tables, charts, and diagrams. By describing and contextualizing mathematics, students create arguments and support conclusions. They evaluate and critique the reasoning of others, analyze, and reflect on their own thought processes. Mathematically proficient students have the capacity to engage fully with mathematics in context by posing questions, choosing appropriate problem-solving approaches, and justifying solutions. Further explanations are included in the main introduction.
Literacy Skills for Mathematical Proficiency
1. Use multiple reading strategies. 2. Understand and use correct mathematical vocabulary. 3. Discuss and articulate mathematical ideas. 4. Write mathematical arguments.
Number and Quantity
The Real Number System * (N.RN)
Cluster Headings Content Standards Scope & Clarifications
A. Extend the properties of exponents to rational exponents.
M2.N.RN.A.1 Extend the properties of integer exponents to rational exponents.*
a. Develop the meaning of rational exponents by applying the properties of integer exponents.*
b. Explain why x1/n can be written as the nth root of x.*
Part B: for example, we define 51/3 to be the cube root of 5 because we want (51/3)3 = 5(1/3)3 to hold, so (51/3)3 must equal 5.

147 Revised February 5, 2021
c. Rewrite expressions involving radicals and rational exponents using the properties of exponents.*
Quantities * (N.Q)
Cluster Headings Content Standards Scope & Clarifications
A. Reason quantitatively and use units to understand problems.
M2.N.Q.A.1 Use units as a way to understand real-world problems.*
a. Choose and interpret the scale and the origin in graphs and data displays.
b. Use appropriate quantities in formulas, converting units as necessary.
c. Define and justify appropriate quantities within a context for the purpose of modeling.
d. Choose an appropriate level of accuracy when reporting quantities.
Apply this standard to any real-world problems studied within the scope of this course.
Algebra
Seeing Structure in Expressions * (A.SSE)
Cluster Headings Content Standards Scope & Clarifications
A. Interpret the structure of expressions.
M2.A.SSE.A.1 Interpret expressions that represent a quantity in terms of its context.*
a. Interpret parts of an expression, such as terms, factors, and coefficients.
b. Interpret complicated expressions by viewing one or more of their parts as a single entity.
For example, inter- pret P(1 + r)n as the product of the initial value P and the growth rate after the first n years. View (1000 – 70x)(0.5 + 0.1x) as the product of the number of items sold and the cost of each item, which produces the profit, where x is the number of 10-cent price increases.
Tasks are limited to exponential and quadratic expressions.

148 Revised February 5, 2021
Arithmetic with Polynomials and Rational Expressions (A.APR)
Cluster Headings Content Standards Scope & Clarifications
A. Perform arithmetic operations on polynomials.
M2.A.APR.A.1 Add, subtract, and multiply polynomials. Use these operations to demonstrate that polynomials form a closed system that adhere to the same properties of operations as the integers.
There are no assessment limits for this standard. The entire standard is assessed in this course.
B. Understand the relationship between zeros and factors of polynomials.
M2.A.APR.B.2 Know and apply the Factor Theorem: For a polynomial p(x) and a number a, p(a) = 0 if and only if (x – a) is a factor of p(x).
Polynomials are limited to degree of two.
Creating Equations * (A.CED)
Cluster Headings Content Standards Scope & Clarifications
Tasks are limited to M2.A.CED.A.1 Create equations and inequalities in quadratic, square one variable and use them to solve problems in a root, and exponential
A. Create real-world context.* equations and equations that inequalities. describe numbers or
M2.A.CED.A.2 Create equations in two variables to represent relationships between quantities and
Tasks are limited to quadratic, square root, and exponential.
relationships. use them to solve problems in a real-world context. Graph equations with two variables on coordinate axes with labels and scales, and use the graphs to make predictions.* Tasks are limited to
A. Create equations that describe numbers or relationships.
M2.A.CED.A.3 Rearrange formulas to isolate a quantity of interest using algebraic reasoning.*
formulas involving quadratic and square root expressions. For example, rearrange the formula for the area of a circle to
isolate the radius.

149 Revised February 5, 2021
Reasoning with Equations and Inequalities (A.REI)
Cluster Headings Content Standards Scope & Clarifications
A. Understand solving equations as a process of reasoning and explain the reasoning.
M2.A.REI.A.1 Understand solving equations as a process of reasoning and explain the reasoning. Construct a viable argument to justify a solution method.
Tasks are limited to quadratic, square root, and exponential equations with integer exponents.
B. Solve equations and inequalities in one variable.
M2.A.REI.B.2 Solve quadratic equations and inequalities in one variable.*
a. Solve quadratic equations by inspection (e.g., for x2 = 49), taking square roots, knowing and applying the quadratic formula, and factoring, as appropriate to the initial form of the equation. Recognize when a quadratic equation has non-real solutions.*
b. Solve quadratic inequalities using the graph of the related quadratic equation.*
Tasks may or may not have a real-world context.
M2.A.REI.B.3 Solve radical equations in one variable and identify extraneous solutions when they exist.
Tasks may have either a linear or quadratic radicand.
C. Solve systems of equations.
M2.A.REI.C.4 Solve a system consisting of a linear equation and a quadratic equation in two variables algebraically, graphically, and using technology.*
Tasks may or may not have a real-world context.
D. Represent and solve equations and inequalities graphically.
M2.A.REI.D.5 Explain why the x-coordinates of the points where the graphs of the equations y = f(x) and y = g(x) intersect are the solutions of the equation f(x) = g(x). Find approximate solutions by graphing the functions or making a table of values, using technology when appropriate.
When finding solutions approximately, students may be expected to produce graphs of functions that are linear, piecewise (including step and absolute value functions), quadratic, square root, and exponential, but may be given graphs of other function types.

150 Revised February 5, 2021
Functions
Cluster Headings Content Standards Scope & Clarifications
A. Understand the concept of function and use function notation.
M2.F.IF.A.1 Use function notation.*
a. Use function notation to evaluate functions for inputs in their domains, including functions of two variables.*
b. Interpret statements that use function notation in terms of a context.*
Limit to functions of one variable in this course.
M2.F.IF.A.2 Understand geometric formulas as functions.
Limit to quadratic functions. For example, see geometric formulas such as area of a circle, area of a square, and surface area of a cube as quadratic functions.
B. Interpret functions that arise in applications in terms of the context.
M2.F.IF.B.3 For a function that models a relationship between two quantities, interpret key features of graphs and tables in terms of the quantities, and sketch graphs showing key features given a verbal description of the relationship.*
Key features include: intercepts; intervals where the function is increasing, decreas- ing, positive, or negative; relative maximums and mini- mums; symmetries; and end behavior.
Tasks are limited to piecewise (including step and absolute value functions), quadratic, square root, and exponential functions.
Interpreting Functions★ (F.IF)

151 Revised February 5, 2021
B. Interpret functions that arise in applications in terms of the context.
M2.F.IF.B.4 Relate the domain of a function to its graph and, where applicable, to the context of the function it models.*
For example, if the function h(t) gives the height of a ball thrown in the air in terms of time, the interval between 0 and the time it hits the ground would be an appropriate domain for the function.
Tasks are limited to piecewise (including step and absolute value functions), quadratic, square root, and exponential functions.
M2.F.IF.B.5 Calculate and interpret the average rate of change of a function (presented algebraically or as a table) over a specified interval. Estimate and interpret the rate of change from a graph.*
Tasks are limited to piecewise (including step and absolute value functions), quadratic, square root, and exponential functions.
C. Analyze functions using different representation.
M2.F.IF.C.6 Graph functions expressed algebraically and show key features of the graph by hand and using technology.*
Key features include: intercepts; intervals where the function is increasing, decreasing, positive, or negative; relative maximums and minimums; symmetries; and end behavior.
Tasks are limited to piecewise (including step and absolute value functions), quadratic, square root, and exponential functions.

152 Revised February 5, 2021
C. Analyze functions using different representation.
M2.F.IF.C.7 Write a function defined by an expression in different but equivalent forms to reveal and explain different properties of the function.*
a. Rewrite quadratic functions to show zeros, extreme values, and symmetry of the graph, and interpret these in terms of a real-world context.*
b. Know and use the properties of exponents to interpret expressions for exponential functions in terms of a real-world context.*
For example, the growth of bacteria can be modeled by either f(t) = 3t+2 or g(t) = 9(3t) because the expression 3t+2 can be rewritten as (3t) (32) = 9(3t).
M2.F.IF.C.8 Compare properties of functions represented algebraically, graphically, numerically in tables, or by verbal descriptions.*
Functions may or may not have a real- world context.
a. Compare properties of two different functions. Functions may be of different types and/or represented in different ways.*
b. Compare properties of the same function on two different intervals or represented in two different ways.*
Tasks are limited to piecewise (including step and absolute value functions), quadratic, square root, and exponential functions.
Cluster Headings Content Standards Scope & Clarifications
A. Build a function that models a relationship between two quantities.
M2.F.BF.A.1 Build a function that describes a relationship between two quantities.*
a. Combine standard function types using arithmetic operations.
Tasks are limited to linear, exponential, and quadratic relationships. For example, if 1000 – 70x represents the number of items sold in a month and 0.5 + 0.1x represents the cost of each item, multiply (1000 – 70x)(0.5 + 0.1x) to write the quadratic function represent- ing the profit, where x is the number of 10- cent price increases.
(F.BF) Building Functions

153 Revised February 5, 2021
B. Build new functions from existing functions.
M2.F.BF.B.2 Identify the effect on the graph of replacing f(x) by f(x) + k, k f(x), f(kx), and f(x + k) for specific values of k (both positive and negative); find the value of k given graphs.
Experiment with cases and illustrate an explanation of the effects on the graph using technology.
Tasks are limited to quadratic, square root, and exponential functions.
Geometry
Congruence (G.CO)
Cluster Headings Content Standards Scope & Clarifications
A. Experiment with transformations in the plane.
M2.G.CO.A.1 Describe transformations as functions that take points in the plane (pre-image) as inputs and give other points (image) as outputs. Compare transformations that preserve distance and angle measure to those that do not, by hand for basic transformations and using technology for more complex cases.
For example, a translation will preserve both distances and angle measures associated with a figure, a compression based around a point preserves angle measures but not distances, and a horizontal stretch does not preserve either except in the cases of a vertical line, ray, or line segment.
Limit the comparison of transformations to figures graphed on a coordinate plane.
M2.G.CO.A.2 Given a rectangle, parallelogram, trapezoid, or regular polygon, determine the transformations that carry the shape onto itself and describe them in terms of the symmetry of the figure.
Limit transformations to figures graphed on a coordinate plane.

154 Revised February 5, 2021
M2.G.CO.A.3 Develop definitions of rotations, reflections, and translations in terms of angles, circles, perpendicular lines, parallel lines, and line segments.
There are no assessment limits for this standard. The entire standard is assessed in this course.
M2.G.CO.A.4 Given a geometric figure, draw the image of the figure after a sequence of one or more rigid motions, by hand and using technology. Identify a sequence of rigid motions that will carry a given figure onto another.
There are no assessment limits for this standard. The entire standard is assessed in this course.
B. Understand congruence in terms of rigid motions.
C. Use geometric theorems to justify relation- ships.
M2.G.CO.B.5 Given two figures, use the definition of congruence in terms of rigid motions to determine informally if they are congruent.
There are no assessment limits for this standard. The entire standard is assessed in this course.
M2.G.CO.B.6 Use the definition of congruence in terms of rigid motions to show that two triangles are congruent if and only if corresponding pairs of sides and corresponding pairs of angles are congruent.
There are no assessment limits for this standard. The entire standard is assessed in this course.
M2.G.CO.B.7 Explain how the criteria for triangle congruence (ASA, SAS, AAS, SSS, and HL) follow from the definition of congruence in terms of rigid motions.
There are no assessment limits for this standard. The entire standard is assessed in this course.
M2.G.CO.C.8 Use definitions and theorems about triangles to solve problems and to justify relationships in geometric figures.
“Justification” may take a variety of forms.
For example, tasks may include, but are not limited to: the segment joining midpoints of two sides of a triangle is parallel to the third side and half the length; the medians of a triangle meet at a point.

155 Revised February 5, 2021
M2.G.CO.C.9 Use definitions and theorems about parallelograms to solve problems and to justify relationships in geometric figures.
“Justification” may take a variety of forms. For example, tasks may include, but are not limited to: opposite sides of a parallelogram are congruent, opposite angles of a parallelogram are congruent, the diagonals of a parallelogram bisect each other, and conversely, rectangles are parallelograms with congruent diagonals.
Similarity, Right Triangles, and Trigonometry (G.SRT)
Cluster Headings Content Standards Scope & Clarifications
A. Understand similarity in terms of similarity transformations.
M2.G.SRT.A.1 Use properties of dilations given by a center and a scale factor to solve problems and to justify relationships in geometric figures.
There are no assessment limits for this standard. The entire standard is assessed in this course.
M2.G.SRT.A.2 Define similarity in terms of transformations. Use transformations to determine whether two figures are similar.
There are no assessment limits for this standard. The entire standard is assessed in this course.
B. Use similarity to solve problems and justify relationships.
M2.G.SRT.B.3 Use congruence and similarity criteria for triangles to solve problems and to justify relationships in geometric figures.
“Justification” may take a variety of forms. For example, tasks could include, but are not limited to: a line parallel to one side of a triangle divides the other two proportionally, and conversely; finding
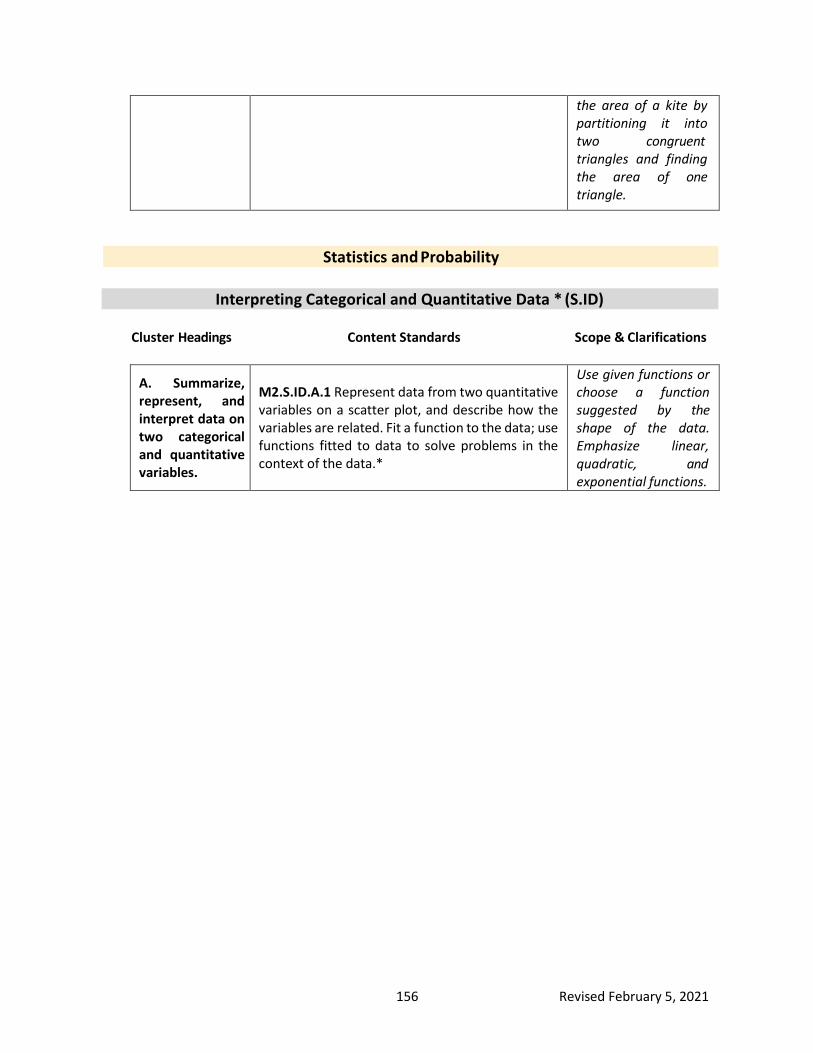
156 Revised February 5, 2021
the area of a kite by partitioning it into two congruent triangles and finding the area of one triangle.
Statistics and Probability
Interpreting Categorical and Quantitative Data * (S.ID)
Cluster Headings Content Standards Scope & Clarifications
A. Summarize, represent, and interpret data on two categorical and quantitative variables.
M2.S.ID.A.1 Represent data from two quantitative variables on a scatter plot, and describe how the variables are related. Fit a function to the data; use functions fitted to data to solve problems in the context of the data.*
Use given functions or choose a function suggested by the shape of the data. Emphasize linear, quadratic, and exponential functions.

157 Revised February 5, 2021
Integrated Math III | M3
“Students must learn mathematics with understanding, actively building new knowledge from experience and previous knowledge” (Principles and Standards for School Mathematics, NCTM). Thus, Integrated Mathematics III seeks to activate students’ prior learning experiences and connect new concepts in a coherent, conceptual manner while also building procedural fluency. This course develops conceptual understanding for cubic, cube root, and logarithmic expressions, equations, and functions. Students will use real-world data to model and interpret cubic and logarithmic relationships. Students will be given the opportunity to explore constructions and how to use geometry to model the real-world. A deep conceptual understanding of right triangle trigonometry, Law of Sines, and Law of Cosines will be a focus for the course. Probability and statistics play a large role in student learning in Integrated Mathematics III and prepares students to become statistically literate citizens. To develop mathematically proficient students, it is imperative attention be given to the Standards for Math Practice as instruction facilitates learning on these topics. Modeling real-world problems through mathematics anchors this course, and “engages students in meaningful learning through individual and collaborative experiences that promote their ability to make sense of mathematical ideas and reason mathematically” (Principles to Action, NCTM).
Mathematical Modeling
Mathematical Modeling is a Standard for Mathematical Practice (MP4) and a Conceptual
Category. Specific modeling standards appear throughout the high school standards indicated with a star (*). Where an entire domain is marked with a star, each standard in that domain is a modeling standard.
Standards for Mathematical Practice
Being successful in mathematics requires the development of approaches, practices, and habits
of mind that need to be in place as one strives to develop mathematical fluency, procedural skills, and conceptual understanding. The Standards for Mathematical Practice are meant to address these areas of expertise that teachers should seek to develop in their students. These approaches, practices, and habits of mind can be summarized as “processes and proficiencies” that successful mathematicians have as a part of their work in mathematics. Additional explanations are included in the main introduction of these standards.

158 Revised February 5, 2021
Standards for Mathematical Practice
1. Make sense of problems and persevere in solving them. 2. Reason abstractly and quantitatively. 3. Construct viable arguments and critique the reasoning ofothers. 4. Model with mathematics. 5. Use appropriate tools strategically. 6. Attend to precision. 7. Look for and make use of structure. 8. Look for and express regularity in repeated reasoning.
Literacy Standards for Mathematics
Communication in mathematics employs literacy skills in reading, vocabulary, speaking and
listening, and writing. Mathematically proficient students communicate using precise terminology and multiple representations including graphs, tables, charts, and diagrams. By describing and contextualizing mathematics, students create arguments and support conclusions. They evaluate and critique the reasoning of others, analyze, and reflect on their own thought processes. Mathematically proficient students have the capacity to engage fully with mathematics in context by posing questions, choosing appropriate problem-solving approaches, and justifying solutions. Further explanations are included in the main introduction.
Literacy Skills for Mathematical Proficiency
1. Use multiple reading strategies. 2. Understand and use correct mathematical vocabulary. 3. Discuss and articulate mathematical ideas. 4. Write mathematical arguments.

159 Revised February 5, 2021
Number and Quantity
Quantities * (N.Q)
Cluster Headings Content Standards Scope & Clarifications
A. Reason quantitatively and use units to understand problems.
M3.N.Q.A.1 Use units as a way to understand real- world problems.*
a. Choose and interpret the scale and the origin in graphs and data displays.
b. Use appropriate quantities in formulas, converting units as necessary.
c. Define and justify appropriate quantities within a context for the purpose of modeling.
d. Choose an appropriate level of accuracy when reporting quantities.
Apply this standard to any real-world problems studied within the scope of this course.

160 Revised February 5, 2021
Algebra
Seeing Structure in Expressions * (A.SSE)
Cluster Headings Content Standards Scope & Clarifications
A. Interpret the structure of expressions.
M3.A.SSE.A.1 Interpret expressions that represent a quantity in terms of its context.*
a. Interpret parts of an expression, such as terms, factors, and coefficients.*
b. Interpret complicated expressions by viewing one or more of their parts as a single entity.*
For example, view x(100 – 2x)(30 – 2x) as the product of the length, width, and height, which produces the volume of an open box made from a 100 by 30 rectangle with an x by x square cut out of each corner.
Tasks are limited to exponential, quadratic, and cubic expressions.
Arithmetic with Polynomials and Rational Expressions (A.APR)
Cluster Headings Content Standards Scope & Clarifications
M3.A.APR.A.1 Know and apply the Factor Polynomials are A. Understand Theorem: For a polynomial p(x) and a number a, limited to degree of the relationship p(a) = 0 if and only if (x – a) is a factor of p(x). three.
between zeros and factors of polynomials.
M3.A.APR.A.2 Identify zeros of polynomials when suitable factorizations are available and use the zeros to construct a rough graph of the function
Polynomials are limited to a degree of three.
defined by the polynomial.

161 Revised February 5, 2021
Creating Equations * (A.CED)
Cluster Headings Content Standards Scope & Clarifications
A. Create equations that describe numbers or relationships.
M3.A.CED.A.1 Create equations and inequalities in one variable and use them to solve problems in a real-world context.*
Tasks are limited to cubic, cube root, or exponential equations and inequalities.
M3.A.CED.A.2 Create equations in two variables to represent relationships between quantities and use them to solve problems in a real-world context. Graph equations with two variables on coordinate axes with labels and scales, and use the graphs to make predictions.*
Tasks are limited to cubic, cube root, and exponential equations.
M3.A.CED.A.3 Rearrange formulas to isolate a quantity of interest using algebraic reasoning.*
Tasks are limited to cubic, cube root, exponential, or logarithmic functions.
For example, rearrange the formula for the volume of a cube to isolate the side length.
Reasoning with Equations and Inequalities (A.REI)
Cluster Headings Content Standards Scope & Clarifications
A. Understand solving equations as a process of reasoning and explain the reasoning.
M3.A.REI.A.1 Understand solving equations as a process of reasoning and explain the reasoning. Construct a viable argument to justify a solution method.
Tasks are limited to cubic, cube root, and exponential equations.
M3.A.REI.A.2 Solve radical equations in one variable and identify extraneous solutions when they exist.
Limit radicand to a linear or quadratic expression. Limit the index to a value of 3.
Tasks may or may not have a real-world context.

162 Revised February 5, 2021
Functions
Interpreting Functions * (F.IF)
Cluster Headings Content Standards Scope & Clarifications
A. Understand the concept of a function and use function notation.
M3.F.IF.A.1 Use function notation.*
a. Use function notation to evaluate functions for inputs in their domains, including functions of two variables.*
b. Interpret statements that use function notation in terms of a context.
Use function notation with various functions of two variables. See functions as defined symbolically (e.g., f(a,b) = 3ab – a or a newly defined symbol like a$b = 3ab – a).
M3.F.IF.A.2 Understand geometric formulas as functions.*
Limit to cubic functions. For example, see geometric formulas such as the volume of a cube and volume of a sphere as cubic functions.
B. Interpret functions that arise in applications in terms of the context.
M3.F.IF.B.3 For a function that models a relationship between two quantities, interpret key features of graphs and tables in terms of the quantities, and sketch graphs showing key features given a verbal description of the relationship.*
Key features include: intercepts; intervals where the function is increasing, decreas- ing, positive, or negative; relative maximums and minimums; symmetries; end behavior; and/or asymptotes where appropriate.
Tasks are limited to piecewise, cubic, cube root, exponential, and logarithmic functions.
M3.F.IF.B.4 Calculate and interpret the average rate of change of a function (presented algebraically or as a table) over a specified interval. Estimate and interpret the rate of change from a graph.*
There are no assessment limits for this standard. The entire standard is assessed in this course.

163 Revised February 5, 2021
C. Analyze functions using different representations.
M3.F.IF.C.5 Graph functions expressed algebraically and show key features of the graph by hand and using technology.*
Key features include: intercepts; intervals where the function is increasing, decreasing, positive, or negative; relative maximums and minimums; symmetries; end behavior; and/or asymptotes where appropriate.
Tasks are limited to piecewise, cubic, cube root, exponential, and logarithmic functions.
M3.F.IF.C.6 Compare properties of functions represented algebraically, graphically, numerically in tables, or by verbal descriptions.*
a. Compare properties of two different functions. Functions may be of different types and/or represented in different ways.*
b. Compare properties of the same function on two different intervals or represented in two different ways.*
Functions may or may not have a real-world context.
Tasks are limited to piecewise, cubic, cube root, exponential, and logarithmic functions.
Building Functions (F.BF)
Cluster Headings Content Standards Scope & Clarifications
A. Build new functions from existing functions.
M3.F.BF.A.1 Build a function that describes a relationship between two quantities.*
a. Combine standard function types using composition.
For example, given a product originally priced at $x is $4 off, build a function using composition that would calculate the final price including 10% sales tax (i.e., f(g(x)) = 1.10(x – 4)).
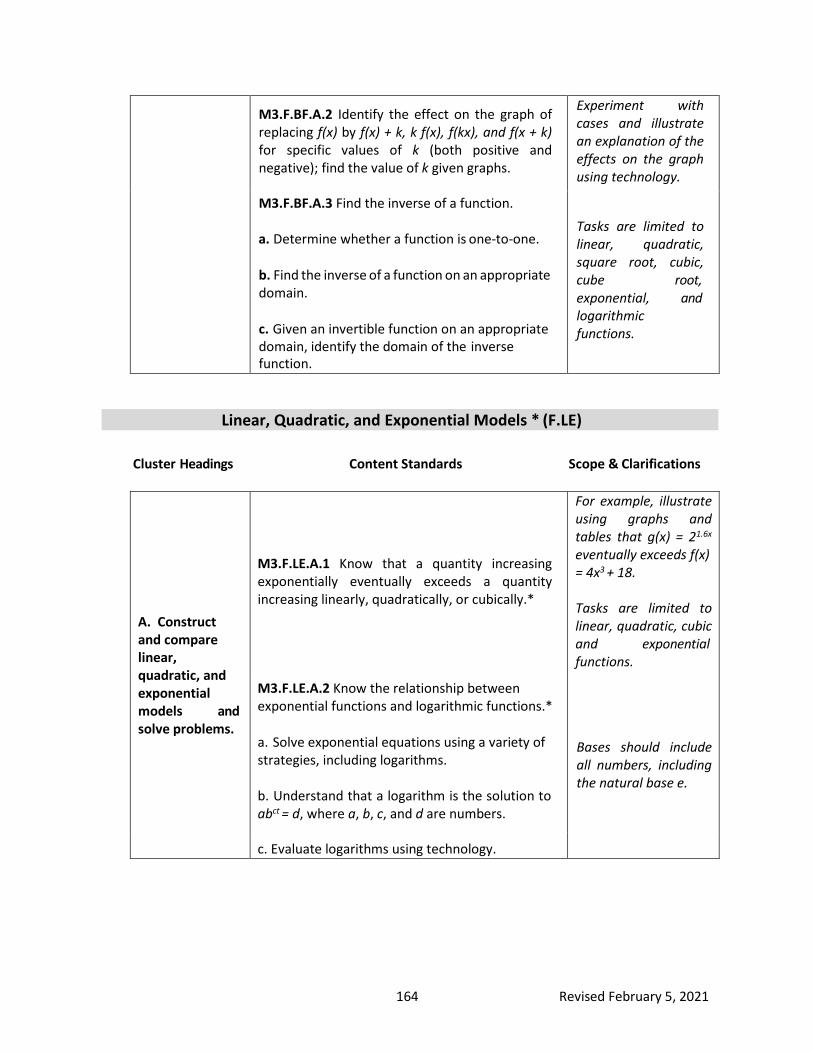
164 Revised February 5, 2021
M3.F.BF.A.2 Identify the effect on the graph of replacing f(x) by f(x) + k, k f(x), f(kx), and f(x + k) for specific values of k (both positive and negative); find the value of k given graphs.
Experiment with cases and illustrate an explanation of the effects on the graph using technology.
M3.F.BF.A.3 Find the inverse of a function.
a. Determine whether a function is one-to-one.
b. Find the inverse of a function on an appropriate domain.
c. Given an invertible function on an appropriate domain, identify the domain of the inverse function.
Tasks are limited to linear, quadratic, square root, cubic, cube root, exponential, and logarithmic functions.
Linear, Quadratic, and Exponential Models * (F.LE)
Cluster Headings Content Standards Scope & Clarifications
A. Construct and compare linear, quadratic, and exponential models and solve problems.
M3.F.LE.A.1 Know that a quantity increasing exponentially eventually exceeds a quantity increasing linearly, quadratically, or cubically.*
For example, illustrate using graphs and tables that g(x) = 21.6x
eventually exceeds f(x) = 4x3 + 18.
Tasks are limited to linear, quadratic, cubic and exponential functions.
M3.F.LE.A.2 Know the relationship between exponential functions and logarithmic functions.*
a. Solve exponential equations using a variety of strategies, including logarithms.
b. Understand that a logarithm is the solution to abct = d, where a, b, c, and d are numbers.
Bases should include all numbers, including the natural base e.
c. Evaluate logarithms using technology.

165 Revised February 5, 2021
Geometry
Circles * (G.C)
Cluster Headings Content Standards Scope & Clarifications
A. Find areas of sectors of circles.
M3.G.C.A.1 Use proportional relationships between the area of a circle and the area of a sector within the circle to solve problems and represent solutions in a real-world context.*
Angles are measured in degrees.
Similarity, Right Triangles, and Trigonometry (G.SRT)
Cluster Headings Content Standards Scope & Clarifications
A. Define trigonometric ratios and solve problems involving triangles.
M3.G.SRT.A.1 Use side ratios in right triangles to define trigonometric ratios.
a. Understand that by similarity, side ratios in right triangles are properties of the angles in the triangle, leading to definitions of trigonometric ratios for acute angles.
b. Explain and use the relationship between the sine and cosine of complementary angles.
There are no assessment limits for this standard. The entire standard is assessed in this course.
M3.G.SRT.A.2 Solve triangles.*
a. Know and use the Pythagorean Theorem and trigonometric ratios (sine, cosine, tangent, and their inverses) to solve right triangles in a real-world context.*
b. Know and use relationships within special right triangles to solve problems in a real-world context.*
c. Use the Law of Sines and Law of Cosines to solve non-right triangles in a real-world context.*
For part c: exclude ambiguous cases.

166 Revised February 5, 2021
Modeling with Geometry * (G.MG)
Cluster Headings Content Standards Scope & Clarifications
A. Apply geometric concepts in modeling situations.
M3.G.MG.A.1 Use geometric shapes, their measures, and their properties to model objects found in a real-world context for the purpose of approximating solutions to problems.*
For example, determine which geometric shape best approximates a real- world object.
Geometric Measurement and Dimension (G.GMD)
Cluster Headings Content Standards Scope & Clarifications
A. Explain volume and surface area formulas and use them to solve problems.
M3.G.GMD.A.1 Understand and explain the formulas for the volume and surface area of a cylinder, cone, prism, and pyramid.
Informal arguments are limited to dissection. Memorizing the formulas is not required.
M3.G.GMD.A.2 Use volume and surface area formulas for cylinders, cones, prisms, pyramids, and spheres to solve problems in a real-world context.*
There are no assessment limits for this standard. The entire standard is assessed in this course.
Statistics and Probability
Interpreting Categorical and Quantitative Data * (S.ID)
Cluster Headings Content Standards Scope & Clarifications
A. Summarize, represent, and interpret data on a single count or measurement variable.
M3.S.ID.A.1 Use measures of center to solve real- world and mathematical problems.*:
Measures of center should include mean (including weighted averages), median, and mode.
For example, a course has 6 tests during the semester. If your average after the first
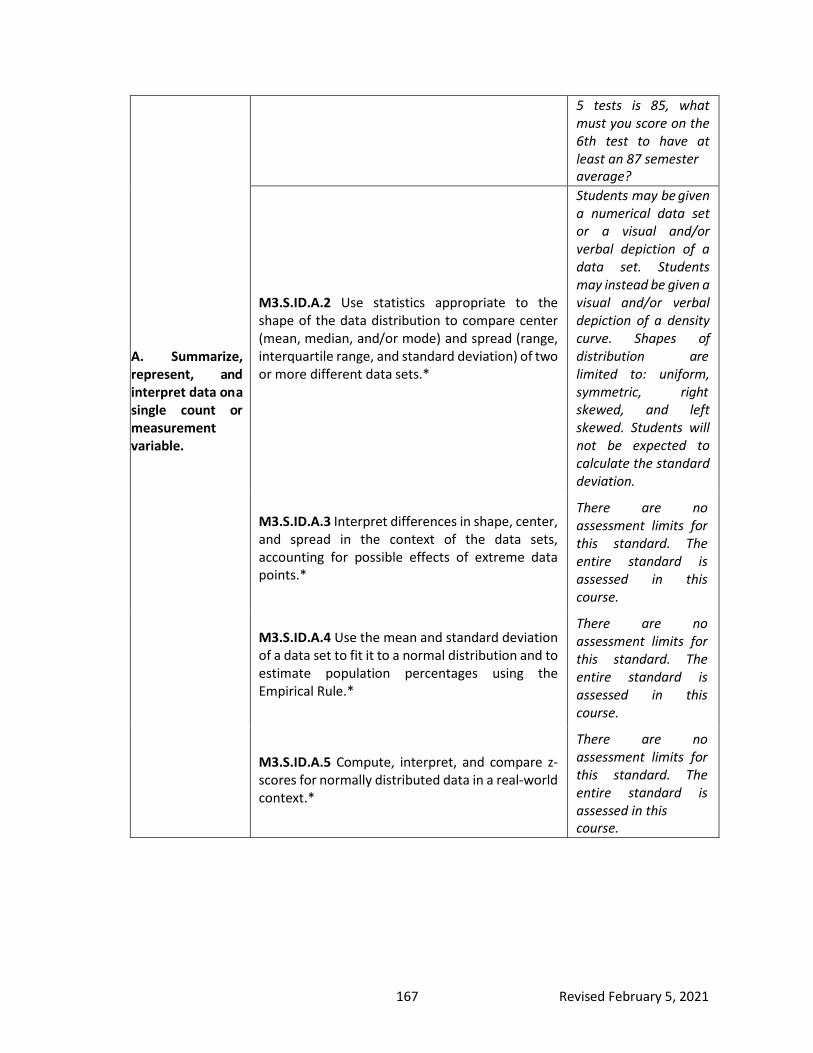
167 Revised February 5, 2021
A. Summarize, represent, and interpret data on a single count or measurement variable.
5 tests is 85, what must you score on the 6th test to have at least an 87 semester average?
M3.S.ID.A.2 Use statistics appropriate to the shape of the data distribution to compare center (mean, median, and/or mode) and spread (range, interquartile range, and standard deviation) of two or more different data sets.*
Students may be given a numerical data set or a visual and/or verbal depiction of a data set. Students may instead be given a visual and/or verbal depiction of a density curve. Shapes of distribution are limited to: uniform, symmetric, right skewed, and left skewed. Students will not be expected to calculate the standard deviation.
M3.S.ID.A.3 Interpret differences in shape, center, and spread in the context of the data sets, accounting for possible effects of extreme data points.*
There are no assessment limits for this standard. The entire standard is assessed in this course.
M3.S.ID.A.4 Use the mean and standard deviation of a data set to fit it to a normal distribution and to estimate population percentages using the Empirical Rule.*
There are no assessment limits for this standard. The entire standard is assessed in this course.
M3.S.ID.A.5 Compute, interpret, and compare z- scores for normally distributed data in a real-world context.*
There are no assessment limits for this standard. The entire standard is assessed in this course.

168 Revised February 5, 2021
B. Summarize, represent, and interpret data on two categorical and quantitative variables.
M3.S.ID.B.6 Represent data from two quantitative variables on a scatter plot, and describe how the variables are related. Fit a function to the data; use functions fitted to data to solve problems in the context of the data.*
Use given functions or choose a function suggested by the shape of the data.
Tasks are limited to linear, quadratic, cubic, logarithmic, and exponential functions.
Making Inferences and Justifying Conclusions * (S.IC)
Cluster Headings Content Standards Scope & Clarifications
A. Make inferences and justify conclusions from sample surveys, experiments, and observational studies.
M3.S.IC.A.1 Recognize the purposes of and differences among sample surveys, experiments, and observational studies.*
For example, in a given situation, is it more appropriate to use a sample survey, an experiment, or an observational study?
M3.S.IC.A.2 Identify potential sources of bias in statistical studies.*
Sources of bias include but are not limited to: leading questions, lack of randomization, sampling bias, undercoverage, nonresponse, and/or small sample size.
M3.S.IC.A.3 Distinguish between a statistic and a parameter. Evaluate reports based on data and recognize when poor conclusions are drawn from well-collected data.*
There are no assessment limits for this standard. The entire standard is assessed in this course.

169 Revised February 5, 2021
Conditional Probability and the Rules of Probability * (CP)
Cluster Headings Content Standards Scope & Clarifications
A. Understand independence and conditional probability and use them to create visual representations of data.
M3.S.CP.A.1 Use set notation to represent contextual situations.*
a. Describe events as subsets of a sample space (the set of outcomes) using characteristics (or categories) of the outcomes, or as unions, intersections, or complements of other events ("or", "and", "not").
b. Flexibly move between visual models (Venn diagrams, frequency tables, etc.) and set notation.
There are no assessment limits for this standard. The entire standard is assessed in this course.
M3.S.CP.A.2 Recognize and explain the concepts of conditional probability and independence in everyday language and everyday situations. Categorize events as independent or dependent.*
There are no assessment limits for this standard. The entire standard is assessed in this course.
B. Understand and apply basic concepts of probability.
M3.S.CP.B.3 Apply statistical counting techniques.*
a. Use the Fundamental Counting Principle to compute probabilities of compound events and solve problems.*
b. Use permutations and combinations to compute probabilities of compound events and solve problems.*
There are no assessment limits for this standard. The entire standard is assessed in this course.
M3.S.CP.B.4 Use the Law of Large Numbers to assess the validity of a statistical claim.*
There are no assessment limits for this standard. The entire standard is assessed in this course.

170 Revised November 6, 2020
C. Use the rules of probability to compute probabilities of compound events in a uniform probability model.
M3.S.CP.C.5 Find the conditional probability of A given B as the fraction of B’s outcomes that also belong to A and interpret the answer in terms of the given context.*
For example, a teacher gave two exams. 75 percent passed the first exam and 25 percent passed both. What percent who passed the first exam also passed the second exam?
Calculating conditional probability may be performed via use of a visual model (Venn diagrams, frequency tables, etc.), calculation/formula, or by using counting techniques.
M3.S.CP.C.6 Understand and apply the Addition Rule.*
a. Explain the Addition Rule, P(A or B) = P(A) + P(B) – P(A and B) in terms of visual models (Venn diagrams, frequency tables, etc.).*
b. Apply the Addition Rule to solve problems and interpret the answer in terms of the given context.*
For example, in a math class of 32 students, 14 are boys and 18 are girls. On a unit test 6 boys and 5 girls made an A. If a student is chosen at random from a class, what is the probability of choosing a girl or an A student?
M3.S.CP.C.7 Calculate probabilities using geometric figures.*
Geometric figures include line segments, two-dimensional shapes, and three- dimensional solids.