Tems Automatic 9.0 Brochure
8
TEMS™ PRODUCTS TEMS ™ AUTOMATIC AUTONOMOUS NETWORK MONITORING SYSTEM
-
Upload
gsmman2006 -
Category
Documents
-
view
218 -
download
0
Transcript of Tems Automatic 9.0 Brochure
7/27/2019 Tems Automatic 9.0 Brochure
http://slidepdf.com/reader/full/tems-automatic-90-brochure 1/8
TEMS™ PRODUCTS
TEMS™ AUTOMATIC
AUTONOMOUS NETWORK MONITORING SYSTEM

7/27/2019 Tems Automatic 9.0 Brochure
http://slidepdf.com/reader/full/tems-automatic-90-brochure 2/8
2
Mobile network operators must
receive continuous eedback on a live
network’s quality o service (QoS), see
the impact o optimization eorts on
a regular basis, and have an accurate
means o measuring quality as
perceived by subscribers.
TEMS™ AUTOMATIC 9.0
GAIN CONTROL OF YOUR NETWORK’S QUALITY
TEMS Automatic provides an autonomous system that uses test probes to:
Continuously monitor and measure a live network’s QoS
(as well as that o their competitors)
Collect accurate quality measurements as perceived by subscribers
Transer that perormance and measurement data back to a central server or
efcient analysis and report generation
7/27/2019 Tems Automatic 9.0 Brochure
http://slidepdf.com/reader/full/tems-automatic-90-brochure 3/8
3TEMS™ AUTOMATIC 9.0
In the competitive mobile Internet environment, delivering
quality o service (QoS) is the key. Good QoS can make the
dierence between a satisfed subscriber and a ormer sub-
scriber. Operators must take control o network quality. To
best manage this, the operator must receive continuous
eedback on the live network’s QoS, see the impact o opti-
mization eorts on a regular basis, and have an accurate
means o measuring quality as perceived by subscribers.
In an eort to ulll these requirements, operators
have various traditional channels or gathering inormation.
One channel is the collection o “xed side” data, rom the
operations support system/network management system
(OSS/NMS). This data is necessary but is generally used only
or statistical analysis; without detailed processing, OSS
data is limited when it comes to QoS evaluation and the end
user’s experience.
Another source o network inormation comes rom the
operator’s own customer care department. While this is
certainly a valuable source o data about network problems,
it, too, is limited. Relatively ew subscribers will call a cus-
tomer care center when they are having problems. The rest
may not complain, but they will be more l ikely to switch to
a competitor. In addition, these disgruntled subscribers can
spread negative word-o-mouth inormation regarding
your network.
Yet another way that network operators have tradition-
ally obtained network data is through manual drive tests.
Drive testing provides a wealth o valuable inormation, but
is limited by time and resources. Drive tests are usually per-
ormed on a set schedule, during regular working hours.
They are not always perormed when the need is greatest,
at times like rush hours and weekends. In addition, manual
test tools do not conduct end-to-end measurements.
Although they are perectly suited or troubleshooting and
optimization, manual tests do not collect enough to deliver
statistically reliable data.
TEMS Automatic, however, exceeds the limitations o
any other method. It is an autonomous system that uses test
probes to collect network inormation which is transerred
back to a central server or analysis and report generation.
An end-to-end solution, it employs handsets making calls
over the air interace, so that it can test rom a subscriber’s
perspective automatically.
By working over the entire network area, 24 hours a
day, seven days a week, it gives statistically reliable data as
well as QoS inormation. It tests your network and your com-
petitors’ networks, giving air and accurate comparisons.
STREAMLINED OPERATIONS AND IMPROVED QoS
TEMS Automatic assesses network quality rom a subscriber’s
perspective by perorming true end-to-end testing o both
voice and data services. It is a complete solution, oering
eective quality monitoring and troubleshooting, while also
enabling operators to discover network weaknesses and
implement corrections eciently and thoroughly. TEMS
Automatic has developed a comprehensive multi-technology
platorm that supports GSM/GPRS/EDGE, WCDMA R99, dual
carrier HSPA+, and LTE.
TEMS Automatic helps operators to:
▪ Increase revenue – Problems can be located and xed
beore they start aecting customers, thus improving
customer satisaction and reducing churn. Fewer blocked
and dropped calls mean more call time and higher earn-
ings. A high QoS also helps attract new subscribers.
▪ Increase eciency – Because it is autonomous, TEMS
Automatic is very cost- and sta-ecient, providing a
comprehensive and continuously updated overview o
network quality.
▪ Optimize investments – A wireless telecom network rep-
resents a huge capital outlay. The network needs to be
optimized to bring the best possible return. TEMS
Automatic urnishes the data needed to make wise in-
vestment decisions.
TEMS Automatic completes theinormation picture
HOW DOES AN OPERATOR KEEP CUSTOMERS SATISFIED?

7/27/2019 Tems Automatic 9.0 Brochure
http://slidepdf.com/reader/full/tems-automatic-90-brochure 4/8
4 TEMS™ AUTOMATIC 9.0
What do you get with TEMS Automatic?
▪ Insight into the end user’s perception o the network, thanks to measure-
ments taken in the air interace rather than in network nodes (where
other monitoring tools are used). A aithul measure o the end-to-end
quality is obtained both or voice and data services.
▪ 24/7 measurements – without the cost o 24/7 sta. Every corner o the
network is probed around the clock by autonomous data collecting units.
The state o the network as perceived by subscribers can be ed back to
technicians and modied at a pace approaching real-time control.
▪ Automated measurements – in the truest sense o the word. Not only test
calls and measurements, but also data uploading and system congura-
tion are carried out automatically. This enables rapid eedback on the state
o the network – almost in real time – to the entire organization, all the
way rom management to RF engineers in the eld.
▪ Analysis and benchmarking with the aid o map, chart, and spreadsheet
presentations o high-level statistics as well as individual routes. Operators,
networks, or geographical areas can be benchmarked with respect to
user-selected perormance parameters. TEMS Automatic data can serve
as input to statistical reports produced by reporting solutions supporting
Microsot® OLAP and Microsot® SQL Server, such as Microsot® Excel and
Microsot® Reporting service.
NEAR-REAL-TIME DELIVERY OF DETAILED NETWORK DATA
For true end-to-end testing o wireless
networks, discover the autonomous
network monitoring solution TEMS
Automatic.
TEMS Automatic is an autonomous system
that uses in-vehicle, fxed location, or
handheld test probes. It sends network
inormation back via the air interace to a
central server or analysis and report
generation.
7/27/2019 Tems Automatic 9.0 Brochure
http://slidepdf.com/reader/full/tems-automatic-90-brochure 5/8
5TEMS™ AUTOMATIC 9.0
The vast amount o network data available rom TEMS
Automatic gives the operator the key to maintaining and
improving network quality. TEMS Automatic analyzes col-
lected data and presents the results in reports and presen-
tations. These show where services are unsatisactory, al-
lowing operators to locate and x problems beore they
start aecting subscribers.
To analyze problem areas, operators can choose to use
TEMS™ Presentation to access TEMS Automatic data, TEMS™
Investigation data, or TEMS™ Pocket data, and to present it
graphically as statistics in routes or in plots/bins o any
shape. This makes it easy to see the network’s QoS, while
also allowing operators to nd the cause o any problem.
All measurements and events (radio parameters, signaling,
etc.) o each single conversation, rom call setup to call end,
can be presented on a map, in a spreadsheet, in line charts,
and in inormation windows. All views are linked together
or maximum benet.
TEMS Automatic benets all levels o the operator’s
organization. Reports and other inormation can be distrib-
uted throughout the organization to show in detail what
the current network situation looks like.
▪ Managers are able to supervise the organization’s pro-
cesses and the services they oer. They can keep track o
key perormance indicators (KPIs), including speech qual-
ity targets, by studying reports automatically distilled
rom measurement data at user-specifed times. They are
aided in making decisions on investments and organiza-
tional improvements. By getting a tighter grip on end-to-
end voice and data quality, the company is in a better
position to oer customers reliable service level agree-
ments. TEMS Automatic results can also give managers
an indirect view o their own workorce’s perormance.
▪ Network planners learn about places with recurrent prob-
lems by requesting statistics conned to specic areas.
This helps them reveal deciencies in their layout or the
underlying theoretical models, and provides input or im-
provements. As a result they are able to boost network
utilization and get maximum mileage out o the existing
network beore new investments are made.
▪ Optimizers are notied o all sorts o local malunctions
(weak signal reception, bad C/I, low data throughput,
etc.), prompting them to try out various adjustments to
the network conguration. For more intricate problems
and in-depth analyses, a post-processing solution like
TEMS™ Discovery is an indispensable complement.
▪ Marketing sta can extract statistics on coverage, ser-
vices, and customer usage, thus urnishing the basis or
precisely targeted advertising campaigns.
▪ Customer care representatives can view reports that give
them an idea o which problems occur in the network in
various areas. They can understand coverage and avail-
able services as well. All o this inormation can be used
to better answer customer questions and address concerns.
▪ Network operations sta can monitor network services
and receive SNMP alarms or non-working services.
Because TEMS Automatic relies upon device-based mea-
surements, it truly tests rom the user’s perspective. It
monitors the radio interace, and conducts end-to-end
voice and data testing. It is unattended and operated re-
motely, reeing operations personnel rom routine drive
testing while providing more network data than directed
drive tests can. It provides multi-technology support in a
single platorm, and can test competitors’ networks along
with the operator’s network, or accurate comparison.
TEMS Automatic is designed to collect huge amounts
o data rom the network with minimal human eort. The
system is objective, and collects and reveals network quality
independently, no matter who the inrastructure provider(s)
may be. A variety o test units, including mobile remote test
units (RTUs), handheld test units, and xed RTUs, are de-
ployed throughout the network to place test calls that
simulate the end user’s experience.
These test units perorm network testing automati-
cally, according to fexible, user-dened measurement
orders. Air interace data is recorded and sent to the central
server over the data channel.
MEETING NEEDS THROUGHOUT YOUR ORGANIZATION
7/27/2019 Tems Automatic 9.0 Brochure
http://slidepdf.com/reader/full/tems-automatic-90-brochure 6/8
6 TEMS™ AUTOMATIC 9.0
Positioned data
A Global Positioning System (GPS) receiver is integrated in
the test units. It captures location during measurements,
allowing data to be geographically positioned in map views.
Quality measurements
TEMS Automatic measures uplink and downlink voice and
data services end-to-end rom the user’s perspective. This
gives operators control over the quality they oer, as well as
the ability to track down network weak spots. Measuring KPIs
allows impartial comparison o dierent networks. Together
with these KPI measurements, the system also supplies
in-depth technical measurements that give a perect ounda-
tion or analysis and problem solving.
Data quality
Data service perormance measurements are perormed on
the air interace layers (RLC/LLC), and in the application
layer (TCP), by measuring industry-standard KPIs. These
KPIs include setup/send/receive timers and the various
data throughput rates at which services have been trans-
erred over the network. Typical services that are used or
data testing include FTP, HTTP, and SMS, as well as new
services such as video streaming/mobile TV, MMS, and WAP.
VSQI
The Video Streaming Quality Index (VSQI) is a non-reerence
method or video streaming quality assessment. VSQI is
based on the quality o the encoded (compressed) signal
prior to transmission, the amount o initial delay, and the
subsequent interruptions during playback o the video se-
quence; that is, the time required or initial buering and
the incidence o rebuering. It also takes into account the
amount o packet loss at the application level (in other
words, in the video streaming client). VSQI is expressed in
the MOS scale.
Speech quality
TEMS Automatic oers unctionality or advanced speech
quality assessment by testing mobile-to-mobile or mobile-
to-xed networks.
POLQA (Perceptual Objective Listening Quality Assessment)
algorithm, standardized as ITU Recommendation P.863.
POLQA is measured in a mobile-to-mobile conguration
(RTU to RTU, or RTU to Mobile Call Generator), and is used
with NB (narrowband, 300-3400 Hz) or SWB (super-wide-
band, 50-14000 Hz) operational mode.
PESQ (Perceptual Evaluation o Speech Quality) algorithm,
standardized as ITU Recommendation P.862.1. PESQ is
measured in a mobile-to-xed conguration (RTU to Call
Generator) as well as in a mobile-to-mobile conguration
(RTU to RTU, or RTU to Mobile Call Generator1).
SQI (Speech Quality Index), an algorithm which uses radio
link parameters to calculate the perceived speech quality
on a radio channel. SQI values are based on bit error and
rame erasure rates and their respective distributions, as
well as handover events, DTX percentage, and the choice
o speech codec. SQI is expressed in the MOS scale.
Both PESQ and POLQA are designed to mimic human speech
perception. Throughout test calls, a speech sentence is
played on the voice channel. The PESQ or POLQA algorithm
computes a quality estimate by comparing the transmitted
sentence with the undistorted reerence, taking also the
xed-side equipment into account, providing scores cali-
brated to the MOS scale
For almost a decade, the intrusive perceptual solution
or listening speech quality evaluation has been PESQ stan-
dard P.862 (along with P.862.1, 2, and 3). With the 3G net-
work evolution towards all IP, particularly NGN (LTE/SAE-
SON), ITU-T recognized the industry’s immediate need or
a new standard that would both improve current PESQ
perormance under certain specic network conditions and
cover 3G network evolution or voice service: rom tradi-
tional CS to VoIP and VoIP over IMS, rom NB to WB and SWB,
and rom low codec rates to very low and adaptive codec
rates. As a result, POLQA was developed.
PESQ and POLQA are both part o a larger package o
audio quality measurements (AQM) that also includes echo
delay and attenuation, speech path delay, volume level, and
silent call detection, as well as it includes requent audio
quality measurements (AQMs). AQM gives quality scores
with twice the requency o PESQ or P:OLQA algorithm. This
makes it easier to geographically pinpoint speech quality
problems and to nd the corresponding radio problem.
By using PESQ/POLQA and SQI together it is possible
to detect non-radio problems that aect speech quality
AUTONOMOUS NETWORK MONITORING
7/27/2019 Tems Automatic 9.0 Brochure
http://slidepdf.com/reader/full/tems-automatic-90-brochure 7/8
7TEMS™ AUTOMATIC 9.0
(suggested by a good SQI and a bad PESQ/POLQA value
occurring simultaneously).
PESQ is supported or mobile-to-mobile and mobile-
to-xed testing, and POLQA is supported or mobile-to-
mobile testing.
C/I measurements
TEMS Automatic can also measure the carrier to interer-
ence (C/I) ratio, another important parameter when assess-
ing radio network perormance. C/I is the ratio between the
signal strength o the current serving cell and the signal
strength o interering signal components. C/I is measured
in real time in idle, dedicated, and packet mode, and can
also be measured in requency hopping networks.
The measured average C/I can be presented or each re-
quency used, and this data makes it possible to identiy
requencies exposed to high levels o radio intererence.
Frequency scanning
Using the handset, the RTU can perorm both GSM and
WCDMA scanning. In GSM scan mode, the handset can scan
any channels including BSIC decoding. In WCDMA scan mode,
the handset can perorm CPICH scanning on up to 12 carriers
(UARFCNs), as well as request layer 3 decoding. It is also pos-
sible to connect an external scanner and have the data up-
loaded via the RTU.
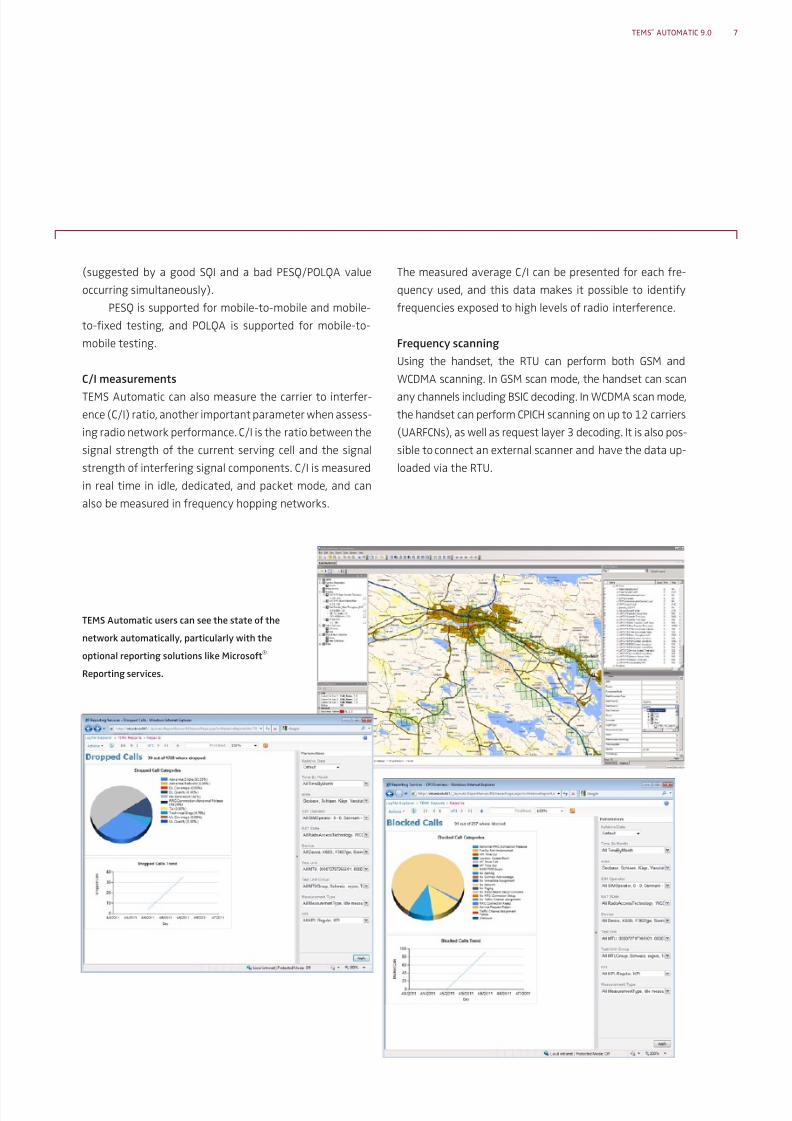
TEMS Automatic users can see the state o the
network automatically, particularly with the
optional reporting solutions like Microsot®
Reporting services.
7/27/2019 Tems Automatic 9.0 Brochure
http://slidepdf.com/reader/full/tems-automatic-90-brochure 8/8
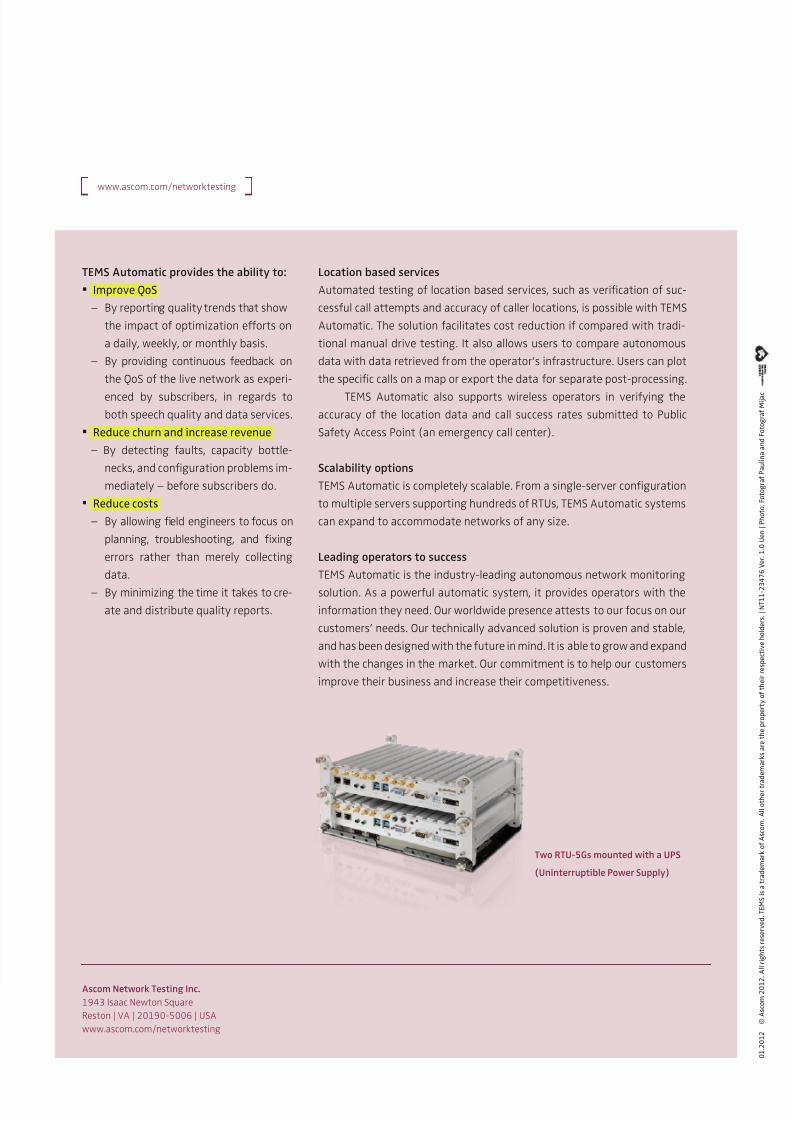
Two RTU-5Gs mounted with a UPS
(Uninterruptible Power Supply)
TEMS Automatic provides the ability to:
▪ Improve QoS
– By reporting quality trends that show
the impact o optimization eorts on
a daily, weekly, or monthly basis.
– By providing continuous eedback on
the QoS o the live network as experi-
enced by subscribers, in regards to
both speech quality and data services.
▪ Reduce churn and increase revenue
– By detecting aults, capacity bottle-
necks, and conguration problems im-
mediately – beore subscribers do.
▪ Reduce costs
– By allowing eld engineers to ocus on
planning, troubleshooting, and xing
errors rather than merely collecting
data.
– By minimizing the time it takes to cre-
ate and distribute quality reports.
www.ascom.com/networktesting
Location based services
Automated testing o location based services, such as verication o suc-
cessul call attempts and accuracy o caller locations, is possible with TEMS
Automatic. The solution acilitates cost reduction i compared with tradi-
tional manual drive testing. It also allows users to compare autonomous
data with data retrieved rom the operator’s inrastructure. Users can plot
the specic calls on a map or export the data or separate post-processing. TEMS Automatic also supports wireless operators in veriying the
accuracy o the location data and call success rates submitted to Public
Saety Access Point (an emergency call center).
Scalability options
TEMS Automatic is completely scalable. From a single-server conguration
to multiple servers supporting hundreds o RTUs, TEMS Automatic systems
can expand to accommodate networks o any size.
Leading operators to success
TEMS Automatic is the industry-leading autonomous network monitoring
solution. As a powerul automatic system, it provides operators with the
inormation they need. Our worldwide presence attests to our ocus on our
customers’ needs. Our technically advanced solution is proven and stable,
and has been designed with the uture in mind. It is able to grow and expand
with the changes in the market. Our commitment is to help our customers
improve their business and increase their competitiveness.
Ascom Network Testing Inc.
1943 Isaac Newton Square
Reston | VA | 20190-5006 | USA
www.ascom.com/networktesting
0 1 . 2
0 1 2
© A
s c o m
2 0 1 2 .
A l l r i g h t s r e s e r v e d .
T E M S i s a t r a d e m a r k o f A s c o m .
A l l o t h e r t r
a d e m a r k s a r e t h e p r o p e r t y o f t h e i r r e s p e c t i v e h o l d e r s .
| N T 1 1 - 2
3 4 7 6 V e r . 1 . 0
U e n | P h o t o : F o t o g r a f P a u l i n a a n d F o t o g r a f M i j a c