
Temperature measurement during solidification of thin wall ... Temperature measurement...
18
General rights Copyright and moral rights for the publications made accessible in the public portal are retained by the authors and/or other copyright owners and it is a condition of accessing publications that users recognise and abide by the legal requirements associated with these rights. Users may download and print one copy of any publication from the public portal for the purpose of private study or research. You may not further distribute the material or use it for any profit-making activity or commercial gain You may freely distribute the URL identifying the publication in the public portal If you believe that this document breaches copyright please contact us providing details, and we will remove access to the work immediately and investigate your claim. Downloaded from orbit.dtu.dk on: Mar 17, 2020 Temperature measurement during solidification of thin wall ductile cast iron. Part 1: Theory and experiment Pedersen, Karl Martin; Tiedje, Niels Skat Published in: Measurement Link to article, DOI: 10.1016/j.measurement.2007.05.002 Publication date: 2008 Link back to DTU Orbit Citation (APA): Pedersen, K. M., & Tiedje, N. S. (2008). Temperature measurement during solidification of thin wall ductile cast iron. Part 1: Theory and experiment. Measurement, 41(5), 551. https://doi.org/10.1016/j.measurement.2007.05.002
Transcript of Temperature measurement during solidification of thin wall ... Temperature measurement...
General rights Copyright and moral rights for the publications made accessible in the public portal are retained by the authors and/or other copyright owners and it is a condition of accessing publications that users recognise and abide by the legal requirements associated with these rights.
Users may download and print one copy of any publication from the public portal for the purpose of private study or research.
You may not further distribute the material or use it for any profit-making activity or commercial gain
You may freely distribute the URL identifying the publication in the public portal If you believe that this document breaches copyright please contact us providing details, and we will remove access to the work immediately and investigate your claim.
Downloaded from orbit.dtu.dk on: Mar 17, 2020
Temperature measurement during solidification of thin wall ductile cast iron. Part 1:Theory and experiment
Pedersen, Karl Martin; Tiedje, Niels Skat
Published in:Measurement
Link to article, DOI:10.1016/j.measurement.2007.05.002
Publication date:2008
Link back to DTU Orbit
Citation (APA):Pedersen, K. M., & Tiedje, N. S. (2008). Temperature measurement during solidification of thin wall ductile castiron. Part 1: Theory and experiment. Measurement, 41(5), 551.https://doi.org/10.1016/j.measurement.2007.05.002
Post-print of article in Measurement 41 (2008) 551-560 Link to article: http://dx.doi.org/10.1016/j.measurement.2007.05.002
Temperature measurement during solidification of thin wall ductile cast iron. Part 1: Theory and experiment Submitted to Measurement 1. July 2005. Accepted 9. May 2007 K. M. Pedersen and N. Tiedje*
Department of Manufacturing Engineering and Management, Technical University of Denmark, Building 425, DK-2800 Kgs. Lyngby, Denmark * Corresponding author: Tel: +45 4525 4719; Fax: +45 4593 4570; E-mail address: [email protected] Post-print of article in Measurement 41 (2008) 551-560 (Layout and minor sub-editing changes have been made to the published article) Link to article: http://dx.doi.org/10.1016/j.measurement.2007.05.002 Link to journals homepage: www.elsevier.com/locate/measurement
Abstract Temperature measurement using thermocouples (TC’s) influence solidification of the casting, especially in thin wall castings. The problems regarding acquisition of detailed cooling curves from thin walled castings is discussed. Experiments were conducted where custom made TC’s were used to acquire cooing curves in thin wall ductile iron castings. The experiments show how TC’s of different design interact with the melt and how TC design and surface quality affect the results of the data acquisition. It is discussed which precautions should be taken to ensure reliable acquisition of cooling curves. Measurement error depending on TC design and cooling conditions is shown. A method is presented that allows acquisition of cooling curves in thin walled ductile iron castings down to thickness of at least 2.8 mm. The obtained cooling curves can be used to compare nucleation and growth during solidification of castings with different plate thicknesses.
Keywords Temperature measurement; Thermocouple; Thin wall casting; Ductile iron
1. Introduction In the recently years there has been increasing interest in solidification of thin wall ductile cast iron. Most of work on the subject has been based on metallurgical examination after solidification and cooling to room temperature, which also involves a phase transformation during the cooling process. Temperature measurement, an
1
Post-print of article in Measurement 41 (2008) 551-560 Link to article: http://dx.doi.org/10.1016/j.measurement.2007.05.002
important tool in investigation of solidification, has rarely been used. The most detailed cooling curves found in literature is published by Labrecque and Gagné [1] with temperature measurement in 3 mm plates. In the large “Thin Wall Iron Casting” project temperature measurement in plates down to thickness of 1.5mm has been carried out [2], although the results have mainly been used to determine the cooling rate at 1170°C [3-5]. Lacaze et al. [6] has reported measured temperatures from a cylinder of Ø9 mm, corresponding to about 4 mm thick plate, but no details from the cooling curves are given. Temperature measurement in castings is normally done with thermocouples (TC) placed in the casting as illustrated in Fig. 1. Placing a TC in the casting will affect the temperature locally, especially in thin wall castings, as the thermal properties of the wire and ceramic will normally differ from the mould. Erickson and Houghton [7] have made numerical simulations of the effect of a ceramic-sheathed TC in a 1.5 inch Pb rod casting. The conclusion was that initially the TC was acting as a chill but later the ceramic was acting as an insulator increasing the local solidification time. Xue et.al. [8] has made a parametric study of TC properties on transient temperature measurement. The conclusion was that the TC should have lower density and specific heat (ρCp) and higher thermal conductivity (λ) than the surrounding material. The diameter of the TC should be small and the heat transfer coefficient (HTC) between TC and surrounding should be high. This study is however based on a 1-D model with the TC in the middle, which does not correspond well with temperature measurement in thin plates as shown in Fig. 1. A better approach is made by Shaukatullah and Claassen [9] in the experimental work of temperature measurement on electronic components. Here the TC was attached to the surface of the electronic component so the thermal conditions correspond better with Fig. 1. They concluded that the TC should have low thermal conductivity and a small diameter to reduce measuring error.
2. Theory The physical principles behind thermocouples are known as the so called Seebeck effect, which gives a thermoelectric force. This force results from the variation of electron density along a conductor subjected to a non-uniform temperature distribution. The Seebeck thermoelectric force E is given by: [10]
dTTdE A )(σ= (1)
where σA is the Seebeck coefficient of metal A and T is the temperature. The Seebeck thermoelectric force in a homogeneous conductor, whose ends are at temperature T1 and T2, is given by integrating:
2

Post-print of article in Measurement 41 (2008) 551-560 Link to article: http://dx.doi.org/10.1016/j.measurement.2007.05.002
( ) ( ) ( 2121
1
2
)(, TETEdTTTTE AA
T
TAA −== ∫σ ) (2)
Having a closed circuit of two conductors A and B, whose both joined ends are at the temperatures, T1 and T2, will create a thermoelectric force in the circuit equal to the sum of the thermoelectric forces for the two conductors. In the practical application, with TC of metals A and B, it is necessary to introduce other metals in the circuit in order to measure the thermoelectric force. This can be done because of the law of the third metal saying that: Introducing a third metal, C, into a circuit of the two metals A and B, does not alter the resulting thermoelectric force in the circuit, provided that both ends of the metal C are at the same temperature. [10]
The third metal C may be introduced in the circuit at any point. The law of the third metal also implies that the TC wires do not have to be welded in the measuring point but the two wires can simply be submerged into the melt at two different points (see Fig. 2) provided that the temperature of the melt is uniform.
2.1 Response time An important factor when measuring temperature in thin wall castings is the response time of the TC. The response time can be estimated by making some assumptions:
• The TC wire has the temperature T0 before the mould is filled. • At the time t = 0 the mould is filled with melt having a constant temperature Tc. • The TC wire is ideal with no heat transfer along the wire, e.g. from the wire
surrounded by the melt to the wire inside the ceramic tube. The temperature of the TC wire can then be calculated by applying a heat balance [10]:
dtTThAdTcV cp )( −=ρ (3)
where V = volume of TC wire surrounded by melt [m3], ρ = density of TC wire [kg m-
3], cp = specific heat of TC wire [J kg-1K-1], h = heat transfer coefficient (HTC) between TC wire and melt [Wm-2K-1] and A = heat exchange area [m2]. Solving the equation gives the temperature of the TC wire as a function of time t:
( )
hAcV
Nwhere
TN
tTTtT
pT
Tc
ρ=
+⎟⎟⎠
⎞⎜⎜⎝
⎛⎟⎟⎠
⎞⎜⎜⎝
⎛ −−−= 00 exp1)(
(4)
NT is called the sensor time constant and is expressed in time units. The time before the measured temperature has an error of 1% of the initial temperature difference can then be calculated by:
3
Post-print of article in Measurement 41 (2008) 551-560 Link to article: http://dx.doi.org/10.1016/j.measurement.2007.05.002
TT NNt ⋅≈⋅−= 6,4)01,0ln(01,0 (5)
The least well known parameter in equation 4 is the HTC since its value depends on how well the TC wire is in contact with the melt. The HTC can have a large influence on the response time. Having an unsheathed TC the situation can be compared with high pressure die casting where HTC of 10000 Wm-2K-1 may be found [11]. Having a ceramic-sheathed TC the HTC will probably only be 500 Wm-2K-1 or even less. Having an ideal TC like the one in Fig. 1 with ρ = 8600 kg m-3, cp = 500 Jkg-1K-1 and wire diameter of 0.5 mm the response time will then be about 0.25s and 5 s respectively for the two different HTC. In comparison to that thin wall castings may have a solidification time of 10-20 s, so it will not be useful to use ceramic-sheathed TC in thin wall castings.
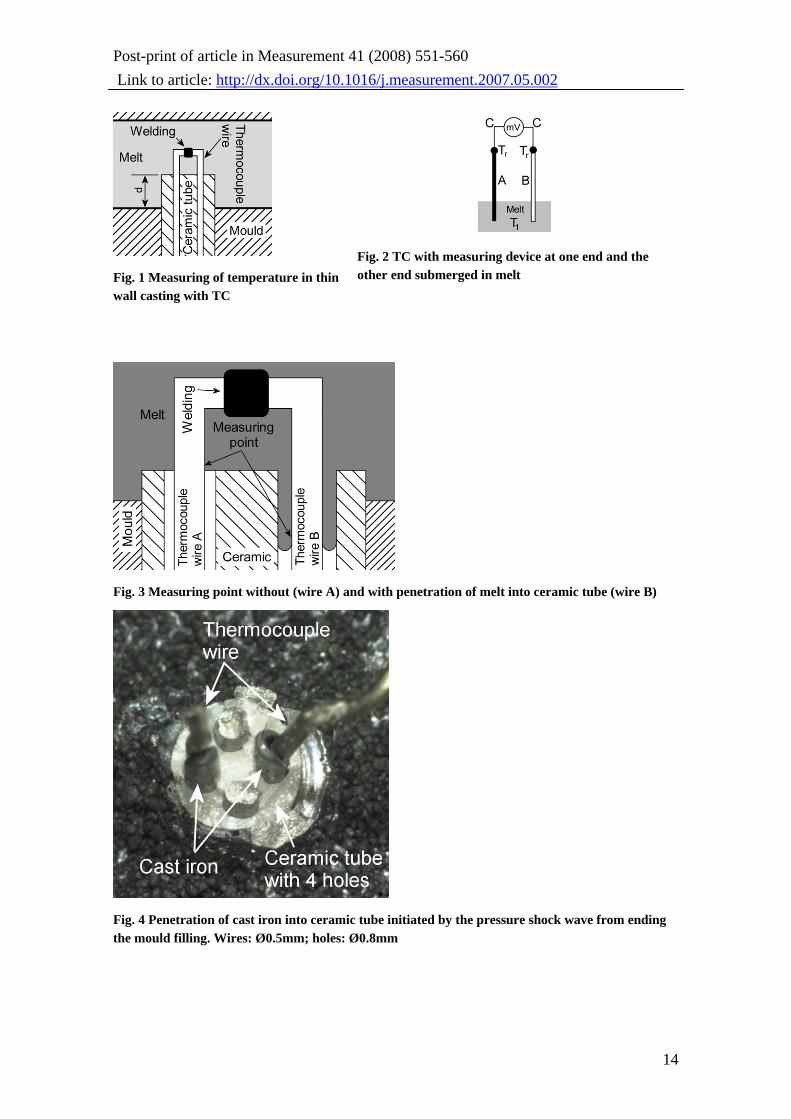
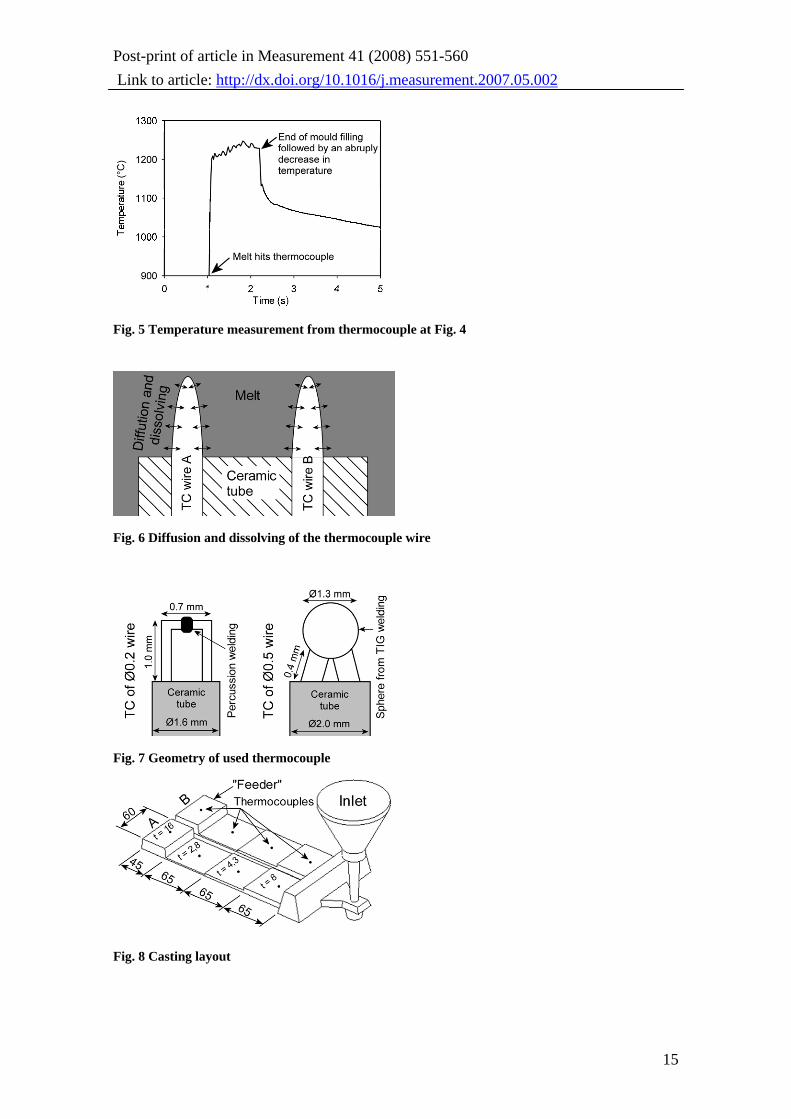
2.2 Measuring point of the thermocouple Normally the welding point between the two wires of the TC is defined as the measuring point. Without a sheathing material protecting the TC wire it can be assumed that there will be electrical contact between the melt and the TC wires and the melt will then act as a short circuit. The measuring point will not be at the welding point but where the surface of the TC wire is in electrical contact with the melt as indicated in Fig. 3. It is important to prevent penetration of melt into the ceramic tube. Penetration into the tube will typically occur at the end of mould filling where a pressure shock wave can be created by the melt hitting the end of the mould [12]. An example of melt penetration can be seen in Fig. 4 and the corresponding cooling curve in Fig. 5. The temperature measurement will then be characterised by an abrupt decrease in temperature. This abrupt decrease indicates that the measuring point has moved from the preheated TC wire outside the ceramic tube into the colder wire inside the ceramic tube to the point where the short circuit starts. Experimental experience shows that melt penetration in general can be avoided by using ceramic tubes where the diameter of the holes is no more than 0.1mm larger the diameter of the TC wires and by avoiding pressure shock waves at the end of the mould filling. Penetration can also be avoided by using ceramic paste to cover the holes in the ceramic tube but in practice it can be difficult to cover the holes and still have a bare TC wire with good thermal contact to the melt.
2.3 Diffusion and dissolution of TC wire Equation (1), describing the thermoelectric force, contains the Seebeck coefficient σ, which is a function of the chemical composition of the TC wire material. When a TC
4
Post-print of article in Measurement 41 (2008) 551-560 Link to article: http://dx.doi.org/10.1016/j.measurement.2007.05.002
wire is immersed in a melt at high temperature for a long period of time diffusion of elements across the interface between melt and TC wire will take place as indicated in Fig. 6. Diffusion of elements into the TC wire can change the Seebeck coefficient giving an error to the thermoelectric force and by that an error to the temperature measurement. However looking at the equation (1), there will at a local point only be a thermoelectric force if there is a temperature gradient at the same place. Since thermal diffusion is several magnitudes higher than diffusion of elements in solid materials this will not, in practice, influence the temperature measurement in thin walled castings. According to Ågren [13] the diffusion coefficient D for carbon in iron at 1200°C will be about 5×10-
10 m2s-1. This will give a diffusion length of about 0.07mm after 10s, which is smaller than the diameter of commonly used TC wires. It can be assumed that after 10s there will not be a temperature gradient across a TC wire of practical importance. And as the temperature gradient dT≈0 in the volume affected by diffusion, the diffusion will not have a practical influence on the temperature measurement. If the solubility of TC wire material in the melt is high diffusion will lead to dissolution of the TC wire. The rate of dissolution will probably depend on the temperature, but it is possible that, after some time, there will not be a direct circuit between the two wires as indicated in Fig. 6. The dissolution of the TC wire will however also indicate a good electric contract between the wires and the melt. The melt will then be a part of the circuit as a third metal and this will not affect the temperature measurement as long as the temperature gradient in the melt is small, which it normally is. In addition to that, dissolution also indicates a very high heat transfer coefficient, giving a very short response time for the TC.
3. Experiments
3.1 Manufacture of thermocouples Thermocouples with wire diameter of 0.2 mm were percussion welded, which gives a small and well-defined welding point, see Fig. 7. Wires with diameter of 0.5 mm were TIG welded. This welding process creates a relatively large weld bead, see Fig. 7. In practise the latter one can be difficult to control and to get the same geometry and size every time. The surface area and volume of TC wire in contact with the melt is given in Table 1.
3.2 Casting Procedure Ductile cast iron was produced in a batch of 100 kg. The chemical composition was: 3.7% C, 2.7% Si and 0.037% Mg. The pouring temperature was about 1350°C. The
5
Post-print of article in Measurement 41 (2008) 551-560 Link to article: http://dx.doi.org/10.1016/j.measurement.2007.05.002
moulds were made of chemically bonded sand (Resol-CO2). The casting layout (see Fig. 8) consists of two fingers, A and B, with plate thickness of 8, 4.3 and 2.8 mm and a feeder with thickness of 16mm. The temperature was measured in the middle of each plate. At finger A in each mould, normal percussion welded unsheathed K-element TC of 0.2 mm wire was used. In finger B a modified TC’s were used. A list of the TC’s used in each experiment is shown in Table 2. The distance, d, the ceramic tube penetrated into the casting (see Fig 1) were 0.5 mm for the 2.8 and 4.3 mm plate and 3.5 mm for the 8 mm plate and the feeder. The sample rate for temperature measurement was 500 Hz. In the TC response time analysis data was used as they were acquired. For the cooling curves every 100 values were averaged to reduce noise giving a time increment of 0.2 second. Cross-sections of some of the TC’s have been analysed in light optical microscope (LOM) and scanning electron microscope (SEM) equipped with energy dispersive spectroscopy (EDS).
4. Results of experiments
4.1 Heat Transfer Coefficient A useful method to find the heat transfer coefficient HTC between melt and TC wire is to look at the response time of the TC. It is however difficult to determine the temperature of the melt surrounding the TC. The first melt that fills the mould will be cooled as it flows through the gating system and will have a temperature lower than the pouring temperature when it reaches the TC. In the following it will be assumed that the first melt hitting the TC’s was 1200°C. The TC can also be preheated by radiation from the melt before it hits the TC. To simplify the problem the measured heating time of the TC was defined as the time between measured temperatures of 200 to 1000°C, t2-10. The HTC can then be calculated from equation (4):
AtcV
TT
hHTC p
c
c
1022001000
ln−
⋅⎟⎟⎠
⎞⎜⎜⎝
⎛−−
−==ρ
(6)
For the normal 0.2 mm TC wire the heating time was between 0.010 and 0.018 s with an average of 0.014 s and a standard deviation of 0.0030. This will give a HTC of about 25000 Wm-2K-1. The TC with 0.5mm wire thickness had a t2-10 between 0.12 and 0.19 s, with an average of 0,15 s. This corresponds to a HTC of about 20000 Wm-2K-1, which is a little lower than the calculated HTC based on 0.2 mm wires. However the calculations are based on assumptions on the geometry of the TC and especially for the 0.5 mm wire there is some variation due to the welding process. Another assumption is that the melt has a
6

Post-print of article in Measurement 41 (2008) 551-560 Link to article: http://dx.doi.org/10.1016/j.measurement.2007.05.002
constant temperature but in reality the TC will cool the melt close to it. Since the thermal conductivity of the melt is limited there will be a local reduction in temperature. It is then reasonable to conclude that when the TC is being heated by the melt the HTC is approximately 25000 Wm-2K-1. The TC’s that were not welded will first give a signal, when there is an electric circuit between the two wires. In that case the first signal received from TC was around 1000°C, or in other words the heating time t2-10 was less than the time step of the temperature measurement of 0.002 s. The coated TC had a t2-10 of about 1 s, which is so large, that it will not be reasonable to calculate the HTC based on equation (6). Only for the thicker parts (8mm plate and feeder) were the temperature measurements useful. For the thinner plates the response time is too long to give a useful measurement.
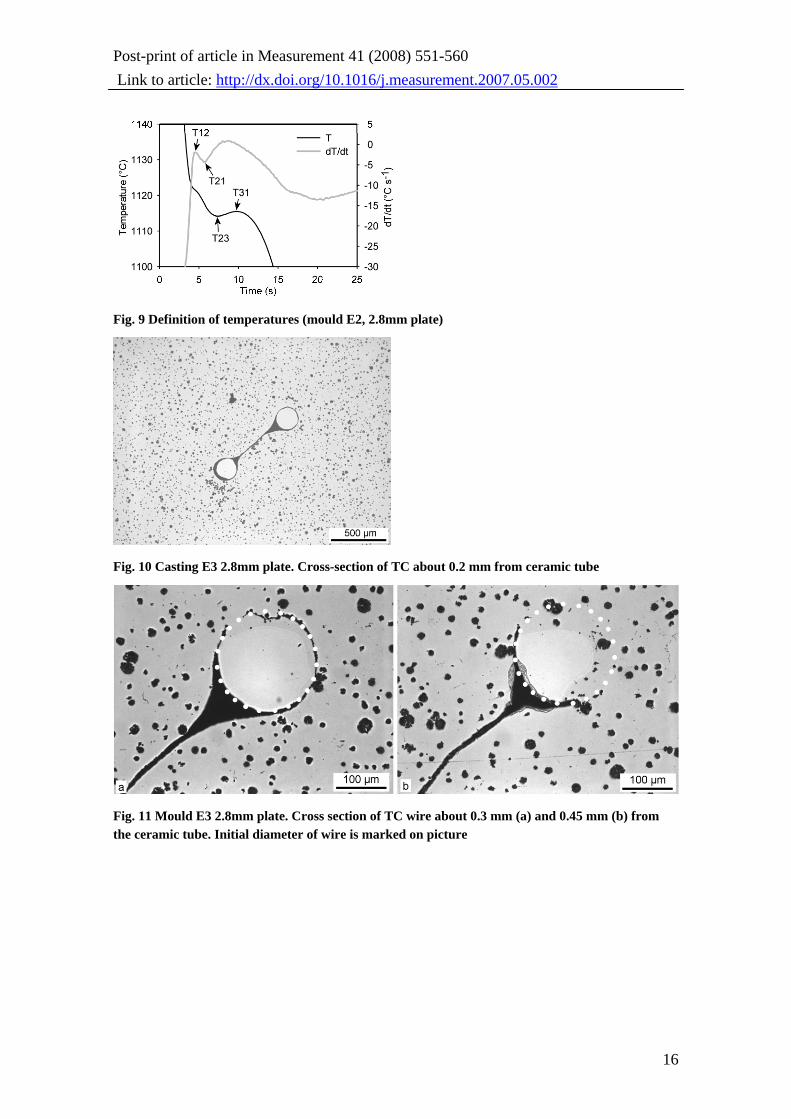
4.2 Measured temperatures An example of a cooling curve combined with the corresponding cooling rate dT/dt can be seen in Fig. 9 together with definition of some characteristic temperatures. T12 is the first maximum of the dT/dt curve and T21 is the following local minimum. T23 and T31 are a local minimum, respectively maximum temperature during solidification. The shapes of the obtained cooling curves are equal to those found in thermal analysis of medium size castings, except for those cooling curves that were obtained by coated TC’s in thin plates. The measured characteristic temperatures are listed in Table 3. The differences between the measured temperatures in the two fingers A and B of the casting are listed in Table 4. There is some parallel shift between the measured temperatures in the two fingers. For the thicker parts the parallel shift is generally small, except in mould E2, where one of the TC was coated. For the thinner plates there is larger variation in the parallel shift.
4.3 Microstructure The microstructure is not affected by the presence of TC in the casting, even in the thin plates, see Fig. 10. Metallographic examination revealed a thin layer coating the TC wires in the casting. The layer is too thick to be the natural surface layer that coats the TC wire when it is handled at ambient temperature. It appears to have been formed during filling of the mould. The thickness of this layer seems to depend on two factors. One is the distance from ceramic tube, where the thickness decreases with increasing distance, and at a point the oxide layer disappear again, see Fig. 11. The other factor is the local solidification time of the melt where the
7
Post-print of article in Measurement 41 (2008) 551-560 Link to article: http://dx.doi.org/10.1016/j.measurement.2007.05.002
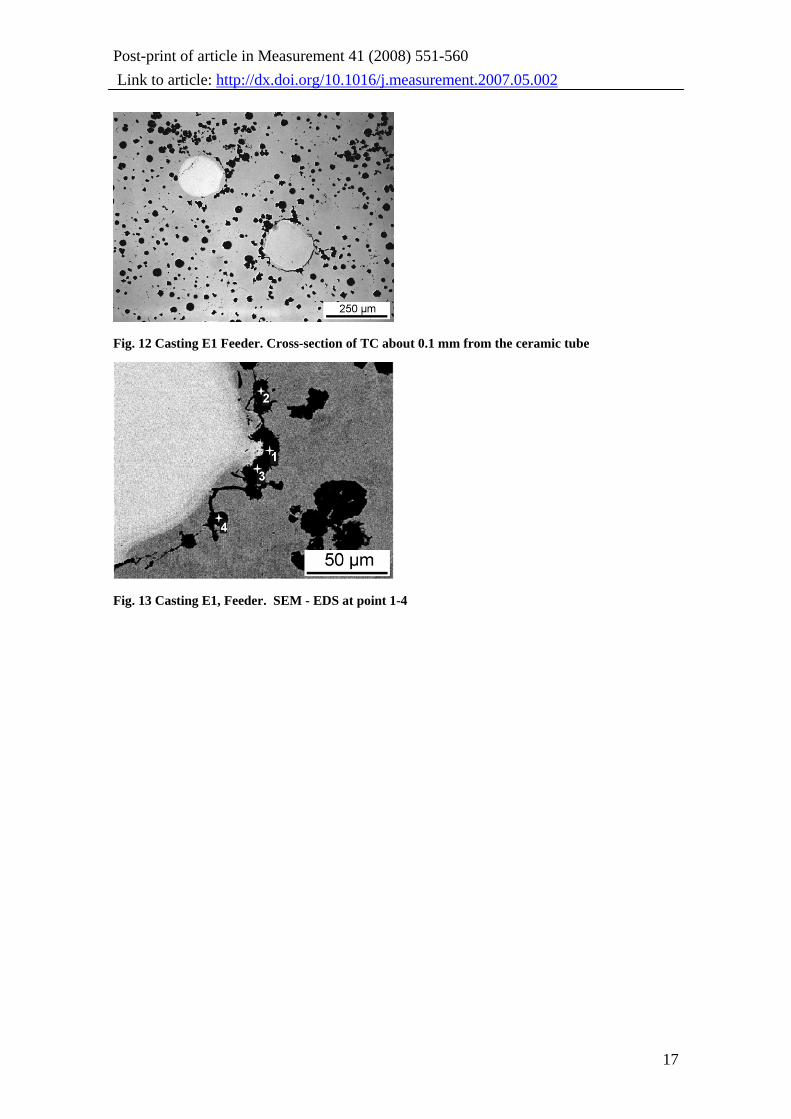
thickness of the oxide layer will decrease with increasing solidification time. An example of this is shown in Fig. 12, where the oxide layer only was found close to the ceramic tube. After some time the melt will start to dissolve the TC even if there still is a thin oxide layer present, indicating the ordinary boundary between TC and melt (see Fig. 12). The oxide layer has been analysed in SEM using EDS and it had a high level of Mg, Al and O compared to the casting, see Fig. 13 and Table 5. The eutectic metastable temperature, Te,m, for the casting can be calculated by [14]:
SipctT me ⋅−= 151148, (7)
The Si content of 2.7% used in the experiment will give Te,m = 1108°C. This would predict the presence of carbides in especially some of the 2.8mm plates as there have be measured temperature below 1100°C during the solidification. But all plates solidified without carbides.
5. Discussion Ductile cast iron is known for its ability to form oxides on the surface on the melt [15]. According to the Ellingham diagram the most stable oxides will be CaO, MgO and Al2O3 [15]. These oxides will stick to the TC when hitting it during filling of the mould. They will later be dissolved or be ripped away from the TC during the continuous filling of the mould and the following solidification process. From EDS analysis a high content of Al, Mg and O was found around the TC, indicating the presence of MgO and Al2O3. In addition to the oxide layer also a graphite film can be formed on the surface of liquid cast iron [15]. It can be difficult to predict the rate of dissolution the oxide layer. However during the filling there will be a continuous flow of melt passing the TC. Therefore the TC will always be surrounded by fresh hot melt during the filling of the mould. This will probably make it easier to dissolve or wash away the oxide layer during the filling compared to the solidification process where there is no forced convection around the TC. It is therefore important to ensure that the melt flows past the TC for some time when the mould is filled. Then the surface of the TC-wire is cleaned and the TC is heated so that the temperature field around it is as close as possible to that of the melt. The effect of this oxide layer can also be seen from the heating time t2-10 of the TC. If it is assumed that oxides in general are good electric insulators the melt will not act as a short circuit when hitting the TC. Only after some time will there be proper electric contact between the two TC wires and the melt. This explains why the first signal from the not welded TC is around 1000°C (t2-10 < 0.002 s) while the normally welded TC has a t2-10 of around 0.014 s.
8
Post-print of article in Measurement 41 (2008) 551-560 Link to article: http://dx.doi.org/10.1016/j.measurement.2007.05.002
The HTC was found to be around 25000 Wm-2K-1 based on the heating time of the TC. It is probably the thickness of the oxide layer that determine the HTC but some of oxide layer if not all will disappear again and then the TC be will in direct contact with the melt giving a very good thermal contact. Only in the thin plates close to the tip of the ceramic tube will the oxide layer envelope the TC wire during the solidification. However as long as the oxide layer also is an electrical insulator the measuring point will be where the TC is in electrical contact with the melt and at that point there will be no thermal resistance between TC and melt. The acquisition hardware used in this experiment has an accuracy of ±1°C. In addition to that the tolerance of TC type K according to IEC 584-2 will be ±4°C at 1000°C. The TC wire was however from the same batch so it can be assumed that the accuracy for all of the TC will be close to the same, probably within ±1°C compared to each other. The accuracy will then be about ±1.4°C when comparing the measured temperature. This could explain some of the parallel shifts between the measured temperatures in plate A and B but not all of it. The parallel shift could be explained by differences in nucleation and growth kinetics in the plate A and B, but the temperature curves are displaced by an almost constant temperature difference having the same differentiated curve. This indicates that the nucleation and growth are very similar in the two plates. For the thicker parts, 8mm plate and feeder, the parallel shift was small except from mould E2 where the coated TC can explain the parallel shift. For the thinner plates the parallel shift in mould E1 can be explained by the use of TC wire with diameter of 0.5mm instead of 0.2mm given higher cooling rate. However also mould E3 and E4 had large parallel shift, which cannot be explained by differences in the used TC. Therefore, the presence of parallel shift in the thin plates indicates that the level of the measured temperature is inaccurate and precautions most be taken when comparing the level of the measured temperatures from different castings. Instead the measured temperatures can give information about the nucleation and growth during the solidification process and this information can be useful when comparing the solidification process between different castings including different plate thicknesses.
6. Conclusion - Using unsheathed thin thermocouple wire, e.g. diameter of 0.2 mm, mounted in a thin
ceramic tube, e.g. diameter of 1.6mm, so that the thermocouple wire is immersed naked in the melt it is possible to obtain reliable cooling curves in the casting.
- The obtained cooling curves can be useful when comparing nucleation and growth during solidification of different castings including different plate thicknesses.
9
Post-print of article in Measurement 41 (2008) 551-560 Link to article: http://dx.doi.org/10.1016/j.measurement.2007.05.002
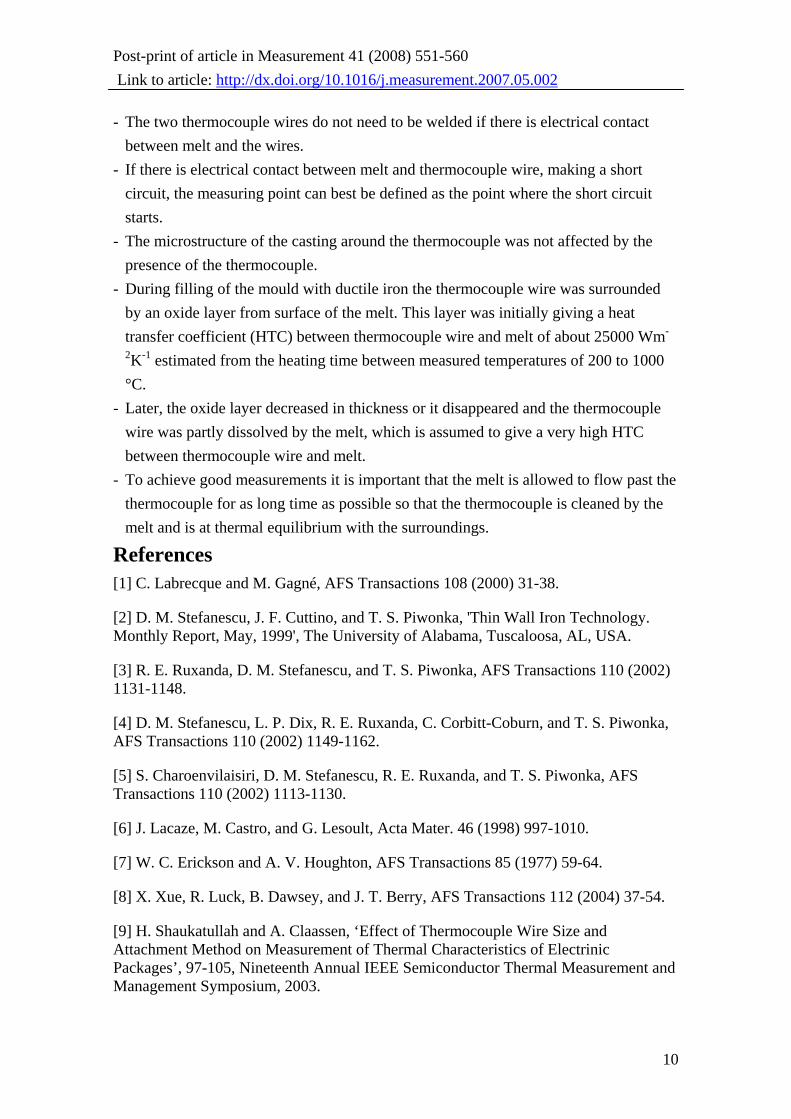
- The two thermocouple wires do not need to be welded if there is electrical contact between melt and the wires.
- If there is electrical contact between melt and thermocouple wire, making a short circuit, the measuring point can best be defined as the point where the short circuit starts.
- The microstructure of the casting around the thermocouple was not affected by the presence of the thermocouple.
- During filling of the mould with ductile iron the thermocouple wire was surrounded by an oxide layer from surface of the melt. This layer was initially giving a heat transfer coefficient (HTC) between thermocouple wire and melt of about 25000 Wm-
2K-1 estimated from the heating time between measured temperatures of 200 to 1000 °C.
- Later, the oxide layer decreased in thickness or it disappeared and the thermocouple wire was partly dissolved by the melt, which is assumed to give a very high HTC between thermocouple wire and melt.
- To achieve good measurements it is important that the melt is allowed to flow past the thermocouple for as long time as possible so that the thermocouple is cleaned by the melt and is at thermal equilibrium with the surroundings.
References [1] C. Labrecque and M. Gagné, AFS Transactions 108 (2000) 31-38.
[2] D. M. Stefanescu, J. F. Cuttino, and T. S. Piwonka, 'Thin Wall Iron Technology. Monthly Report, May, 1999', The University of Alabama, Tuscaloosa, AL, USA.
[3] R. E. Ruxanda, D. M. Stefanescu, and T. S. Piwonka, AFS Transactions 110 (2002) 1131-1148.
[4] D. M. Stefanescu, L. P. Dix, R. E. Ruxanda, C. Corbitt-Coburn, and T. S. Piwonka, AFS Transactions 110 (2002) 1149-1162.
[5] S. Charoenvilaisiri, D. M. Stefanescu, R. E. Ruxanda, and T. S. Piwonka, AFS Transactions 110 (2002) 1113-1130.
[6] J. Lacaze, M. Castro, and G. Lesoult, Acta Mater. 46 (1998) 997-1010.
[7] W. C. Erickson and A. V. Houghton, AFS Transactions 85 (1977) 59-64.
[8] X. Xue, R. Luck, B. Dawsey, and J. T. Berry, AFS Transactions 112 (2004) 37-54.
[9] H. Shaukatullah and A. Claassen, ‘Effect of Thermocouple Wire Size and Attachment Method on Measurement of Thermal Characteristics of Electrinic Packages’, 97-105, Nineteenth Annual IEEE Semiconductor Thermal Measurement and Management Symposium, 2003.
10
Post-print of article in Measurement 41 (2008) 551-560 Link to article: http://dx.doi.org/10.1016/j.measurement.2007.05.002
[10] L. Michalski, K. Eckersdorf, J. Kucharski, and J. McGhee, 'Temperature Measurement', 2nd ed., John Wiley & Sons Ltd, Chichester, England, 2001, pp. 37-41 and 284-291.
[11] G. Dour, M. Drgusch, C. Davidson, A. Nef, and D. St John, Metallurgical Science and Technology 22 (1) (2004) 16-21.
[12] P. Larsen and N. Tiedje, The 66th World Foundry Congress, Istanbul, Turkey, September, 2004, Foundrymen’s Association of Turkey, Paper 44, 223-234.
[13] J. Ågren, Scripta Metallurgica 20 (1986) 1507-1510.
[14] M. I. Onsøien, Ø. Grong, Ø. Gundersen, and T. Skaland, Metall. Mater. Trans. A 30A (1999) 1053-1068.
[15] J. Campbell, 'Castings', 2nd ed., Butterworth-Heinemann, Oxford, UK, 2003, pp. 9 and 156-160;
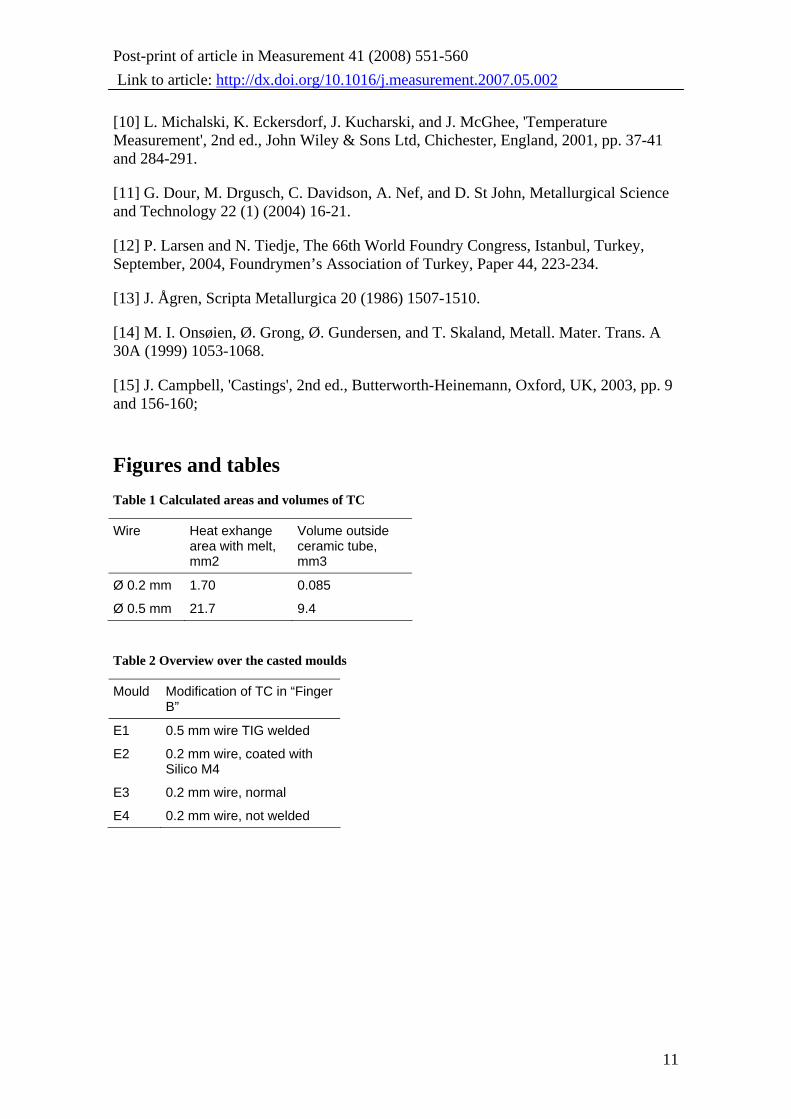
Figures and tables Table 1 Calculated areas and volumes of TC
Wire Heat exhange area with melt, mm2
Volume outside ceramic tube, mm3
Ø 0.2 mm 1.70 0.085
Ø 0.5 mm 21.7 9.4
Table 2 Overview over the casted moulds
Mould Modification of TC in “Finger B”
E1 0.5 mm wire TIG welded
E2 0.2 mm wire, coated with Silico M4
E3 0.2 mm wire, normal
E4 0.2 mm wire, not welded
11
Post-print of article in Measurement 41 (2008) 551-560 Link to article: http://dx.doi.org/10.1016/j.measurement.2007.05.002
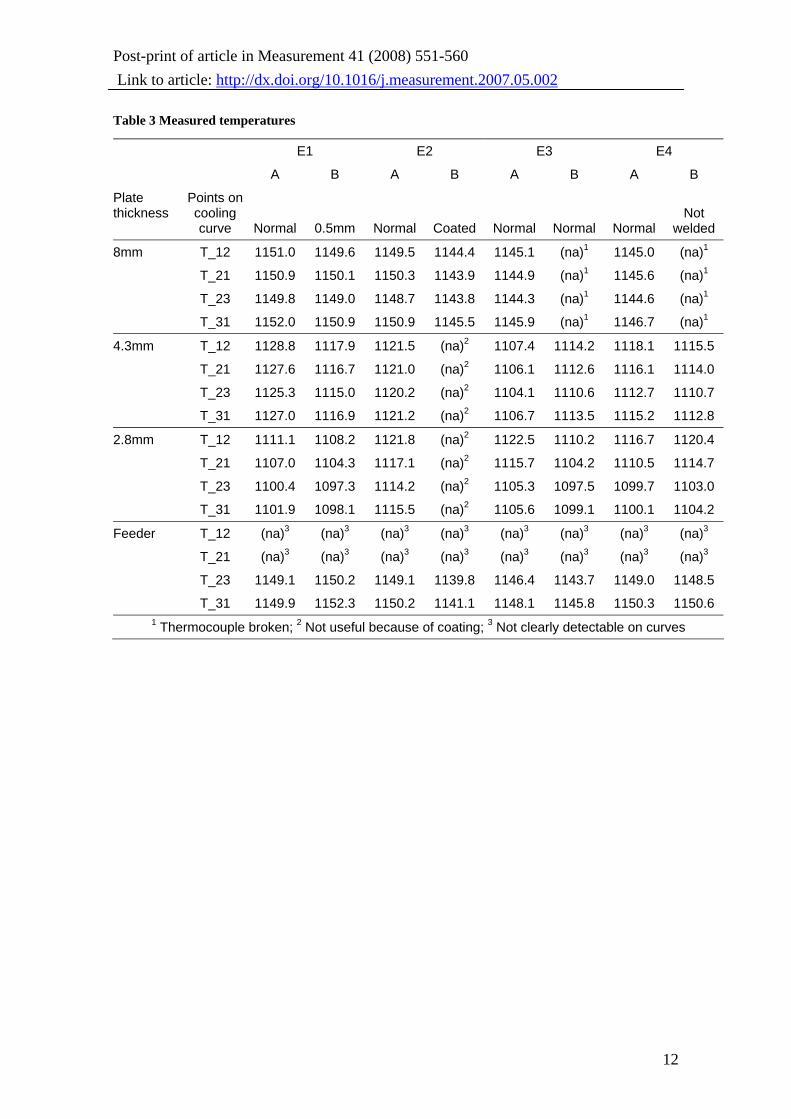
Table 3 Measured temperatures
E1 E2 E3 E4
A B A B A B A B
Plate thickness
Points on cooling curve Normal 0.5mm Normal Coated Normal Normal Normal
Not welded
8mm T_12 1151.0 1149.6 1149.5 1144.4 1145.1 (na)1 1145.0 (na)1
T_21 1150.9 1150.1 1150.3 1143.9 1144.9 (na)1 1145.6 (na)1
T_23 1149.8 1149.0 1148.7 1143.8 1144.3 (na)1 1144.6 (na)1
T_31 1152.0 1150.9 1150.9 1145.5 1145.9 (na)1 1146.7 (na)1
4.3mm T_12 1128.8 1117.9 1121.5 (na)2 1107.4 1114.2 1118.1 1115.5
T_21 1127.6 1116.7 1121.0 (na)2 1106.1 1112.6 1116.1 1114.0
T_23 1125.3 1115.0 1120.2 (na)2 1104.1 1110.6 1112.7 1110.7
T_31 1127.0 1116.9 1121.2 (na)2 1106.7 1113.5 1115.2 1112.8
2.8mm T_12 1111.1 1108.2 1121.8 (na)2 1122.5 1110.2 1116.7 1120.4
T_21 1107.0 1104.3 1117.1 (na)2 1115.7 1104.2 1110.5 1114.7
T_23 1100.4 1097.3 1114.2 (na)2 1105.3 1097.5 1099.7 1103.0
T_31 1101.9 1098.1 1115.5 (na)2 1105.6 1099.1 1100.1 1104.2
Feeder T_12 (na)3 (na)3 (na)3 (na)3 (na)3 (na)3 (na)3 (na)3
T_21 (na)3 (na)3 (na)3 (na)3 (na)3 (na)3 (na)3 (na)3
T_23 1149.1 1150.2 1149.1 1139.8 1146.4 1143.7 1149.0 1148.5
T_31 1149.9 1152.3 1150.2 1141.1 1148.1 1145.8 1150.3 1150.6 1 Thermocouple broken; 2 Not useful because of coating; 3 Not clearly detectable on curves
12

Post-print of article in Measurement 41 (2008) 551-560 Link to article: http://dx.doi.org/10.1016/j.measurement.2007.05.002
Table 4 Temperature differences between the two fingers of the casting (finger A minus finger B)
Plate thickness
Points on
cooling curve E1 E2 E3 E4
T_12 1.4 5.1 - -
T_21 0.8 6.4 - -
T_23 0.8 4.9 - -
8mm
T_31 1.1 5.4 - -
T_12 10.9 - -6.8 2.6
T_21 10.9 - -6.5 2.1
T_23 10.3 - -6.5 2
4.3mm
T_31 10.1 - -6.8 2.4
T_12 2.9 - 12.3 -3.7
T_21 2.7 - 11.5 -4.2
T_23 3.1 - 7.8 -3.3
2.8mm
T_31 3.8 - 6.5 -4.1
T_23 -1.1 9.3 2.7 0.5 Feeder
T_31 -2.4 9.1 2.3 -0.3
Table 5 Chemical analysis from oxide layer around TC wire
Point C O Mg Al Si Ca Mn Fe Ni Total
1 63.9 10.5 0.8 2.1 1.4 0.5 1.2 19.6 - 100.0
2 34.5 13.3 3.6 20.7 1.9 0.7 3.5 20.1 1.7 100.0
3 33.2 17.3 3.9 10.0 6.1 1.3 3.3 23.8 1.1 100.0
4 30.4 15.5 1.2 7.5 2.0 0.4 0.6 41.4 1.0 100.0
13
Post-print of article in Measurement 41 (2008) 551-560 Link to article: http://dx.doi.org/10.1016/j.measurement.2007.05.002
Fig. 1 Measuring of temperature in thin wall casting with TC
Fig. 2 TC with measuring device at one end and the other end submerged in melt
Fig. 3 Measuring point without (wire A) and with penetration of melt into ceramic tube (wire B)
Fig. 4 Penetration of cast iron into ceramic tube initiated by the pressure shock wave from ending the mould filling. Wires: Ø0.5mm; holes: Ø0.8mm
14
Post-print of article in Measurement 41 (2008) 551-560 Link to article: http://dx.doi.org/10.1016/j.measurement.2007.05.002
Fig. 5 Temperature measurement from thermocouple at Fig. 4
Fig. 6 Diffusion and dissolving of the thermocouple wire
Fig. 7 Geometry of used thermocouple
Fig. 8 Casting layout
15
Post-print of article in Measurement 41 (2008) 551-560 Link to article: http://dx.doi.org/10.1016/j.measurement.2007.05.002
Fig. 9 Definition of temperatures (mould E2, 2.8mm plate)
Fig. 10 Casting E3 2.8mm plate. Cross-section of TC about 0.2 mm from ceramic tube
Fig. 11 Mould E3 2.8mm plate. Cross section of TC wire about 0.3 mm (a) and 0.45 mm (b) from the ceramic tube. Initial diameter of wire is marked on picture
16
Post-print of article in Measurement 41 (2008) 551-560 Link to article: http://dx.doi.org/10.1016/j.measurement.2007.05.002
Fig. 12 Casting E1 Feeder. Cross-section of TC about 0.1 mm from the ceramic tube
Fig. 13 Casting E1, Feeder. SEM - EDS at point 1-4
17


