Predicting noise-induced critical transitions in bistable ...
Upload
truongtuyenCategory
view
230download
0
PHYSICAL REVIEW B 84, 054202 (2011)
Temperature-induced martensitic phase transitions in gum-metal approximants:First-principles investigations for Ti3Nb
Petr Lazar, Michal Jahnatek, and Jurgen Hafner*
Faculty of Physics and Center for Computational Materials Science, University of Vienna, Sensengasse 8/12, A-1090 Wien, Austria
Naoyuki Nagasako and Ryoji AsahiToyota Central Research and Development Laboratories, Incorporated, Nagakute, Aichi 480-1192, Japan
Claudia Blaas-Schenner, Markus Stohr, and Raimund PodlouckyInstitute for Physical Chemistry and Center for Computational Materials Science, University of Vienna, Sensengasse 8/7, A-1090 Wien,
Austria(Received 27 April 2011; published 2 August 2011)
We present a first-principles investigation of the structures and the dynamical stability of the austenite andmartensite phases of binary Ti3Nb alloys, used as a model system for the superelastic and superplastic gum-metalalloy. For the body-centered cubic high-temperature β phase, structural models are constructed by optimizingthe chemical decoration of a large supercell and by a cluster expansion method. The energetically most favorablestructure is found to be elastically stable but dynamically unstable in the harmonic approximation. At finitetemperature anharmonic phonon-phonon interactions treated in a self-consistent phonon approximation stabilizethe structure already at room temperature. For the low-temperature α′, ω, and α′′ phases stable structure modelshave been constructed. For the hexagonal α′ phase a model is generated by optimizing the chemical decoration ofa supercell based on the hexagonal Bh lattice. The hexagonal ω structure may be derived from the body-centeredcubic β phase using the (111) plane collapse model. The structure of the orthorhombic α′′ phase may be viewed asproduced by a strain-induced transformation of the body-centered cubic β phase, albeit with a different chemicaldecoration. The relaxed structures of the α′, ω, and α′′ phases were found to be both elastically and dynamicallystable in the low-temperature limit. The martensitic temperatures for the β → α′′, β → ω, and β → α′ transitionswere estimated by comparing the Helmholtz free energies as a function of temperature.
DOI: 10.1103/PhysRevB.84.054202 PACS number(s): 61.50.Ah, 61.50.Ks, 62.20.−x, 63.20.−e
I. INTRODUCTION
The phase stability of Ti alloys can be changed by addingalloying elements such as vanadium, niobium, molybdenum,or iron, most of which are known to stabilize the bcc β
phase at ambient or elevated temperatures. The limit of bccstability was shown to be determined by the vanishing of theshear modulus C ′ = 1
2 (C11 − C12) and correlated to a criticalelectron-per-atom ratio of e/a ∼ 4.15.1,2 The stabilization ofthe β phase is of practical importance because it enhancesdeformation capability and strength of the alloy. Three kindsof phase transitions (β → α′,α′′,ω) have been reported forTi-rich alloys.2,3 The structure of α′ martensite is closelyrelated to the hexagonal low-temperature α phase of pureTi, the formation of which is limited to low concentrationsof the alloying element. Above a critical alloying contenta martensitic transformation to the orthorhombic α′′ phaseis observed. The reversible β ↔ α′′ transition results in ashape-memory effect.4 The ω phase can be formed as ametastable phase, at low solute content by quenching fromthe β phase, at higher solute content by isothermal aging closeto the martensite temperature.5 The structure of the ω phaseis either hexagonal or trigonal. Moffat and Larbalestier3 haveinvestigated the competition between the formation of α′′ andω phases in Ti-Nb alloys upon quenching and aging. Fastquenching of alloys with 20–25 at. % Nb favors the formationof the α′′ phase, while under slow quenching conditions the ω
phase is formed. Aging of air-cooled samples at temperatures
above 400◦C leads to formation of α′′ precipitates, whileaging at temperatures below 400◦C favors formation of theω phase. The formation of α′′ and ω precipitates was found tobe mutually exclusive; no transformations between both low-temperature phases was observed. A β → α′′ transformationcan also be induced by applying uniaxial strain. The plasticdeformation of β-phase alloys is a complex process, becausebesides simple dislocation-motion deformation, twinning andstress-induced martensitic transformations play an importantrole. The dominant mechanism depends on alloy compositionand/or the fabrication process.6
During the last decades, binary Ti-V,7 Ti-Nb,8–12 Ti-Ta,13 and Ti-Mo14 based alloys have been the focus ofintense research efforts because their superelastic and shape-memory properties makes them suitable for many high-techapplications and detailed investigations of their martensitictransformations have been reported.10 β-phase Ti alloys withNb, Ta, and Zr have also been considered for biocompatibleimplants because they feature not only high strength, corrosionresistance, and nontoxicity, but also a low Young’s moduluscompatible with that of human bones.15
Detailed results for the martensitic transformations inbinary Ti-Nb alloys with 15–35 at. % Nb have been reported byKim et al.10 The critical strain for the β → α′′ transformationis found to decrease linearly with increasing Nb content. Ata composition of Ti3Nb the maximum transformation strainof 4.1% is reported for the [110] direction, and lower values
054202-11098-0121/2011/84(5)/054202(17) ©2011 American Physical Society
PETR LAZAR et al. PHYSICAL REVIEW B 84, 054202 (2011)
of 2.1% and 1.5% have been found for the [100] and [111]directions, respectively. The martensitic start temperaturedecreases from about 500 K at 20 at. % Nb to about 150 K at 30at. % Nb, reaching room temperature at the composition Ti3Nb.The critical stress for slip increases due to the fine subgrainstructure of the ω precipitates, leading to stable superelasticity.
The name of gum-metal has been given to a classof Ti-Nb-Zr-O alloys which display high strength, a lowelastic modulus, high yield strain, and a very good ductilitydeveloped at the Toyota Central Research and DevelopmentLaboratories.16 These properties are achieved by adjusting thealloy composition such that the average electron-per-atom ratiocomes close to a critical value of e/a ∼ 4.24, for which abinitio calculations of the elastic constants of binary Ti-basedalloys have predicted a vanishing tetragonal shear constant.17
Under tensile loading the alloy deforms elastically until thestress approaches the value of the ideal strength of σ ∼1.5 GPa estimated from the calculated elastic constants.18–20
It has been reported21 that in gum-metal the large elasticdeformation reaching 2.5% is not accompanied by martensiticphase transformation. Nanoindentation experiments revealan unusual deformation pattern around the imprint of thenanoindenter22 but no evidence for dislocation, twin, orfault propagation. In contrast, tensile and compressive load-ing of single-crystal specimens of gum-metal23,24 and thecompression of nanopillars of the material25 studied in situusing transmission electron microscopy demonstrated that adeformation-induced transformation to the orthorhombic α′′phase takes place. Largely reversible stress-induced phasetransformations during tensile loading and unloading wereobserved also using in situ synchrotron x-ray diffraction.26,27
Formation of the α′′ phase under stress was found to be verysensitive to the direction of the applied load. Single crystalsoriented along (110) underwent a β → α′′ transformationunder tensile load, while crystals loaded along (111) or (100)did not transform at all. Compressive stress along (100)induces a martensitic transformation.
In contrast to the extensive experimental investigationsof gum-metal and related alloys, only a very few attemptshave been made to achieve a fundamental understanding oftheir outstanding properties by atomistic simulations. Saitoet al.16 suggested that the unique properties result from adislocation-free plastic deformation mechanism called giantplanar faults, which induces crystallographic rotations fromthe neighboring area by plastic deformation. Sun et al.28 havecalculated the total energies and elastic properties of the β, α′′,and ω phases of Ti3Nb using density-functional theory. Phasestability was found to decrease in the sequence α′′ → ω → β
(assuming D03-type ordering in the β phase). The bulk moduliof all three phases were found to be of similar magnitude,but the shear and Young’s moduli are lower in the β than inthe α′′ and ω phases. Li et al.29 performed calculations ofthe elastic properties and the ideal tensile and shear strengthsof bcc Ti-V alloys in a virtual crystal approximation. Theydemonstrated that at a critical composition of 75 at. % of Tithe alloy indeed shows exceptionally low values of the idealtensile and shear strengths and proposed that a dislocation-freedeformation takes place because the triggering stress fordislocation motion exceeds the ideal strength. However, details
of the alloy structure and the relative stabilities of thecompeting martensitic phases of the alloy have not beeninvestigated so far.
That the bcc high-temperature phases of many metals arestabilized by their large vibrational entropies was proposedlong ago by Zener.30 For the light alkali metals Li and Na andfor LiMg alloys this conjecture has indeed been confirmedby quantitative calculations of the vibrational free energies,leading to reasonably accurate predictions of the martensitictemperatures.31 Moroni et al.32 have pointed out that for thestabilization of the bcc phases of the group IV transitionmetals Ti and Zr, both the vibrational and electronic entropiesplay an important role. However, in contrast to the bcc alkalimetals and their alloys which are found to be dynamicallystable in a harmonic approximation, the phonon spectraof bcc Ti and Zr calculated in a harmonic approximationreveal imaginary phonon frequencies at some wave vectors.Souvatzis et al.33 have demonstrated that for Ti, Zr, and Hfthe unstable phonon modes are stabilized at finite temperatureby anharmonic phonon-phonon interactions treated in a self-consistent phonon approximation.34–37 Very recently38 thisapproach has been extended to the investigation of the stabilityof the bcc (B2-type) β phase of NiTi shape-memory alloysand of the premartensitic transition to a rhombohedral R phase(space group P 3). The investigations did not include the low-temperature martensitic phase, which is generally believedto crystallize in the monoclinic B19′ structure (space groupP 21/m).39–41 Recent ab initio calculations have raised doubtsabout the structure of the martensitic phase of NiTi, suggestingthat the experimentally reported B19′ phase might be stabilizedby internal stress and that a B33 phase (space group Cmcm)has a lower energy.42–44 Detailed studies of the deformationmechanisms under strain have demonstrated that although theB33 is lower in energy, its formation in bulk samples might besuppressed because the B2-to-B33 transformation requires anunusually large extension of one of the lattice constants. Thus,while for the NiTi alloys atomistic models for the structureof the austenitic and martensitic phases are available, ourknowledge of the crystal structures of gum-metal and relatedalloys is far less complete.
The aim of the present work is to investigate the martensiticphase transitions in gum-metal approximants using ab initiocalculations. Originally the intention was to extend the workof Ikehata et al.17 on the elastic properties of binary gum-metalapproximants with the D03 structure to a calculation of theirphonon dispersion relations and vibrational free energies andto compare these results with similar calculations for thehexagonal and orthorhombic phases. However, difficultiesalready arose at a lower level. New calculations of the elasticconstants of D03-type Ti-(V, Nb, Ta) alloys with improved all-electron methods found bcc Ti3V and Ti3Nb to be elasticallyunstable (negative values of C44), and calculations of theformation energies for point defects also produced negativevalues for antisite defects in D03-type Ti3Nb if a full relaxationin a large supercell was permitted. Hence the assumption thatan ordered D03 structure provides a realistic model for thestructure of the alloy turned out to be invalid, confrontingus with the necessity to construct a better structural model.The search for a better description of the structure and the
054202-2

TEMPERATURE-INDUCED MARTENSITIC PHASE . . . PHYSICAL REVIEW B 84, 054202 (2011)
investigation of the dynamical properties of the body-centeredcubic, hexagonal, and orthorhombic phases are describedbelow. While for the hexagonal and orthorhombic phases theoptimized structures were found to be both elastically anddynamically stable, even the energetically most favorable bccstructure was found to be dynamically unstable, although elas-tically stable. Hence, the situation is similar to that of pure Ti,where the high-temperature bcc phase is dynamically unstableat low temperatures. Self-consistent phonon calculations havebeen used to demonstrate that at finite temperature the bccphase is stabilized by anharmonic phonon-phonon interactionsand to estimate the transition temperatures to the hexagonaland orthorhombic low-temperature phases.
II. COMPUTATIONAL METHODS
Our ab initio total-energy and force calculations are basedon density-functional theory (DFT) as implemented in theVienna ab initio simulation package (VASP).45,46 A gradient-corrected functional has been used to describe electronic ex-change and correlations.47 Electron-ion interactions are treatedwithin the projector-augmented-wave (PAW) method.48,49 Theplane-wave basis set contained components with kineticenergies up to 350 eV. The total energy was calculated withhigh precision, converged to 10−8 eV/atom. Forces actingon the atoms were calculated using the Hellmann-Feynmantheorem,50 and stresses on the unit cell were calculatedusing the generalized force theorem of Nielsen and Martin.51
Structural relaxation was performed using a quasi-Newtonalgorithm or the GADGET routine developed by Bucko et al.52
using generalized coordinates. The structural relaxation wasstopped when all forces acting on the atoms, calculatedaccording to the Hellmann-Feynman theorem, were convergedto 10−3 eV/A, and all components of the stress tensor exceptthat conjugate to the imposed strain where converged to0.05 GPa.
Structural models for the bcc β and hexagonal α′ phaseshave been constructed by optimizing the chemical decorationof the sites in large supercells and subsequent structuralrelaxation. In addition, for the β phase cluster-expansioncalculations53 have been performed. Models for the ortho-rhombic α′′ and hexagonal ω phases have been constructedby applying appropriate deformations to the bcc lattice for theβ phase with different chemical decorations and subsequentrelaxation. For calculation of the elastic constants we used thesymmetry-general least-squares extraction method proposedby Le Page and Saxe54 in connection with VASP. The cubiccells were submitted to ±ε1 and ±ε4 strains, the tetragonalcells were submitted additionally to ±ε3 and ±ε6 strains, andfor the orthorhombic cells two more strains, ±ε2 and ±ε5, wereadded. For each set of strains ±εi , three different magnitudesof 0.25%, 0.5%, and 0.75% were used. Atomic coordinateswere relaxed at constant strains using the external optimizerdeveloped by Bucko et al.52 For calculation of the elasticconstants the total energy was calculated with even higheraccuracy, converged to 10−9 eV/atom.
Very fine k-point meshes are required to calculate theelastic shear constants (details are given below together withthe information on the supercells used for the simulations).All integration meshes were constructed according to the
Monkhorst-Pack scheme.55 The integration over the Brillouinzone used the tetrahedron method with Blochl corrections.56
For calculations of the vibrational frequencies of a systemwe utilized generalized density-functional perturbation theoryas implemented in VASP.57 The calculations were performedfor supercells containing up to 32 atoms. Tests performedwith a larger supercell containing 108 atoms showed that thephonon frequencies differ only little and the free energy isconverged with respect to supercell size. The PHONOPY58
package was used to visualize calculated phonon dispersions.The vibrational contribution to the free energy Fvib(V,T ) iscalculated using the phonon density of states g(ω) from theself-consistent phonon calculations as
Fvib(V,T ) =∫ ∞
0g(ω)
[hω
2+ kBT ln(1 − e−hω/kBT )
]dω.
(1)
It has been demonstrated by Cochran and Cowley37 that thisgives a value of the entropy which is correct to leading orderin the anharmonicity.
The electronic contribution to the free energy Fel(V,T ) isevaluated directly in VASP by using the Fermi-Dirac functionfor the smearing of the eigenvalues. The electronic contributionis obtained by using a smearing width σ appropriate forthe temperature (σ = kBT ) and calculating the total energydifference with respect to σ = 0. The Helmholtz free energywas then calculated by
F (V,T ) = E(V ) + Fel(V,T ) + Fvib(V,T ), (2)
where E(V ) is the static lattice energy. Note that thermalexpansion has been neglected, because it would make thecalculations very time-demanding.
The bcc β phase was found to be dynamically unstable atlow temperatures; it is stabilized only at finite temperaturesby anharmonic interactions. Anharmonicity was included bymeans of the self-consistent ab initio lattice dynamical method(SCAILD) developed by Souvatzis et al.33 The SCAILDmethod combines Born’s self-consistent phonon approach34–37
with accurate ab initio calculations of interatomic forces ina supercell. All phonons with wave vectors commensuratewith the supercell are excited together in the same cell. Dueto the simultaneous presence of all commensurate phonons,the interaction between different lattice vibrations is takeninto account. The phonon frequencies are calculated in a self-consistent manner by alternating between DFT calculationsof the Hellmann-Feynman forces acting on atoms displacedfrom their equilibrium positions, and calculations of improvedphonon frequencies and atomic displacement vectors. The self-consistent loop represents a much larger computational effortcompared to usual phonon calculations, because the forceshave to be recalculated at each iteration. In our calculations,about 100 iterations were necessary to obtain convergedphonon frequencies. Note that in the present calculationsthermal expansion and phonon damping have been neglected,and all calculations were performed at constant volume usingthe calculated lattice constants. A more detailed description ofthe SCAILD method can be found in the Appendix.
054202-3

PETR LAZAR et al. PHYSICAL REVIEW B 84, 054202 (2011)
III. STRUCTURAL MODELS FOR THE β, α′, α′′, AND ω
PHASES OF Ti3Nb ALLOYS
In all four structural variants, Ti-Nb alloys are generallycharacterized as disordered and a random distribution ofthe chemical species over the sites of the bcc, hexagonal,or orthorhombic lattices is assumed. Elementary excitationsin disordered alloys can be described, in principle, by twodifferent approaches: (i) The structure of the alloys can beapproximated by a large supercell whose sites are occupiedsuch as to minimize the total energy of the system. Electronicor vibrational spectra can be calculated via diagonalization ofthe Hamiltonian or dynamical matrices. (ii) The disorderedalloy is described by an effective periodic Hamiltonianconstructed at different levels of theory—the virtual crystalapproximation (VCA), the average T-matrix approximation(ATA), or the coherent potential approximation (CPA).59–61
For a comparative discussion of the effective Hamiltonianand supercell approaches applied to harmonic phonons indisordered alloys, see, e.g., Refs. [ 60–62]. The analysishas demonstrated that even a high-level theory such as theCPA may fail quite badly, at least if implemented as asingle-site theory. The reason for this failure is twofold: (i)Mass disorder (which is usually considered as diagonal andimplemented as such in the CPA) has in fact the same effectas off-diagonal force-constant disorder, since the vibrationalfrequencies are determined by the interatomic force constantdivided by the square root of the product of the atomicmasses. (ii) Even small displacements of the atoms fromtheir idealized lattice sites, induced by changes in the localenvironment, lead to pronounced changes in the local forceconstants. Supercell calculations, on the other hand, are ingood agreement with the measured phonon frequencies anddynamical structure factors.60,62 For dynamically stable alloysthe defects of the single-site CPA could possibly be curedby a cluster version of the CPA. Ti-rich β-phase alloys,however, are dynamically unstable and the bcc lattice isstabilized only by anharmonic phonon-phonon interactions.We have therefore used the supercell approach which permitsan accurate description of anharmonicity within self-consistentphonon theory. The chemical decoration of the underlyingbcc or hexagonal lattices has been optimized using extensivetotal-energy calculations. For the low-temperature phases an
unconstrained optimization of the unit-cell parameters andinternal coordinates has been performed for each configu-ration, while for the high-temperature phase only the unitcell parameters have been relaxed at fixed reduced internalcoordinates. In addition, for the bcc high-temperature phasewe have used a cluster-expansion approach53 to search for theoptimal structure.
A. High-temperature bcc β Ti3Nb alloys
1. D03-type alloys
The search for β-phase Ti alloys with optimal elastic andplastic properties has been guided by ab initio calculations ofthe elastic constants, assuming a D03 structure for Ti3X anda B2 structure for TiX alloys.17 These calculations predictedTi3Nb to be marginally stable in the D03 structure, with avery small value of the shear constants C44 and C ′ = 1
2 (C11 −C12). Figure 1 compares the elastic constants of three D03-typeTi3X alloys (X = V, Nb, and Ta) as calculated using the PAWapproach implemented in VASP with the previous calculationsof Ikehata et al.17 based on ultrasoft pseudopotentials (USPP).The present calculations are based on very fine Brillouin-zonemeshes (up to 20 × 20 × 20) and use the method of LePageand Saxe54 to extract the elastic constants from the stress-strainrelations. For control some elastic constants have also beencalculated using the generalized perturbation approach to theresponse functions, as implemented in VASP by Gajdos et al.57
Agreement of our results with Ikehata et al.17 was generallyvery good (see Fig. 1), with the exception of C44 of Ti3Vand Ti3Nb, which we found to be negative—in contrast to theprevious study.
The discrepancy between the two sets of results arises fromthe strongly nonlinear stress-strain relation for Ti3V and Ti3Nb(see Fig. 2), which is in turn a consequence of a stronglystructured electronic density of states in the vicinity of theFermi level. If larger sampling strains of ε4 ∼ 4% are used forthe calculation of C44 (such as in the work of Ikehata et al.17),positive shear constants are calculated, while more accuratecalculations using very small strains produce negative values(which are also confirmed by calculations using the linearresponse approach). For Ti3Ta the stress-strain relation isalmost perfectly linear for all strains in this range, and the
-40
-20
0
20
40
60
80
100
120
140
C44C12C11
Ela
stic
con
stan
ts (
GP
a)
Ti3V PAWUSPP
-20
0
20
40
60
80
100
120
140
C44C12C11
Ela
stic
con
stan
ts (
GP
a)
Ti3Nb PAWUSPP
0
20
40
60
80
100
120
140
C44C12C11
Ela
stic
con
stan
ts (
GP
a)
Ti3Ta PAWUSPP
FIG. 1. (Color online) Elastic constants of D03-type Ti3X (X = V, Nb, Ta) alloys, calculated using the PAW method and compared withthe USPP calculations of Ikehata et al.17 (cf. text).
054202-4

TEMPERATURE-INDUCED MARTENSITIC PHASE . . . PHYSICAL REVIEW B 84, 054202 (2011)
-1.5
-1.0
-0.5
0.0
0.5
1.0
1.5
-0.04 -0.02 0.00 0.02 0.04
σ 4 (
GP
a)
ε4
Ti3V
Ti3Nb
Ti3Ta
FIG. 2. (Color online) Stress-strain (σ4 vs ε4) relations determin-ing the elastic shear constant C44 for D03-type Ti3X (X = V, Nb, Ta)alloys (cf. text).
use of a larger sampling strain produces correct results. Thedifference between USPP and the all-electron PAW method isof minor importance in this case.
The formation of point defects (vacancies, antisite atoms)has been investigated using the grand-canonical formalismdeveloped by Fahnle et al.63 and applied to large supercellsof D03-type intermetallic compounds by Dennler et al.64
For Ti3Nb alloys we have used large supercells consistingof 2 × 2 × 2 cubic supercells containing 128 atoms. Thecalculations have been performed without relaxation, withrelaxation at a fixed cell volume, and allowing a full relaxationof cell volume and internal coordinates. Both vacancy andantisite formations were found to be exothermic processes ifa relaxation of the internal degrees of freedom was permitted.In addition, the D03 structure was found to be dynamicallyunstable in a harmonic approximation (the phonon dispersioncalculations have been calculated using the direct method65
and the large supercell) with imaginary acoustic phonon modes(see Fig. 3). Although the occurrence of some imaginaryphonon modes was expected in an alloy undergoing a low-temperature martensitic transformation, the instability againstshear deformations and the formation of point defects provideample evidence that the D03 structure does not represent anacceptable model for these alloys. We have also investigatedthe possible stabilization of the structure by anharmonicphonon-phonon interactions but found that imaginary phononmodes persist to very high temperatures (see below for details).These results confront us with the necessity to construct a moresuitable structural model for the β phase.
2. Supercell models for β Ti3Nb with an average bcc lattice
A search for possible structures of Ti3Nb alloys describableas superstructures of a basic bcc lattice has been conductedin a 2 × 2 × 2 bcc supercell containing 16 Ti and Nb atomsin a proportion of 3 to 1. For this supercell there are 1820different possible distributions of the two types of atoms overthe available sites of the bcc lattice. However, using a group-theoretical classification 29 classes of structurally equivalentconfigurations can be identified. Each class consists of4 to 192 symmetry-equivalent representatives. For all
FIG. 3. (Color online) The phonon dispersion relations of D03-type Ti3Nb, calculated in the harmonic approximation and repre-sented in the Brillouin zone corresponding to the primitive unit cellcontaining four atoms (cf. text).
structures volume and shape of the unit cell (but not the internalcoordinates, to preserve an overall body-centered lattice) havebeen relaxed. The calculations show that two or more classesof structures can be combined into one group—all membersof this group are energetically degenerate and belong to thesame space group.
Table I lists the chemical decorations, relaxed latticeconstants, and atomic volume for all possible configurationsof a 16-atom 2 × 2 × 2 bcc supercell of Ti3Nb. The structuralenergy differences are given relative to the energetically mostfavorable structure. The site occupation can be representedby a string of 16 binary digits—0 standing for occupationby a Ti, and 1 for occupation by a Nb atom. The notationis based on a representation of the bcc structure by twointerpenetrating simple cubic lattices. The first eight digitslabel the sites of one, and the following eight the sites of thesecond lattice. Hence, e.g., the D03 structure is described bythe string 0101010100000000—the first lattice is occupiedalternatingly by Ti and Nb atoms, while all sites of the secondlattice are occupied by Ti atoms.
The energetically most favorable structure exists in 16 dif-ferent realizations (group G1); the total energy is lower by only0.58 meV/atom than for the next favorable group of structures.Upon relaxation the cubic unit cell of these structures remainsunchanged. Only for four of the 18 groups of structures (G1,G10, G14, G16) the cubic symmetry is conserved upon relax-ation. Group 14 corresponds to the D03 structure, but it is foundto be 7.79 meV/atom higher in energy than the energeticallymost favorable G1 structure. For most groups of structures,relaxation reduces the symmetry to tetragonal (groups G2–G5, G7–G9, G11–G13, G15, G17, G18); for group G6 thesymmetry is only orthorhombic. Note that all tetragonal ororthorhombic distortions are very small, about 1% on average.The structure of group G18 corresponds to the well-knowntetragonal L60 structure. Although this structure represents achemical decoration with a relatively high total energy (�E ∼11 meV/atom), we have found that it plays an important rolein the transformation to the orthorhombic α′′ phase.
054202-5
PETR LAZAR et al. PHYSICAL REVIEW B 84, 054202 (2011)
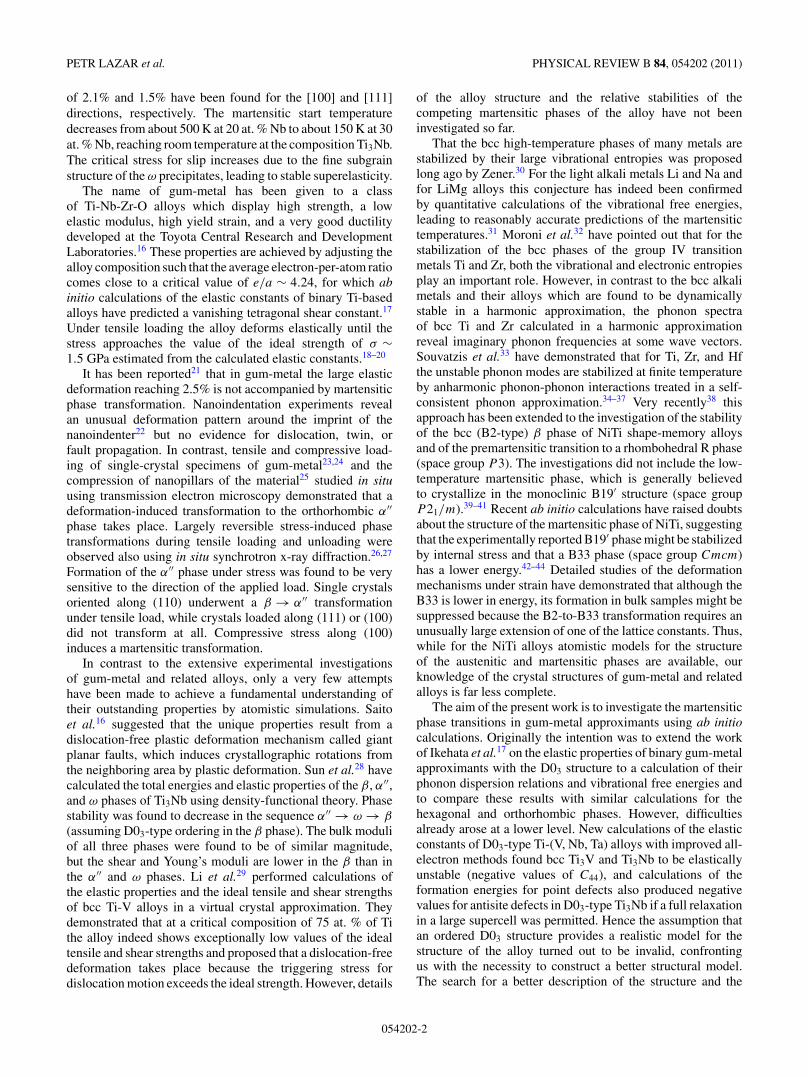
TABLE I. Chemical decorations (represented by a string of 16 binary digits, cf. text), lattice constants (in A), volume/atom (in A3),structural energy difference �E relative to the energetically most favorable structure (in meV/atom) of all possible configurations of a 16-atom2 × 2 × 2 bcc supercell of a Ti3Nb alloy. The translational symmetry is cubic (c), tetragonal (t), or orthorhombic (o), as indicated for eachgroup of structures (cf. text).
Chem. decoration Count a b c �E Group
0000011000100100 12 6.524 6.524 6.524 17.36 0.00 G1(c)0000110000101000 4 6.524 6.524 6.524 17.36 0.000001000001000110 48 6.536 6.536 6.504 17.37 0.58 G2(t)0111000010000000 48 6.504 6.536 6.536 17.37 0.580000000010100101 24 6.561 6.459 6.561 17.38 0.76 G3(t)0000000000010111 24 6.561 6.561 6.460 17.38 0.760000000001101010 96 6.542 6.519 6.519 17.38 0.86 G4(t)0100001010000001 48 6.512 6.550 6.512 17.36 1.44 G5(t)0010010000101000 48 6.512 6.512 6.550 17.36 1.440000100011000001 192 6.497 6.528 6.554 17.37 1.54 G6(o)0100100110000000 48 6.520 6.520 6.538 17.37 1.62 G7(t)0001110010000000 48 6.520 6.520 6.538 17.37 1.620110000000100010 96 6.538 6.538 6.502 17.37 2.33 G8(t)0100100000100010 24 6.512 6.556 6.512 17.37 2.38 G9(t)1001000000100100 24 6.512 6.512 6.556 17.37 2.381001101000000000 32 6.526 6.526 6.526 17.37 2.51 G10(c)0000100001110000 96 6.526 6.526 6.526 17.37 2.510011100010000000 96 6.518 6.518 6.535 17.36 3.60 G11(t)1010000001000010 96 6.355 6.518 5.518 17.36 3.600001100001000001 192 6.535 6.518 6.518 17.36 3.600010000100100001 96 6.556 6.456 6.556 17.36 4.18 G12(t)1001000010001000 192 6.556 6.556 6.465 17.36 4.180001000100000011 96 6.556 6.465 6.556 17.36 4.180001000100100001 12 6.583 5.915 6.583 17.36 6.26 G13(t)0101010100000000 4 6.522 6.522 6.522 17.34 7.79 G14(c-D03)0100000001100001 48 6.558 6.558 6.445 17.33 9.86 G15(t)0001010100000001 16 6.521 6.521 6.521 17.33 10.41 G16(c)1000100000000110 48 6.545 6.507 6.507 17.32 11.22 G17(t)0010100010001000 12 6.499 6.499 6.561 17.32 11.38 G18(t-L60)
The energetically most favorable G1 structure has space-group symmetry R3m. The lattice constant is a = 6.524 A forthe 2 × 2 × 2 bcc supercell containing 16 atoms. The latticeconstant of abcc = 3.262 A for the underlying bcc lattice isalmost identical with the results of Ikehata et al.17 (3.273 A)and Sun et al.28 (3.260 A), assuming a D03-type orderingand with the room-temperature measurements of Kim et al.10
(abcc = 3.287 A). A schematic representation of the three mostrelevant structures is shown in Fig. 4. The G1 structure ischaracterized by chains of nearest-neighbor Nb atoms runningalong one of the body diagonals, e.g., the [111] directions.In the D03 structure chains of Nb atoms extend along theface diagonals. In the tetragonal L60 structure chains of Nbatoms are arranged parallel to one of the edges of the cell.The essential difference between the alloy models is evident:Whereas in the D03 structure each Nb atom has eight Tineighbors in the first and six Ti neighbors in the secondcoordination shell, in the G1 structure the Nb atoms havetwo Nb and six Ti next and six Ti next-nearest neighbors, andin the L60 structure the Nb atoms have eight Ti next and fourTi and two Nb next-nearest neighbors. Similar arrangementsof nearest-neighbor Nb-Nb bonds as for the G1 structure, inthe form of zigzag or spiral chains, are also characteristic forother low-energy structures, emphasizing the importance of
strong Nb-Nb interactions for the structural stability. All threestructures may also be described by smaller primitive unit cellscontaining only four crystallographically inequivalent atoms,as shown in Fig. 4.
The energetic ordering changes if different levels of relax-ation are permitted. A relaxation of the internal coordinates ata fixed cell shape and under the constraint of conserving space-group symmetry (which is the standard mode of relaxation inVASP) leaves the G1, D03, and L60 structures unchanged. Ifprior to the relaxation of the atomic positions the symmetryis broken, the energy of the G1 structure is lowered by9.4 meV/atom, that of the L60 phase by 14.5 meV/atom. TheD03 structure remains unchanged. A subsequent full relaxation(volume and shape of the unit cell and internal coordinates)lowers the energy of the G1 phase further by 6.7 meV/atomand that of the L60 phase further by 14.3 meV/atom. Hence thefully relaxed L60 structure is lower in energy by 25 meV/atomthan the D03 phase and by 1.2 meV/atom lower than the G1phase. As we demonstrate below, it represents a possible modelfor transforming to the α′′ phase. The structure resulting froma fully unconstrained relaxation of the G1 structure, on theother hand, represents only a local minimum of the potentialenergy and was found to be dynamically unstable. This isa first indication that upon transformation to a more stable
054202-6

TEMPERATURE-INDUCED MARTENSITIC PHASE . . . PHYSICAL REVIEW B 84, 054202 (2011)
FIG. 4. (Color online) Comparison of the chemical decoration of the 2 × 2 × 2 bcc supercell of a Ti3Nb alloy corresponding to the G1(a), D03 (b), and L60 (c) structures. Ti atoms are shown in blue (light gray), Nb atoms in red (dark gray). For all three structures an irreduciblefour-atom unit cell may be defined. The crystallographically inequivalent sites in the irreducible cell are labeled by the chemical symbols (cf. text).
low-temperature phase the chemical decoration optimized forthe bcc lattice will not be conserved.
We have also calculated the elastic constants for the G1β-phase Ti3Nb alloy, and the results are compiled in Table IItogether with the elastic constants measured by Takesue et al.23
and by Talling et al.26,27 for different gum-metal specimens.For these alloys the electron/atom ratio lies in the rangebetween 4.25 and 4.26. These values are very close toe/a = 4.25 for Ti3Nb. For the ground-state structure and underapplied constant strain the coordinates of all atoms within the16-atom supercell have been relaxed under the constraint ofconserving space-group symmetry. The results show that incontrast to the D03-type alloy, G1-type Ti3Nb is stable againstshearing. By construction, at low temperatures the G1 phaseis also stable against the formation of antisite defects.
The elastic constants of gum-metal have been determinedby Takesue et al.23 by a Monte Carlo fitting procedure from themoduli determined by compressive and tensile tests on single-crystal specimens. Talling et al.26,27 used synchrotron x-raydiffraction on specimens produced from elemental powders(EPs) by the same techniques as those used by Takesue et al., aswell as specimens of identical composition but prepared usinga different technique (plasma spraying and hot pressing—HP).
The comparison with experiment demonstrates that theG1-type Ti3Nb alloy has elastic shear constants which are
very similar to those measured for gum-metal alloys. Cal-culations of the phonon dispersion relations in the harmonicapproximation confirm that all acoustic phonons have realeigenfrequencies. However, the G1 structure has imaginaryoptical phonon modes, similar to bcc Ti, which can be stabi-lized only by anharmonic phonon-phonon interactions. Detailsof the harmonic and anharmonic phonons in the β phase ofTi3Nb will be discussed together with the temperature-drivenphase transformation.
In the following we assume that the G1-ordered binary alloyis a good model system for the high-temperature phase of gum-metal alloys. However, this does not mean that we claim thatthe β phase is an ordered intermetallic compound. First, theG1 structure is only one among sixteen symmetry-equivalentand energetically degenerate configurations. A real alloy willconsist of a disordered arrangement of domains consistingof these 16 configurations. Second, the energy differencesbetween the various ordered structures representing differentchemical decorations are sufficiently small such that low-energy configurations can be realized at a local level, theincrease in internal energy being compensated by a gainin configurational entropy. However, for calculation of thedynamical properties we need a supercell model which isstable at least against shear deformations. This condition isfulfilled for the G1 structure.
TABLE II. Elastic constants (in GPa) calculated for bcc D03- and G1-type Ti3Nb alloys, compared with experimental results measured ongum-metal specimens of slightly different compositions (cf. text).
Alloy C11 C12 C44 C ′ Reference
TheoryTi3Nb (G1) 148.8 111.4 37.5 18.7 PWd
Ti3Nb (D03) 131.3 119.3 −7.8 6.0 PWd
Ti3Nb (D03) 128.5 115.5 14.9 6.5 17Ti3Nb (D03) 117.3 105.6 19.9 5.8 28ExperimentTi-23Nb-0.7Ta-2Zr-Oa 28.5–35.6 12.3–13.7 23EPb 125 93 28 16 26HPc 125 90 31 17.5 26
aComposition given in atomic percent (cf. text).bProduced from elemental powders and cold pressing.cProduced by plasma spraying and hot pressing.dPresent work.
054202-7

PETR LAZAR et al. PHYSICAL REVIEW B 84, 054202 (2011)
3. Cluster expansion calculations for bcc Ti-Nb alloys
In order to make an exhaustive search for concentration-dependent ground-state structures based on a given lattice, thecluster expansion (CE) technique was applied by exploiting thecapabilities of the Universal Cluster Expansion code UNCLE.66
The key concept of CE is to describe the infinite solid asa set of interacting clusters of atoms located on the sites of alattice and to reformulate the total energy in terms of a clusterseries.53 For a binary AxB1−x alloy, the enthalpy of formation�H (σi) for a given distribution σi of the A and B atoms overthe sites of the crystal lattice is given by
�H (σi) = E(AxB1−x,σi) − xE(A) − (1 − x)E(B). (3)
The enthalpy of formation is linearly expanded into a sum ofenergies characteristic for geometrical building blocks (singleatoms, dimers, triangles, etc.) of the structure, similar to aHeisenberg model of interacting spins,
�H (σi) =∑F
DF F (σi)JF , (4)
in which the coefficients DF and the correlation functionsF (σi) are determined by the geometry of the underlyingcrystal lattice and its chemical decoration in the configurationσi . The so-called effective cluster interaction energies JF aredetermined by fitting formation energies of a suitably selectedset of structures derived by a DFT method (such as VASP) tothe expansion in Eq. (4). Making use of UNCLE, structures forcompounds are constructed for which DFT formation energiesare evaluated. From these a set of cluster interaction energiesJF are derived which are then used (i) to test the fit to theinput DFT structures and (ii) to predict formation energies fornew ground-state structures which are then recalculated byDFT. This procedure is repeated until a sufficient set of figuresand corresponding cluster interaction energies are obtainedfrom which energies of formation are determined accordingto Eq. (4), which fit all DFT energies within a cross-validationscore of 0.5 meV (for the present case of bcc Ti-Nb alloys) withrespect to formation energies per atom. Now, this convergedCE is used to find the most stable structures, i.e., the ones withlowest formation energies which constitute the ground-stateline of the concentration-dependent phase diagram.
Normally, the total energy calculations are performed forfully relaxed structures to account for local distortions of thelattice depending on the given chemical decoration. However,for the metastable high-temperature phase of Ti-Nb alloys,only the volume of the unit cell can be allowed to relax,because an optimization of the cell shape and the internaldegrees of freedom could eventually relax to the more stablelow-temperature phase or to an intermediate metastable phaseof different symmetry.
CE calculations for the bcc β phase of Ti-Nb alloys havebeen performed for the entire concentration range. To createthe final input for the calculation of the cluster interactions,total energies have been calculated for 95 different structures,including at the composition Ti3Nb three structures with fourinequivalent sites per primitive unit cell (i.e., the G1, D03,and L60 structures) and three structures with eight sites perprimitive unit cell. For these structures only the volume of theunit cell has been relaxed; the shape of the unit cell and the
internal positions of the atoms have been kept frozen. Withthe cluster interactions determined from these data, altogether163 373 structures with up to 16 atoms per primitive unitcell may be generated, including 3450 structures with thecomposition Ti3Nb. Details of the CE calculations will bereported elsewhere;67 here the important point is that the CEcalculations predict and confirm that at the composition Ti3Nbthe G1 structure indeed has the lowest energy of all 3450structures investigated on a bcc lattice.
B. Supercell models for the low-temperature α′
phase of Ti3Nb
The α′ phase of the Ti-rich alloys is in principle a solidsolution of the second component in the hexagonal low-temperature phase of Ti. Hence at the composition Ti3Nbthis phase will be strongly supersaturated with Nb. However,for completeness it has been included in our analysis. Toconstruct a model for the α′ low-temperature phase of Ti3Nbwe have followed a strategy similar to that used for the bccphase. We constructed a supercell containing 16 atoms basedon the hexagonal Bh lattice. The lower symmetry of thisstructure made it necessary to reduce the number of possibleconfigurations by fixing the occupation of one half of the latticesites with Ti, but this still leaves 66 different decorations ofthe basic Bh structure. For these low-temperature structureswe have performed a complete relaxation of the volume andshape of the supercell and also of all atomic coordinates.According to their energies, the structures can be arrangedinto ten groups (some of them turn out to be energeticallydegenerate), and for three of these groups the internal energyis lower than for the high-temperature bcc G1 phase. Thefirst two energetically degenerate groups contain 16 and 8structures with monoclinically distorted cells and a strongNb-Nb interaction. These structures are by about 10 meV/atomenergetically more favorable than the G1 phase. The thirdgroup consists of four monoclinic structures and is about3 meV/atom higher in energy than the structures from thefirst two groups. The site occupation of these structures isclosely related to that from the first two groups, but they differin the absence of the nearest-neighbor Nb-Nb interactions.Representative examples from all three groups are shown inFig. 5. The energetically degenerate fourth and fifth groups ofstructures are already higher in energy than the G1 structureand have a tetragonal unit cell. For these five groups ofstructures the information on the chemical decoration, latticeparameters, and total energies is compiled in Table III.
The other groups of structures have higher energy thanthe G1 structure and are therefore not suitable candidates fora martensitic phase. It should be noted that the hexagonalsymmetry is preserved upon relaxation only for the sixstructures with the highest energies, which are by 17 meV/atomless favorable than the bcc G1 phase. By construction theserelaxed structures are at least metastable with respect to elasticdeformations and the formation of antisite point defects.
For the structures from groups H1, H2, and H3 we havealso calculated the phonon dispersion relations in a harmonicapproximations. Imaginary phonon modes have been found forthose from groups H1 and H2. These structures are thereforeunsuitable as models for a metastable low-temperature phase
054202-8
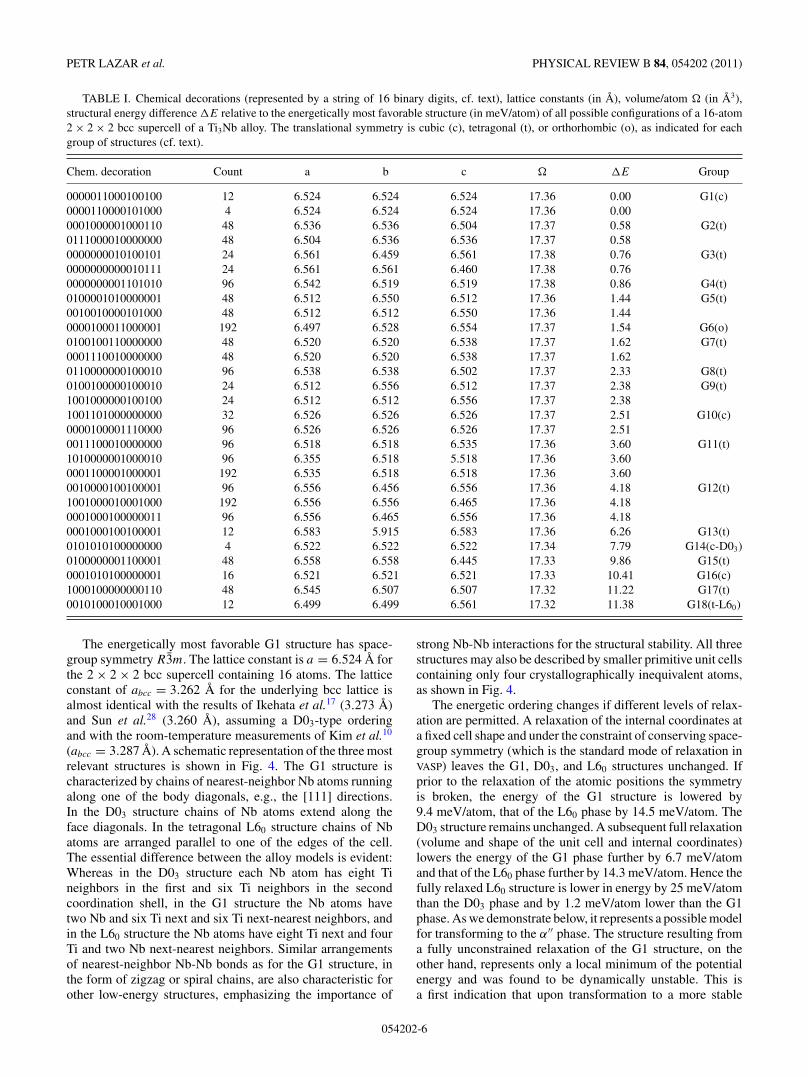
TEMPERATURE-INDUCED MARTENSITIC PHASE . . . PHYSICAL REVIEW B 84, 054202 (2011)
FIG. 5. (Color online) Supercells containing 16 atoms of the energetically most favorable groups of structures produced by relaxation of aBh structure with different chemical decorations used to model the α′ phase: structures from groups H1 (a), H2 (b), and H3 (c). Ti atoms areshown in gray, Nb atoms in black (cf. text).
derived from an hcp structure. In contrast, for structure H3all eigenmodes are found to be real; the structure is foundto be dynamically stable (see Fig. 6). This structure is apossible candidate for the metastable low-temperature α′ phaseof Ti3Nb. The distortion from the basic hexagonal lattice iscaused by the large content of Nb, which makes this structurealso less stable than the orthorhombic α′′ and hexagonal ω
phases (see below).
C. Structure of orthorhombic α′′ Ti3Nb martensite
The α′′ martensite has an orthorhombic lattice3,68–70 withthe atoms in positions arranged according to space groupCmcm. The Wyckoff positions are (0,0,0), (1/2,1/2,0),(0,1 − 2y,1/2), and (1/2,1/2 − 2y,1/2), with y being ≈0.2.By varying b/a, c/a, and y the hcp structure of the α′ phase(for b/a = √
3,c/a = √8/3,y = 1/3) and the bcc structure
of the β phase (for b/a = √2,c/a = √
2,y = 1/4) may beproduced. Lattice constants of the α′′ phase of Ti-Nb alloyswith 15 − 35 at. % Nb have been reported by Kim et al.10
At the composition Ti3Nb the measured lattice constants area = 3.19 A, b = 4.80 A, and c = 4.64 A. The orthorhombicstructure may be viewed as arising from a distortion of asupercell containing four atoms inscribed to the bcc lattice ofthe β phase and a slight displacement of the atoms decoratingthe faces of the new unit cell (see Fig. 7).
As for the β phase, the chemical decoration of theorthorhombic lattice remains to be specified. In their cal-culations of the elastic constants of α′′ Ti3Nb, Sun et al.28
had assumed that the (1/2,1/2 − 2y,1/2) site is occupied
by Nb without investigating alternative decorations. Thetwo crystallographically inequivalent sites allow only twodifferent chemical decorations. Our calculations show that thedecoration assumed by Sun et al.28 is the most stable one,but both allowed decorations differ by only 0.005 meV/atomin energy. If the optimized structure of the α′′ martensite istransformed back to the bcc lattice, the chemical decorationcorresponds to the L60 structure.
Our starting points for the construction of models for theα′′ phase were hence the chemical decorations of the bcclattice in the G1 and L60 structures, described in the rotatedcoordinate system appropriate to the α′′ phase (see Fig. 7). Arelaxation at constant cell volume and fixed lattice parameterb, but without any symmetry constraints (the symmetry mustbe broken in the initial configuration), has been performedusing the GADGET routine.52 The relaxation lowers the totalenergy of the G1 structure by ∼7.5 meV/atom and that ofthe L60 structure by ∼22 meV/atom. While the relaxed G1structure is stable against a distortion along the (110) directionrequired to match the orthorhombic α′′ structure, the distortionof the relaxed L60 lattice lowers the total energy by a further∼6.8 meV/atom (see Fig. 8). A stable energy minimumis reached for the orthorhombic lattice parameters, 3.34,4.77, and 4.41 A, and a value of the internal parameter ofy = 0.20, in good agreement with the experimental latticeconstants reported by Kim et al.10 and those calculated bySun et al.28 According to our calculation, the total energyof the α′′ structure is by 17.4 meV/atom lower than that ofthe bcc G1 structure and lower by 1.2 meV/atom than thedistorted structure resulting from an unconstrained relaxation
TABLE III. The five groups of possible Ti3Nb structures with a total energy lower or comparable to that of the bcc G1 structure. Thesestructures have been created by decorating the sites in a 16-atom supercell of the Bh lattice and full relaxation. The chemical decoration isdescribed by a string of 16 binary digits, 0 standing for the occupation with Ti, 1 with Nb atoms. Lattice constants are given in A, volume/atomin A3, and angles in degree. The energy difference �E (in meV/atom) has been evaluated relative to the most stable bcc phase (the unrelaxedG1 structure) (cf. text).
Chem. decoration Count a b c α β γ Volume �E Group
0000000010010011 16 5.797 6.612 8.900 90 90 55.2 17.51 −9.7 H10000000001001110 8 5.797 5.797 8.897 90 90 69.6 17.51 −9.7 H20000000010011001 4 6.758 5.827 8.734 90 90 54.6 17.51 −7.0 H30000000011100010 16 9.164 6.511 6.586 90 90 45.3 17.45 +2.7 H40000000011010100 8 6.512 6.512 6.586 90 90 89.4 17.45 +2.7 H5
054202-9

PETR LAZAR et al. PHYSICAL REVIEW B 84, 054202 (2011)
FIG. 6. (Color online) The phonon dispersions of α′ Ti3Nb in theH3 structure, calculated in the harmonic approximation and shown inthe Brillouin zone corresponding to the 16-atom cell (cf. text).
of the G1 structure. It is also considerably lower than any ofthe structures based on the relaxed hexagonal Bh lattice. Thehigher stability of the α′′ phase is consistent with experimentalobservations. However, it is important to emphasize thatalthough the bcc lattice of the β phase may be continuouslydeformed to the orthorhombic α′′ phase, the optimal chemicaldecoration of both lattices is different; a phase transformationwill hence involve changes in the site occupation. In fact, thestructural relation with the L60 structure has been discoveredby following the inverse transformation from the α′′ to theβ phase.
We have also calculated the elastic constants of theoptimized α′′ phase and the results are compiled in Table IV.
FIG. 7. (Color online) Schematic illustration of the structuralrelationship between the bcc β and the orthorhombic α′′ phases ofTi3Nb. The α′′ phase may be generated by a shear deformation of asupercell inscribed into the bcc lattice and a slight displacement ofthe atoms decorating the faces of this cell. The chemical decorationis shown for the L60 structure. In this case relaxation of the internalcoordinates, followed by an orthorhombic distortion of the inscribedsupercell, yields immediately to the α′′ structure with the chemicaldecoration giving the lowest energy. Ti atoms are represented by blackballs, Nb atoms are marked by red circles around the black dots (cf.text).
0
0.005
0.01
0.015
0.02
0.025
ener
gy [e
V/a
tom
] bcc Ti3NbG1 Ti3Nb
4.6 4.65 4.7 4.75 4.8 4.85 4.9lattice parameter in [110] direction
3.2
3.6
4
4.4
latti
ce p
aram
eter
s
a lattice parameter
c lattice parameter
cubic symmetry
symmetry brokenand relaxed
β phase α’’ phase
experimental values ofα’’ lattice parameters
FIG. 8. (Color online) Variation of the total energy of the G1 (redtriangles) and L60 (blue diamonds) models of the β-phase structureupon relaxation of the internal coordinates at fixed cell shape (afterbreaking point group symmetry) and further distortion along the(110) direction to induce a transformation to the orthorhombic α′′
phase. Note that the distortion of the relaxed L60 structure leads to astable orthorhombic structure, whereas the distortion is energeticallyunfavorable for the relaxed G1 structure (cf. text).
The conditions for the elastic stability of the orthorhombiclattice are71
Cii > 0 for i = 1 − 6,
C22C33 − C223 > 0, (5)
C11C22C33 + 2C12C13C23 − C212C33 − C2
13C22 − C223C11 > 0,
and they are all satisfied for the fully relaxed structure.Compared to the elastic constants calculated by Sun et al.,28
we find considerably higher values for all shear constants.
FIG. 9. (Color online) Phonon dispersions of orthorhombic α′′
Ti3Nb along the principal symmetry directions, calculated in theharmonic approximation and represented in the Brillouin zonecorresponding to the orthorhombic four-atom elementary cell.
054202-10

TEMPERATURE-INDUCED MARTENSITIC PHASE . . . PHYSICAL REVIEW B 84, 054202 (2011)
TABLE IV. Elastic constants (in GPa) calculated for orthorhombic α′′ Ti3Nb alloy (cf. text).
Alloy C11 C12 C13 C22 C23 C33 C44 C55 C66 Reference
Ti3Nb 148.1 93.0 123.8 171.1 80.4 174.6 64.7 44.9 32.3 PWa
Ti3Nb 129.9 91.1 126.8 148.2 69.3 135.6 28.4 23.1 39.7 28
aPresent work.
The phonon dispersion relations of orthorhombic α′′ Ti3Nbcalculated in the harmonic approximation for the irreduciblefour-atom cell are shown in Fig. 9. All eigenmodes are foundto be real—the structure is elastically and dynamically stable.Hence the structure represents an acceptable model for thelow-temperature phase. However, it must also be noted thatthe relation between the bcc G1 and the orthorhombic α′′structures is not quite as simple as suggested for a completelyrandom alloy—the optimal model for the α′′ structure has beenderived from a bcc lattice with a slightly different chemicaldecoration than the optimized G1 model of the β phase.
D. Structure of the low-temperature ω phase of Ti3Nb
The ω phase of Ti-based alloys exists in two slightlydifferent modifications—hexagonal and trigonal.5 The hexag-onal version has the AlB2-type structure with space groupP 6/mmm and three atoms per unit cell at positions (0,0,0),(2/3,1/3,1/2), and (1/3,2/3,1/2), the axial ratio is c/a ∼0.62. The structure may be considered as an ABAB... stackingsequence of triangular A and honeycomb B layers. Thestructure may be derived from the bcc structure by collapsingone pair of (111) planes to the intermediate position, creatinga honeycomb layer, leaving the next plane unchanged, andcollapsing the next pair and so forth [see Fig. 10(a)]. Thecomplete collapse (atomic displacements by ±abcc
√3/12)
will produce the ideal ω structure with aω = √2abcc and
cω = √3abcc/2. Displacements smaller than abcc
√3/2 from
the positions in the bcc phase will lead to the formationof the trigonal ω phase (sometimes also referred to as the“rumpled” ω structure). The space group is P 3m1, andatoms are located at positions (0,0,0), (2/3,1/3,1/2 + z), and(1/3,2/3,1/2 − z). The hexagonal ω structure correspondsto z = 0. The bcc structure is recovered for z = 1/6 andc/a = √
3/8.
The elementary cell of the ω structure contains onlythree atoms. The smallest supercell compatible with thestoichiometry Ti3Nb contains 12 atoms. Starting from theG1 structure of the β phase, the collapse model leads afterrelaxation to a hexagonal ω structure with a lattice constantof aω = 9.324 A and an axial ratio of c/a = 0.30 for thesupercell. For the primitive hexagonal cell, the lattice constantof 4.66 A and the axial ratio of 0.30 are in perfect agreementwith the results of Sun et al.28 The structure of the ω phase,with the chemical decoration derived from the G1 structure, isshown in Fig. 10(b). The total energy is 10 meV/atom lowerthan for the G1-type β phase, but higher by 7.4 meV/atom thanfor the α′′ structure. Note that the structure of the ω phase canbe derived from the G1 structure of the β phase without anychange of site occupation.
The elastic constants for the ω phase are compiled inTable V. They are in reasonable agreement with the resultsof Sun et al.28 The conditions for the elastic stability of thehexagonal structure71
C44 > 0,
(C11 + C12)C33 − 2C213 > 0, (6)
C11 − C12 > 0,
are all satisfied and the hexagonal ω structure is elasticallystable.
A calculation of the phonon dispersion relations in theharmonic approximation confirms that all acoustic modes arestable but display an imaginary long-wavelength optical modealong the [ξξ0] direction (see Fig. 11). The eigenvectors of thismode show that it consists of a displacement of the Nb atomslocated in the collapsed honeycomb-type layer perpendicularto the plane. A static relaxation without the constraint ofhexagonal symmetry, however, does not converge to a trigonalphase where pairs of atoms are displaced in opposite directions.
FIG. 10. (Color online) (a) Schematic representation of the collapse model for the relation between the structural models of the bcc β
and hexagonal ω phases. (b) Supercell containing 12 atoms representing the structure of the hexagonal ω Ti3Nb alloys. The [111] directionof the bcc lattice corresponds to the [0001] axis of the hexagonal lattice. Ti atoms are shown in blue (dark), Nb atoms in red (light gray) (cf.text).
054202-11

PETR LAZAR et al. PHYSICAL REVIEW B 84, 054202 (2011)
TABLE V. Elastic constants (in GPa) calculated for hexagonal ω Ti3Nb alloy, cf. text.
Alloy C11 C12 C13 C33 C44 C66 Reference
Ti3Nb-hexagonal 226.0 116.7 80.7 276.4 54.7 38.8 PWa
Ti3Nb-hexagonal 162.2 124.9 84.8 234.3 22.3 18.6 28
aPresent work.
This suggests that this mode will be stabilized by modestanharmonic corrections. A self-consistent phonon calculationfor such a large cell with low symmetry, however, turnsout to be computationally very demanding. Therefore, thecalculation of the vibrational free energy for the ω phasehas been performed in the harmonic approximation and thecontribution of the soft mode has been set to zero.
IV. STABILIZATION OF THE bcc β PHASE BYANHARMONIC INTERACTIONS
In the preceding sections we have constructed structuralmodels for the β, α′, ω, and α′′ phases of Ti3Nb alloys.Relative to the most stable α′′ phase the structural energydifferences are 7.4, 10.4, and 17.4 meV/atom for the ω, α′,and β phases, respectively. While the relaxed structures ofthe α′′ and α′ phases have been shown to be both elasticallyand dynamically stable, and the ω phase shows only oneimaginary phonon mode related to displacements of the Nbatoms from the collapsed honeycomb plane, the optimized G1structure of the β phase was found to be elastically stable butdynamically unstable, with imaginary optical phonon modesextending over almost the entire Brillouin zone. To verify that,as for the β phase of pure Ti, the G1 structure is stabilizedalready at moderate temperatures by anharmonic interactions,the phonon dispersion relations have been calculated usingself-consistent phonon theory as implemented in the SCAILDmethod for temperatures up to 1600 K. Figure 12 showsthe phonon dispersion relations calculated in the harmonic
FIG. 11. (Color online) The phonon dispersion relations of thehexagonal ω phase Ti3Nb alloy along the principal symmetrydirections of the Brillouin zone corresponding to the hexagonalsupercell with 12 atoms, calculated in the harmonic approximation.
(a)
0
2
4
6
8
freq
uenc
y (T
Hz)
T=0K
[ξ00][ξξξ] Γ[1/4,1/4,1/4]Γ [ξ−ξξ]
2i
(b)
0
2
4
6
8fr
eque
ncy
(TH
z)
T=300K
[ξ00][ξξξ] Γ[1/4,1/4,1/4]Γ [ξ−ξξ]
(c)
0
2
4
6
8
freq
uenc
y (T
Hz)
T = 600K
[ξ00][ξξξ] Γ[1/4,1/4,1/4]Γ [ξ−ξξ]
FIG. 12. (Color online) The phonon dispersions of the β Ti3Nballoy in the G1 structure, calculated in the harmonic approxima-tion (a) and using self-consistent phonon theory at T = 300 K(b) and T = 600 K (c). The dispersion relations are drawn for theBrillouin zone corresponding to the irreducible four-atom elementarycell.
054202-12
TEMPERATURE-INDUCED MARTENSITIC PHASE . . . PHYSICAL REVIEW B 84, 054202 (2011)
0 200 400 600 800 1000 1200temperature (K)
0
1
2
3
4
freq
uenc
y (T
Hz)
double degenerate optical modenon-degenerate optical mode
1i
2i
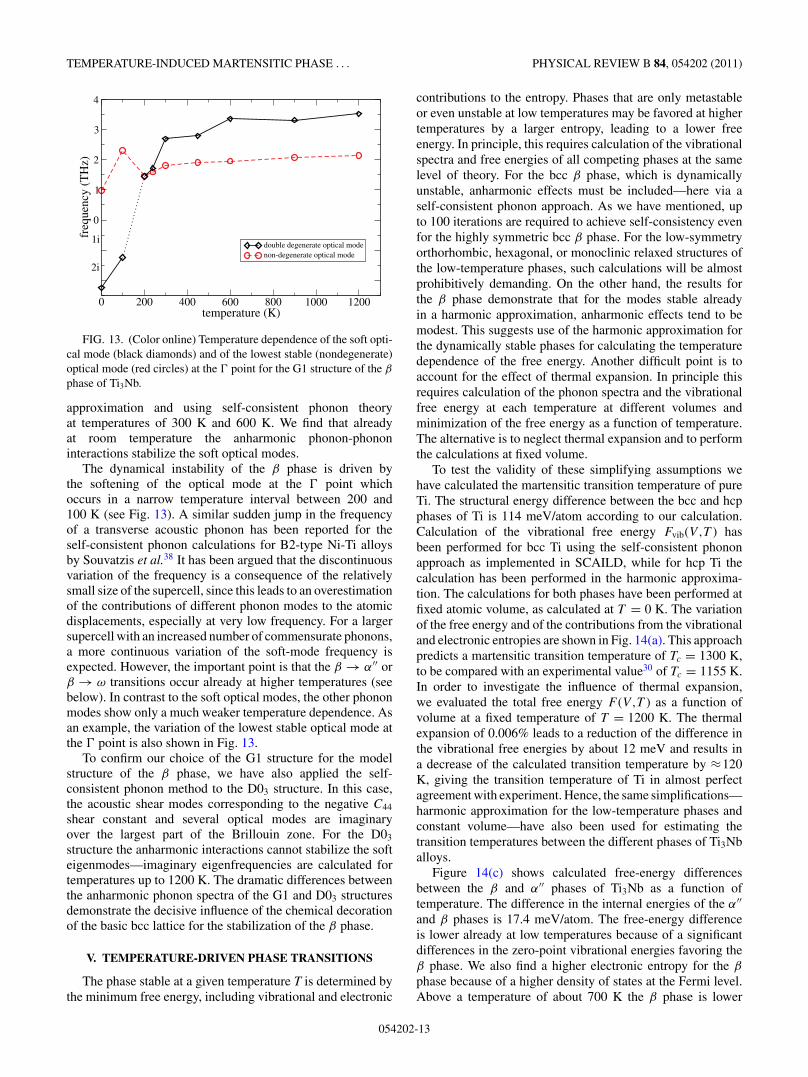
FIG. 13. (Color online) Temperature dependence of the soft opti-cal mode (black diamonds) and of the lowest stable (nondegenerate)optical mode (red circles) at the point for the G1 structure of the β
phase of Ti3Nb.
approximation and using self-consistent phonon theoryat temperatures of 300 K and 600 K. We find that alreadyat room temperature the anharmonic phonon-phononinteractions stabilize the soft optical modes.
The dynamical instability of the β phase is driven bythe softening of the optical mode at the point whichoccurs in a narrow temperature interval between 200 and100 K (see Fig. 13). A similar sudden jump in the frequencyof a transverse acoustic phonon has been reported for theself-consistent phonon calculations for B2-type Ni-Ti alloysby Souvatzis et al.38 It has been argued that the discontinuousvariation of the frequency is a consequence of the relativelysmall size of the supercell, since this leads to an overestimationof the contributions of different phonon modes to the atomicdisplacements, especially at very low frequency. For a largersupercell with an increased number of commensurate phonons,a more continuous variation of the soft-mode frequency isexpected. However, the important point is that the β → α′′ orβ → ω transitions occur already at higher temperatures (seebelow). In contrast to the soft optical modes, the other phononmodes show only a much weaker temperature dependence. Asan example, the variation of the lowest stable optical mode atthe point is also shown in Fig. 13.
To confirm our choice of the G1 structure for the modelstructure of the β phase, we have also applied the self-consistent phonon method to the D03 structure. In this case,the acoustic shear modes corresponding to the negative C44
shear constant and several optical modes are imaginaryover the largest part of the Brillouin zone. For the D03
structure the anharmonic interactions cannot stabilize the softeigenmodes—imaginary eigenfrequencies are calculated fortemperatures up to 1200 K. The dramatic differences betweenthe anharmonic phonon spectra of the G1 and D03 structuresdemonstrate the decisive influence of the chemical decorationof the basic bcc lattice for the stabilization of the β phase.
V. TEMPERATURE-DRIVEN PHASE TRANSITIONS
The phase stable at a given temperature T is determined bythe minimum free energy, including vibrational and electronic
contributions to the entropy. Phases that are only metastableor even unstable at low temperatures may be favored at highertemperatures by a larger entropy, leading to a lower freeenergy. In principle, this requires calculation of the vibrationalspectra and free energies of all competing phases at the samelevel of theory. For the bcc β phase, which is dynamicallyunstable, anharmonic effects must be included—here via aself-consistent phonon approach. As we have mentioned, upto 100 iterations are required to achieve self-consistency evenfor the highly symmetric bcc β phase. For the low-symmetryorthorhombic, hexagonal, or monoclinic relaxed structures ofthe low-temperature phases, such calculations will be almostprohibitively demanding. On the other hand, the results forthe β phase demonstrate that for the modes stable alreadyin a harmonic approximation, anharmonic effects tend to bemodest. This suggests use of the harmonic approximation forthe dynamically stable phases for calculating the temperaturedependence of the free energy. Another difficult point is toaccount for the effect of thermal expansion. In principle thisrequires calculation of the phonon spectra and the vibrationalfree energy at each temperature at different volumes andminimization of the free energy as a function of temperature.The alternative is to neglect thermal expansion and to performthe calculations at fixed volume.
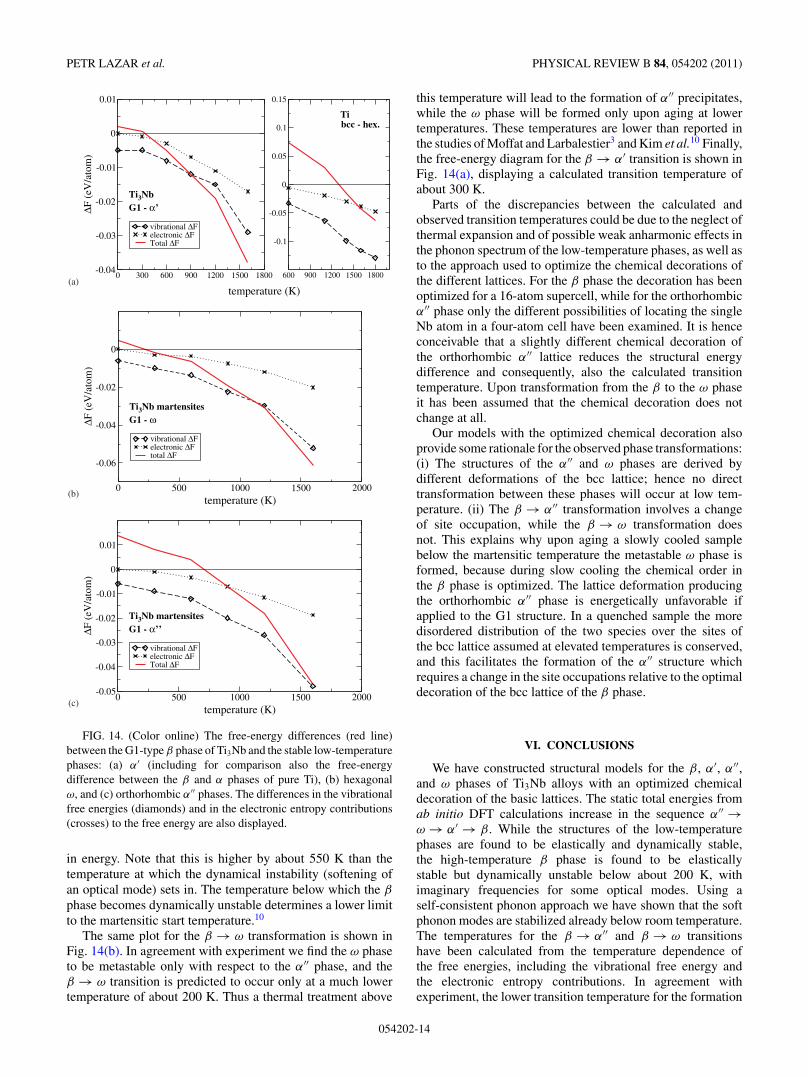
To test the validity of these simplifying assumptions wehave calculated the martensitic transition temperature of pureTi. The structural energy difference between the bcc and hcpphases of Ti is 114 meV/atom according to our calculation.Calculation of the vibrational free energy Fvib(V,T ) hasbeen performed for bcc Ti using the self-consistent phononapproach as implemented in SCAILD, while for hcp Ti thecalculation has been performed in the harmonic approxima-tion. The calculations for both phases have been performed atfixed atomic volume, as calculated at T = 0 K. The variationof the free energy and of the contributions from the vibrationaland electronic entropies are shown in Fig. 14(a). This approachpredicts a martensitic transition temperature of Tc = 1300 K,to be compared with an experimental value30 of Tc = 1155 K.In order to investigate the influence of thermal expansion,we evaluated the total free energy F (V,T ) as a function ofvolume at a fixed temperature of T = 1200 K. The thermalexpansion of 0.006% leads to a reduction of the difference inthe vibrational free energies by about 12 meV and results ina decrease of the calculated transition temperature by ≈120K, giving the transition temperature of Ti in almost perfectagreement with experiment. Hence, the same simplifications—harmonic approximation for the low-temperature phases andconstant volume—have also been used for estimating thetransition temperatures between the different phases of Ti3Nballoys.
Figure 14(c) shows calculated free-energy differencesbetween the β and α′′ phases of Ti3Nb as a function oftemperature. The difference in the internal energies of the α′′
and β phases is 17.4 meV/atom. The free-energy differenceis lower already at low temperatures because of a significantdifferences in the zero-point vibrational energies favoring theβ phase. We also find a higher electronic entropy for the β
phase because of a higher density of states at the Fermi level.Above a temperature of about 700 K the β phase is lower
054202-13
PETR LAZAR et al. PHYSICAL REVIEW B 84, 054202 (2011)
(a)0 300 600 900 1200 1500 1800
temperature (K)
-0.04
-0.03
-0.02
-0.01
0
0.01ΔF
(eV
/ato
m)
vibrational ΔFelectronic ΔFTotal ΔF
600 900 1200 1500 1800
-0.1
-0.05
0
0.05
0.1
0.15
G1 - α’Ti3Nb
Tibcc - hex.
(b)0 500 1000 1500 2000
temperature (K)
-0.06
-0.04
-0.02
0
ΔF (
eV/a
tom
)
vibrational ΔFelectronic ΔFtotal ΔF
G1 - ωTi3Nb martensites
(c)0 500 1000 1500 2000
temperature (K)
-0.05
-0.04
-0.03
-0.02
-0.01
0
0.01
ΔF (
eV/a
tom
)
vibrational ΔFelectronic ΔFTotal ΔF
G1 - α’’Ti3Nb martensites
FIG. 14. (Color online) The free-energy differences (red line)between the G1-type β phase of Ti3Nb and the stable low-temperaturephases: (a) α′ (including for comparison also the free-energydifference between the β and α phases of pure Ti), (b) hexagonalω, and (c) orthorhombic α′′ phases. The differences in the vibrationalfree energies (diamonds) and in the electronic entropy contributions(crosses) to the free energy are also displayed.
in energy. Note that this is higher by about 550 K than thetemperature at which the dynamical instability (softening ofan optical mode) sets in. The temperature below which the β
phase becomes dynamically unstable determines a lower limitto the martensitic start temperature.10
The same plot for the β → ω transformation is shown inFig. 14(b). In agreement with experiment we find the ω phaseto be metastable only with respect to the α′′ phase, and theβ → ω transition is predicted to occur only at a much lowertemperature of about 200 K. Thus a thermal treatment above
this temperature will lead to the formation of α′′ precipitates,while the ω phase will be formed only upon aging at lowertemperatures. These temperatures are lower than reported inthe studies of Moffat and Larbalestier3 and Kim et al.10 Finally,the free-energy diagram for the β → α′ transition is shown inFig. 14(a), displaying a calculated transition temperature ofabout 300 K.
Parts of the discrepancies between the calculated andobserved transition temperatures could be due to the neglect ofthermal expansion and of possible weak anharmonic effects inthe phonon spectrum of the low-temperature phases, as well asto the approach used to optimize the chemical decorations ofthe different lattices. For the β phase the decoration has beenoptimized for a 16-atom supercell, while for the orthorhombicα′′ phase only the different possibilities of locating the singleNb atom in a four-atom cell have been examined. It is henceconceivable that a slightly different chemical decoration ofthe orthorhombic α′′ lattice reduces the structural energydifference and consequently, also the calculated transitiontemperature. Upon transformation from the β to the ω phaseit has been assumed that the chemical decoration does notchange at all.
Our models with the optimized chemical decoration alsoprovide some rationale for the observed phase transformations:(i) The structures of the α′′ and ω phases are derived bydifferent deformations of the bcc lattice; hence no directtransformation between these phases will occur at low tem-perature. (ii) The β → α′′ transformation involves a changeof site occupation, while the β → ω transformation doesnot. This explains why upon aging a slowly cooled samplebelow the martensitic temperature the metastable ω phase isformed, because during slow cooling the chemical order inthe β phase is optimized. The lattice deformation producingthe orthorhombic α′′ phase is energetically unfavorable ifapplied to the G1 structure. In a quenched sample the moredisordered distribution of the two species over the sites ofthe bcc lattice assumed at elevated temperatures is conserved,and this facilitates the formation of the α′′ structure whichrequires a change in the site occupations relative to the optimaldecoration of the bcc lattice of the β phase.
VI. CONCLUSIONS
We have constructed structural models for the β, α′, α′′,and ω phases of Ti3Nb alloys with an optimized chemicaldecoration of the basic lattices. The static total energies fromab initio DFT calculations increase in the sequence α′′ →ω → α′ → β. While the structures of the low-temperaturephases are found to be elastically and dynamically stable,the high-temperature β phase is found to be elasticallystable but dynamically unstable below about 200 K, withimaginary frequencies for some optical modes. Using aself-consistent phonon approach we have shown that the softphonon modes are stabilized already below room temperature.The temperatures for the β → α′′ and β → ω transitionshave been calculated from the temperature dependence ofthe free energies, including the vibrational free energy andthe electronic entropy contributions. In agreement withexperiment, the lower transition temperature for the formation
054202-14
TEMPERATURE-INDUCED MARTENSITIC PHASE . . . PHYSICAL REVIEW B 84, 054202 (2011)
of the ω phase shows that it can be formed only as a metastablephase.
We have shown that the chemical decoration of the basiclattices is essential for achieving elastic and dynamic stabilityof the β phase. While a D03-type superstructure of the bcclattice (and many other possible chemical decorations) leadsto an elastic instability and soft optical and acoustic modeswhich cannot be stabilized by anharmonic phonon-phononinteractions, the optimized G1 structure is stable against sheardeformations and the soft optical modes are stabilized alreadyat moderate temperature. The necessity to create an ordereddistribution of the Ti and Nb atoms on the bcc lattice also hassignificant consequences for the phase transformations. Boththe α′′ and ω structures can be created by a continuous defor-mation of the bcc lattice. However, whereas the deformationof the G1 structure leads to a stable ω structure, the transitionto the α′′ structure also has to involve a change in the chemicaldecoration—which is possible at elevated temperature, butnot in quenched samples. This provides a rationale for theobserved competition between the formation of ω and α′′precipitates.
Our study has been motivated by the recent interestin gum-metal alloys, which differ from the binary Ti3Nballoy by the presence of small additions of other elements(Zr, Ta) and doping with a small amount of oxygen whilemaintaining the same electron/atom ratio. We think that themain conclusion of our work—the stabilization of the β
phase by anharmonic phonon-phonon interactions—appliesalso to gum-metal alloys. However, the presence of ternaryor quaternary additions might present a major obstacle to achange in site occupation and hence hinder the formation of achemically optimized α′′ phase.
Characteristic properties of gum-metal alloys include,besides their low shear moduli, their low ideal tensile andshear strengths. Current work is devoted to simulations ofthe response of β-phase Ti3Nb alloys with the G1 structureto tensile and shear loading. Preliminary results show valuesof the ideal strengths close to experiment but very unusualstress-strain relations. More details will be reported verysoon.
ACKNOWLEDGMENTS
We thank Dr. P. Souvatzis for making the SCAILD packageavailable to us. Work at the Universitat Wien was supported bythe Austrian Science Fund (FWF) within the Special ResearchProgram ViCoM (Vienna Computational Materials Labora-tory, F41), through the VASP project, and in cooperation withthe Toyota Central Research and Development Laboratory. Thecalculations were done at the facilities of the Vienna ScientificCluster.
APPENDIX
The SCAILD method is based on the calculation ofHellmann-Feynman forces acting on atoms at locations dis-placed from their positions in an idealized lattice due tolattice vibrations (phonons). All phonons with wave vectorsq commensurate with the supercell used for the calculationsare excited and contribute to the displacements of the atoms
from their equilibrium positions in a static lattice R + bj to newpositions R + bj + URj , where the displacements are givenby
URj = 1√N
∑qs
Ajqsε
jqs expiq(R+bj ) . (A1)
Here R represents the N Bravais lattice sites of the supercell,bj the position of atom j relative to its site, and ε
jqs are the
phonon eigenvectors corresponding to the phonon mode qs.The amplitudes A
jqs of all phonon modes can be calculated
in a harmonic approximation from the phonon frequenciesωqs as
Ajqs = ±
√h
2Mjωqs
coth
(hωqs
2kBT
), (A2)
where T is the temperature of the system and Mj the massof atom j . The phonon frequencies ωqs appearing in thisexpression can be obtained from the Fourier transform Fj
qof the force constants acting on the atoms in the supercell by
ωqs =√√√√−
∑j
εjqsF
jq
AjqsMj
. (A3)
In the SCAILD scheme the equations are solved first bycalculating a starting guess for the phonon dispersion relationsby means of a standard supercell calculation using the direct-displacement method implemented in VASP.65 The phononfrequencies corresponding to q vectors commensurate with thesupercell are then used to calculate the atomic displacementsusing Eqs. (A1), (A2), and (A3). The forces induced by thedisplacements URj are calculated using the VASP code. Fromthe Fourier transform of the new force constants, a set ofimproved phonon frequencies is calculated using Eq. (A3).The mean value of the phonon frequencies calculated in allprevious iterations provides a new set of frequencies:
ωqs(Ni) = 1√Ni
√√√√ Ni∑i=1
2qs(i), (A4)
where qs(i) are the frequencies from previous iterations.These steps are repeated until convergence is reached (hencethe name “self-consistent phonon method”). In our calcula-tions, about 100 iterations were necessary to obtain convergedphonon frequencies, which makes SCAILD calculationsconsiderably more expensive than usual direct-displacementor density-functional perturbation calculations of harmonicphonon frequencies. Anharmonicities associated with thermalexpansion of the lattice are not included in the SCAILD schemebut might be taken into account by performing SCAILDcalculations at several different volumes.
054202-15

PETR LAZAR et al. PHYSICAL REVIEW B 84, 054202 (2011)
*[email protected]. A. Luke, R. Taggart, and D. H. Polonis, Trans. ASM 57, 142(1964).
2E. W. Collings, The Physical Metallurgy of Titanium Alloys(American Society for Metals, Metals Park, OH, 1984).
3D. L. Moffat and D. C. Larbalestier, Metall. Trans. A 19, 1677(1988); 19, 1687 (1988).
4C. Baker, Met. Sci. J. 5, 92 (1971).5S. K. Sikka, Y. K. Vohra, and R. Chidabaram, Prog. Mater. Sci. 27,245 (1982).
6S. Hanada and O. Izumi, Metall. Trans. A 17, 1409 (1986).7T. W. Duerig, J. Albrecht, D. Richter, and P. Fischer, Acta Metall.30, 2161 (1982).
8B. A. Hatt and V. R. Rivlin, J. Phys. D: Appl. Phys. 1, 1145(1968).
9H. Y. Kim, S. Hashimoto, J. I. Kim, H. Hosoda, and S. Miyazaki,Mater. Trans. 45, 2443 (2004).
10H. Y. Kim, Y. Ikehara, J. I. Kim, H. Hosoda, and S. Miyazaki, ActaMater. 54, 2419 (2006).
11H. Hosoda, Y. Fukui, T. Inamura, K. Wakashima, S. Miyazaki, andK. Inoue, Mater. Sci. Forum 425-432, 3121 (2003).
12H. Matsumoto, S. Watanabe, and S. Hanada, Mater. Trans. 46, 1070(2005).
13P. J. S. Buenconsejo, H. Y. Kim, and S. Miyazaki, Acta Mater. 57,2509 (2009).
14T. Grosdidier and M. J. Philippe, Mater. Sci. Eng. A 291, 218(2000).
15M. Tane, S. Akita, T. Nakano, K. Hagiharam, Y. Umakoshi,M. Niinomi, and H. Nakajima, Acta Mater. 56, 2856(2008).
16T. Saito, T. Furuta, J. H. Hwang, S. Kuramoto, K. Nishino,N. Suzuki, R. Chen, A. Yamada, K. Ito, Y. Seno, T. Nonaka,H. Ikehata, N. Nagasako, C. Iwamoto, Y. Ikuhara, and T. Sakuma,Science 300, 464 (2003).
17H. Ikehata, N. Nagasako, T. Furuta, A. Fukumoto, K. Miwa, andT. Saito, Phys. Rev. B 70, 174113 (2004).
18T. Furuta, S. Kuramoto, H. H. Hwang, K. Nishino, and T. Saito,Mater. Trans. 46, 3001 (2005).
19S. Kuramoto, T. Furuta, J. H. Hwang, K. Nishino, and T. Saito,Metall. Mater. Trans. A 37, 657 (2006).
20M. Y. Gudkin, T. Ishizaki, S. Kuramoto, and I. A. Ovidko, ActaMater. 54, 2489 (2006).
21S. Kuramoto, T. Furuta, J. Hwang, K. Nishino, and T. Saito, Mater.Sci. Eng. A 442, 454 (2006).
22E. Withey, M. Jin, A. Minor, S. Kuramoto, D. C. Chrzan, and J. W.Morris, Mater. Sci. Eng. A 493, 26 (2008).
23N. Takesue, N. Shimizu, T. Yano, M. Hara, and S. Kuramoto,J. Cryst. Growth 311, 3319 (2009).
24J. W. Morris Jr., Y. Hanlumyang, M. Sherburne, E. Withey, D. C.Chrzan, S. Kuramoto, Y. Hayashi, and M. Hara, Acta Mater. 58,3271 (2010).
25E. A. Withey, A. M. Minor, D. C. Chrzan, J. W. Morris, andS. Kuramoto, Acta Mater. 58, 2652 (2010).
26R. J. Talling, R. J. Dashwood, M. Jackson, S. Kuramoto, andD. Dye, Scr. Mater. 59, 669 (2008).
27R. J. Talling, R. J. Dashwood, M. Jackson, and D. Dye, Scr. Mater.60, 1000 (2009).
28J. Sun, Q. Yao, H. Xing, and W. Y. Guo, J. Phys. Condens. Matter19, 486215 (2007).
29T. Li, J. W. Morris, N. Nagasako, S. Kuramoto, and D. C. Chrzan,Phys. Rev. Lett. 98, 105503 (2007).
30C. Zener, in Phase Stability in Metals and Alloys, edited by P. S.Rudman, J. Stringer, and R. I. Jaffee (McGraw-Hill, New York,1967), p. 25.
31G. Punz and J. Hafner, Z. Phys. B 65, 465 (1987).32E. G. Moroni, G. Grimvall, and T. Jarlborg, Phys. Rev. Lett. 76,
2758 (1996).33P. Souvatzis, O. Eriksson, M. I. Katsnelson, and S. P. Rudin, Phys.
Rev. Lett. 100, 095901 (2008).34M. Born, Festschrift der Akad. d. Wissenschaften zu Gottingen,
Math. Phys. Klasse (Berlin, Springer 1951).35T. R. Koehler, Phys. Rev. Lett. 17, 89 (1966); 18, 654 (1967).36Ph. F. Choquard, The Anharmonic Crystal (W. A. Benjamin, New
York, 1967).37W. Cochran and R. A. Cowley, Handbuch der Physik (Springer,
Berlin, 1967).38P. Souvatzis, D. Legut, O. Eriksson, and M. I. Katsnelson, Phys.
Rev. B 81, 092201 (2010).39F. E. Wang, S. J. Pickart, and H. A. Alperin, J. Appl. Phys. 43, 97
(1972).40S. Prokoshkin, A. Korotitskyi, V. Brailovski, S. Turenne,
I. Khmelevskaya, and I. Trubitsyna, Acta Mater. 52, 4479 (2004).41T. Waitz, D. Spisak, J. Hafner, and H. P. Karnthaler, Europhys. Lett.
71, 98 (2005).42X. Huang, G. Ackland, and K. Rabe, Nat. Mater. 2, 307 (2003).43M. X. Wagner and W. Windl, Acta Mater. 56, 6232 (2008).44N. Hatcher, O. Yu. Kontsevoi, and A. J. Freeman, Phys. Rev. B 80,
144203 (2009).45G. Kresse and J. Furthmuller, Comput. Mater. Sci. 6, 15
(1996).46G. Kresse and J. Furthmuller, Phys. Rev. B 54, 11169
(1996).47J. P. Perdew, J. A. Chevary, S. H. Vosko, K. A. Jackson, M. R.
Pederson, D. J. Singh, and C. Fiolhais, Phys. Rev. B 46, 6671(1992).
48P. E. Blochl, Phys. Rev. B 50, 17953 (1994).49G. Kresse and D. Joubert, Phys. Rev. B 59, 1758 (1999).50R. P. Feynman, Phys. Rev. 56, 340 (1939).51O. H. Nielsen and R. M. Martin, Phys. Rev. Lett. 50, 697 (1983).52T. Bucko, J. Hafner, and J. G. Angyan, J. Chem. Phys. 122, 124508
(2005).53S. Muller, J. Phys. Condens. Matter 15, R1429 (2003).54Y. LePage and P. Saxe, Phys. Rev. B 63, 174103 (2001).55H. J. Monkhorst and J. D. Pack, Phys. Rev. B 13, 5188 (1976).56P. E. Blochl, O. Jepsen, and O. K. Andersen, Phys. Rev. B 49, 16223
(1994).57M. Gajdos, K. Hummer, G. Kresse, J. Furthmuller, and F. Bechstedt,
Phys. Rev. B 73, 045112 (2006).58A. Togo, F. Oba, and I. Tanaka, Phys. Rev. B 78, 134106
(2008).59D. W. Taylor, Phys. Rev. 156, 1017 (1967).60S. de Gironcoli and S. Baroni, Phys. Rev. Lett. 69, 1959
(1992).61S. Ghosh, P. L. Leath, and M. H. Cohen, Phys. Rev. 66, 214206
(2002).62J. Hafner and G. Punz, Phys. Rev. B 30, 7336 (1984).63M. Fahnle and L. Schimmele, Z. Metallkd. 95, 864 (2004).64S. Dennler and J. Hafner, Phys. Rev. B 73, 174303 (2006).
054202-16
TEMPERATURE-INDUCED MARTENSITIC PHASE . . . PHYSICAL REVIEW B 84, 054202 (2011)
65G. Kresse, J. Furthmuller, and J. Hafner, Europhys. Lett. 32, 729(1995).
66D. Lerch, O. Wieckhorst, G. Hart, R. Forcade, and S. Muller,Modell. Simul. Mater. Sci. Eng. 17, 055003 (2009).
67C. Blaas-Schenner, M. Stohr, P. Lazar, R. Podloucky, J. Hafner,and R. Asahi (unpublished).
68D. Pattanayank, B. Obst, and U. Wolfsteig, Z. Metallkd. 72, 481(1981).
69K. S. Jepson, A. R. G. Brown, and J. A. Gray, The Science,Technology and Applications of Titanium, edited by R. I. Jaffeeand N. E. Promisel (Pergamon Press, Oxford, 1970), p. 677.
70J. P. Morniroli and M. Gantois, memoires Scientifiques de la Revuede Metallurgie 70, 831 (1973).
71M. Born and K. Huang, Dynamical Theory ofCrystal Lattices (Clarendon Press, Oxford, 1954),p. 141.
054202-17