temperature estimates of the planet mars, 1924 and 1926 - NIST Page
13
U. S. DEPARTMENT or COMMERCE NATIONAL BUREAU OF STANDARDS RESEARCH PAPER RP1458 Part of Journal of Research of the N.ational Bureau of Standards, Volume 28, March 1942 TEMPERATURE ESTIMATES OF THE PLANET MARS, 1924 AND 1926 By W. W. Coblentz ABSTRACT In earlier publica tions (8512 and 8553), data were given on the plan etary radi- ation emanating from different parts of the surface of Mars as measured with a thermocouple and filters. From these radiomet ric measur ements, planetary temperatures were calculated by fiv e m et hod s, using the tran smission data of the earth's atmosphere at 7 to 15 /1-. published by Fowle in the Smithsonian Physical Tables. In the meantime, based upon ob servations at Flagstaff, Arizona (ele- vation 7,250 ft) , Adel and Lampland have publi shed atmosph eric transmissions t hat appear to be somewhat differ ent from the Smithsonian measurements, in the spectral band extending from 7 to 15 /1-. 8ince the planetary-radiation measurements were made at Flagst .aff, the data obtained during the oppositions of Mars in 1924 a,nd in 1926 hav e been r ecalcu- la te d, using the atmospheric transmissions observed at that stat ion . In the present communication the fiv e methods and proc edures previously used, by three calculators, in deriving planetary temperatures are reviewed, and it is shown that in four of these methods of calculation, which employ the law of total radi at ion of a black body, there is but little difference in the planetary temper- at ur es deduced by using the transmission coefficients of the eart h's atmosphere published by these t wo sets of observers. This is owing to the fortuitous circum- stan ce that, while they differ in spectral outline, there is but littl e difference in the total areas encomp a ssed by these two t ransmission curves, and hence, in the cal- culated total amount of plan etary radiation transmitted by the earth's atmos- phere. Hence, no revision is made of the planetary temperatures previously deduc ed by the four methods involving the law of total radiation. On the other h an d, the fifth method, using the law of spectral radiation of a black body and the Flagstaff transmission coefficients of the atmosphere, gives planetary temperatures that are entirely diff erent from the values previously deduced by this method, and by the four other methods, by applying the Smith- sonian data. This incon sistency can be eliminated , at least in pa rt, and the data harmoniz ed by taking into consideration selective emission of the planetary surface. On the assumption that the surface of Mars, like that of the earth, is composed of silicates (feldspar, mica, silica, etc.) which hav e a high selective emission at 8 to 10 /1-, the temperatures derived from the sp ectral components of planetary radiation of Mars, measured in 1926, are in good agreement with the values calcu- lated by other methods that are less affe cted by sel ective spectral emission. From this it would appear that, assuming that the temperatures deduc ed by the other m ethods of calculation are indicative of met eorological conditions at the time of making the observations, the fluorite-filter method of analysis may be a useful means of securing information on the selective sp ect ral emission of the planetary surface. In a supplementary note a new thermocoupl e, made of bismu th and Chromel-P wires, suitable for planetary radiometry is described. 297
Transcript of temperature estimates of the planet mars, 1924 and 1926 - NIST Page
U. S. DEPARTMENT or COMMERCE NATIONAL BUREAU OF STANDARDS
RESEARCH PAPER RP1458
Part of Journal of Research of the N.ational Bureau of Standards, Volume 28, March 1942
TEMPERATURE ESTIMATES OF THE PLANET MARS, 1924 AND 1926
By W. W. Coblentz
ABSTRACT
In earlier publicat ions (8512 and 8553), data were given on the planetary radiation emanating from different parts of the surface of Mars as measured with a thermocouple and filters. From these radiometric measurements, planetary temperatures were calculated by fiv e methods, using the transmission data of the earth's atmosphere at 7 to 15 /1-. published by Fowle in the Smithsonian Physical Tables. In the meantime, based upon observations at Flagstaff, Arizona (elevation 7,250 ft) , Adel and Lampland have published atmospheric transmissions that appear to be som ewhat different from the Smithsonian measurements, in the spectral band extending from 7 to 15 /1-.
8ince the planetary-radiation measurements were made at Flagst.aff, the data obtained during the oppositions of Mars in 1924 a,nd in 1926 have been recalculated, using t he atmospheric transmissions observed at that station . In the present communication the five methods and procedures previously used , by three calculators, in deriving planetary temperatures are reviewed , and it is shown that in four of these methods of calculation, which employ the law of total radiation of a black body, t here is but little difference in the planetary temperatures deduced by using the transmission coefficients of the earth's atmosphere published by these t wo sets of observers. This is owing to the fortuitous circumstance that, while they differ in spectral outline, there is but little difference in t he total areas encompassed by these two t ransmission curves, and hence, in t he calculated total amount of planetary radiation transmitted by the earth's atmosphere. Hence, no revision is made of the planetary temperatures previously deduced by the four methods involving the law of total radiation.
On the other hand, t he fifth method, using the law of spectral radiation of a black body and the Flagstaff transmission coefficients of the atmosphere, gives planetary temperatures that are enti rely different from the values previously deduced by this method, and by the four other methods, by applying the Smithsonian data. This inconsistency can be eliminated, at least in part, and the data harmonized by taking into consideration selective emission of the planetary surface.
On the assumption that the surface of Mars, like that of the earth, is composed of silicates (feldspar, mica, silica, etc.) which have a high selective emission at 8 to 10 /1-, the temperatures derived from the spectral components of planetary radiation of Mars, measured in 1926, are in good agreement with the values calculated by other methods that are less affected by selective spectral emission. From this it would appear that, assuming that the temperatures deduced by the other methods of calculation are indicative of meteorological conditions at the time of making the observations, the fluorite-filter method of analysis may be a useful means of securing information on the selective spectral emission of th e planetary surface.
In a supplementary note a new thermocouple, made of bismu th and Chromel-P wires, suitable for planetary radiometry is described.
297
298 Journal of Resea'J'clt of tlte National Bureau of Standards
CONTENTS Page
I. IntroductioD ____________________________________________________ 298 II. Estimates of temperatures on the planet Mars ___ ________ _________ __ 299
1. Infrared transmission of the earth's atmosphere _______________ 299 2. Planetary temperatures derived from the law of total radiation
of a black body ___________ ______________ ________________ 300 3. Planetary temperatures derived from a comparison with the moon _____ ____________________ ___ ______________________ 302
4. Planetary temperatures derived from spectral-radiation com-ponents ________________________________ __ ______________ 302 III. References and notes ____________________________________________ 308 IV. Appendix. Thermocouples for planetary radiometry _______ ___ __ ____ 308
1. INTRODUCTION
In a previous paper [1]1 the writer summarized estimates of the temperature of the surface of Mars, based upon radiometric measurements with filters, including a plate of fluorite 2.7 mm in thickness, which give an integrated spectrum analysis of the band of planetary radiation, of wavelengths extending from about 7 to 15 J.!, that is freely transmitted by the earth's atmosphere.
In the absence of a spectroradiometric analysis of the energy distribution of radiation from the planet, transmitted by the earth's atmosphere, the fluorite filter is especially useful in separating this band of radiation into two components (A, extending from about 7 to 12.5 J.!; and B, extending from about 12.5 to 15 J.!)' the ratio of which gives some indication of the selective emission of the planetary surface [1, p. 379].
In the previous calculations of planetary temperatures the transmission coefficients of the earth's atmosphere, observed by Fowle [7] and published in the Smithsonian Physical Tables, were used. The temperatures derived from a comparison of the observed and the calculated ratios of the spectral components, A : B, were of the same magnitude as those obtained by several other methods of calculation. In other words, the fluorite-filter analysis gave no definite indication of the selective emission that is to be expected to obtain on a planet having a surface (presumably composed of silica, silicates, and perhaps sulfates) similar to that of the earth [1, p. 379].
Moreover, since all the methods of analysis indicated that the temperature of the dark areas of Mars, under a noonday sun, rises considerably above the freezing point of water (in agreement with visual observations), the tendency seemed to be to consider the question solved. However, this question is reopened by the publication of atmospheric-transmission data, by Adel and Lampland [4], indicating a higher transmission at 8 to 9 J.L and a lower tra,nsmission at 13 to 14 J.! than that given in the Smithsonian Physical Tables. The implications of the effect this shift in spectral transmissions would have on the ratios of the components, A: B, were at once apparent to the writer and were verified by calculations, which showed that the planetary temperatures derived by using the atmospheric transmissions published by Adel and Lampland [4] were from 50° C (1926) to more than 100° C (1924) lower than those derived by using Fowle's data and that the resultant discrepancy with the temperatures derived by several other methods of calculation (at least of the 1926 observa-
I Figures in brackets indicate tbe literature references and notes at the end of this paper.

Planetary Temperature 299
tions) can be eliminated by taking into consideration the selective emission of the sUTface of Mars.
Evidently the fluorite-filter method of analysis of the spectral components of planetary radiation requires a more accurate knowledge of the transmission coefficients of the earth's atmosphere at 8 to 15 p, than is required in making the calculations by using the law of total radiation of a black body [1, p. 379].
Since there is good agreement in the Martian temperatures, deduced by foUT methods of calculation, using the Smithsonian and the Lowell transmission coefficients of the earth's atmosphere and the law of total radjation of a black body, it seems permissible to assume that these values are indicative of temperature conditions on the planetary sUTface at the time of making the radiometric meaSUTements. Hence, as outlined in the present paper, using the spectral components, A: B, of the planetary radiation at 8 to 15 p" measUTed with the fluorite filter, by trial calculation an estimate is obtained of the selective spectral emission of the planetary surface that is required in order to deduce planetary temperatUTes in agreement with the values obtained by the four other methods, which are less sensitive to terrestrial and planetary meteorological conditions. From this it would appear that, with accurate transmission coefficients of the earth's atmosphere, the fluorite~filter method of analysis may provide important information of the selective emission of a planetary surface.
II. ESTIMATES OF TEMPERATURES ON THE PLANET MARS
In the present paper the various methods previously employed in deriving planetary temperatures from radiometric meaSUTements on Mars and on the moon [1, 2,3] are reviewed, and the temperatures are revised when the calculations are affected by the Flagstaff transmission coefficients of the earth's atmosphere [4].
1. INFRARED TRANSMISSION OF THE EARTH'S ATMOSPHERE
At the outset of this discussion it is relevant to consider the spectral transmission of the earth's atmosphere. In this connection it is interesting to note that the earliest measurements by Langley [5] show deep absorption bands in the far infrared. Translated from spectrometer circle-readings to wavelengths, by Very [6], the wide band of high atmospheric transparency at 7.5 to 15 p, shows a strong narrow absorption band at 9.6 p, (now identified with ozone) and weaker absorption bands at 10.9, 11.6, 12.4, 13.4, 14.3 and 15.7 p" respectively, which are very similar to the most recent observations of Adel and Lampland [4], illustrated in figure 1. This raises the interesting question of the conditions under which Fowle [7] observed a greater absorption in the band at about 10.3 p, than at 9.6 p,. He reports that the band at 10.3 p, (which he sUTmised might be caused by ozone) systematically deepens with increasing air mass; and, in using the tabulated data given in the Physical Tables, he recommends multiplication of the values at 9.5 and 10.5 p, by 0.90 and 0.70, respectively, for one air mass, and 0.85 and 0.65 for two air masses, to allow for ozone absorption when the radiation comes from a celestial body. This has been the common practice in calculating planetary temperatUTes.

300 Jou1'nal of Research of the National Bureau of Standards
In figure 1 are shown the atmospheric-transmission curves, A and B, (but free from small indentations) for respectively 0.5 and 1.0 em of precipitable water, observed by Adel and Lampland [4] i and similar curves, A' and E', as deduced from the Smithsonian Physical Tables [7] and used by the writer in previous calculations of Martian temperatures. Recalling the observations of Angstrom [8], that the selective absorption of a gas (e. g., CO2), is dependent upon the total pressure, and recalling also that most of Fowle's measurements were made at lower elevations, and through larger amounts (1 to 3 em) of precipitable water, than at Flagstaff, Ariz., it is an interesting question
100.---r---~--~--~--~--~--~--~--~
90
80 /,
" " ~ 70 " z I, w
U B /1 a: 60 A-
w A!J tB' a. I, z 50 ! ,
I I z I I Q 40 I I I/') I/') I I ~ 30 I I I/') I , Z I « / 0:: 20 .... ,
I
10 I /
/
~,
"",~,
"
A=0.5 eM H~O B=I.OCM
, 1\ . \\ , \ \ \ \ \ \
\ \ \ \ \ \ \
15).4 FIGURE l.- Tmnsmission of the earth's atmosphere containing respectively 0.5 cm
and 1.0 cm of precipitable water.
06 7 8 9 10 11 12 13
A and B, Flagstaff data; A' and B', Smithsonian data.
whether this difference in outline of the band of high atmospheric transparency at 7 to 15 fJ. , noted in these two sets of observations (see fig. 1), is partly attributable to the physical state of water vapor as affected (if at all) by barometric pressure. By shifting Fowle's transmission curve about 0.7 fJ. to the shorter wavelengths, the two sets of data are in as good agreement as can be expected, and they are in good agreement witl l the ell dier measurements of Langley [5] and Very [6] .
2. PLANETARY TEMPERATURES DERIVED FROM THE LAW OF TOT AL RADIATION OF A BLACK BODY
Although there appears to be an appreciable difference in the outline of the I1tmospberic-transmission curves of Adel and Lampland [4]

Planetary Temperature 301
and of Fowle [7] for the same amount of precipitable water (curves A and A' in fig. 1) , the total area included under these two Clll'ves happens to be closely the same.
This is shown also in figure 2, which gives the spectral-energy distribution of a black body at 0°0, as it would be observed after transmission through the atmosphere containing 0.5 cm of precipitable water, based upon the transmission data of Adel and Lampland (curve A) and upon the data published by Fowle (curve A'). Integration of these two curves shows only a small difference in area, amounting to (Fowle minus Adel and Lampland) +2.6 percent at -23°0, +1.1 percent at 0°0, and -2.2 percent at 100°0; or the equivalent of + 2°, +0.7°, and -4.6°0, respectively, at these three temperatures. From this it appears that a recalculation of the measurements, using the atmospheric-transmission data of Adel and Lampland and the total radiation of a black body, would decrease the previously pub-
E
40
20
10
7 8 9 10
cfc 0.5 CM H"O
... , ... ... "'-
1 1 12 13
, \ \ \ \ \ \ \ \
\
14 15f!
FIGURE 2.- Method of calculating the spectral-component radiation (A and B ) and estimating planetary temperatures.
Upper curve, distribution of radiation of a black body at O°C, outside the earth's atmosphere; cur ve A, same. after transmission through the 0.5 em of precipitable water (Flagstaff data) and II' (Smithsonian data); curves F and F', same as A and A' after transmission throngh the flnorite filter.
lished estimated planetary temperatures by 4° to 5°0 at 100°0 and increase the temperatures by 2°0 at -20°0, with practically no chango in the values at 12° to 16°0.
Owing to uncertainties in other factors, e. g., "spottedness" of the planetary surface, that enter into the computations, two persons (see [3], table 5, O. O. L. and D. H. M.) making these calculations, using the same observed water-cell transmissions and presumably the same (Smithsonian) atmospheric-transmission data, derived planetary temperatures differing by 1° to 18°.
In view of the foregoing analysis, in the present paper no revision seems to be required of the temperature estimates previously derived from the observed water-cell transmission of planetary radiation and the law of total radiation of a black body.
Reduction of the temperatures, by 5° to 10°, as deduced by the total-radiation method, using the Flagstaff transmission data, would introduce no inconsistencies with other data. In fact, since the true temperature of the planetary surface must be considerably higher
302 Journal of Researcl~ of the National Bureau of Standa1'ds
than the calculated black-body temperature, a reduction in the previously calculated values (which seem higb) would leave the data practically in terms of true temperatures.
3. PLANETARY TEMPERATURES DERIVED FROM A COMPARISON WITH THE MOON
Based on the foregoing analysis, the temperatures of the moon, calculated by Menzel [9], using the water-cell transmissions of Coblentz and Lampland [3], should be lowered by perhaps 3° to 5° C. This will have but little effect upon the Martian temperatures (see [3], table 5, column 3), which are high when calculated by this method. Another method of estimating Martian temperatures, used by the writer, [3] was by plotting the observed lunar spectral-radiation components, A: B, (obtained with the fluorite filter) against Very's [10] observed temperatures at different ages of the moon, and extrapolating to the observed ratios, A: B, observed on Mars. These are true temperatures, and, hence, higher than the calculated "black body" temperatures. In the present investigation, this method of attack was reviewed, I:1nd it was found that the lunar temperatures derived from the ratio of the components, A: B, averaged about 5° C higher than the values given in reference [1], table 2, column A: B. Evidently no revision of Martian temperatures derived by this method is indicated. However, since all these temperatures appear to be unusuallv high, q,nd since more recent work indicates somewhat lower lunar temperatures than those observed by Very (who compared the lunar radiation with that of a terrestrial source), this method of analysis of temperature conditions on Mars is not stressed as being crucial.
4. PLANETARY TEMPERATURES DERIVED FROM SPECTRAL-RADIATION COMPONENTS
As fully explained in the previous publications [1 , 2, 3], this method of observation consists in separating the planetary radiation of wavelengths 7 to 15 J1, into two parts, by means of transmission screens of thin glass and of fluorite, giving spectral-radiation components, A and B, of wavelengths 7 to 12.5 JJ., and 12.5 to 15 JJ., respectively. Unfortunately the spectrum cutoff is not sharp, especially with the fluorite filter, which is the most crucial part of the measurement. Other weak points in the method are the uncertainty of the correction for losses by reflection in the filters, and, especially, the uncertainty of the transmission coefficients of the air, and the size of the absorption band of ozone at 9.6 JJ., which falls in the region of high absorption of the fluorite filter [1, p. 379].
In order to translate the observed components, A and B, into temperatures, in the past it was assumed that the spectral radiation from the planetary surface is nonselective (black body); and radiation components were computed for several temperatures (200°, 250°, 273°, 300°, and 373° K) by multiplying the respective spectralenergy curves by the atmospheric transmissions for, say, 0.5 cm of precipitable water. This gives energy curves, A (Flagstaff) and A' (Smithsonian transmission data), depicted in figure 2, representing the spectral distribution of planetary radiation incident at the observing station.
These spectral intensities are then multiplied by the spectral transmissions (transmittances; see [3] table 3) of the fluorite filter,

Planetary Temperat~tre 303
giving the curves F and F' in figure 2. Integration of these curves gives the components of planetary radiation extending from 7 to 12.5 J1. (=A) and 12.5 to 15 J1. (=B), respectively. Using the Smithsonian atmospheric-transmission data for 0.5 cm of precipitable water gives calculated ratios of A: B, ranging from 42.5 percent at -23 0 C (250 0 K) to 64 percent at 1000 C (curve 8 in fig. 3). The corresponding values obtained by using the data published by Adcl and Lampland give ratios ranging from 53 percent at -23 0 C to 77 percent at 100 0 C (curve F in fig. 3). For 1 cm of precipitable water the ratios calculated from the Smithsonian data decrease O'!'eatly in magnitude (37 percent at -23 0 C, and 54 percent at 1000 en, whereas the ratios calculated from the Flagstaff data remain practICally unchanged (54 percent at -23 0 C and 78 percent at 1000 C).
+Iscfc
+Iocf
+50"
_ SOD
-roet
20 30 40 50 60 70 FIGURE 3.-7'emperat1tre calibration curves.
Calculated ratio of spectral compouen ts, A: E, (see fig. 2) for different black·body temperatu res, using the Smithsonian (S) and the Flagstaff (P) atmospheric transmissions; also selective emission on Ma rs (0).
In figure 3 are plotted the calculated ratios (A: B) of the components of planetary radiation transmitted through 0.5 and 1.0 cm of precipitable water, based upon the Smithsonian (8) and the Flagstaff.(F) data on atmospheric transmission. From these graphs it appears that since the observed ratios of the components of the radiation from Mars range from about A: B=41 to 56 in 1924, and A: B =50 to 62 in 1926, the corresponding temperatures deduced from the Flagstaff data are generally far below zero, which is contrary to visual observation and contrary to all other methods of calculation.
Accepting the adequacy of the filter method of spectral analysis and the correctness of the atmospheric transmissions, the explanation is to be sought in the spectral emission from the surface of Mars. The most obvious way to decrease the magnitudes of these ratios is to reduce the emission in the region of 8 to 10 jJ.. The only gases having strong selective absorption in this region of the spectrum are S02,
440573-42-5
304 Journal of Research of the National Bureau of Standards
with strong absorption bands at 7.4 and 8.8 J.I, respectively, and NH3,
which has a wide band of strong absorption extending from 8.5 to 11 J.I [11].
Discounting gaseous absorption, there remains the practical certainty of selective emission from the solid surface of Mars. This problem was discussed in previous papers [12] in connection with the observations on the selective reflection of minerals, and the bearing of such data on the question of the temperature of the moon. It was then deduced that in the band of planetary radiation at 7 to 15 J.I, freely transmitted by the earth's atmosphere, the amount of solar radiation selectively reflected by carbonates, silicates, and sulfates (which have bands of selective reflection in this region of the spectrum) is relatively small; and that the emission of planetary radiation is suppressed in the bands of selective reflection, which is especially strong at 8 to 10 J.I, in silicates.
:J J 20
10
0 7 8 9 10 " 12 13 14P.
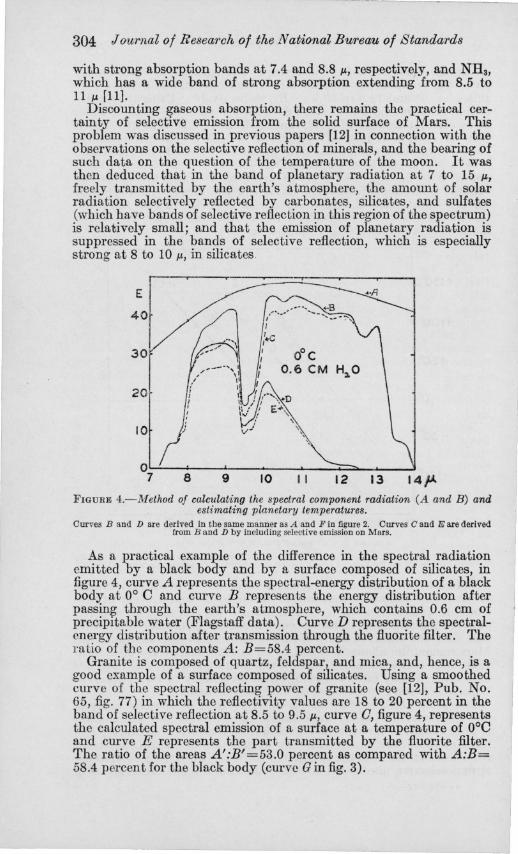
FIGURE 4.-Method of calculating the spectral component radiation (A and B) and estimating planetary temperature8.
Curves Band D are derived in the same manner as A and F in figure 2. Curves C and E are derived Crom Band D by inclnding selective emission on Mars.
As a practical example of the difference in the spectral radiation emitted by a black body and by a surface composed of silicates, in figure 4, curve A represents the spectral-energy distribution of a black body at 0° 0 and curve B represents the energy distribution after passing through the earth's atmosphere, which contains 0.6 em of precipitable water (Flagstaff data). Ourve D represents the spectralenergy distribution after transmission through the fluorite filter. The ratio of the components A: B=58.4 percent.
Granite is composed of quartz, feldspar, and mica, and, hence, is a good example of a surface composed of silicates. Using a smoothed curve of the spectral reflecting power of granite (see [12], Pub. No. 65, fig. 77) in which the reflectivity values are 18 to 20 percent in the band of selective reflection at 8.5 to 9.5 J.I, curve 0, figure 4, represents the calculated spectral emission of a surface at a temperature of 0°0 and curve E represents the part transmitted by the fluorite filter. The ratio of the areas A':B'=53.0 percent as compared with A:B= 58.4 percent for the black body (curve G in fig. 3).

Planetary T emperatu1'e 305
Granite was used in these calculations because spectral-reflectivity data are available and because it is a composite of the minerals considered. From an investigation rI3] of the diffuse reflecting power of feldspar, sandstone, slate, etc., which show a high reflectivity at 8.8 p"
the use of the spectral emissivities (I-reflectivity) of granite seems justified. Of course it is not to be inferred that the surface of Mars is solid granite.
For further data on selective reflection and selective emission, particularly in connection with the radiation from the moon, reference is made to Carnegie Institution Pub. No. 65, page 113, figure 99, and Pub. No . 97, page 143, figures 102 and 103, reference [12].
In the absence of recent observations on the spectral emission from the moon, it is relevant to add some calculations the writer has made on the components of the lunar radiation (the average curve, plate 7, reference [5]) published by Langley. The ratio of A:B=118 is unusually high, indicating lunar surface temperatures up to 150° C. Part of this radiation may be selectively reflected sunlight and perhaps diffuse light in the spectrobolometer. Nevertheless, the evidence seems in favor of high selective emission on the lunar surface. A similarly high selective emission may be expected from the surface of Mars.
In view of the foregoing considerations, and the fact that the radiometric observations on Mars were made at Flagstaff, Arizona (elevation 7,250 ft.), the WI'iter has recalculated the temperatures derived from the ratios of the spectral components, A:B, using (1) a nonselective (black body) emission, and (2) a selective emission (silicates), as shown in figure 4 and (cUl"ve G) in figure 3.
As shown in tables 1 and 2, the black-body temperatures derived from the Flagstaff atmospheric-transmission data are much lower than the corresponding values previously derived by means of the Smithsonian data. In these same tables (in columns marked "Selective Emission") the con-esponding temperatures are deduced on the assumption of selective emission from silicates. The latter are true temperatures, and for the opposition of 1924 average about 25° C higher. For the opposition of 1926 the temperatures average about 23° C higher than the calculated black-body temperatures. This is as it should be, but whether the magnitude is as grea.t as indicated is unknown.
In the previous papers [1, 2, 3] it was conjectured that the "true temperatures" might be 10° C higher than the "black-body" temperatures. Since there probably is but little "blanketing effect" of the Martian atmosphere (there was more cloudiness in 1926 than in 1924), and since vegetation as we know it has a high nonselect.ive emission, the temperature rise of the Martian surface, under prolonged illuminat.ion, is a mere conjecture. Owing to seasonal conditions (late summer in 1926, and early summer in 1924) in the Southern hemisphere, the higher temperatures observed in 1926 are consistent with expectations. The average temperature (table 2) of the apparent center of the disk of Mars, as deduced by the fluorite-filter analysis and selective emission on Mars during the opposition of 1926, is about +15° C,inharmony with other methods of analysis. It is to be noted that on 40 percent of the observing nights the temperatures derived from fluorite-filter measurements are below 0° C. However, a study of the observations of 1926, made on other parts of the planetary disk,

306 Jmtrnal of Research of the National Bureau of Standards
:.tnd of the "remarks" concerning the visual physical conditions, given in table 2 of the previous paper [3], indicate that the cloudy conditions and "poor seeing," visible through il greater air mass on the limbs of the planet, may have extended to the center of the disk in sufficient amount to be perceptible radiometrically. In the previous paper, more cloudiness was noted on Mars in 1926 than in 1924. This cloudiness should raise the surface temperature, a well-recognized terrestrial phenomenon.
Examination of tables 1 and 2 shows that during the opposition of Mars in 1924 the water-cell transmissions (W. C. T.'s) were higher, and the ratios of the spectral components (A:B) were lower, than during the opposition of 1926. This may be owing to two causes:
TABLE l.-Temperature estimates of Mars, 1924
[Comparison of temperatures on the apparent centcr of the disk, assuming (1) black·body spectral emission and (2) selective spectral emission, on Mars; and using (I) the Smithsonian and (2) t.he Flagstaff transmission coefficients of the earth's atmosphere. 1.0 em of precipitable water. Declination of IvIars.-17°3S'; brightness,I00]
Temperatures ----------
Water- Spectral Method of calculation Date: cell trans- compo- Region on Mars 1924 mission, nents, Black body W.C.T. A.B
------ Selective emission,
Smith- Flagstaff Flagstaff sODian
------------- ---- --° C ° C ° C
Aug. 6 33.5 41. 7 +12 -83 -58 Syrtis Major. 14 30. S 41. 3 + 10 -85 -60 Mare Sirenum. IS 32.4 43. 1 + 21 -75 -52 Mare Sirenum on meridian. 18 31.1 38.6 -5 -102 -75 Mare Siren urn. 21 32.5 40.7 +6 -90 -65 Mare Sirenum on meridian. 21 34.9 39.1 -3 -98 -73 Bright region north of Mare Siren urn. 23 32.8 36.6 -20 -110 -85 no. 25 33.7 38.3 -8 -102 -77 Bright region north of Beak of Sirens. 28 31.2 50.0 + 65 -40 -16 Solis Lacus; poor seeing.
Sept. 11 30.8 47.8 +45 -51 -26 Syrtis Major on meridian. 13 29.6 39.3 -2 -95 -70 Syrtis Major on east limb. 13 25.1 55.8 100 -12 + 15 Syrtis Major. 18.4-loot focus; receiver 0.35
diameter of disk. 14 29.3 46. 4 HO -50 -35 Mare Clmmerium; receiver 0.35 diameter
of disk.
(a) the much greater amount of water vapor traversed by the planetary radiation in 1924; and (b) higher temperatme conditions on the surface of Mars during the opposition of 1926.
The apparent declinations of Mars, at these two oppositions, were -17°35' and +14°37', respectively-a total difference of 32°. Hence, the amount of terrestrial atmospheric water vapor traversed by tllfl radiation from Mars was much greater during the opposition of 1924. Therefore the water-cell transmissions should be higher and the ratio of the spectral components should be lower, in 1924, as observed.
On the other hand, recalling the effect of clouds upon terrestrial temperatures, with much greater cloudiness on :Mars in 1926, as already noted the surface temperatures should be higher than in 1924, as deduced from all the radiometric measurements. In this connection it is to be noted that owing to differences in (a) solar distance, (b) inclination of the planetary surface exposed to the sun (seasonal differences), and (c) the size of the areas intercepted by the receivers,

Planetary Temperature 307
and (d) owing to the impracticability of measuring the radiation emanating from identical areas, close agreement in the temperature estimates of Mars, at the two oppositions, should not be expected.
The average temperature of the center of the planetary disk of Mars, during the opposition of 1924, is far below 0° C, indicating that an assumed selective emission does not completely account for the discrepancy in the temperatures derived by the fluorite-filter method of analysis of the spectral components of planetary radiation. This seems to be owing, partly at least, to the low declination of Mars in 1924 and to the resultant greater uncertainty of the amount of water vapor traversed by the planetary radiation. Slight changes in the amount of atmospheric water vapor apparently have a relatively
TABLE 2.-Temperatu.re estimates of Mars, 1926
[Comparison of temperatnres on the apparent ccnter of the disk, assuming (1) black·body spectral emission and (2) selective spcctral emission on Mars; and using (I) the Smithsonian and (2) the Flagstaff trans· mission coefficients 0( tbe earth 's atmosphere. 0.5 cm of precipitable water. Declination of Mars: +14°37'; brightness, 60.J
-Observed- Temperatures
Method of calculation Date: Water· Spectral Remarks 1926 cell
trans· compo· Black body mission, nents, Selective W.C.T. A:B emission,
Smith· Flagstaff Flagstaff soniaD
------._ -----------°C °C ° C
Oct. 11 27.9 58. 3 55 3 27 18.4·foot focus, receiver-0.45 diameter 0
12 21.8 66.5 105 45 70 planetary image.
53.a·foot focus, receiver=0.16 diameter 0 image of Mars. Mare Clmmerium on ccnter of disk.
14 27 . . 1 56.3 45 -.1 17 Do. 21 25. 5 61. 7 75 22 47 8(}'loot focus, receiver = O. 11 diameter 0
disk. Solis Locus central. 25 24. 0 52.5 25 -27 -2 Do. 27 25. 5 51. 0 16 -33 - 10 Do. 28 26.4 50. a 12 - 37 - 13 ])0.
Nov . 1 30.5 56.3 45 -6 17 53.a·loot focus. receiver intercepts 0.10 oithe diameter.
2 28. 9 57. 2 50 -2 22 Do. 4 27.4 52.7 25 -~, -I Do. 5 28.3 51. 3 17 -33 -10 Do.
greater effect upon the transparency at 6 to 8 JL than at 13 to 14 JL. The fluorite-filter method of spectral analysis is very sensitive to slight changes in the spectral transmission of the earth's atmosphere. Hence, owing to the uncertainties of the transmission coefficients at the time of the observations, the fluorite-filter method is evidently too sensitive to deduce planetary temperatures from measurements of the components of the radiation emitted by celestial objects, in the spectral band at 7 to 12 JL (which is deeply indented by the absorption band of ozone), at 9.6 JL, in the earth's atmosphere. On the other hand, by proceeding as above outlined, this method of analysis appears to be a useful means of securing information on the selective spectral emission of the planetary surface.
The foregoing calculations were made with the expectation of making a further investigation of the planetary radiation of Mars during the opposition of 1941, using the filters and some of the other apparatus left at the Lowell Observatory. As it was not possible to continue the work, these calculations are now published, thus bringing

308 Journal of Research of the National Bureau of Standards
to a close an interesting investigation of instruments and methods of planetary radiometry,2 made, during the past 20 years, in cooperation with the Lowell Observatory. Obviously, what is needed is a spectroradiometric analysis of tile planetary radiation from Mars and from the moon. This should be feasible with the large reflecting telescopes now under construction and with further improvements in spectroradiometl'Y·
III. REFERENCES AND NOTES
(1) W. W. Coblent z, Temperature estimates of the planet Mars, BS Sci. Pap. 20, 371 (1925) S512.
(2) W. W. Coblentz and C. O. Lampland, Some measurements of the spectral components of planetary radiation and planetary temperatures, J. Franklin Inst. 199, 785; 200, 103 (1925).
[3] W. W. Coblentz and C. O. Lampland, Further radiometric measurements and temperature estimates of the planet Mars , 1926, BS Sci. Pap. 22, 237 (1927) S553.
(4) Arthur Adel and C. O. Lampland, Atmospheric absorption of infrared solar radiation at the Lowell Observatory, Astrophys. J. 91, 1 and 481 (January and June 1940).
(5) S. P. Langley, The temperature of the Moon, Nat. Acad. Sci. U. S. 4, 107, (1889). (See plate 6.)
[6] Frank W. Very, Atmospheric radiation, U. S. Weather Bur., Bulletin G (W. B. No. 221, 1900). (See fig. 22.)
[7] F. E. Fowle, Transmission percentages of radiation through moist sir, Smithsonian Physical Tables ; also Smithsonian Misc. Collections 68, No.8 (1917).
(8) K. Angstrom, Influence of pressure upon the absorption of gases, Arkiv Mat., Astron. Fysik 4, No. 30 (1908). Eva Von Bahr, Ann. Physik 29, 780 (1909).
[9] D. H. Menzel, W. W. Coblentz, and C. O. Lampland, Planetary temperatures derived f rom water-cell transmissions, Astrophys. J. 63,177 (1926).
[10] F . W. Very, Llmar temperatures, Astrophys. J . 8, 199 and 265 (1898). (11) W. W. Coblentz, Investigations of Infrared Spectra, Pub!. No. 35 Carnegie
Institution of Washington, 1905. [12] W. W. Coblentz, Investigations of Infrared Spectra, Pub. No. 65 (1906)
and No. 97 (1908), Carnegie Institution of Washington. Bu!. BS 2,457 (1906) S45.
[13] W. W. Coblen tz, The diffuse reflecting power of various substances, Bu!. BS 9, 283 (1913) S196.
[14] W. W. Coblentz, Tests of stellar radiometers and measurements of the energy distribution in the spectra of 16 stars, BS Sci. Pap. 17, 725 (1922) S438.
See table 2 for comparison of the radiation sensitivity of thermocouples of various alloys; and, figure 4, showing the arrangement of the filters and (insert, fig. 4) t he method of construction of the thermocouples to reduce the internal resistance.
IV. APPENDIX. THERMOCOUPLES FOR PLANETARY RADIOMETRY
In connection with the foregoing inquiry, the writer made tests on new combinations of thermocouple material (not available in fine wires 17 years ago), one of which he recommends for use in stellar and planetary radiometry.
In previous researches [14] it was found that, in spite of their high thermoelectric power (up to 120 p.v;oC), the radiation sensitivity of thermocouples of alloys of Bi-Sn and Bi-Sb was not much higher than that of thermocouples of Bi-Pt, which has a much smaller thermoelectric power (80 p.v/°C). This is owing to the great heat capacity of t he alloy material, which is brittle and cannot be drawn into fine, pliable wire.
It was found that a thermopile of fin e-drawn wire of the alloy Chromel-P, having a thermoelectric power of +21 p.v;oC (against Cu), combined with constantan (-40 p.v/°C) , giving a total of 61 p.v;oC, is almost as sensitive as a Bi-Cu thermopile (75 p.v;oC) in use by the writer.
''T'be next opposition of Mars occurs September 10.1956. witb a brightness of97.
Planetary Temperature 309
The thermoelectric power of the purest Bi wire, against copper, varies from 75 to 80 p,v/oC. Thermocouples of Bi-Chromel-P wires were found to have a thermoelectric power of 96 to 100 p,v/oC. The resistance of Chromel-P wire, 0.015 mm in thickness is high (about 4 ohms per mm), However, since in stellar and planetary radiometers a length of only a few millimeters is required, the resistance is of minor importance in comparison with the gain in radiation sensitivity resulting from a reduction of heat conductivity. For instance in the writer's tests it was found that the radiation sensitivity of a Bi-Chromel-P thermocouple (Bi wire, t=0.012 mm, pressed flat; Chromel-P, (=0.007 mm; receivers 0.1 mm diam.) for use in planetary radiometry, was from 25 to 35 percent higher than that of a similar thermocouple of Bi-Pt, which is in accord with the data given in table 2 of reference [14].
WASHINGTON, August 15, 1941.