Temperature Effect on the Aggregation Kinetics of CeO2 ...
5
Volume 2 • Issue 7 • 1000158 J Environ Anal Toxicol ISSN:2161-0525 JEAT an open access journal Open Access Research Article Chen et al., J Environ Anal Toxicol 2012, 2:7 DOI: 10.4172/2161-0525.1000158 *Corresponding author: Yongsheng Chen, School of Civil and Environmental Engineering, Georgia Institute of Technology, Atlanta, Georgia 30332, USA, Tel: +1-404-894-3089; E-mail: [email protected] Received July 15, 2012; Accepted October 26, 2012; Published October 29, 2012 Citation: Chen Y, Huang Y, Li K (2012) Temperature Effect on the Aggregation Kinetics of CeO 2 Nanoparticles in Monovalent and Divalent Electrolytes. J Environ Anal Toxicol 2:158. doi:10.4172/2161-0525.1000158 Copyright: © 2012 Chen Y, et al. This is an open-access article distributed under the terms of the Creative Commons Attribution License, which permits unrestricted use, distribution, and reproduction in any medium, provided the original author and source are credited. Temperature Effect on the Aggregation Kinetics of CeO 2 Nanoparticles in Monovalent and Divalent Electrolytes Yongsheng Chen*, Ying Huang and Kungang Li School of Civil and Environmental Engineering, Georgia Institute of Technology, Atlanta, Georgia, USA Keywords: Nanoparticle; Aggregation; Temperature; EDLVO Introduction Recently, engineered nanoparticles (NPs) have received enormous attention owing to their potential commercial and industrial applications in many sectors, such as cosmetics, textiles, pharmaceutical, catalysts and electronics [1,2]. But meanwhile, the release of NPs into the environment will very likely happen along with their large-scale manufacture and wide use, which will subsequently impose risks for ecosystems and human health [3]. It is thus important to evaluate the environmental and health risks of NPs before their mass production. Since the toxicological testing’s of NPs are expensive and time-consuming, researchers are developing theoretical models to evaluate and predict the behavior and risks of NPs in environmental systems [4-6]. Previous studies have shown that the aggregation of NPs plays an important role in their environmental risks by influencing their transport, fate, bioavailability and biological effects [7-11]. Understanding the fundamental principles underlying the aggregation process of NPs and quantitatively describing this process are essential prerequisites for characterizing the environmental behavior of NPs and further quantifying the risk. e aggregation of NPs is fundamentally governed by the interfacial force between interacting particles, which includes several either attractive or repulsive forces. When the attractive force is greater than the repulsive force, NPs approach each other and aggregate; otherwise, NPs stay stable. e famous Derjaguin-Landau-Verwey-Overbeek (DLVO) theory has been widely used to characterize the interfacial force between particles [12,13]. According to it, the vander Waals (vdW) force and electrostatic (EL) force compose the interfacial force. e DLVO theory achieved great success in explaining the stability of colloids in salt solutions. But for NP aggregation, many studies have found that a discrepancy exists between DLVO predictions and experimental observations [14]. is problem might be overcome by taking non-DLVO forces into account, such as the polar Lewis acid/base (AB) force [15] and steric force [16]. Here the AB force is the sum of the hydrophobic interaction force, hydrogen-bonding force and hydration force [15-17]. e precise theoretical analysis of NP interaction and quantitative description of NP aggregation can be obtained by incorporating those non-DLVO forces into the DLVO theory, which is known as the extended DLVO (EDLVO or XDLVO) theory [15]. On the basis of EDLVO theory, our previous studies have addressed the effects of ionic strength and natural organic matter on NP aggregation with modeling approaches [5,18]. It is well known that temperature also greatly influences the aggregation of NPs. Understanding the temperature effect is important for environmental and health risk assessments of NPs, as both natural water and human body fluids can be at temperatures that are remarkably different from the typically used room temperature. For example, river waters in some cold areas may be only 4°C, whereas the temperature of blood in the human body is as high as 37°C. NPs in these solutions would undergo different aggregation processes. e temperature effect, however, has not gained much attention in NP aggregation studies. In this study, we investigated the temperature effect on the aggregation of NPs in KCl and CaCl 2 solutions using time-resolved dynamic light scattering (TR-DLS). We selected CeO 2 NP as a model NP owing to its extensive commercial applications [19-21]. It has been listed as a priority nanomaterial for immediate testing by the Organization for Economic Co-operation and Development (OECD) [22]. We used the EDLVO theory to interpret the fundamentals of the temperature effect on NP aggregation. Furthermore, a kinetic model developed on the basis of EDLVO theory and von Smoluchowski’s population balance equation was used to predict the aggregation kinetics of CeO 2 Abstract Aggregation of engineered nanoparticles (NPs) plays a crucial role in their environmental transport, fate, bioavailability and biological effects. This study investigated the temperature effect on the aggregation kinetics of CeO 2 NPs in KCl and CaCl 2 solutions using time-resolved dynamic light scattering. The results show that in KCl and CaCl 2 , the aggregation rate became faster as the temperature increased. The critical coagulation concentration (CCC) of CeO 2 NPs went down from approximately 100 to 10 mM in KCl and from approximately 10 to 2 mM in CaCl 2 solutions when the temperature increased from 4 to 37°C. The observations were analyzed in the framework of extended Derjaguin- Landau-Verwey-Overbeek (EDLVO) theory in order to find out the mechanisms underlying the temperature effect. Moreover, a theoretical model developed on the basis of EDLVO theory and von Smoluchowski’s population balance equation was used to predict the aggregation kinetics of CeO 2 NPs under different temperature. The model predictions agreed well with experimental data, suggesting that the model could be employed to predict the size change of NPs in solution. Overall, this work provides insights into NP aggregation using experimental and modeling approaches, and allows people to better understand and theoretically predict the environmental behavior and risk of NPs. Journal of Environmental & Analytical Toxicology J o u r n a l o f E n v i r o n m e n t a l & A n a l y t i c a l T o x i c o l o g y ISSN: 2161-0525
Transcript of Temperature Effect on the Aggregation Kinetics of CeO2 ...
Research Article Open Access
Volume 2 • Issue 7 • 1000158J Environ Anal ToxicolISSN:2161-0525 JEAT an open access journal
Open AccessResearch Article
Chen et al., J Environ Anal Toxicol 2012, 2:7 DOI: 10.4172/2161-0525.1000158
*Corresponding author: Yongsheng Chen, School of Civil and Environmental Engineering, Georgia Institute of Technology, Atlanta, Georgia 30332, USA, Tel: +1-404-894-3089; E-mail: [email protected]
Received July 15, 2012; Accepted October 26, 2012; Published October 29, 2012
Citation: Chen Y, Huang Y, Li K (2012) Temperature Effect on the Aggregation Kinetics of CeO2 Nanoparticles in Monovalent and Divalent Electrolytes. J Environ Anal Toxicol 2:158. doi:10.4172/2161-0525.1000158
Copyright: © 2012 Chen Y, et al. This is an open-access article distributed under the terms of the Creative Commons Attribution License, which permits unrestricted use, distribution, and reproduction in any medium, provided the original author and source are credited.
Temperature Effect on the Aggregation Kinetics of CeO2 Nanoparticles in Monovalent and Divalent ElectrolytesYongsheng Chen*, Ying Huang and Kungang Li
School of Civil and Environmental Engineering, Georgia Institute of Technology, Atlanta, Georgia, USA
Keywords: Nanoparticle; Aggregation; Temperature; EDLVO
IntroductionRecently, engineered nanoparticles (NPs) have received
enormous attention owing to their potential commercial and industrial applications in many sectors, such as cosmetics, textiles, pharmaceutical, catalysts and electronics [1,2]. But meanwhile, the release of NPs into the environment will very likely happen along with their large-scale manufacture and wide use, which will subsequently impose risks for ecosystems and human health [3]. It is thus important to evaluate the environmental and health risks of NPs before their mass production. Since the toxicological testing’s of NPs are expensive and time-consuming, researchers are developing theoretical models to evaluate and predict the behavior and risks of NPs in environmental systems [4-6].
Previous studies have shown that the aggregation of NPs plays an important role in their environmental risks by influencing their transport, fate, bioavailability and biological effects [7-11]. Understanding the fundamental principles underlying the aggregation process of NPs and quantitatively describing this process are essential prerequisites for characterizing the environmental behavior of NPs and further quantifying the risk. The aggregation of NPs is fundamentally governed by the interfacial force between interacting particles, which includes several either attractive or repulsive forces. When the attractive force is greater than the repulsive force, NPs approach each other and aggregate; otherwise, NPs stay stable. The famous Derjaguin-Landau-Verwey-Overbeek (DLVO) theory has been widely used to characterize the interfacial force between particles [12,13]. According to it, the vander Waals (vdW) force and electrostatic (EL) force compose the interfacial force. The DLVO theory achieved great success in explaining the stability of colloids in salt solutions. But for NP aggregation, many studies have found that a discrepancy exists between DLVO predictions and experimental observations [14]. This problem might be overcome by taking non-DLVO forces into account, such as the polar Lewis acid/base (AB) force [15] and steric force [16]. Here the AB force is the sum of the hydrophobic interaction force, hydrogen-bonding force and hydration force [15-17]. The precise theoretical analysis of NP interaction and quantitative description of
NP aggregation can be obtained by incorporating those non-DLVO forces into the DLVO theory, which is known as the extended DLVO (EDLVO or XDLVO) theory [15].
On the basis of EDLVO theory, our previous studies have addressed the effects of ionic strength and natural organic matter on NP aggregation with modeling approaches [5,18]. It is well known that temperature also greatly influences the aggregation of NPs. Understanding the temperature effect is important for environmental and health risk assessments of NPs, as both natural water and human body fluids can be at temperatures that are remarkably different from the typically used room temperature. For example, river waters in some cold areas may be only 4°C, whereas the temperature of blood in the human body is as high as 37°C. NPs in these solutions would undergo different aggregation processes. The temperature effect, however, has not gained much attention in NP aggregation studies. In this study, we investigated the temperature effect on the aggregation of NPs in KCl and CaCl2 solutions using time-resolved dynamic light scattering (TR-DLS). We selected CeO2 NP as a model NP owing to its extensive commercial applications [19-21]. It has been listed as a priority nanomaterial for immediate testing by the Organization for Economic Co-operation and Development (OECD) [22]. We used the EDLVO theory to interpret the fundamentals of the temperature effect on NP aggregation. Furthermore, a kinetic model developed on the basis of EDLVO theory and von Smoluchowski’s population balance equation was used to predict the aggregation kinetics of CeO2
AbstractAggregation of engineered nanoparticles (NPs) plays a crucial role in their environmental transport, fate,
bioavailability and biological effects. This study investigated the temperature effect on the aggregation kinetics of CeO2 NPs in KCl and CaCl2 solutions using time-resolved dynamic light scattering. The results show that in KCl and CaCl2, the aggregation rate became faster as the temperature increased. The critical coagulation concentration (CCC) of CeO2 NPs went down from approximately 100 to 10 mM in KCl and from approximately 10 to 2 mM in CaCl2 solutions when the temperature increased from 4 to 37°C. The observations were analyzed in the framework of extended Derjaguin-Landau-Verwey-Overbeek (EDLVO) theory in order to find out the mechanisms underlying the temperature effect. Moreover, a theoretical model developed on the basis of EDLVO theory and von Smoluchowski’s population balance equation was used to predict the aggregation kinetics of CeO2 NPs under different temperature. The model predictions agreed well with experimental data, suggesting that the model could be employed to predict the size change of NPs in solution. Overall, this work provides insights into NP aggregation using experimental and modeling approaches, and allows people to better understand and theoretically predict the environmental behavior and risk of NPs.
Journal ofEnvironmental & Analytical Toxicology
Jour
nal o
f Env
ironmental &Analytical Toxicology
ISSN: 2161-0525
Citation: Chen Y, Huang Y, Li K (2012) Temperature Effect on the Aggregation Kinetics of CeO2 Nanoparticles in Monovalent and Divalent Electrolytes. J Environ Anal Toxicol 2:158. doi:10.4172/2161-0525.1000158
Page 2 of 5
Volume 2 • Issue 7 • 1000158J Environ Anal ToxicolISSN:2161-0525 JEAT an open access journal
NPs, which were then compared with experimental observations. Our aim was to fundamentally understand the temperature effect on NP aggregation and theoretically predict the aggregation kinetics of NPs under different temperature, which were anticipated to benefit the predictive modeling research of environmental behavior and toxicity assessment of NPs.
Materials and MethodsMaterials
CeO2 NPs with a nominal diameter of 25 nm were purchased from Sigma-Aldrich. The atomic composition of the sample was verified using X-ray diffraction (data not shown). The pH of the stock suspension was measured to be 4.5 by pH meter (Accumet model 15, Fisher Scientific Co., USA). KCl and CaCl2 stock solutions were prepared using ACS reagent-grade chemicals (Fisher Scientific Co., USA) and were filtered through 0.02 µm filters (VWR International, USA) before use.
Characterization of CeO2 NPs
The morphology and primary particle size of CeO2 NPs were determined using transmission electron microscopy (TEM). 5 μL of CeO2 NP suspensions were deposited on a copper grid (400 mesh size) coated with carbon film (Ted Pella, Redding, CA, USA). A Philips EM420 TEM was employed to acquire images. Particle size distribution (PSD) was obtained with DLS on a Zetasizer Nano ZS instrument (Malvern Instruments). Briefly, 1.5 mL of 10 mg/L CeO2 NP suspension was injected into a clean cuvette; the DLS instrument was then operated with a scattering angle of 173° from the incident laser beam, and the autocorrelation function automatically accumulated at least 10 runs for each sample. The electrophoretic motilities’ (EPMs) of 10 mg/L CeO2 NPs were measured for a range of K+ and Ca2+ concentrations under different temperatures using the Zetasizer Nano ZS instrument. At least four parallel measurements were made for each condition. The measurement began immediately after the desired conditions were achieved to minimize the interference of aggregation.
Aggregation kinetics
The aggregation kinetics experiments were carried out at pH 5.7, at which the CeO2 NPs are stable for at least 24 h. The pH values of the CeO2 NP, KCl and CaCl2 solutions were pre-adjusted to 5.7 to ensure that each measurement could start immediately after addition of K+ and Ca2+. For the aggregation experiment, the sample holder of the Zeta sizer Nano ZS instrument was preheated or precooled to the desired temperature. A premeasured amount of KCl or CaCl2 was added to 1 mL of CeO2 NP suspension in a cuvette. The NP suspension was then shaken slightly and placed in the sample holder.
Modeling the aggregation kinetics
According to the EDLVO theory, the total interfacial force between two metal oxide NPs is comprised of the vdW force, EL force and AB force [15]. The total interfacial energy (VT) between NPs is computed by assuming that each force acts individually and is thus additive: VT=VvdW+VEL+VAB.
The vdW attractive energy (VvdW)between two identical spherical particles, which considers the retardation effect, can be computed using Equation (1) [23]:
( ) ( )12 1 11.12 /H
VdWc
A rV hh h λ
= −+
(1)
where AH is the Hamaker constant, which is 5.57×10⁻²⁰ J for CeO2 in
water [24]. r is the particle radius. h is the separation distance between the interacting surfaces. λc is the “characteristic wavelength” of the interaction, which is often assumed to be 100 nm [25].
The EL repulsive energy (VEL) between two identical spheres of radii r in 1-1 electrolyte solutions (e.g., KCl) is given by Equation (2a-c). In 2-1 electrolyte solutions (e.g., CaCl2), Equation (2a) and (2b) are replaced by Equation (2d) and (2e), respectively [26-28]:
( ) ( )2
1 22
128 exp2
BEL
k Tn rV h hr h
π γ γ κκ
= × −+
(2a)
tanh4i Si
iz ekTψγ =
(2b)
1 02
2B
A
k TN Ieεε
κ − = (2c)
( ) ( )2
1 22
384 exp2
BEL
k Tn rV h hr h
π γ γ κκ
= × −+
(2d)
1/2
1/2
2exp / 3 1 / 3 132
2exp / 3 1 / 3 1
Si
iSi
ekT
ekT
ψ
γψ
+ − = + +
(2e)
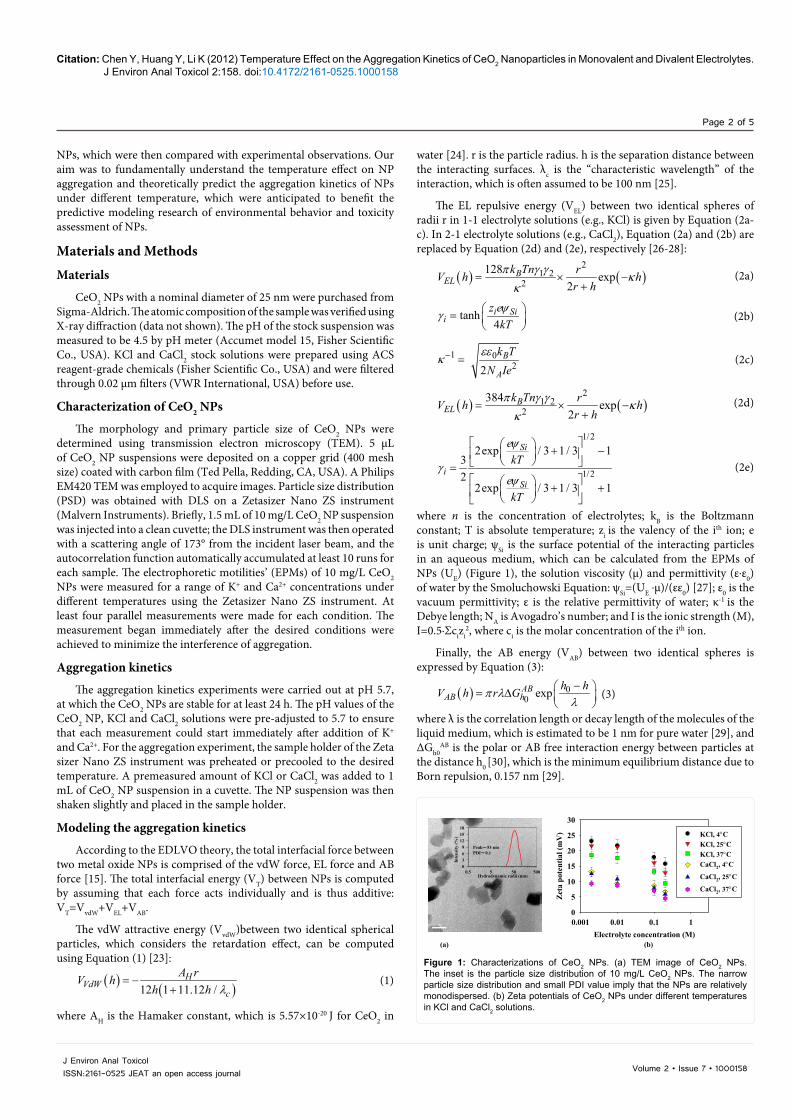
where n is the concentration of electrolytes; kB is the Boltzmann constant; T is absolute temperature; zi is the valency of the ith ion; e is unit charge; ψSi is the surface potential of the interacting particles in an aqueous medium, which can be calculated from the EPMs of NPs (UE) (Figure 1), the solution viscosity (µ) and permittivity (ε.ε0) of water by the Smoluchowski Equation: ψSi=(UE .µ)/(εε0) [27]; ε0 is the vacuum permittivity; ε is the relative permittivity of water; κ-1
is the Debye length; NA is Avogadro’s number; and I is the ionic strength (M), I=0.5·Σcizi
2, where ci is the molar concentration of the ith ion.
Finally, the AB energy (VAB) between two identical spheres is expressed by Equation (3):
( ) 00 expAB
AB hh hV h r Gπ λλ− = ∆
(3)
where λ is the correlation length or decay length of the molecules of the liquid medium, which is estimated to be 1 nm for pure water [29], and ∆Gh0
AB is the polar or AB free interaction energy between particles at the distance h0 [30], which is the minimum equilibrium distance due to Born repulsion, 0.157 nm [29].
(a) (b) Electrolyte concentration (M)
0.001 0.01 0.1 1
Zeta
pot
entia
l (m
V)
0
5
10
15
20
25
30
KCl, 4°C KCl, 25°CKCl, 37°C CaCl2, 4°C
CaCl2, 25°C
CaCl2, 37°C
0369
121518
0.5 5 50 500Hydrodynamic radii (nm)
Inte
nsity
(%)
Peak 53 nmPDI 0.1
∼∼
Figure 1: Characterizations of CeO2 NPs. (a) TEM image of CeO2 NPs. The inset is the particle size distribution of 10 mg/L CeO2 NPs. The narrow particle size distribution and small PDI value imply that the NPs are relatively monodispersed. (b) Zeta potentials of CeO2 NPs under different temperatures in KCl and CaCl2 solutions.
Citation: Chen Y, Huang Y, Li K (2012) Temperature Effect on the Aggregation Kinetics of CeO2 Nanoparticles in Monovalent and Divalent Electrolytes. J Environ Anal Toxicol 2:158. doi:10.4172/2161-0525.1000158
Page 3 of 5
Volume 2 • Issue 7 • 1000158J Environ Anal ToxicolISSN:2161-0525 JEAT an open access journal
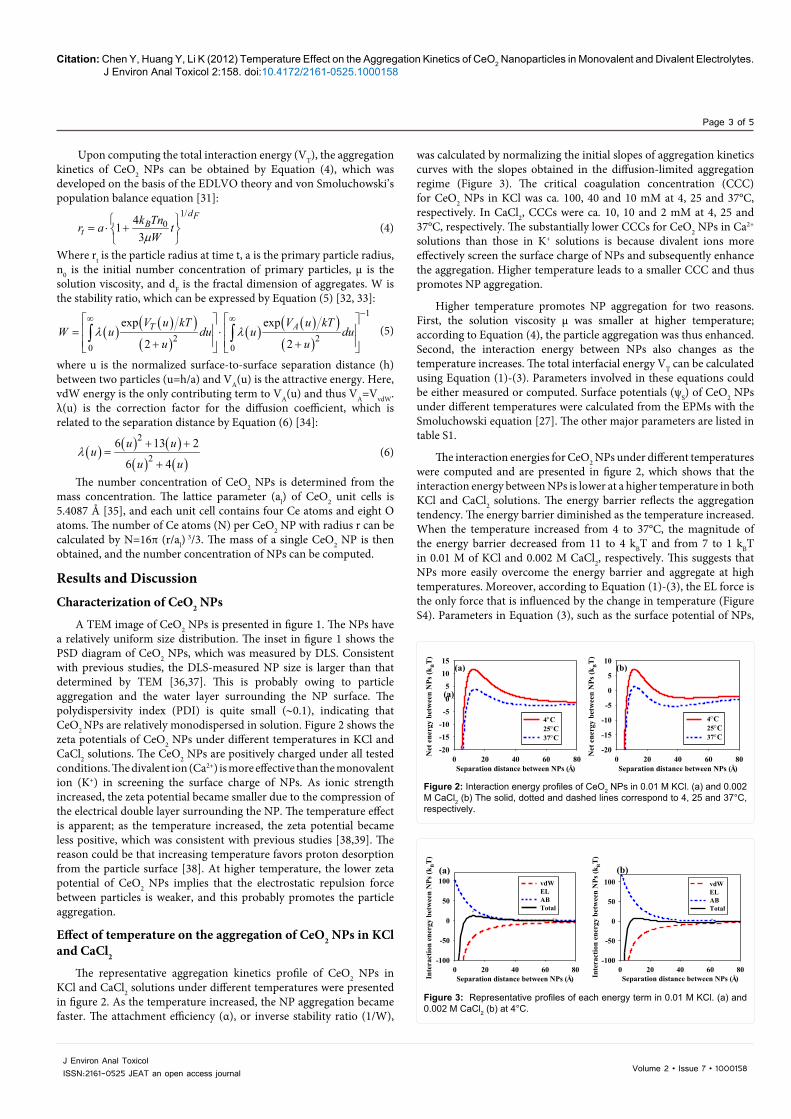
was calculated by normalizing the initial slopes of aggregation kinetics curves with the slopes obtained in the diffusion-limited aggregation regime (Figure 3). The critical coagulation concentration (CCC) for CeO2 NPs in KCl was ca. 100, 40 and 10 mM at 4, 25 and 37°C, respectively. In CaCl2, CCCs were ca. 10, 10 and 2 mM at 4, 25 and 37°C, respectively. The substantially lower CCCs for CeO2 NPs in Ca2+ solutions than those in K+ solutions is because divalent ions more effectively screen the surface charge of NPs and subsequently enhance the aggregation. Higher temperature leads to a smaller CCC and thus promotes NP aggregation.
Higher temperature promotes NP aggregation for two reasons. First, the solution viscosity µ was smaller at higher temperature; according to Equation (4), the particle aggregation was thus enhanced. Second, the interaction energy between NPs also changes as the temperature increases. The total interfacial energy VT can be calculated using Equation (1)-(3). Parameters involved in these equations could be either measured or computed. Surface potentials (ψS) of CeO2 NPs under different temperatures were calculated from the EPMs with the Smoluchowski equation [27]. The other major parameters are listed in table S1.
The interaction energies for CeO2 NPs under different temperatures were computed and are presented in figure 2, which shows that the interaction energy between NPs is lower at a higher temperature in both KCl and CaCl2 solutions. The energy barrier reflects the aggregation tendency. The energy barrier diminished as the temperature increased. When the temperature increased from 4 to 37°C, the magnitude of the energy barrier decreased from 11 to 4 kBT and from 7 to 1 kBT in 0.01 M of KCl and 0.002 M CaCl2, respectively. This suggests that NPs more easily overcome the energy barrier and aggregate at high temperatures. Moreover, according to Equation (1)-(3), the EL force is the only force that is influenced by the change in temperature (Figure S4). Parameters in Equation (3), such as the surface potential of NPs,
Upon computing the total interaction energy (VT), the aggregation kinetics of CeO2 NPs can be obtained by Equation (4), which was developed on the basis of the EDLVO theory and von Smoluchowski’s population balance equation [31]:
1/041
3
dFB
tk Tnr a tWµ
= ⋅ +
(4)
Where rt is the particle radius at time t, a is the primary particle radius, n0 is the initial number concentration of primary particles, µ is the solution viscosity, and dF is the fractal dimension of aggregates. W is the stability ratio, which can be expressed by Equation (5) [32, 33]:
( ) ( )( )( )
( ) ( )( )( )
1
2 20 0
exp exp
2 2T AV u kT V u kT
W u du u duu u
λ λ
−∞ ∞ = ⋅ + + ∫ ∫ (5)
where u is the normalized surface-to-surface separation distance (h) between two particles (u=h/a) and VA(u) is the attractive energy. Here, vdW energy is the only contributing term to VA(u) and thus VA=VvdW. λ(u) is the correction factor for the diffusion coefficient, which is related to the separation distance by Equation (6) [34]:
( ) ( ) ( )( ) ( )
2
26 13 2
6 4
u uu
u uλ
+ +=
+ (6)
The number concentration of CeO2 NPs is determined from the mass concentration. The lattice parameter (al) of CeO2 unit cells is 5.4087 Å [35], and each unit cell contains four Ce atoms and eight O atoms. The number of Ce atoms (N) per CeO2 NP with radius r can be calculated by N=16π (r/al)
3/3. The mass of a single CeO2 NP is then obtained, and the number concentration of NPs can be computed.
Results and DiscussionCharacterization of CeO2 NPs
A TEM image of CeO2 NPs is presented in figure 1. The NPs have a relatively uniform size distribution. The inset in figure 1 shows the PSD diagram of CeO2 NPs, which was measured by DLS. Consistent with previous studies, the DLS-measured NP size is larger than that determined by TEM [36,37]. This is probably owing to particle aggregation and the water layer surrounding the NP surface. The polydispersivity index (PDI) is quite small (∼0.1), indicating that CeO2 NPs are relatively monodispersed in solution. Figure 2 shows the zeta potentials of CeO2 NPs under different temperatures in KCl and CaCl2 solutions. The CeO2 NPs are positively charged under all tested conditions. The divalent ion (Ca2+) is more effective than the monovalent ion (K+) in screening the surface charge of NPs. As ionic strength increased, the zeta potential became smaller due to the compression of the electrical double layer surrounding the NP. The temperature effect is apparent; as the temperature increased, the zeta potential became less positive, which was consistent with previous studies [38,39]. The reason could be that increasing temperature favors proton desorption from the particle surface [38]. At higher temperature, the lower zeta potential of CeO2 NPs implies that the electrostatic repulsion force between particles is weaker, and this probably promotes the particle aggregation.
Effect of temperature on the aggregation of CeO2 NPs in KCl and CaCl2
The representative aggregation kinetics profile of CeO2 NPs in KCl and CaCl2 solutions under different temperatures were presented in figure 2. As the temperature increased, the NP aggregation became faster. The attachment efficiency (α), or inverse stability ratio (1/W),
Separation distance between NPs ( )0 20 40 60 80
Inte
ract
ion
ener
gy b
etw
een
NPs
(kBT
)
-100
-50
0
50
100 vdWELABTotal
Å Separation distance between NPs ( )0 20 40 60 80
Inte
ract
ion
ener
gy b
etw
een
NPs
(kBT
)
-100
-50
0
50
100 vdWELABTotal
Å
(a) (b)
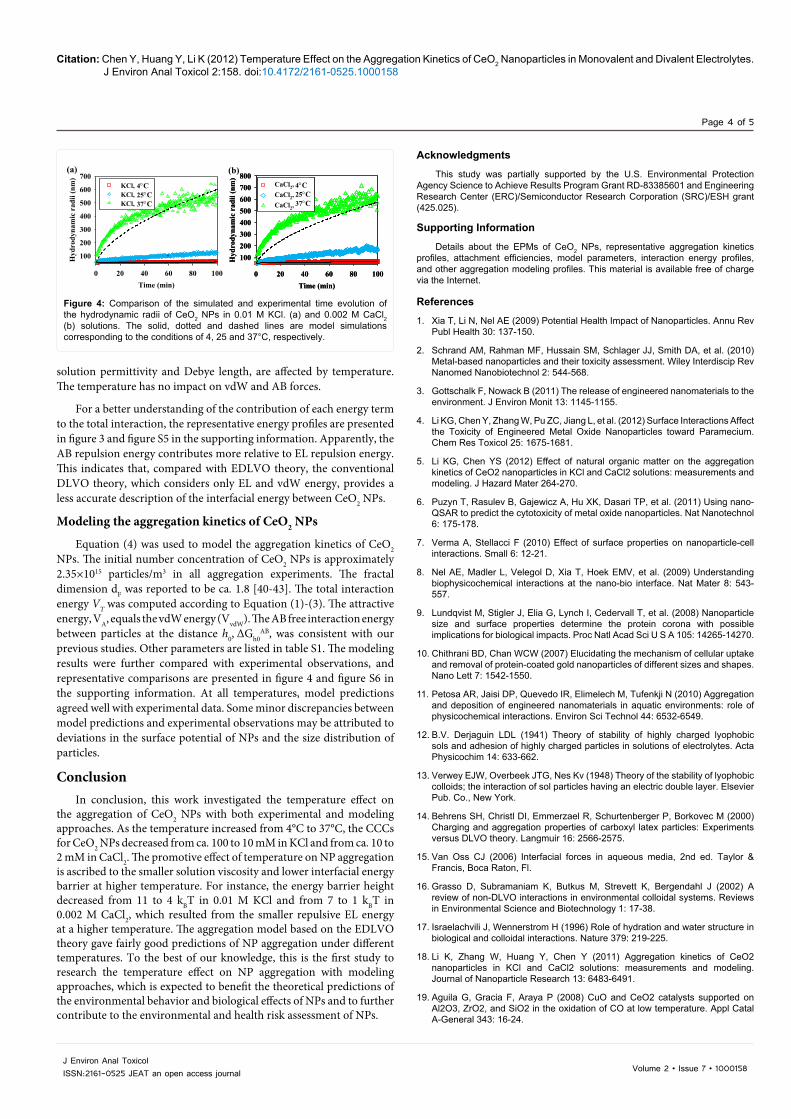
Figure 3: Representative profiles of each energy term in 0.01 M KCl. (a) and 0.002 M CaCl2 (b) at 4°C.
Separation distance between NPs ( )0 20 40 60 80
Net
ene
rgy
betw
een
NPs
(kBT
)
-20-15-10-505
1015
4°C25°C37°C
Å Separation distance between NPs ( )0 20 40 60 80
Net
ene
rgy
betw
een
NPs
(kBT
)
-20
-15
-10
-5
0
5
10
Å
(a)
(a) (b)
4°C25°C37°C
Figure 2: Interaction energy profiles of CeO2 NPs in 0.01 M KCl. (a) and 0.002 M CaCl2 (b) The solid, dotted and dashed lines correspond to 4, 25 and 37°C, respectively.
Citation: Chen Y, Huang Y, Li K (2012) Temperature Effect on the Aggregation Kinetics of CeO2 Nanoparticles in Monovalent and Divalent Electrolytes. J Environ Anal Toxicol 2:158. doi:10.4172/2161-0525.1000158
Page 4 of 5
Volume 2 • Issue 7 • 1000158J Environ Anal ToxicolISSN:2161-0525 JEAT an open access journal
solution permittivity and Debye length, are affected by temperature. The temperature has no impact on vdW and AB forces.
For a better understanding of the contribution of each energy term to the total interaction, the representative energy profiles are presented in figure 3 and figure S5 in the supporting information. Apparently, the AB repulsion energy contributes more relative to EL repulsion energy. This indicates that, compared with EDLVO theory, the conventional DLVO theory, which considers only EL and vdW energy, provides a less accurate description of the interfacial energy between CeO2 NPs.
Modeling the aggregation kinetics of CeO2 NPs
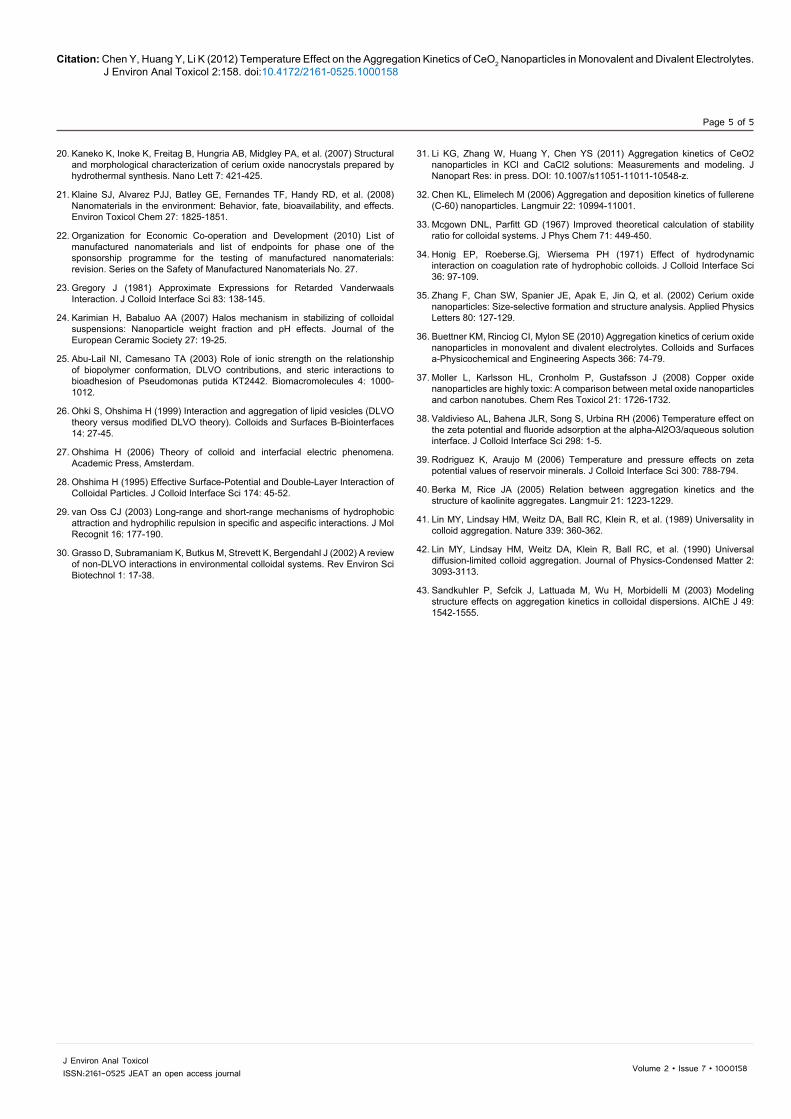
Equation (4) was used to model the aggregation kinetics of CeO2 NPs. The initial number concentration of CeO2 NPs is approximately 2.35×10¹⁵ particles/m3 in all aggregation experiments. The fractal dimension dF was reported to be ca. 1.8 [40-43]. The total interaction energy VT was computed according to Equation (1)-(3). The attractive energy, VA, equals the vdW energy (VvdW). The AB free interaction energy between particles at the distance h0, ∆Gh0
AB, was consistent with our previous studies. Other parameters are listed in table S1. The modeling results were further compared with experimental observations, and representative comparisons are presented in figure 4 and figure S6 in the supporting information. At all temperatures, model predictions agreed well with experimental data. Some minor discrepancies between model predictions and experimental observations may be attributed to deviations in the surface potential of NPs and the size distribution of particles.
ConclusionIn conclusion, this work investigated the temperature effect on
the aggregation of CeO2 NPs with both experimental and modeling approaches. As the temperature increased from 4°C to 37°C, the CCCs for CeO2 NPs decreased from ca. 100 to 10 mM in KCl and from ca. 10 to 2 mM in CaCl2. The promotive effect of temperature on NP aggregation is ascribed to the smaller solution viscosity and lower interfacial energy barrier at higher temperature. For instance, the energy barrier height decreased from 11 to 4 kBT in 0.01 M KCl and from 7 to 1 kBT in 0.002 M CaCl2, which resulted from the smaller repulsive EL energy at a higher temperature. The aggregation model based on the EDLVO theory gave fairly good predictions of NP aggregation under different temperatures. To the best of our knowledge, this is the first study to research the temperature effect on NP aggregation with modeling approaches, which is expected to benefit the theoretical predictions of the environmental behavior and biological effects of NPs and to further contribute to the environmental and health risk assessment of NPs.
Acknowledgments
This study was partially supported by the U.S. Environmental Protection Agency Science to Achieve Results Program Grant RD-83385601 and Engineering Research Center (ERC)/Semiconductor Research Corporation (SRC)/ESH grant (425.025).
Supporting Information
Details about the EPMs of CeO2 NPs, representative aggregation kinetics profiles, attachment efficiencies, model parameters, interaction energy profiles, and other aggregation modeling profiles. This material is available free of charge via the Internet.
References
1. Xia T, Li N, Nel AE (2009) Potential Health Impact of Nanoparticles. Annu Rev Publ Health 30: 137-150.
2. Schrand AM, Rahman MF, Hussain SM, Schlager JJ, Smith DA, et al. (2010) Metal-based nanoparticles and their toxicity assessment. Wiley Interdiscip Rev Nanomed Nanobiotechnol 2: 544-568.
3. Gottschalk F, Nowack B (2011) The release of engineered nanomaterials to the environment. J Environ Monit 13: 1145-1155.
4. Li KG, Chen Y, Zhang W, Pu ZC, Jiang L, et al. (2012) Surface Interactions Affect the Toxicity of Engineered Metal Oxide Nanoparticles toward Paramecium. Chem Res Toxicol 25: 1675-1681.
5. Li KG, Chen YS (2012) Effect of natural organic matter on the aggregation kinetics of CeO2 nanoparticles in KCl and CaCl2 solutions: measurements and modeling. J Hazard Mater 264-270.
6. Puzyn T, Rasulev B, Gajewicz A, Hu XK, Dasari TP, et al. (2011) Using nano-QSAR to predict the cytotoxicity of metal oxide nanoparticles. Nat Nanotechnol 6: 175-178.
7. Verma A, Stellacci F (2010) Effect of surface properties on nanoparticle-cell interactions. Small 6: 12-21.
8. Nel AE, Madler L, Velegol D, Xia T, Hoek EMV, et al. (2009) Understanding biophysicochemical interactions at the nano-bio interface. Nat Mater 8: 543-557.
9. Lundqvist M, Stigler J, Elia G, Lynch I, Cedervall T, et al. (2008) Nanoparticle size and surface properties determine the protein corona with possible implications for biological impacts. Proc Natl Acad Sci U S A 105: 14265-14270.
10. Chithrani BD, Chan WCW (2007) Elucidating the mechanism of cellular uptake and removal of protein-coated gold nanoparticles of different sizes and shapes. Nano Lett 7: 1542-1550.
11. Petosa AR, Jaisi DP, Quevedo IR, Elimelech M, Tufenkji N (2010) Aggregation and deposition of engineered nanomaterials in aquatic environments: role of physicochemical interactions. Environ Sci Technol 44: 6532-6549.
12. B.V. Derjaguin LDL (1941) Theory of stability of highly charged lyophobic sols and adhesion of highly charged particles in solutions of electrolytes. Acta Physicochim 14: 633-662.
13. Verwey EJW, Overbeek JTG, Nes Kv (1948) Theory of the stability of lyophobic colloids; the interaction of sol particles having an electric double layer. Elsevier Pub. Co., New York.
14. Behrens SH, Christl DI, Emmerzael R, Schurtenberger P, Borkovec M (2000) Charging and aggregation properties of carboxyl latex particles: Experiments versus DLVO theory. Langmuir 16: 2566-2575.
15. Van Oss CJ (2006) Interfacial forces in aqueous media, 2nd ed. Taylor & Francis, Boca Raton, Fl.
16. Grasso D, Subramaniam K, Butkus M, Strevett K, Bergendahl J (2002) A review of non-DLVO interactions in environmental colloidal systems. Reviews in Environmental Science and Biotechnology 1: 17-38.
17. Israelachvili J, Wennerstrom H (1996) Role of hydration and water structure in biological and colloidal interactions. Nature 379: 219-225.
18. Li K, Zhang W, Huang Y, Chen Y (2011) Aggregation kinetics of CeO2 nanoparticles in KCl and CaCl2 solutions: measurements and modeling. Journal of Nanoparticle Research 13: 6483-6491.
19. Aguila G, Gracia F, Araya P (2008) CuO and CeO2 catalysts supported on Al2O3, ZrO2, and SiO2 in the oxidation of CO at low temperature. Appl Catal A-General 343: 16-24.
Time (min)0 20 40 60 80 100
Hyd
rody
nam
ic r
adii
(nm
)
100
200
300
400
500
600
700KCl,KCl, oCKCl,
4°C25°C37°C
Time (min)0 20 40 60 80 100
Hyd
rody
nam
ic r
adii
(nm
)
100200300400500600700800
CaCl2, 4 oCCaCl2, 25 oCCaCl2, 37 oC
�C�C�C
Time (min)0 20 40 60 80 100
Hyd
rody
nam
ic r
adii
(nm
)
100200300400500600700800
CaCl2,CaCl2,CaCl2,
4°C25°C37°C
(a) (b)
Figure 4: Comparison of the simulated and experimental time evolution of the hydrodynamic radii of CeO2 NPs in 0.01 M KCl. (a) and 0.002 M CaCl2 (b) solutions. The solid, dotted and dashed lines are model simulations corresponding to the conditions of 4, 25 and 37°C, respectively.
Citation: Chen Y, Huang Y, Li K (2012) Temperature Effect on the Aggregation Kinetics of CeO2 Nanoparticles in Monovalent and Divalent Electrolytes. J Environ Anal Toxicol 2:158. doi:10.4172/2161-0525.1000158
Page 5 of 5
Volume 2 • Issue 7 • 1000158J Environ Anal ToxicolISSN:2161-0525 JEAT an open access journal
20. Kaneko K, Inoke K, Freitag B, Hungria AB, Midgley PA, et al. (2007) Structural and morphological characterization of cerium oxide nanocrystals prepared by hydrothermal synthesis. Nano Lett 7: 421-425.
21. Klaine SJ, Alvarez PJJ, Batley GE, Fernandes TF, Handy RD, et al. (2008) Nanomaterials in the environment: Behavior, fate, bioavailability, and effects. Environ Toxicol Chem 27: 1825-1851.
22. Organization for Economic Co-operation and Development (2010) List of manufactured nanomaterials and list of endpoints for phase one of the sponsorship programme for the testing of manufactured nanomaterials: revision. Series on the Safety of Manufactured Nanomaterials No. 27.
23. Gregory J (1981) Approximate Expressions for Retarded Vanderwaals Interaction. J Colloid Interface Sci 83: 138-145.
24. Karimian H, Babaluo AA (2007) Halos mechanism in stabilizing of colloidal suspensions: Nanoparticle weight fraction and pH effects. Journal of the European Ceramic Society 27: 19-25.
25. Abu-Lail NI, Camesano TA (2003) Role of ionic strength on the relationship of biopolymer conformation, DLVO contributions, and steric interactions to bioadhesion of Pseudomonas putida KT2442. Biomacromolecules 4: 1000-1012.
26. Ohki S, Ohshima H (1999) Interaction and aggregation of lipid vesicles (DLVO theory versus modified DLVO theory). Colloids and Surfaces B-Biointerfaces 14: 27-45.
27. Ohshima H (2006) Theory of colloid and interfacial electric phenomena. Academic Press, Amsterdam.
28. Ohshima H (1995) Effective Surface-Potential and Double-Layer Interaction of Colloidal Particles. J Colloid Interface Sci 174: 45-52.
29. van Oss CJ (2003) Long-range and short-range mechanisms of hydrophobic attraction and hydrophilic repulsion in specific and aspecific interactions. J Mol Recognit 16: 177-190.
30. Grasso D, Subramaniam K, Butkus M, Strevett K, Bergendahl J (2002) A review of non-DLVO interactions in environmental colloidal systems. Rev Environ Sci Biotechnol 1: 17-38.
31. Li KG, Zhang W, Huang Y, Chen YS (2011) Aggregation kinetics of CeO2 nanoparticles in KCl and CaCl2 solutions: Measurements and modeling. J Nanopart Res: in press. DOI: 10.1007/s11051-11011-10548-z.
32. Chen KL, Elimelech M (2006) Aggregation and deposition kinetics of fullerene (C-60) nanoparticles. Langmuir 22: 10994-11001.
33. Mcgown DNL, Parfitt GD (1967) Improved theoretical calculation of stability ratio for colloidal systems. J Phys Chem 71: 449-450.
34. Honig EP, Roeberse.Gj, Wiersema PH (1971) Effect of hydrodynamic interaction on coagulation rate of hydrophobic colloids. J Colloid Interface Sci 36: 97-109.
35. Zhang F, Chan SW, Spanier JE, Apak E, Jin Q, et al. (2002) Cerium oxide nanoparticles: Size-selective formation and structure analysis. Applied Physics Letters 80: 127-129.
36. Buettner KM, Rinciog CI, Mylon SE (2010) Aggregation kinetics of cerium oxide nanoparticles in monovalent and divalent electrolytes. Colloids and Surfaces a-Physicochemical and Engineering Aspects 366: 74-79.
37. Moller L, Karlsson HL, Cronholm P, Gustafsson J (2008) Copper oxide nanoparticles are highly toxic: A comparison between metal oxide nanoparticles and carbon nanotubes. Chem Res Toxicol 21: 1726-1732.
38. Valdivieso AL, Bahena JLR, Song S, Urbina RH (2006) Temperature effect on the zeta potential and fluoride adsorption at the alpha-Al2O3/aqueous solution interface. J Colloid Interface Sci 298: 1-5.
39. Rodriguez K, Araujo M (2006) Temperature and pressure effects on zeta potential values of reservoir minerals. J Colloid Interface Sci 300: 788-794.
40. Berka M, Rice JA (2005) Relation between aggregation kinetics and the structure of kaolinite aggregates. Langmuir 21: 1223-1229.
41. Lin MY, Lindsay HM, Weitz DA, Ball RC, Klein R, et al. (1989) Universality in colloid aggregation. Nature 339: 360-362.
42. Lin MY, Lindsay HM, Weitz DA, Klein R, Ball RC, et al. (1990) Universal diffusion-limited colloid aggregation. Journal of Physics-Condensed Matter 2: 3093-3113.
43. Sandkuhler P, Sefcik J, Lattuada M, Wu H, Morbidelli M (2003) Modeling structure effects on aggregation kinetics in colloidal dispersions. AIChE J 49: 1542-1555.