TEMPERATURE DEPENDENCE OF THE SPECTROSCOPIC AND STRUCTURAL PROPERTIES...
85
TEMPERATURE DEPENDENCE OF THE SPECTROSCOPIC AND STRUCTURAL PROPERTIES OF TlGaS 2 AND TlInS 2 CRYSTALS A THESIS SUBMITTED TO THE GRADUATE SCHOOL OF NATURAL AND APPLIED SCIENCES OF MIDDLE EAST TECHNICAL UNIVERSITY BY MUHAMMED AÇIKGÖZ IN PARTIAL FULFILLMENT OF THE REQUIREMENTS FOR THE DEGREE OF MASTER OF SCIENCE IN PHYSICS AUGUST 2004
-
Upload
hoangkhuong -
Category
Documents
-
view
229 -
download
0
Transcript of TEMPERATURE DEPENDENCE OF THE SPECTROSCOPIC AND STRUCTURAL PROPERTIES...

TEMPERATURE DEPENDENCE OF THE SPECTROSCOPIC AND STRUCTURAL PROPERTIES OF TlGaS2 AND TlInS2 CRYSTALS
A THESIS SUBMITTED TO THE GRADUATE SCHOOL OF NATURAL AND APPLIED SCIENCES
OF MIDDLE EAST TECHNICAL UNIVERSITY
BY
MUHAMMED AÇIKGÖZ
IN PARTIAL FULFILLMENT OF THE REQUIREMENTS
FOR
THE DEGREE OF MASTER OF SCIENCE
IN
PHYSICS
AUGUST 2004
Approval of the Graduate School Natural and Applied Sciences. Prof. Dr. Canan Özgen Director I certify that this thesis satisfies all the requirements as a thesis for the degree of Master of Science. Prof. Dr. Sinan Bilikmen Head of Department This is to certify that we have read this thesis and that in our opinion it is fully adequate, in scope and quality, as a thesis for the degree of Master of Science. Prof. Dr. Nizami Hasanli Prof. Dr. Hüsnü Özkan Co-supervisor Supervisor Examining Committee Members Prof. Dr. Yakup Cevdet Akgöz
(METU, ES)
Prof. Dr. Hüsnü Özkan
(METU, PHYS)
Prof. Dr. Nizami Hasanli
(METU, PHYS)
Prof. Dr. Bülent Akınoğlu
(METU, PHYS)
Assoc. Prof. Dr. Mehmet Parlak
(METU, PHYS)

iii
I hereby declare that all information in this document has been obtained and
presented in accordance with academic rules and ethical conduct. I also declare that,
as required by these rules and conduct, I have fully cited and referenced all material
and results that are not original to this work.
Name, Last name: Muhammed Acikgoz
Signature :

iv
ABSTRACT
TEMPERATURE DEPENDENCE OF THE SPECTROSCOPIC AND STRUCTURAL PROPERTIES OF TlGaS2 AND TlInS2 CRYSTALS
Açıkgöz, Muhammed
M. S., Department of Physics
Supervisor: Prof. Dr. Hüsnü Özkan
Co-supervisor: Prof. Dr. Nizami Hasanli
August 2004, 71 pages
The results of photoluminescence (PL) spectra of TlGaS2 single crystal were reported
in the 500-1400 nm wavelength and in the 15-115 K temperature range. Three broad
PL bands with an asymmetric Gaussian lineshapes were observed to be centered at
568 nm (A-band), 718 nm (B-band) and 1102 nm (C-band). The shift of the emission
band peak energy as well as the change of the half-width of the emission band with
temperature and excitation laser intensity were also studied. We analyzed the
observed results using the configurational coordinate (CC) model.
The powder diffraction patterns of TlInS2 and TlGaS2 crystals were obtained and the
diffraction data were indexed using CRYSFIRE computer program packet. TlInS2
has hexagonal system with parameters a = 3.83 and c = 14.88 Ao. TlGaS2 has
monoclinic system with parameters a = 9.62, b = 4.01 and c = 7.52 Ao with β=
96.30o. Our diffraction studies at low temperatures did not reveal any phase

v
transition for TlInS2 as reported in the literature. The specific heat capacities of both
TlInS2 and TlGaS2 crystals calculated from Differential Scanning Calorimetry (DSC)
measurements at low temperatures are reported in the thesis.
Keywords: Photoluminescence, ternary compounds, band structure, indexing, phase
transition, specific heat capacity.

vi
ÖZ
TlGaS2 ve TlInS2 KRİSTALLERİNİN SPEKTROSKOPİK VE
YAPISAL ÖZELLİKLERİNİN SICAKLIK DEĞİŞİMLERİ
Açıkgöz, Muhammed
Yüksek Lisans, Fizik Bölümü
Tez Yöneticisi: Prof. Dr. Hüsnü Özkan
Ortak Tez Yöneticisi: Prof. Dr. Nizami Hasanli
Ağustos 2004, 71 sayfa
TlGaS2 katlı kristalinin fotoışıma spektrumunun sonuçları 500-1400 nm dalga boyu
diliminde ve 15-115 K sıcaklık aralığında elde edildi. Merkezleri 568 nm (A-band),
718 nm (B-band) ve 1102 nm (C-band) olan asimetrik çizgi şekilli üç tane geniş
fotoışıma bandı gözlendi. Sıcaklık ve lazer uyarma yoğunluğuyla ışıma bandının tepe
noktasındaki kayma aynı şekilde ışıma bandının yarı genişligindeki değişme de
çalışıldı. Elde edilen sonuçlar konfıgürasyon koordinat model kullanılarak analiz
edildi.
TlInS2 ve TlGaS2 kristallerinin toz kırınım desenleri elde edildi ve kırınım dataları
CRYSFIRE bilgisayar program paketi kullanılarak indekslendi. TlInS2 heksagonal
sisteme sahiptir ve örgü parametreleri a = 3.83 ve c = 14.88 Ao olarak belirlenmiştir.
TlGaS2 monoklinik sisteme sahiptir ve örgü parametreleri a = 9.62, b =4.01, c = 7.52
Ao ve β = 96.30o olarak belirlenmiştir. TlInS2 için düşük sıcaklıklardaki kırınım

vii
çalışmalarımız literatürde rapor edilmiş olan faz geçişlerini ortaya çıkarmadı. TlInS2
ve TlGaS2 kristallerinin Diferansiyel Tarama Kalorimetre ölçümleri yapıldı ve düşük
sıcaklıklarda ısınma ısıları hesaplandı.
Anahtar kelimeler: Fotoışıma, üçlü bileşikler, band yapısı, indeksleme, faz geçişleri,
belli ısı kapasitesi.

viii
To My Lovers...

ix
ACKNOWLEDGMENTS
I would like to thank all who helped me to have the opportunity and
possibility to continue the graduate study and to prepare this thesis.
My sincere gratitude and deep appreciation go to Prof. Dr. Hüsnü Özkan and
Prof. Dr. Nizami Hasanli for their kind and supervision during this study.
At the same time, I am also grateful to Prof. Dr. Atilla Aydınlı for his
guidance and laboratory opportunity at Bilkent University.
I am grateful to all staff of Superconductivity laboratory of METU,
Characterization laboratory of ANAEM and Advanced Physics laboratory of Bilkent
University.

x
TABLE OF CONTENTS
PLAGIARISM…………………………………………………………………….…iii
ABSTRACT……………………………………………………………………….....iv
ÖZ…………………………………………………………………………………....vi
DEDICATION……………………………………………………………………...viii
ACKNOWLEDGMENTS…………………………………………………………...ix
TABLE OF CONTENTS………………………………………………………….…x
LIST OF FIGURES………………………………………………………………....xii
LIST OF TABLES……………………………………………………………….…xiv
CHAPTER
1 INTRODUCTION……………………………………………………….….1
2 THEORETICAL CONSIDERATIONS………………………………….…6
2.1 Introduction………………………………………………………...6
2.2 Electronic Properties of Semiconductors…………………………..6
2.2.1 Band Structure ……………………………………………....7
2.2.2 Impurity States……………………………………………….7
2.2.3 Holes in Semiconductors………………………………….…8
2.2.4 Extrinsic and Intrinsic Semiconductors……………………...9
2.2.5 Defects……………………………………………………...10
2.3 Optical Properties of Semiconductors…………………………....11
2.3.1 Luminescence……………………………………………....11

xi
2.3.2 Photoluminescence………………………………………....12
2.3.3 Recombination Mechanisms………………………………..14
2.3.3.a Band-to-band Transition…………………………...….16
2.3.3.b Free-to-bound Transition………………………….…..17
2.3.3.c Donor Acceptor Pair Transition…………………….…18
2.3.3.d Excitons and Bound Exciton Emission…………….….19
2.3.4 Excitation Power Dependence of PL in Semiconductor....…20
2.4 Indexing of Powder X-ray Diffraction (XRD) Pattern…………...24
2.5 Diffraction Scanning Calorimetry……...……………………...….28
2.5.1 Heat Capacity Determination using DSC…………………..30
3 RESULTS AND DISCUSSION…………………………………………...33
3.1 Introduction…………………………………………………….....33
3.2 PL Spectra Analysis………………………………………….…...33
3.2.1 Experimental Details………………………………………...33
3.2.2 Results and Discussion………………………………….…..34
3.3 Results of XRD Measurements……………………………….…49
3.4 Temperature-dependent XRD Measurements…………………....55
3.5 Results of DSC Measurements…………………………………...59
4 CONCLUSIONS……………………………………………………….….66
REFERENCES……………………………………………………………………...68

xii
LIST OF FIGURES 2.1 Excitation and recombination transitions….……………………………..…....16 2.2 DSC setup used in experiments……………………………………………..…30 2.3 A basic figure of heat flow versus temperature plot…………………………...31 3.1 PL setup used in experiments………………………………………………….35 3.2 PL spectrum of TlGaS2 crystal in the 500-1200 nm wavelength range at T = 15 K. Excitation laser intensity L = 19.49 W cm-2……………………......36 3.3 PL spectra of TlGaS2 crystal in the 15-40 K temperature range and 1000-1250 nm wavelength region. Excitation laser intensity L = 19.49 Wcm-2………………...………………………………………….....39 3.4 PL spectra of TlGaS2 crystal in the 15-115 K temperature range and 1000-1250 nm wavelength region. Excitation laser intensity L = 19.49 W cm-2 ……………………………………………………………...40 3.5 Temperature dependence of integrated PL band intensity for TlGaS2 crystal. The arrow at T = 60 K shows the starting point of the intensive quenching process. (a) are the experimental data, (b) gives the theoretical fit using equation (3.1), (c) is only the guide for eye…………………………………....41 3.6 Pl spectra of TlGaS2 crystal as a function of excitation laser intensity at T= 15 K………………………………………………………………………...43 3.7 Dependence of integrated PL band intensity on excitation laser intensity at T = 15 K. The solid curve gives the theoretical fit using equation (3.2)……....44
3.8 Temperature dependence of the emission band peak energy for
TlGaS2 crystal. The dotted line is only guide for the eye...……………..……..46 3.9 Variation of the half-width with square root of temperature for TlGaS2 crystal emission band. The solid curve is a plot of equation (3.4) with hνe = 0.011 eV…………………………………………………………………47 3.10 Band model (a) and configurational coordinate (CC) model (b) of TlGaS2 crystal at T = 15 K…………………………………………………………….48
3.11 X-ray Powder Diffraction Pattern of TlInS2…………………………………..52

xiii
3.12 X-ray powder diffraction pattern of TLGaS2……………………………..…..53 3.13 Fragments of diffraction patterns of the TlInS2 crystal at various sample temperatures T, K: 215, 213, and 200, from top to down………………….....56 3.14 Fragments of diffraction patterns of the TlInS2 crystal at various sample temperatures T, K: 200, 195, and 193, from top to down………………….....57 3.15 Fragments of diffraction patterns of the TlInS2 crystal at two sample temperatures T, K: 250, and 83, from top to down……………..………….....58 3.16 DSC curves of 1-baseline, 2-TlInS2, and 3-TlGaS2………………………......62 3.17 Temperature dependence of the specific heat of a TlGaS2 single crystal determined in the range 170-240 K…………………………………………..63 3.18 Temperature dependence of the specific heat of a TlInS2 single crystal determined in the range 170-280 K…………………………………………..64

xiv
LIST OF TABLES 3.1 The TREOR90 outputs from the X-ray diffraction measurements of
TlGaS2…………………………………………………………………….54 3.2 Calculated heat capacities of TlInS2 and TlGaS2 at various temperatures...65

1
CHAPTER 1
INTRODUCTION
All the materials can be classified into three main groups in terms of their
electrical properties: conductors, semiconductors and insulators. A useful way to
visualize the difference between conductors, insulators, and semiconductors is to plot
the available energy states for electrons in the materials. Instead of having discrete
energies as in the case of free atoms, in solids the available energy states form bands.
Crucial to the conduction process is whether or not there are electrons in the
conduction band. In conductors like metals, the valence band overlaps the conduction
band. In insulators, the electrons in the valence band are separated by a large gap
from the conduction band. In semiconductors, there is a small enough gap between
the valence and conduction bands that thermal or other excitations can bridge the
gap.
The study of semiconductors started in the 1870s, when W. Smith discovered the
selenium photoconductivity that followed the first attempts to use selenium in the
devices for the visual image transport by telegraph [1].
In the previous decades researchers discovered many types of binary and ternary
semiconductors. They investigated various parameters, such as mobility, defect
mechanism, impurities and carrier transport, related to their features and applications
in the technology.
Photoluminescence (PL) spectroscopy is one of the most important techniques
which is very suitable and widely used. The first truly scientific investigation of PL

2
was carried out by Sir George Gabriel Stokes in 1852. His famous paper “On the
charge of Refrengibility of light “[2] still makes excellent reading for its masterly
style. Stokes coined the word fluorescence “from flour-spar, as the analogous term
brightness is derived from the name of a mineral.” This term is still used, although in
a light sense. Luminescence stimulated by non-ionizing optical radiation, more
properly, is called photoluminescence and includes fluorescence as well as
phosphorescence [3]. PL is the optical emission obtained by photon excitation. PL
spectroscopy analysis allows non-destructive, contactless characterization of
materials. PL has several applications: Band gap and impurity level determination,
defect detection, understanding recombination mechanisms and material quality [4,
5].
The measurement of PL is not a simple matter, due to its complexity and very low
intensity. Thus specialized techniques and apparatus are required for this metrology.
PL can be caused by UV, visible or infrared radiation. A special form of the PL is the
anti-Stokes luminescence, where an emission at wavelengths shorter than the shortest
wavelength of the excited radiation occurs [3].
A wide variety of ternary layered semiconductors receive much attention due to
their optical and electrical features as possible light emitters in optoelectronic device
applications from UV to the infrared [3, 6, 7]. The ternary compounds have three
different chemical components causing significant physical properties that attracted
valuable attention [8, 9].
In recent years, the physical properties of the III-III-VI2 family, the layer-
structured thallium dichalcogenides with chemical formula TlBX2, where B = In or
Ga and X = S or Se, have been studied extensively [6]. At room temperature,
thallium dichalcogenides belong to the monoclinic system, and their space

3
group is C2/c. The lattice of these crystals consists of alternatively two-dimensional
layers arranged parallel to the (001) plane [10]. Each successive layer is rotated by a
90o angle with respect to the previous layer. The fundamental structural unit of a
layer is the B4X10 polyhedron representing a combination of four elementary BX4
tetrahedra linked together by bridging X atoms. The thallium atoms are in trigonal
prismatic voids resulting from the combination of the B4X10 polyhedra into a layer.
The thallium atoms form nearly planer chains along the [110] and 0]1[1-
directions
[11]. These crystals are characterized by clearly defined anisotropy in their
mechanical properties.
TlGaS2, which is a member of this family of crystals, is a semiconductor with
indirect band gap of about 2.46 and 2.55 eV at 300 and 10 K, respectively [12]. In view
of its possible applications in optoelectronic devices, a great deal of attention has been
devoted to the study of the optical and electrical properties of TlGaS2 [12-17]. In this
regard, detailed information on the impurity levels is very useful for the fabrication of
high-quality devices. Abutalybov et al. [20] have reported the existence of a fine
structure in the PL spectra of a TlGaS2 in the temperature range 1.8-77 K. It was found
that the PL lines in the long-wavelength part of the spectrum (595-610) nm were
separated by ≈ 0.5 eV from the direct edge exciton absorption peak and were due to
recombination of bound excitons. Abdullaeva et al. [21] have observed two broad
emission bands in PL spectra of TlGaS2 at T= 6 K due to impurity level-to-band
radiative transitions at 499 and 590 nm. Song et al. [16] have investigated the impurity
levels of TlGaS2 crystals in the temperature range 90-350 K by thermally stimulated
current (TSC) and photoinduced current transient spectroscopy techniques. The
activation energies of the observed four peaks were found to be 0.18, 0.23, 0.36 and
0.66 eV. Recently, Yuksek et al. [18] have studied the shallow levels of TlGaS2

4
crystal in the low-temperature range of 10-60 K by TSC method and observed three
trap levels with activation energies 0.006, 0.012 and 0.026 eV. Long-wave optical
phonons in TlGaS2 crystals were investigated by infrared reflection and Raman
scattering experiments [17, 19].
In this work, we present the results of the PL investigation of TlGaS2 single crystals
in the 500-1400 nm wavelength and in the 15-115 K temperature range. The shift of
the emission band peak energy as well as the change of the half-width of the emission
band with temperature and excitation laser intensity was also studied. The observed
results were analyzed using the configurational coordinate (CC) model.
As a part of this thesis, we have also studied the structural characterization of
TlGaS2 and TlInS2 crystals. Firstly, we carried out x-ray powder diffraction (XRD)
measurements to identify the crystal system and the lattice parameters of these
samples.
There are only a few reports in the literature about diffraction data of TlGaS2 and
TlInS2. The 2θ and intensities of the peaks of the different reports agree each other but
they do not agree on the indexing of the data. Some authors report the system of the
crystal to be hexagonal and some others to be monoclinic. We wanted to determine the
crystal system of our samples by indexing the data using several relevant computer
programs. The crystal system and the lattice parameters of TlGaS2 and TlInS2 were
obtained.
Some authors reported phase transitions in the layered crystals at low
temperatures. We wanted to learn if such transitions could be observed in our
samples using temperature-dependent powder diffraction method. For this reason we
obtained the powder diffraction patterns of TlInS2 at low temperatures between 83-
250 K. Our observation about this topic will also be presented.

5
Important information about phase transitions could also be obtained using
Differential Scanning Calorimetry (DSC) method. We have obtained DSC patterns of
TlGaS2 and TlInS2 at low temperatures. From such patterns we have determined the
specific heat capacities and their temperature variations for TlGaS2 and TlInS2, and
compared these results with the relevant data in the literature [23-25].
6
CHAPTER 2
THEORETICAL CONSIDERATIONS
2.1. Introduction
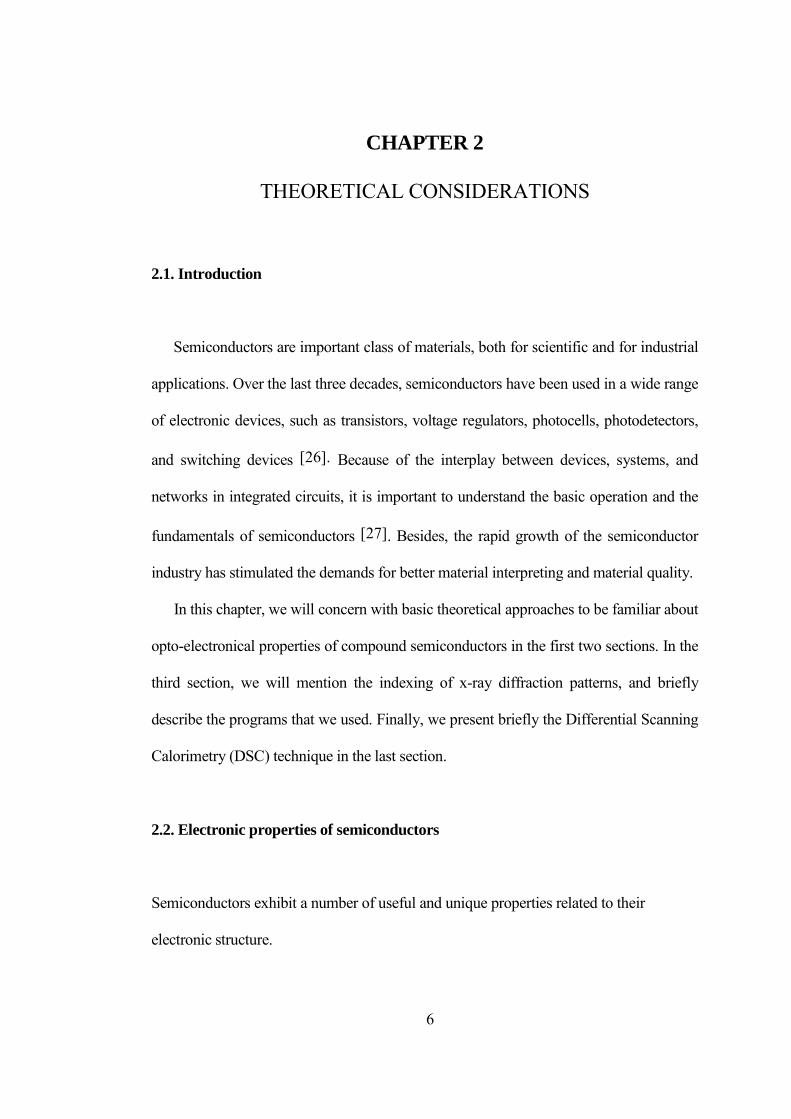
Semiconductors are important class of materials, both for scientific and for industrial
applications. Over the last three decades, semiconductors have been used in a wide range
of electronic devices, such as transistors, voltage regulators, photocells, photodetectors,
and switching devices [26]. Because of the interplay between devices, systems, and
networks in integrated circuits, it is important to understand the basic operation and the
fundamentals of semiconductors [27]. Besides, the rapid growth of the semiconductor
industry has stimulated the demands for better material interpreting and material quality.
In this chapter, we will concern with basic theoretical approaches to be familiar about
opto-electronical properties of compound semiconductors in the first two sections. In the
third section, we will mention the indexing of x-ray diffraction patterns, and briefly
describe the programs that we used. Finally, we present briefly the Differential Scanning
Calorimetry (DSC) technique in the last section.
2.2. Electronic properties of semiconductors
Semiconductors exhibit a number of useful and unique properties related to their
electronic structure.
7
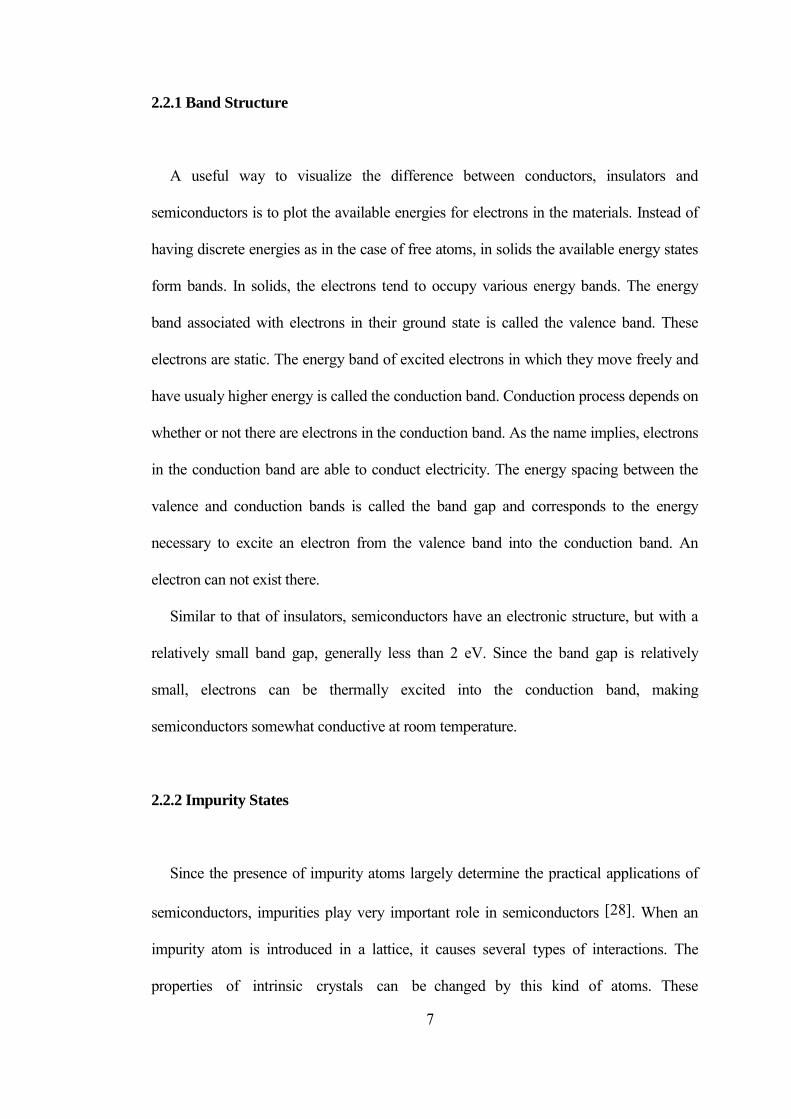
2.2.1 Band Structure
A useful way to visualize the difference between conductors, insulators and
semiconductors is to plot the available energies for electrons in the materials. Instead of
having discrete energies as in the case of free atoms, in solids the available energy states
form bands. In solids, the electrons tend to occupy various energy bands. The energy
band associated with electrons in their ground state is called the valence band. These
electrons are static. The energy band of excited electrons in which they move freely and
have usualy higher energy is called the conduction band. Conduction process depends on
whether or not there are electrons in the conduction band. As the name implies, electrons
in the conduction band are able to conduct electricity. The energy spacing between the
valence and conduction bands is called the band gap and corresponds to the energy
necessary to excite an electron from the valence band into the conduction band. An
electron can not exist there.
Similar to that of insulators, semiconductors have an electronic structure, but with a
relatively small band gap, generally less than 2 eV. Since the band gap is relatively
small, electrons can be thermally excited into the conduction band, making
semiconductors somewhat conductive at room temperature.
2.2.2 Impurity States
Since the presence of impurity atoms largely determine the practical applications of
semiconductors, impurities play very important role in semiconductors [28]. When an
impurity atom is introduced in a lattice, it causes several types of interactions. The
properties of intrinsic crystals can be changed by this kind of atoms. These

8
impurity atoms may be found in one of two places. Whether they can replace some of
the original atoms in the lattice or can occur interstitially among the original ones where
its outer-shell electrons are available for conduction. In most cases these impurities enter
the lattice by substituting for normal atoms. In this stuation, if the impurity atom
replacing one of the constituent atoms of the crystal provides with one or more
additional electrons than the atom it replaced, this impurity is called a donor. Si on a Ga-
site in GaAs is an example for this. On the other hand, when the impurity atom provides
less electrons than the atom it replaces, it forms an acceptor as the role of Si on an As-
site in GaAs. This lack of electron due to Si is considered as a hole. Both this hole and
the extra electron coming from donor atom are weakly bounded and behave as localized
states in each side of the band gap.
When the impurity atom can contribute more than one extra carrier ( electron or hole),
it is called a multiple donor or a multiple acceptor, both of which have a state for each
carrier they can contribute. Apparently, when the multiple donor has released one
electron it is singly ionized. When it is doubly ionized, the donor is doubly charged,
hence the corresponding binding energy is much greater than for the singly ionized state.
Therefore, as the degree of ionization increases, the various donor levels go deeper
below the conduction-band edges [29].
2.2.3 Holes in Semiconductors
The most important startling feature that makes a semiconductor so different from a
metal is the vacancy h, left in the covalent bond by the liberated electron e, behaves as if
it were a new free particle with a positive electronic charge +q and a mass comparable to
that of an electron [30]. This particle is logically called as a hole. This positively

9
charged vacancy can move, in spite of the fact that the ionized atom itself does not
move. Hence, the motion of the hole may be esteemed as a transfer of ionization from
one atom to another.
As we know from general electron theory, if we apply an external electric field to the
crystal, the electron will have a direction opposite to the field due to the negative charge
of the electron simply. On the other hand, if we consider the hole concept, wherever the
hole is , a valence electron will fill it by moving in a direction opposite to the electric
field with the effect hole drifts in the direction of the field [31].
2.2.4 Extrinsic and Intrinsic Semiconductors
Generally, we can conclude that an intrinsic semiconductor is an insulator at low
temperatures and turns to a conductor at high ones, its conductivty tending to increase
with temperature. This takes place since in the intrinsic semiconductor the increase in the
number of free carriers with temperature far outbalances the reduction of mobility [30].
In a pure semiconductor, a hole is also produced for every conduction electron, and n = p
where n and p denotes the concentrations of conduction electrons and holes,
respectively. This is called intrinsic conduction and we add a subscript i to n. It is
ni = C1/2 T3/2 exp ( -Eg / 2kBT). (2.1)
In this formula, the value of constant C depends on the semiconductor material. kB is
Boltzman’s constant and T the absolute temperature (at room temperature kBT = 25.9
meV).

10
As a matter of fact, the development of practical semiconductor devices would
not be possible without the freedom of adding infinitesimal controlled amounts of
suitable foreign substances (impurities) to otherwise pure material. By this way, it is
possible to create semiconductors exhibiting extrinsic conductivity over a fairly wide
temperature range [30]. In this range, these semiconductors may have either more
conduction electrons than holes or more holes than electrons. That is, if a
semiconductor is extrinsic then no >> po or po >> no.
2.2.5 Defects
Over several decades, the study of crystalline defects has deduced a considerable
impulsion in order to understand the control that is exerted by defects on most
technologically significant ptoperties of solids [32]. In general, defects are classified
into line defects and point defects. As the name express line defects involve rows of
atoms, and typical examples of line defects are dislocations. On the other hand, point
defects usually involve isolated atoms in localized regions of a host crystal. Point
defects are often further classified into the many kinds with special terminology and
notations. These are named as vacancy, interstitial, substitutional, antisite, and
Frenkel defect pair. Vacancies and antisite defects are native or intrinsic defects
because they do not involve foreign atoms. Their concentrations can not be
determined by mass spectrometry or chemical analysis. Besides, defects which
involve foreign atoms ( i.e., impurities) are referred to as extrinsic defects [33].
The growing importance of compound semiconductors emphasizes the necessity
to identify and investigate the properties and the ways so as to control these defects.
The vacancies are less mobile in the compound materials than in the

11
elemental semiconductors. This is reasonable in the sense since diffusion in the
elemental materials involves the nearest neighbor moving into the vacancy.
However, in the compound materials, it is the next nearest neighbor that must take
the move, the nearest neighbor functioning to block its motion [34].
2.3 Optical Properties of Semiconductors
2.3.1 Luminescence
Luminescence is a rewarding field for scientific and practical application. Even
though its basic physical mechanism is simple in a conceptual manner, it provides
fascinating variety. In 1888, the German physicist Eilhard Wiedemann introduced
the term luminescence, of Latin origin, to include both fluorescence and
phosphorescence.
The optical processes involve emission of radiation from the sample. Luminescence
is one of these processes. In a typical luminescence process electrons in the sample
are excited optically or electrically. After some energy relaxation (loss), the excited
electrons return to the ground state, during which it emits light [33]. Luminescence is
a process where matter generates nonthermal radiation which is characteristic of the
particular luminescent material. However, the radiation so generated is also called
luminescence so often. In order to avoid the misunderstandings that can arise when
radiation and luminescence are used synonymously, luminescence is used to denote
either the luminescence process including excitation, emission, and temporary
storage of energy, or sometimes just the final emission part of the luminescence
process [35]. Furthermore, since the quality and quantity of luminescence

12
radiation are strongly dependent on the nature of the emitting material, it is useful to
begin to study of luminescence with the study of matter.
In addition to the great variety of luminescence emissions from different
materials, there are a lot of kinds of input energies which can excite luminescent
materials. To distinguish among the different causes of excitation, it has become
customary to use prefixes. We can make a list of these methods as follows:
Photoluminescence: Absorption of light
Radioluminescence: High energy particles
Cathodoluminescence: Cathode rays, electron beams
Electroluminescence: Electric fields
Thermoluminescence: Thermally activated ion recombination
Chemiluminescence: Chemical reaction ion recombination
Bioluminescence: Biological processes, usually enzymatic
Triboluminescence: Friction and static forces
Sonoluminescence: Sound and ultrasound
Roentgenoluminescence: High energy x-rays
This list may be extended with other names for luminescence excited by different
means [36].
2.3.2 Photoluminescence
In general, photoluminescence is a common method by absorption of photons of
energy higher than that of the bandgap, in the resulting process photons of energy

13
lower than the exciting photons are radiated. When light of sufficient energy is
incident on a semiconductor material, photons are absorbed and electronic
excitations are created. Eventually, these excitations relax and the electrons return to
the ground state. If radiative relaxation occurs, the emitted light is called
photoluminescence (PL). This light can be collected and analyzed to yield a wealth
of information about the material. The color (or wavelength) of the light provides
information on transition energies, and the intensity is a measure of the relative rate
of radiative and nonradiative recombination. Radiative transition includes the
emission of light but nonradiative does not. Here, we should conclude this: The
quantity of the emitted light is linked to the relative contribution of the radiative
process.
Optical transitions between two bands are powerfully affected by whether the
band structure of the material is indirect or direct. A transition in indirect involves a
change in momentum while in direct it does not since the valence band maximum in
both cases is at k = 0 where k is the wavevector. For the reason that the photon
momentum is negligibly small, for an indirect transition, momentum conservation
requires the co-operation of another particle. This particle is phonon. It obtains
momentum by interacting with a phonon. In the course of the transition, the particle
changes its momentum by an amount ћq. Then the energy conservation formula
becomes:
pif E-EEhν ±= (2.2)
where Ef and Ei are the final and initial energies respectively and Ep is the energy of

14
phonon. The minus and plus signs indicate the phonon absorption and emission,
respectively.
In direct band gap transition with the same wavevector, semiconductors whose
fundamental absorption edge involves a vertical transition are said to have a direct
absorption with the following energy conservation relation,
hν = Ef - Ei. (2.3)
The indirect gap energy is usually determined by the measurement of temperature
dependence of the Hall coefficient in intrinsic region, while the direct gap energy is
directly measured only in an optical absorption experiment [26]. PL is one of the
most useful, powerful, and sensitive optical methods.
As a luminescence process, a PL one involves three individual steps. First, in
excitation step, electron-hole pairs have to be excited by an external source of
energy. Then the excited electron-hole pairs relax towards quasi-thermal equilibrium
distributions. This process is called thermalization. Ultimately, the thermalized e-h
pairs recombine radiatively to produce the emission in recombination part.
2.3.3 Recombination Mechanisms
Electrons and holes, in a semiconductor, are constantly generated by thermal
excitation of electrons from the valence band to the conduction band. Under thermal
equilibrium, this generation process is compensated by a recombination process
where electrons and holes annihilate each other [26]. Recombination is part of a
process to restore equilibrium to a semiconductor that has been perturbed,

15
or disturbed out of equilibrium. Three things can cause to the perturbations mainly. It
can be in the form of an applied electric field, a change in temperature or exposure to
light. Recombination takes place when there is an excess of carriers and they are
destroyed, by recombining. Remember carriers are in the form of a free electron and
hole it leaves behind, or electrons or holes brought in from dopants. When they are
destroyed, a negatively charged electron is attracted to the positively charged hole,
and as they get together, their charges are canceled and the electron is part of a bond
once again.
In order to obtain the general expression for the net recombination rate, we can
make the following assumptions: For a single electron transition from a to b, the
transition probability, Sab, depends on only a and b states. So as to take place this
transition, state a should be occupied with probability pa and state b should be vacant
with probability qb. Then the general expression for the average rate of the transition
from a to b takes the form Sabpaqb. If we consider the same procedure for the reverse
process from b to a, at this time, state b will be occupied and state a will be vacant.
Hence the rate of this reverse process is Sbapbqa. Finally, the net recombination rate
per unit volume for the process a to b can then be written as
Uab = (Sabpaqb- Sbapbqa)/V (2.4)
Schmidt et al. mention about many recombination mechanisms in their paper [37].
There are four types of recombination which we cover in this study.

16
Fig. 2.1: Excitation and Recombination Transitions
2.3.3.a Band-to-band Transition
Band-to-band transition occurs when an electron falls from its state in the
conduction band into the empty state in the valence band which is associated with the
hole.
This process depends on the density of electrons and holes. The rate is expected to be
proportional to the product of n and p, since both carrier types need to be available in
the recombination process. The total rate of recombination is given by
R = rnp (2.5)
a
b
c
jfe
d
h
g
i
CONDUCTION BAND
VALENCE BAND
+
+
+
+
+
D0
D0
D0
D+ D+
A0
A0
A0
A-
A-

17
as for any bimolecular process, where r is a constant of proportionality. Opposite to
the recombination process, there is a constant generation of carriers. However, under
thermal equilibrium the recombination rate must equal to the generation rate since
there is no net recombination and generation. That is, the generation rate G = rnopo,
where no and po are thermal equilibrium electron-hole concentration, respectively,
must be equal to recombination rate R. The net recombination rate, U, can be
expressed as:
U = R-G = r(np-nopo) (2.6)
This band-to-band transition is typically also a radiative transition in direct bandgap
semiconductors, like GaAs, with a high probability. In an indirect semiconductor,
like Si and Ge, recombination can occur radiatively only via phonon-assisted
transitions.
2.3.3.b Free-to-bound Transition
Carriers are frozen at sufficiently low temperatures. At higher temperature where
all the shallow impurities are ionized, band-to-band transitions tend to dominate.
Free-to-bound transitions can occur radiatively or non-radiatively between a free
carrier and a charge bound to an impurity. We can consider, as an example, a
photoluminescence experiment on a p-type sample containing NA acceptors per unit
volume. Here, at low photoexcitation, the density ne of free electrons created in the
conduction band is much smaller than NA. These free electrons recombine with

18
holes trapped on the acceptors. In this example, the emitted photon energy is
calculated by Eg-EA, where EA is the shallow acceptor binding energy. Therefore, we
can use emission due to free-to-bound transitions as a simple way of measuring
impurity binding energies.
2.3.3.c Donor-acceptor Pair Transition
Donor-acceptor pair transitions take place in compensated semiconductors. In
compensated situation, under equilibrium conditions, some of the electrons from the
donors will be captured or compensated by the acceptors. Hence, a compensated
material contains both acceptors (A-) and ionized donors (D+). It is without
questioning assumed that there are more donors than acceptors. By the way, let me
point that a semiconductor quite often may contain both donors and acceptors.
By optical excitation, electrons can be created in the conduction band and holes
can be created in the valence band. Then these carriers can be trapped at A- and D+
sites in order to produce neutral Ao and Do centers. In returning to equilibrium, a
donor-acceptor pair transition (or DAP transition), in which some of the electrons on
the neutral donors will recombine radiatively with holes on the neutral acceptors,
occur. We can formulate this transition as
Ao+Do = A-+D++hν. (2.7)
We may expect that the photon emitted in a DAP transition has energy

19
hν = Eg - EA - ED, (2.8)
where Eg is the bandgap energy and EA and ED are the acceptor and donor binding
energies, respectively. However, the Eqn. (2.8) neglects the Coulomb interaction
between the acceptors and ionized donors. This causes a problem. If we suppose the
distance between D+ and A- to be r, then Coulomb energy will be equal to –e2 / (4π
єo2r), where єo is the static dielectric constant. By taking account this Coulomb
energy, the emitted photon energy should be
hν = Eg - EA- ED + e2/(4πєo2r). (2.9)
Since the energy of the final state in Eqn. (2.7) is lowered by the Coulomb attraction,
the emitted photon energy is increased by the amount e2 / (4π єo2r) [33].
2.3.3.d Excitons and Bound Exciton Emission
An exciton is a bound state of an electron and a hole in a semiconductor (or an
insulator), that is, a Coulomb correlated electron/hole pair. A brilliant picture of
exciton formation is as follows: A photon exciting an electron from the valence band
to the conduction band enters a semiconductor. The missing electron in the valence
band leaves a hole behind, to which it is attracted by the Coulomb force. The exciton
is resulted from the binding of the electron with its hole.
Excitons can have a relatively long lifetime because the probability of the electron
falling into (annihilating with) the hole is limited by the difficulty of losing the
excess energy. We can mention about another limiting factor in the

20
recombination probability which is the spatial overlap is smaller for lighter electrons,
holes and for highly excited hydrogenic states. The existence of exciton states may
be inferred from the absorption of light associated with their excitation. In a typical
manner, excitons are observed just below the bandgap. Alternatively, an exciton may
be thought of as an excited state of an atom or ion.
We expect the photoexcited electrons and holes to be attracted to each other by
Coulomb interaction and to form excitons in photoluminescence experiments on high
purity and high quality semiconductors at low temperatures. The excitons will be
attracted to a small number of donors and acceptors in their neutral state by way of
van der Walls interaction when the sample contains these impurities. Neutral
impurities are very efficient at trapping excitons to form bound excitons at low
temperature since this attraction lowers the exciton energy.
2.3.4 Excitation Power Dependence of Photoluminescence in Semiconductors
The excitation intensity power controls the density of photo-excited electrons and
holes, which governs the behavior of these carriers. Each electron and hole
recombination has a distinct functional dependence on the carrier density. That the
behavior of the photoluminescence intensity alters, as the power of the light source is
varied. Hence, it can be used to describe the fundamental recombination process
[38]. As a general statement, luminescence intensity I of near band edge
photoluminescence emission lines has been found that it is proportional to Lγ, as can
be expressed:
I α Lγ (2.10)

21
where L is the excitation laser intensity and γ is the dimensionless exponent [39-42].
This γ takes different values: for exciton like transition, it is 1<γ<2 and for both free-
to-bound and donor-acceptor pair (DoAo) transitions it is less than 1 (γ<1) [43].
The characteristics of PL observed in experiment can be explained by a model
proposed by Schmidt et al. [43]. This model assumes that the hole concentration, p,
in the valence band is equal to the electron concentration, n, in the conduction band.
Also, thermal separation of free and bound excitons is neglected. Furthermore, this
model takes into account all transitions shown in fig. 2.1. In order to identify these
transitions the following set of coupled differential equations are used:
dtdn =iL–an2-gn(ND-ND
0)– enNA0 (2.11)
dt
dnFE =an2 + jL– [FEτ1 + nr
FEτ1 ]nFE – b nFE ND
0 – c nFE NA0 (2.12)
the term j describes the direct formation of free excitons and can be omitted for
laser light energies hν exceeding the gap energy Eg.
dt
dnDX = bnFEND0-[
DXτ1 + nr
DXτ1 ]nDX (2.13)
dt
dnAX =cnFENA0-[
AXτ1 + nr
AXτ1 ] nAX (2.14)

22
dtdN A0
= h (NA – NA0) n + i (NA – NA
0) L - c nFE NA0+ [
AXτ1 + nr
AXτ1 ] nAX – d ND
0 NA0
(2.15)
dtdN D0
=g(ND – ND0) n + k ND
0 L - b nFE ND0+ [
DXτ1 + nr
DXτ1 ] nDX – d ND
0 NA0 – f ND
0 n,
(2.16)
in these equations, ND and ND0 are the concentrations of donors and neutral donors,
NA and NA0 are the concentrations of acceptors and neutral acceptors. nFE, nDX and
nAX are the concentrations of the free and bound excitons, respectively. DXτ , nrDXτ ,
AXτ , nrAXτ are the radiative and nonradiative lifetimes of donor and acceptor bound
excitons, and FEτ and nrFEτ are the radiative and nonradiative lifetimes of free excitons,
respectively. The coefficients a,b,…l are the transition rates of the processes shown
in fig.2.1. Since two electron and two hole transitions and the recombination of
excitons bound to ionized donors (D+X) are weak transitions, these are neglected for
easiness.
Assuming that, for constant ND0 and NA
0, a small portion of the free electron-hole
pairs form excitons and photoexcited carriers recombine by way of defect states of
donors and acceptors and neglecting the term an2 in Eq.(2.11), using Eqn. (2.12) and
(2.14), we can derive the luminescence intensities of free and bound excitons, IFE,
ID0
X and IA0
X:
IFE = FE
FEnτ
= FEτβ n2 (2.17)

23
where ( )oo DDA NNgeNin
−+=
ID0
X = DX
DXnτ
=
nrDX
DX
DbN
ττ
β
+1
0 n2 (2.18)
IA0
X = AX
DAnτ
=
nrAX
AX
AcN
ττ
β
+1
0 n2 (2.19)
where β = ] 1 1 [ 00 ADnr
FEFE
NcNb
a
+++ττ
and assuming the proportionality between the intensity of free-to-bound transitions
and respective transition rates,
IhD0 ∼ n ND
0 (2.20)
IeA0 ∼ n NA
0 (2.21)
can be written. For fluctuation of ND0 and NA
0 with L, assuming that ND0NA
0 is
proportional to ID0
A0, they obtained the equation:
kD0
A0 = ( kD
0X - kFE ) + ( kA
0X - kFE ) (2.22)

24
for the donor-acceptor pair transition, where kD
0A
0, kD0
X, kFE and kA0
X denote the
slopes of log(ID0
A0) vs log(L), log(kD
0X) vs log(L), log(kFE) vs log(L) and log (kA
0X)
vs log(L) graphs.
As a conclusion, we can say that this model can satisfactorily re-create the power
dependence of all PL lines. It is not restricted to one particular semiconductor. It can
be applied to any direct semiconductor.
2.4 Indexing of Powder X-ray Diffraction (XRD) Patterns
Information about crystal structure is important for most research projects. Relevant
information about crystal systems and the lattice parameters can be obtained from the
x-ray powder diffraction patterns. X-ray diffraction (XRD) is a non-destructive
technique for the qualitative and quantitative analysis of the crystalline materials.
Basically, XRD is obtained as the reflection of an x-ray beam from a family of
parallel and equally spaced atomic planes. It follows the Bragg’s law.
Bragg’s law: diffraction takes place if the path of rays reflected by successive planes
with distance d is a multiple of the wavelength λ when a monochromatic x-ray beam
is incident on lattice planes with an angle θ. The diffraction condition for a beam is
given by:
nλ = 2dsinθ (2.23)
where n is a positive integer showing the order of reflection maximum, d is the inter-
planer spacing between successive atomic planes in the crystal and θ is the angle of
reflection. In this formula, Bragg derived a mathematical relation connecting the
25
wavelength λ of the reflected x-radiation, the spacing d and the angle θ [44].
In structure analysis, XRD is used to investigate the crystallographic structure of a
material. The position and the relative intensities of the diffraction lines can be
correlated to the position of the atoms in the unit cell, and its dimensions. Structure
refinement, simulation, and indexing can be obtained with specific computer
programs.
X-ray measurements can be carried out using both single crystal and powder forms
of sample. We have used powder form in our measurements. Powder XRD is one of
the primary techniques used by solid state scientists to characterize materials; it may
provide information about shape and size of the unit cell of the crystal. In powder
method, the value of the lattice parameters and the information about the unit cell can
be determined accurately. The diffraction peaks in the powder patterns corresponds
to the sets of crystal planes that satisfy the Bragg’s law. The 2θ values can be related
to the wavelength, the lattice parameters and the Miller indices of the plane causing
the peaks. Such relations can be expressed for the different crystal systems. By using
the row 2θ values of a substance, by carefully analyzing the data one can find the
Miller indices of each reflection together with the lattice parameters and the crystal
system. This is called indexing.
Theoretically, in order to determine the crystal system of a sample, we should
consider the powder diffraction patterns. The system of any crystal must be one of
the seven certain crystal systems (cubic, monoclinic, hexagonal, tetragonal,
rhombohedral, orthorhombic, or triclinic). At the beginning, we do not know which
the relevant crystal system is.

26
The interplaner spacings can be related to the Miller indices and the lattice
parameters. These relations are shown below for the seven crystal system,
For cubic: 2
222
2 alkh
d1 ++= (2.24)
For tetragonal: 2
2
2
22
2 cl
akh
d1 ++= (2.25)
For hexagonal: 2
2
2
22
2 cl
akhkh
34
d1 +
++= (2.26)
For rhombohedral: ( ) ( )( )( )α2cosα3cos1a
cosααcoshlklhk2αsinlkhd1
322
22222
2 +−−+++++= (2.27)
For orthorhombic: 2
2
2
2
2
2
2 cl
bk
ah
d1 ++= (2.28)
For monoclinic:
−++=
ac2hlcosβ
cl
bβsink
ah
βsin1
d1
2
2
2
22
2
2
22 (2.29)
For triclinic: ( )hl2Skl2Shk2SlSkShSV1
d1
1323122
332
222
1122 +++++= (2.30)
In the above equation V is the volume of unitcell that can be calculated for triclinic
systems by:
γβαγβα coscoscos2coscoscos1 222 +−−−= abcV (2.31)
where α, β, γ are the angles between lattice parameters b, c; a, c; a, b, respectively,

27
and ,sin222
11 αcbS =
,sin22222 βcaS =
,sin22233 γbaS =
( ),coscoscos212 γβα −= abcS (2.32)
( ),coscoscos223 αγβ −= bcaS
( ).coscoscos213 βαγ −= cabS
Combining these equations with Bragg law, we can relate 2θ values to the Miller
indices for each crystal system. As an example such a relation, for cubic system, is
obtained as follows:
( )2222
22 lkh
4aλθsin ++= (2.33)
If the crystal system is tetragonal with axes a and c, then the corresponding general
equation will be
++= 2
2
2
2222
cl
akh
4λθsin (2.34)
and the similar equations can be obtained for the other crystal systems [45].
If all the diffraction lines are considered, then the experimental values of sin2θ should
form a pattern related to the values of Miller indices (h, k, and l) for the structure. For
the cubic system we multiply the sin2θ values by a parameter (4a2/λ2) to give

28
nearly integer values for all the h2+ k2+ l2 values. Finally the integer values of h2+
k2+ l2 are matched with the h k l values to index each plane. This procedure depends
on several parameters and rather complex when the crystal system is unknown. In
order to determine the Miller indices of diffraction planes, we should consider all the
sin2θ formulas for each crystal system and choose the most approptiate one.
Fortunately, computational techniques can be used to refine powder data. There exist
so many powder indexing programs used world wide by crystallographers for
indexing powder diffraction data. These programs are typically non-graphical and
rely on complex interaction with the user via text file input and output. There is
obviously considerable scope for increasing the efficiency of such programs through
the use of graphical tools and user interfacing.
In order to analyze the data from the powder XRD measurements, CRYSFIRE
indexing packet program was used. It combines several different indexing programs
written in FORTRAN by different scientists. The basic features of this packet
program will be mentioned next in the Results and Discussion part.
2.5 Differential Scanning Calorimetry (DSC)
Differential Scanning Calorimetry or DSC for short is a technique used to study
what happens to crystals when they are heated. It is used to study what we call the
thermal reactions taking place in a crystal during heating or cooling. DSC has been
used for over forty years to characterize transitions in materials. However,
interpretation of the observed events and data by DSC is often very difficult,
especially for the inexperienced beginners. Many events, such as crystallization,

29
melting, annealing, evaporation, etc., which occurs in the sample involves either the
absorption or release of heat. The selection of the analysis is difficult and often
subjective because many of these processes overlap in temperature.
In the most DSC apparatus, there are two pans, identically positioned platforms
and connected to a furnace by a common heat flow path. In one pan, we put the
sample, and in the other pan is used as a reference. It is left empty. The device used
has a software program to turn on the furnace. It tells to the system to heat the pans
with a specific heating rate, as 5, 10, or 15oC per minute. Throughout the experiment,
the heating rates through the pans are kept equal and stable.
The pan containing the sample takes more heat compared to the reference pan to
increase the temperature at the same rate. Therefore, in a DSC experiment we
measure the extra heat induced by the sample. Figure 2.2 illustrates the basic parts of
a DSC apparatus.
In a DSC experiment, we obtain a plot of temperature on the x-axis and the
difference in heat flow between the sample and reference on the y-axis while the
temperature is increasing. At the first glance we can see from this plot the
endothermic and exothermic reactions taking place while temperature is changing.

30
Fig.2.2: DSC setup.
2.5.1 Heat Capacity Determination using DSC
Heat capacity is a measure of the energy that is required to raise the temperature
of a material. The heat capacity per amount of substance is the specific heat capacity
which is the amount of necessary energy to heat one gram of the material one degree.
Cp is a characteristic thermodynamic property of a material. It should always be
positive. Its value at a temperature is independent of the heating rate, and also sample
size apart from time-dependent processes. Similar to heating process, how much heat
must be removed to cool it to a temperature where the dimensions are stable can be
obtained from similar Cp data taken in cooling. Cp value is low for a crystalline
material in that molecules can only vibrate. But Cp is higher for liquids in which
molecules can also rotate and translate.
DSC provides information to obtain heat capacity. We can achieve capacity
measurements between -100 and 725oC with the apparatus that we have used. When
31
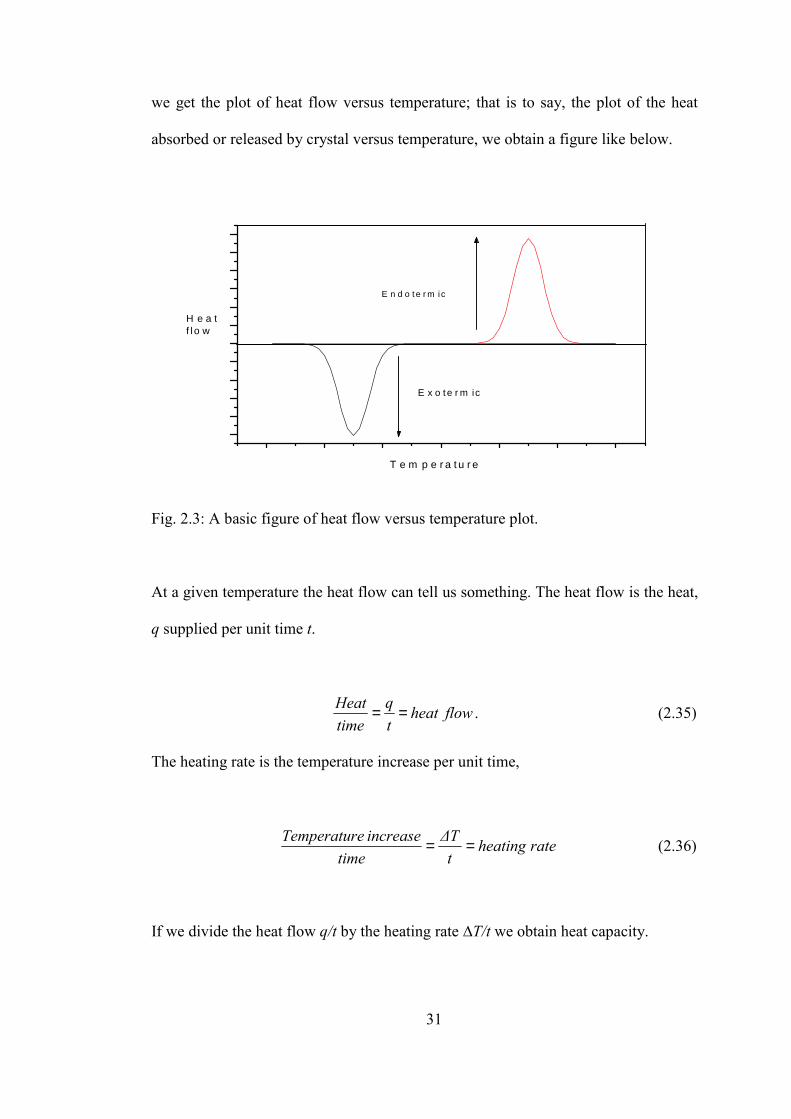
we get the plot of heat flow versus temperature; that is to say, the plot of the heat
absorbed or released by crystal versus temperature, we obtain a figure like below.
H e a tf l o w
T e m p e r a t u r e
E n d o t e r m ic
E x o te r m ic
Fig. 2.3: A basic figure of heat flow versus temperature plot.
At a given temperature the heat flow can tell us something. The heat flow is the heat,
q supplied per unit time t.
flow heattq
timeHeat == . (2.35)
The heating rate is the temperature increase per unit time,
rate heatingt∆T
timeincrease eTemperatur == (2.36)
If we divide the heat flow q/t by the heating rate ∆T/t we obtain heat capacity.
32
capacity heatC∆tq
t∆ttq
p=== . (2.37)
When a certain amount of heat is supplied into material, its temperature will increase
by a certain amount. The amount of heat absorbed to increase temperature by a
certain amount is called the heat capacity (Cp). The statements above outline how to
obtain heat capacity from the DSC plot.

33
CHAPTER 3
RESULTS AND DISCUSSION
3.1 Introduction
In this chapter, first, we investigated the details of photoluminescence spectra of
TlGaS2 crystals. Second, we analyzed and obtained some results from the data of
powder XRD patterns of TlInS2 and TlGaS2 crystals. Also, we attempt to get some
conclusions from temperature dependent XRD measurements of TlInS2. Finally, we
concluded differential scanning clorimeter (DSC) measurements by finding the
specific heat capacities of both TlGaS2 and TlInS2 crystals.
3.2 Photoluminescence Spectra Analysis
In this section, we present the results of the PL investigation of TlGaS2 single
crystals in the 500-1400 nm wavelength and in the 15-115 K temperature ranges. The
shift of the emission band peak energy as well as the change of the half-width of the
emission band with temperature and excitation laser intensity was also studied. The
observed results were analyzed using the configurational coordinate (CC) model.
3.2.1 Experimental Details
TlGaS2 polycrystals were synthesized from high-purity elements (at least 99.999%

34
pure) prepared in stoichiometric proportions. Single crystals of TlGaS2 were grown by
the modified Bridgman method. The samples were prepared by cleaving an ingot
parallel to the crystal layer, which was perpendicular to the c-axis, with typical sample
dimensions of 8 x 4 x 2 mm3. The electrical conductivity of the studied samples was p-
type as determined by the hot probe method. A "Spectra-Physics" argon ion laser
operating at a wavelength 476.5 nm was used as the excitation source. The PL was
observed from the laser illuminated face of the samples, in a direction close to the
normal of the (001) plane. A "CTI-Cryogenics M-22" closed-cycle helium cryostat was
used to cool the crystals from room temperature down to 15 K. The temperature was
controlled within an accuracy of 0.5 K. The PL spectra in the 500-860 nm wavelength
range were analyzed using a "U-1000 Jobin-Yvon" double grating spectrometer and a
cooled GaAs photomultiplier equipped with the necessary photon counting electronics.
The PL spectra in the 600-1400 nm wavelength range were obtained by means of “CVI
Digikrom DK-480" monochromator and Hamamatsu TE cooled detector. A set of
neutral-density filters was used to adjust the excitation laser intensity from 0.35 to
19.49 Wcm-2.
3.2.2 Results and Discussion
Figure 3.2 shows the PL spectrum of the TlGaS2 crystal measured at T = 15 K and
excitation laser intensity of 19.49 W cm-2 in the 500-1200 nm wavelength range. We

35
Fig. 3.1 PL setup used in experiments
observed three broad bands with an asymmetric Gaussian lineshapes centered at 568
nm (2.183 eV, A-band), 718 nm (1.727 eV, B-band) and 1102 nm (1.125 eV, C-band)
in the PL spectrum. The observed bands have half-widths of 0.221, 0.258 and 0.067 eV
for A- , B- and C-bands, respectively. The emission bands intensity, half-width and
peak position changed with respect to temperature. These features are typical of
emission bands, which are due to donor-acceptor pair transitions observed in ternary
semiconductors [46].
LASER
MONOCHROMATOR
PHOTOMULTIPLIER TUBE
COMPUTERCONTROL
CLOSED-CYCLEHELIUM
CRYOSTAT
MONOCHRMONOCHROMATOR
LASER
COMPUTER
CLOSED-CYCLE HELIUM CRYOSTAT
PHOTOMULTIPLIER TUBE

36
50 0 60 0 7 00 8 00 90 0 10 00 11 00 1 20 0
PL
Inte
nsity
(a.u
.)
W ave leng th (nm )
571 nm
719 nm
1102 nm
T = 15 K
Fig. 3.2: PL spectrum of TlGaS2 crystal in the 500-1200 nm wavelength range at T =
15 K. Excitation laser intensity L = 19.49 W cm-2.
Gasanly et al. [47] presented the results of detailed analysis of the A- and B-bands
behavior in the PL spectra of TlGaS2 crystals with respect to the temperature and
excitation intensity. It was shown that in the temperature range of
10-90 K, the intensity of the A-band decreases, while the intensity of the B-band
increases. For T > 90 K, when the A-band becomes very weak, the intensity of the B-
band decreases drastically as the temperature increases. The activation energies
∆EA = 0.005 eV and ∆EB = 0.085 eV for A- and B-bands, respectively, have been
obtained from semilog plots of PL intensities as a function of reciprocal temperature.
The A- and B-bands were found to be due to radiative transitions from the deep
donor levels located at 0.362 eV (d1) and 0.738 eV (d2) below the bottom of the

37
conduction band to the shallow acceptor levels at 0.005 (a1) and 0.085 eV (a2)
located above the top of the valence band, respectively. The presence of two acceptor
levels allowed to explain the thermal quenching behavior of A- and B-bands in PL
spectra of TlGaS2 crystal, where the intensity of the B-band increases in the same
temperature range (10-90 K) in which the quenching of the A-band is observed.
Quenching of the A-band may be associated with the thermal release of holes from
the acceptor level a1 to the valence band. The thermally released holes are then
captured by the acceptor level a2. Finally, this results in the increase of the intensity
of the B-band in the same temperature range where quenching of the A-band occurs.
Figures 3.3 and 3.4 shows the PL spectra of the TlGaS2 crystal (C-band) measured
in the 1000-1250 nm near-infrared wavelength range and in the 15-115 K
temperature regions at a constant excitation laser intensity of 19.49 W cm-2. From
Fig. 3.3 it can be seen that in the temperature range of 15-40 K the intensity of the C-
band increases with respect to increasing temperature, while for T > 40 K the
intensity of the band decreases. Figure 3.5 shows the temperature dependence of the
integrated C-band intensity as a function of the reciprocal temperature in the 15-115
K range. The increase of C-band intensity in the temperature range of 15-40 K may
be related to the thermal release of holes from the above-mentioned acceptor level a1
to the valence band. Probably, these released holes are captured not only by the
acceptor level a2 but also by the acceptor level a3, which is responsible for
appearance of C-band in the PL spectra. The decrease of the C-band intensity in the
temperature range of 40-115 K is associated with the thermal release of holes from
the acceptor level a3 when the contribution of captured holes released from level a1
becomes very small. A rapid thermal quenching of the PL band is observed above T
= 60 K. The experimental data for the temperature dependence of the

38
integrated C-band intensity can be fitted by the following expression [48]
)/exp(1
)( 2/32
2/31
0
kTETTITI
∆αα −++= (3.1)
where I0 is a proportionality constant, ∆E the thermal activation energy, k the
Boltzmann constant, α1 and α2 are the fitting parameters associated with the
temperature dependence of the capture cross sections of the donor and acceptor
impurity levels. The best fit in the temperature range 40-115 K using Eqn. (3.1),
demonstrated by the solid curve in Fig. 3.5, has been achieved with parameters I0 =
2.6 × 10⁵, ∆E = 0.035 eV, α1 = 1.6 × 10⁻⁴ and α2 = 2.9 ×10⁻¹.
In elucidating the nature of luminescence from semiconductors, excitation laser
intensity dependence of the PL spectra is an important consideration. In Fig. 3.6, we
present the excitation laser intensity dependence of the PL spectra of TlGaS2 crystal.

39
1000 1050 1100 1150 1200 1250
40 K 35 30 25 20 15
PL
Inte
nsity
(a.u
.)
Wavelength (nm)
1
6
1
6
(a)
Fig.3.3: PL spectra of TlGaS2 crystal in the 15-40 K temperature range and 1000-
1250 nm wavelength region. Excitation laser intensity L = 19.49 W cm-2

40
1000 1100 1200 1300
40 K 45 50 55 60 65 70 75 80 85 90 95 100 105 110 115
PL
Inte
nsity
(a.u
.)
W a v e l e n g t h (n m )
6
21
(b)
Fig. 3.4: PL spectra of TlGaS2 crystal in the 40-115 K temperature range and
1000-1250 nm wavelength region. Excitation laser intensity L = 19.49 W cm-2.

41
0 2 0 4 0 6 0
PL
Inte
nsity
(a.u
.)
1 0 0 0 /T (K -1 )
a b c
6 0 K
Fig. 3.5: Temperature dependence of integrated PL band intensity for TlGaS2 crystal.
The arrow at T = 60 K shows the starting point of the intensive quenching process. (a)
are the experimental data, (b) gives the theoretical fit using equation (3.1), (c) is only
the guide for eye.
The C-band is visible even at the lowest excitation intensity and increases in
intensity as the excitation intensity increases. Detailed analysis of the peak position
of this band as a function of increasing excitation laser intensity did not yield any
variation of the peak energy values. We, therefore, concentrated on the analysis of
PL intensity as a function of the excitation laser intensity. The experimental data can
be fitted by a simpler power law of the form:
I ∝ L γ , (3.2)

42
where I is the PL intensity, L is the excitation laser intensity and γ is a dimensionless
exponent. It was found that the integrated intensity of the emission band increases
sublinearly with respect to the excitation laser intensity (Fig. 3.7). The value of γ was
found to be 0.97. It is well known that for excitation laser photon with an energy
exceeding the band gap energy, Eg, the coefficient γ is generally 1 < γ < 2 for the
free- and bound-exciton emission, and γ ≤ 1 for free-to-bound and donor-acceptor
pair recombination [49]. Thus, the obtained value of γ < 1 further confirms our
assertion that C-band in the PL spectra of TlGaS2 is due to donor-acceptor pair
recombination.
Peak energy of C-band does not change with increasing excitation laser intensity
(Fig. 3.6). This result rules out the model of "distant" donor-acceptor pair (DAP)
recombination process where a shift toward higher energies are expected as the
excitation laser intensity is increased [50]. It is known that in general, the emission
energy from a DA pair separated by a distance of r is obtained from [51]
reZZEEErE AD
DAg ε
2
)()( ++−= , (3.3)
where, Eg is the band gap energy, AE and DE are the acceptor and donor ionization
energies, ε is the dielectric constant, ZD and ZA are the charges of the donor and
acceptor states, respectively.

43
1100 1200 1300
14
1
PL In
tens
ity (a
.u.)
Wavelength (nm)
19.49 Wcm-2
13.65 9.75 7.80 6.83 5.46 3.90 2.73 2.54 1.77 1.27 1.01 0.89 0.35
1
14
Fig. 3.6: PL spectra of TlGaS2 crystal as a function of excitation laser intensity at
T = 15 K.

44
10-1 100 101100
101
102
PL In
tens
ity (a
.u.)
Excitation Intensity (Wcm-2)
Experiment Fit
γ = 0.97TlGaS2
Fig.3.7: Dependence of integrated PL band intensity on excitation laser intensity at T
= 15 K. The solid curve gives the theoretical fit using Eqn. (3.2)
From Eq. (3.3), it is clear that as the excitation laser intensity is increased, the
contribution of closer pairs will increase leading to the expected blue shift of the
peak energy of the emission. Since this is in contrast with the observed data, we
conclude that, only close pairs such as the nearest or next-nearest neighbors are
involved in the transitions.
Figure 3.8 shows the shift of the emission peak energy as a function of
temperature. The emission band peak energy increases with increasing temperature.
This is opposite to the behavior of the band gap energy shift, which decreases with
increasing temperature [58]. The total range of the peak energy shift is 0.014 eV.
Similar behavior for the peak energy shift as well as the above-mentioned half-

45
width increase with temperature has been observed for the emission bands of p-GaAs
[52] and layered p-GaSe [53]. The 1.37 eV (GaAs) and 1.20 eV (GaSe) emission
bands were associated with a vacancy-acceptor complex center, and the
recombination mechanism was interpreted as self-activated luminescence in terms of
the CC model. Since the CC model was so successful in explaining the behavior of
the luminescence associated with such a localized center in layered p-GaSe, it was
also applied here for layered TlGaS2 which belongs to the same III-VI family as
GaSe with a layered crystal structure.
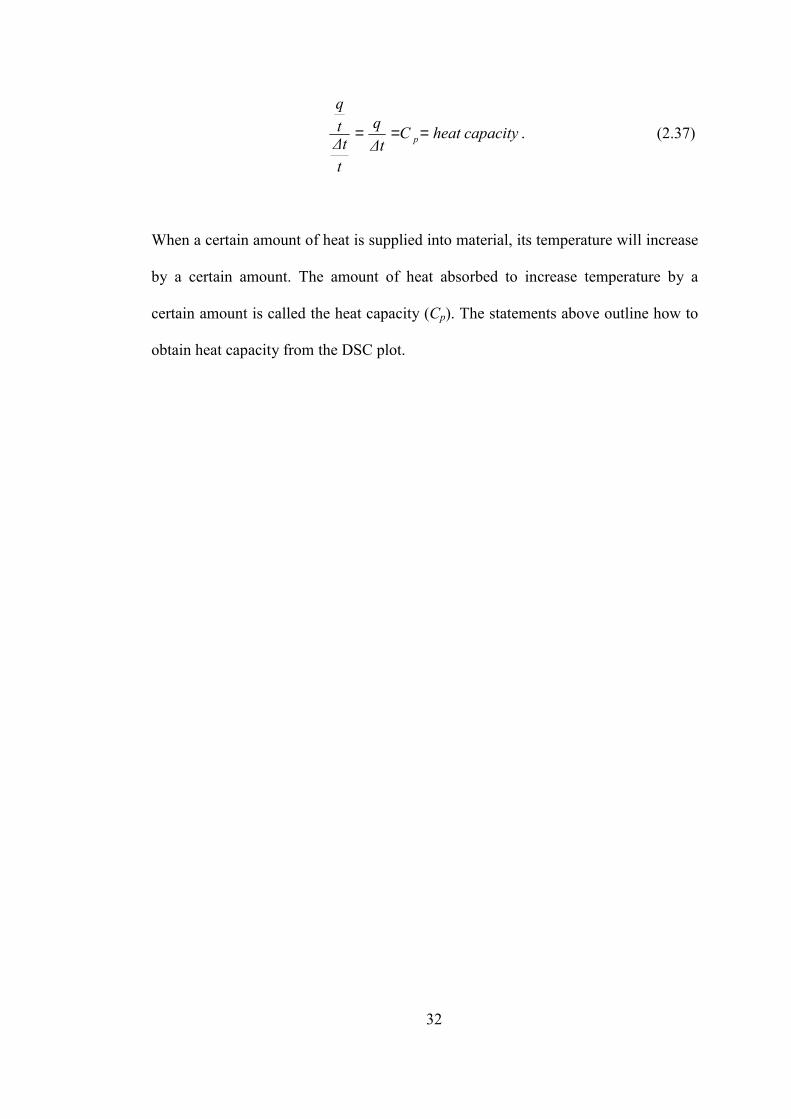
Figure 3.9 presents the temperature dependence of the C-band half-width W, which
appears to follow the CC model equation [54]
W = Wo [coth (hνe / 2kT )]1/2 , (3.4 )
where Wo is a constant, whose value is equal to W as the temperature approaches 0
K, and hνe is the energy of the vibrational mode of the excited state. The half-width
measurements were not performed above 115 K, because of the reduced PL intensity.
However, the changes in the half-width between 15 and 115 K are large enough to
show the functional dependence of Eq. (3.4). The solid line in Fig. 3.9 is a plot of Eq.
(3.4) with parameters Wo = 0.071 eV and hνe = 0.011 eV.

46
20 40 60 80 100 120
1.125
1.130
1.135
1.140
Pea
k E
nerg
y (e
V)
Temperature (K)
Fig.3.8: Temperature dependence of the emission band peak energy for TlGaS2
crystal. The dotted line is only guide for the eye.
The fact that the excited state vibrational energy (hνe) is lower than the LO phonon
energy of 0.039 eV (315 cm-1), measured by IR reflection [59], shows the localized
nature of the centers and the validity of applying the CC model [52].
Figure 3.10 shows the CC model for the TlGaS2. Following the p-GaAs [52] and
p-GaSe [53] works, let us assume that, the ground state of the localized center is
derived from an acceptor level a3, the excited state originates from a sulphur vacancy
donor level d3, and the zero point of both states lie within the band gap. Actually, in
compound semiconductors a deviation from stoichiometry generates donors for the
case of anion vacancy [55].
47
4 6 8 10 12
0.07
0.08
0.09
0.10
0.11
Experiment Fit
Hal
f-w
idth
(eV
)
T1/2 (K1/2)
Fig.3.9: Variation of the half-width with square root of temperature for TlGaS2
crystal emission band. The solid curve is a plot of Eqn. (3.4) with hνe = 0.011 eV.
The acceptor level a3 above the top of the valence band may be linked, as in GaSe [56],
to the defects and stacking faults, which are due to the weak interlayer interactions in
the studied crystals. Electron transitions from the excited state of the donor level to the
ground state of the acceptor level gives rise to the PL with emitted photon energy Eems.
Also, according to the CC model, when the ground-state vibrational energy is larger
than the excited-state vibrational energy, the peak shift of the emission band with
temperature is opposite to the band gap energy shift [52].

48
Fig.3.10: Band model (a) and configurational coordinate (CC) model (b) of TlGaS2
crystal at T = 15 K.
In terms of the CC model, the observed quenching of the C-band in the PL spectra
with increasing temperature (Figs. 3.4 and 3.5) is due to an increased electron
population of the excited state at higher displacement coordinates. These electrons then
return to the ground state through nonradiative recombination. Thus, the activation
energy ∆E = 0.035 eV, obtained from the thermal quenching of the PL , is the
difference in the energies of the lowest excited state and the intersection point of the
excited and the ground state CC curves (Fig.3.10).

49
3.3 Results of XRD Measurements
X-ray powder diffraction measurements were carried out to identify the structural
features of TlInS2 and TlGaS2 samples. CuKα radiation (λ = 1.540598 Ao) was used
in the scan range of 2θ = 5-80o. In order to analyze the diffraction data, we have used
CRYSFIRE Powder Indexing System. Analyzing the diffraction data means indexing
the diffraction peaks (finding the Miller indices of the diffraction planes) and
determining the crystal system and the lattice parameters.
CRYSFIRE: It is a system of programs. Its function is to provide a set of tools to
assist in the preparation and enhancement of powder diffraction data for indexing. In
particular, it acts as an expert system to allow relatively fast indexing to be carried
out by a non-specialist.
When an indexing command is activated, control passes to the accessory scripts, to
run a sequence of programs carrying out indexing. The program displays the most
proper results, and finally returns to CFmain (CRYSFIRE main prompt) and the
CRYSFIRE command prompt.
There are 11 different programs inside CRYSFIRE packet. Each of them has
individual role of use. These are Ito, Dicvol, Treor, Taup, Kohl, Fjzn6, Lzon, Losh,
Mmap, and ClePage.
• For high symmetry systems as cubic, tetragonal, and hexagonal Taup and
Dicvol91 appear to be suitable.
• Other moderately fast programs applicable for any crystal system are the
index-space programs Kohl and Treor90
50
• For low symmetry cells down to monoclinic, the Dicvol91 low symmetry
mode 2 is efficient, but it does not allow any impurity lines.
• Most of these indexing programs require at least 20 diffraction peaks.
To obtain acceptable results, the data quality is the most significant point. All the
precautions should be taken to produce accurate diffraction data. Before we analyze
our data, we applied the programs using the data of some well known structures,
taken from JCPDS files, to make sure that the program leads to the expected results.
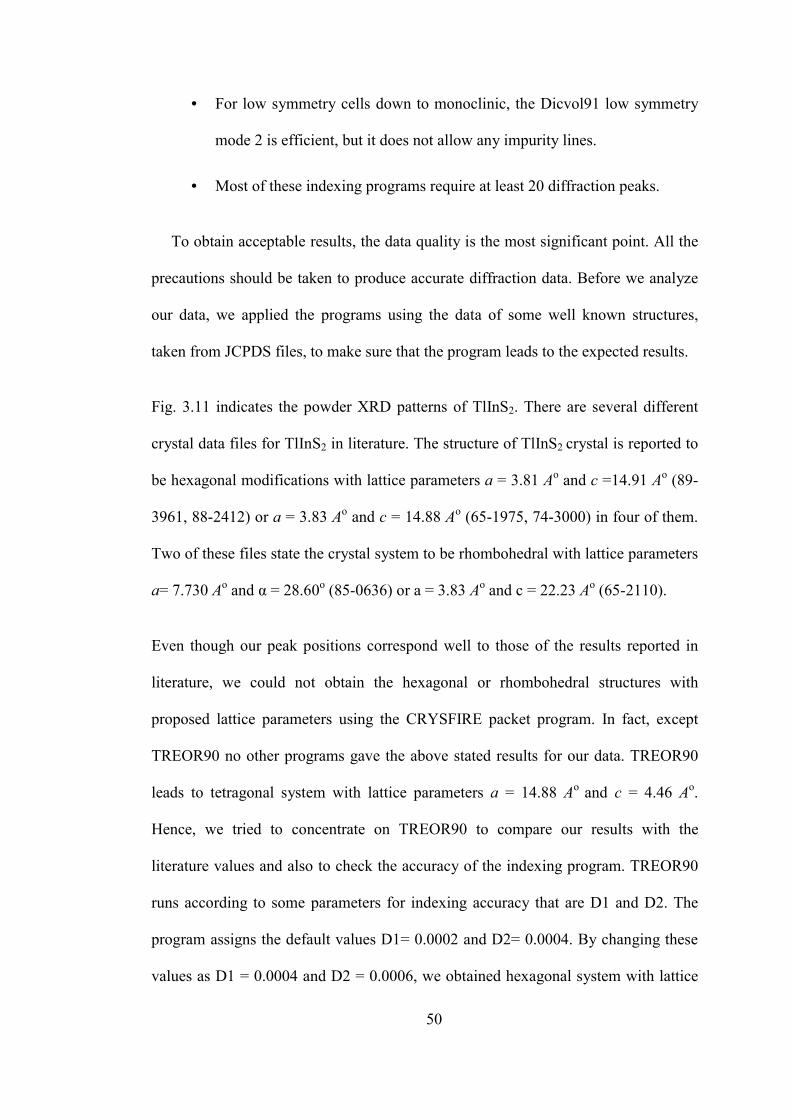
Fig. 3.11 indicates the powder XRD patterns of TlInS2. There are several different
crystal data files for TlInS2 in literature. The structure of TlInS2 crystal is reported to
be hexagonal modifications with lattice parameters a = 3.81 Ao and c =14.91 Ao (89-
3961, 88-2412) or a = 3.83 Ao and c = 14.88 Ao (65-1975, 74-3000) in four of them.
Two of these files state the crystal system to be rhombohedral with lattice parameters
a= 7.730 Ao and α = 28.60o (85-0636) or a = 3.83 Ao and c = 22.23 Ao (65-2110).
Even though our peak positions correspond well to those of the results reported in
literature, we could not obtain the hexagonal or rhombohedral structures with
proposed lattice parameters using the CRYSFIRE packet program. In fact, except
TREOR90 no other programs gave the above stated results for our data. TREOR90
leads to tetragonal system with lattice parameters a = 14.88 Ao and c = 4.46 Ao.
Hence, we tried to concentrate on TREOR90 to compare our results with the
literature values and also to check the accuracy of the indexing program. TREOR90
runs according to some parameters for indexing accuracy that are D1 and D2. The
program assigns the default values D1= 0.0002 and D2= 0.0004. By changing these
values as D1 = 0.0004 and D2 = 0.0006, we obtained hexagonal system with lattice

51
parameters a = 3.83 Ao and c = 14.88 Ao, that is, the proposed structure and lattice
parameters given in the powder diffraction data file numbers 65-1975 and 74-3000
for TlInS2. This coherence between our result and the results in the files 65-1975 and
74-3000 help us to choose efficient parameters for the TREOR90 program.
For TlGaS2, we could not find any diffraction data file in the softwares. There is only
one set of reference data given by Hahn et al. [22]. They state the structure to be
monoclinic with lattice parameters a = 10.31, b = 10.43 and c = 15.07 Ao with β =
99.60o.
We have obtained the diffraction pattern of TlGaS2 as shown in Fig. 3.12. For this
pattern, the result obtained from the TREOR90 program was monoclinic with lattice
parameters a = 9.62, b = 4.01, and c = 7.52 Ao with β = 96.30o. At first glance, these
values do not agree with Hahn’s results. However, we have noticed that Hahn’s a and
b parameters are very close to the diagonal of the present a and b values. Also twice
of our c value is nearly equal to Hahn’s c value. The relative intensities, 2θ and d
values, corresponding Miller indices, and the lattice parameters of observed
reflections of TlGaS2 are given in Table 3.1. Based on the available programs and
their outputs with our data (2θ values) we propose the indexing presented in Table
3.1 to represent the best and relevant indexing for TlGaS2.

52
0 10 20 30 40 50 60 70 80
0
1000
2000
3000
4000
5000
In
tens
ity (a
.u.)
2 Theta (degrees)
Fig.3.11: X-ray powder diffraction pattern of TlInS2.

53
20 30 40 50 60 70 80
0
2000
4000
6000
8000
10000
12000
14000
In
tens
ity (a
.u.)
2 theta (degrees)
Fig.3.12: X-ray powder diffraction pattern of TlGaS2.

54
Table 3.1: The TREOR90 outputs from the x-ray diffraction measurements of TlGaS2.
System: Monoclinic Unit cell volume = 288.49 A3 a = 9.62 Ao b = 4.01 Ao c = 7.52 Ao β = 96.30o.
h k l No. 2Theta (in deg.)
d-Value Intensity I/Io
0 0 2 -1 0 2 1 1 1 -2 0 2 2 1 1 3 1 0 -2 1 2 2 1 2 -1 0 4 -4 0 3 -1 2 2 -2 1 4 -6 0 2 -7 0 2
1 2 3 4 5 6 7 8 9 10 11 12 13 14
23.800 24.580 27.340 28.630 32.190 35.950 36.480 39.240 48.560 49.870 52.090 55.670 60.550 70.720
3.7354 3.6186 3.2592 3.1153 2.7784 2.4959 2.4609 2.2939 1.8732 1.8270 1.7543 1.6496 1.5278 1.3310
100 10 3 5 28 17 5 5 13 7 8 10 4 8

55
3.4 Temperature Dependent XRD Measurements
Temperature dependent x-ray diffraction is one of the most powerful analytical
methods to study the phase transitions during temperature treatments of a sample.
The combination of a reliable, fast, temperature monitoring and control with the
capability of recording a wide 2θ range opens new analytical possibilities for
laboratory XRD experiments.
Sheleg et al. [57] reported some extra low intensity diffraction peaks of TlInS2 in
the 2θ range of 40-45o. The extra peaks symmetrically located on the right and left of
the main peak near 2θ = 44.4o. They interpreted these extra peaks to be associated to
a so-called commensurate and incommensurate phase transitions. The lattice
demonstrates additional symmetry with repeat distances related to the original lattice
parameters. This additional symmetry is labeled as “super periodicity”. We were
interested to see if our sample would show evidences for such a phase transitions.
For this reason we have carried out powder diffraction measurements at low
temperatures.
Figures 3.13, 3.14 and 3.15 show the diffraction patterns of TlInS2 at different
temperatures from 80 to 250 K. Examination of these patterns indicates that our
sample do not go through a phase transition at low temperatures as reported in [57].
The differences of the growth conditions and amounts of impurities may be effective
for the occurrence of the transitions at low temperatures.

56
215 K
0
100
200
300
400
500
600
700
800
40 40.5 41 41.5 42 42.5 43 43.5 44 44.5 45
213 K
0
100
200
300
400
500
600
700
40 40.5 41 41.5 42 42.5 43 43.5 44 44.5 45
200 K
0
100
200
300
400
500
600
40 40.5 41 41.5 42 42.5 43 43.5 44 44.5 45
Fig. 3.13: Fragments of diffraction patterns of the TlInS2 crystal at various sample temperatures T, 215, 213, and 200 K, from top to down.
2 theta (degrees)
2 theta (degrees)
2 theta (degrees)
I nt ensity
I nt ensity
I nt ensity

57
200 K
0
100
200
300
400
500
600
40 40.5 41 41.5 42 42.5 43 43.5 44 44.5 45
193 K
0
100
200
300
400
500
600
700
800
40 40.5 41 41.5 42 42.5 43 43.5 44 44.5 45
Fig.3.14: Fragments of diffraction patterns of the TlInS2 crystal at various sample temperatures T, 200, 195, and 193 K, from top to down.
195 K
0
100
200
300
400
500
600
700
40 40.5 41 41.5 42 42.5 43 43.5 44 44.5 45
2 theta (degrees)
2 theta (degrees)
2 theta (degrees)
I nt ensity
I nt ensity
I nt ensity

58
250 K
0
100
200
300
400
500
600
40 40.5 41 41.5 42 42.5 43 43.5 44 44.5 45
83 K
0
100
200
300
400
500
600
700
800
40 40.5 41 41.5 42 42.5 43 43.5 44 44.5 45
Fig. 3.15: Fragments of diffraction patterns of the TlInS2 crystal at two sample temperatures T, 250, and 83 K, from top to down.
2 theta (degrees)
2 theta (degrees)
I nt ensity
I nt ensity

59
3.5 Results of DSC Measurements
This section deals with the specific heat capacities of TlInS2 and TlGaS2 crystals
obtained by Differential Scanning Calorimetry (DSC) method at low temperatures.
For these measurements, we used DSC 2010 equipment from TA Company
instruments. DSC 2010 is advanced equipment providing a fundamentally more
accurate way of measuring heat flow. It supplies information for the direct
measurement of the heat capacity. DSC 2010 has the reference and sample cells
made of platinum-iridium alloy. These cells with a thermometer and a heater are
mounted in an aluminum heat sink kept nearly at the temperature of the cooling bath.
The heat sink is cooled with liquid nitrogen. The level of liquid nitrogen is kept
constant during the DSC measurements. In order to purge the system, helium gas is
constantly passed through the heat sink and over the cells. The sample and reference
pans are covered with an aluminum foil. Pan and the covers are folded up with a
special tool. In this mechanism, the folded up sample pan is placed in one cell, and
the folded up empty pan is placed in the other cell. After calibration for temperatures
and calorimetric sensitivity of the DSC equipment, the optimum heating rate was
determined to be 10 K per min. The raw DSC curves of TlInS2, TlGaS2 and baseline
are shown in Fig.3.16 in the temperature range 140 to 300 K.
In the calculation process, we have used a formula suitable for calculating heat
capacity using the data of our apparatus
m∆H
Hr60.EC p
= (3.5)
where
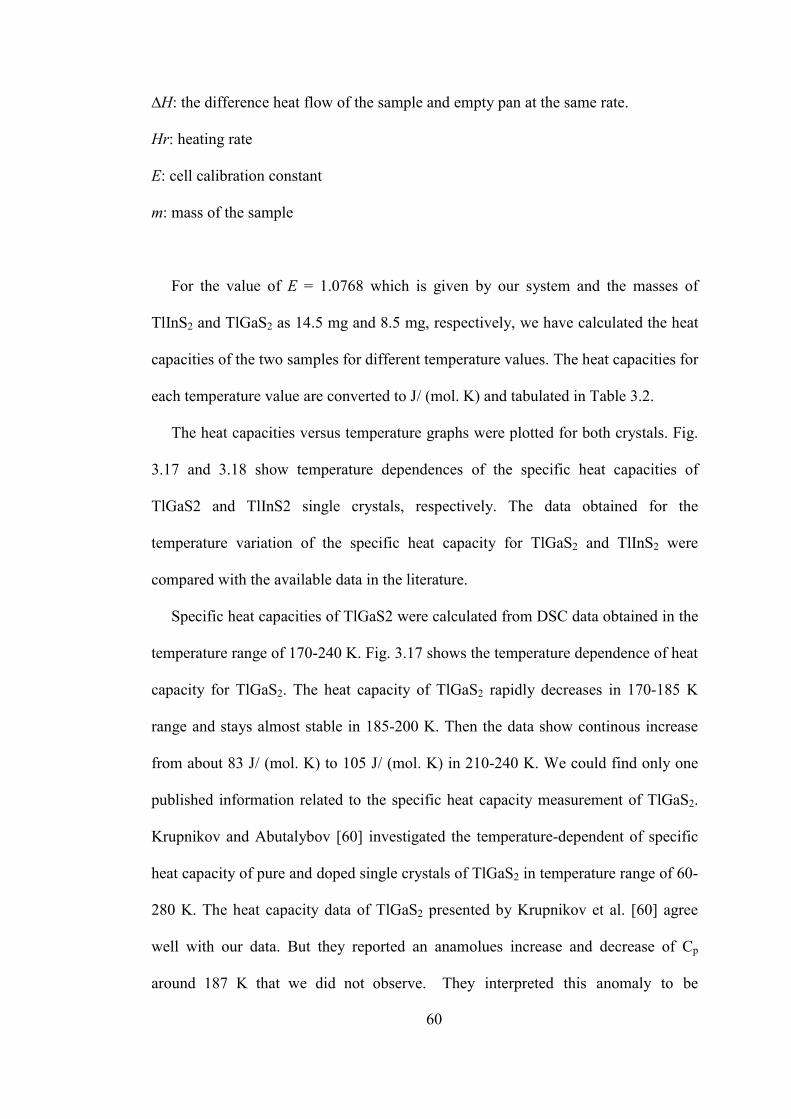
60
∆H: the difference heat flow of the sample and empty pan at the same rate.
Hr: heating rate
E: cell calibration constant
m: mass of the sample
For the value of E = 1.0768 which is given by our system and the masses of
TlInS2 and TlGaS2 as 14.5 mg and 8.5 mg, respectively, we have calculated the heat
capacities of the two samples for different temperature values. The heat capacities for
each temperature value are converted to J/ (mol. K) and tabulated in Table 3.2.
The heat capacities versus temperature graphs were plotted for both crystals. Fig.
3.17 and 3.18 show temperature dependences of the specific heat capacities of
TlGaS2 and TlInS2 single crystals, respectively. The data obtained for the
temperature variation of the specific heat capacity for TlGaS2 and TlInS2 were
compared with the available data in the literature.
Specific heat capacities of TlGaS2 were calculated from DSC data obtained in the
temperature range of 170-240 K. Fig. 3.17 shows the temperature dependence of heat
capacity for TlGaS2. The heat capacity of TlGaS2 rapidly decreases in 170-185 K
range and stays almost stable in 185-200 K. Then the data show continous increase
from about 83 J/ (mol. K) to 105 J/ (mol. K) in 210-240 K. We could find only one
published information related to the specific heat capacity measurement of TlGaS2.
Krupnikov and Abutalybov [60] investigated the temperature-dependent of specific
heat capacity of pure and doped single crystals of TlGaS2 in temperature range of 60-
280 K. The heat capacity data of TlGaS2 presented by Krupnikov et al. [60] agree
well with our data. But they reported an anamolues increase and decrease of Cp
around 187 K that we did not observe. They interpreted this anomaly to be

61
related to phase transition at this temperature.
Fig. 3.18 shows the temperature dependence of heat capacity of TlInS2 that we
have obtained from the DSC data. The heat capacity of TlInS2 decreases rather
rapidly with temperature from 170 K up to about 200 K. Then, the graph shows
decrease with temperature at a slower rate. The data demonstrate some small
fluctuations. There are only two reports in the literature about the heat capacity of
TlInS2. There are reasonable agreements about the temperature dependence of our
data and those of the references [23, 24]. Aldzhanow et al. [23] determined one of
them. Cp values and that reported in Ref. [23] fluctuate between 185 and 230 K, but
the degree of fluctuation is high in Ref. [23]. The authors of Ref. [24] revealed
additional anomalues variations of Cp (T) in the range 196.9-214.9 K that we did not
observe.

62
160 200 240 280
-0.6
-0.4
-0.2
0.0
0.2
0.4
Temperature (K)
3
2
1
Hea
t Flo
w (m
W)
Fig. 3.16: DSC curves of 1-baseline, 2-TlInS2, and 3-TlGaS2

63
170 180 190 200 210 220 230 24080
85
90
95
100
105
110
Cp (
J/m
ol.K
)
Temperature (K)
Fig. 3.17: Temperature dependence of the specific heat of TlGaS2 single crystal determined in the range 170-240 K.

64
170 180 190 200 210 220 230 240 25060
80
100
120
140
160
Cp (
J/m
ol.K
)
Temperature (K)
Fig. 3.18: Temperature dependence of the specific heat of TlInS2 single crystal determined in the range 170-250 K.

65
Table 3.2: Calculated heat capacities of TlInS2 and TlGaS2 at various temperatures TlInS2
TlGaS2
T, K
Cp, J/K.mol
T, K
Cp, J/K.mol
170.59 177.28 183.72 185.13 187.34 193.49 197.4 201.46 206.5 210.6 212.66 215.61 222.33 225.12 227.53 228.67 235.38 236.98 237.65 238.78 241.11
126.63923 114.28418 106.03393 103.67672 103.18902 95.03225 95.88979 91.07376 92.27269 87.51356 90.30157 88.39548 88.37516 91.09815 88.38735 88.52553 88.54992 86.23741 85.94886 87.90372 87.84275
170.59 177.28 183.72 185.13 187.34 193.49 197.4 201.46 206.5 210.6 212.66 215.61 222.33 225.12 227.53 228.67 235.38 236.98 237.65 238.78 241.11
89.59988 87.41081 84.30963 83.45832 83.51913 82.98098 83.65291 83.15124 84.99067 84.59238 87.13414 87.07637 91.95617 94.93574 95.18809 97.02448 100.26552 101.21108 101.78571 103.94742 105.14836

66
CHAPTER 4
CONCLUSION
A wide variety of ternary layered semiconductors receives much attention due to
their optical and electrical features as possible light emitters in optoelectronic device
applications from ultraviolet to infrared. The presence of three different chemical
compounds allows the gathering of several significant properties. Therefore, the
physicochemical properties of ternary compounds also have attracted a valuable
attention in addition to fundamental and technological interest. In view of its possible
applications in optoelectronic devices, a great deal attention has been devoted to the
study of the optical and electrical properties of TlGaS2. In this concern, detailed
information about the properties of TlGaS2 is very useful for the fabrication of high
quality devices.
In the photoluminescence part of this work, we report the results of the PL
investigation of TlGaS2 single crystals in the 500-1400 nm wavelength and in the 15-
115 K temperature range. From the laser excitation intensity dependence and
temperature dependence of PL spectra, we obtained the following results for TlGaS2.
We observed three broad bands with an asymmetric Gaussian line shapes centered
at 568 nm (2.183 eV, A-Band), 718 nm (1.727 eV, B-Band), and 1102 nm (1.125 eV,
C-Band) in the PL spectrum. The emission band intensity, half width, and peak
position changed with respect to temperature. These features are typical of emission
bands, which are due to donor-acceptor pair transitions observed in ternary
semiconductors. The A- and B- bands were found to be due to radiative transitions
from the deep donor levels located at 0.362 eV (d1) and 0.738 eV (d2) below the

67
bottom of the conduction band to the shallow acceptors levels at 0.005 eV (a1) and
0.085 eV (a2) located above the top of the valence band, respectively. The presence
of these two acceptor levels explains the thermal quenching behavior of the A- and
B- bands in PL spectra of TlGaS2 crystal.
The peak energy of C-band does not change with increasing excitation laser
intensity. This result rules out the model of distant donor-acceptor pair (DAP)
recombination process where a shift toward higher energies are expected as the
excitation laser intensity is increased. In terms of the CC model, the observed
quenching of the C-band in the PL spectra with increasing temperature is due to an
increased electron population of the excited state at higher displacement coordinates.
Indexing studies and analysis using powder x-ray diffraction data showed that
TlInS2 has hexagonal system with lattice parameters a = 3.83 and c = 14.88 Ao.
TlGaS2 has monoclinic system with lattice parameters a = 9.62, b = 4.01, c = 7.52 Ao
and β = 96.30o. Diffraction measurements on our samples at low temperatures do not
show evidences for the occurrence of incommensurate phase transition in the range
of 200-214 K as pointed out by Sheleg et al. We propose that the growth conditions
and the amounts of impurities may be effective for the phase transitions of these
crystals at low temperatures.
Finally, specific heat capacity measurements have been carried out for TlInS2 and
TlGaS2 using Differential Scanning Calorimetry (DSC) method. Specific heat
capacities of these crystals have not been investigated by DSC method before. The
Cp (T) data obtained for TlGaS2 and TlInS2 agree reasonably well with the available
data in the literature with some deviations at low temperatures. The results of these
measurements showed that we can use DSC method to determine the specific heat
capacities of chalcogenides.

68
REFERENCES
[1] L. I. Berger, Semiconductor Materials, CRC Press, Boca Raton, 1997. [2] G. G. Stokes, Philos. Trans. R., Soc. London A 142:463, 1852. [3] Klaus D. Mielenz, Optical radiation measurements: Measurement of Photoluminescence, p. iv, Academic Press, New York, 1982 [4] R. A. Stradling and P. C. Klippstein, Linhtowlers in Growth and
Characterization of Semiconductors, Bristol, 1990. [5] C. B. Collins, R. D. Carlson and C. J. Gallagher, Phys. Rev., 105:1168, 1957. [6] K. A. Yee and A. Albright, J. Am. Chem. Soc., 113:6474, 1991. [7] A. G. Kyazmazade, R. N. Mekhtieva, and A. A. Akhmedov, Sov. Phys.
Semocond., 25:840, 1992. [8] S. K. Deb and A. Zunger (Ed), Proc. 7th Internat. Conf. Ternary and Multinary
Compounds, MRS, Pittsburgh, 1987. [9] S. I. Radautsan and Schwab (Ed), Proc. 7th Internat. Conf. Ternary and
Multinary Compounds, Stiintsa Press, Kishinev, 1992. [10] D. Muller and H. Z. Hahn, Anorg. Allg. Chem., 438:258, 1978. [11] N. M. Gasanly et al., Solid State Commun., 105:21, 1998. [12] M. P. Hanias, A. N. Anagnostopoulos, K. Kambas, and J. Spvridelis, Mat.
Res. Bull., 27:25, 1992. [13] N. Kalkan, J. A. Kalomiros, M. Hanias, and A. N. Anagnostopoulos, Solid
State Commun., 99:375, 1996. [14] B. Abay, H. S. Guder, H. Efeoglu, and Y. K. Yogurtcu, Solid State Solidi (b),
227:469, 2001. [15] K. Allakhverdiev, T. G. Mammedov, R. Suleymanov, and N. Z. Gasanov,
J.Phys.: Condens. Matter, 15:1291, 2003. [16] H. J. Song, S. H. Yun, and W. T. Kim, Solid State Commun., 94:225, 1995. [17] A. Kato, M. Nishigaki, N. Mammedov, M. Yamazaki, S. Abdullayeva, E.
69
Kerimova, H. Uchiki, and S. Lida, J. Phys. Chem. Sol., 64:1713, 2003. [18] N. S. Yuksek, N. M. Gasanly, and H. Ozkan, Semicond. Sci. Techol., 18:834,
2003. [19] N. M. Gasanly, A. F. Goncharov, N. N. Melnik, A. S. Ragimov, and V. I.
Tagirov, Phys. Stat. Solidi. (b), 116:427, 1983. [20] G. I. Abutalybov and E. Yu. Salaev, Sov. Phys. Solid State, 28:1231, 1986. [21] S. G. Abdullaeva, N. T. Mamedov, F. A. Mustafaev, and E.Yu. Salaev, Phys
Status Solidi. (a), 82:K75, 1984. [22] H. Hahn, B. Wellmann, Naturwissenschaften, 54:42, 1967. [23] M. A. Aldzhanov, N. G. Guseinov, and Z. N. Mamedov, Sov. Phys. Solid
State, 30:580, 1987. [24] K. K. Mamedov, A. M. Abdullaev, and E. M. Kerimova, Phys. Stat. Sol. (a),
94:115, 1986. [25] S. G. Abdullaeva, A. M. Abdullaev, K. K. Mamedov, and N. T. Mamedov,
Sov. Phys. Solid State, 26:618, 1984. [26] S. Wang, Fundamentals of Semiconductor Theory and Device Physics,
Prentice Hall, New Jersey, 1989. [27] E. S. Yang, Fundamentals of Semiconductor Devices, Mc Graw-Hill, New
York, 1988. [28] Yu. P. Gnatenko, I. A. Farina, R. V. Gamernik, V. S. Blashkiv, and A. S.
Krochuk, Semiconductors, 30:1027, 1996. [29] J. I. Pankove, Optical Processes in Semiconductors, p. 150, Prentice Hall, New Jersey, 1971. [30] R. B. Adler, Introduction to Semiconductor Physics, Wiley, New York, 1964. [31] K. Seeger, Semiconductor Physics, Springer-Verlag, New York, 1973. [32] B. Hendersen, Defects in Crystalline Solids, Crane, Russak, New York, 1972. [33] P. Y.Yu., M. Cardona, Fundamentals of Semiconductors, p. 344, Springer, Berlin, 1995. [34] B. Hendersen and A. E. Hughes, Defects and Their Structure in Nonmetallic
Solids, Plenum Press, New York, 1976.

70
[35] H. W. Leverenz, An Introduction to Luminescence of Solids, RCA
Laboratories Princeton, N. J., 1968. [36] Klaus D. Mielenz, Optical radiation measurements: Measurement of Photoluminescence, p. iv, Academic Press, New York, 1982. [37] T. Schmidth, K. Lischka, and W. Zulehner, Phys. Rev., B45:8989, 1992. [38] P. J. Dean, Prog. Cryst. Growth Charact. 5:89, 1982. [39] T. Taguchi, J. Shirafuji and Y. Inuishi, Phys. Status Solidi B 68:727, 1975. [40] D. E. Cooper, J. Bajaj and P. R. Newmann, J. Cryst. Growth, 86:544, 1988. [41] Z. C. Feng, A. Mascarenhas and W. J. Choyke, J. Lumin. 35:329, 1986. [42] Q. Kim and D. W. Langer, Phys. Status Solidi B, 122, 263, 1984. [43] A. G. Milnes, Deep Impurities in Semiconductors, p. vii, John Wiley and Sons, New York, 1973. [44] E. W. Nuffield, X-ray Diffraction Methods, John Wiley & Sons, Inc., 1966. [45] B. D. Cullity, Elements of X-ray Diffraction, Addison-Wesley Publishing Company, Inc., 1967. [46] H.G. Kim, K. H. Park, B.N. Park, H.J. Lim, S. K. Min, H. L. Park and W. T. Kim, Jap. J. Appl. Phys., Suppl. No. 3, 32:476, 1993. [47] N. M. Gasanly, A. Aydinli, A. Bek, and I. Yilmaz, Solid State Commun.,
105:21, 1998. [48] J. Krustok, H. Collan , and K. Hjelt, J. Appl. Phys. 81:1442, 1997. [49] T. Schmidt, K. Lischka, and W. Zulehner, Phys. Rev., B 45:8989, 1992. [50] P.Y. Yu and M. Cardona, Fundamentals of Semiconductors, Springer, Berlin, 1995, p. 348. [51] J. Krustok, J.H. Schon, H. Collan, M. Yakushev, J. Mudasson, and E. Bucher, J. Appl. Phys., 86:364 1999. [52] C. J. Hwang, Phys. Rev., 180:827, 1969.
[53] S. Shigetomi, T. Ikari, and H. Nakashima, J. Appl. Phys., 74:4125, 1993. [54] R. K. Willardson, and A. C. Beer, Semiconductors and Semimetals, Academic Press, New York, vol. 8, 1972, p.374.

71
[55] J. I. Pankove, Optical Processes in Semiconductors, p. 150, Prentice Hall, New Jersey, 1971, p.150. [56] V. Capozzi, Phys. Rev., B28:46, 1983. [57] A. U. Sheleg, O. B. Plynshch, and V. A. Aliev, Sov. Phys. Solid State, 36:226, 1994. [58] M. P. Hanias, A. N. Anagnostopoulos, K. Kambas, and J. Spyridelis, Mat. Res.Bull., 27:25, 1992. [59] N. M. Gasanly, A. F. Goncharov, N. N. Melnik, A. S. Ragimov, and V. I.
Tagirov, Phys. Stat. Solidi (b) , 116:427, 1983. [60] E. S. Kuripnikov and G. I. Abutalybov, Sov. Phys. Solid State, 34:702, 1992.