
Temperature Dependence of the Frequency of … · 10/11/2008 · The mean DCC frequency sensitivity...
38
H. H. Aumann Temperature Dependence of the Frequency of Severe Storms Hartmut Aumann and Joao Teixeira California Institute of Technology Jet Propulsion Laboratory 14 September 2008
Transcript of Temperature Dependence of the Frequency of … · 10/11/2008 · The mean DCC frequency sensitivity...

H. H. Aumann
Temperature Dependence of the Frequency of Severe Storms
Hartmut Aumann and Joao Teixeira
California Institute of Technology Jet Propulsion Laboratory
14 September 2008

H. H. Aumann
We use 5 years of AIRS data to determine how Nature responds to global warming with a change in convective activity, i.e.
we derive a sensitivity equation which relates the frequency of deep convective clouds to the mean zonal surface temperature.
This results in a scaling equation, which can be used to test climate models.
GRL doi:10.1029/2008GL034562 GRL doi:10.1029/2006GL029191

H. H. Aumann
Source of of the data
Deep Convective Clouds (DCC)
Frequency of DCC and mean surface temperature
DCC and Global Warming
Precipitation and DCC
Conclusion
Outline

H. H. Aumann
AIRS/AMSU/HSB
Latest Prediction: 12 year life = year 2014

H. H. Aumann
Source of of the data
Deep Convective Clouds (DCC)
Frequency of DCC and mean surface temperature
DCC and Global Warming
Precipitation and DCC
Conclusion
Outline

H. H. Aumann
DCC were discovered using GOES data. Reynolds (1986) and Purdom (1991) correlated DCC with severe storms and extreme precipitation
H. H. Aumann
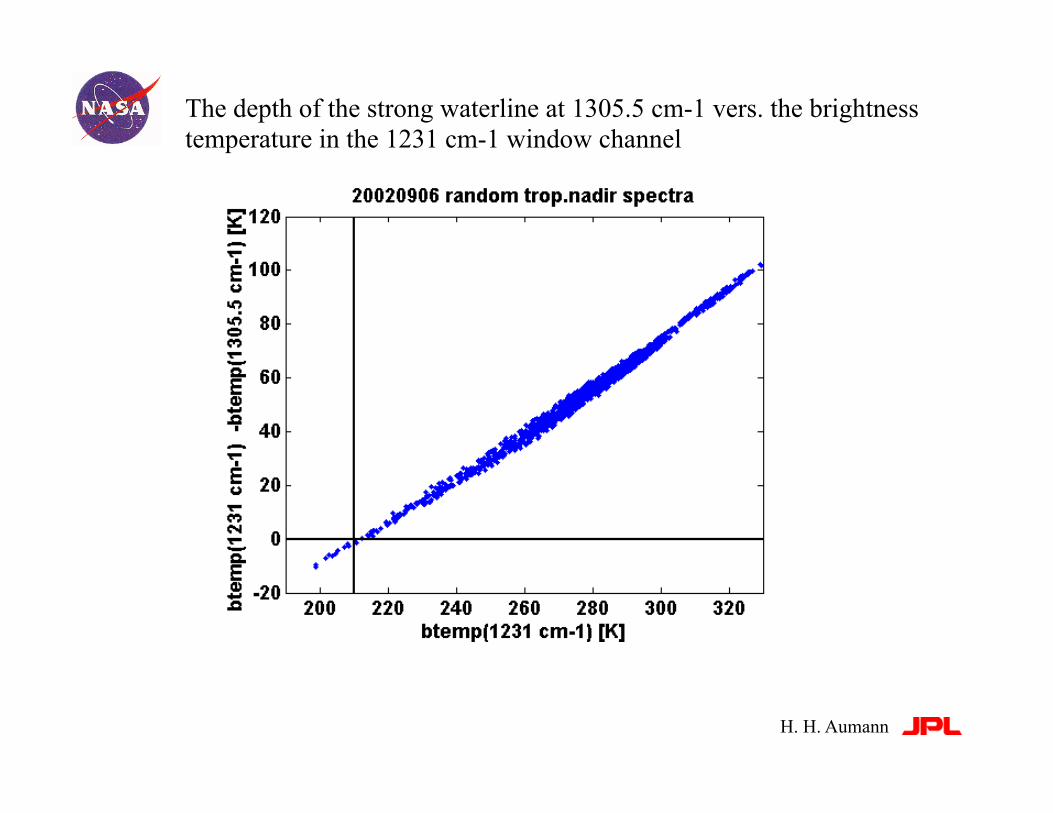
The depth of the strong waterline at 1305.5 cm-1 vers. the brightness temperature in the 1231 cm-1 window channel

H. H. Aumann
We define a DCC as any spectrum where bt1231-bt1305<0 at the tropical latitudes. This is equivalent to bt1231<210 K.

H. H. Aumann
DCC on 20050819 during the 1:30 PM orbits.

H. H. Aumann
Source of of the data
Deep Convective Clouds (DCC)
Frequency of DCC and mean surface temperature
DCC and Global Warming
Precipitation and DCC
Conclusion
Outline

H. H. Aumann
DCC count is highly correlated with the mean zonal SST
Zonal mean TSurf
For night 0-30N the correlation is 0.62
Aumann et al. 2007 GRL
DCC count

H. H. Aumann
We use the seasonal change in the temperature of the ocean as a free large scale experiment to evaluate how Nature responds to a change in surface temperature with a change in the frequency of DCC

H. H. Aumann
We analyze the data in terms of the DCC frequency, i.e. the DCC count divided by the number available spectra.
The DCC frequency for the tropical oceans is approximately 1% for the 1:30 pm EOS Aqua orbit.
The IASI DCC frequency (9:30 am orbit) is also about 1%.
IASI is consistent with AIRS. There is very little day/night variability in strong convection in the tropical oceans.

H. H. Aumann
DCC frequency correlation with TSurf results in a DCC frequency sensitivity of 48%/K
Aumann, Ruzmaikin and Teixeira GRL doi:10.1029/2008GL034562
H. H. Aumann
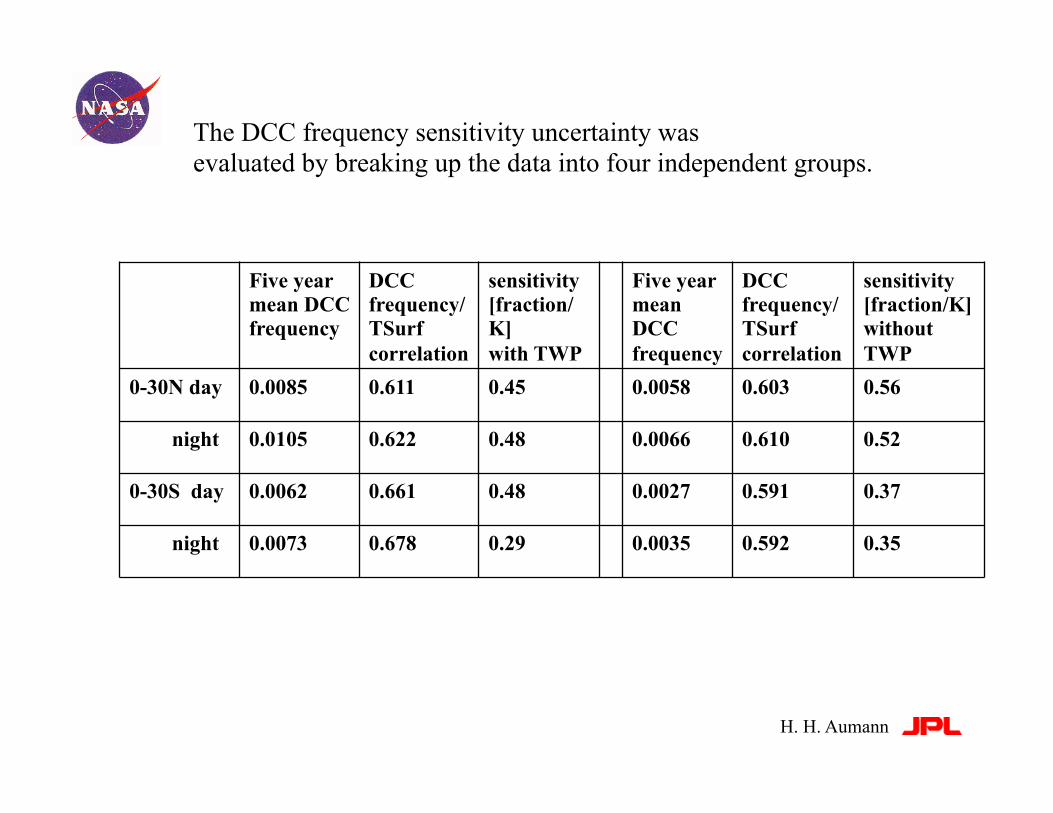
The DCC frequency sensitivity uncertainty was evaluated by breaking up the data into four independent groups.
Five year mean DCC frequency
DCC frequency/ TSurf correlation
sensitivity [fraction/K] with TWP
Five year mean DCC frequency
DCC frequency/ TSurf correlation
sensitivity [fraction/K] without TWP
0-30N day 0.0085 0.611 0.45 0.0058 0.603 0.56
night 0.0105 0.622 0.48 0.0066 0.610 0.52
0-30S day 0.0062 0.661 0.48 0.0027 0.591 0.37
night 0.0073 0.678 0.29 0.0035 0.592 0.35

H. H. Aumann
DCC is a process which occurs with a frequency which is a function of the mean zonal surface temperature.
Nature responds to a increase in the surface temperature by increasing the DCC frequency by 45%/K .

H. H. Aumann
Source of of the data
Deep Convective Clouds (DCC)
Frequency of DCC and mean surface temperature
DCC and Global Warming
Precipitation and DCC
Conclusion
Outline

H. H. Aumann
On a 100 year scale the temperature in the tropical zone has increased at the rate of 0.13 K/decade

H. H. Aumann
The mean DCC frequency sensitivity is (+45±15) %/K
50 year trend in global warming is +0.13 K/decade
Combine the two equations to predict the increase in DCC frequency
(+45±15) %/K * 0.13K/decade = (+6±1.5) %/decade
The frequency of severe storms increased with global warming at the rate of 6%/decade.
Expected changes with global warming

H. H. Aumann
Source of of the data
Deep Convective Clouds (DCC)
Frequency of DCC and mean surface temperature
DCC and Global Warming
Precipitation and DCC
Conclusion
Outline

H. H. Aumann
AMSRE on the EOS Aqua spacecraft measure rain rate.
Mean tropical ocean rain rate: 0.12 mm/hr
The rain rate at the DCC identified by AIRS is obtained from AMSRE
DCC are correlated with the most intense rain events.
Mean Rain rate at AIRS DCC matchups with AMSRE: 3 mm/hr

H. H. Aumann
DCC cover about 1% of the tropical oceans.
DCC contribute 25% to the tropical ocean mean rainfall. (3 mm/hr * 0.01 area = 0.030 mm/hr compared to total of 0.12 mm/hr
A 6%/decade increase in the DCC frequency increases total precipitation from DCC alone from 0.030 mm/hr to 3 mm/hr * 0.01*1.06 = 0.032 mm/hr
The increase is 0.002 mm/hr per decade
0.002 mm/hr / 0.12 mm/hr mean = + 1.7%/decade.

H. H. Aumann
How does this compare to the Climate Models?

H. H. Aumann
Held, I.M. and B.J. Soden (2006) “Robust Responses of the Hydrological Cycle to Global Warming”, J.Climate, v.19, 5686-5699
“... the major Climate Models predicted
... 2%/K increase in precipitation
… with global warming

H. H. Aumann
On a 100 year scale the temperature in the tropical zone has increased at the rate of 0.13 K/decade
Data downloaded from http://data.giss.nasa.gov

H. H. Aumann
Held, I.M. and B.J. Soden (2006) “Robust Responses of the Hydrological Cycle to Global Warming”, J.Climate, v.19, 5686-5699
“... the major Climate Models predicted
... 2%/K increase in precipitation
… with global warming
2%/K * 0.13 K/decade = 0.3%/decade increase in precipitation with global warming

H. H. Aumann
The major Climate Models predicted an increase of 0.3%/decade increase in precipitation with global warming
DCC: +1.7%/decade increase precipitations.

H. H. Aumann
DCC: +1.7%/decade increase precipitations.
SSMI data: Wentz (2007): +1.5%/decade increase in precipitation.
The major Climate Models predicted an increase of 0.3%/decade increase in precipitation with global warming

H. H. Aumann
DCC: +1.7%/decade increase precipitations.
SSMI data: Wentz (2007): +1.5%/decade increase in precipitation.
The major Climate Models predicted an increase of 0.3%/decade increase in precipitation with global warming
The climate models respond to global warming with a factor of five less precipitation then is derived from two independent sets of observations

H. H. Aumann
Can the change in the DCC frequency or the rain rate be detected in the first 6 years of AIRS data?
H. H. Aumann
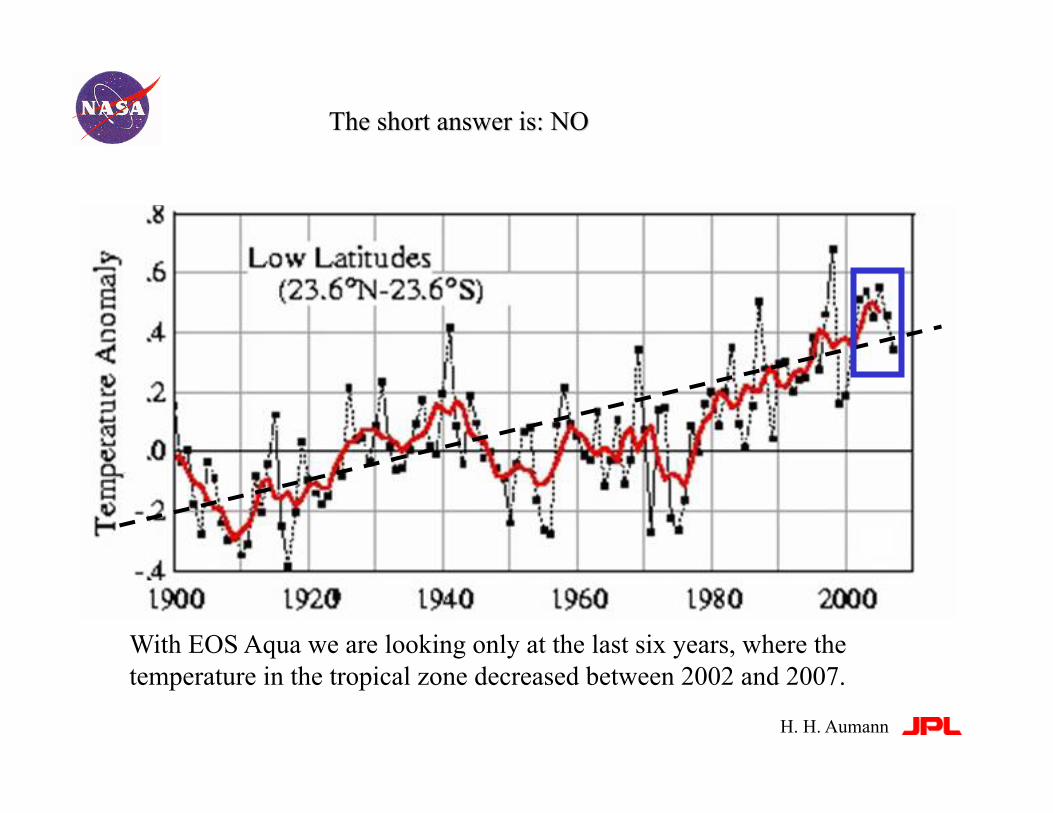
With EOS Aqua we are looking only at the last six years, where the temperature in the tropical zone decreased between 2002 and 2007.
H. H. Aumann

H. H. Aumann
Conclusions
The parametrization of Climate Models needs to be tuned to more closely emulate the way Nature respond to global warming.

H. H. Aumann
www.jpl.nasa.gov/airs

H. H. Aumann
DCC on 20050819 during the 1:30 AM orbits.
H. H. Aumann
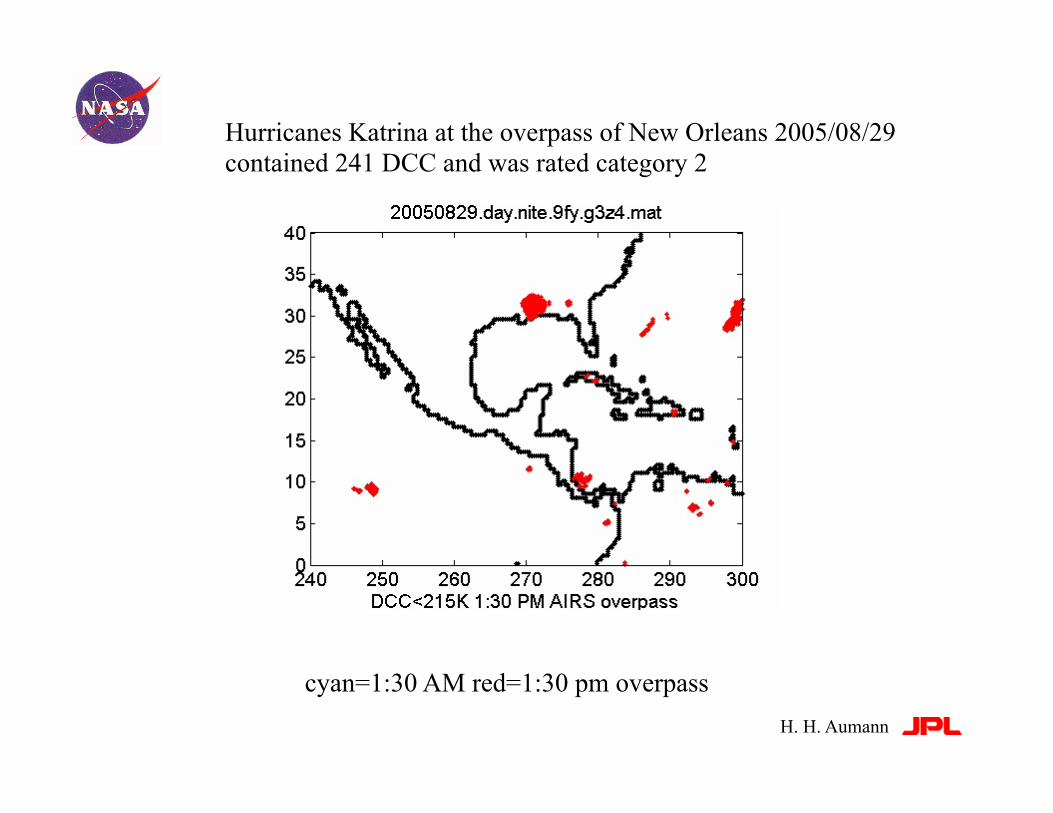
cyan=1:30 AM red=1:30 pm overpass
Hurricanes Katrina at the overpass of New Orleans 2005/08/29 contained 241 DCC and was rated category 2

H. H. Aumann
cyan=1:30 AM red=1:30 pm overpass
We zoom in on an AIRS data granule to see what Katrina looks like at 1231 cm-1

H. H. Aumann
Hurricane Katrina shortly after crossing into land contained 241 DCC
cyan=1:30 AM red=1:30 pm overpass
Hurricanes Katrina overpass of New Orleans 2005/08/29


![arXiv:1911.12039v1 [cs.SI] 27 Nov 2019 · 1.01 18.25 0.13 2.53 0.38 38.66 5.2 0.13 0.51 0.25 0.63 0.38 0.13 2.53 0.38 0.13 0.51 0.13 America Asia Europe Oceania e official politician](https://static.fdocuments.net/doc/165x107/60561aa2f1cec31da8515ff6/arxiv191112039v1-cssi-27-nov-2019-101-1825-013-253-038-3866-52-013.jpg)


![The Design Concept of K-band Frequency Triplerhome.agh.edu.pl/~rydosz/MIKON/P1.10.pdf · The Design Concept of K-band Frequency Tripler . ... WKŁ, Warszawa 1975. [4] M. T. Faber,](https://static.fdocuments.net/doc/165x107/5a79b8567f8b9afa378bfd38/the-design-concept-of-k-band-frequency-rydoszmikonp110pdfthe-design-concept.jpg)


