Temperature change in Canada
16
TEMPERATURE CHANGE IN CANADA CANADIAN ENVIRONMENTAL SUSTAINABILITY INDICATORS
Transcript of Temperature change in Canada

TEMPERATURE CHANGE IN CANADA CANADIAN ENVIRONMENTAL
SUSTAINABILITY INDICATORS

Temperature change in Canada Page 2 of 16
Suggested citation for this document: Environment and Climate Change Canada (2021) Canadian Environmental Sustainability Indicators: Temperature change in Canada. Consulted on Month day, year. Available at: www.canada.ca/en/environment-climate-change/services/environmental-indicators/temperature-change.html.
Cat. No.: En4-144/77-2021E-PDF
ISBN: 978-0-660-38602-7
Unless otherwise specified, you may not reproduce materials in this publication, in whole or in part, for the purposes of commercial redistribution without prior written permission from Environment and Climate Change Canada's copyright administrator. To obtain permission to reproduce Government of Canada materials for commercial purposes, apply for Crown Copyright Clearance by contacting:
Environment and Climate Change Canada Public Inquiries Centre 12th Floor Fontaine Building 200 Sacré-Coeur Blvd Gatineau QC K1A 0H3 Telephone: 1-800-668-6767 (in Canada only) or 819-938-3860 Fax: 819-938-3318
Email: [email protected]
Photos: © Environment and Climate Change Canada
© Her Majesty the Queen in Right of Canada, represented by the Minister of Environment and Climate Change,
2021
Aussi disponible en français

Canadian Environmental Sustainability Indicators Page 3 of 16
CANADIAN ENVIRONMENTAL
SUSTAINABILITY INDICATORS
TEMPERATURE CHANGE IN CANADA
May 2021
Table of contents
Temperature change in Canada ............................................................................................................ 5
Key results .................................................................................................................................... 5
Seasonal temperature change.............................................................................................................. 7
Key results .................................................................................................................................... 7
Regional temperature ......................................................................................................................... 8
Key results .................................................................................................................................... 8
About the indicators ............................................................................................................................ 9
What the indicators measure ............................................................................................................ 9
Why these indicators are important.................................................................................................... 9
Related indicators ........................................................................................................................... 9
Data sources and methods .................................................................................................................. 9
Data sources ................................................................................................................................. 9
Methods ...................................................................................................................................... 10
Recent changes ........................................................................................................................... 10
Caveats and limitations.................................................................................................................. 10
Resources ...................................................................................................................................... 10
References .................................................................................................................................. 10
Related information ....................................................................................................................... 11
Annex ............................................................................................................................................... 12
Annex A. Data tables for the figures presented in this document.............................................................. 12
Temperature change in Canada Page 4 of 16
List of Figures
Figure 1. Annual average temperature departures from the 1961 to 1990 reference value, Canada, 1948 to 2020 ............................................................................................................................................... 5
Figure 2. Seasonal average temperature departures compared with the 1961 to 1990 reference value, Canada, 1948 to 2020 ....................................................................................................................... 7
Figure 3. Regional average temperature departures from the 1961 to 1990 reference value, Canada, 2020 .... 8
List of Tables
Table A.1. Data for Figure 1. Annual average temperature departures from the 1961 to 1990 reference value, Canada, 1948 to 2020 ..................................................................................................................... 12
Table A.2. Data for Figure 2. Seasonal average temperature departures compared with the 1961 to 1990 reference value, Canada, 1948 to 2020 .............................................................................................. 13

Canadian Environmental Sustainability Indicators Page 5 of 16
Temperature change in Canada
Changes in climate variables such as temperature, precipitation and humidity affect a wide range of natural processes and human activities. For example, temperature change can influence crops, forests, infrastructure, the spread of disease, the availability of water and the health of ecosystems. Temperature is also a key indicator of how the climate is changing in response to human emissions of greenhouse gases (GHGs), as increasing GHG concentrations result in warming of the lower atmosphere. The indicators show the yearly and seasonal surface air temperature departures1 for the years 1948 to 2020.
Key results
In Canada, the national average temperature for the year 2020 was 1.1 degree Celsius (°C) above the 1961 to 1990 reference value
From 1948 to 2020, there is a trend in annual average temperature departures, showing 1.8°C of warming over that period
Annual average temperatures were consistently above or equal to the reference value from 1993 onward
Figure 1. Annual average temperature departures from the 1961 to 1990 reference value, Canada, 1948 to 2020
Data for Figure 1
Note: Departures are calculated by subtracting the 1961 to 1990 reference value from the annual average.
Source: Environment and Climate Change Canada (2021) Adjusted and homogenized Canadian climate data.
Six (6) of the 10 warmest years have occurred during the last 15 years, with 2010 being the record warmest (3.0 degrees Celsius [°C] above the 1961–1990 reference value). Canada's coldest year since 1948 occurred in 1972 at 2.0°C below the reference value.
The annual average temperature in Canada has increased at roughly twice the global mean rate. Patterns are different across regions of the country however. Temperatures have increased more in northern Canada than in
1 The temperature departure corresponds to the difference between the observed temperature values and a temperature reference value, also
called the "normal". The average of temperature annual values from 1961 to 1990 is commonly used as a baseline for comparing how
temperature for a given year departs from what could be referred as the "normal".

Temperature change in Canada Page 6 of 16
southern Canada. Annual mean temperature over northern Canada increased by roughly 3 times the global mean
warming rate.
The effects of widespread warming are evident in many parts of Canada and are projected to intensify in the future. In Canada, these effects include more extreme heat, less extreme cold, longer growing seasons, shorter snow and ice cover seasons, earlier spring peak streamflow, thinning glaciers, thawing permafrost, and rising sea
level. Because some further warming is unavoidable, these trends will continue (Bush and Lemmen, 2019).
The heat-trapping effect of atmospheric greenhouse gases is well-established. It is extremely likely that human activities, especially emissions of greenhouse gases, are the main cause of observed warming since the mid-20th century. Natural factors cannot explain this observed warming. Evidence is widespread of a human influence on many other changes in climate as well (Bush et al., 2019).

Canadian Environmental Sustainability Indicators Page 7 of 16
Seasonal temperature change
Key results
Like the national annual average temperature, seasonal average temperature increased over the 1948 to 2020 period. Warming trends were detected for:
o winter, with an increase of 3.3°C o spring, with an increase of 1.6°C o summer, with an increase of 1.5°C o autumn, with an increase of 1.6°C
The warmest winter and spring recorded were both in 2010.2 The warmest summer was in 2012, while the warmest autumn was in 1998
Figure 2. Seasonal average temperature departures compared with the 1961 to 1990 reference value, Canada, 1948 to 2020
Data for Figure 2
Note: Departures are calculated by subtracting the 1961 to 1990 reference value from the seasonal average. Seasons are defined as w inter
(December, January, and February), spring (March, April, and May), summer (June, July, and August) and autumn (September, October, and November).
Source: Environment and Climate Change Canada (2021) Adjusted and homogenized Canadian climate data.
2 Winter 2020 includes the months of December 2019, January 2020 and February 2020.

Temperature change in Canada Page 8 of 16
Regional temperature
Key results
In 2020,
Most of Canada experienced annual temperatures above the baseline average
Annual temperatures near the baseline average were observed in most of the Prairies, in southern Northwest Territories and in the centre of Yukon
Northeastern Nunavut, northwestern Quebec, southeastern Ontario and some parts of the Maritime provinces experienced temperatures notably above the 1961 to 1990 reference value
Figure 3. Regional average temperature departures from the 1961 to 1990 reference value, Canada, 2020
Note: 2020 annual average temperature departures were computed for 561 active weather stations across Canada. Departures are calculated
by subtracting the reference value from the annual average.
Source: Environment and Climate Change Canada (2021) Canadian gridded temperature and precipitation anomalies.

Canadian Environmental Sustainability Indicators Page 9 of 16
About the indicators
What the indicators measure
Indicators of Temperature change in Canada show the yearly and seasonal surface air temperature departures for the years 1948 to 2020. As well, they present a spatial distribution of surface air temperature departures for the
year 2020.
An annual departure (or anomaly) is the difference between the value for a given year and a baseline value. The baseline values used in these indicators are the annual and seasonal temperature averages for the reference period of 1961 to 1990 (often referred to as the 1961 to 1990 normal). This reference period is consistent with the approach used to compare anomalies in the Intergovernmental Panel on Climate Change Fifth Assessment Report and the World Meteorological Organization Annual Statements on the Status of the Global Climate. The temperature departures are measured in degrees Celsius (°C) and calculated using data from weather stations across Canada with sufficiently long data records to allow for a meaningful trend calculation.
Why these indicators are important
Much of the Canadian economic and social activity is climate dependent. Understanding how Canada's climate is changing is important for developing adaptive responses. The Temperature change in Canada indicators help show how Canada's surface air temperature has changed since nationwide recording of consistent and comparable climate observations began in 1948.
The Intergovernmental Panel on Climate Change and the United Nations Framework Convention on Climate Change uses surface air temperature, among other variables, to assess long-term changes in climate. Surface air temperature is considered by the World Meteorological Organization - Global Climate Observing System as an Essential Climate Variable.
Effective action on climate change
These indicators support the measurement of progress towards the following 2019 to 2022 Federal Sustainable Development Strategy long-term goal: A low-carbon economy contributes to limiting global average temperature rise to well below 2 degrees Celsius and supports efforts to limit the increase to 1.5 degrees Celsius.
Related indicators
The Precipitation change in Canada indicators present annual and seasonal precipitation departures.
The Sea ice in Canada indicators provide information on variability and trends in sea ice in Canada during the
summer season.
The Snow cover indicators provide information on spring snow cover extent and annual snow cover duration in
Canada.
Data sources and methods
Data sources
The Temperature change in Canada indicators are based on the Environment and Climate Change Canada's gridded temperature departures, or anomalies, data (Canadian gridded temperature and precipitation anomalies [CANGRD]), which in turn is based on the Adjusted and homogenized Canadian climate data for historical climate
observations and on near real-time data in the national climate archives for the current year.
More information
The indicators are calculated using data collected in weather stations across Canada for the period 1948 to 2020.

Temperature change in Canada Page 10 of 16
The dataset contains daily data from 780 weather stations: 508 active stations with long record (starting prior to 1990); 53 active stations with short record (starting in or after 1990); and 219 locations with no current observations (station closed) but with more than 30 years of data.
Methods
The seasonal and annual average temperature departures are computed at each observing station and for each season and year by subtracting the reference value (defined as the average over the 1961 to 1990 reference
period) from the relevant seasonal and annual values.
More information
The annual departure is the average of all monthly departures and the seasonal departure is the average of the monthly departures in the corresponding season.
Seasons are defined as winter (December of previous year, January and February), spring (March, April and May), summer (June, July and August) and autumn (September, October and November).
Temperature departures were computed for the 780 weather stations across Canada and were then applied to a grid with cells of 50 square kilometers. Temperature departures were assumed to be uniform and equal for a given cell. Values for each grid cell were averaged together to produce the annual and seasonal time series of temperature departures representing the entire country. Values for grid boxes over large bodies of water are excluded. More information about the calculation method for annual average temperature departures can be found in the Climate Trends and Variations Bulletin documentation.
Statistical linear trends at the 95% confidence level were obtained by using the Mann-Kendall and Sen's methods (Kendall-tau).
Recent changes
Third Generation of Homogenized Temperature datasets replaced the first and second generation datasets that were used in the previous versions of the Temperature change in Canada indicators.
The Third Generation of Homogenized Temperature dataset was prepared for use in climate trend analysis in Canada. In this version, the list of stations was revised to include observations from a larger number of surface monitoring stations, in particular those collected at Reference Climate Stations and at some Canadian Aviation Weather Services stations. The procedures used to produce the Third Generation are described in the publication A third generation of homogenized temperature for trend analysis and monitoring changes in Canada’s climate .
Caveats and limitations
Breaks in the data can be a concern. To mitigate this, the Temperature change in Canada indicators use homogenized and adjusted station data for temperature. Adjustments for data variations caused by changes in site exposure, location, instrumentation, observer and observing procedures over the 73-year reporting period were performed on the dataset. Observations from nearby co-located stations are sometimes merged to produce longer time series.
Resources
References
Bush E and Lemmen DS, editors (2019) Canada’s Changing Climate Report; Government of Canada, Ottawa,
ON. 444 p. Retrieved on February 25, 2021.
Bush E, Gillett N, Watson E, Fyfe J, Vogel F and Swart N (2019) Understanding Observed Global Climate Change; Chapter 2 in Canada’s Changing Climate Report, (ed.) E. Bush and D.S. Lemmen; Government of Canada, Ottawa, Ontario, p. 24–72. Retrieved on February 25, 2021.
Environment and Climate Change Canada (2021) Adjusted and Homogenized Canadian Climate Data. Retrieved on February 25, 2021.

Canadian Environmental Sustainability Indicators Page 11 of 16
Environment and Climate Change Canada (2021) Climate data: homogenized surface air temperature data.
Retrieved on February 25, 2021.
Environment and Climate Change Canada (2021) Climate Trends and Variations Bulletin: Annual for 2020.
Retrieved on February 25, 2021.
Environment and Climate Change Canada (2021) Climate Trends and Variations Bulletin. Retrieved on February
25, 2021.
Vincent LA, Hartwell MM, and Wang XL (2020) A third generation of homogenized temperature for trend analysis and monitoring changes in Canada’s climate. Atmosphere-Ocean. 58:3, 173-191. Retrieved on February 25, 2021.
Zhang X, Flato G, Kirchmeier-Young M, Vincent LA, Wan H, Wang XL, Rong R, Fyfe J, Li G and Kharin VV (2019) Changes in Temperature and Precipitation Across Canada; Chapter 4 in Bush E and Lemmen DS (Eds.)
Canada’s Changing Climate Report. Government of Canada, Ottawa, Ontario, pp 112-193. February 25, 2021.
Related information
Vincent LA, Wang XL, Milewska EJ, Wan H, Yang F and Swail V (2012) A second generation of homogenized Canadian monthly surface air temperature for climate trend analysis. Journal of Geophysical Research – Atmospheres 117 (D18):1–13.
Vincent LA, Zhang X, Brown R, Feng Y, Mekis E, Milewska EJ, Wan H and Wang XL (2015) Observed trends in Canada's climate and influence of low frequency variability modes. Journal of Climate 28 (11):4545–4560.
Temperature change in Canada Page 12 of 16
Annex
Annex A. Data tables for the figures presented in this document
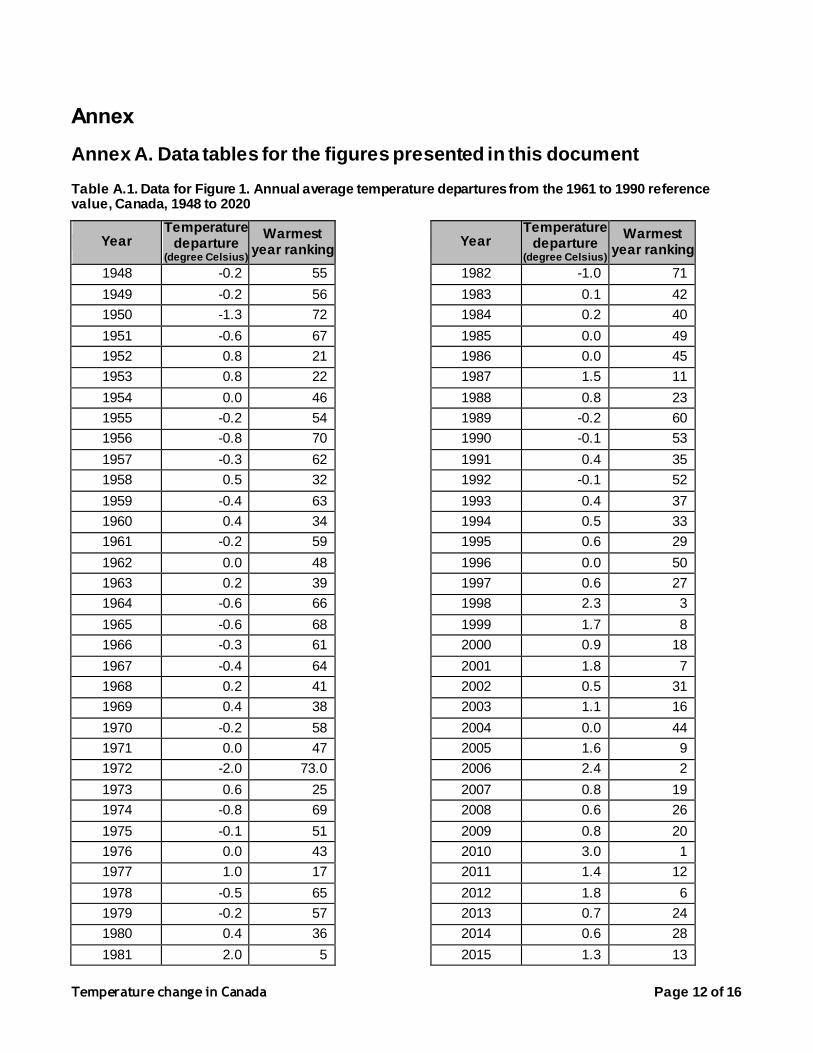
Table A.1. Data for Figure 1. Annual average temperature departures from the 1961 to 1990 reference value, Canada, 1948 to 2020
Year Temperature
departure (degree Celsius)
Warmest year ranking
1948 -0.2 55
1949 -0.2 56
1950 -1.3 72
1951 -0.6 67
1952 0.8 21
1953 0.8 22
1954 0.0 46
1955 -0.2 54
1956 -0.8 70
1957 -0.3 62
1958 0.5 32
1959 -0.4 63
1960 0.4 34
1961 -0.2 59
1962 0.0 48
1963 0.2 39
1964 -0.6 66
1965 -0.6 68
1966 -0.3 61
1967 -0.4 64
1968 0.2 41
1969 0.4 38
1970 -0.2 58
1971 0.0 47
1972 -2.0 73.0
1973 0.6 25
1974 -0.8 69
1975 -0.1 51
1976 0.0 43
1977 1.0 17
1978 -0.5 65
1979 -0.2 57
1980 0.4 36
1981 2.0 5
Year Temperature
departure (degree Celsius)
Warmest year ranking
1982 -1.0 71
1983 0.1 42
1984 0.2 40
1985 0.0 49
1986 0.0 45
1987 1.5 11
1988 0.8 23
1989 -0.2 60
1990 -0.1 53
1991 0.4 35
1992 -0.1 52
1993 0.4 37
1994 0.5 33
1995 0.6 29
1996 0.0 50
1997 0.6 27
1998 2.3 3
1999 1.7 8
2000 0.9 18
2001 1.8 7
2002 0.5 31
2003 1.1 16
2004 0.0 44
2005 1.6 9
2006 2.4 2
2007 0.8 19
2008 0.6 26
2009 0.8 20
2010 3.0 1
2011 1.4 12
2012 1.8 6
2013 0.7 24
2014 0.6 28
2015 1.3 13

Canadian Environmental Sustainability Indicators Page 13 of 16
Year Temperature
departure (degree Celsius)
Warmest year ranking
2016 2.1 4
2017 1.5 10
2018 0.6 30
Year Temperature
departure (degree Celsius)
Warmest year ranking
2019 1.1 15
2020 1.1 14
Note: Annual average temperature departures were computed for weather stations across Canada with sufficiently long data records to allow for trend calculation and were then interpolated to a 50-kilometre spaced grid. Annual grid points values were averaged together to produce an
annual time series of temperature departures representing the entire country. Departures are calculated by subtracting the 1961 to 1990 reference value from the annual average.
Source: Environment and Climate Change Canada (2021) Adjusted and homogenized Canadian climate data.
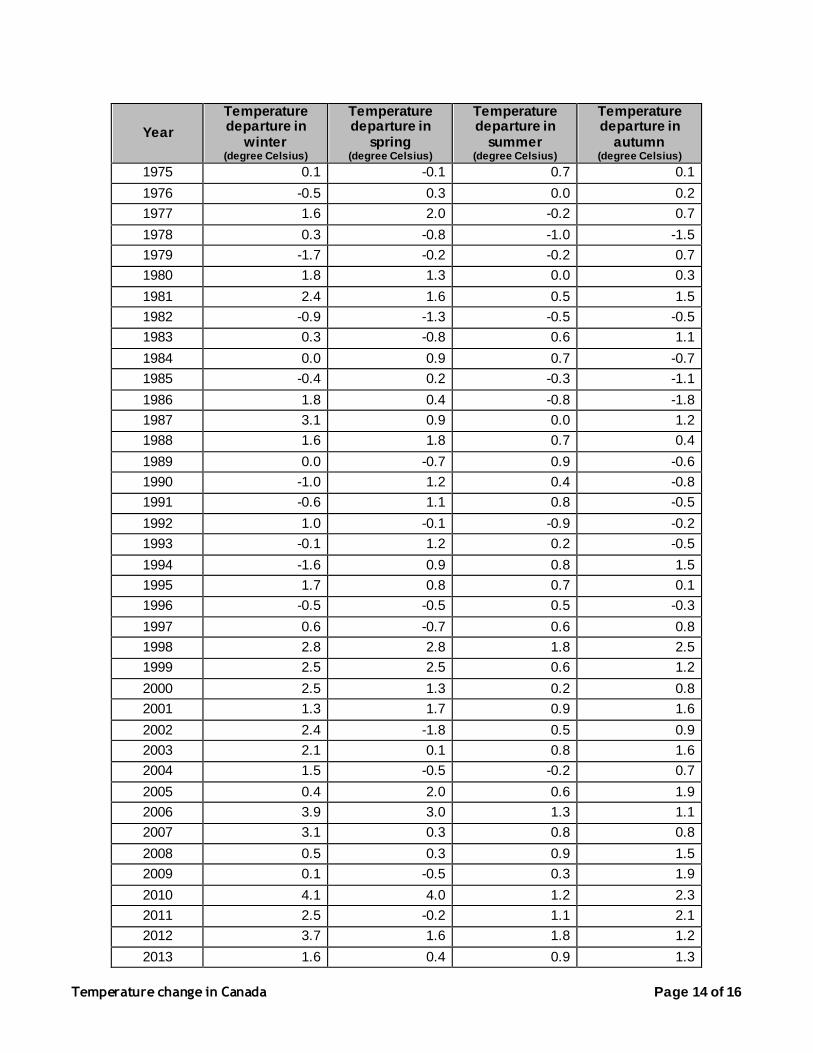
Table A.2. Data for Figure 2. Seasonal average temperature departures compared with the 1961 to 1990 reference value, Canada, 1948 to 2020
Year
Temperature departure in
winter (degree Celsius)
Temperature departure in
spring (degree Celsius)
Temperature departure in
summer (degree Celsius)
Temperature departure in
autumn (degree Celsius)
1948 0.2 -1.8 0.4 1.7
1949 -2.0 0.3 -0.2 0.8
1950 -3.0 -0.9 -0.8 -0.9
1951 -0.3 0.2 -0.3 -0.6
1952 -1.5 1.6 -0.1 0.7
1953 2.0 1.2 -0.1 1.3
1954 -0.4 -1.4 0.2 1.2
1955 0.8 -0.6 0.7 -0.3
1956 -0.4 -1.4 -0.5 -0.6
1957 -2.1 0.2 -0.5 0.5
1958 1.2 1.2 -0.2 0.1
1959 -0.9 -0.8 -0.5 -1.1
1960 2.5 -0.7 0.3 0.2
1961 0.6 -0.9 0.6 -0.4
1962 -1.6 -0.2 0.1 0.9
1963 0.5 -0.5 0.1 1.1
1964 1.3 -2.0 -0.6 -0.1
1965 -2.0 0.1 -0.8 -0.9
1966 -0.4 -0.1 0.2 -0.7
1967 -0.7 -2.0 -0.1 0.5
1968 0.5 0.7 -1.0 1.4
1969 0.3 -0.2 -0.4 0.2
1970 1.4 -0.4 0.4 0.2
1971 -1.2 0.5 0.1 0.5
1972 -3.6 -1.3 -0.8 -1.8
1973 -1.3 0.9 0.8 0.6
1974 -1.1 -2.0 -0.1 -0.5
Temperature change in Canada Page 14 of 16
Year
Temperature departure in
winter (degree Celsius)
Temperature departure in
spring (degree Celsius)
Temperature departure in
summer (degree Celsius)
Temperature departure in
autumn (degree Celsius)
1975 0.1 -0.1 0.7 0.1
1976 -0.5 0.3 0.0 0.2
1977 1.6 2.0 -0.2 0.7
1978 0.3 -0.8 -1.0 -1.5
1979 -1.7 -0.2 -0.2 0.7
1980 1.8 1.3 0.0 0.3
1981 2.4 1.6 0.5 1.5
1982 -0.9 -1.3 -0.5 -0.5
1983 0.3 -0.8 0.6 1.1
1984 0.0 0.9 0.7 -0.7
1985 -0.4 0.2 -0.3 -1.1
1986 1.8 0.4 -0.8 -1.8
1987 3.1 0.9 0.0 1.2
1988 1.6 1.8 0.7 0.4
1989 0.0 -0.7 0.9 -0.6
1990 -1.0 1.2 0.4 -0.8
1991 -0.6 1.1 0.8 -0.5
1992 1.0 -0.1 -0.9 -0.2
1993 -0.1 1.2 0.2 -0.5
1994 -1.6 0.9 0.8 1.5
1995 1.7 0.8 0.7 0.1
1996 -0.5 -0.5 0.5 -0.3
1997 0.6 -0.7 0.6 0.8
1998 2.8 2.8 1.8 2.5
1999 2.5 2.5 0.6 1.2
2000 2.5 1.3 0.2 0.8
2001 1.3 1.7 0.9 1.6
2002 2.4 -1.8 0.5 0.9
2003 2.1 0.1 0.8 1.6
2004 1.5 -0.5 -0.2 0.7
2005 0.4 2.0 0.6 1.9
2006 3.9 3.0 1.3 1.1
2007 3.1 0.3 0.8 0.8
2008 0.5 0.3 0.9 1.5
2009 0.1 -0.5 0.3 1.9
2010 4.1 4.0 1.2 2.3
2011 2.5 -0.2 1.1 2.1
2012 3.7 1.6 1.8 1.2
2013 1.6 0.4 0.9 1.3

Canadian Environmental Sustainability Indicators Page 15 of 16
Year
Temperature departure in
winter (degree Celsius)
Temperature departure in
spring (degree Celsius)
Temperature departure in
summer (degree Celsius)
Temperature departure in
autumn (degree Celsius)
2014 -0.5 -0.5 1.1 0.6
2015 0.8 1.2 0.9 1.7
2016 4.0 1.6 1.3 2.4
2017 3.0 0.6 0.9 1.2
2018 1.4 0.4 0.7 -0.8
2019 1.1 1.5 0.6 1.5
2020 1.9 -0.1 1.1 0.7
Note: Seasonal average temperature departures were computed for weather stations across Canada with sufficiently long data records to allow for trend calculation and were then interpolated to a 50-kilometre spaced grid. Seasonal grid points values were averaged together to produce a seasonal time series of temperature departures representing the entire country. Seasons are defined as winter (Dece mber,
January, and February), spring (March, April, and May), summer (June, July, and August) and autumn (September, O ctober, and November). Departures are calculated by subtracting the 1961 to 1990 reference value from the annual average.
Source: Environment and Climate Change Canada (2021) Adjusted and homogenized Canadian climate data.
Temperature change in Canada Page 16 of 16
Additional information can be obtained at:
Environment and Climate Change Canada
Public Inquiries Centre
12th Floor Fontaine Building
200 Sacré-Coeur Blvd
Gatineau QC K1A 0H3
Telephone: 1-800-668-6767 (in Canada only) or 819-938-3860
Fax: 819-938-3318
Email: [email protected]