TEM-EDS Characterization of Second in Steels - EDP … · 633-TEM-EDS Characterization of Second...
14
633- TEM-EDS Characterization of Second Phases in Ferritic Steels Susanna Matera and Ettore Anelli Centro Sviluppo Materiali S.P.A, P.O. Box 10747, Roma-EUR, Italy (Received March 1; accepted June 14, 1995) Abstract. TEM/STEM-EDS methods for the quantitative assessment of geometrical parameters, chemical composition and crystal structure of second phase particles are reviewed. Significant applica- tions are discussed with regard to different ferritic steels: Interstitial Free (IF) steel for deep drawing, electrical 1%Si steel and enameling steel. After short term isothermal annealing, a Ti-containing IF steel exhibited Ti(C,N) precipitates that were finer and more frequent than Ti4C2S2. Ti(C,N) was a preferential site for Ti4C2S2 nucleation. The experimental results were compared with calcula- tions by a mathematical model of precipitation. Analysis of second phase particles in an electrical 1% Si steel after isothermal annealing allowed evaluation of the inhibition factor for grain growth. The abnormal grain growth in this steel was mainly due to dissolution of Cu1.92S and Ostwald ripen- ing of (Mn,Cu)S and Ti(C,N) with AlN. Quantitative investigation of precipitates in an enameling steel, together with hydrogen permeation measurements, showed that interstitial sites at the surface of coherent ~-Ti(C,N) precipitates act as efficient traps for hydrogen atoms. Microsc. Microanal. Microstruct. 6 (1995) Classification Physics Abstracts 61.72F 75.50B 1. Introduction TEM/STEM-EDS techniques are a very useful tool for the quantitative analysis of fine second phases that play an important role in controlling the mechanical and magnetic properties of ferritic steels. Carbides and nitrides cause precipitation hardening [1] and, together with sulphides and oxides, influence hydrogen embrittlement [2]. In addition, second phases can influence grain size and texture, which affect strength, formability and magnetic properties. In the present work methods for the measurement of mean size (D), volume fraction (Fv), number per unit volume (Nv), chemical composition and crystal structure of fine second phase particles by TEM/STEM-EDS are reviewed and significant applications in steel metallurgy are discussed. Investigations were performed by a JEM 200CX TEM equipped with a LaB6 electron source, STEM attachment and EDS detector for high spatial resolution analysis of elements with atomic number Z > 11. 2. Expérimental Methods The characterization of second phases in steels requires the application of various TEM/STEM techniques on carbon extraction replicas and thin foils. Article available at http://mmm.edpsciences.org or http://dx.doi.org/10.1051/mmm:1995153
Transcript of TEM-EDS Characterization of Second in Steels - EDP … · 633-TEM-EDS Characterization of Second...

633-
TEM-EDS Characterization of Second Phases in Ferritic Steels
Susanna Matera and Ettore Anelli
Centro Sviluppo Materiali S.P.A, P.O. Box 10747, Roma-EUR, Italy
(Received March 1; accepted June 14, 1995)
Abstract. 2014 TEM/STEM-EDS methods for the quantitative assessment of geometrical parameters,chemical composition and crystal structure of second phase particles are reviewed. Significant applica-tions are discussed with regard to different ferritic steels: Interstitial Free (IF) steel for deep drawing,electrical 1%Si steel and enameling steel. After short term isothermal annealing, a Ti-containing IFsteel exhibited Ti(C,N) precipitates that were finer and more frequent than Ti4C2S2. Ti(C,N) wasa preferential site for Ti4C2S2 nucleation. The experimental results were compared with calcula-tions by a mathematical model of precipitation. Analysis of second phase particles in an electrical1% Si steel after isothermal annealing allowed evaluation of the inhibition factor for grain growth.The abnormal grain growth in this steel was mainly due to dissolution of Cu1.92S and Ostwald ripen-ing of (Mn,Cu)S and Ti(C,N) with AlN. Quantitative investigation of precipitates in an enamelingsteel, together with hydrogen permeation measurements, showed that interstitial sites at the surfaceof coherent ~-Ti(C,N) precipitates act as efficient traps for hydrogen atoms.
Microsc. Microanal. Microstruct. 6 (1995)
Classification
Physics Abstracts61.72F - 75.50B
1. Introduction
TEM/STEM-EDS techniques are a very useful tool for the quantitative analysis of fine secondphases that play an important role in controlling the mechanical and magnetic properties of ferriticsteels. Carbides and nitrides cause precipitation hardening [1] and, together with sulphides andoxides, influence hydrogen embrittlement [2]. In addition, second phases can influence grain sizeand texture, which affect strength, formability and magnetic properties.
In the present work methods for the measurement of mean size (D), volume fraction (Fv),number per unit volume (Nv), chemical composition and crystal structure of fine second phaseparticles by TEM/STEM-EDS are reviewed and significant applications in steel metallurgy arediscussed. Investigations were performed by a JEM 200CX TEM equipped with a LaB6 electronsource, STEM attachment and EDS detector for high spatial resolution analysis of elements withatomic number Z > 11.
2. Expérimental Methods
The characterization of second phases in steels requires the application of various TEM/STEMtechniques on carbon extraction replicas and thin foils.
Article available at http://mmm.edpsciences.org or http://dx.doi.org/10.1051/mmm:1995153

634
2.1 DIFFRACTION CONTRAST TECHNIQUE - Selected Area Diffraction (SAD) patterns, darkand bright field images of second phases were applied to identify the crystal structure and orien-tation relationship with respect to the matrix. A previously developed on-line acquisition system[3] for automatic indexing of SAD patterns was applied.
2.2 HIGH SPATIAL RESOLUTION EDS MICROANALYSIS - The quantitative EDS microanalysisof fine second phases, with size in the range 20 nm to 300 nm, was performed at 200 kV on extrac-tion replicas in order to avoid matrix contribution effects. The Cliff-Lorimer ratio method [4, 5]was applied. Carbon extraction replicas on graphite and aluminium grids were used to minimizespurious X-ray peaks. The electron beam current was chosen in order to have high X-ray countrates. However, 3000 counts per second were found to be a limit for the large particles to avoidexcessive dead times. For a live time of 100 s, the relative errors for peak intensity measurementswere less than 13% (Fig. 1), even for small particles (20 nm size) or low concentration values(10-20 wt%).
Fig. 1. - High spatial resolution EDS microanalysis of sulphides in extraction replicas. Effect of particlesize (Di) on the relative error for peak intensity measurements. (I = net peak intensity; Ib = backgroundintensity).
2.3 QUANTITATIVE METALLOGRAPHY - The determination of Fv and Nv was carried out onthin foils, as extraction replicas do not allow one to evaluate accurately the depth from whichparticles were extracted. TEM images of particles represent their area projection on a plane.Therefore the corrections of measured geometrical parameters, due to overlapping of particlesand sectioning effects, are different from the case of optical metallography [6, 7].The extraction replica technique was therefore selected as the sample preparation method for
determining size distributions and D values, since sectioning effects are avoided and overlapping

635
will be minimized. The high contrast was also helpful for accurate size measurements of a largenumber of particles (> 1000).
Methods used for the evaluation of geometrical parameters are described in the Appendix.
3. Second Phase Characterization
Examples of second phase characterization will be presented for an interstitial free (IF) steelfor deep drawing applications, an electrical 1% Si- steel and an enameling steel, whose chemicalcompositions are shown in Table I.
Table I. - Alloying elements (wt%) in the steels.
3.1 PRECIPITATION OF Ti COMPOUNDS IN IF STEEL - The excellent non ageing properties ofIF steels depend on their low content of interstitial elements (C and N) and on the proper additionof microalloying elements (Ti, Nb) which form highly stable phases with these solutes.The isothermal precipitation of Ti compounds was investigated in the IF steel (Tab. I) in order
to evaluate the reliability of a mathematical model in predicting nucleation and growth of secondphases [8, 9].
Samples were annealed at 900 ° C for holding times 1.2, 2.4, 12 and 60 ks. The following secondphases were identified:
fcc Ti(C,N) with a = 0.433 nm;hcp Ti4C2S2 with a = 0.3206 nm and c = 1.1190 nm.
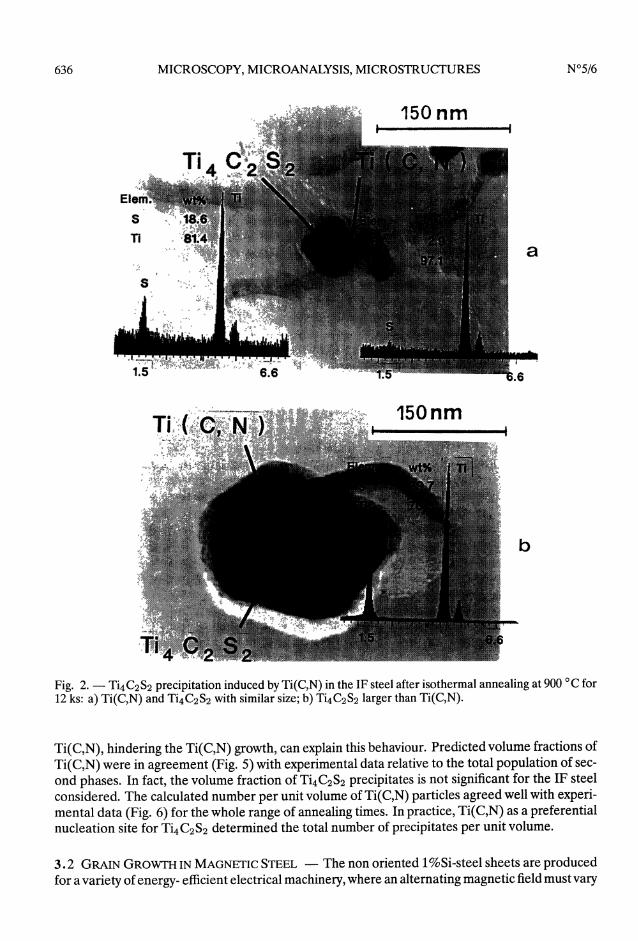
TiN and TiC are mutually miscible and could not be distinguished.Some Ti4 C2 S2 particles were found to be formed on Ti(C,N) precipitates as shown in Figure 2.
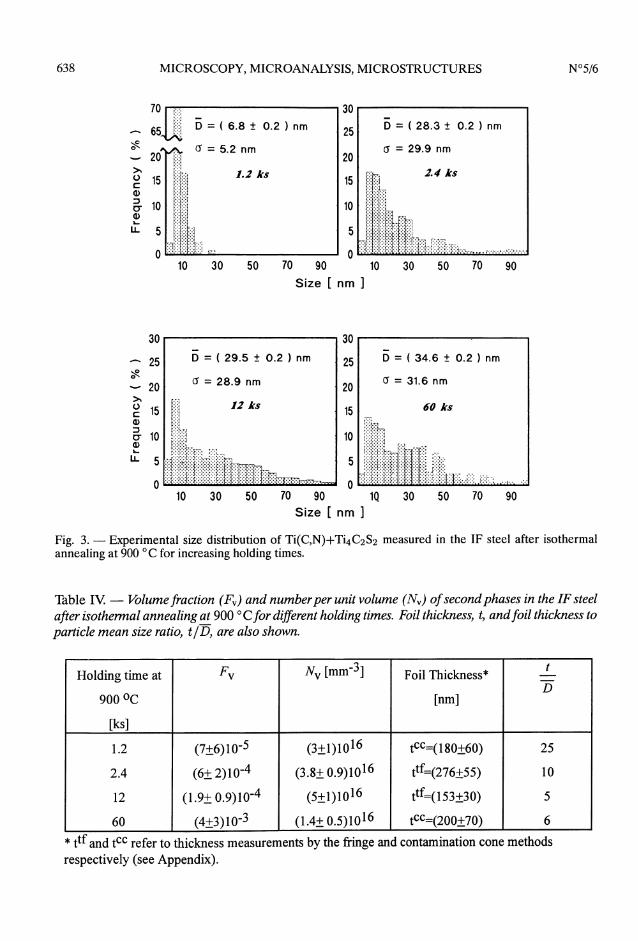
In such cases, when the sizes of the two types of particle were similar (Fig. 2a), the S contentin Ti4C2S2 was underestimated because of the contribution of Ti from Ti(C,N) (Tab. II). Nearlystoichiometric levels of S were measured when the size of Ti4 C2 S2 was larger than that of Ti(C,N)(Fig. 2b, Tab. II). The nature of second phases and their relative frequency for increasing holdingtimes are shown in Table III. The size distribution and values of D (Fig. 3), Fv and Nv (Tab. IV)were measured for the total population of second phase particles. The experimental geometricalparameters were compared with those calculated by a mathematical model [9] taking into accountnucleation at dislocations and lattice defects. The interaction of Ti4 C2 S2 with Ti(C,N) was notconsidered in the calculation and both precipitation processes were assumed to be independent.The model predicted that Ti(C,N) had higher frequency and smaller size than Ti4 C2 S2 for shortholding times (~ 2.4 ks), due to a faster nucleation rate, in agreement with experimental results(Tab. III).Thé calculated mean sizes for Ti(C,N) were consistent with experimental data (Fig. 4). How-
ever, the calculated values for long holding times predicted a faster rate of particle coarsening(a coefficient) than the experimental one (Fig. 4). The preferential nucleation of Ti4C2S2 on
636
Fig. 2. - Ti4 C2 S2 precipitation induced by Ti(C,N) in the IF steel after isothermal annealing at 900 ° C for12 ks: a) Ti(C,N) and Ti4C2S2 with similar size; b) Ti4C2S2 larger than Ti(C,N).
Ti(C,N), hindering the Ti(C,N) growth, can explain this behaviour. Predicted volume fractions ofTi(C,N) were in agreement (Fig. 5) with experimental data relative to the total population of sec-ond phases. In fact, the volume fraction of Ti4 C2 S2 precipitates is not significant for the IF steelconsidered. The calculated number per unit volume of Ti(C,N) particles agreed well with experi-mental data (Fig. 6) for the whole range of annealing times. In practice, Ti(C,N) as a preferentialnucleation site for Ti4 C2 S2 determined the total number of precipitates per unit volume.
3.2 GRAIN GROWTH IN MAGNETIC STEEL - The non oriented 1%Si-steel sheets are producedfor a variety of energy- efficient electrical machinery, where an alternating magnetic field must vary

637
Table II. - Quantitative EDS microanalysis of second phases as a function of size for the IF steelafter isothermal annealing at 900 °C for 12 ks.
Table III. - Second phases identified in the IF steel after isothermal annealing at 900 ° C for differentholding times.
isotropically. These materials are required to have a sharp grain size distribution centred at 120-130 03BCm and a controlled texture characterized by the direction of easy magnetization, 100 >,lying in the plane of the sheet.The isothermal evolution of second phases in the magnetic steel (Tab. I) was investigated in or-
der to evaluate the inhibition effect on grain growth. The second phase parameters are importantin controlling abnormal grain growth process and the consequent texture development. Differ-ent types of second phases such as sulphides and nitrides were identified in samples annealed at850 ° C for holding times from 0.18 to 864 ks:
hcp Cu1.92S with a = 1.135 nm, c = 1.3506 nm,fcc (Mn,Cu)S with a = 0.5224 nm,hcp AIN with a = 0.3111 nm and c = 0.4978 nm,fcc TiN with a = 0.424 nm
638
Fig. 3. - Experimental size distribution of Ti(C,N)+Ti4 C2 S2 measured in the IF steel after isothermalannealing at 900 °C for increasing holding times.
Table IV. - Volume fraction (Fv) and number per unit volume (N,) of second phases in the IF steelafter isothermal annealing at 900 °C for different holding times. Foil thickness, t, and foil thickness toparticle mean size ratio, t/D, are also shown.
* ttf and tcc refer to thickness measurements by the fringe and contamination cone methodsrespectively (see Appendix).

639
Fig. 4. - Comparison of experimental and calculated values of D as a function of holding time in the IFsteel.
Fig. 5. - Comparison of experimental and calculated values of Fv as a function of holding time for the IFsteel.
The nature of second phases and their relative frequency for increasing holding times are shownin Table V. A holding time of 18 ks at 850 ° C caused CU1.92S dissolution and the precipitationof TiN; for holding times longer than 18 ks Ostwald ripening of (Mn,Cu)S and TiN, AIN wasobserved.
_
Measurements of D and Fv parameters with reference to the total population of second phaseswere performed to evaluate the grain growth inhibition factor, Iz, defined as follows [10]:

640
Fig. 6. - Comparison of experimental and calculated values of Nv as a function of holding time for the IFsteel.
Table V - Second phases identified in magnetic steel after isothermal annealing at 850 °C for differ-ent holding times.
The measured precipitate parameters and Iz values for samples treated for 0.18 ks and 864 ks arecompared in Table VI. A significant decrease in lz is observed for long holding times.
These results, combined with the initial grain size distribution and texture were used as in-put data to simulate grain growth evolution by another mathematical model [11]. The observedabnormal grain growth of {110} and {111} grains was explained by considering two inhibition de-creases at different annealing times: a fast decrease due to CU1.92S dissolution, and a successiveslow one due to Ostwald ripening of the (Mn,Cu)S and TiN with AIN.

641
Table VI. - Mean size (D), volume fraction (Fv) and grain growth inhibition factor (Iz) of secondphases in the magnetic steel after isothermal annealing at 850 °C for different holding times.
* ttf refers. to thickness measurement by the fringe method (see Appendix).
3.3 HYDROGEN TRAPPING IN ENAMELING STEELS - The diffusivity and solubility of hydrogenin enameling steels are influenced by the presence of second phases which behave as traps forhydrogen atoms. The geometrical parameters and crystal structure of second phases in an enameling steel
(Tab. I) were related to hydrogen permeation measurements in order to evaluate the hydrogentrapping capability of second phases. Hydrogen permeation curves and trapped hydrogen con-centrations were measured by means of the electrochemical method [12] using a 0.1 M NaOHsolution and the technique reported in reference [13].
Three types of precipitates were present in the enameling steel:6-Ti(C,N) coherent with ferritic matrix (a-Fe): Simple Tetragonal with a = 0.429 nm and c =
0.561 nm. The SAD pattern of E-Ti(C,N) showed the following orientation relationship (Fig. 7):[111]03B1-Fe ~ [342]~-Ti(C,N)(110)a-Fe ~ (221)~-Ti(C,N)Ti(C,N) incoherent with ferritic matrix: fcc with a = 0.433 nm;TiS incoherent with ferritic matrix: hcp with a = 0.342 nm and c = 2.640 nm.
Table VII. - Second phases identified in the enameling steel.
However, incoherent Ti(C,N) and TiS precipitates were not frequently detected (Tab. VII).The estimated numerical fraction of incoherent Ti(C,N) was less than 2% (Fig. 8).

642
Fig. 7. - Second phases analysis in a thin foil of the enameling steel. Coherent E-Ti(C,N) in the enamelingsteel: a) SAD pattern; b) indexing of SAD pattern (Simple Tetragonal: a = 0.429 nm, c = 0.561 nm) andorientation relationship with matrix; c) Bright Field Image; d) EDS microanalysis.
These results, combined with hydrogen permeation tests, showed that hydrogen trapping ismainly due to coherent E-Ti(C,N).
Assuming that the whole surface area (S) of the coherent E-Ti(C,N) precipitates can contributeto hydrogen trapping and considering the average area (a)2 = (a2 + 2ac) /3 = 0.222 nm2 of oneface of the tetragonal unit cell, the number, k, of hydrogen atoms for unit cell is calculated fromthe following equation [14]:
where NI is the number of trapped hydrogen atoms per unit volume, evaluated by permeationmeasurements, and N, is the number per unit volume of coherent 6-Ti(C,N). TEM measurements(Tab. VIII) and permeation results (NI = 7 x 1015 mm-3) allowed us to estimate a k value ofabout 1, which is the number of interstitial sites of the tetragonal unit cell.

643
Fig. 8. - Size distribution and D of Ti(C,N) in the enameling steel.
Table VIII. - Mean size (D), surface area S and number per unit volume (Nv) of coherentE-Ti(C,N) precipitates in the enameling steel.
* ttf refers to thickness measurement by the fringe method (see Appendix).
4. Conclusions
TEM/STEM-EDS techniques allow a quantitative assessment of geometrical parameters, chemi-cal composition and crystal structure of second phases in steels.
Regarding the Ti-IF steel, these methods indicate that, after isothermal annealing, Ti(C,N)precipitates are finer and more frequent than Ti4 C2 S2 for short holding times, in agreement withmathematical model calculations which predicted a fast Ti(C,N) nucleation rate. Ti(C,N) is apreferential site for Ti4C2S2 nucleation and determines the value of Nv for all precipitates of thetype Ti(C,N)+Ti4 C2S2.The abnormal grain growth, observed for an electrical 1% Si steel, is mainly due to dissolution
of CU1.92S and Ostwald ripening of (Mn,Cu)S, Ti(C,N) with AIN second phases.Quantitative investigation of precipitates present in an enameling steel, combined with hydro-
gen permeation measurements, shows that interstitial sites at the surface of coherent E-Ti(C,N)precipitates have a high probability of occupancy by hydrogen atoms.

644
Appendix
A.1 MEASUREMENTS OF GEOMETRICAL PARAMETERS.- Size distribution, and mean size, D,were measured on extraction replicas. The size of the i’h particle, Di, was evaluated as:
with
where ai and bi are the maximum and the minimum sizes of the ith particle, respectively. Thesesizes were accurately measured on TEM micrographs by a graduated eye piece or an automaticimage analyzer equipped with a macroviewer.The mean size, D, was calculated as the numerical average of Di :
where n is the total number of measured particles and AD is the experimental uncertainty asso-ciated with D.
Assuming that overlap effect can be ignored, the volume fraction, Fy, and number per unit vol-ume, N,, of second phase particles were measured on thin foils applying the following equations[7]:
where m is the total number of particles in the investigated region, Vi is the volume of the ithparticle, AT is the area of the region, t is the foil thickness and D is the average particle size. The(t + D) factor arises from particles with centers outside the foil within D /2 of the top and bottomsurfaces. Therefore equations (A.4) and (A.5) become:
where VT is the volume of the region. The relative errors associated were calculated according to

645
the following equations:
Carbides, sulphides and oxides generally have an ellipsoidal or spherical shape while nitrides havea prismatic shape. Taking into account equations (A.1) and (A.2), Vi was calculated, in the caseof an ellipsoidal shape, as:
In the case of a prismatic shape, Vi was calculated as the volume of a parallelepiped with a squarebase:
The volume of the thin foil region is:
where (lx ly) is the area of the investigated region (0394lx = 0394ly ~ ±10 nm) and t the foil thickness.The foil thickness measured by the thickness fringes technique, ttf is:
where 03BE(hkl) is the extinction distance of the matrix (i.e. a-Fe), n is the number of grain boundaryfringes in bright field and hkl is the two beam diffraction vector. The estimated thickness error is20%.When the electron transparent region did not allow observation of a grain boundary, the foil
thickness was determined by the contamination spots method. Contamination spots with a con-ical shape were obtained by focusing the electron beam (STEM operating condition) on a tiltedspecimen, without activating the anticontamination device. The foil thickness tlc was estimated,after tilting the contaminated specimen to zero degrees by the relationship:
where x is the mean distance of the double cone centres measured for different contamination
points and T = (30.0° ± 0.5°) is the tilt angle. The error associated with tcc calculation is:
However, the error can be larger when an oxide layer is formed on the specimen surface. In thiscase, the foil thickness is overestimated by 10 nm to about 50 nm [15].

646
References
[1] Haasen P., in "Physical Metallurgy", R.W Cahn and P. Haasen Eds., Vol. 2 (North Holland PhysicsPublishing, 1983) p. 1376.
[2] Johnson H.H., Metal. Trans. A 19 (1988) 2371.[3] Di Nunzio P.E. and Venditti D., Proceedings of "13th International Congress on Electron Microscopy",
Paris, Vol. 1 (1994) p. 925.[4] Cliff G. and Lorimer G.W., Proceedings of "5th European Congress on Electron Microscopy", Inst.
Phys., London (1972) p. 140.[5] Anelli E., in "Microscopia Elettronica in Trasmissione e Tecniche di Analisi di Superfici in Scienza dei
Materiali", ENEA, Castro Marina (Le) (1985) p. 523.[6] Underwood E.E., in "Quantitative Microscopy", R.T DeHoff and F.N. Rhines Eds. (McGraw-Hill
Book Company, New York, 1986) p. 149.[7] Hirsh P.B., Nicholson R., Pashley D.W and Whelan M.J., "Electron Microscopy of Thin Crystals",
Butterworths, London (1965) p. 424.[8] Di Nunzio P.E., Matera S. and Serventi A.M., Proceedings of "13th International Congress on Electron
Microscopy", Paris, Vol. 2A (1994) p. 707.[9] Di Nunzio P.E., "Development and Validation of Mathematical Models for Complex Carbide Pre-
cipitation During Hot Working and Continuous Annealing of Deep Drawing Steels", CSM FinalReport, ECSC Agreement 7210-EC/401 (1994).
[10] Abbruzzese G., Acta Metall. 33 (1985) 1329.[11] Abbruzzese G. and Lücke K., Acta Metall. 34 (1986) 905.[12] Devanathan M.A.V and Stachurski Z.O.J., Proc. Roy. Soc. A270 (1962) 90.[13] Valentini R. and Solina A., Mater. Sci. Technol. 10 (1994) 908.[14] Pressouyre G.M. and Bernstein I.M., Acta Metall. 27 (1979) 89.[15] Rae D., Scott VD. and Love G., Proceedings of "Quantitative Microanalysis with High Spatial Reso-
lution", The Metal Society of London (1981) p. 57.