Tellatin Senior Housing and Healthcare Valuations, Market ... fileitself enough from the entry-fee...
59
Tellatin Senior Housing and Healthcare Valuations, Market Studies and Consulting Services St. Louis, Missouri | Wilsonville, Oregon | Boston, Massachusetts Leawood, Kansas| Nashville, Tennessee A Market Study Report Proposed Independent Living Facility To Be Located At August Hill Drive Chesterfield, St. Louis County, Missouri Prepared for Boutique Retirement Clubs, LLC Effective Dates of the Market Study November 16, 2017 As Is Subject Property Latitude and Longitude Coordinates 38.653905, -97.374551 Copyright 2017
Transcript of Tellatin Senior Housing and Healthcare Valuations, Market ... fileitself enough from the entry-fee...

Tellatin Senior Housing and Healthcare Valuations, Market Studies and Consulting Services
St. Louis, Missouri | Wilsonville, Oregon | Boston, Massachusetts
Leawood, Kansas| Nashville, Tennessee
A Market Study Report
Proposed Independent Living Facility
To Be Located At August Hill Drive
Chesterfield, St. Louis County, Missouri
Prepared for Boutique Retirement Clubs, LLC
Effective Dates of the Market Study
November 16, 2017As Is
Subject Property Latitude and Longitude Coordinates 38.653905, -97.374551
Copyright 2017

Tellatin, Inc.
Western Region Main Office Melanie J. Kosich, MAI David Fryday & Brad Thompson James K. Tellatin, MAI, Principal Massachusetts 130 Salem Heights Avenue Victor Cremeens, MAI, Bradley Schopp & Mark Tracy Salem, Oregon 97302 16759 Main Street, Suite 209 A. Chantay Betts
Telephone: (503) 485-5118 St. Louis, Missouri 63040 Illinois
Facsimile: (503) 485-5120 Telephone: (636) 530-0009
James Tellatin, MAI, New Mexico Facsimile: (636) 530-0046 Hunter Creekmore
Mark Landzaat, Kansas Tennessee
December 18, 2017 File Reference: 1712087 Ms. Bridget Snodgrass Boutique Retirement Clubs, LLC 5345 West 151st Terrace Leawood, Kansas 66224 RE: A Market Study Report Proposed Independent Living Facility August Hill Drive Chesterfield, St. Louis County, Missouri 63005 Dear Ms. Snodgrass: In accordance with the signed engagement contract dated November 3, 2017, we have prepared a market study within the defined primary market area of the proposed independent living facility that will be located at August Hill Drive, in Chesterfield, Missouri. It is our understanding that the purpose and intended use of this market study is to assist Boutique Retirement Clubs, LLC in determining if there is sufficient demand to support the development of additional independent living units to be completed in Chesterfield, St. Louis County, Missouri. This report and its contents are solely for the intended use, and it should not be relied upon for any other purpose. The effective date of the market study is November 16, 2017. The intended use of this market study is not to determine the financial feasibility of the proposed independent living facility. Our analyses, opinions, and conclusions were developed, and this report has been prepared, in conformity with:
• The Uniform Standards of Professional Appraisal Practice of the Appraisal Foundation, and
• The requirements of the Code of Professional Ethics and Standards of Professional Practice of the Appraisal Institute.
The following conclusions were drawn from our market analyses.
• Unmet demand is indicated from our market saturation rate for independent living. However, it should be noted that the market contains a large number of entry-fee independent living units which will indirectly compete with the subject facility. Entry-fee facilities typically charge a very large upfront fee which in this market range from $281,115 up to $650,000, and then charge an additional monthly maintenance fee. We believe that the month to month rental structure of the proposed property differentiates

itself enough from the entry-fee model that we have only included 25 percent of the entry-fee units in the market as being competitive with the proposed subject facility.
The accompanying prospective analysis is based on assumptions and opinions developed in connection with the market study. However, some assumptions inevitably will not materialize, and unanticipated events and circumstances will occur. The actual results achieved during the holding period will vary from our forecasts, and these variations may be material. We have not been engaged to evaluate the effectiveness of management, and we are not responsible for management’s actions such as the quality of care or marketing efforts. A copy of this report, together with the field data from which it was prepared, is retained in our files. These data are available for your inspection upon request. Respectfully submitted,
Tellatin, Inc. ______________________________________ By: Mark A. Landzaat Senior Appraiser

TABLE OF CONTENTS
Tellatin, Inc.
iv
Executive Summary --------------------------------------------------------------------------------------- 5 Market Summary ------------------------------------------------------------------------------------------- 5 Independent Living ---------------------------------------------------------------------------------------- 6
Standard Appraiser-Client Contractual Agreements ----------------------------------------------- 7 Competency Rule ------------------------------------------------------------------------------------------ 8 Prior Assignments Involving the Subject Property ------------------------------------------------- 8 Scope of Work ---------------------------------------------------------------------------------------------- 9 Problem Identification ------------------------------------------------------------------------------------- 9
Client ---------------------------------------------------------------------------------------------------------- 9 Intended User(s) of the Market Study ----------------------------------------------------------------- 9 Intended Use of the Market Study --------------------------------------------------------------------- 9 Effective Date of the Market Study --------------------------------------------------------------------- 9 Date of Report ---------------------------------------------------------------------------------------------- 9 Property Inspection ---------------------------------------------------------------------------------------- 9 Extraordinary Assumptions ------------------------------------------------------------------------------ 9 Hypothetical Conditions -------------------------------------------------------------------------------- 10 Data Research and Analysis -------------------------------------------------------------------------- 10
Micro-Economic Analysis ------------------------------------------------------------------------------ 11 Regional Analysis ---------------------------------------------------------------------------------------- 11
Physical Data ----------------------------------------------------------------------------------------- 11 Demographic Data ----------------------------------------------------------------------------------- 13 Economic Data --------------------------------------------------------------------------------------- 16 Conclusion --------------------------------------------------------------------------------------------- 20
Neighborhood Analysis --------------------------------------------------------------------------------- 21 Location Description and Analysis --------------------------------------------------------------- 21 Demographic Data ----------------------------------------------------------------------------------- 25 Conclusion of Neighborhood Analysis ---------------------------------------------------------- 27
Defining the Primary Market Area -------------------------------------------------------------------- 29 Demand Trends ------------------------------------------------------------------------------------------ 29
Primary Market Demand Trends --------------------------------------------------------------------- 29 Supply Trends -------------------------------------------------------------------------------------------- 32
Primary Market Area Supply -------------------------------------------------------------------------- 32 Existing Supply --------------------------------------------------------------------------------------- 34 Proposed Supply ------------------------------------------------------------------------------------- 37
Independent Living -------------------------------------------------------------------------------------- 38 Market Analysis – Independent Living -------------------------------------------------------------- 38
Saturation Analysis ---------------------------------------------------------------------------------- 38 Certification ------------------------------------------------------------------------------------------------ 44 EXHIBIT SECTION
• Exhibit A -- Engagement Letter
• Exhibit B -- Photographs of the Subject Site
• Exhibit C – Photographs of Competitive Facilities
• Exhibit D -- Qualifications

Tellatin, Inc.
5
Executive Summary
Market Summary Approximately 21.6 percent of the population within the primary market area has a household income of less than $50,000, and 78.4 percent have a household income of greater than $50,000, of which approximately 65.3 percent have a household income of greater than $75,000. These figures indicated a strong income density. It is very important to examine the relationship between the 45-64 population and the 75-plus population. The following table displays the 75-plus population as a percentage of the 45-64 population.
Demographic Overview of Primary Demand Drivers
St. Louis Primary Market
United States Missouri County Area
Total Population 45-64
2017 84,939,888 1,625,305 279,196 36,939
2022 83,911,001 1,572,877 264,834 34,967
Annual Change -0.24% -0.65% -1.05% -1.09%
45 to 65 Ratio to General Population
2017 25.93% 26.25% 27.55% 30.63%
2022 24.58% 24.85% 25.89% 28.66%
Total Population 75 and Over
2017 21,089,231 429,191 81,692 12,640
2022 24,983,884 498,121 92,363 14,704
Annual Change -- 2010 to 2013 1.85% 1.46% 1.18% 1.86%
Annual Change -- 2014 to 2019 3.45% 3.02% 2.49% 3.07%
75-plus Ratio to General Population
2017 6.44% 6.93% 8.06% 10.48%
2022 7.32% 7.87% 9.03% 12.05%
Ratio of 75-Plus Population to 45-64 Age Cohort
2017 24.8% 26.4% 29.3% 34.2%
2022 29.8% 31.7% 34.9% 42.1%
Source: ESRI, 2013 (2010 Census)
As displayed in the table above the 75-plus population as a percentage of the 45-64 population for the primary market area is more than St. Louis County, and significantly less than the state of Missouri as well as the United States. The ratio of the 75-plus population to the 45-64 population for St. Louis County is 85.5 percent of the ratio for the primary market area. Additionally, the ratio 75-plus population to the 45-64 population for Missouri is 77.2 percent of the ratio for the primary market area. In normal market conditions, when the ratio of the 75-plus population as a percentage of the 45-64 population for the primary market area is comparable to the County, State and Nation, we assume that 80.0 percent of demand originates from the primary market area.

Tellatin, Inc.
6
Independent Living The following table summarizes the conclusions and implications of our saturation rate analysis.
Summary of Conclusions and Implications -- Independent Living
Total Demand and Implied Occupancy Calculation
A. Qualified Demand 7,091
B. Empirical Equilibrium Saturation Rate Conclusion 9.0%
C. Implied Demand from Primary Market (A x B) 638
D. % of Demand From Primary Market 80.0%
E. Total Market Demand (C ÷ D) 798
F. Total Competitive Supply 750
Excess Demand Calculation
G. Total Market Demand 798
H. Total Competitive Supply at 95 Percent Occupancy (F x .95) 713
I. Excess Demand (G-H) 85
J. Balanced Supply required to achieve 95 Percent Market Occupancy (E ÷ .95) 840
K. % of Excess Demand (I ÷ H) 12.0%
As presented above, the implied saturation rate for the primary market falls below the empirical saturation rate for a balanced market, indicating insufficient supply or pent-up demand of 85 units/beds in addition to the subject units. Current market occupancy rates are summarized as follows.
Summary of Competitive Independent Living Facility Occupancy Rates Summary of Competitive Independent Living Facility Private-Pay Mixes
# of Fair Percent of Overall
# of Market Units/Beds Market Occupancy Market Penetration Comparability
Competitor Name Units/Beds Inclusion In Market Share Rate Captured Rate Rating 1-30
1 Chesterfield Villas 73 100% 73 8.6% 88.0% 8.0% 93.6% -
2 Friendship Village Chesterfield 244 100% 244 28.6% 98.0% 29.9% 104.3% -
3 The Willows at Brooking Park 120 100% 120 14.1% 95.0% 14.2% 101.1% -
4 The Fountains Of West County 160 100% 160 18.8% 97.5% 19.5% 103.8% -
5 Briarcrest Estates 92 100% 92 10.8% 90.2% 10.4% 96.0% -
6 Gambrill Gardens 100 100% 100 11.7% 97.0% 12.1% 103.2% -
7 Garden Villas 63 100% 63 7.4% 75.0% 5.9% 79.8% -
Market Totals/Averages 852 852 100.0% 94.0% 100.0% 100.0%
Market High 98.0% 29.9% 104.3%
Market Low 75.0% 5.9% 79.8%
Competitive occupancy rates vary greatly -- from 75.0 percent to 98.0 percent with an average of 94.0 percent. The high average occupancy rate suggests that there may be some excess demand in the market. Garden Villas, a Delmar Gardens property is experiencing a low occupancy largely because the building is the oldest is the market and there is considerable deterioration; we believe the ownership may be looking down the road to redevelop the property in five to 10 years, and in the meantime, they are not reinvesting in the property. In fact, there was a second set of independent living buildings, of similar age, located on the east sided of this campus, that includes a skilled nursing facility, that were demolished a few years ago. Chesterfield Villas, also a Delmar product, is the only other property in the market to have an occupancy rate below 90 percent. That building is also one of the oldest in the market, but has seen capital investment in recent years.

Tellatin, Inc.
7
Standard Appraiser-Client Contractual Agreements Advertising Neither all nor any part of the contents of this report shall be conveyed to the public through advertising, public relations, news, sales or other media without the written consent and approval of Tellatin, Inc. Public Dissemination Neither the report nor any portions thereof (especially any conclusions as to value, the identity of the appraisers, or Tellatin, Inc.) or any reference to the Appraisal Institute, American Society of Appraisers or their relative professional designations, shall be disseminated to the public through public relations media, news media, sales media or any other public means of communication without the prior written consent and approval of the analysts or appraisers and Tellatin, Inc. Plagiarism Neither all nor any part of the contents of this report shall be plagiarized for any purpose by the client or anyone else who obtains a copy of the report directly, or indirectly without the written approval of an officer of Tellatin, Inc. Court Testimony Testimony or attendance in court due to this appraisal shall not be required unless arrangements for such services are subsequently made. Financial Information The report and the opinions and prospective financial analyses included in it are intended for the information of the person or persons to whom they are addressed, solely for the purposes stated therein, and should not be relied upon for any other purpose. Neither our report, nor its contents, nor any reference to the analysts, appraisers or Tellatin, Inc. may be included or quoted in any offering circular or registration statement, prospectus, sales brochure, other appraisal, loan, or other agreement or document without our prior written permission. Permission will be granted only upon meeting certain conditions.

Tellatin, Inc.
8
Competency Rule Definition: “An appraiser must:
1. be competent to perform an assignment; 2. acquire the necessary competency to perform the assignment; or 3. decline or withdraw from the assignment.
In all cases, the appraiser must perform competently when completing the assignment.” 1
Tellatin, Inc. specializes in appraisals and consulting assignments involving seniors housing and healthcare facilities. As a specialist, our strengths are analyzing industry-specific macroeconomic data as well as local markets. We regularly perform assignments throughout the nation and in Missouri that necessitate familiarizing ourselves with local markets. The typical buyer for most senior housing properties are regional or national in their operational and acquisition footprints, with their valuation and price decision often made by individuals and groups from the subject geographic market. Based on the general practices of our peers, we believe that we satisfy the industry norms relative to establishing competency relative to local markets.
Prior Assignments Involving the Subject Property
If known prior to accepting an assignment, and/or if discovered at any time during the assignment, an appraiser must disclose to the client, and in the subsequent report certification:
• Any current or prospective interest in the subject property or parties involved; and
• Any services regarding the subject property performed by the appraiser within the three-year period immediately preceding acceptance of the assignment, as an appraiser or in any other capacity
Mark A. Landzaat has not provided services pertaining to the subject property during this time frame. Mark A. Landzaat does not have any current or prospective interest in the subject property or the parties involved.
1 Uniform Standards of Professional Appraisal Practice, 2014-2015
Edition. Appraisal Foundation. 2013. U-12. Print.

Tellatin, Inc.
9
Scope of Work Definition: “The type and extent of research and analyses in an appraisal or appraisal review.” 2
The scope of work is the primary mechanism for tailoring an appraisal to the circumstances related to the assignment. The following sections detail the scope of work for this assignment.
Problem Identification
Client Boutique Retirement Clubs, LLC is the client; specifically, the market study assignment was engaged by Ms. Bridget Snodgrass.
Intended User(s) of the Market Study The only intended user of this market study is Boutique Retirement Clubs, LLC.
Intended Use of the Market Study It is our understanding that the market study will be used to ascertain the depth of demand within the defined primary market area for independent living facility units. This report is not intended for any other use.
Effective Date of the Market Study November 16, 2017
Date of Report The date of this report is December 18, 2017 and this report is the only valid report for this assignment. A previous report was provided with a date of the report as of November 21, 2017; this report is no longer valid because of revisions.
Property Inspection The subject site was inspected by Mark A. Landzaat on November 16, 2017. A cursory inspection of the competitive facilities in the primary market was also performed.
Extraordinary Assumptions Definition: “an assumption, directly related to a specific assignment, which, if found to be false, could alter the analyst’s opinions or conclusions.” (USPAP Modified by TSH with analyst versus appraiser) Comment: “Extraordinary assumptions presume as fact otherwise uncertain information about physical, legal, or economic characteristics of the subject property or about conditions external to the property, such
2 Ibid., U-4.

Tellatin, Inc.
10
as market conditions or trends, or the integrity of data used in an analysis.” (USPAP)
There are no extraordinary assumptions.
Hypothetical Conditions Definition: “that which is contrary to what exists, but is supposed for the purpose of the market study.” (USPAP Modified by TSH with market study versus appraisal) Comment: “Hypothetical conditions assume conditions contrary to known facts about the physical, legal, or economic characteristics of the subject property or about conditions external to the property, such as market conditions or trends, or the integrity of data used in an analysis.” (USPAP)
There are no hypothetical conditions.
Data Research and Analysis In the performance of the market study, the type and extent of data researched and analyzed are profiled as follows.
• Regional & Neighborhood Analysis
• Primary Market Demographic Analyses
• Demographic data
• Total population trends
• Population trends by age cohorts: 45-to-65 age group and primary focus on 75+ age group
• Socioeconomic data
• Economic data
• Market Supply and Demand Analysis
• Definition of primary market area
• Interviews with marketing and executive directors
• Supply Analysis
• Identification and profile of the competitive supply
• Identification any proposed competitive supply
• Demand analysis
• Based demand growth
• General population
• 45-to-65 age group
• 75-plus age group
• Independent living supply and demand analysis
• Occupancy analysis
• Saturation analysis – fundamental supply and demand analysis to determine depth of demand based on peoples’ preferences for independent living as a lifestyle choice.
• Overview of current market occupancy
It is our opinion that the data research and analysis is sufficient to produce a credible assignment result.

Tellatin, Inc.
11
Micro-Economic Analysis Regional Analysis
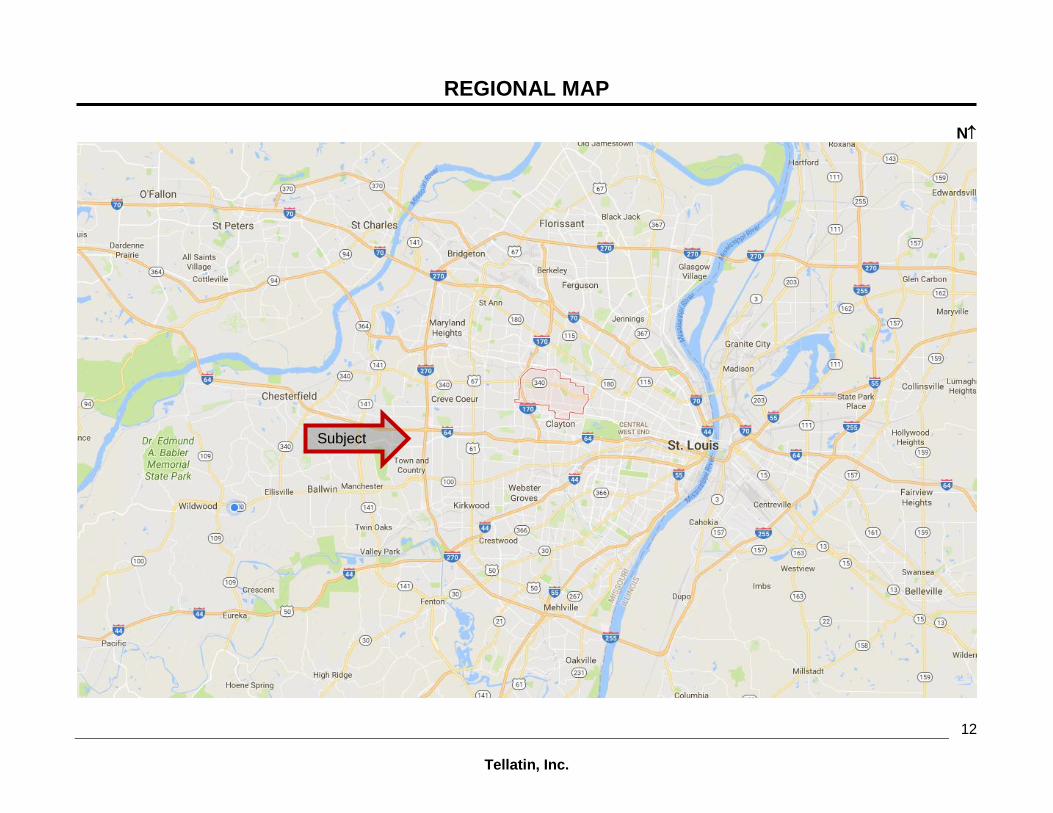
The regional analysis focuses primarily on levels of income and poverty, and employment composition. The optimum market area for senior housing and healthcare property has a growing number of elderly persons with high levels of income and wealth, and contains sufficient labor at reasonable wages. Income and wealth levels directly relate to the current and historical economic conditions of the region. The focus of this analysis is the 75-plus-age group – the greatest users of senior housing and healthcare properties. Physical Data The site of the proposed independent living facility is located in Chesterfield, St. Louis County, Missouri in the eastern portion of the state -- 20 miles west of the city of St. Louis. The bi-state St. Louis MSA encompasses 12 counties, including Franklin, Jefferson, Lincoln, St. Charles, St. Louis, and Warren Counties and the city of St. Louis in Missouri, and Clinton, Jersey, Madison, Monroe and St. Clair Counties in Illinois. St. Louis is situated on the western bank of the Mississippi River and just south of the Missouri River. These rivers separate the till plains to the north and east from the Ozark Plateau to the south and west. The St. Louis area has a generally rolling terrain with a humid continental climate consisting of cold winters and hot, humid summers.
The region has seen much of the wealthier residential areas and well-funded private institutional centers locate through a western corridor, while more industrialized areas have trended to develop northwesterly. The Illinois side of the region is more fragmented and much of the heavier industry (steel mills and refineries) is east of the Mississippi River. The St. Louis Central Business District has not experienced much development and job growth for several decades, as office-type job growth and corresponding commercial real estate development has been most active in the western corridor, near Interstates 64 and 270. The area of greatest residential and population growth is in St. Charles County, which is situated on the northwest area of the metropolitan area. The subject is located just west of the St Louis City Limits in Richmond Heights which has seen significant retail redevelopment on the south side of Interstate 64, just west of the subject. Richmond Heights is adjacent to Clayton, one of the main office districts in the St. Louis metro area. Major highways servicing the area include: Interstates 44, 55, 64 and 70; plus I-270/255, which serves as the regional circumferential. .
Tellatin, Inc.
12
REGIONAL MAP
N
Subject

Tellatin, Inc.
13
Demographic Data The trends for the total population are profiled as follows.
Table R-1 Region: Total Population Trends Table N-1 Neighborhood: Total Population Trends
St. Louis St. Louis
United States Missouri CBSA County
Total Population 2000 281,421,906 5,595,211 2,675,343 1,016,152
Total Population 2010 308,745,538 5,988,927 2,787,701 998,954
Total Population 2017 327,514,334 6,191,231 2,848,573 1,013,355
Total Population 2022 341,323,594 6,329,330 2,890,276 1,023,053
Annual Total Population Growth Rate
2010 to 2017 0.85% 0.48% 0.31% 0.20%
2017 to 2022 0.83% 0.44% 0.29% 0.19%
Source: ESRI, 2017 (2010 Census)
The population within the core business statistical area(CBSA) is forecasted to increase 0.29 percent annually from 2017 to 2022. Age demographics are important to isolate and analyze relative to unit/bed demand and staffing forecasts for the industry. The growth of the elderly population should correlate to growth in senior housing demand. The population trends, according to age group, are profiled in the following table.

Tellatin, Inc.
14
Table R-2 Region: Population Trends By Age Group Table N-2 Neighborhood: Population Trends By Age Group
St. Louis St. Louis
United States Missouri CBSA County
Total Population Ages 25 to 34
2017 45,352,541 830,125 385,737 127,040
2022 47,089,953 822,626 378,689 126,251
Annual Change 0.75% -0.18% -0.37% -0.12%
Total Population Ages 35 to 44
2017 41,060,751 751,374 356,944 120,185
2022 44,437,193 802,389 383,975 128,691
Annual Change 1.59% 1.32% 1.47% 1.38%
Total Population Ages 45 to 54
2017 42,570,702 796,857 379,439 134,063
2022 40,774,913 745,555 350,996 123,528
Annual Change -0.86% -1.32% -1.55% -1.62%
Total Population Ages 55 to 64
2017 42,369,186 828,448 391,873 145,133
2022 43,136,088 827,322 388,145 141,306
Annual Change 0.36% -0.03% -0.19% -0.53%
Total Population Ages 65 to 74
2017 30,023,583 594,248 261,403 100,362
2022 35,141,272 681,120 306,585 116,915
Annual Change 3.20% 2.77% 3.24% 3.10%
Total Population Ages 75 to 84
2017 14,541,340 296,652 131,328 53,527
2022 18,126,849 360,596 157,471 63,371
Annual Change 4.51% 3.98% 3.70% 3.43%
Total Population 85 and Over
2017 6,547,891 132,539 61,942 28,165
2022 6,857,035 137,525 63,420 28,992
Annual Change 0.93% 0.74% 0.47% 0.58%
Total Population 75 and Over
2010 18,554,555 387,804 178,092 75,250
2017 21,089,231 429,191 193,270 81,692
2022 24,983,884 498,121 220,891 92,363
Annual Change -- 2010 to 2017 1.85% 1.46% 1.18% 1.18%
Annual Change -- 2017 to 2022 3.45% 3.02% 2.71% 2.49%
Source: ESRI, 2017 (2010 Census)
The 75-plus-age group within the St. Louis CBSA is forecasted to increase 2.71 percent annually. The “graying of America” is a trend that started to boom in 2010 when the first “baby boomers” reached age 65. The boomers will not start turning 75 years of age until 2020. The level of wealth for the community, and specifically the market area of the subject facility, warrants closer examination. Wealth levels can be inferred through the following demographic data.
• Household and/or per capita income levels
• Home values
• Percentage of owner-occupied dwelling units
• Educational attainment

Tellatin, Inc.
15
Demographic data providing insight as to the socioeconomic status of the region are profiled as follows.
Table R-3 Region: Socioeconomic Indicators Table N-3 Neighborhood: Socioeconomic Indicators
St. Louis St. Louis
United States Missouri CBSA County
Average Household Income, 2017 $80,675 $70,118 $80,538 $93,384
Per Capita Income, 2017 $30,820 $28,143 $32,422 $38,105
Number of Households, 2017
<$15,000 14,111,230 296,346 114,879 33,592
$15,000 - $24,999 12,338,601 271,573 110,221 37,044
$25,000 - $34,999 11,900,340 269,897 107,653 38,073
$35,000 - $49,999 16,101,373 355,511 149,908 51,953
$50,000 - $74,999 21,924,374 460,299 209,592 73,847
$75,000 - $99,999 15,244,571 297,752 148,678 52,186
$100,000 - $149,999 17,092,812 305,595 167,617 61,597
$150,000 - $199,999 6,960,352 98,680 62,718 26,546
$200,000+ 7,483,548 92,530 60,903 34,424
Household Income Distribution, 2017
<$15,000 11.5% 12.1% 10.1% 8.2%
$15,000 - $24,999 10.0% 11.1% 9.7% 9.1%
$25,000 - $34,999 9.7% 11.0% 9.5% 9.3%
$35,000 - $49,999 13.1% 14.5% 13.2% 12.7%
$50,000 - $74,999 17.8% 18.8% 18.5% 18.0%
$75,000 - $99,999 12.4% 12.2% 13.1% 12.8%
$100,000 - $149,999 13.9% 12.5% 14.8% 15.1%
$150,000 - $199,999 5.7% 4.0% 5.5% 6.5%
$200,000+ 6.1% 3.8% 5.4% 8.4%
Median Home Value, 2017 $207,344 $156,108 $174,146 $194,399
Bachelor Degree or Higher (2016 Estimate) 19.3% 17.4% 20.0% 24.9%
Source: ESRI, 2017 (2010 Census)
Most metropolitan areas have higher cost-of-living indices limiting the benefit of the higher income levels, especially for the “working poor,” and income disparity typically ranges from poor inner urban areas to affluent suburban bedroom communities. The St. Louis MSA fits this description. The average household income for St. Louis County is 133.2 percent of the state average indicative of a high standard of living. St. Louis County has a lower percentage of low-income households (under $15,000), and correspondingly, a higher percentage of high-income households (over $100,000). In St. Louis County, the median home value is $194,399, which is relatively high in comparison to the state. The county population is more educated than the state based on college graduates. Most of these demographic data suggest that the regional population has a greater level of affluence compared to the statewide population.

Tellatin, Inc.
16
Economic Data The following table provides a breakdown of employment by industry sectors.
Table R-4 Region: Employment By Industry Table N-4 Region, Employment By Industry
St. Louis St. Louis
Employment Sector United States Missouri CBSA County
Total (Civilian Employment, Age 16+) 152,829,200 3,197,902 1,489,153 674,936
Agriculture/Mining 1.5% 1.3% 1.1% 0.9%
Construction 4.1% 3.6% 3.9% 3.8%
Manufacturing 8.6% 9.1% 9.7% 10.8%
Transportation 3.0% 2.9% 3.3% 3.2%
Communication 1.0% 0.9% 1.0% 0.7%
Utility 0.7% 0.6% 0.6% 0.2%
Wholesale Trade 4.5% 4.4% 4.1% 4.6%
Retail Trade 20.7% 20.4% 20.9% 21.9%
Finance/Insur/Real Estate 6.6% 6.7% 7.5% 8.7%
Service 42.4% 43.2% 42.7% 41.6%
Government 6.7% 6.6% 4.9% 3.3%
Unclassified Establishments 0.3% 0.1% 0.2% 0.2%
Source: ESRI, 2017 (2010 Census)
Within St. Louis County, employment sectors with a ratio of employment exceeding 125.0 percent of the national average are: manufacturing and finance/insurance/real estate. The greatest concentration is within service. St. Louis Major Employers
Employer Product/Services Employees
BJC Health Care Health Care 24,800
Boeing Defense Military Contractor 15,000
SSM Health Care Health Care 14,700
Washington University Education 13,700
Wal-Mart Stores Retail 13,000
Scott Air Force Base Military 12,900
Archdiocese Saint Louis Not-for-profit 11,000
Schnucks Markets Grocery 10,600
Mercy Health Health Care 10,300
McDonalds Food Service 9,600
United Postal Service Government 6,700
Wells Fargo Financial Finance 6,200 The regional economy has been following the same macroeconomic trends and the national economy. Since the bottom of the recession, the economy has been slowly growing and unemployment has been dropping. The Federal Reserve Bank of St. Louis reports the following in its most recent Beige Book.
• Economic conditions in the St. Louis zone have slightly improved since our previous report. Contacts reported no change in employment, generally due to difficulties finding qualified workers. Construction contacts noted that prices have moved up modestly as a limited supply of workers is pushing up labor costs.

Tellatin, Inc.
17
• Reports on consumer spending were generally positive: A regional director of tourism noted that activity has been higher over the past few months, and bookings indicate a positive outlook for the next few months. Manufacturing conditions continue to improve; however, statewide manufacturing indexes for Missouri suggest growth may be slowing.
• Real estate conditions continued to be constrained by a limited supply of homes for sale. Single-family home sales in the St. Louis MSA have declined slightly since our previous report. Construction activity remains constrained as well, as seasonally adjusted single-family building permits declined about 6 percent in May.
The regional economy has been recovering for the last several years from the national recession. As of June 2017, the unemployment in St. Louis County was 4.0 percent -- representing a decrease over the June 2016 unemployment rate, which was 4.9 percent (National unemployment rate is 4.4 percent; Missouri rate is 3.9 percent). Staffing all positions in long-term care and senior housing properties becomes problematic during periods of low unemployment. When unemployment rates drop, employees become more difficult to find and wages escalate. St. Louis has experienced considerable loss in national economic stature in the past several decades as many of its former Fortune 500 companies have been sold and merged. Without exception, the sales resulted in loss of jobs and other community support. The former McDonnell Douglas aviation company was sold to Boeing; Ralston Purina was sold to Nestle, Anheuser Busch was sold to InBev, May Companies was sold to Federated Department Store and Monsanto and Mallinckrodt were sold and returned to St. Louis later as much smaller companies. SBC Communications (AT&T) and General Dynamics moved their headquarters from St. Louis. Ford and Chrysler automobile assemblage plants have also closed. The region has found it difficult to recapture much of the lost employment from these major companies. Despite these losses, the economy continues to prosper with smaller business growth. Major strong points in the economy are in education -- Washington University and St. Louis University leading the way and medical research at Washington University Medical Center and BJC hospital. The City of St. Louis is relatively small geographically and saw a population peak at approximately 900,000 in 1950, before suburban flight began. The region has developed essentially two Central Business Districts. One is in the downtown St. Louis area and the other, eight miles west in Clayton. Most CBSAs that are not interrupted by complex water or topographical boundaries have a “wealth corridor” that represents the sector of the region where there is the greatest concentration of expensive housing, upscale shopping, private schools, major cultural institutions, and prime offices. This corridor, over time extends outward in a linear manner from the region’s central business district. The wealth corridor within St. Louis County radiates west along Interstate 64. The corridor has extended outward throughout the century, and based on current trends, it should continue in the same direction, with the greatest amount of urban in-fill redevelopment occurring in this direction. Seniors housing facilities within the corridor tend to have higher rental rates. The subject is situated within this band and its surroundings are considered a desirable residential and retail suburban area.

Tellatin, Inc.
18
Median Household Income
N
Subject

Tellatin, Inc.
19
Median Home Value
N
Subject

Tellatin, Inc.
20
Zillow Home Value Index
Source: Zillow.com
Conclusion Based on the main demographic indicators as presented above, coupled with our research of economic, physical, social and governmental factors, the region should provide average economic prospects for senior housing. Pertinent demographic data pertaining to the primary market area will be presented in the Primary Market Demand Trends section of the report. Furthermore, supply and demand conditions will be discussed in the Primary Market Demographic and Socioeconomic Analysis section of the report.

Tellatin, Inc.
21
Neighborhood Analysis
The value of senior housing and healthcare property are influenced by the same local physical, social, economic, and political forces that affect all real estate. Location and environment affect a property’s ability to compete for residents and staff. In this analysis, we have reviewed quantifiable demographic, residential property value and labor data to objectively measure, describe and analyze local forces on the subject. Additionally, we have observed the neighborhood during our site inspection to provide evidence in forming our opinion regarding the critical local forces that will drive the value of the subject.
Location Description and Analysis
The subject site is in the central portion of Chesterfield. The subject site is situated 20 miles west from the downtown St. Louis Central Business District. Access to the subject site is considered good as it will be located only about a half mile south of Interstate 64. The subject is situated in a suburban area that is in a growth phase of its life cycle.

Tellatin, Inc.
22
Aerial Photograph of the Subject Site and Surroundings N
Land uses surrounding the subject include:
• North: Central Pak Lake followed by a wooded area
• East: Central Park Lake followed by the Chesterfield Amphitheater
• South: August Hill Drive followed by single family residences
• West: A wooded area followed by single family residences
These adjacent land use and improvements impose no negative influence on the subject. Overall, the composition of real estate within the neighborhood complements the subject facility.
Central Park
SUBJECT Site Chesterfield Amphitheater
YMCA
Single Family Vacant Land
Aquatic Center
Church
Single Family

Tellatin, Inc.
23
NEIGHBORHOOD MAP
N

Tellatin, Inc.
24
NEIGHBORHOOD AERIAL MAP
N

Tellatin, Inc.
25
Demographic Data
For purposes of depicting the demographic characteristics for the surrounding area, we have defined the neighborhood as a one-mile radius centered on the subject. The following tables present demographic data for the defined neighborhood and provides comparisons to the regional population data. The following table presents population data.
Table N-1 Neighborhood: Total Population Trends Table MKT-1 Market: Population Trends
St. Louis Neighborhood Expanded Neighborhood
County 1-mile radius 3-mile radius
Total Population 2000 1,016,152 5,103 37,088
Total Population 2010 998,954 5,717 38,028
Total Population 2017 1,013,355 5,944 38,673
Total Population 2022 1,023,053 6,061 39,099
Annual Total Population Growth Rate
2010 to 2017 0.20% 0.56% 0.24%
2017 to 2022 0.19% 0.39% 0.22%
Source: ESRI, 2017 (2010 Census)
The population within the neighborhood is forecasted to increase at 0.39 percent annually from 2017 to 2022 -- a similar trend as the county. The population trends, according to age group, are profiled as follows.

Tellatin, Inc.
26
Table N-2 Neighborhood: Population Trends By Age Group Table MKT-2 Market: Population Trends By Age Group
St. Louis Neighborhood Expanded Neighborhood
County 1-mile radius 3-mile radius
Total Population Ages 25 to 34
2017 127,040 929 3,058
2022 126,251 859 3,066
Annual Change -0.12% -1.55% 0.05%
Total Population Ages 35 to 44
2017 120,185 762 3,988
2022 128,691 946 4,327
Annual Change 1.38% 4.42% 1.65%
Total Population Ages 45 to 54
2017 134,063 833 5,741
2022 123,528 756 5,195
Annual Change -1.62% -1.92% -1.98%
Total Population Ages 55 to 64
2017 145,133 814 6,567
2022 141,306 838 6,442
Annual Change -0.53% 0.58% -0.38%
Total Population Ages 65 to 74
2017 100,362 585 5,082
2022 116,915 660 5,710
Annual Change 3.10% 2.44% 2.36%
Total Population Ages 75 to 84
2017 53,527 303 2,544
2022 63,371 372 3,277
Annual Change 3.43% 4.19% 5.19%
Total Population 85 and Over
2017 28,165 174 1,433
2022 28,992 182 1,546
Annual Change 0.58% 0.90% 1.53%
Total Population 75 and Over
2000 75,250 430 3,489
2017 81,692 477 3,977
2022 92,363 554 4,823
Annual Change -- 2010 to 2017 1.18% 1.49% 1.89%
Annual Change -- 2017 to 2022 2.49% 3.04% 3.93%
Source: ESRI, 2017 (2010 Census)
The 75-plus-age group within the neighborhood is forecasted to increase 3.04 percent annually -- higher than the county rate of 2.49 percent. The increasing trend for the overall population within the neighborhood will influence the elderly population trend. The Demand Analysis within the Market Analysis will address these issues in more detail. Demographic data providing insight as to the socioeconomic status are profiled as follows.

Tellatin, Inc.
27
Table N-3 Neighborhood: Socioeconomic Indicators Table MKT-3 Market: Socioeconomic Indicators
St. Louis Neighborhood Expanded Neighborhood
County 1-mile radius 3-mile radius
Average Household Income, 2017 $93,384 $138,856 $163,529
Per Capita Income, 2017 $38,105 $63,498 $64,363
Number of Households, 2017
<$15,000 33,592 133 415
$15,000 - $24,999 37,044 173 628
$25,000 - $34,999 38,073 179 667
$35,000 - $49,999 51,953 274 1,012
$50,000 - $74,999 73,847 399 1,840
$75,000 - $99,999 52,186 450 1,899
$100,000 - $149,999 61,597 416 3,035
$150,000 - $199,999 26,546 263 2,001
$200,000+ 34,424 622 3,579
Household Income Distribution, 2017
<$15,000 8.2% 4.6% 2.8%
$15,000 - $24,999 9.1% 5.9% 4.2%
$25,000 - $34,999 9.3% 6.2% 4.4%
$35,000 - $49,999 12.7% 9.4% 6.7%
$50,000 - $74,999 18.0% 13.7% 12.2%
$75,000 - $99,999 12.8% 15.5% 12.6%
$100,000 - $149,999 15.1% 14.3% 20.1%
$150,000 - $199,999 6.5% 9.0% 13.3%
$200,000+ 8.4% 21.4% 23.7%
Median Home Value, 2017 $194,399 $400,000 $377,827
Bachelor Degree or Higher (2016 Estimate) 24.9% 38.8% 36.1%
Employment Sector
Total (Civilian Employment, Age 16+) 674,936 10,339 34,872
Agriculture/Mining 0.9% 0.7% 1.2%
Construction 3.8% 1.8% 4.3%Manufacturing 10.8% 2.4% 5.3%
Transportation 3.2% 0.6% 1.4%
Communication 0.7% 0.3% 0.6%
Utility 0.2% 0.3% 0.1%
Wholesale Trade 4.6% 2.0% 2.7%
Retail Trade 21.9% 40.9% 26.2%
Finance/Insur/Real Estate 8.7% 12.8% 13.3%
Service 41.6% 34.9% 42.1%
Government 3.3% 3.0% 2.7%
Unclassified Establishments 0.2% 0.2% 0.2%
Source: ESRI, 2017 (2010 Census)
The average household income within the neighborhood is higher than the county, and it is 198.0 percent of the state average -- indicative of a high standard of living. In comparison to the county, the neighborhood has a lower percentage of low-income households (under $15,000), and a comparable percentage of high-income households (over $100,000). The median home value within the neighborhood is $400,000, relatively high compared to the Missouri median home value of $156,108. Conclusion of Neighborhood Analysis Based on the main demographic indicators as presented above, coupled with our research of economic, physical, social and governmental factors, the neighborhood should provide good economic prospects for senior housing.

___________________________________________________________________
Tellatin, Inc.
28
Market Analysis Section

__________________________________________________________________
Tellatin, Inc.
29
Defining the Primary Market Area Primary market areas for senior housing are typically defined by a combination of geographic and socioeconomic boundaries, arterial transportation routes and senior housing supply. This generally equates to a five-mile radius ring centered on the subject property with a few exceptions. The western boundary is the Missouri River as most residents in St. Louis County do not cross the river for basic services. The northern Boundary is the Missouri River, the southern boundary is Manchester Road and the eastern boundary is Interstate 270. The remainder of St. Louis County is the sub-market, also known as the secondary market.
Primary Market Area Map
Demand Trends
Primary Market Demand Trends While the total population of the primary market area should be considered, the 75-plus and the 45-64 age cohorts impose the greatest impact on demand for seniors housing.
Z

__________________________________________________________________
Tellatin, Inc.
30
Total Population: The following table presents the total population trends.
Total Population Trends
St. Louis Primary
Missouri County Market
Total Population 2017 6,191,231 1,013,355 120,614
Total Population 2022 6,329,330 1,023,053 122,002
Annual Total Population Growth Rate
2017 to 2022 0.44% 0.19% 0.23%
Source: ESRI, 2017 (2010 Census)
For the primary market area, the population is forecast to increase at 0.23 percent annually -- a similar trend as the county. 75-Plus Age Cohort: The following table presents the demographic data for the 75-plus age group.
Population Trends for 75+ Age Cohort
St. Louis Primary
Missouri County Market
Total Population Ages 75+
2016 429,191 81,692 12,640
December, 1, 2017 447,724 84,589 13,194
2022 498,121 92,363 14,704
Annual Change 3.02% 2.49% 3.07%
Source: ESRI, 2017 (2010 Census)
The 75-plus population within the primary market area is forecast to increase at 3.07 percent annually -- a higher growth rate compared to the county. 45-64 Age Cohort: Adult children can have a profound effect on the demand for seniors housing. The importance of this population of segment is illustrated in the following table.
Adult Children Characteristics of Independent Living, Direct Capitalization Rate Industry Statistics
Assisted Living and Nursing Home Residents by Type of Senior Housing
Profile IL AL NH
Mean Age of Adult Children 54.6 53.9 55
Mean Number of Living Parents 1.68 1.77 1.41
Mean Monthly Amount of Finacial Assistance to Parent $884 $598 $635
% Involved in Decision for Parent to Move 66.0% 76.7% 81.8%
Source: Senior Housing Statistical Handbook, Edition III: ASHA
As seen in the table above, adult children are heavily involved in the decision process to move a senior into a retirement housing facility. In addition, they often provide substantial financial assistance at all care levels. Industry studies, along with our interviews with senior operators, suggest that 20.0 to 40.0 percent of residents will relocate to the primary market area to be near one or more of their children. The 45-64 age cohort is profiled in the table below.

__________________________________________________________________
Tellatin, Inc.
31
Population Trends for 45-64 Age Cohort
St. Louis Primary
Missouri County Market
Total Population Ages 45-64
2016 1,625,305 279,196 36,939
December, 1, 2017 1,610,249 275,042 36,368
2022 1,572,877 264,834 34,967
Annual Change -0.65% -1.05% -1.09%
Source: ESRI, 2017 (2010 Census)
According to the demographic forecasts for 2017 to 2022, the 45-64 population within the primary market area is forecast to decrease at an annual compounded rate of 1.09 percent. Income-qualified demand portrays a more precise measure of demand than simple total population figures. Demographic data providing insight as to the socioeconomic status are profiled as follows.
Table MKT-3 Market: Socioeconomic Indicators
Neighborhood Market
1-mile radius
Average Household Income, 2017 $138,856 $151,253
Per Capita Income, 2017 $63,498 $59,440
Number of Households, 2017
<$15,000 133 1,809
$15,000 - $24,999 173 2,102
$25,000 - $34,999 179 2,359
$35,000 - $49,999 274 3,883
$50,000 - $74,999 399 6,183
$75,000 - $99,999 450 5,518
$100,000 - $149,999 416 9,859
$150,000 - $199,999 263 5,425
$200,000+ 622 9,874
Household Income Distribution, 2017
<$15,000 4.6% 3.8%
$15,000 - $24,999 5.9% 4.5%
$25,000 - $34,999 6.2% 5.0%
$35,000 - $49,999 9.4% 8.3%
$50,000 - $74,999 13.7% 13.2%
$75,000 - $99,999 15.5% 11.7%
$100,000 - $149,999 14.3% 21.0%
$150,000 - $199,999 9.0% 11.5%
$200,000+ 21.4% 21.0%
Median Home Value, 2017 $400,000 $331,140
Bachelor Degree or Higher (2016 Estimate) 38.8% 35.5%
The average household income within the market compares closely to the neighborhood, and it is 215.7 percent of the state average -- indicative of a high standard of living. In comparison to the neighborhood, the market has a comparable percentage of low-income households (under $15,000), and a higher percentage of high-income households (over $100,000).

__________________________________________________________________
Tellatin, Inc.
32
Primary Market Home Value Trends The ESRI data shows the median home value in the subject’s primary market area of $331,140.
Supply Trends
Primary Market Area Supply The following tables summarize the salient data for the competitive facilities. The competitive occupancy rates, resident mixes, and private-pay rates are derived from a survey by Tellatin, Inc. The following pages include several maps and numerous tables that profile the competitive facilities. These maps and tables are outlined as follows.
• Competitive Maps o Primary Competitors o Secondary Competitors in the Market
• Summary of Primary Competitors o Independent Living

__________________________________________________________________________________________________________
Tellatin, Inc.
33
PRIMARY COMPETITORS
Note: Ring shown at 3 and 5-mile radii. N

___________________________________________________________________
Tellatin, Inc.
34
Existing Supply
Profile of the Primary Competitors
Ratings 1-10 (10 = Good)
Facility Name Management Company Zip Code Year(s)
Address Type of Control Income Built
1 Chesterfield Villas Delmar Gardens $122,014 1983/2015
14901 N Outer 40 Rd For Profit
Chesterfield
2 Friendship Village Chesterfield Friendship Village $122,014 1975/2013
15201 Olive Blvd Non-Profit
Chesterfield
3 The Willows at Brooking Park St. Andrew's Resources For Seniors $122,014 2004
211 S Woods Mill Rd Not For Profit
Chesterfield
4 The Fountains Of West County First Capitol Senior Living $102,665 2004
15826 Clayton Rd For Profit
Ellisville
5 Briarcrest Estates Holiday Retirement Corp. $102,665 1990
14525 Clayton Rd For Profit
Ballwin
6 Gambrill Gardens Silver Tree Residential, LLC $102,665 1979/2017
1 Strecker Rd Not For Profit
Ellisville
7 Garden Villas Delmar Gardens $122,014 1979/2014
13590 S Outer 40 Rd For Profit
Chesterfield
Subject Facility $138,856 2017
Source: TS&H Market Survey

___________________________________________________________________________________________________________
Tellatin, Inc.
35
Primary Competitors -- Independent Living Operating Statistics
# of Occu- Private- % 2nd 2nd
ILF pancy Pay Occu- One Bedroom Two Bedroom Occu-
Facility Name Units Rate Mix pant Rent Per SF Rent Per SF pant
1 Chesterfield Villas 73 88.0% 100.0% 18.5% $3,800 $6.67 $4,595 $5.34 $300
2 Friendship Village Chesterfield 244 98.0% 100.0% 25.0% 4,454 4.52 5,107 4.66 1,450
3 The Willows at Brooking Park 120 95.0% 100.0% 25.0% 3,162 3.10 4,778 2.68 450
4 The Fountains Of West County 160 97.5% 100.0% 16.0% 3,150 5.25 3,800 4.22 500
5 Briarcrest Estates 92 90.2% 100.0% 14.5% 2,750 4.29 3,100 3.44 500
6 Gambrill Gardens 100 97.0% 100.0% 15.0% 2,590 4.32 2,850 3.56 500
7 Garden Villas 63 75.0% 100.0% 17.0% 3,800 5.63 4,595 4.60 300
Totals/Averages 852 94.0% 100.0% 18.7% $3,387 $4.82 $4,118 $4.07 $571
Source: TS&H Market Survey
It should be noted that competitor Two and Competitor 3 in the above table are entry-fee facilities that charge a large up-front payment in addition to a monthly maintenance fee. The rates shown for these two facilities are only the monthly maintenance fee.

___________________________________________________________________________________________________________
Tellatin, Inc.
36
Primary Competitors -- Summary of Base Independent Living Unit Rates Summary and Forecast of Independent Living 2nd Occupant Rates/Ratios
One Bedroom Two Bedroom
Facility Name Rent Size/SF Per SF Rent Size/SF Per SF
1 Chesterfield Villas $3,800 570 $6.67 $4,595 860 $5.34
2 Friendship Village Chesterfield 4,454 986 4.52 5,107 1,096 4.66
3 The Willows at Brooking Park 3,162 1,020 3.10 4,778 1,780 2.68
4 The Fountains Of West County 3,150 600 5.25 3,800 900 4.22
5 Briarcrest Estates 2,750 641 4.29 3,100 900 3.44
6 Gambrill Gardens 2,590 600 4.32 2,850 800 3.56
7 Garden Villas 3,800 675 5.63 4,595 1,000 4.60
Average $3,387 727 $4.82 $4,118 1,048 $4.07
High $4,454 1,020 $6.67 $5,107 1,780 $5.34
Low $2,590 570 $3.10 $2,850 800 $2.68
Source: TS&H Market Survey It should be noted that competitor Two and Competitor 3 in the above table are entry-fee facilities that charge a large up-front payment in addition to a monthly maintenance fee. The rates shown for these two facilities are only the monthly maintenance fee.

___________________________________________________________________
Tellatin, Inc.
37
Proposed Supply
We have relied on several sources, including a review of CBRE-EA/Dodge Pipeline report, online internet searches, as well as our visits or telephone inquiries to local town and county planning and building departments, and interviews with market participants. These investigations may not disclose all possible additions to the competitive supply. We have attempted to be as comprehensive as possible and note that those interviewed may have overlooked or concealed some meaningful information. Based on these investigations, we have learned of quite a bit of new independent living facility construction or development activity in the primary market area. The Fountains of West County (A current competitor) is the process of constructing a 64- unit addition. The new four-story addition will be completed in the fall of 2018. According to the administrator, the building usually stays quite full and an expansion was necessary to accommodate a growing wait list. We have included all 64 of the new units as part of the market supply in our saturation analysis. Friendship Village (A current competitor) is also in the process of expanding their facility. This entry-fee facility will soon start construction on a new 52-unit independent living apartment building. In addition to the independent living building, the facility plans to construct a new 60 unit assisted living building as well as a new skilled nursing building with 144 beds. The independent living building is expected to be completed by the summer of 2020 and we have only included 25 percent of these units in the market as they will be entry-fee units. According to the administrator, the independent living units are already 73 percent pre-leased. Finally, a new facility called Shelbourne Senior Independent Living Facility is in the rezoning stages of development and pending approval will construct a 94-unit independent living facility on Chesterfield Parkway. This facility will pose the biggest threat to the subject facility as it will be located just a quarter mile east from the subject site and will directly complete with the subject facility. Therefore, we have included all of the units into the market supply for our saturation analysis.

___________________________________________________________________
Tellatin, Inc.
38
Independent Living This section of the Market Analysis specifically focuses on Independent Living, and it features the following outline.
• Occupancy Rate Analysis o Saturation Analysis
▪ Qualified Demand Analysis ▪ Supply Analysis ▪ Implications and Conclusions
o Competitive Market Survey
Market Analysis – Independent Living Saturation Analysis
A saturation analysis is a type of market analysis that identifies the maximum demand expected in a market called a saturation point. The saturation point is compared to existing and proposed supply to determine if the market has pent up or excess demand, or excess supply. The saturation ratio of a market is expressed as the ratio of actual demand relative to qualified demand.
Actual Demand ÷ Qualified Demand = Saturation Ratio Actual demand is the number of occupied units or beds in a market. Qualified demand is the age-, income-, and care-qualified number of persons in the market. In estimating an appropriate saturation ratio for the subject market, we have examined saturation ratios from comparable saturated markets. In those markets, we have determined the actual and qualified demand amounts in a manner and methodology that is consistent with our treatment of the primary market area. Qualified Demand Analysis The steps to calculate the qualified demand are as follows:
• Estimate of the minimum income needed to participate in the subject independent living market
• The number of people age 75-plus in the market
• The 75-plus population with incomes above the minimum income level.
• Additional income qualified after the sale of a primary residence. Age-and-Income Qualified Private-Pay Demand Forecast Seniors opting for independent living typically spend 60.0 to 80.0 percent of their income on market-rate monthly service fees or rental rates. We have forecasted that the independent living residents that reside at the subject will use roughly 67.0 percent of their income for housing. Independent living one bedrooms units in the subject market rent from a low of $2,590 to a high of $4,454 per month with an average of $3,387 per month. We have used an income qualifying rent of $2,590 per month, or $31,080 per year, in the following calculations. We have elected to use one-bedroom units as the rent threshold since these units are the most abundant unit type in the market.

___________________________________________________________________
Tellatin, Inc.
39
Interest income from the sale of personal residence is expected to increase the number of income-qualified persons in the potential demand pool. According to ESRI, the median home price of a single-family residence in the primary market area is $331,140. The following table calculates the minimum income necessary for an independent living unit at the subject.
Estimating Minimum Pre-Tax Income -- Independent Living
Minimum Monthly Rent $2,590
Months 12
Annual Rent/Fees for Subject $31,080
Percentage of Income for Rent 67.0%
Minimum Annual Income Necessary $46,388
Marginal Tax Bracket 15.0%
Minimum Pre-Tax Income $54,574
Median Home Value $331,140
Reduction Factor for Mortgage 80.0%
Net Home Value $264,912
After-Tax Safe Investment Rate 1.0% With Income from Home
Interest Income on Cash from Sale of Home $2,649
Minimum Pre-Tax Income, Reduced by Interest Income & Principal from Sale of Home $51,925
The following table presents the age-and-income qualified demand calculation based only upon annual income.
Independent Living Age/Income Qualified -- Based solely on Income above $54,574
2017 12/1/17 2022
Population 75+
Income of less than $15,000 954 972 1,022
Income $15,000 to $24,999 1,232 1,239 1,255
Income $25,000 to $34,999 1,465 1,450 1,414
Income $35,000 to $49,999 2,048 2,044 2,033
Income $50,000 to $74,999 2,919 3,010 3,255
Income $75,000 to $99,999 898 1,001 1,316
Income $100,000 to $149,999 1,608 1,773 2,268
Income Over $150,000 1,516 1,673 2,142
Total Population 75+ 12,640 13,162 14,704
Age & Income Qualified Population: $75,000 and Over 4,022 4,446 5,726
Age/Income Qualified -- Based on Income between $54,574 and $74,999
Fully Qualified from Income Ranges: $75,000 and Over 4,446
75+ Population with Income between: $50,000 and $74,999 3,010
Estimated % between: $54,574 and $74,999 81.7%
Income Qualified between: $54,574 and $74,999 2,459
Total Age/Income Qualified 75+ Population -- Based solely on Income above $54,574 6,905
After calculating the qualified demand from income only, we add additional qualified demand resulting from income generated by an annuity stream derived from the equity received upon the sale of a primary residence.

___________________________________________________________________
Tellatin, Inc.
40
% Qualified of Qualified
Income Qualified, with Income from the Sale of Home 75+ Population Income Range Population
Income of less than $15,000 N/A N/A N/A
Income $15,000 to $24,999 N/A N/A N/A
Income $25,000 to $34,999 N/A N/A N/A
Income $35,000 to $49,999 N/A N/A N/A
Income $50,000 to $74,999 3,010 10.6% 319
Income $75,000 to $99,999 N/A N/A N/A
Income $100,000 to $149,999 N/A N/A N/A
Income Over $150,000 N/A N/A N/A
75+ Population with Income between: $51,925 and $54,574 319
Total Age/Income Qualified -- Based on Annual Income between $51,925 and $54,574 319
Percentage of Dwellings Owner Occupied 58.0%
Total 75+ Age/Income Qualified, with Income from Sale of Home 185
75+ Age/Income Qualified -- Based on Income between $51,925 and $54,574 from Sale of Home
Total Age/Income Qualified 75+ Population -- Based solely on Income above $54,574 6,905
Total 75+ Age/Income Qualified, with Income from Sale of Home 185
Total Age/Income Qualified 75+ Population Demand 7,091
Independent Living Total Age and Income Qualified Demand
Market Inclusion Supply Analysis We have refined the market supply estimate by applying rates of inclusion to the respective competitors based on location and competitive units (rent threshold). The purpose of these adjustments is to derive an estimate of truly competitive market supply.
Market Supply - Independent Living
% Inclusion % Inclusion Net ILF
Location Competitive Supply
Primary Competitors Units/Beds in Market Units Units/Beds
Chesterfield Villas 73 100% 100% 73
Friendship Village Chesterfield 244 100% 25% 61
The Willows at Brooking Park 120 100% 25% 30
The Fountains Of West County 160 100% 100% 160
Briarcrest Estates 92 100% 100% 92
Gambrill Gardens 100 100% 100% 100
Garden Villas 63 100% 100% 63
Proposed Competitors
The Fountains of West County -- Addition 64 100% 100% 64
Friendship Village -- Addition 52 100% 25% 13
Shelborne Senior Living 94 100% 100% 94
Total Market Supply 750
The market contains a large number of entry-fee independent living units which will indirectly compete with the subject facility. Entry-fee facilities typically charge a very large upfront fee which in this market range from $281,115 up to $650,000, and then charge an additional monthly maintenance fee. We believe that the month to month rental structure of the proposed property differentiates itself enough from the entry-fee model that we have only included 25 percent of the entry-fee units in the market as being competitive with the proposed subject facility. After adjusting the competitors to eliminate non-competitive units, the total independent living supply is estimated to be 750 units.

___________________________________________________________________
Tellatin, Inc.
41
Empirical Data – Market-Derived Saturation Rates The following table shows saturation rates for selected independent living markets where supply and demand conditions are very near equilibrium, suggesting that nearly all the demand originating from within the market appears to be accommodated by that supply.
Market Derived Saturation Rates Based on FITCH Qualified Demand Model -- Independent Living
Qualified
Qualified Total Market Occupied Saturation
Year Primary Market Area -- Qualified Demand Demand Units Occupancy Units Rates
2011 Orange Park, Florida (Jacksonville area)
Total Market Private-pay Demand 3,522 402 87.6% 282 8.0%
2012 Vancouver, Washington
Total Market Private-pay Demand 6,097 761 90.8% 552 9.1%
2012 Salem, Oregon
Total Market Private-pay Demand 2,674 356 89.3% 254 9.5%
2011 Helena, Montana
Total Market Private-pay Demand 1,649 196 93.9% 147 8.9%
2011 The Dalles, Oregon
Total Market Private-pay Demand 775 96 76.0% 58 7.5%
2011 Edmond, Oklahoma
Total Market Private-pay Demand 4,784 691 90.4% 500 10.4%
2011 Portland, Oregon (Bethany Market Area)
Total Market Private-pay Demand 4,595 599 78.5% 377 8.2%
2012 Eugene, Oregon
Total Market Private-pay Demand 7,456 770 93.4% 576 7.7%
Totals and Averages
Total Market Private-pay Demand 31,552 3,871 88.7% 2,745 8.7%
Source: TS&H Market Survey, Claritas, Inc & FITCH Senior Housing Demand Model

___________________________________________________________________
Tellatin, Inc.
42
Our empirical data shows, on average, independent living markets have a saturation rate of 8.5 to 9.0 percent of total qualified demand but can range as high as 10.4 percent. Based on the empirical data, a saturation rate above 9.0% of qualified demand reveals a potentially overbuilt market. Implications and Conclusions The following table summarizes the conclusions and implications of our saturation rate analysis.
Summary of Conclusions and Implications -- Independent Living
Total Demand and Implied Occupancy Calculation
A. Qualified Demand 7,091
B. Empirical Equilibrium Saturation Rate Conclusion 9.0%
C. Implied Demand from Primary Market (A x B) 638
D. % of Demand From Primary Market 80.0%
E. Total Market Demand (C ÷ D) 798
F. Total Competitive Supply 750
Excess Demand Calculation
G. Total Market Demand 798
H. Total Competitive Supply at 95 Percent Occupancy (F x .95) 713
I. Excess Demand (G-H) 85
J. Balanced Supply required to achieve 95 Percent Market Occupancy (E ÷ .95) 840
K. % of Excess Demand (I ÷ H) 12.0%
As presented above, demand in the primary market is greater than the existing supply, indicating excess demand of 85 units/beds. The saturation analysis is simply one tool to analyze the market. The actual market occupancy rates, which are discussed next, should be given at least equal if not greater consideration when forecasting occupancy for the subject facility. Competitive Market Occupancy Survey Current market occupancy rates are summarized as follows.
Summary of Competitive Independent Living Facility Occupancy Rates Summary of Competitive Independent Living Facility Private-Pay Mixes
# of Fair Percent of Overall
# of Market Units/Beds Market Occupancy Market Penetration Comparability
Competitor Name Units/Beds Inclusion In Market Share Rate Captured Rate Rating 1-30
1 Chesterfield Villas 73 100% 73 8.6% 88.0% 8.0% 93.6% -
2 Friendship Village Chesterfield 244 100% 244 28.6% 98.0% 29.9% 104.3% -
3 The Willows at Brooking Park 120 100% 120 14.1% 95.0% 14.2% 101.1% -
4 The Fountains Of West County 160 100% 160 18.8% 97.5% 19.5% 103.8% -
5 Briarcrest Estates 92 100% 92 10.8% 90.2% 10.4% 96.0% -
6 Gambrill Gardens 100 100% 100 11.7% 97.0% 12.1% 103.2% -
7 Garden Villas 63 100% 63 7.4% 75.0% 5.9% 79.8% -
Market Totals/Averages 852 852 100.0% 94.0% 100.0% 100.0%
Market High 98.0% 29.9% 104.3%
Market Low 75.0% 5.9% 79.8%
Competitive occupancy rates vary greatly -- from 75.0 percent to 98.0 percent with an average of 94.0 percent. The high average occupancy rate suggests that there may be some excess demand in the market.

___________________________________________________________________
Tellatin, Inc.
43
• Garden Villas, a Delmar Gardens property is experiencing a low occupancy largely because the building is the oldest is the market and there is considerable deterioration; we believe the ownership may be looking down the road to redevelop the property in five to 10 years, and in the meantime, they are not reinvesting in the property. In fact, there was a second set of independent living buildings, of similar age, located on the east sided of this campus, that includes a skilled nursing facility, that were demolished a few years ago.
• Chesterfield Villas, also a Delmar product, is the only other property in the market to have an occupancy rate below 90 percent. That building is also one of the oldest in the market, but has seen capital investment in recent years. Both Delmar Gardens properties converted portions of their buildings to assisted living in 2013 and 2014, as aging-in-place issues were extensive, and the company had no place to accommodate that need, other than in their adjoining skilled nursing facilities. The addition of assisted living bridge the continuum of care.
• Grambill Gardens, which sold in 2016, has another 180 (approximate) units of HUD Section Eight units, which we are not including in the supply. The buyer must continue to honor Section Eight for many more years. The figures we used represent only the market rental units.
• Friendship Village and The Willows at Brooking Park are entrance-fee CCRC units.
Given the strong occupancy rates in the newer independent living, and the large size of the market, we believe the unmet need indicated by our saturation analysis is validated. Market Analysis Conclusion Our saturation rate analysis indicates that there is pent-up or excess demand in the primary market area. While the competitive occupancy rate shows an adjusted occupancy of 94.0, which indicates excess demand in the market area.

___________________________________________________________________
Tellatin, Inc.
44
Certification
We certify that, except as otherwise noted in this market study report, to the best of our
knowledge and belief: The statements of fact contained in this report are true and correct. The reported analyses, opinions, and conclusions are limited only by the reported assumptions and limiting conditions, and are our personal, impartial, unbiased professional analyses, opinions, and conclusions. We have no present or prospective interest in the property that is the subject of this report, and we have no personal interest with respect to the parties involved. We have no bias with respect to the property that is the subject of this report or to the parties involved with this assignment. Our engagement in this assignment was not contingent upon developing or reporting predetermined results. Our compensation for completing this assignment is not contingent upon the development or reporting of a predetermined value or direction in value that favors the cause of the client, the amount of the value opinion, the attainment of a stipulated result, or the occurrence of a subsequent event directly related to the intended use of this market study. The reported analyses, opinions, and conclusions were developed, and this report has been prepared, in conformity with the requirements of the Code of Professional Ethics and Standards of Professional Practice of the Appraisal Institute, which include the Uniform Standards of Professional Appraisal Practice. The subject facility was inspected by Mark A. Landzaat on November 16, 2017. Mark A. Landzaat has not provided services pertaining to the subject property during this time frame. Mark A. Landzaat does not have any current or prospective interest in the subject property or the parties involved.
Mark A. Landzaat Senior Appraiser

Exhibit A Engagement Letter


Exhibit B Photographs of the Subject Facility

Subject Photographs
Eastern Portion of Site Looking North
Future Entrance on August Hill Drive Looking West

Subject Photographs
Future Entrance on August Hill Drive Looking East
Southern Portion of the Site Looking North

Subject Photographs
Lake to the Northeast of the Subject Site
Eastern Portion of Site Looking North

Subject Photographs
Eastern Portion of Site Looking South
Eastern Portion of the Site Looking West

Exhibit C Photographs of the Competitive Facilities

PHOTOGRAPHS OF THE COMPETITIVE FACILITIES
Competitor One: Chesterfield Villas
Competitor Two: Friendship Village Chesterfield

PHOTOGRAPHS OF THE COMPETITIVE FACILITIES
Competitor Three: The Willows at Brooking Park
Competitor Four: The Fountains of West County

PHOTOGRAPHS OF THE COMPETITIVE FACILITIES
Competitor Five: Briarcrest Estates
Competitor Six: Gambrill Gardens

PHOTOGRAPHS OF THE COMPETITIVE FACILITIES
Competitor Seven: Garden Villas

Exhibit D Qualifications

___________________________________________________________________
Tellatin, Inc.
Mark A. Landzaat, MBA St. Louis, Missouri
Employment
Mr. Landzaat joined Tellatin, Short & Hansen in August 2001. Prior to joining the firm on a full-time basis, he interned with the firm while pursuing his college degree during the summers of 1999 and 2000.
Experience
Mr. Landzaat entered the commercial real estate appraisal industry as an assistant appraiser in August 2001, specializing in senior housing and healthcare properties. Most healthcare and seniors housing assignments have included an in-depth market analysis. The appraisals have functioned as support for clients in financing, litigation support, bankruptcy proceedings, and internal review. Mr. Landzaat has performed appraisals in more than ten states.
Education
Mr. Landzaat earned a Bachelor of Science degree in Business Administration from Rockhurst University in Kansas City, Missouri in 2001. His areas of emphasis in the BSBA degree were finance and economics.
Immediately after graduation in 2001, Mr. Landzaat pursued a master’s degree, and he graduated in 2003 with a Master of Business Administration, from Rockhurst University.
He has completed nearly all the course work required for the MAI designation offered by the Appraisal Institute.
15455 Conway Road, Suite 355 Chesterfield, Missouri 63017 Office Phone (636) 530-0009 Fax (636) 530-0046
Email: [email protected]