Telkom SA SOC Limited Group Interim · PDF fileOperational data 2 Telkom group interim results...
46
Group Interim Results for the six months ended 30 September 2017 SA SOC Limited
Transcript of Telkom SA SOC Limited Group Interim · PDF fileOperational data 2 Telkom group interim results...

Group Interim Resultsfor the six months ended 30 September 2017
Telkom SA SOC Limited

Telkom group interim results 2017 3Operational data 2
Contents
01 Overview of our business 07
30
44
34
86
04Condensed consolidated interim financial statements
05 Today’s presentation
02 Operational data
03 Financial performance
www.telkom.co.za
Telkom SA SOC Limited
(Registration number 1991/005476/30)JSE share code: TKG ISIN: ZAE000044897
Special note regarding forward-looking statements Many of the statements included in this document, as well as verbal statements that may be made by us or by officers, directors or employees acting on our behalf, constitute or are based on forward-looking statements.
All statements, other than statements of historical facts, including, among others, statements regarding our convergence and other strategies, future financial position and plans, objectives, capital expenditures, projected costs and anticipated cost savings and financing plans, as well as projected levels of growth in the communications market, are forward-looking statements. Forward-looking statements can generally be identified by the use of terminology such as “may”, “will”, “should”, “expect”, “envisage”, “intend”, “plan”, “project”, “estimate”, “anticipate”, “believe”, “hope”, “can”, “is designed to” or similar phrases, although the absence of such words does not necessarily mean that a statement is not forward looking. These forward-looking statements involve a number of known and unknown risks, uncertainties and other factors that could cause our actual results and outcomes to be materially different from historical results or from any future results expressed or implied by such forward-looking statements. Factors that could cause our actual results or outcomes to differ materially from our expectations, include but are not limited to those risks identified in Telkom’s most recent annual report, which is available on Telkom’s website at www.telkom.co.za/ir.
We caution you not to place undue reliance on these forward-looking statements. All written and verbal forward looking statements attributable to us, or persons acting on our behalf, are qualified in their entirety by these cautionary statements. Moreover, unless we are required by law to update these statements, we will not necessarily update any of these statements after the date of this document, so that they conform either to the actual results or to changes in our expectations.
The information contained in this document is also available on Telkom’s investor relations website www.telkom.co.za/ir.
Telkom SA SOC Limited is listed on the JSE Limited. Information may be accessed on Reuters under the symbol TKGJ.J and on Bloomberg under the symbol TKG.SJ. Information contained on Reuters and Bloomberg is provided by a third party and is not incorporated by reference herein. Telkom has not approved or verified such information and does not accept any liability for the accuracy of such information.

Operational data 4
Report structureTelkom provides fixed-line access and data communication services through Telkom South Africa and the mobile business offers mobile voice services, data services and handset sales through Telkom Mobile.
BCX provides converged infrastructure solutions, information and communication services including cloud, infrastructure, and workspace services; global service integration management; and hardware and network equipment sales in South Africa and African countries.
Results from continuing operationsThe comparative information for the period ended 30 September 2016 is restated as a result of a prior year correction relating to fraud in Trudon. The impact was a R61 million decline in profit after tax.
Refer to note 2.2 of the notes to the condensed consolidated interim financial statements for detailed disclosure on the restatement.
The group recorded a profit after tax of R1 659 million (September 2016: R1 760 million) and a 1.9 percent decrease on EBITDA of R5 201 million (September 2016: R5 301 million), resulting in a 7.4 percent decrease in headline earnings per share.
5
Key indicators
September 2017September 2016
Group interim results 2017 4
1 821
1 373
Cash at the end of the period
0R million
24.6%5 301
5 201EBITDA
0R million
1.9%
1 594
2 282
Mobile service
revenue
0R million
43.2%3 639
3 974
Capital expenditure
to revenue
0R million
9.2%
340.9
316.9
328.2
303.9HEPS
BEPS
0Cents / share
7.0%
7.4%15 928
15 791
20 237
20 109
Operatingrevenue
0R million
Net operating
revenue
0.6%
0.9%
R million
5 932
6 507
Datarevenue
0
9.7%3 775
3 652
Information technology
revenue
R million 0
3.3%

7
Message from group CEO: Sipho Maseko
Overview of our business
7
01
Johannesburg, South Africa – 10 November 2017, Telkom SA SOC Limited (JSE: TKG) today announced group interim results for the period ended 30 September 2017.
The first half of the year was characterised by a tough economic environment and increased competition. We saw corporate businesses defer their spend on information, communication and technology (ICT) as a result of an uncertain political, economic and policy environment. Even though South Africa exited the technical recession in the second quarter of the year, business confidence remains very low, with a lack of appetite for investment by corporate businesses. Lower spend from government placed a further damper on ICT spend in the public sector.
Telkom Group performance was negatively impacted by the challenging economic environment. BCX was mainly impacted as it is exposed to corporate businesses and the public sector which are both under pressure. In the short term BCX has accelerated cross selling opportunities across the customer base, ensuring that we retain our customers.
The Mobile business growth trajectory continued in the period with strong growth in active customers and stable ARPUs resulting in an increase of 43.2 percent in mobile service revenue. The strong mobile growth which boosted group’s performance was underpinned by an expansion of our network, distribution and the launch of innovative products which were well received by our customers. We are pleased that our mobile business received the MyBroadband Best Mobile Broadband Provider of the year award, in the best value for money category. The Ask Africa Orange Index awards, which are based on customer satisfaction ratings, placed both our mobile business and internet service provider in 2nd and 3rd place respectively against our competitors. In addition, the innovation of mobile has extended to its new content value added service as evidenced by winning the best innovation in the Broadcast Broadband Connection Award from AfricaCom.
Openserve continued its journey of transforming and modernising the network. We expanded the fibre ecosystem with the purpose of stimulating
the digital economy. Improved processes and efficiencies led to an increase in the connectivity rate of the homes passed. In the first half of the year, we connected more than 40 percent of homes passed while the active connectivity rate for the entire base is 24.5 percent. With a strong focus on bringing value to our customers, Openserve has brought prices down in the past 12 to 18 months with the recent 25 percent price reduction in IP Connect in the first half of the year. Our efforts to improve customer experience have also been recognised with Openserve receiving two MyBroadband 2017 awards, namely Fixed Broadband Provider of the year as well as 2017 Best Fixed Network.
Investment in our key growth areas, such as fibre and mobile, remains imperative to ensure that we are focused on our medium and long-term strategy. We remain cognisant of the group revenue pressure and we are diligent in ensuring that we continue to invest on a sustainable basis to improve our returns. We are encouraged by the strong growth in demand in mobile and fibre investments.
Customer experience remains a priority, with the key pillars being people, systems and processes. Having the right talent in the right place at the right time enables us to execute on our strategy. The new IT platform and the digitalisation of our stores have assisted us in improving customer experience. We continue to enhance our engagement models with our corporate customers. With our advanced internal data analytics services, we are able to have faster access to higher quality information that allows us to have a more proactive approach in managing our network, thereby enhancing our decision making in a timeous manner. We will continue to improve our fulfilling and assurance processes.
Sipho MasekoGroup chief executive officer

Telkom group interim results 2017 9Overview of our business 8
Capex increased 9.2 percent to R 3 974 million with capex to revenue of 19.8 percent in line with our guidance. We remain cognisant of revenue pressures and we are disciplined in extracting returns from our capital investment. Mobile and fibre remain key capex focus areas and we have witnessed strong returns in a form of service revenue growth of 43.2 percent in mobile and an active connectivity rate of 24.5 percent for fibre.
The Mobile business capital investment for the period increased 56.3 percent to R1 185 million. The largest contributor to this spend was the roll-out of the mobile network, on 3G and FDD LTE for our mobility led services, as well as TDD LTE/LTE Advanced for our nomadic data services. To this end, we increased our sites by 24.1 percent to 3 445, of which 1 945 are TDD LTE enabled and 114 are LTE Advanced. Furthermore, we completed re-farming of the 1800 MHz spectrum to enable FDD LTE on the older sites.
Openserve continued the investment in the fibre market underpinned by our strategy to modernise the network, resulting in more than 2.4 million premises passed with fibre. This ensures that we maintain and grow market share in the fibre market. The Consumer market benefited through our focused deployment approach, resulting in 73 710 homes connected with fibre. This translates to an overall active connectivity rate of 24.5 percent.
Service on Demand investment related to providing data connectivity which included a net growth of 6 196 new Metro Ethernet services.
The core network growth investment is primarily related to the packet optical transport network (POTN) roll-out. In the period, 3.7 terabytes bandwidth was added into the transport network.
Financial capital
Operating revenue impacted by weaker economic conditionsOperating revenue declined slightly by 0.6 percent to R20 109 million mainly impacted by the weak operating environment. The negative revenue impact was higher than expected as a result of deferred corporate ICT spend, reduced spend in the public sector as well as pricing pressures in the wholesale environment.
Group EBITDA impacted by lower revenueGroup EBITDA decreased 1.9 percent to R5 201 million with an EBITDA margin of 25.9 percent impacted by lower revenue. To respond to the revenue headwinds, we continued to aggressively drive our multiyear cost-efficiency initiatives as part of our ongoing business transformation, which included the rationalisation of vacancies and consolidation of positions to align with the new operating model. These measures have had a positive impact in ensuring that our expenses are kept well below inflation.
HEPS decreased based on lower revenuesHEPS decreased 7.4 percent to 303.9 cents mainly as a result of lower revenue. Basic earnings per share (BEPS) decreased 7.0 percent to 316.9 cents.
Financial capital
Salient features > Operating revenue declined slightly by 0.6 percent to R20 109 million
> EBITDA down 1.9 percent to R5 201 million with an EBITDA margin of 25.9 percent
> Headline earnings per share (HEPS) decreased 7.4 percent to 303.9 cents
> Capex increased 9.2 percent to R3 974 million
> Interim dividend decreased 9.9 percent to 118.1 cents per share
Group capital expenditure
September2017
Rm
September2016
Rm %
Fibre 1 177 929 26.7 Mobile 1 185 758 56.3 OSS/BSS programme 213 325 (34.5)Network rehabilitation/sustainment 145 192 (24.5)Service on demand 622 658 (5.5)Core Network 295 392 (24.7)Other 61 158 (61.4)Telkom 3 698 3 412 8.4 BCX 262 108 142.6 Other
Trudon 6 51 (88.2) Gyro 8 11 (27.3)
Capital expenditure included in PPE 3 974 3 582 10.9 Capital inventory - 57 (100.0)Total 3 974 3 639 9.2
Investment for future growth

Telkom group interim results 2017 11Overview of our business 10
Financial capitalcontinued
Strong balance sheet to fund future growthDespite the increase in net debt, including financial assets and liabilities to R7 562 million from R3 428 million as at 30 September 2017, our group’s capital structure remains strong with a net debt to EBITDA ratio of 0.7 times. This is in line with our strategy to move to a more efficient capital structure. We procured R2.4 billion to fund part of our capital investment for the period. On this date, the group had cash balances, including other current financial assets and liabilities of R1 227 million (September 2016: R1 530 million). Our group cash balances decreased mainly due an increase in capital expenditure in line with our strategy. We remain lowly geared with a comfortable debt maturity profile.
Free cash flow impacted by higher capex and taxFree cash flow was negatively impacted by the 12.0 percent increase in capital investment and higher tax paid resulting from an effective tax rate increase to 26.4 percent from 23.5 percent in the prior period and an increase in the group taxable income furthermore contributed to the negative free cash flow.
Our group performance was significantly impacted by the tough economic environment and increased competition. Based on the current economic climate and the impact of several price reductions in the wholesale environment, it will be challenging to meet the mid-single digit revenue growth by the year-end. Management will seek to keep operating revenue flat and continue to exercise discipline on costs to respond to the revenue headwinds.
Adjusted free cash flow
September2017
Rm
September2016
Rm %
Cash generated from operations 3 873 3 577 8.3
Add back: Package cost paid 55 522 (89.5)
Adjusted cash generated from operations 3 928 4 099 (4.2)
Interest received 125 253 (50.6)
Finance charges paid (264) (191) 38.2
Taxation paid (723) (373) 93.8
Adjusted cash generated from operations 3 066 3 788 (19.1)
Cash paid for capital expenditure (3 974) (3 547) (12.0)
Free cash flow (908) 241 (476.8)
FY2018H1 FY2018
ActualRevisedFY2018
Operating revenue Mid- single digits (0.6%) Flat
EBITDA margin 23% - 25% 25.9% 23% - 25%
Capex to revenue 17% - 20% 19.8% 17% - 20%
Net debt to EBITDA ≤ 1 0.7 ≤ 1
Financial guidance revised
Financial capitalcontinued

Telkom group interim results 2017 13Overview of our business 12
Productive capital
We increased our investment in the fibre ecosystem with the purpose of stimulating the digital economy. The investment enabled us to maintain the lead in the provisioning of high speed next generation broadband access with over 151 000 kilometres of fibre deployed nationally.
Openserve implemented speed increases across its fibre portfolio, upgrading 2 Mbps lines to 4 Mbps, and 8 Mbps to 10 Mbps. In the first half of the year, we connected more than 40 percent of the homes passed during the first six months while the overall connectivity rate increased 24.5 percent. With a strong focus on bringing value to our customers, Openserve has brought prices down in the past 12 to 18 months with the recent 25 percent price reduction in IP Connect in the first half of the year. In addition, we have also increased our ISP base to more than 150 resellers. Such improvements in pricing and speeds were underpinned by proactive maintenance and improved operational efficiencies.
The deployment of fibre to the cabinet, which complements our vast copper network, gives us the ability to provide high speed broadband reaching up to 40 Mbps to over 1.4 million of our customers. In addition, the successful completion of the G.Fast proof of concept will enhance our ability to provide even higher broadband speeds, utilising existing infrastructure.
Data consumption is driven extensively via the Enterprise market. The growing data demand is catered for through the provisioning of fibre-based Metro Ethernet customer lines which increased by 43 percent year on year. Metro Ethernet, being seen as the preferred migration
route from old legacy technology, will create the opportunity for us to enter into new markets through business partners, to gain a larger share of the ICT spend in the Enterprise environment.
Growth in mobile broadband (LTE, 5G and wi-fi) will significantly drive the demand for wholesale fibre services in the Carrier market. We have increased the number of fibre links to base stations by 10 percent to 6 183. Our pricing and infrastructure sharing strategy continues to make headway in reducing self-provisioning. We plan to leverage the IP-based footprint and our dense Metro fibre network to allow mobile operators to deploy smaller cells in lieu of the provision of 5G backhaul.
As the global market experiences increased competition from price volatility, Openserve is looking to reposition itself to increase the utilisation of the undersea cables and build managed service agreements with multiple players across the regions. We are confident that through improved cost to serve initiatives, focused client interaction and product innovation we will continue to redefine the data connectivity market in South Africa through pervasive, high quality network access and affordable services.
Customer experience remains a top priority for us. Our internal data analytics services provide predictive information that allow us to have a more proactive approach in managing our network and meet customer expectations more efficiently, with an improved quality of work.
In our endeavour to build and lead in the communication infrastructure market, we continue to provide the foundation for enabling a connected future for all South Africans.
Openserve investing in the broadband ecosystem

Telkom group interim results 2017 15Overview of our business 14
Productive capitalcontinued
BCX revenue performance impacted by tough economic environment
Despite the challenging operating conditions we remain focused on efficiencies, allowing us to invest in growth. In the short-term we are reacting to revenue headwinds by accelerating cross selling opportunities across our customer base, improving our engagement model across both large corporates and medium size customers, and developing innovative solutions informed by customer insights. We also focused on developing innovative solutions, with disruptive value propositions, catering for medium-sized entities.
Although our revenue performance has been disappointing, the opportunity to create a leadership position within the segment remains significant. The combination of IT and connectivity assets provides BCX with a unique opportunity to redefine the ICT market in South Africa. Current trends indicate that ICT stack lines are increasingly blurring with cloud migration and owning the network provides BCX with a significant competitive advantage.
To this end, we have embarked on a business re-organisation initiative which will enable us to be better at what we do today whilst investing in our future growth. There is an increased and immediate need to make existing businesses more effective, efficient and focused by creating two key delivery capabilities.
Firstly, our infrastructure, such as data centres, connectivity services and associated service delivery, will be run as centres of excellence. This allows us to create improved economies of scale and skill and improved service delivery resilience. Secondly, our applications development, maintenance, software engineering, and system integration skills will be brought together to improve our performance across the group, while investing in talent pools for SAP, Oracle, Microsoft and other key software technologies.
Simultaneously we have identified the need to create space and capability to invest in new technologies and capabilities such as data science and cyber security solutions and consultancy skills enabling us to work with customers to solve their business problems and use our technologies to deliver outcomes. BCX is investing in incubation and innovation skills and in identifying and finding the right new businesses, technologies and skills.
BCX has initiated a portfolio review process that will enable our strategy by identifying the core and non-core assets. This process has resulted in the classification of certain BCX assets as held for sale. BCX will continue the review process throughout the remainder of the financial year.
Revenue performance was negatively impacted by the poor economic conditions in South Africa. A higher level of fiscal restraint in South Africa became visible within the BCX customer base as customers continue to make more conscious choices regarding their ICT spend. Lower spend from government placed a further damper on ICT spend in the public sector.

Telkom group interim results 2017 17Overview of our business 16
Productive capitalcontinued
Mobile growth trajectory boosted the performance of the Consumer business
Mobile service revenue recorded a 43.2 percent growth supported by a 35.9 percent increase in the active subscriber base to 4.4 million with a blended average revenue per user (ARPU) stable at R92. This was underpinned by an investment in our network of R 1 185 million, extension of our distribution channels, increased store footprint and innovative data-led product suite launched in the prior year and now gaining traction. Postpaid subscribers increased 36.3 percent to 1.3 million, with an ARPU of approximately R184. Prepaid subscribers grew 35.7 percent to 3.0 million, with ARPU holding steady at R53.
Our mobile broadband-led strategy delivered a strong performance with mobile data revenue increasing 59.8 percent to R1 627 million supported by 108 percent growth in data usage. The refarming of our 1800 MHz spectrum is paying dividends with smartphone subscribers increasing by 28.4 percent to 2.1 million. Our fixed wireless LTE Smart Broadband offerings continue to do well with an increase of 72 percent in LTE subscribers, driven by our popular “Deal of the Month” and an improved quality and footprint expansion of our 2300 MHz LTE network.
The decline in fixed consumer broadband subscribers exhibited over the past few years has moderated with the base stabilising in the last two months. We continue to see significant growth in fibre customers albeit from a low base, driven by an increase in new-to-franchise business as well as migration of DSL customers
to fibre. Our packages are strengthened by the inclusion of uncapped data, which customers can use to download and stream rich media content. The innovative Unlimited Home product suite has redefined and broadened the addressable fixed broadband market base and increased the portion of new to franchise connections. High levels of churn seen previously have now stabilised and we see an increase in ARPU as existing customers migrate from capped to uncapped products and to higher speeds.
We have entered into the content sphere via an OTT enablement mechanism that seeks to drive broadband adoption in both the mobile and fixed domains. To this end we introduced LIT video and music on mobile and a LIT TV streaming device for fixed broadband. In support of this we have formed partnerships with various content players, including ShowMax, YouTube, Google Music and TV, Apple Music and Simfy Africa. We have strengthened our position in the content space by also offering a gaming option that further seeks to stimulate broadband growth, where broadband services facilitate the consumers’ adoption of video and entertainment. We offer an enabler to future broadband growth, from online video games through to console games, hardware and software, and accessories. In support of our foray into the gaming sphere we have formed partnerships with SuperSport, Logitech and Orlando Pirates.
Telkom Consumer performance was driven by the mobile business as the investment in capex yields impressive returns.

Telkom group interim results 2017 19Overview of our business 18
Productive capitalcontinued
Gyro established to monetise the property portfolio for long-term returns
Gyro is structured to provide three business services - Masts and Towers, Property Management Services and Property Development. Initial properties and all masts and towers were sold to Gyro Properties and Gyro Masts and Towers respectively on 1 April 2017.
Gyro Properties acquired 39 high potential properties including technical, commercial and industrial properties across the country with a concentration in urban nodes. The intention is to form partnerships with property developers.
Gyro Towers acquired approximately 6 500 masts and towers across South Africa from Telkom. The business is a neutral passive infrastructure provider focusing on delivering high quality service to all passive infrastructure users. Gyro Towers will focus on increasing co-location leases on existing towers, expanding current footprint and
increasing efficiencies. With a dedicated management team, we expect the tenancy ratio on our masts and towers to improve by renting out more space on existing towers with little incremental costs.
Gyro Property Management Services is a single point of contact with clients for a turnkey delivery of all property and tower related requirements to standardise, optimise and consolidate services, works and products. This business focuses on services such as integrated property management solutions, real estate asset management, facilities management and lease management.
Gyro was established on 1 April 2017 to unlock value by commercialising the property portfolio, extract value from excess building capacity, smart building solutions and allow Openserve to focus on its core business.

Telkom group interim results 2017 21Overview of our business 20
Productive capitalcontinued
Trudon driving digitalisation
Trudon continues to enhance its OTT partnership capabilities through partnerships with global players building compelling digital products aimed at helping businesses generate qualified leads for their business.
This includes continued growth of online advertising service Google Adwords where revenues have grown by 8 percent year on year. The partnership with Yext from the Insync presence management platform is also showing positive growth and there are now 5 000 active customers on the platform, since the launch in March 2017.
The pricing gap between traditional print products and entry level digital offerings continues to be a challenge. Trudon has partnered with the Web.com Group to bring an entry level presence solution to market at an attractive price. The digital webcard is mobile device friendly and comes with a unique domain giving customers an easy way to be found on a hyper local level. Demand for the product has been encouraging since the launch in August 2017 with the digital webcards mainly sold to new customers.
Building e-commerce and marketplace platforms that expand SME’s access to markets and customers remains a priority. One of the cornerstones of this strategy has been the enhancement of the home marketplaces application, Yapp. The app has now achieved 10 000 downloads and over 2 000 advertisements have been placed,
with 600 first time chat engagements being conducted with vendors. Further enhancements have been implemented since launch in February 2017 and the app now features booking, quotation and invoicing functionality with payment functionality planned for future releases. The Kompare cost comparison site has also seen over 300 percent growth in traffic year on year, and the level of clicks, being transactions which flow through to e-commerce gateways has increased by over 120 percent relative to the same period in 2016. Additional vertical categories are being introduced on a regular basis, with the latest focused on home improvement.
The Omni channel work is still underway and the business has enriched the data sets through the addition of 45 790 new business to our database since March. To further enhance the lead generation capabilities, Trudon has launched the Stratify solution that enables targeted marketing and lead generation using big data analytics. In addition, Trudon is in the process of concluding negotiations for the rollout of a nationwide Mobile Adxchange network for one of the major retailers with the view of going live before March 2018.

Telkom group interim results 2017 23Overview of our business 22
The Telkom Group IT function has been migrated to BCX with the related people and systems, with an outsourced service level agreement that was negotiated and signed, effective from 1 April 2017. Approximately 400 permanent employees have been transferred during the process. IT enterprise architecture and security architecture functions will remain at the Corporate Centre in Telkom Head Office.
We have appointed chief information officers to the three business units. The evaluation of new technology solutions and new technology value propositions to support the three business units will be completed in 2018.
Legacy systems decommissioning remains a top priority across all business units. Isolated legacy systems have been decommissioned and there remains a sizeable opportunity over the next three years to further decommission legacy systems and realise cost savings for Telkom group.
Customer experience continues to be a key priority focus area for the IT functions. The new next generation network (NGN) platform has 50% less clicks and movements between screens to fast track customer applications and requests for services. The new OSS/BSS NGN stack for fixed and mobile services has been deployed throughout the provinces of Eastern Cape, KwaZulu-Natal, Free State and North West. We intend to migrate all our Telkom Consumer customers in the remaining provinces to the new platform in the second half of the year. The NGN OSS/BSS stack has already processed all Telkom Consumer mobile customers throughout South Africa.
The backend IT systems and hardware in all our Telkom stores have been upgraded, providing new network connectivity and higher processing and response time speeds to stores and our customers. Training call centre and stores personnel is ongoing. We have rationalised the number of products on the OSS/BSS systems and continue to implement the IT strategy based upon the principles of simplification, consolidation, rationalisation, optimisation and standardisation.
Understanding our current talent, knowing where our gaps are and recognising the people investments we need to make are some of our key talent imperatives. With the support of our top leadership teams, we have built and embedded a clear talent framework and rhythm providing valuable insights to talent decisions across the business.
During the first half of the financial year, the executive leadership teams were actively involved in reviewing and mapping 253 senior level leaders, ensuring visibility of talent across the group. Through this we have identified a total of 97 high potential leaders from across the group, with 52 percent being in the age category 30 to 39 years. Clear succession plans with adequate emergency cover have been
identified to safeguard all key leadership roles, while development actions for successors have been put in place to build deeper and more diverse talent pipelines. The visibility of our talent has led to 54 percent of executive level placements being filled through internal talent mobility processes, promoting the movement of talent across the business while offering greater career and development opportunities for our leaders.
During the second half of the financial year, our focus will be on driving the targeted investment of our key talent, while ensuring we deploy our top talent in our mission critical roles across the business. Managing our talent will continue to closely align with our business strategy, helping build and attract the right supply of talent to deliver on our objectives.
Human capitalFocusing on our people
Intellectual capitalIT systems supporting customer experience
Having the right talent in the right place at the right time drives our talent management initiatives to support our key strategic priorities.
We continued to implement our IT strategy throughout Telkom, which aims to enable all newly formed business units to complete the journey of independence in line with the new Telkom operating model.

Telkom group interim results 2017 25Overview of our business 24
Socio-economic development
Social and relationship capitalGenerating societal value
Telkom is committed to improving its B-BBEE level in 2018 and has already commenced with initiatives which will result in additional points in the 2018 B-BBEE verification audit.
solutions with our customers. We are opening the doors of our market to new participants by making available the resources, relationships and support that technology entrepreneurs require to gain traction and grow their innovative ideas into businesses that can succeed. The launch of SpliceWorks on an
invitation only basis to 200 select technology entrepreneurs creates an online innovation and business enablement platform for the benefit of the entire group. These are the digital architects who will change the landscape to grow our country’s economy.
FutureMakers supports small black-owned enterprises with a focus on supply chain, channel development and the development of innovation solutions. An investment of R150 million has been made into the FutureMakers investment fund, which focuses on providing seed finance, early stage finance and commercial finance, for financing of black-owned small businesses. R44 million was invested towards providing
non-financial support such as connectivity, office space, mentorship, training, business management systems etc. More than 500 small businesses have benefited from the investment. BCX will invest approximately R100 million into hubs that foster technology entrepreneurship and innovation. In October we launched a Johannesburg-based innovation centre and incubation space to co-create smart
The Telkom Foundation’s new strategy aims to address the skills shortage in the ICT sector in the long term. The intent is to strengthen learner performance throughout high school and ultimately encourage and inspire learners to pursue careers in the ICT sector.
The strategy is three pronged. The first phase is focused on high school learner and teacher support with a blended education model incorporating both traditional and ICT teaching and learning. Grade 8 learners in seven schools receive supplementary tuition in maths, science, technology and language. Learners are also exposed to basic ICT skills such as coding and gaming, and are also supported through our integrated psycho-social programme. The second and third phases aim to facilitate post schooling opportunities for the same learners helping them to eventually participate in the mainstream economy. The Foundation is working with the FutureMakers programme to increase its reach of young people exposed to coding as a core skill in the ICT space.
In 2017, just under 1 000 learners in five schools in Tshwane West were registered in the programme. A further 2 000 learners will be registered in 2018 from Port Elizabeth and Tshwane West reaching a total of 3 000 in the next five years.
To ensure sustainability and long-term impact on the entire school, the programme also supports the training of teachers in these subjects as well as the use of ICT to improve teaching and learning. School leadership is also a focus of the programme with participating school principals already in a structured facilitated programme aimed at encouraging shared learning and support amongst these principals.
All learners have been pre-assessed in order to track their progress throughout the programme.
Enterprise and supplier development
Skills development continues to be a major focus across Telkom and subsidiaries. BCX is also investing in initiatives that will fuel the digital skills pipeline and impact the South African economy. We are building a generation of smart ‘digital warriors’ who can be absorbed not only by our own business, but by our customers, suppliers and partner SMMEs. Some of the initiatives include, but are not limited to:
> Investment in young talent development through the implementation of learnerships and internships for both employed and unemployed black people.
> WeThinkCode, where top candidates in South Africa are selected to join a full time two-year training course, during which they will learn how to use coding as a tool to solve problems in the evolving digital landscape.
> The Explore Data Science Academy in which we have invested over R50 million as a founding sponsor. The Academy is truly the first of its kind for South Africa and highlights the need for data science which has become a core and specialised skill-set for corporates who are looking to digitalise their operations, leverage big data and become insight leaders.

Telkom group interim results 2017 27Overview of our business 26
Looking forward, we will continue to seek a sustainable growth framework for the group. We intend to invest in a manner that enhances our financial sustainability to continue creating a platform for growth. We remain cognisant of the challenging economic environment and we will be diligent in the allocation of capital including measuring returns. It is imperative for the group to continue to invest in key growth areas in line with our strategy to ensure that we do not compromise our medium-term prospects. This is the primary reason for the increased investment in fibre and mobile.
As we focus on our growth framework for the group, we will continue the review of our business portfolio and prioritise strategic initiatives. This includes reviewing our legacy network and IT systems; non-core assets and product portfolio.
Openserve will focus on reviewing the network technology. We will continue to optimise our network footprint, by analysing our current deployed network and upgrading, decommissioning and using alternative technology where seen optimal. This is in line with our strategy of modernising, transforming and commercialising our network thus ensuring that the end customer continues to be given the best output value through the best possible connectivity option.
BCX will continue with its cost-conscious approach in order to preserve profit and margins. Our business portfolio review process will positively change the quality of our earnings and revenue mix. BCX will continue focussing on leading application and infrastructure service capabilities and investing in future growth areas, which include driving solutions and business outcomes for our customers. BCX remains a growth platform through which cloud computing and data analytics, amongst others, will be delivered.
Telkom Consumer will be discontinuing legacy products. This product rationalisation process will therefore see our suite of Unlimited, Freeme and Smart broadband products forming the bedrock of our sales and marketing advances going forward. In addition, we are redesigning our IT systems to drive and enable a lean business operating model and provide an automated business process. This IT redesign is premised on a nimble architecture supporting an Omni-channel service model. This will also incorporate a full digital channel element enabling and ecommerce and self-service capabilities. Telkom Consumer will continue on its trajectory of growing the mobile business by double digit growth, the stabilisation of the fixed consumer segment and reaffirming the market share in the small business sector.
We continue to drive the new operating model that provides greater business unit accountability for operational delivery and value contribution for the group as a whole, while ensuring strategic control from the corporate centre. We will continue to improve our organisational culture and foster increased initiative and enhance individual accountability. Talent management remains key in ensuring that we have the right skills in the business units. We believe our focus on talent management will ensure the sustainability of the group.
Natural capitalInvesting in renewable natural resources
Outlook
We are in the process of fitting lights with energy efficient motion sensors at the PV solar car park that automatically switch off during daytime hours and when there is no movement to reduce energy use. This will provide employees working after hours the comfort and security of sufficient illumination levels in the car parking area.
BCX moved to a more environmentally responsible office in July 2017. The building design has been rated 4 star by the Green Building Council certified by the Green Building Council of South Africa.
Our 3 MW grid-tied solar PV plant continues to generate 90% of our head office campus daytime energy demand, excluding our data centres.
We have installed a building management system that monitors, and controls key elements of the air conditioning, ventilation, electrical, access control, and fire and plumbing services. The building management system collects and monitors the following information:
> Water consumption
> Electrical consumption
> Domestic and treated water pumps’ status and alarm conditions
> Air conditioning and ventilation installation (HVAC) plant status, trip and alarm conditions
We will continue to implement initiatives to further reduce our energy consumption and, therefore, our emissions and costs.

Telkom group interim results 2017 29Overview of our business 28
Outlookcontinued
Salient dates with regard to the ordinary interim dividend
Declaration date Friday, 10 November 2017
Last date to trade cum dividend Tuesday, 28 November 2017
Shares trade ex dividend Wednesday, 29 November 2017
Record date Friday, 1 December 2017
Payment date Monday, 4 December 2017
Share certificates may not be dematerialised or re-materialised between Wednesday, 29 November 2017 and Friday, 1 December 2017, both days inclusive.
On Monday, 4 December 2017, dividends due to holders of certificated securities on the South African register will be transferred electronically to shareholders’ bank accounts.
Dividends in respect of dematerialised shareholders will be credited to shareholders’ accounts with their relevant central securities depository participant (CSDP) or broker.
Dividend policyOur policy is to pay an annual dividend of 60 percent of headline earnings with an interim dividend of 40 percent of interim headline earnings.
Declaration of dividendIn line with our dividend policy of paying an interim dividend of 40 percent of interim headline earnings for the six months ended 30 September 2017, the Board declared an ordinary interim dividend 21 of 118.114 cents per share. The declared dividend is payable on Monday, 4 December 2017 to shareholders recorded in the register of the company at close of business on Friday, 1 December 2017. The dividend will be subject to a local dividend withholding tax rate of 20 percent which will result in a net interim dividend of 94.49120 cents per ordinary share to those shareholders not exempt from paying dividend withholding tax. The ordinary dividend will be paid out of available cash balances.
The number of ordinary shares in issue at date of this declaration is 526 948 698. Telkom SA SOC Limited’s tax reference number is 9/414/001/710.

Telkom group interim results 2017 31Operational data 30
02 Operational data

Telkom group interim results 2017 3332
Operational data
September2017
September2016 %
SubscribersBroadband subscribers1 999 311 1 018 405 (1.9)
Mobile broadband subscribers 2 848 568 2 275 513 25.2
Closer subscribers 806 647 821 246 (1.8)
Internet all access subscribers2 533 550 561 581 (5.0)
Fixed access lines (’000)3 2 840 3 090 (8.1)
Revenue per fixed access line (ZAR) 2 265 2 339 (3.2)
Total fixed- line traffic (millions of minutes) 6 449 6 797 (5.1)
Fixed voice ARPUs 274.67 276.57 (0.7)
Fixed broadband ARPUs 346.30 321.88 7.6
Active mobile subscribers4 4 364 508 3 212 499 35.9
Pre- paid 3 035 173 2 236 996 35.7
Post- paid 1 329 335 975 503 36.3
ARPU (Rand) 92.46 88.84 4.1
Pre- paid 52.96 46.98 12.7
Post- paid 183.81 187.97 (2.2)
Smartphone subscribers 2 060 645 1 605 397 28.4
Pre- paid churn % 52.0 50.0 2.0
Post- paid churn % 12.0 12.0 -
Managed data network sites 46 844 46 978 (0.3)
September2017
September2016 %
Group employees5 18 522 19 021 (2.6)
Telkom company employees6 10 050 12 184 (17.5)
BCX group employees6 7 778 6 234 24.8
Trudon group employees 483 468 3.2
Gyro employees7 211 135 56.3
NetworkPorts activated via MSAN access 1 413 594 1 278 430 10.6
Fibre to the home 300 506 144 512 107.9
Fibre to the cabinet 2 123 523 1 826 836 16.2
Mobile sites integrated 3 445 2 777 24.1
LTE sites integrated 1 945 1 532 27.0
Active fibre connectivity rate % 24.5 13.0 11.5
1. Includes 6 985 (September 2016: 8 213) internal lines.2. Includes Telkom Internet ADSL, ISDN and WiMAX subscribers. 3. Excludes Telkom internal lines.4. Based on a subscriber who has participated in a revenue-generating activity within the last 90 days. 5. Based on number of group permanent employees. 6. Telkom business (1 180 ) and Telkom IT (401) employees were transferred from Telkom Company to BCX.7. 74 Telkom company employees were transferred to Gyro.

03 Financial performance

Telkom group interim results 2017 3736
Financial performance
September2017
Rm
September2016
Rm %
Voice and subscriptions 6 983 7 485 (6.7)
Usage 2 375 2 802 (15.2)
Subscriptions 4 021 4 163 (3.4)
Mobile voice & subscriptions 587 520 12.9
Interconnection 388 531 (26.9)
Fixed- line domestic 171 198 (13.6)
Fixed- line international 149 277 (46.2)
Mobile interconnection 68 56 21.4
Data1 6 507 5 932 9.7
Data connectivity 3 364 3 327 1.1
Internet access & related services 951 994 (4.3)
Managed data network services 545 566 (3.7)
Multi- media services 20 27 (25.9)
Mobile data 1 627 1 018 59.8
Customer premises equipment sales & rentals 1 766 1 707 3.5
Sales 118 139 (15.1)
Rentals 501 493 1.6
Mobile handset & equipment sales 1 147 1 075 6.7
Information technology 3 652 3 775 (3.3)
Converged communication1 8 37 (78.4)
Information technology service solutions2 2 089 2 306 (9.4)
Application solutions 948 824 15.1
IT hardware and software 374 311 20.3
Industrial technologies 70 61 14.8
Other 163 236 (30.9)
Other revenue 65 70 (7.1)
Trudon 421 478 (11.9)
Gyro 318 259 22.8
VS Gaming 9 - 100.0
Total 20 109 20 237 (0.6)
Group operating revenue
1. Enterprise which moved to BCX with the Enterprise/BCX integration, is disclosed in the voice and subscriptions, data, customer premises equipment sales and rentals and other revenue lines for comparability purposes.
2. IT business revenue of R227 million (September 2016: R183 million) previously reported as data is now disclosed as information technology.
Revenue driversGroup operating revenue decreased 0.6 percent to R20 109 million (September 2016: R20 237 million), driven by a 6.1% decline in fixed line service revenue to R11.6 billion partially offset by a 43.2% increase in mobile service revenue to R2.3 billion.
Fixed line voice usage and subscription revenue decreased by 8.2 percent to R6 396 million (September 2016: R6 965 million) driven by mobile substitution, an 8.1 percent decline in the number of fixed access lines and customers migrating to lower value bundled offerings.
Mobile voice and subscriber revenue increased 12.9 percent to R587 million (September 2016: R520 million). This is attributed to a 35.9 percent increase in the number of active mobile subscribers.
Interconnection revenue decreased 26.9 percent to R388 million (September 2016: R531 million) mainly due to the less traffic carried for other operators. The decline in interconnection revenue is offset by an 8.0 percent decrease in payments to other operators.
Fixed line data revenue decreased 0.7 percent to R4 880 million (September 2016: R4 914 million).
Data connectivity services increased slightly to R3 364 million (September 2016: R3 327 million) due to the migration from leased lines to higher capacity and lower priced megalines.
We saw a 4.3 percent decline from internet access and related services revenue to R951 million (September 2016: R994 million) due to a 5.0 percent decrease in internet all access subscribers.
Managed data network services revenue decreased 3.7 percent to R545 million (September 2016: R566 million) mainly due a decrease in satellite services and the 0.3 percent decrease in the number of managed network sites to 46 844 (September 2016: 46 978).
Mobile data revenue increased 59.8 percent to R1 627 million (September 2016: R1 018 million) driven by our strategy to focus on data which led to a 107.7 percent increase in mobile data traffic.
Customer premises equipment sales increased 3.5 percent to R1 766 million (September 2016: R1 707 million) mainly due to increased sales of high end devices.
Information technology decreased 3.3 percent to R3 652 million (September 2016: R3 775 million) mainly impacted by the economic pressure in the corporate business and public sector.

Telkom group interim results 2017 39Financial performance 38
Financial performancecontinued
September2017
Rm
September2016
Rm %
Payments to other operators 1 172 1 274 8.0
Cost of sales 3 146 3 035 (3.7)
Total 4 318 4 309 (0.2)
Group direct expenses
Group direct expenses remained flat year on year. Cost of sales increased 3.7 percent as a result of higher direct costs due to an increase in mobile subscribers connected. The increase was offset by lower payments to other operators of 8.0 percent as a result of lower traffic carried for other operators.
September2017
Rm
September2016
Rm %
Employee expenses 5 360 5 360 -
Selling, general and administrative expenses 3 531 3 722 5.1
Service fees 1 375 1 438 4.4
Operating leases 553 508 (8.9)
Depreciation, amortisation, impairments, write-offs
and impairment reversals
2 660
2 751 3.3
Total 13 479 13 779 2.2
Group operating expenses

Telkom group interim results 2017 41Financial performance 40
Operating expense driversGroup operating expenses including depreciation, amortisation, impairments, write-offs and impairment reversals decreased by 2.2 percent to R13 479 million (September 2016: R13 779 million).
Employee expenses remained flat at R5 360 million (September 2016: R5 360 million). The group headcount decreased 2.6 percent to 18 522 full-time employees. The savings emanating from the lower headcount were offset by an average salary increase of 6 percent and market related salary adjustments.
Selling, general and administrative expenses decreased 5.1 percent to R3 531 million (September 2016: R3 722 million) mainly due to lower support cost of services sold in our BCX segment partially offset by an increase due to Openserve’s focus on service improvement.
Service fees decreased slightly by 4.4 percent to R1 375 million (September 2016: R1 438 million) as a result of continued effective property management and a reduction in consultancy expenses.
Operating leases increased 8.9 percent to R553 million (September 2016: R508 million) due to recovering costs relating to delayed removal of mobile masts.
Depreciation, amortisation, impairments, write-offs and impairment reversals decreased 3.3 percent to R2 660 million (September 2016: R2 751 million) mainly due to a reversal of the impairment of network equipment items.
Investment incomeInvestment income consists of interest received on short- term investments and bank accounts.
Investment income decreased by 50.0 percent to R64 million (September 2016: R128 million) mainly as a result of lower cash balances.
Finance charges and fair value movementsFinance charges include interest paid on local and foreign borrowings, amortised discounts on bonds, fair value gains and losses on financial instruments, the cell captive and foreign exchange gains and losses on foreign currency denominated transactions and balances.
The increase in finance charges is due to higher borrowings over the course of the period. Foreign exchange and fair value movements decreased 107.7 percent to a gain of R6 million (September 2016: R78 million loss). This decrease was mainly as a result of an improved hedging strategy and a higher fair value gain from the cell captive.
Financial performancecontinued
TaxationThe reported tax expense increased by 10 percent to R594 million (September 2016: R540 million). The higher tax expense is due to tax losses in the group and deferred tax asset limitations. This also resulted in an increase in the effective tax rate by 2.9 points to 26.4 percent (September 2016: 23.5 percent).
Annexure A
Below are the results of BCX for the six month period ended 30 September 2017 (before inter- group eliminations).
September2017
Rm
September2016
Rm
Operating revenue 10 805 11 349
Payments to other operators 55 57
Cost of sales* 1 355 1 483
Net revenue 9 395 9 809
Other income - 45
Operating expenses 7 279 7 637
Employee expenses 2 448 2 206
Selling, general and administrative expenses 4 577 5 151
Service fees 168 203
Operating leases 86 77
EBITDA 2 116 2 217
Depreciation, amortisation, impairment, write- offs and
impairement reversals239 253
Operating profit 1 877 1 964
Statement of profit or loss
* BCX cost of sales has been reclassified to align with the change in the group cost of sales policy.
Telkom group interim results 2017 43Financial performance 42 43
Annexure B
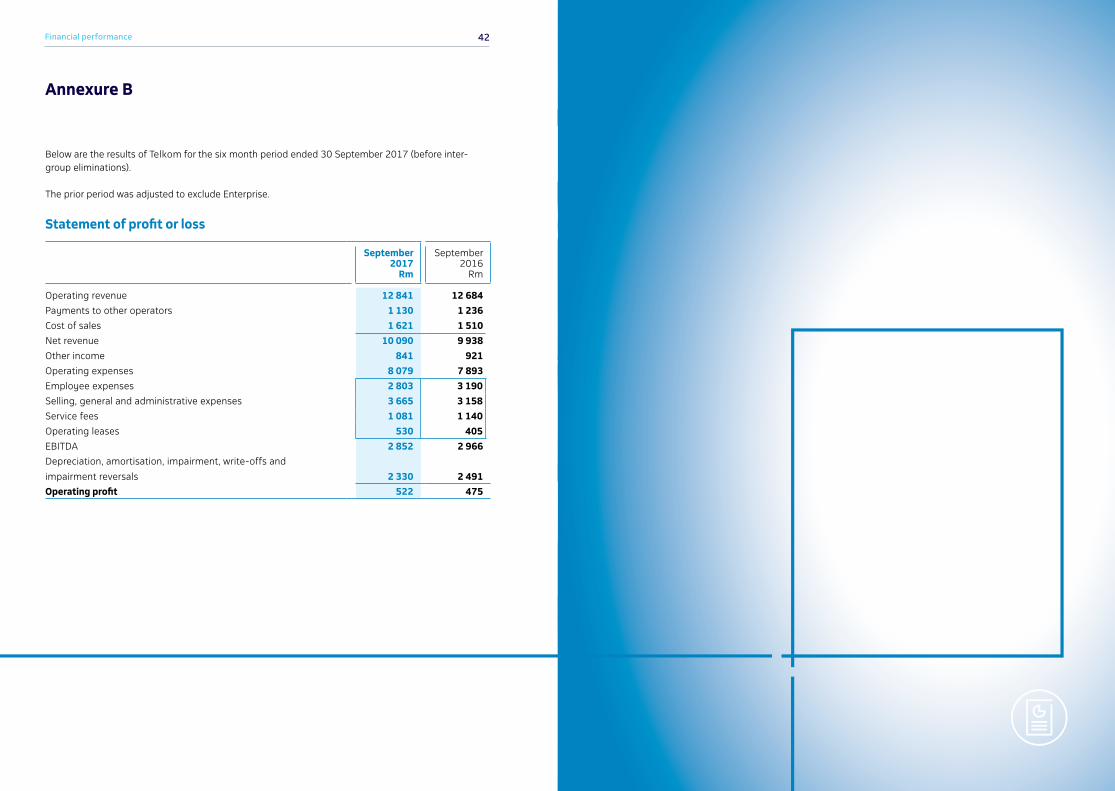
Below are the results of Telkom for the six month period ended 30 September 2017 (before inter-group eliminations).
The prior period was adjusted to exclude Enterprise.
Statement of profit or loss
September2017
Rm
September2016
Rm
Operating revenue 12 841 12 684
Payments to other operators 1 130 1 236
Cost of sales 1 621 1 510
Net revenue 10 090 9 938
Other income 841 921
Operating expenses 8 079 7 893
Employee expenses 2 803 3 190
Selling, general and administrative expenses 3 665 3 158
Service fees 1 081 1 140
Operating leases 530 405
EBITDA 2 852 2 966
Depreciation, amortisation, impairment, write- offs and
impairment reversals 2 330 2 491
Operating profit 522 475

Telkom group interim results 2017 45Operational data 44
04 Condensed consolidated interim financial statements
Condensed consolidated interim 46statement of profit or loss and other comprehensive income
Condensed consolidated interim 48 statement of financial position
Condensed consolidated interim 50statement of changes in equity
Condensed consolidated interim 51statement of cash flows
Notes to the condensed consolidated 52interim financial statements1. Corporate information 522. Basis of preparation and 52 accounting policies3. Segment information 604. Total revenue 665. Operating expenses 666. Taxation 687. Earnings per share 698. Capital additions and disposals 709. Employee benefits 7010. Other financial assets and other 71 financial liabilities11. Inventories 7212. Net cash and cash equivalents 7213. Deferred taxation 7314. Financial risk management 7415. Acquisition and disposals 7716. Interest-bearing debt 7917. Provisions 8018. Trade and other payables 8019. Commitments 8120. Contingencies 8121. Related parties 8222. Significant events 84 23. Events after the reporting date 85
Auditors’ Review ReportOur joint auditors, Ernst & Young Inc. and Nkonki Inc. have reviewed the condensed consolidated interim financial statements. The unmodified review report is available for inspection at the Group’s registered office.
Board approvalThe condensed consolidated interim financial statements were authorised for issue by the Board of Directors on 9 November 2017 and published on 10 November 2017.
Preparer and supervisor of annual financial statementsThese prepared condensed consolidated interim financial statements were supervised by the Group Chief Financial Officer, DJ Fredericks, CA(SA), BCompt (Hons), ACMA(UK), Honours in Business Management.

Condensed consolidated interim financial statements 46 Telkom group interim results 2017 47
Notes
ReviewedSix months
ended30 September
2017Rm
RestatedSix months
ended30 September
2016Rm
Operating revenue 4 20 109 20 237
Payments to other operators 5.1 1 172 1 274
Cost of sales* 5.2 3 146 3 035
Net operating revenue 15 791 15 928
Other income 4 229 401
Operating expenses 10 819 11 028
Employee expenses* 5.3 5 360 5 360
Selling, general and administrative expenses* 5.4 3 531 3 722
Service fees* 5.5 1 375 1 438
Operating leases* 5.6 553 508
EBITDA 5 201 5 301
Depreciation of property, plant and equipment* 5.7 2 336 2 305
Amortisation of intangible assets 5.7 359 376Write-offs, impairment and losses of property, plant and
equipment and intangible assets and
(impairment reversals) 5.7 (35) 70Operating profit 2 541 2 550
Investment income 4 64 128
Finance charges and fair value movements 352 378
Finance charges 358 300
Foreign exchange and fair value movements (6) 78
Profit before taxation 2 253 2 300
Taxation expense 6 594 540
Profit for the period 1 659 1 760
Condensed consolidated interim statement of profit or loss and other comprehensive incomefor the period ended 30 September 2017
Notes
ReviewedSix months
ended30 September
2017Rm
RestatedSix months
ended30 September
2016Rm
Other comprehensive income
Items that will be reclassified subsequently to profit
or loss
Exchange gains/(losses) on translating foreign
operations 4 (56)
Items that will not be reclassified to profit or loss
Defined benefit plan actuarial gains/(losses) 678 (207)
Defined benefit plan asset ceiling limitation 2 7
Income tax relating to actuarial gains/(losses) (63) -
Other comprehensive gains/(losses) for the period, net
of taxation 621 (256)
Total comprehensive income for the period 2 280 1 504
Profit attributable to:
Owners of Telkom 1 623 1 754
Non-controlling interests 36 6
Profit for the period 1 659 1 760
Total comprehensive income attributable to:
Owners of Telkom 2 244 1 498
Non-controlling interests 36 6
Total comprehensive income for the period 2 280 1 504
Total operations
Basic earnings per share (cents) 7 316.9 340.9
Diluted earnings per share (cents) 7 311.9 334.6
*Refer to note 2.1, 2.2 and 2.3
* *

Condensed consolidated interim financial statements 48 Telkom group interim results 2017 49
Notes
ReviewedSix months
ended30 September
2017Rm
AuditedYear ended
31 March 2017
Rm
Assets
Non-current assets 35 408 34 125
Property, plant and equipment 8 29 186 27 918
Intangible assets 8 4 718 4 720
Other investments 10 41 40
Employee benefits 9 706 635
Other financial assets 10 15 60
Finance lease receivables 291 310
Deferred taxation 13 451 442
Current assets 14 244 13 912
Inventories 11 1 606 1 384
Income tax receivable 53 9
Current portion of finance lease receivables 173 237
Trade and other receivables 8 425 8 156
Current portion of other financial assets 10 110 126
Current portion of other investments 10 2 504 2 388
Cash and cash equivalents 12 1 373 1 612
Assets of disposal groups classified as held for sale 15 8 12
Total assets 49 660 48 049
Equity and liabilities
Equity attributable to owners of the parent 28 316 27 569
Share capital 5 208 5 208
Share-based compensation reserve 394 452
Non-distributable reserves 1 473 1 376
Retained earnings 21 241 20 533
Non-controlling interests 323 337
Total equity 28 639 27 906
Condensed consolidated interim statement of financial positionat 30 September 2017
Notes
ReviewedSix months
ended30 September
2017Rm
AuditedYear ended
31 March 2017
Rm
Non-current liabilities 8 140 7 004
Interest-bearing debt 16 6 466 4 744
Employee related provisions 17 965 1 536
Non-employee related provisions 17 39 56
Deferred revenue 492 529
Deferred taxation 13 178 139
Current liabilities 12 881 13 139
Trade and other payables 18 7 065 7 516
Shareholders for dividend 77 25
Current portion of interest-bearing debt 16 2 343 1 541
Current portion of employee-related provisions 17 1 022 1 397
Current portion of non-employee-related provisions 17 154 124
Current portion of deferred revenue 1 575 1 570
Income tax payable 389 433
Current portion of other financial liabilities 226 440
Credit facilities utilised 12 30 93
Total liabilities 21 021 20 143
Total equity and liabilities 49 660 48 049

Condensed consolidated interim financial statements 50 Telkom group interim results 2017 51
Condensed consolidated interim statement of changes in equity
Condensed consolidated interim statement of cash flows
for the six months ended 30 September 2017 for the six months ended 30 September 2017
ReviewedSix months
ended30 September
2017Rm
Restated*Six months
ended30 September
2016Rm
Balance at 1 April 27 906 26 607
Restatement (Refer to note 2.2 & 2.3) – (242)
Restated balance at 1 April 27 906 26 365
Attributable to owners of Telkom 27 569 25 975
Non-controlling interests 337 390
Total comprehensive income for the period 2 280 1 504
Profit for the period 1 659 1 760
Other comprehensive income 621 (256)
Exchange gains/(losses) on translating foreign operations 4 (56)
Net defined benefit plan remeasurements 617 (200)
Dividend declared** (1 596) (1 451)
Acquisition of subsidiaries with non-controlling interest – 1
Purchase of shares for the Telkom Share Plan – (205)
Increase in share-compensation reserve 49 98
Balance at end of period 28 639 26 312
Attributable to owners of Telkom 28 316 25 958
Non-controlling interests 323 354
* Refer to note 2.1, 2.2 and 2.3** Dividend declared includes dividend to the non-controlling interests of the Trudon group and the BCX group.
Notes
ReviewedSix months
ended30 September
2017Rm
ReviewedSix months
ended30 September
2016Rm
Cash flows from operating activities 1 517 1 819
Cash receipts from customers 19 886 20 042
Cash paid to suppliers and employees (16 013) (16 465)
Cash generated from operations 3 873 3 577
Interest received 125 253
Finance charges paid (264) (191)
Taxation paid (723) (373)
Cash generated from operations before dividend paid 3 011 3 266
Dividend paid (1 494) (1 447)
Cash flows from investing activities (3 878) (1 805)
Proceeds on disposal of property, plant and equipment
and intangible assets 52 107
Additions to assets for capital expansion (3 974) (3 547)
Decrease/(increase) in repurchase agreements and other
financial assets 44 1 634
Acquisition of subsidiary, net of cash acquired 15 – 1
Cash flows from financing activities 2 182 (732)
Loans raised 4 930 –
Loans repaid (2 494) (377)
Finance lease capital repaid (3) (18)
Purchase of shares for the Telkom Share Plan - (205)
Proceeds from net derivatives 48 99
Repayment from net derivatives (299) (231)
Net decrease in cash and cash equivalents (179) (718)
Net cash and cash equivalents at beginning of period 1 519 2 542
Effect of foreign exchange rate differences on cash and
cash equivalents3 (3)
Net cash and cash equivalents at end of period 1 343 1 821

Condensed consolidated interim financial statements 52 Telkom group interim results 2017 53
1. Corporate information
Telkom SA SOC Limited (Telkom) is a company incorporated and domiciled in the Republic of South Africa (South Africa) whose shares are publicly traded. The main objective of Telkom group is to supply telecommunication, multimedia, technology, information and other related information technology services to the group customers, as well as mobile communication services, in Africa. Turnkey property and tower management solutions are also provided through the Gyro group.
2. Basis of preparation and accounting policies
Basis of preparationThe condensed consolidated interim financial statements have been prepared in accordance with IAS 34 Interim Financial Reporting and in compliance with the Listings Requirements of the JSE Limited, the South African Companies Act, 2008, as amended, the SAICA Financial Reporting Guides as issued by the Accounting Practices Committee, and the Financial Pronouncements as issued by the Financial Reporting Standards Council. The condensed consolidated interim financial statements are presented in South African Rand, which is the group’s presentation currency. All financial information presented in Rand has been rounded off to the nearest million. The condensed consolidated interim financial statements are prepared on the historical cost basis, with the exception of certain financial instruments initially (and subsequently) measured at fair value. The results of the interim period are not necessarily indicative of the results for the entire year and these reviewed financial statements should be read in conjunction with the audited annual financial statements for the year ended 31 March 2017. The preparation of the condensed consolidated interim financial statements requires the use of estimates and assumptions that affect the reported amounts of assets and liabilities and disclosure of contingent assets and liabilities at the date of the financial statements and the reported amounts of revenue and expenses during the reporting periods. Although these estimates are based on management’s best knowledge of current events and actions that the group may undertake in the future, actual results may differ from those estimates. Significant accounting judgements, estimates and assumptionsIn preparing these condensed consolidated interim financial statements, the significant judgements made by management in applying the group’s accounting policies and the key sources of estimation uncertainty were consistent with those applied to the consolidated financial statements for the year ended 31 March 2017.
2. Basis of preparation and accounting policies (continued)
Significant accounting policiesThe condensed consolidated interim financial statements have been prepared in accordance with the accounting policies adopted in the group’s most recent annual financial statements for the year ended 31 March 2017. The accounting policies have been applied consistently throughout the group for the purposes of preparation of these condensed consolidated interim financial statements. With the exception of IFRIC 23 noted below the group has not early adopted any other standard, interpretation or amendment that has been issued but is not yet effective. IFRIC 23 — Uncertainty over Income Tax Treatments early adoption: The group has made the decision to early adopt the interpretation which comes into effect for financial periods starting on or after 1 January 2019. The group has early adopted the interpretation as it believes that the interpretation provides clarity on the application of the group’s uncertain tax provision policy.
The interpretation provides clarification on how the requirements of IAS 12 should be applied when there is uncertainty over income tax treatments.
The interpretation will be applied prospectively as retrospective adoption is not possible without the application of hindsight.
IFRS 15 - Revenue from Contracts with CustomersManagement is in the process of completing the impact assessment regarding the implications of IFRS 15. It has been determined that IFRS 15 will lead to the re-allocation of revenue between the group’s revenue stream, with the CPE revenue line being impacted the most. The group is still assessing the final quantitative impact of the re-classification. As part of the completion of the impact assessment, management still needs to conclude on the best transition approach.
IFRS 9 - Financial InstrumentsManagement has completed a high-level assessment of the potential impact of IFRS 9 – Financial Instruments and has concluded that there is no significant impact anticipated regarding the initial recognition and measurement of the group’s financial instruments. It is anticipated that the classification and measurement of the group’s financial instruments will remain consistent with the current classification and measurement as disclosed in the significant accounting policies notes. It is also not anticipated that the application of hedge accounting under IFRS 9 will have a significant impact on the financial results of the group.Management is still in the process of quantifying the impact of IFRS 9 on the impairment models applied to its financial instruments. The group will apply the standard using the modified application approach.
Notes to the condensed consolidated interim financial statementsfor the six months ended 30 September 2017

Condensed consolidated interim financial statements 54 Telkom group interim results 2017 55
Notes to the condensed consolidated interim financial statements (continued)for the six months ended 30 September 2017
2. Basis of preparation and accounting policies (continued)
IFRS 16 - LeasesManagement has completed a high-level assessment of the potential impact of IFRS 16 – Leases and has concluded that there is no significant impact anticipated regarding the initial recognition and measurement of the group’s leases where the group is the lessor as the lease accounting will remain consistent with the current classification and measurement as disclosed in the significant accounting policies notes. The group is in the process of completing the impact assessment of IFRS 16 on the leases where the group is the lessee.As part of the completion of the impact assessment, management still needs to conclude on the best transition approach.
2.1 Correction of prior period errors and change in accounting policies 2.1.1 Correction of prior period errorsThe condensed consolidated interim financial statements provide comparative information in respect of the previous period. In addition, the group presents an additional statement of financial position at the beginning of the preceding period when there is a retrospective application of an accounting policy and a retrospective restatement. The correction of the prior period error, as disclosed below, did not impact the comparative statement of financial position as the matter was identified and corrected in the 31 March 2017 financial period. The comparative statement of profit or loss and other comprehensive income, statement of cash flows and statement of changes in equity have been restated to reflect the impact of the prior period error and the change in accounting policy.
Fraud – TrudonDuring the 31 March 2017 financial year, the group uncovered financial irregularities at one of its subsidiaries, Trudon, resulting in the termination of the services of the general manager IT.
An internal investigation into the financial irregularities was launched, which identified invoicing and accounting irregularities which led to the incorrect recognition and subsequent measurement of intangible assets over a period of several years. The investigation also identified the past practice of irregularly capitalising operating expenditure as intangible assets. The nature of the errors identified included:• Intangible assets capitalised for which there was no evidence of a valid asset or expense as
a result of the above financial irregularities• Expenses capitalised to intangible assets which on re-evaluation of the nature of the
expense, based on the invoice detail, were deemed to not meet the recognition criteria of IAS 38 at date of capitalisation
• Identification of intangible assets which were no longer in use and which had been decommissioned in earlier periods but not de-recognised at time of decommissioning
• Income tax implications in relation to expenses and wear and tear allowances deducted in prior periods relating to invoices associated with financial irregularities which, based on senior counsel opinion, should not have been deducted for tax purposes
2. Basis of preparation and accounting policies (continued)
2.1 Correction of prior period errors and change in accounting policies (continued) 2.1.1 Correction of prior period errors (continued)Fraud – Trudon (continued)These issues identified constituted material prior period errors and have been corrected by restating each of the affected line items for the prior period as shown in the table 2.2 and 2.3 below.
2.1.2 Change in accounting policiesCost of salesFor the financial period ended 30 September 2016, group included all the expenses that can be directly linked to revenue received for services provided and goods sold to customers in the definition of cost of sales. Following the sale of the Enterprise business to BCX in November 2016, the group elected to change its accounting policy for cost of sales to only include expenses directly linked to revenue from the sale of goods. This decision to change the accounting policy in the view of management will provide more reliable and relevant information to ensure consistent presentation across the group following the sale of Enterprise to BCX. The cost of sales policy for the period ended 30 September 2017 is consistent with the accounting policy amended and adopted as at 31 March 2017. This change in policy has resulted in the reclassification of these line items in the comparative statement of profit or loss and other comprehensive income. Refer to note 2.2.

Condensed consolidated interim financial statements 56 Telkom group interim results 2017 57
Notes to the condensed consolidated interim financial statements (continued)for the six months ended 30 September 2017
2. Basis of preparation and accounting policies (continued)2.2 Adjustments to the consolidated statement of profit or loss and other comprehensive income for the period ended 30 September 2016
Group
As previously reported
Rm
BCX Restatement*
Rm
Trudon IAS 8 disclosure**
RmRestated
Rm
Continuing operations
Operating revenue 20 237 – – 20 237
Payments to other operators 1 274 – – 1 274
Cost of sales 5 114 (2 079) – 3 035
Net operating revenue 13 849 2 079 – 15 928
Other income 401 – – 401
Operating expenses 8 978 1 997 53 11 028
Employee expenses 4 191 1 169 – 5 360
Selling, general and administrative expenses 2 879 790 53 3 722
Service fees 1 404 34 – 1 438
Operating leases 504 4 – 508
EBITDA 5 272 82 (53) 5 301
Depreciation of property, plant and equipment 2 234 82 (11) 2 305
Amortisation of intangible assets 376 – – 376
Write-offs, impairment and losses of PPE and IA 70 – – 70
Operating profit 2 592 – (42) 2 550
Investment income 128 – – 128
Finance charges and fair value movements 378 – – 378
Interest 300 – – 300
Foreign exchange loss and fair value movements 78 – – 78
Profit before taxation 2 342 – (42) 2 300
Taxation expense 521 – 19 540
Profit for the period 1 821 – (61) 1 760
Other comprehensive income
Items that will be reclassified subsequently to profit or loss
Exchange losses on translating foreign operations (56) – – (56)
Items that will not be reclassified to profit or loss
Defined benefit plan actuarial losses (207) – – (207)
Defined benefit plan asset ceiling limitation 7 – – 7
Other comprehensive loss for the period, net of taxation (256) – – (256)
Total comprehensive income for the period 1 565 – (61) 1 504
Total operations
Basic earnings per share (cents) 348.7 340.9
Diluted earnings per share (cents) 342.2 334.6
* Refer to Note 2.1.2 ** Refer to Note 2.1.1

Condensed consolidated interim financial statements 58 Telkom group interim results 2017 59
2. Basis of preparation and accounting policies (continued)2.3 Adjustments to the condensed consolidated interim statement of changes in equity for the period ended 30 September 2016
Group
As previously reported
Rm
Trudon IAS 8 disclosure*
RmRestated
Rm
Balance at 1 April 2016 26 607 (242) 26 365
Attributable to owners of Telkom 26 134 (159) 25 975
Non-controlling interests 473 (83) 390
Total comprehensive income for the period 1 565 (61) 1 504
Profit for the period 1 821 (61) 1 760
Other comprehensive income (256) – (256)
Exchange losses on translating foreign operations (56) – (56)
Net defined benefit plan remeasurements (200) – (200)
Dividend declared** (1 451) – (1 451)
Acquisition of subsidiaries with non-controlling interest 1 – 1
Purchase of shares for the Telkom Share Plan (205) – (205)
Increase in share-compensation reserve 98 – 98
Balance at end of period 26 615 (303) 26 312
Attributable to owners of Telkom 26 157 (199) 25 958
Non-controlling interests 458 (104) 354
* Refer to note 2.1.1** Dividend declared includes dividend to the non-controlling interests of the Trudon group and the BCX group.
Notes to the condensed consolidated interim financial statements (continued)for the six months ended 30 September 2017

Condensed consolidated interim financial statements 60 Telkom group interim results 2017 61
Notes to the condensed consolidated interim financial statements (continued)for the six months ended 30 September 2017
3. Segment information
The executive committee (Exco) is the group’s chief operating decision maker (CODM).
Management has determined the operating segments based on the reports reviewed by Exco
that are used to make the strategic decisions, allocate resources, and assess performance of each
reportable segment.
The CODM reviews the performance of the operating segments on a net operating revenue basis.
For this purpose the reportable segments have been determined as Openserve, Consumer, BCX
and “Other”.
The CODM reviews the results of the operating segments at an EBITDA level to determine the
allocation of resources. For this purpose the reportable segments have been determined as Fixed
Stream, Mobile Stream, BCX and “Other”.
“Other” includes Swiftnet, Trudon, Gyro Group and other business units.
In the current period, the CODM has also included intersegmental revenue in the measure of
performance used to assess performance and allocate resources. The performance measures
reviewed by the CODM excludes transfer pricing.
The September 2016 segment note has been restated to reflect the new review structure. In
November 2016, Telkom disposed of its Enterprise business unit to BCX. Enterprise has been
included in the BCX segment for the six months ended 30 September 2017. The comparative BCX
segment has been prepared as if the Enterprise sale had occurred effective 1 April 2016.

Condensed consolidated interim financial statements 62 Telkom group interim results 2017 63
3. Segment information (continued) Openserve Consumer BCX Other Consolidated
Rm Rm Rm Rm Rm
September 2017
Total operating revenue (including intersegmental revenue) 4 780 7 989 10 805 982 24 556
Intersegment operating revenue (2 723) – (1 562) (162) (4 447)
Operating revenue from external customers 2 057 7 989 9 243 820 20 109
Payment to other operators (568) (555) (24) (25) (1 172)
Cost of sales (44) (1 573) (1 307) (222) (3 146)
Segment net external operating revenue 1 445 5 861 7 912 573 15 791
Fixed Stream Mobile Stream
Total operating revenue (including intersegmental revenue) 9 342 3 427
Intersegment operating revenue (2 723) –Operating revenue from external customers 6 619 3 427 Payment to other operators (659) (464)
Cost of sales (192) (1 425)
Segment net external operating revenue 5 768 1 538
Earnings before interest, tax, depreciation and amortisation (EBITDA) for reportable segments
including intersegmental transactions 3 914 635 2 116 (1 464) 5 201
Reconciliation of operating profit to profit before tax
Earnings before interest, tax, depreciation and amortisation (EBITDA) for reportable segments 5 201
Depreciation, amortisation, impairment, write-offs and losses (2 660)
Operating profit 2 541
Investment income 64
Finance charges and fair value movement (352)
Profit before taxation 2 253
Other Segment Information
Capital expenditure of property, plant and equipment and intangible assets 2 295 1 185 262 232 3 974
Notes to the condensed consolidated interim financial statements (continued)for the six months ended 30 September 2017

Condensed consolidated interim financial statements 64 Telkom group interim results 2017 65
Notes to the condensed consolidated interim financial statements (continued)for the six months ended 30 September 2017
3. Segment information (continued) Openserve Consumer BCX* Other Consolidated
Rm Rm Rm Rm Rm
September 2016
Total operating revenue (including intersegmental revenue) 5 261 7 423 11 349 791 24 824
Intersegment operating revenue (2 944) (14) (1 574) (55) (4 587)
Operating revenue from external customers 2 317 7 409 9 775 736 20 237
Payment to other operators (717) (480) (57) (20) (1 274)
Cost of sales (6) (1 466) (1 233) (330) (3 035)
Segment net external operating revenue 1 594 5 463 8 485 386 15 928
Fixed Stream Mobile Stream
Total operating revenue (including intersegmental revenue) 10 016 2 668
Intersegment operating revenue (2 944) (14)
Operating revenue from external customers 7 072 2 654
Payment to other operators (838) (359)
Cost of sales (112) (1 360)
Segment net external operating revenue 6 122 935
Earnings before interest, tax, depreciation and amortisation (EBITDA) for reportable segments
including intersegmental transactions 4 432 203 2 217 (1 551) 5 301
Reconciliation of operating profit to profit before tax
Earnings before interest, tax, depreciation and amortisation (EBITDA) for reportable segments 5 301
Depreciation, amortisation, impairment, write-offs and losses (2 751)
Operating profit 2 550
Investment income 128
Finance charges and fair value movement (378)
Profit before taxation 2 300
Other Segment Information
Capital expenditure of property, plant and equipment and intangible assets 2 517 758 207 100 3 582
* Includes Enterprise results as if the transaction was effective on 1 April 2016.

Condensed consolidated interim financial statements 66 Telkom group interim results 2017 67
4. Total revenue Reviewed Six months
ended 30 September
2017 Rm
Reviewed Six months
ended 30 September
2016 Rm
Operating revenue 20 109 20 237
Other income* (excluding profit on disposal of property, plant
and equipment, intangible assets and disposal of business)
197 257
Investment income 64 128
Operating revenue has decreased in the current year due to lower traffic volumes in the Openserve
and BCX business units. The decrease in revenue was also impacted by an increasingly competitive
environment. Print revenue from the Trudon business has also been decreasing due to lower
volumes traded.
The decrease in other income relates primarily to a decrease in interest received in overdue trade
receivable balances and finance lease receivable balances.
* The profit on disposal of the excluded items is R32 million (30 September 2016: R144 million).
5. Operating expenses Reviewed
Six months ended
30 September 2017
Rm
Restated*Six months
ended30 September
2016Rm
5.1 Payments to other operators 1 172 1 274 The decrease is as a result of lower traffic carried for other operators.5.2 Cost of sales 3 146 3 035 The increase in cost of sales relates to higher per unit costs and subscriber numbers related to CPE sales in the period under review.
5.3 Employee expenses 5 360 5 360 Included in the expense for the period is lower performance incentive expenses incurred in the current reporting period due to the internal performance targets not being fully achieved as planned. The decrease was offset by an average salary increase of 6 percent and a market related salary adjustment.
Notes to the condensed consolidated interim financial statements (continued)for the six months ended 30 September 2017
5. Operating expenses (continued) ReviewedSix months
ended30 September
2017Rm
Restated*Six months
ended30 September
2016Rm
5.4 Selling, general and administrative expenses 3 531 3 722 The decrease in selling, general and administrative expenses is mainly due to the cost containment strategy being implemented in the group and the restriction of discretionary expenditure and lower marketing expenditure. Included in selling, general and administrative expenses is a write-down of inventories to the value of R35 million (30 September 2016: R21 million).5.5 Service fees 1 375 1 438 The decrease is largely due to continued effective property management and a reduction in consultancy expenses.5.6 Operating leases 553 508Operating lease expenditure has increased with annual escalation clauses implemented and due to recovering costs relating to delayed removal of mobile masts.5.7 Depreciation, amortisation, impairment, write- offs and losses/(impairment reversals)
2 660 2 751
Depreciation of property, plant and equipment 2 336 2 305
Amortisation of intangible assets 359 376
Write-offs of property, plant and equipment and intangible assets/(reversal of impairments) (35) 70
Depreciation increased due to higher CAPEX levels in the current period, offset by the extension of useful lives of certain assets as at 30 September 2017 as Telkom refocused its capital investment spend. This resulted in a net decrease in depreciation and amortisation of R91 million. The total depreciation for future periods of these assets will be higher due to the reassessment. The impairment reversal relates to a favourable re-assessment of the manner in which previously impaired assets are expected to be utilised.
*Refer to note 2.2

Condensed consolidated interim financial statements 68 Telkom group interim results 2017 69
Notes to the condensed consolidated interim financial statements (continued)for the six months ended 30 September 2017
7. Earnings per share ReviewedSix months
ended30 September
2017Rm
Restated*Six months
ended30 September
2016Rm
Total operations
Basic earnings per share (cents) 316.9 340.9
Diluted earnings per share (cents) 311.9 334.6
Headline earnings per share (cents) 303.9 328.2
Diluted headline earnings per share (cents) 299.1 322.2
Reconciliation of weighted average number of ordinary shares: Number of shares
Number of shares
Weighted ordinary shares in issue 526 948 700 526 948 700
Weighted average number of shares held by subsidiaries
and in escrow (14 869 186) (12 398 650)
Weighted average number of shares outstanding 512 079 514 514 550 050
Reconciliation of diluted weighted average number of
ordinary shares
Weighted average number of shares outstanding 512 079 514 514 550 050
Expected future vesting of shares 8 268 074 9 725 687
Diluted weighted average number of shares outstanding 520 347 588 524 275 737
Total operations
Reconciliation between earnings and headline earnings: Rm Rm
Profit for the year 1 659 1 760
Non-controlling interests (36) (6)
Profit attributable to equity holders of Telkom 1 623 1 754
Adjustments:
Profit on disposal of property, plant and equipment and
intangible assets (32) (87)
Profit on disposal of business – (57)
Write-offs of property, plant and equipment and intangible assets (35) 70
Taxation effects – 9
Headline earnings 1 556 1 689
Dividend per share (cents) 291.00 270.00
The calculation of dividend per share is based on dividends of R1 532 million (30 September 2016: R1 422 million) declared on 1 June 2017 and 526 948 700 (30 September 2016 : 526 948 700) number of ordinary shares outstanding on the date of dividend declaration.
*Refer to note 2.2 and 2.3
6. Taxation ReviewedSix months
ended30 September
2017Rm
Restated*Six months
ended30 September
2016Rm
Taxation 594 540
South African normal company taxation 622 557
Deferred taxation (refer to note 13) (33) (20)
Foreign Tax 5 3
The increase in the tax expense relates to the increase in the effective tax rate for interim reporting purposes when compared to the prior reporting period. * Refer to note 2.2

Condensed consolidated interim financial statements 70 Telkom group interim results 2017 71
8. Capital additions and disposals ReviewedSix months
ended30 September
2017Rm
AuditedYear ended
31 March 2017
Rm
Property, plant and equipment
Additions 3 659 7 536
Disposals (8) (67)
Intangible assets
Additions 327 1 069
Disposals (12) –
Capital expenditure for the six months ended 30 September 2017 relates primarily to the expansion of existing networks and services, expansion of the Mobile network and expenditure related to the Next Generation Network programme. The focus of the current capital investment program remains the Next Generation Network technologies. It is expected that this focus will be maintained in the near future. Finance charges of R91 million (31 March 2017: R130 million) were capitalised to property, plant and equipment and intangible assets in the current financial year.
Notes to the condensed consolidated interim financial statements (continued)for the six months ended 30 September 2017
9. Employee benefits ReviewedSix months
ended30 September
2017Rm
AuditedYear ended
31 March 2017
Rm
706 635
Telkom Pension net Fund asset (TPF) 23 23
Post retirement medical aid net plan asset (PRMA) 683 612
The assets recognised are determined in accordance with IAS 19. The increase in the net asset is due to a decrease in the offsetting obligations due to changes in the financial assumptions applied to the valuations. The TPF had fund assets of R196 million (31 March 2017: R197 million) and benefit obligation of R89 million (31 March 2017: R92 million). The asset restriction is R84 million (31 March 2017: R82 million). In the current period there was a restriction on the interest return of R8 million. The PRMA had plan assets of R2 847 million (31 March 2017: R2 872 million) and benefit obligation of R2 164 million (31 March 2017: R2 260 million).
10. Other investments and financial assets ReviewedSix months
ended30 September
2017Rm
AuditedYear ended
31 March 2017
Rm
Non-current other investments 56 100
FutureMakers 11 11
Equity investment in Number Portability Company 5 5
Loan at amortised cost 15 60
BCX group interests in associates and joint ventures 25 24
Other financial assets
Current portion of other financial assets consist of: 110 126
- Derivative instruments 62 78
Forward exchange contracts 54 54
Firm commitments 8 24
- Asset finance receivables 48 48
The decrease in other financial assets is primarily due to movement in the derivative instruments as a result of the underlying movement in foreign exchange rates.
Current other investments consist of:
- Cell Captive preference shares 2 504 2 388
The increase in the Cell Captive investment is due the restructuring of the investment portfolio to a better performing portfolio.
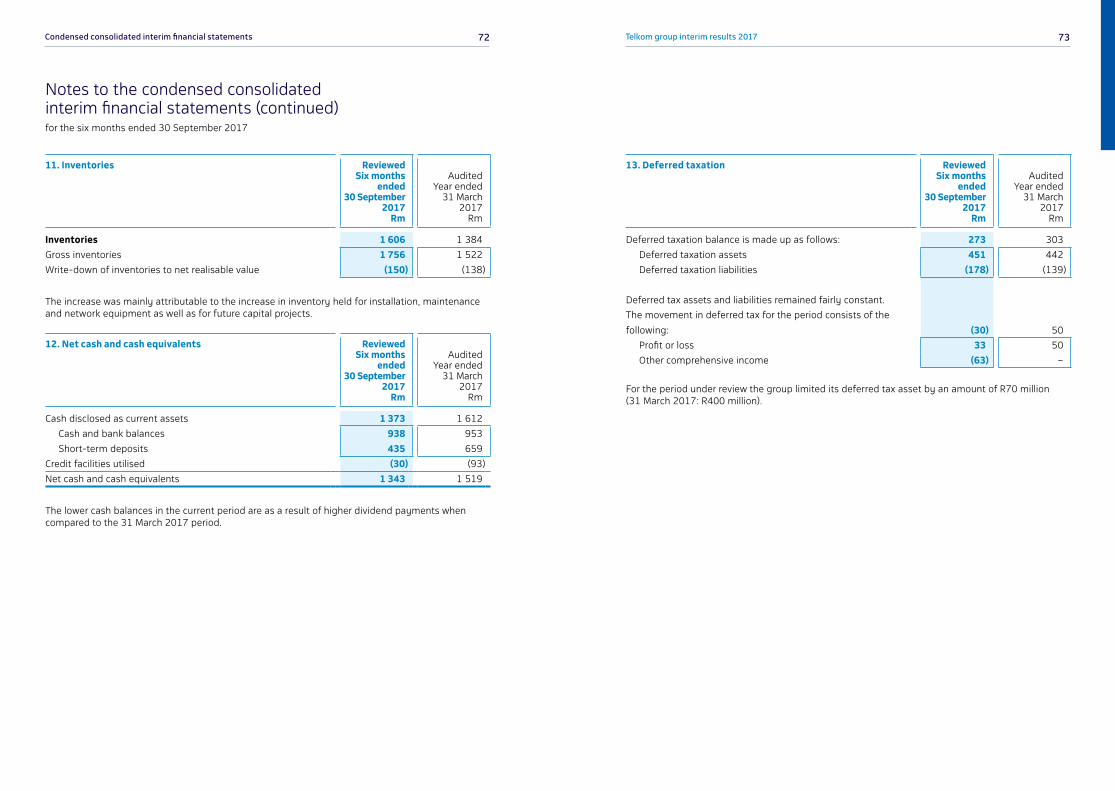
Condensed consolidated interim financial statements 72 Telkom group interim results 2017 73
Notes to the condensed consolidated interim financial statements (continued)for the six months ended 30 September 2017
11. Inventories ReviewedSix months
ended30 September
2017Rm
AuditedYear ended
31 March 2017
Rm
Inventories 1 606 1 384
Gross inventories 1 756 1 522
Write-down of inventories to net realisable value (150) (138)
The increase was mainly attributable to the increase in inventory held for installation, maintenance and network equipment as well as for future capital projects.
13. Deferred taxation ReviewedSix months
ended30 September
2017Rm
AuditedYear ended
31 March 2017
Rm
Deferred taxation balance is made up as follows: 273 303
Deferred taxation assets 451 442
Deferred taxation liabilities (178) (139)
Deferred tax assets and liabilities remained fairly constant.
The movement in deferred tax for the period consists of the
following: (30) 50
Profit or loss 33 50
Other comprehensive income (63) –
For the period under review the group limited its deferred tax asset by an amount of R70 million (31 March 2017: R400 million).
12. Net cash and cash equivalents ReviewedSix months
ended30 September
2017Rm
AuditedYear ended
31 March 2017
Rm
Cash disclosed as current assets 1 373 1 612
Cash and bank balances 938 953
Short-term deposits 435 659
Credit facilities utilised (30) (93)
Net cash and cash equivalents 1 343 1 519
The lower cash balances in the current period are as a result of higher dividend payments when compared to the 31 March 2017 period.
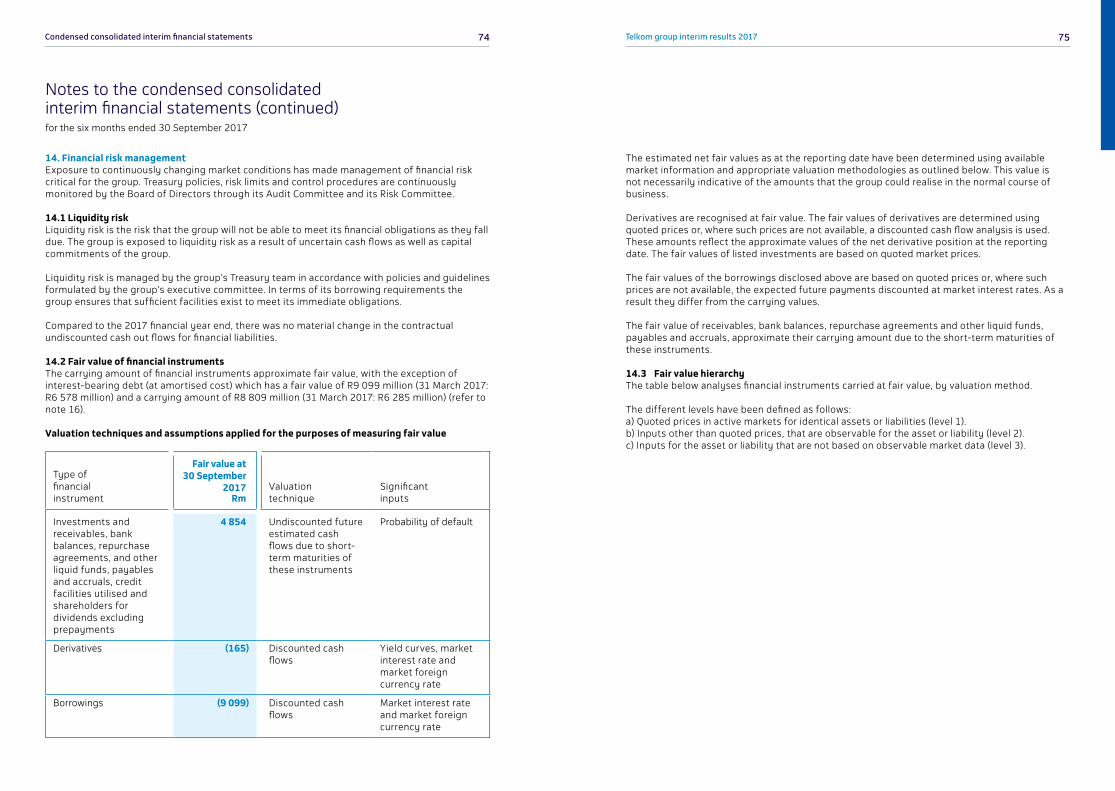
Condensed consolidated interim financial statements 74 Telkom group interim results 2017 75
Notes to the condensed consolidated interim financial statements (continued)for the six months ended 30 September 2017
14. Financial risk managementExposure to continuously changing market conditions has made management of financial risk critical for the group. Treasury policies, risk limits and control procedures are continuously monitored by the Board of Directors through its Audit Committee and its Risk Committee. 14.1 Liquidity risk Liquidity risk is the risk that the group will not be able to meet its financial obligations as they fall due. The group is exposed to liquidity risk as a result of uncertain cash flows as well as capital commitments of the group. Liquidity risk is managed by the group’s Treasury team in accordance with policies and guidelines formulated by the group’s executive committee. In terms of its borrowing requirements the group ensures that sufficient facilities exist to meet its immediate obligations. Compared to the 2017 financial year end, there was no material change in the contractual undiscounted cash out flows for financial liabilities.
14.2 Fair value of financial instruments The carrying amount of financial instruments approximate fair value, with the exception of interest-bearing debt (at amortised cost) which has a fair value of R9 099 million (31 March 2017: R6 578 million) and a carrying amount of R8 809 million (31 March 2017: R6 285 million) (refer to note 16).
Valuation techniques and assumptions applied for the purposes of measuring fair value
Type of financial instrument
Fair value at 30 September
2017 Rm
Valuation technique
Significant inputs
Investments and receivables, bank balances, repurchase agreements, and other liquid funds, payables and accruals, credit facilities utilised and shareholders for dividends excluding prepayments
4 854 Undiscounted future estimated cash flows due to short-term maturities of these instruments
Probability of default
Derivatives (165) Discounted cash flows
Yield curves, market interest rate and market foreign currency rate
Borrowings (9 099) Discounted cash flows
Market interest rate and market foreign currency rate
The estimated net fair values as at the reporting date have been determined using available market information and appropriate valuation methodologies as outlined below. This value is not necessarily indicative of the amounts that the group could realise in the normal course of business. Derivatives are recognised at fair value. The fair values of derivatives are determined using quoted prices or, where such prices are not available, a discounted cash flow analysis is used. These amounts reflect the approximate values of the net derivative position at the reporting date. The fair values of listed investments are based on quoted market prices. The fair values of the borrowings disclosed above are based on quoted prices or, where such prices are not available, the expected future payments discounted at market interest rates. As a result they differ from the carrying values. The fair value of receivables, bank balances, repurchase agreements and other liquid funds, payables and accruals, approximate their carrying amount due to the short-term maturities of these instruments. 14.3 Fair value hierarchyThe table below analyses financial instruments carried at fair value, by valuation method. The different levels have been defined as follows:a) Quoted prices in active markets for identical assets or liabilities (level 1).b) Inputs other than quoted prices, that are observable for the asset or liability (level 2).c) Inputs for the asset or liability that are not based on observable market data (level 3).

Condensed consolidated interim financial statements 76 Telkom group interim results 2017 77
Notes to the condensed consolidated interim financial statements (continued)for the six months ended 30 September 2017
15. Acquisition and disposal of subsidiariesSeptember 2017 15.1 Disposal of subsidiary15.1.1 Netcampus Proprietary LimitedOn 1 September 2017, BCX sold Netcampus Proprietary Limited business to Teboho Makgatho Holdings Proprietary Limited.
Netcampus Proprietary Limited is involved in information technology (IT) training and related activities and operates principally in South Africa.
2017
Rm
The net cash flows attributable to operating, investing and financing activities of the discontinued operations:
Net assets disposed 2
Consideration (2)
Profit/(loss) on disposal 0
15.2 Common control transactions15.2.1 Mast and Towers businessOn 16 March 2017, the Telkom board approved a disposal of Telkom’s Mast and Towers business to Swiftnet, a wholly owned subsidiary of Telkom group. This is part of Telkom’s strategic imperative to maximise value from its Mast and Towers portfolio. The Mast and Towers are currently used to provide telecommunication services to Telkom customers. They are also leased to third parties. The effective date of the sale was 1 April 2017, in the form of assets for preference shares. At 31 March 2017, Telkom company recognised the Mast and Towers portfolio as held for sale in its statement of financial position. On 31 March 2017, the fair value of the Mast and Towers exceeded their carrying value. From a group perspective the Mast and Towers were transferred at their carrying amount as the transaction constituted a business combination under common control.
March 201715.3 Acquisition of subsidiaries15.3.1 Taropa Technologies Proprietary Limited (Taropa)On 1 March 2017 BCX acquired the entire issued ordinary share capital of Taropa for a total purchase consideration of R13 million. The consideration is made up of R8 million cash and R5 million deferred consideration.
14. Financial risk management (continued)14.3 Fair value hierarchy (continued)The following table presents the fair value of the group’s assets and liabilities:
Hierarchy levels
Six months ended
30 September 2017
Rm
AuditedYear ended
31 March 2017
Rm
Assets measured at fair value
Investment in Cell Captive preference shares Level 2 2 504 2 388
Investment by FutureMakers Level 3 11 11
Forward exchange contracts Level 2 54 54
Asset finance receivable Level 2 48 73
Other financial assets Level 2 30 35
Firm commitments Level 2 8 24
Liabilities measured at fair value
Interest rate swaps Level 2 (28) (22)
Firm commitments Level 2 (183) (189)
Forward exchange contracts Level 2 (15) (229)
Liabilities measured at amortised cost
Interest bearing debt Level 2 (9 099) (6 578)

Condensed consolidated interim financial statements 78 Telkom group interim results 2017 79
15. Acquisition and disposal of subsidiaries (continued)15.3.1 Taropa Technologies Proprietary Limited (Taropa) (continued)Taropa provides innovative business solutions based on information and communication technology and runs ICT systems and manages products, services and solutions for a wide range of customers.
15.3.2 African Arete Proprietary LimitedOn 1 November 2016 BCX acquired the entire issued ordinary share capital of African Arete Proprietary Limited. The total purchase consideration of R19 million was settled in cash. African Arete Proprietary Limited provides innovative business solutions based on information and communication technology and runs ICT systems and manages products, services and solutions for a wide range of customers.
15.3.3 Relational Database Consulting Proprietary Limited (RDC)On 1 April 2016, BCX acquired the entire share of RDC. The total purchase consideration amounting to R30 million was funded by a cash payment of R16 million and a deferred purchase consideration of R14 million payable on achieving specified targets. RDC is a market leader in database and operating system administration with a strong focus on Oracle. 15.4 Common control transactions15.4.1 Enterprise business On 1 November 2016 Enterprise, previously a division of Telkom group, was sold to BCX to realise synergies. The integration will enable Telkom group to offer Enterprise solutions beyond connectivity and to strengthen Telkom’s leadership in the Enterprise market. The transaction was financed through redeemable preference shares from BCX to Telkom and accounted for as a common control transaction. BCX recognised the acquired Enterprise assets at their carrying amount on the date of sale and the difference between the proceeds and the carrying amount of the Enterprise business was recognised as common control equity reserves. In Telkom company the difference between the carrying amount of the Enterprise business and proceeds was recognised in profit or loss.
15. Acquisition and disposal of subsidiaries (continued)15.6 Other propertiesTelkom board approved the disposal of an additional 26 properties to the market. These properties were identified as no longer needed for the Telkom operations. The sale is planned to take place during the next 12 months.
15.7 BCX non-core investments classified as held for saleDuring the period under review, BCX initiated a review of its portfolio with specific focus on non-core investments. This process has resulted in the classification of the following investments as held for sale as at 30 September 2017: - NGA Africa - Appzone - BCX Kenya - BCX Botswana
At 30 September 2017, BCX management was committed to a plan to sell these assets and had initiated a marketing plan for the assets at a price relative to their fair value. It was also considered probable that the sales would be concluded within 12 months following 30 September 2017. The assets and their operating results are not considered material to the financial statements of the group as a whole and have therefore not been separately disclosed.
Notes to the condensed consolidated interim financial statements (continued)for the six months ended 30 September 2017
September 2017
Rm
March 2017
Rm
15.5 Goodwill reconciliation
Opening balance 1 253 1 214
Acquisition of Anco IT Proprietary Limited – (8)
Acquisition of Taropa – 7
Acquisition of African Arete Proprietary Limited – 16
Acquisition of RDC – 24
1 253 1 253
16. Interest-bearing debt ReviewedSix months
ended30 September
2017Rm
AuditedYear ended
31 March 2017
Rm
Non-current interest-bearing debt 6 466 4 744
Local debt 6 269 4 550
Foreign debt 134 123
Finance leases 63 71
Current portion of interest-bearing debt 2 343 1 541
Local debt 2 297 1 500
Foreign debt 2 2
Finance leases 44 39
The current portion of interest bearing debt of R2 343 million (nominal) as at 30 September 2017 is expected to be repaid from available cash or operational cash flow and other borrowings.
The significant loans raised during the six months ended 30 September 2017 related to the issue of commercial paper. Management believes that sufficient funding facilities will be available at the date of repayment.

Condensed consolidated interim financial statements 80 Telkom group interim results 2017 81
18. Trade and other payables ReviewedSix months
ended30 September
2017Rm
AuditedYear ended
31 March 2017
Rm
Trade and other payables 7 065 7 516
Trade payables 2 978 3 870
Finance cost accrued 145 60
Accruals and other payables 3 942 3 586
Accruals and other payables mainly represent amounts payable for goods received, net of Value Added Tax, obligations and licence fees.
Included in the current and prior year balance is the refund from SARS of R854 million including interest. Refer to note 20.
19. Commitments ReviewedSix months
ended30 September
2017Rm
AuditedYear ended
31 March 2017
Rm
Capital commitments authorised 6 343 8 158
Commitments against authorised capital expenditure 5 860 6 594
Authorised capital expenditure not yet contracted 483 1 564
Capital expenditure is committed for property, plant and equipment and software (included in intangible assets). Management expects these commitments to be financed from internally generated cash and borrowings.
Notes to the condensed consolidated interim financial statements (continued)for the six months ended 30 September 2017
20. Contingencies
Contingent liabilitiesMatters before ICASAEnd-User and Service Charter Regulations Based on ICASA’s Complaints and Compliance Committee (CCC) ruling in the prior period, Telkom has initiated administrative review proceedings seeking to set aside the applicability of the Regulations in issue. The review application is in process and no hearing date has been allocated as yet. In the interim, however, ICASA promulgated the Amended End-User and Subscriber Charter Regulations on 1 April 2016, in terms of which the fault clearance measurement for fixed services was amended to 90% fault clearance within five days, instead of three days. Telkom is still in the process of assessing the impact of the amended Regulations on the group going forward.
High CourtRadio Surveillance Security Services (Pty) Ltd (RSSS) In December 2011, RSSS issued summons against Telkom for the sum of R216 million. Telkom is defending the matter and has filed a plea and a counterclaim for R22 million. No contract was concluded with RSSS, no purchase orders were issued and no quotations were accepted by Telkom. The trial commenced in August 2017. The matter is anticipated to be finalised by January 2018.
Phutuma Networks (Pty) Ltd (Phutuma) In August 2009, Phutuma served summons on Telkom, claiming damages to the amount of R5.5 billion arising from the cancellation of a tender published by Telkom in November 2007. The High Court granted absolution from the instance in Telkom’s favour. The Supreme Court of Appeal (SCA) had initially dismissed Phutuma’s application for leave to appeal in October 2014. In early 2015, the SCA referred the appeal back to the North Gauteng High Court. The appeal which was heard in September 2016, was upheld. A request has been made for the re-enrolment of the matter for trial. Telkom is awaiting a court date.
17. Provisions ReviewedSix months
ended30 September
2017Rm
AuditedYear ended
31 March 2017
Rm
Non-current portion of provisions 1 004 1 592
Employee related 965 1 536
Non-employee related 39 56
Current portion of provisions 1 176 1 521
Employee related 1 022 1 397
Non-employee related 154 124
The decrease in the non-current employee provision is mainly due to the change in assumptions used to value Telkom’s obligation to future retirees in the Telkom retirement fund. The assumptions used are based on the valuation techniques prescribed by IAS 19.
The decrease in the current employee provision is mainly due to lower performance incentive provisions in the current financial period as internal financial targets have not been fully achieved as planned.

Condensed consolidated interim financial statements 82 Telkom group interim results 2017 83
Notes to the condensed consolidated interim financial statements (continued)for the six months ended 30 September 2017
21. Related parties ReviewedSix months
ended30 September
2017Rm
ReviewedSix months
ended30 September
2016Rm
AuditedYear ended
31 March 2017
Rm
Details of material transactions and balances with related parties not disclosed separately in the condensed consolidated interim annual financial statements were as follows:
With shareholders:
Government of South Africa
Related party balances
Finance lease receivable 125 250 180
Trade receivables 693 561 692
Provision for doubtful debt (134) (68) (147)
Related party transactions
Revenue (1 989) (1 974) (3 927)
Individually significant revenue* (626) (666) (1 341)
Department of Correctional Services (44) (42) (85)
Eastern Cape Department of Health (27) (26) (52)
Province of KZN Health Service (40) (40) (79)
Department of Justice (43) (56) (107)
South African National Defence Force (34) (35) (70)
South African Police Services (268) (301) (586)
S.I.T.A. (Pty) Ltd (103) (112) (214)
Ekurhuleni Metropolitan Council (28) (22) (77)
Gauteng Health (19) (21) (44)
City of Tshwane Metropolitan Municipality (20) (11) (27)
Collectively significant revenue* (1 363) (1 308) (2 586)
* The nature of the individually and collectively significant revenue consists mostly of data revenue. The individually significant revenue has changed in the current reporting period due to make up of the entities disclosed.
21. Related parties (continued) ReviewedSix months
ended30 September
2017Rm
ReviewedSix months
ended30 September
2016Rm
AuditedYear ended
31 March 2017
Rm
At 30 September 2017, the Government of South Africa held 39.3% (2016: 39.3%) of Telkom’s shares, and has the ability to exercise significant influence, and the Public Investment Corporation held 11.9% (2016: 11.9%) of Telkom’s shares.
With entities under common control:
Major public entities
Related party balances
Trade receivables 54 54 40
Trade payables (10) (7) (21)
Related party transactions
Revenue (80) (110) (291)
Expenses 119 120 236
Individually significant expenses 110 112 236
South African Post Office 24 25 63
Eskom 86 87 173
Collectively significant expenses 9 8 –
Rent received (13) (16) (35)
Individually significant rent received: South
African Post Office (10) (12) (26)
Collectively significant rent received (3) (4) (9)
Rent paid 11 12 25
Individually significant rent paid: South
African Post Office 8 9 20
Collectively significant rent paid 3 3 5
20. Contingencies (continued)
Contingent assets Tax matters As noted in the 2017 consolidated annual financial statements, the tax treatment of the loss that arose in the 2012 and 2014 financial years on the sale of foreign subsidiaries is based on a specific set of circumstances and a complex legislative environment. A tax refund received during prior periods, relating to the 2012 sale, is contingent and will only be recognised once the matter has been resolved with SARS.

Condensed consolidated interim financial statements 84 Telkom group interim results 2017 85
Notes to the condensed consolidated interim financial statements (continued)for the six months ended 30 September 2017
22. Significant events and transactions (continued)
Allocation of shares in terms of the Telkom Employee Share Plan On 1 June 2017, the board approved the fifth allocation of shares to employees in terms of its Employee Share Plan. The number of shares that vests will depend on the extent to which the performance conditions are met at the end of the applicable vesting period. Vesting and sale of shares In terms of the Telkom Share Plan 146 668 and 49 366 shares vested to Sipho Maseko and Deon Fredericks respectively in June 2017.
BCX portfolio review process During the period under review, BCX initiated a review of its portfolio, with a specific focus on non-core investments in subsidiaries, joint ventures and associates. Certain investments have been identified as held for sale as at 30 September 2017 (Refer to note 15). BCX will continue the review process throughout the remainder of the 2018 financial year and will re-assess the accounting treatment of its investments as held for sale assets or discontinued operations as part of the 31 March 2018 financial statement close process.
Resignation of non-executive director: Telkom announced on 11 May 2017 that Ms Thembisa Skweyiya (Dingaan) had informed the board of her resignation as director from 10 May 2017.
22. Significant events and transactions
Results of the Telkom Annual General Meeting regarding directors’ re-appointments On 24 August 2017, all board members were re-elected as per the Annual General Meeting ordinary resolutions. Dividends The Telkom board declared an ordinary dividend of 290.75253 cents per share on 1 June 2017 which was paid on 3 July 2017 to shareholders registered on 30 June 2017. Establishment of Gyro group Telkom SA SOC Ltd (Telkom) and Gyro group, entered into a sale of business for shares transaction in terms of which Telkom sold its Mast and Towers (M&T) business to its existing subsidiary, Swiftnet, and a portfolio of properties to a newly established wholly owned subsidiary, Gyro.
The M&T business was sold as a going concern. Included in the M&T business are contracts, licenses, M&T fixed assets and free right of use on Intellectual Property (IP) all of which is currently used by the M&T business. The properties consist of technical, commercial and industrial properties owned by Telkom.
The sale is part of Telkom’s endeavour to unlock value in its property and M&T portfolios and the sale was effective from 1 April 2017.
21. Related parties (continued) ReviewedSix months
ended30 September
2017Rm
ReviewedSix months
ended30 September
2016Rm
AuditedYear ended
31 March 2017
Rm
Key management personnel compensation:
(Including directors and prescribed
officers’ emoluments)
Related party transactions
Short-term employee benefits 104 91 262
Post-employment benefits 8 6 13
Termination benefits 13 2 19
Equity compensation benefits 15 29 17
Terms and conditions of transactions with related partiesOutstanding balances at the end of financial periods are unsecured, interest free and settlement occurs in cash. There have been no guarantees provided or received for related party receivables or payables.
23. Events after the reporting date
Dividends The Telkom Board declared an ordinary dividend of 118.114 cents per share on 10 November 2017 payable on 4 December 2017 to shareholders registered on 1 December 2017. Launch of SpliceWorks Subsequent to 30 September 2017 BCX launched SpliceWorks - an online innovation and business enablement platform that connects tech entrepreneurs and their ideas to business development partners, funders and potential customers.
Other matters The directors are not aware of any other matters or circumstances since the financial period ended 30 September 2017 and the date of this report, or otherwise dealt with in the financial statements, which significantly affects the financial position of the group and the results of its operations.

Condensed consolidated interim financial statements 86Overview of our business 86
05 Today’s presentation

Telkom group interim results 2017 89Today’s presentation 88
Notes: Notes: