Television Bureau of Advertising Optimizing the Internet in Local Markets Updated June 2009 Tips to...
23
Television Bureau of Advertising Optimizing the Internet in Local Markets Updated June 2009 Tips to Viewing PowerPoint On- Line in Slide-Sorter View (multiple slides): 1. Right click anywhere on this slide. 2. Choose “Edit Slides” from the drop- down list. 3. In the lower left corner of
-
Upload
frederick-paul -
Category
Documents
-
view
216 -
download
0
Transcript of Television Bureau of Advertising Optimizing the Internet in Local Markets Updated June 2009 Tips to...

Television Bureau of AdvertisingTelevision Bureau of Advertising
Optimizing the Internet in Local Markets
Updated June 2009
Tips to Viewing PowerPoint On-Linein Slide-Sorter View (multiple
slides):1. Right click anywhere on this slide.2. Choose “Edit Slides” from the
drop- down list.3. In the lower left corner of the window, choose the icon.

Broadcast Television and the Internet both offer unique advertising
opportunities.
Both TV and the Internet play critical roles in
the purchase funnel.
This presentation will help demystify and quantify both roles in the local
advertising marketplace.

3
Deconstructing the InternetDeconstructing the Internet
Content - News, information and entertainment.
Communications - Email and instant messenger.
Commerce - Shopping online. Community - User-generated content and
communication. Search - Prioritized results based on specific
criteria from user-generated requests.

4
Internet Activity Is Varied by FormatInternet Activity Is Varied by Format
Internet Activity Index
Source: IAI Internet Activity Index, online-publishers.org
April 2009 Share of Time Spent Online
Content 41.3%
Communications 26.4%
Commerce 13.3%
Community 13.7%
Search 5.3%

5
Spending Reflects the Diversity of the Internet as an Ad Medium
Spending Reflects the Diversity of the Internet as an Ad Medium
Source: 2008 IAB/PricewaterhouseCoopers data, IAB.net press release 3/30/09
Sponsorships, $387
Digital Video, $734
Referrals, $1,683
E-mail, $405
Classifieds, $3,174
Search, $10,546
Rich Media, $1,642
Banner Ads, $4,877
U.S. Online Ad Spending by Format – 2008 Annual Revenue in Millions

6
Search and Digital Video are Top Formats
for Growth
Search and Digital Video are Top Formats
for Growth
Source: Interactive Advertising Bureau, Press Releases, 3/30/09
2008 ($Millions)
% Market Share 2008)
2007($Millions)
% Market Share 2007
Type of Advertising
Keyword Search 10,546 45% 8,805 42%
Banner Ads 4,877 21% 4,456 21%
Classifieds 3,174 14% 3,321 16%
Rich Media 1,642 7% 1,656 8%
Referrals/Lead Generation 1,683 7% 1,584 7%
Sponsorship 387 2% 636 3%
E-mail 405 2% 424 2%
Digital Video 734 3% 324 2%
TOTALS 23,400 100% 21,200 100%
Internet Ad Revenues by Ad Format

7
Majority of Advertising is Based on Transactional or Direct Marketing
Models
Majority of Advertising is Based on Transactional or Direct Marketing
Models
Source: TNS Media Intelligence Full Year 2008
Top 25 Internet AdvertisersAdvertising Dollars (000) Full Year 2008Scotttrade Inc. $597,352Tree.com Inc. 522,024TD Ameritrade Holding Corp. 269,298Bank of America Corp. 223,222FMR Corp. 212,743E-Trade Financial Corp. 207,091General Motors Corp. 187,727Experian Group LTD 151,129Verizon Communications Inc. 143,266Walt Disney Co. 108,731Apollo Group 107,124News Corp. 100,763Capital One Financial Corp. 83,566Expedia Inc. 79,352Netflix Inc. 78,103Time Warner Inc. 76,848United Online Inc. 74,341AT&T Inc. 69,552Target Corp. 68,955Comcast Corp. 63,065ING Groep Nv 61,670Privacy Matters 61,445Housevalues Inc. 60,545Ford Motor Co. 57,946Hewlett-Packard Co. 57,830
8
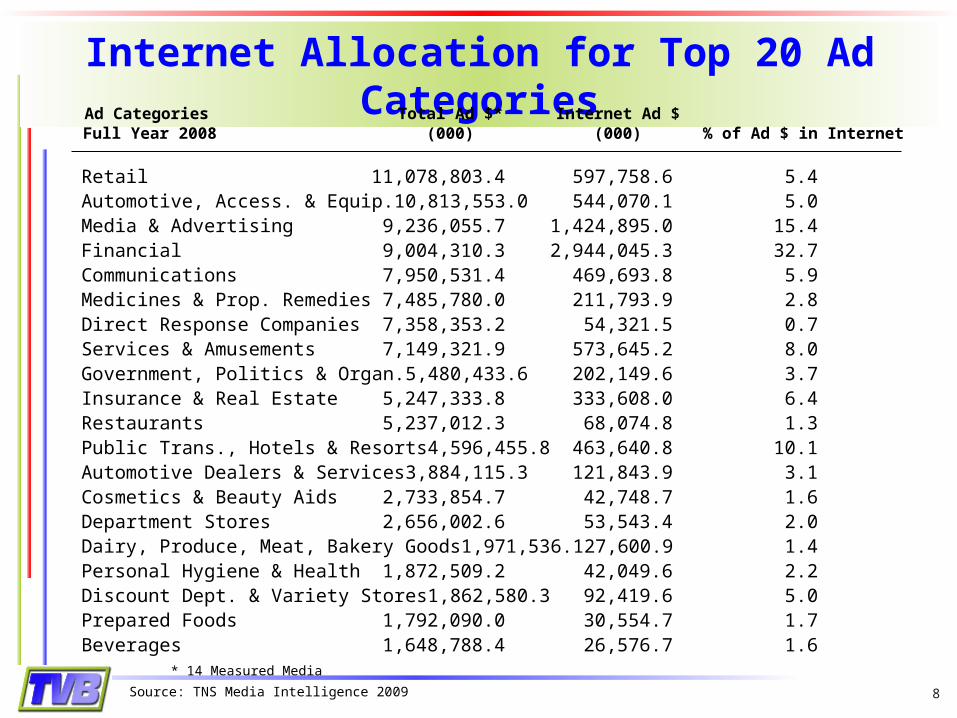
Internet Allocation for Top 20 Ad Categories
Internet Allocation for Top 20 Ad Categories
Source: TNS Media Intelligence 2009
Ad Categories Total Ad $* Internet Ad $ Full Year 2008 (000) (000) % of Ad $ in Internet
Retail 11,078,803.4 597,758.6 5.4Automotive, Access. & Equip. 10,813,553.0 544,070.1 5.0Media & Advertising 9,236,055.7 1,424,895.0 15.4Financial 9,004,310.3 2,944,045.3 32.7Communications 7,950,531.4 469,693.8 5.9Medicines & Prop. Remedies 7,485,780.0 211,793.9 2.8Direct Response Companies 7,358,353.2 54,321.5 0.7Services & Amusements 7,149,321.9 573,645.2 8.0Government, Politics & Organ. 5,480,433.6 202,149.6 3.7Insurance & Real Estate 5,247,333.8 333,608.0 6.4Restaurants 5,237,012.3 68,074.8 1.3Public Trans., Hotels & Resorts 4,596,455.8 463,640.8 10.1Automotive Dealers & Services 3,884,115.3 121,843.9 3.1Cosmetics & Beauty Aids 2,733,854.7 42,748.7 1.6Department Stores 2,656,002.6 53,543.4 2.0Dairy, Produce, Meat, Bakery Goods1,971,536.1 27,600.9 1.4Personal Hygiene & Health 1,872,509.2 42,049.6 2.2Discount Dept. & Variety Stores 1,862,580.3 92,419.6 5.0Prepared Foods 1,792,090.0 30,554.7 1.7Beverages 1,648,788.4 26,576.7 1.6 * 14 Measured Media

9
Web ROI Models Web ROI Models
National portal advertising is primarily direct marketing, based on cost-per-click or cost-per-acquisition web ad models such as Search.
Most local websites are content driven, based on a cost-per-thousand or flat rate model. However, they are increasingly supporting local search and directory formats.

10
PurchasePurchase
PreferencePreference
ConsiderationConsideration
AwarenessAwareness
Media Influence Through Funnel: Automotive
Media Influence Through Funnel: Automotive
TV 44%Newspaper 6%Magazine 6%Internet 19%
TV 40%Newspaper 7%Magazine 3%Internet 17%
TV 35%Newspaper 4%Magazine 4%Internet 12%
TV 22%Newspaper 1%Magazine 3%Internet 12%
Source: TVB/Yankelovich “How Media Works,” April 2009

11
Automotive Advertising Impact at Various Stages of
the Consumer Purchase Funnel
Automotive Advertising Impact at Various Stages of
the Consumer Purchase Funnel
80%75%
67%61% 59%
53%
20%25%
33%39% 41%
47%
81%74%
59% 55% 51%41%
19%26%
41%45%
49%
59%
0%
10%
20%
30%
40%
50%
60%
70%
80%
90%
100%
Media Influence (Any)-All Cat. No Media Influence-All Cat.
Media Influence (Any)-Automotive No Media Influence-Automotive
Awareness Interest Consider Want to Visit Make Purchase Purchase Store/Website Purchase
Source: TVB/Yankelovich “How Media Works,” April 2009
12
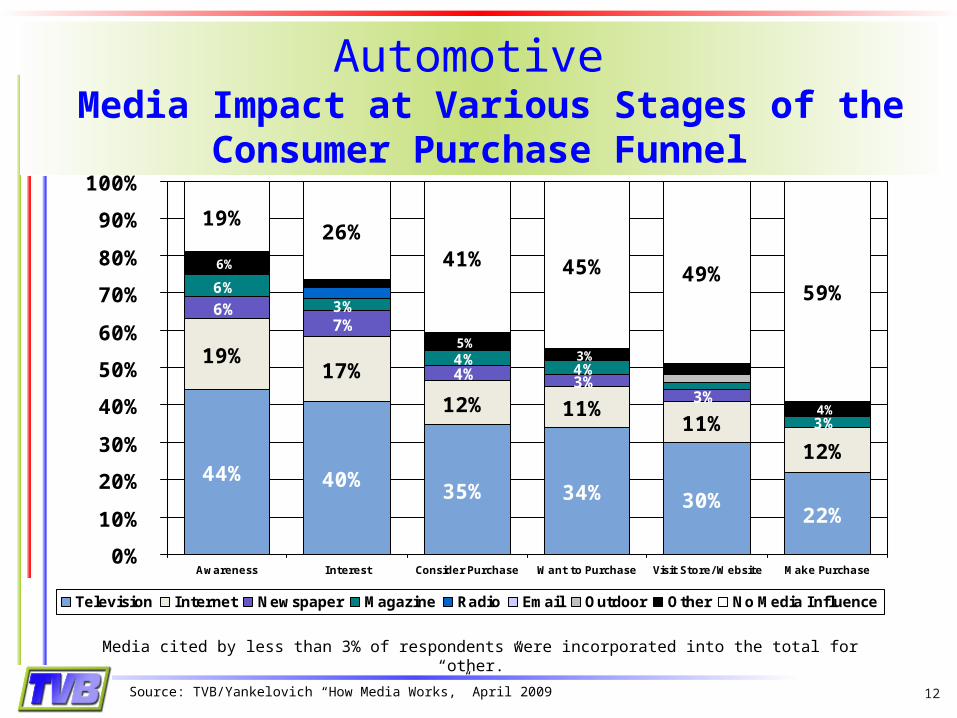
Media cited by less than 3% of respondents were incorporated into the total for “other.”
Automotive Media Impact at Various Stages of the
Consumer Purchase Funnel
Automotive Media Impact at Various Stages of the
Consumer Purchase Funnel
Source: TVB/Yankelovich “How Media Works,” April 2009
44% 40% 35% 34% 30%22%
19%17%
12% 11%11%
12%
6%7%
4% 3%3%
6%3%
4%4%
3%
6%
5%3%
4%
19%26%
41% 45% 49%59%
0%
10%
20%
30%
40%
50%
60%
70%
80%
90%
100%
Awareness Interest Consider Purchase Want to Purchase Visit Store/ Website Make Purchase
Television Internet Newspaper Magazine Radio Email Outdoor Other No Media Influence

13
The Automotive Purchase FunnelThe Automotive Purchase Funnel
The research has shown that the auto purchase process begins within six months from the eventual acquisition and consists of three stages:
“Needs Phase” (6 – 4 months prior to purchase) Intenders are assessing the options that are available for
basicconsumer needs and desires — size, space and styling.
“Features Phase” (3 – 2 months prior to purchase) Intenders have narrowed their choices and are now
comparingoptions within a single segment focusing on product
features.
“Price Phase” (final month prior to purchase) Cost becomes paramount as the intender visits
dealerships (usually for the first time) and makes final comparisons that lead to purchase.
Source: Time Inc. Automotive Purchase Process ©

14
Purchase Funnel RealityPurchase Funnel Reality
In the real world, there are many factors which drive consumer behavior, independent of the stages in the funnel:
Big Sale Special prices / financing Launch of new products or models
Source: Wordpress.com

15
In Fact, Consumers Are Always in the Purchase Funnel Cycle
In Fact, Consumers Are Always in the Purchase Funnel Cycle
There are always consumers in the purchase funnel at varying stages in their purchase decisions.
Advertisers who maintain a broadcast schedule reach consumers who are learning about a brand or narrowing down choices for future purchases.
Broadcast ads are also reaching consumers post-purchase to re-enforce proof of performance and promote related items.
16
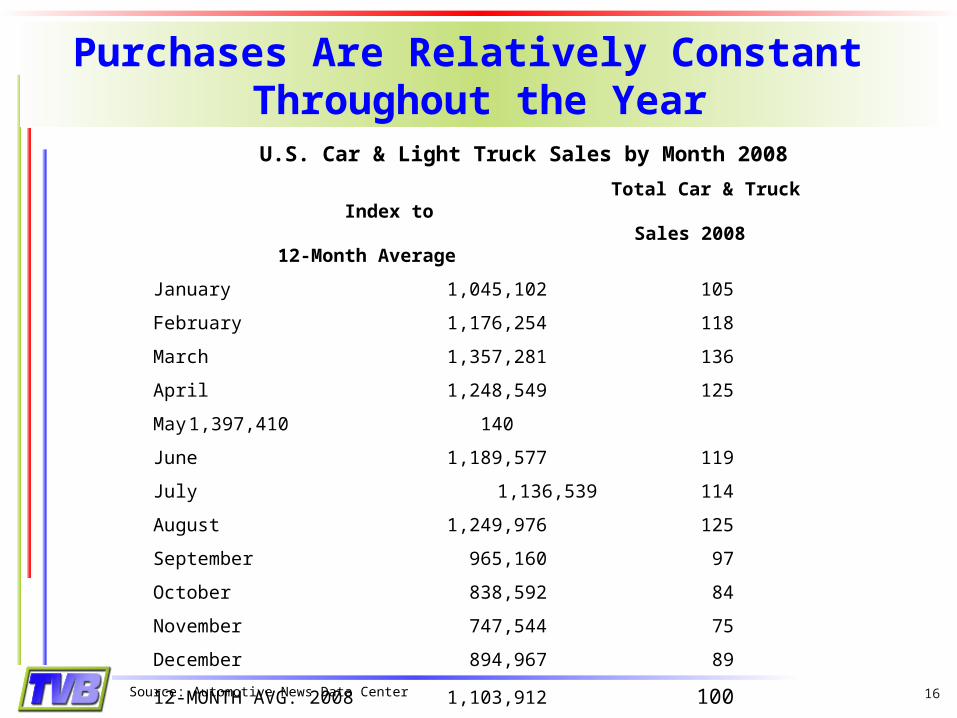
Purchases Are Relatively Constant Throughout the Year
Purchases Are Relatively Constant Throughout the Year
U.S. Car & Light Truck Sales by Month 2008
Total Car & Truck Index to Sales 2008 12-Month Average
January 1,045,102 105
February 1,176,254 118
March 1,357,281 136
April 1,248,549 125
May 1,397,410140
June 1,189,577 119
July 1,136,539 114
August 1,249,976 125
September 965,160 97
October 838,592 84
November 747,544 75
December 894,967 89
12-MONTH AVG. 2008 1,103,912 100
Source: Automotive News Data Center
17
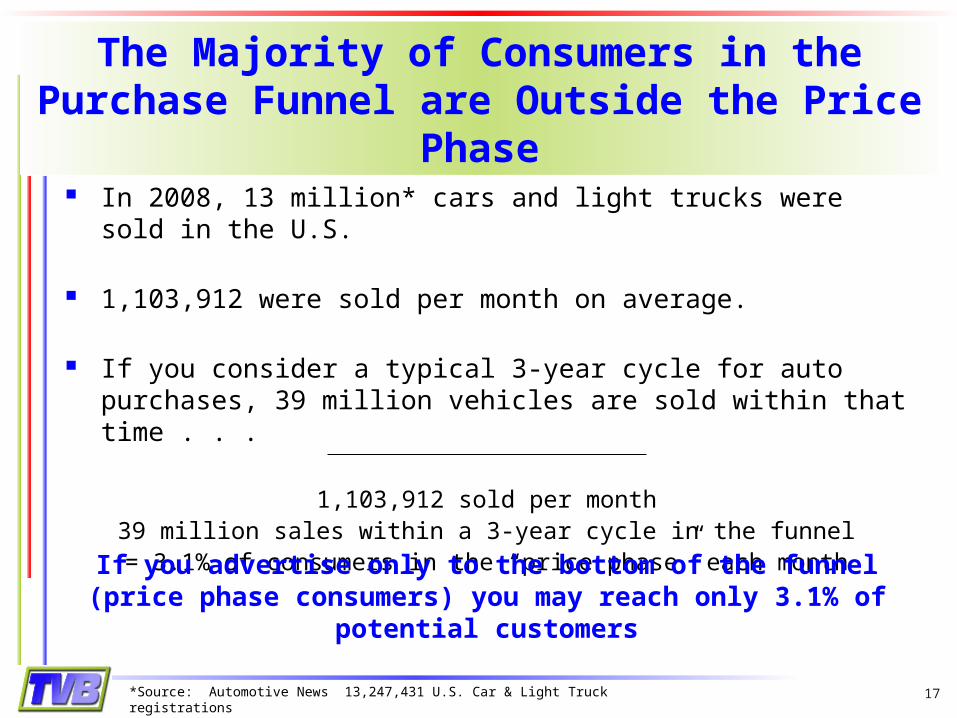
The Majority of Consumers in the Purchase Funnel are Outside the Price
Phase
The Majority of Consumers in the Purchase Funnel are Outside the Price
Phase In 2008, 13 million* cars and light trucks were sold in the
U.S. 1,103,912 were sold per month on average.
If you consider a typical 3-year cycle for auto purchases, 39 million vehicles are sold within that time . . .
1,103,912 sold per month39 million sales within a 3-year cycle in the funnel
= 3.1% of consumers in the “price phase” each month
*Source: Automotive News 13,247,431 U.S. Car & Light Truck registrations
If you advertise only to the bottom of the funnel (price phase consumers) you may reach only 3.1% of potential
customers

18
TV and Internet Relative ReachTV and Internet Relative Reach
TVB’s Media Comparisons Study 2008 shows that despite the strength of the Internet, Television
reaches more adults:
Source: TVB, Nielsen Media Research Custom Survey 2008
% Reached YesterdayDemographic Television Internet
Adults 18+ 90.2 65.6Adults 18-49 89.3 73.8Adults 25-54 90.0 72.1Adults 35-64 90.7 69.5

19
The Value Proposition of Local TV & Local TV Station Websites
The Value Proposition of Local TV & Local TV Station Websites
Broadcast TV and the Internet are complementary ad environments in providing news, entertainment and video content.
Awareness about products and services seen on TV send consumers to websites to learn more detail and find local retail outlets.
Advertisers using television advertising to drive awareness of a new campaign can measure response or purchase intent through the Internet.

20
Adults Turn to Local Television Station Websites for Local News and Event
Information (%)
Adults Turn to Local Television Station Websites for Local News and Event
Information (%)
18+ 18-34 18-49 25-54
Local Broadcast TV Station Site 33.4 39.5 39.3
39.0
Local Newspaper Site 25.7 29.3 28.9
28.3
Local Radio Station Site 7.3 6.2 6.4
7.0
Some Other Type of Local Website4.6 6.4 5.8
5.1
Some Other Type of Non-Local Site5.5 7.2 6.4
6.3
None/Don’t Use Websites 28.2 16.4 17.6
17.8
Local Broadcast TV Station Site 33.4 39.5 39.3
39.0
Local Newspaper Site 25.7 29.3 28.9
28.3
Local Radio Station Site 7.3 6.2 6.4
7.0
Some Other Type of Local Website4.6 6.4 5.8
5.1
Some Other Type of Non-Local Site5.5 7.2 6.4
6.3
None/Don’t Use Websites 28.2 16.4 17.6
17.8
Source: TVB, Nielsen Media Research Custom Survey 2008
21
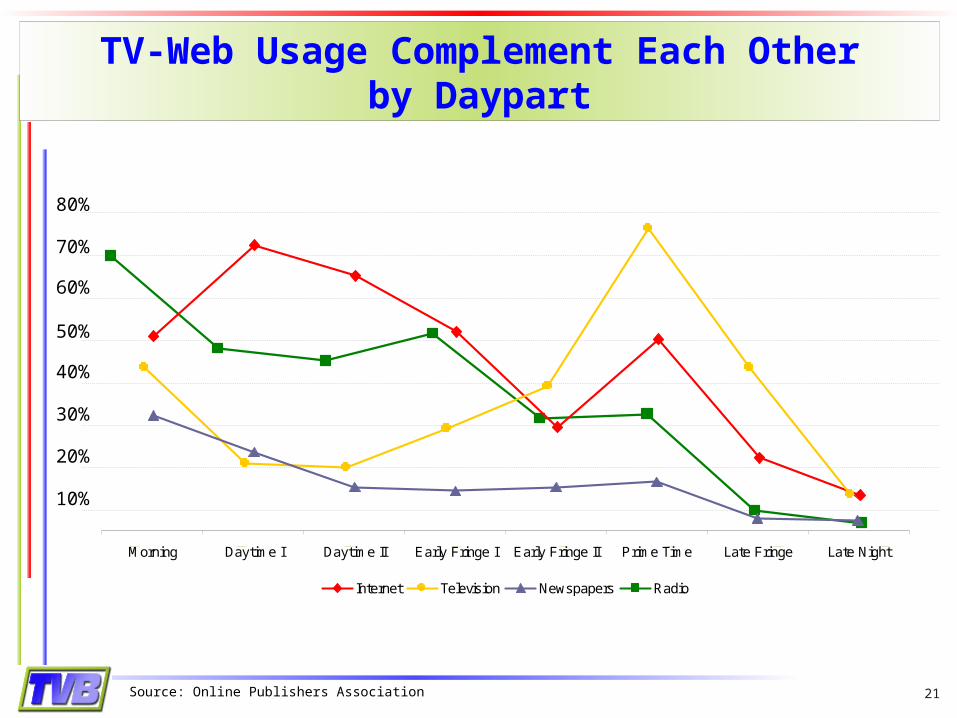
Morning Daytime I Daytime II Early Fringe I Early Fringe II Prime Time Late Fringe Late Night
80%
70%
60%
50%
40%
30%
20%
10%
Morning Daytime I Daytime II Early Fringe I Early Fringe II Prime Time Late Fringe Late NightMorning Daytime I Daytime II Early Fringe I Early Fringe II Prime Time Late Fringe Late NightMorning Daytime I Daytime II Early Fringe I Early Fringe II Prime Time Late Fringe Late NightMorning Daytime I Daytime II Early Fringe I Early Fringe II Prime Time Late Fringe Late NightMorning Daytime I Daytime II Early Fringe I Early Fringe II Prime Time Late Fringe Late Night
Internet Television Newspapers Radio
TV-Web Usage Complement Each Otherby Daypart
TV-Web Usage Complement Each Otherby Daypart
Source: Online Publishers Association

22
Local Television Websites Provide Top Drivers for Local Consumers
Local Television Websites Provide Top Drivers for Local Consumers
Source: Frank N. Magid Associates, Inc. Hearst-Argyle News Study 2007
47%
48%
51%
51%
52%
53%
53%
56%
57%
65%
Forecast w/ Meterologist
Local Forecast w/ Graphs and Maps
Local Shopping Service
Top 10 Things to do for Fun in Local Area
Local Search Engine
Local Search
Things to do on the Weekend
Sales Promotions for Local Merchants
Maps and Driving Directions
Severe Weather Alerts
Top 10 Local Content

23
TVB Suggested StrategyTVB Suggested Strategy Television has the largest ad impact of any media
at all stages of the Automotive purchase funnel, from Awareness through Purchasing, according to the Yankelovich Study findings.
Internet advertising has the second highest media impact in the Automotive purchase funnel and is a complementary ad environment to Broadcast TV.
Newspaper is declining. Be aware of local online opportunities – local broadcast websites included – for reaching “price phase” consumers with search, directories and classifieds.
Consider marketing dollars independent of your advertising budgets to maintain share of voice.