
Telephone presentation April 29, 2016, 13:00 CET 020-213...
29
CEO Georg Brunstam CFO Karin Gunnarsson April 29, 2016, 13:00 CET Welcome to HEXPOL Q1 2016 report update Telephone presentation April 29, 2016, 13:00 CET Please call +46 8213 091 (international call) 020-213 091 (national call, Sweden) 08-213 091 (mobile call, Sweden) and enter meeting code 917 840 April 29, 2016 - 1 -
Transcript of Telephone presentation April 29, 2016, 13:00 CET 020-213...
CEO Georg Brunstam
CFO Karin Gunnarsson April 29, 2016, 13:00 CET
Welcome to HEXPOL Q1 2016 report update
Telephone presentation April 29, 2016, 13:00 CET
Please call +46 8213 091 (international call)
020-213 091 (national call, Sweden)
08-213 091 (mobile call, Sweden)
and enter meeting code 917 840
April 29, 2016
- 1 -

Agenda
• Introduction to HEXPOL
• Q1 2016 – HEXPOL Group
• Q1 2016 – Business areas
• Q1 2016 – Summary
• Q & A
April 29, 2016
- 2 -

HEXPOL is a world-leading polymers group with strong global positions in
advanced Polymer Compounds (Compounding), Gaskets for plate heat
exchangers (Gaskets) and Wheels made of plastic and rubber materials
for forklift and castor wheel application (Wheels).
April 29, 2016
- 3 -
HEXPOL – Fast growing with strong margins

HEXPOL’s vision is to be market leader,
number one or two, in selected technological
or geographical segments, to generate profit,
growth and shareholder value.
Our vision guides us
April 29, 2016
- 4 -

• Two business areas
– HEXPOL Compounding
– HEXPOL Engineered Products
• Strong global market positions
– Global leader for Rubber Compounding
– Strong European position in Thermoplastic Elastomer Compounding (TPE)
– Strong US position for reinforced Polypropylene Compounding
– Global leader in Gaskets for plate heat exchangers (PHEs)
– Global market coverage in Wheels for fork lift trucks and castor wheels
• Global presence with production at 38 units in 10 countries (≈3,900 employees)
• 97% of sales outside Sweden
• Head office in Malmö, Sweden
• Shares listed on Large Cap segment of the NASDAQ OMX Nordic Exchange
April 29, 2016
- 5 -
HEXPOL – A well positioned Group

HEXPOL – A well positioned Group
• True global footprint – 11 of 38 production units in growth markets
• Historical strong sales growth and good profitability
• Well invested and strong cash flow
• Long industrial history with highly experienced and dedicated management and board
• Acquisition oriented – major acquisition within Polymer Compounding:
2010:
Elasto, Excel Polymers
2012:
Müller Kunststoffe, Robbins
2014:
Kardoes, Vigar Rubber Compounding,
Portage Precision Polymers
2015:
RheTech Thermoplastic Compounding
• Acquired 23 units with sales, development
April 29, 2016
- 6 -

Two business areas
– HEXPOL Compounding (92 % of sales)
– HEXPOL Engineered Products (8 % of sales)
April 29, 2016
- 7 -
HEXPOL – A well positioned Group with a stable organisation

0
1 000
2 000
3 000
4 000
5 000
6 000
7 000
8 000
9 000
10 000
11 000
12 000
M SEK
RheTech (Jan 2015)
PPP (Dec 2014)
Vigar (Nov 2014)
Kardoes (Aug 2014)
Robbins (Nov 2012)
Müller Kunststoffe (Jan 2012)
EXCEL Polymers (Dec 2010)
ELASTO (Apr 2010)
Gold Key (Sep 2007)
Trostel (May 2005)
Thona (May 2004)
GFD (Jul 2002)
HEXPOL
April 29, 2016
- 8 -
HEXPOL – A fast growing Group
Contribution to sales made by acquisitions in the past years (acquisition month in parenthesis)

• Product Development – New segments (for example: flame retardant)
– New products in existing segments (for example: weight saving)
– Application oriented
• Increased market share
• Acquisitions mainly within Polymer Compounding
– Existing geographical markets (Kardoes and Portage Precision in US, Vigar Rubber
Compounding in Germany)
– New geographical markets (Vigar Rubber Compounding in Spain)
– New chemistry (Portage Precision/silicon compounding, RheTech Thermoplastic
Compounding/specialized TP compounding)
– New end user segments
– Existing end user segments
• Capacity investments in Mexico
• Capacity investments in TPE Compounding
April 29, 2016
- 9 -
HEXPOL – A fast growing Group

Raw material
manufacturers Manufacturer of
polymer compounds
Rubber and plastic
component
manufacturers
OEMs End customers
The market:
• Fragmented market – few global players – many
local players
• Few industrial consolidators
• Few vertically integrated companies
-Rubber -TPE -PP
-Silicone -FKM -PA
- 10 -
April 29, 2016
HEXPOL – A fast growing Group
Business model:
• “Glocal” (local production/JIT)
• Application focused (often end user specified)
• Customized made to order
HEXPOL Compounding, value chain* (example):
(reinforced)
* Examples of companies, active in different parts of the value chain

HEXPOL – A well positioned Group
Fragmented market in polymer compounding with few global
competitors
Examples of polymer compounders:
– AirBoss - Teknor Apex
– Kraiburg - Multibase
– Dynamix - GLS
– Preferred Rubber - SOFTER
– PTE - Alpha Gary
– Unica - PolyOne
– SPC - Washington Penn
– Kardoes - A.Schulman
(acquired in 2014)
– Portage Precision Polymers
(acquired in 2014)
– Vigar Rubber Compounding
(acquired in 2014)
– Müller Kunststoffe
(acquired in 2012)
– Customers own rubber compounding facilities
– Many local national compounders
- 11 -
April 29, 2016
- 11 -
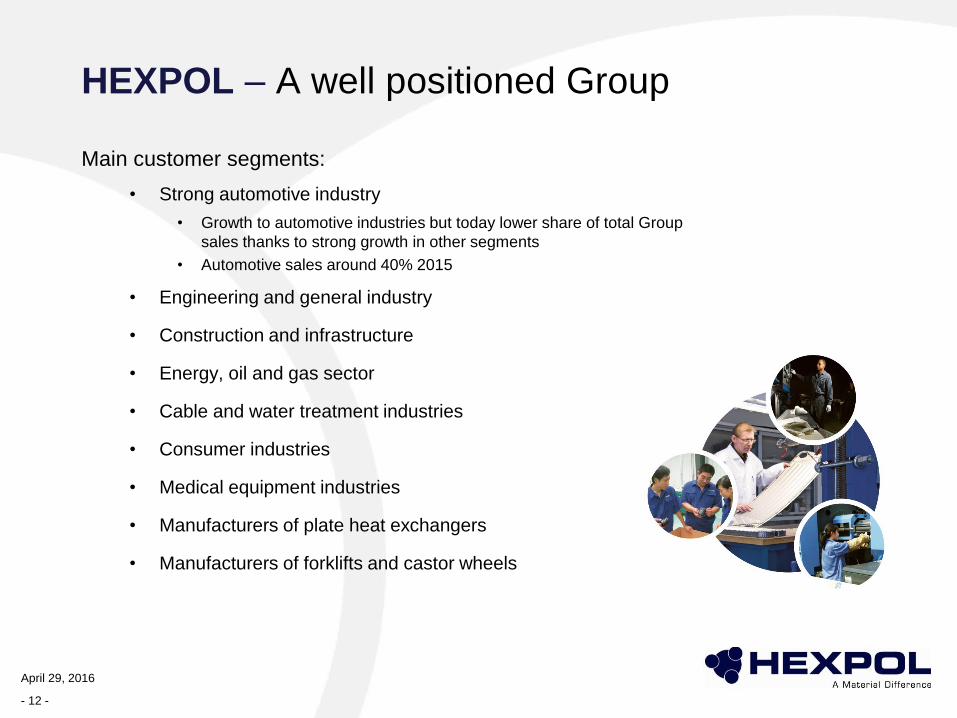
Main customer segments:
• Strong automotive industry
• Growth to automotive industries but today lower share of total Group
sales thanks to strong growth in other segments
• Automotive sales around 40% 2015
• Engineering and general industry
• Construction and infrastructure
• Energy, oil and gas sector
• Cable and water treatment industries
• Consumer industries
• Medical equipment industries
• Manufacturers of plate heat exchangers
• Manufacturers of forklifts and castor wheels
HEXPOL – A well positioned Group
- 12 -
April 29, 2016
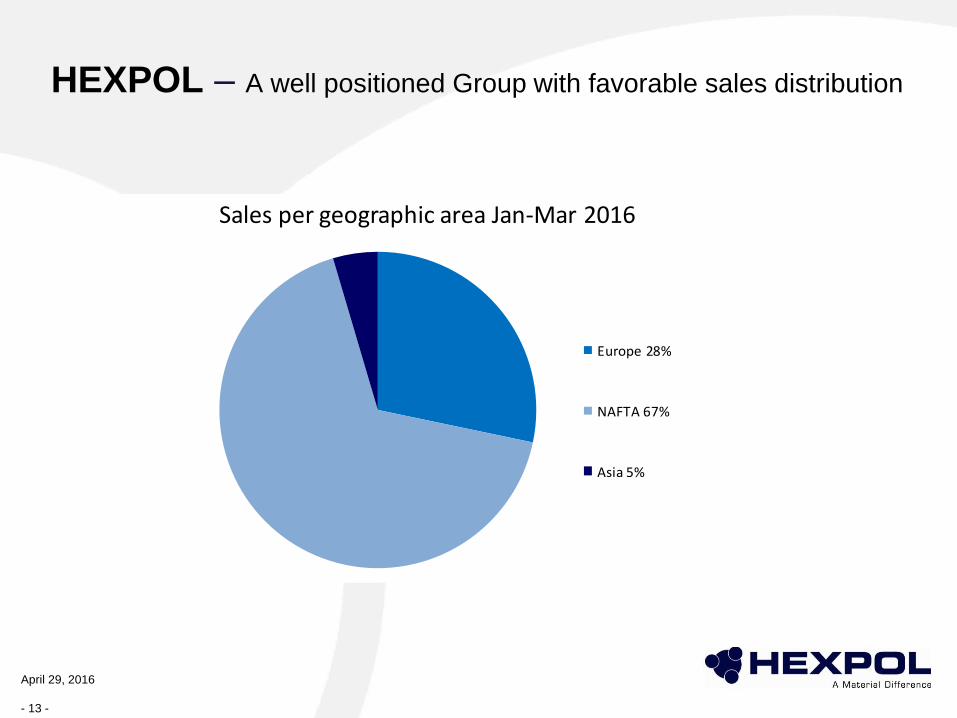
Sales per geographic area Jan-Mar 2016
Europe 28%
NAFTA 67%
Asia 5%
HEXPOL – A well positioned Group with favorable sales distribution
April 29, 2016
- 13 -

HEXPOL – Fast growing Group with strong margin development
3 1902 608
3 798
7 1978 007 8 036 8 919
11 229 11 035
0,0
4,0
8,0
12,0
16,0
20,0
0
2 000
4 000
6 000
8 000
10 000
12 000
2008 2009* 2010* 2011 2012 2013 2014 2015 Apr 15 -Mar 16
Sales OM
M SEK %
- 14 -
April 29, 2016
*Adjusted for items affecting comparability

Acquisitions oriented – Major acquisitions within
Polymer Compounding
April 29, 2016
- 15 -
• Elasto (April, 2010) – TPE Compounding
- Units in UK and Sweden
• Excel Polymers (Nov, 2010) – Rubber Compounding
- Units in U.S., Mexico, UK and China
• Müller Kunststoffe (Jan, 2012) – TPE Compounding
- Units in Germany
• Robbins (Nov, 2012) – Rubber Compounding
- Units in U.S.
• Kardoes (Aug, 2014) – Rubber Compounding
- Unit in U.S.
• Vigar Rubber Compounding (Nov, 2014) – Rubber Compounding
- Units in Spain and Germany
• Portage Precision Polymers (Dec, 2014) – Rubber/silicon Compounding
- Unit in U.S.
• RheTech Thermoplastic Compounding (Jan, 2015) – Specialized Thermoplastic Compounding
- Units in U.S.

HEXPOL acquired RheTech in 2015
April 29, 2016
• RheTech Thermoplastic Compounding have four facilities
(including manufacturing and laboratories) located in
Whitmore Lake, MI (RheTech), Fowlerville, MI (RheTech),
Sandusky, OH (RheTech Color) and in Blacksburg, SC
(RheTech Engineered Plastics)
• Turnover of 114 MUSD in 2015
• 210 employees
- 16 -

HEXPOL Group
Depreciations/amortizations & Investments
0
50
100
150
200
250
2007 2008 2009 2010 2011 2012 2013 2014 2015 Apr 15 -Mar 16
Depreciation/amortisation Investments
MSEK
April 29, 2016
- 17 -
• Investments in line with depreciations/amortizations
• Mainly capacity investments in Mexico and within TPE Compounding
• Maintenance investments primarily in the U.S.

- 18 -
April 29, 2016
- 18 -
2016 2015 2015
MSEK Q1 Q1 Q4
Net Sales 2,757 2,951 2,596
Operating Profit, EBIT 497 495 456
Operating Margin, % 18.0 16.8 17.6
Profit after tax 355 352 326
Earnings per share, SEK 1.03 1.02 0.95
Operating cash flow 325 480 562
• Another strong quarter with improved margins
• Again positive volume development
• Sales negatively affected by considerably lower sales prices due to considerably
lower raw material prices
Q1 2016 – Positive volume development and
continued strong result
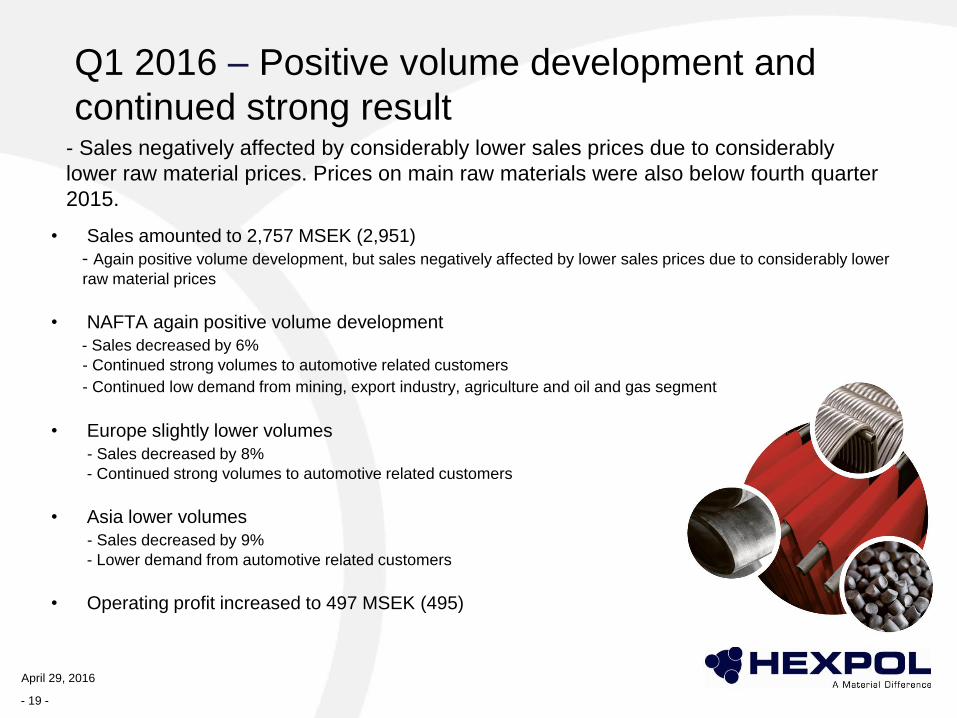
- Sales negatively affected by considerably lower sales prices due to considerably
lower raw material prices. Prices on main raw materials were also below fourth quarter
2015.
• Sales amounted to 2,757 MSEK (2,951)
- Again positive volume development, but sales negatively affected by lower sales prices due to considerably lower
raw material prices
• NAFTA again positive volume development
- Sales decreased by 6%
- Continued strong volumes to automotive related customers
- Continued low demand from mining, export industry, agriculture and oil and gas segment
• Europe slightly lower volumes
- Sales decreased by 8%
- Continued strong volumes to automotive related customers
• Asia lower volumes
- Sales decreased by 9%
- Lower demand from automotive related customers
• Operating profit increased to 497 MSEK (495)
April 29, 2016
- 19 -
Q1 2016 – Positive volume development and
continued strong result

- Strong result and improved margins
- Sales negatively affected by considerably lower sales prices due to considerably lower raw
material prices. Prices on main raw materials were also below fourth quarter 2015.
• Net sales amounted to 2,757 MSEK (2,951)
• Operating profit increased to 497 MSEK (495)
• Operating margin increased to 18.0% (16.8)
• Return on capital employed, R12 amounted to
28.9% (27.9)
April 29, 2016
MS
EK
- 20 -
• Earnings per share increased to 1.03 SEK (1.02)
• Operating cash flow amounted to 325 MSEK (480)
• Strong Balance Sheet
– Equity/assets ratio 74% (63)
– Net cash 714 MSEK (net debt 232)
0%
4%
8%
12%
16%
20%
24%
0
500
1000
1500
2000
2500
3000
3500
Q1 Q2 Q3 Q4 Q1 Q2 Q3 Q4 Q1 Q2 Q3 Q4 Q1 Q2 Q3 Q4 Q1
2012 2013 2014 2015 -16
Net sales Operating margin
Q1 2016 – Positive volume development and
continued strong result
Net sales & operating margin

- Strong balance sheet, well equipped for further expansion
April 29, 2016
- 21 -
2016 2015 2015
MSEK Q1 Q1 Q4
Net Sales 2,757 2,951 2,596
Operating Profit, EBIT 497 495 456
Operating Margin, % 18.0 16.8 17.6
Profit after tax 355 352 326
Earnings per share, SEK 1.03 1.02 0.95
Operating cash flow 325 480 562
Net cash 714 -232 454
Equity/assets ratio, % 74 63 72
Q1 2016 – Positive volume development and
continued strong result

April 29, 2016
- 22 -
MSEK 2016 2015 Growth
Sales 2 757 2 951 -6,6%
Currency -18 -0,6%
Ex. Currency 2 739 2 951 -7,2%
- Sales negatively affected by considerably lower sales prices due to considerably
lower raw material prices. Prices on main raw materials were also below fourth
quarter 2015.
Q1 2016 – Positive volume development and
continued strong result

April 29, 2016
• Again positive volume development in HEXPOL Compounding
– Strong and improved margins
– Sales negatively affected by considerably lower sales prices due to considerably lower raw material prices.
Prices on main raw materials were also below fourth quarter 2015.
– Continued price pressure
• Improved profit in HEXPOL Engineered Products
- 23 -
Q1 2016 – Business areas Positive volume development and continued strong result
2016 2015 2015 2016 2015 2015 2016 2015 2015
MSEK Q1 Q1 Q4 Q1 Q1 Q4 Q1 Q1 Q4
HEXPOL
Compounding2 550 2 744 2 393 473 473 428 18.5 17.2 17.9
HEXPOL Engineered
Products207 207 203 24 22 28 11.6 10.6 13.8
Operating Margin, %Operating ProfitNet Sales

Q1 2016 – HEXPOL Compounding Positive volume development and continued strong result
0%
4%
8%
12%
16%
20%
24%
0
500
1000
1500
2000
2500
3000
Q1 Q2 Q3 Q4 Q1 Q2 Q3 Q4 Q1 Q2 Q3 Q4 Q1 Q2 Q3 Q4 Q1
2012 2013 2014 2015 -16
Net sales Operating margin
• Sales amounted to 2,550 MSEK (2,744)
– Sales negatively affected by considerably lower sales prices due to considerably lower raw material prices.
Prices on main raw materials were also below fourth quarter 2015.
– Volume increases in NAFTA, with continued strong volumes to automotive related customers
– Volumes slightly lower in Europe, though volumes to automotive related customers developed positively
– Volumes in Asia was lower, due to lower demand from automotive related customers in China
– Continued price pressure on all markets
• Operating profit amounted to 473 MSEK (473) – Operating profit continued strong with improved operating margins of 18.5% (17.2)
April 29, 2016
Net sales & operating margin
MS
EK
- 24 -
Positive volume development and continued strong result - Sales negatively affected by considerably lower sales prices due to considerably lower raw
material prices. Prices on main raw materials were also below fourth quarter 2015.
Q1 2016 – HEXPOL Compounding
• NAFTA – again positive volume development
– Continued strong volumes to automotive related customers including
tire industry
– Continued low demand from mining, export industry, agriculture and oil
and gas sector
– Acquired RheTech Thermoplastic Compounding has developed
positively
• Europe – slightly lower volumes
– Continued positive volume development to automotive related
customers
– Volumes were slightly negatively affected, by the closing of the acquired
Vigars German manufacturing unit
• Asia – lower volumes
– Lower demand from automotive related customers
• Continued price pressure
April 29, 2016
- 25 -

• Net sales amounted to 207 MSEK (207) – Sales somewhat lower for HEXPOL Gaskets
– Sales increased for HEXPOL Wheels in all geographical regions, good development in US
– Positive development in China for both HEXPOL Wheels and HEXPOL Gaskets
• Continued price pressure
• Operating profit increased to 24 MSEK (22), mainly thanks to increased volumes and efficiency improvements in operations
• Operating margin increased to 11.6% (10.6)
April 29, 2016
Net sales & operating margin
MS
EK
0%
2%
4%
6%
8%
10%
12%
14%
16%
18%
0
50
100
150
200
250
Q1 Q2 Q3 Q4 Q1 Q2 Q3 Q4 Q1 Q2 Q3 Q4 Q1 Q2 Q3 Q4 Q1
2012 2013 2014 2015 -16
Net sales Operating margin
- 26 -
Q1 2016 – HEXPOL Engineered Products
- Improved profit and positive volume development

- 27 -
Q1 2016 – Positive volume development and
continued strong result
April 29, 2016
2016 2015
MSEK Q1 Q1
Net Sales 2 757 2 951
Operating Profit, EBIT 497 495
Operating Margin, % 18.0 16.8
Profit after tax 355 352
Earnings per share, SEK 1.03 1.02
Operating cash flow 325 480
Net cash 714 -232
Equity/assets ratio, % 74 63
Return on capital employed, % (R12) 28.9 27.9
The Board of Directors proposes a dividend of 1.70 SEK (1.20) per share
- Sales negatively affected by considerably lower sales prices due to considerably lower
raw material prices. Prices on main raw materials were also below fourth quarter 2015.
- Continued price pressure on all markets
- Strong balance sheet

• Again positive volume development in a challenging market
– NAFTA again positive volume development
– Europe slightly lower volumes
– Asia lower volumes
• Sales amounted to 2,757 MSEK (2,951)
• Operating profit increased to 497 MSEK (495)
• Earnings per share rose to 1.03 SEK (1.02)
• Continued price pressure
• Strong financial position, net cash 714 MSEK
– Well equipped for continued expansion
April 29, 2016
- 28 -
- Sales negatively affected by considerably lower sales prices due to considerably
lower raw material prices. Prices on main raw materials were also below fourth quarter
2015.
Q1 2016 – Positive volume development and
continued strong result

- 29 -
Q & A
April 29, 2016


